
Submitted:
24 September 2025
Posted:
24 September 2025
You are already at the latest version
Abstract
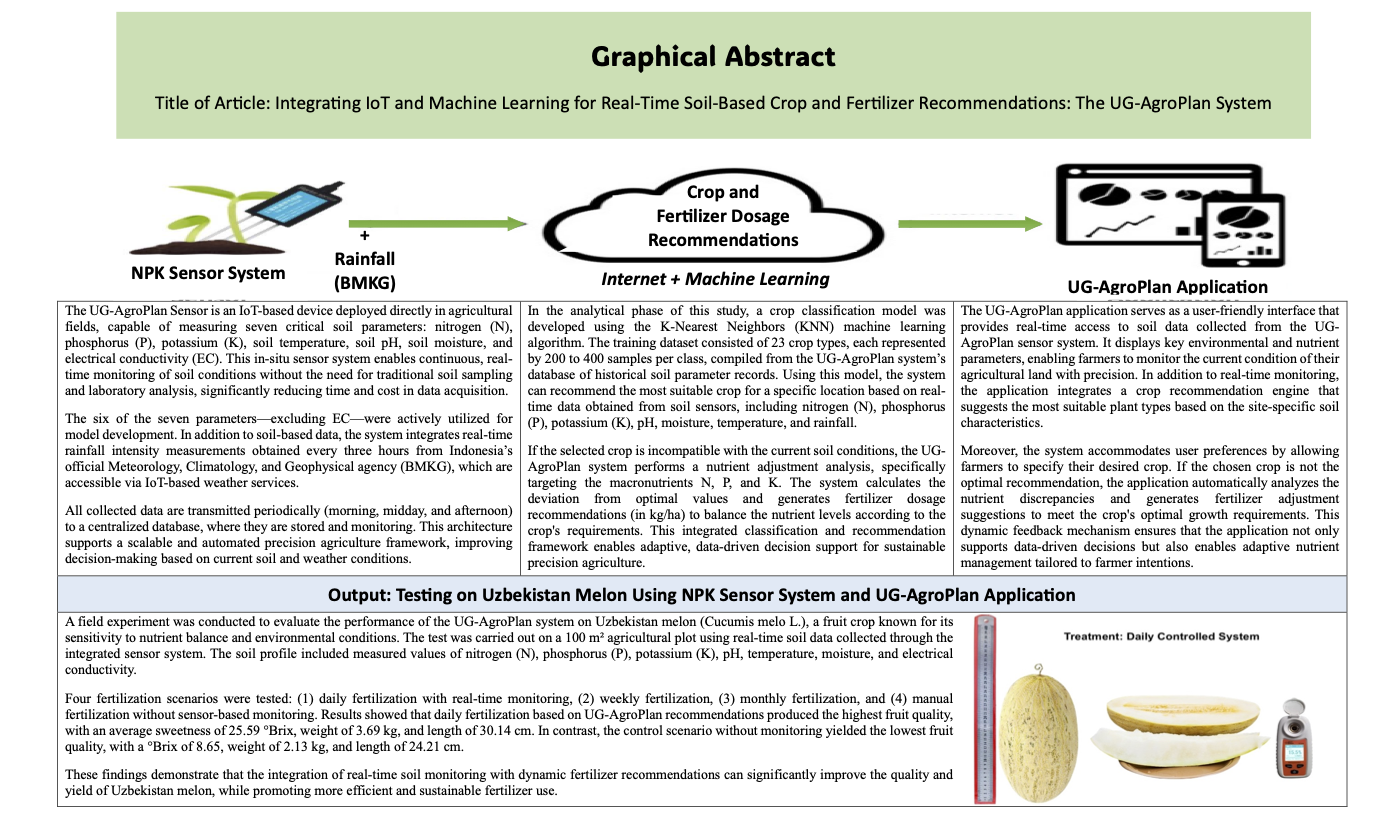
Precision agriculture plays a critical role in addressing global food security while minimizing environmental impact. However, conventional fertilization practices often rely on fixed schedules without real-time feedback from soil conditions, leading to inefficient resource use and reduced crop quality. Unlike existing systems that provide static fertilizer schedules or lack integration with real-time soil data, UG-AgroPlan uniquely combines a calibrated multi-parameter soil sensor and a K-Nearest Neighbors model to deliver adaptive recommendations that dynamically adjust to changing soil conditions. This study introduces the UG-AgroPlan system, which integrates IoT-based soil nutrient monitoring with Machine Learning algorithms to provide real-time crop and fertilizer recommendations. The system utilizes a calibrated multi-parameter soil sensor capable of detecting nitrogen (N), phosphorus (P), potassium (K), pH, moisture, temperature, and electrical conductivity with high accuracy (97.41% Field validation was conducted using Uzbekistan melon as a case study, as this crop is highly sensitive to soil nutrient balance and requires precise fertilization to achieve optimal quality and specific location. This characteristic makes it an ideal indicator for evaluating the system’s accuracy and effectiveness, applying four fertilization strategies (daily, weekly, monthly, and conventional). Results showed that the daily precision fertilization strategy achieved the best performance, with fruit sweetness reaching 15.59°Brix, average weight 3.69 kg, and length 30.14 cm, while reducing fertilizer usage by up to 18% compared to conventional methods. These findings demonstrate that UG-AgroPlan offers a scalable, accurate, and adaptive approach to sustainable smart farming by integrating real-time sensing, machine learning, and actionable agronomic recommendations. These findings demonstrate that UG-AgroPlan offers a scalable, accurate, and adaptive approach to sustainable smart farming by integrating real-time sensing, machine learning, and actionable agronomic recommendations. Unlike existing systems that provide static fertilizer schedules or lack integration with real-time soil data, UG-AgroPlan uniquely combines a calibrated multi-parameter soil sensor and a KNN model to deliver adaptive recommendations that dynamically adjust to changing soil conditions.
Keywords:
smart farming
; UG-AgroPlan
; precision agriculture
; soil monitoring
; crop recommendation
; IoT sensors
; K-Nearest Neighbors (KNN)
; nutrient detection
; fertilizer optimization
; data-driven agriculture
1. Introduction
Agriculture is a critical sector that supports global food security and economic development [1]. Through understanding and applying soil science principles, farmers can adopt sustainable practices supported by IoT technologies [2] and Smart Farm systems [3,4,5]. These practices improve soil productivity, conserve natural resources, and support long-term food security [6]. However, challenges in selecting the right type and amount of fertilizer often hinder agricultural productivity, particularly for small-scale farmers. The fertilizers are materials composed of one or more essential nutrients that, when applied to plants, promote improved growth and increased crop production [7]. Fertilizers are closely tied to fertilization, which refers to the method of providing nutrients to the soil for plant absorption . Nutrient enrichment in soil can come from the use of organic and inorganic fertilizers, which can increase soil organic carbon, total nitrogen, and available phosphorus [8]. Efficient fertilizer use involves not only adjusting fertilizer doses to meet plant needs but also eliminating soil factors that hinder nutrient absorption to achieve optimal yields through the use of quality fertilizers [9].
The high cost of quality fertilizers and the difficulty in obtaining fertilizers is due to high market prices, which increase farming costs [10]. Fertilizer subsidy policies in Indonesia have been comprehensively implemented to address this issue, with the government providing subsidies to small and medium farmers for fertilizers such as UREA, NPK, organic, and SP-36 [11]. Improper fertilizer use can result in stunted plants, early flowering [12], and vulnerability [13] to pests (OPT) [14]. It can also cause low production that does not match the potential of the variety, poor product quality (dull, easily damaged, brittle, and taste changes), and a decrease in soil nutrients over time. This decline in nutrients can negatively impact soil health and food security [15]. In addition, fertilization practices can affect soil microbial activity and overall plant health [16]. Furthermore, unbalanced fertilizer use can disrupt nutrient absorption and utilization by plants, leading to reduced yields and product quality [17]. Sensor-based monitoring of soil nutrients and fertilizer delivery must be dynamically and real-time integrated, which can be achieved through the implementation of Wireless Sensor Network (WSN) technology. Integrating WSNs in precision agriculture improves agricultural productivity and efficiency by monitoring macronutrient content with an error rate of 8.47% [18].
The ability to analyze complex data through machine learning has become an essential tool for making data-driven predictions and decisions. There are three main categories in machine learning: supervised learning, unsupervised learning, and reinforcement learning [19]. Through the integration of various digital technologies and the enhancement of autonomous learning capabilities, machine learning continues to accelerate innovation and its applications in everyday life [20], including in agriculture.
Machine learning-based fertilization recommendation systems have emerged as innovative solutions to address this challenge [21,22,23]. For example, research by [24] developed a fertilization recommendation methodology based on soil fertility mapping using Internet of Things (IoT). The tested several machine learning models such as Logistic Regression (LR) [25], Support Vector Machine (SVM) [26] , Gaussian Naïve Bayes (GNB), and K-Nearest Neighbor (KNN), and found that GNB achieved the highest accuracy .
Effective fertilization recommendation systems must consider various parameters, such as soil fertility levels [27], crop type [28], and environmental conditions in real-time [17,29]. However, many current systems do not account for real-time contexts, resulting in less accurate and efficient recommendations [24]. To overcome this issue, Internet of Things (IoT) technology can be used for real-time soil fertility mapping [30], which is then analyzed using machine learning models to provide more accurate fertilization recommendations [24,31]. Other research shows that the use of machine learning in agricultural recommendation systems extends beyond fertilization to include crop recommendations and plant disease identification. For instance, the AgriRec system uses machine learning algorithms to recommend crops and fertilizers based on soil properties, water requirements, and profitability analysis [32]. Additionally, deep learning models like ResNet-50 have been used to diagnose nutrient deficiencies in plant leaves and provide appropriate fertilization recommendations [33].
Machine learning improves both the efficiency and accuracy of fertilization recommendations. Methods such as Random Forest and Logistic Regression have been applied to predict the appropriate type and amount of fertilizer based on environmental, soil, and plant conditions [34]. The results of these studies not only help increase crop yields but also reduce the environmental impact of excessive fertilizer use. Furthermore, fertilizer recommendation systems designed specifically for small-scale farmers can provide significant benefits. Previous research implemented systems that use historical data and machine learning techniques to deliver personalized recommendations, accessible through user-friendly dashboards [35], enabling farmers to make better decisions about fertilizer application, ultimately improving productivity and income based on the quality and quantity of harvests.
One of the biggest challenges in crop cultivation is the proper management of fertilization. Overuse of fertilizers not only increases production costs but also leads to soil degradation, environmental pollution, and reduced crop quality [17]. The fertilizers applied to soil are often not optimally absorbed by plants [36], resulting in increased greenhouse gas emissions and groundwater contamination [37].
Uzbekistan melon is a high-value horticultural crop that is known for its sensitivity to soil nutrient balance and environmental conditions. This sensitivity makes it highly suitable as a model plant to evaluate the accuracy of real-time nutrient monitoring and fertilization recommendation systems. Uzbekistan melons have particular cultivation needs to thrive, requiring well-drained, nutrient-rich soils and consistent water supply during flowering and fruiting stages. As noted by the International Center for Agricultural Research in the Dry Areas (ICARDA), they grow best in warm, arid climates with average temperatures ranging from 25 to 30°C [38]. Moreover, optimal growth requires nutrient-rich, well-drained soils [39]. Adequate water supply is also crucial, especially during the flowering and fruit-setting stages, where water availability significantly influences fruit development [40].
A system capable of real-time soil nutrient monitoring and precise fertilization recommendations is required. In this context, our research has been developed as an innovative solution that integrates Internet of Things (IoT) and Machine Learning (ML) to provide precision fertilization guidance. This system uses soil sensors to measure critical parameters. The collected data are analyzed using the K-Nearest Neighbors (KNN) algorithm to determine the most suitable crops to measure critical parameters such as nitrogen (N), phosphorus (P), potassium (K), pH, temperature, moisture, and electrical conductivity, which are then analyzed using the K-Nearest Neighbors (KNN) algorithm to determine the most suitable crops for a given soil condition. Recent advancements in Machine Learning (ML) have enabled the development of more accurate and computationally efficient solutions to address these challenges. This research aims to develop an application, UG-AgroPlan, based on Machine Learning for providing crop recommendation systems. Another function in UG-AgroPlan can provide optimal real-time fertilization and crop advice for future needs.
This study addresses the limitations of existing systems that typically focus on a single aspect of agricultural management, such as crop classification or static nutrient mapping, without providing an integrated approach that adapts to real-time soil conditions. In the context of precision agriculture, there is a clear need for a system that combines direct soil nutrient sensing, intelligent data processing, and phase-specific fertilizer recommendations.
To fill this gap, we propose the development of UG-AgroPlan, an integrated platform that incorporates high-accuracy soil sensors, a machine learning–based crop recommendation algorithm (K-Nearest Neighbors), and a dynamic fertilization module that adjusts nutrient doses according to the plant’s growth stages (vegetative, flowering, and fruiting). This system not only detects real-time soil conditions with high precision but also delivers adaptive, data-driven crop and fertilization recommendations.
Recent studies have demonstrated the potential of AI-based decision support systems in improving agricultural productivity through data-driven recommendations [41]. However, the practical implementation of such systems—especially in field conditions with diverse soil types and crop varieties—remains limited. The system was validated through field trials using Uzbekistan melon as a case study. This crop was selected due to its specific nutritional requirements and sensitivity to nutrient imbalances, making it an ideal model for evaluating the accuracy and effectiveness of UG-AgroPlan’s recommendations. The results demonstrate significant improvements in both crop quality and fertilizer efficiency, supporting the potential of UG-AgroPlan as a practical solution for sustainable smart farming.
2. Materials and Methods
2.1. Materials
The materials used in this research consist of datasets, hardware and software. The dataset includes soil nutrients such as nitrogen (N), phosphorus (P), and potassium (K), as well as other soil parameters, including electrical conductivity (EC), soil pH, temperature, and soil moisture. Soil health is determined by a delicate balance of nutrients and environmental conditions, where both deficiencies and surpluses can significantly affect crop performance. Nitrogen deficiency often leads to stunted growth and chlorosis, while excess nitrogen results in excessive vegetative growth and poor fruit quality. Similarly, phosphorus deficiency causes underdeveloped roots and reduced yields, whereas surplus interferes with micronutrient uptake. Potassium deficiency increases susceptibility to stress and disease, while excess disrupts magnesium and calcium absorption. Soil pH that is too low (<5.5) increases aluminum and manganese toxicity, while high pH (>7.5) reduces micronutrient availability and causes chlorosis.
Electrical conductivity (EC) that is too low signals nutrient depletion, whereas high EC causes osmotic stress and root damage. Soil moisture imbalance—whether drought leading to wilting or waterlogging causing root rot—impairs nutrient absorption. Soil temperature extremes slow metabolism at low levels or induce enzyme dysfunction and flower or fruit abortion at high levels. Finally, rainfall scarcity results in drought stress, while excessive rainfall causes nutrient leaching, heightened humidity, fungal outbreaks, and flooding. Understanding these dynamics is essential for designing IoT-enabled Smart Farm systems capable of providing real-time monitoring and adaptive recommendations to sustain soil fertility and optimize crop productivity
The data used in this study were collected from two sources: secondary and primary datasets. The secondary dataset was obtained from various credible sources, such as data provided by the Indonesian Ministry of Agriculture, the Food and Agriculture Organization (FAO), and research studies in the field of agricultural cultivation. These data contain important information about soil conditions and nutrients from various agricultural areas in Indonesia.
Additionally, the primary dataset was directly collected from various agricultural fields in West Java Province through field measurements. The primary data collection process was carried out using a sensor system designed by the researchers to measure soil parameters directly in the fields, such as nitrogen, phosphorus, potassium levels, soil pH, moisture, temperature, soil type, and electrical conductivity. Before use, the primary data measurements were calibrated with laboratory equipment to ensure accuracy and reliability of the data obtained. This calibration aims to compare the sensor measurement results with laboratory standards. If the metric evaluation results of the calibration demonstrate errors approaching zero, the collected data are considered valid and can be integrated with the existing secondary dataset.
The hardware used for data collection consists of a soil measurement sensor system designed by the researchers. This sensor system is equipped with soil sensors that have seven main outputs: nitrogen (N) levels, phosphorus (P), potassium (K), soil pH, soil electrical conductivity, soil moisture, and soil temperature [42]. The sensors are optimized to provide accurate data on soil conditions, so the results can be used in machine learning modeling for fertilizer recommendation [43].
The development of the UG-AgroPlan system utilizes a comprehensive set of software tools to ensure robust functionality and seamless performance. Visual Studio Code was employed as the primary IDE for efficient code management, complemented by HTML, CSS, and JavaScript for front-end design and Python for back-end development. The machine learning models, including the deployed K-Nearest Neighbors (KNN), were implemented using frameworks like Scikit-learn, while Pandas and NumPy supported data preprocessing and numerical computations. Data visualization was achieved through Matplotlib and Seaborn, enhancing analytical insights. For database management, Firebase was utilized to enable real-time data storage and synchronization, particularly for handling sensor inputs. The application deployment was facilitated through Website, ensuring a seamless connection between the back-end processes and user interface. Additional tools for API testing, while Git and GitHub provided robust version control and collaborative development capabilities. These materials collectively provided a solid foundation for UG-AgroPlan system, enabling accurate crop recommendations, effective fertilization guidance, and a user-friendly application interface.
The prototype of this nutrient detection system is the result of research innovation utilizing soil sensors, which provide seven output values from a single sensor, as shown in Figure 2. This sensor is designed to detect various important parameters that influence soil fertility and plant growth. The sensor can measure seven key components: nitrogen (N), phosphorus (P), potassium (K) levels, soil pH, soil moisture, electrical conductivity (EC), and soil temperature. The nutrient detection system, which uses this sensor, is designed to provide real-time data, processed by a machine learning-based system to offer precise fertilizer and crops recommendations. With accurate measurements of these seven parameters, the sensor helps farmers better understand soil conditions in detail, including detecting nutrient deficiencies or excesses in the soil.
The Figure 1 are measurements from the soil sensor are sent to a database connected to the UG-AgroPlan application. This data is used by the application to analyze the types of crops most suited to current soil conditions and offer recommendations for adjusting nutrient levels or crops recommendations. The 7-in-1 soil sensor can be used across various types of agricultural land, making this prototype a potential solution for more efficient and sustainable fertilization scenarios.
Figure 1.
Soil NPK Sensor 7 to 1
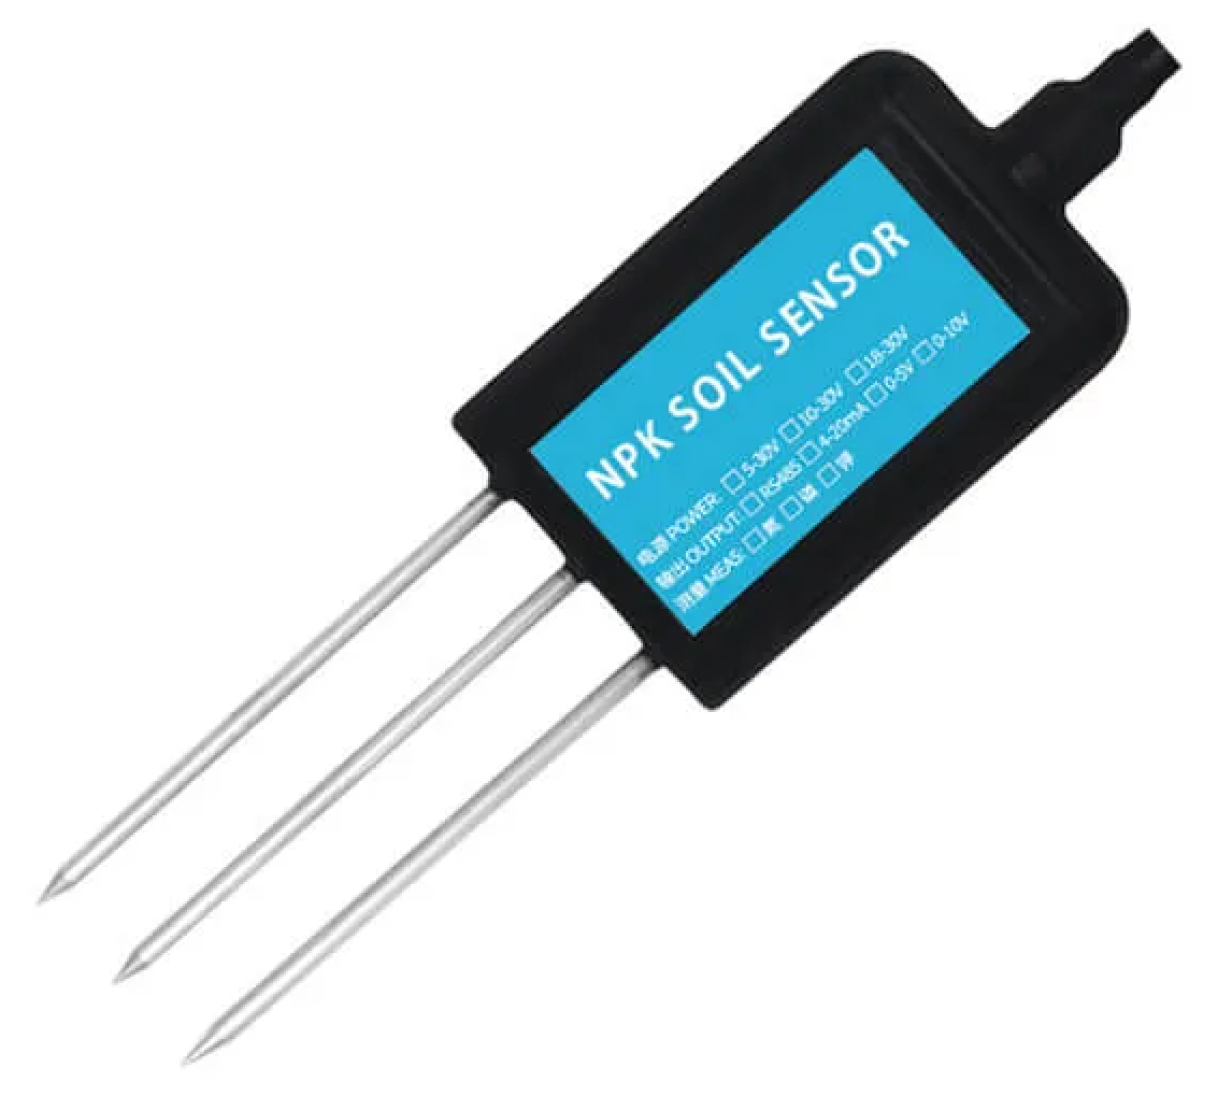
Figure 2.
UG-AgroPlan of the our prototype system. (a.) Our Sensor System for detection N, P, K, and other parameters (pH, EC, Temperature, Moisture), (b). Our Application for crop and fertilizer recommendation
Figure 2.
UG-AgroPlan of the our prototype system. (a.) Our Sensor System for detection N, P, K, and other parameters (pH, EC, Temperature, Moisture), (b). Our Application for crop and fertilizer recommendation
2.2. Methods
The research methodology comprises four main stages, which are integrated to develop the UG-AgroPlan system as an AI-based solution for crop and fertilization recommendations, as shown in Figure 3.
The first stage involves the development of a sensor system for data acquisition of soil parameters. This system is designed to measure nitrogen (N), phosphorus (P), potassium (K) content, soil pH, moisture, electrical conductivity, and soil temperature. The collected data serves as the basis for determining real-time soil conditions.
The second stage focuses on simulations using seven machine learning models to train a dataset consisting of the parameters obtained from the sensor measurements, including soil type and rainfall data. The aim of this simulation is to evaluate the performance of each model and identify the best-performing model with high predictive accuracy. The selected model is then deployed in the developed application.
The third stage involves the development of the UG-AgroPlan system with IoT and Machine Learning. This study introduces UG-AgroPlan, a decision support application powered by machine learning algorithms, which provides real-time fertilizer recommendations based on soil sensor data. Unlike static models, UG-AgroPlan dynamically adjusts fertilization recommendations in response to changes in nutrient levels, pH, and environmental parameters. This application utilizes the K-Nearest Neighbors (KNN) algorithm, which has been deployed to support two main functions: first, providing crop recommendations based on soil parameter values acquired by the sensors; and second, offering fertilization recommendations when the parameter values decrease. This ensures that nutrient requirements are optimized to maintain soil fertility and support plant growth effectively.
The last stage is to evaluate the practical applicability of the UG-AgroPlan system, a direct cultivation trial was conducted using the Uzbekistan melon variety. This crop was selected due to its specific nutrient requirements and economic value. The trial aimed to assess the effectiveness of UG-AgroPlan in guiding fertilizer dosage per growth phase and improving overall input efficiency. The results of this field experiment serve as the foundation for discussing the system’s accuracy and its potential impact on sustainable crop management.
An UG-AgroPlan system integrates sensor technology, machine learning, and artificial intelligence to promote sustainable agricultural practices. The research methodology consists of several main stages (see Figure 4).
2.2.1. Impelementation Sensor System for Detection Soil Nutrient and Parameters
After implementing the prototype, a calibration process was conducted to compare the laboratory sensor’s measurements with those of the sensor system designed by the researchers for detecting soil nutrients. This sensor system is capable of measuring nitrogen (N), phosphorus (P), potassium (K), soil pH, moisture, temperature, and electrical conductivity. The calibration process ensured that the designed sensor system provided accurate and reliable measurements, which are crucial for generating precise crop recommendations for users.
The calibration process between laboratory measurements and the prototype sensor system was a critical step in ensuring the reliability and accuracy of the data used for further analysis. Initially, the prototype sensor exhibited a wide range of accuracy, with values varying between 34% and 95%, depending on the nutrient parameter measured. This variation highlighted the need for a robust calibration process to align the prototype’s readings with laboratory-standard measurements.
The accuracy (A) for both the laboratory instrument and the prototype sensor was calculated using the formula:
Where: is the measured output from our prototype sensor instrument. is the reference standard value obtained from a certified laboratory.
During the calibration process, discrepancies between the prototype sensor’s measurements and laboratory results were systematically analyzed. A regression-based correction algorithm was applied to minimize errors, thereby aligning the prototype’s readings with the laboratory standards. This iterative process refined the sensor’s output for nitrogen (N), phosphorus (P), potassium (K), pH, moisture, and electrical conductivity. As a result of the calibration process, the prototype sensor’s accuracy improved significantly, achieving an overall accuracy ranging from 97.41% to 97.61% across all nutrient parameters (N, P, K) and other soil characteristics. This enhancement demonstrates the sensor’s capability to provide precise and reliable measurements comparable to laboratory standards.
The successful calibration process underscores the importance of integrating mathematical evaluation and laboratory standards in the development of agricultural sensor technologies. It ensures that the sensor system can serve as a dependable tool for data acquisition in precision agriculture applications. Calibration results with the accurary are considered valid, and the data is subsequently used as part of the data training for dataset or data testing. A comparison between the laboratory equipment and the prototype sensor results for soil nutrients and various soil parameters is also conducted to validate the sensor’s performance and reliability for further research.
2.2.2. Evaluation Training Model with 7 Models
Following the completion of the calibration process in the prototype sensor system, the next stage involves training the dataset. This process begins with the collection of data to be used for model training. Subsequently, data preprocessing is performed to prepare the raw data for analysis. At this stage, soil nutrient values (N, P, K) along with other parameters—such as pH, EC, moisture, and temperature—are labeled according to the associated plant types based on the measured nutrient levels and soil conditions.
Once preprocessing is completed, an outlier analysis is conducted to identify and address any anomalies that may compromise the accuracy of the machine learning model. Outlier data is either treated or removed according to predefined criteria to ensure that the resulting model is robust and capable of generating precise and reliable recommendations. This meticulous approach to training and preprocessing ensures the integrity and quality of the dataset, forming a solid foundation for further stages of the research.
The next phase of the training process involves applying machine learning algorithms to generate crop recommendations. The algorithms used include Support Vector Machine (SVM), Logistic Regression, Decision Tree, K-Nearest Neighbors (KNN), Gradient Boosting, Random Forest, and Gaussian Naive Bayes. This stage focuses on analyzing the relationships between soil parameters and nutrient values (N, P, K) to identify the most suitable crops for specific conditions. The process of training dataset simulation concludes with the selection of the most effective model, which accuracy the K-Nearest Neighbors (KNN) are 98%, deployed within the UG-AgroPlan system based on the performance metrics of each algorithm (between 95% until 100%).
The recommendation of crops using the K-Nearest Neighbors (KNN) algorithm is based on the nutrient content and soil parameters measured through sensors. The KNN model utilizes a labeled dataset comprising historical data of soil nutrient levels (N, P, K), soil pH, moisture, and temperature, along with the types of crops that thrive under those specific conditions. When new sensor data is inputted into the UG-AgroPlan system, the KNN algorithm identifies the "k" nearest neighbors in the dataset—those with the most similar soil nutrient profiles and environmental conditions.
The algorithm calculates the Euclidean distance between the input data and each entry in the training dataset. The shortest distances are considered the nearest neighbors, and the majority class (crop type) among these neighbors determines the recommendation. For example, if the sensor readings indicate high nitrogen levels, moderate phosphorus, low potassium, and neutral pH, the algorithm compares these values with historical data to recommend a crop that thrives under such conditions, such as maize or Mango. After the data training phase is finalized, seven models are evaluated according to the accuracy levels they achieve, as presented in Table 1.
Table 1 presents the accuracy comparison of seven machine learning models applied for crop classification based on soil parameters. Among these, Random Forest and XGBoost achieved perfect accuracy (100%). However, despite the high scores, these models pose potential overfitting risks due to their complexity and lack of interpretability. In contrast, the K-Nearest Neighbors (KNN) algorithm, with an accuracy of 98%, offers a simpler and more interpretable approach. It was therefore selected as the primary model in the UG-AgroPlan system due to its robustness, efficiency, and suitability for real-time classification in resource-constrained environments. Additionally, the KNN model ensures adaptability by updating the dataset with new soil readings and successful crop outcomes, enhancing its accuracy over time. The recommendation process enables farmers to make informed decisions, optimizing soil productivity and crop yield.
The next stage of the process uses the UG-AgroPlan application, developed to assist farmers in receiving crop recommendations tailored to the specific soil conditions of the land they cultivate.
2.2.3. UG-AgroPlan System: Integrated Our Prototype with Artificial Intelligent
In Table 1, the performance evaluation of various machine learning algorithms for crop recommendation based on soil parameters revealed differences in accuracy. Logistic Regression and Decision Tree models both reached an accuracy of 95.00%, whereas SVM and K-NN achieved higher results at 98.00%, indicating strong effectiveness in modeling complex data patterns. Naïve Bayes further increased the accuracy to 99.00%, and both Random Forest and XGBoost reached a perfect accuracy of 100.00%, highlighting excellent classification strength and outstanding results. Overall, the average accuracy obtained from the seven models was 97.86%.
Several studies emphasize that extremely high accuracy results—such as perfect scores—may indicate potential overfitting, particularly when models are applied to datasets that are limited in size or lack diversity. In our study, this condition is observed in models such as Naïve Bayes, Random Forest, and XGBoost, which achieved exceptionally high accuracy, even reaching 100%. Although these models demonstrate excellent classification performance, such results should be interpreted with caution, as they may compromise the model’s generalizability to unseen data.
Based on findings by [44,45], adopting average accuracy and near-perfect but not absolute accuracy values has been considered optimal, as it balances efficiency and accuracy. Similarly, emphasize that this strategy ensures consistent model performance and adaptability, particularly in real-world applications where data variability is significant [46]. This perspective aligns with the goal of achieving reliable predictions while avoiding overfitting, making it a practical choice for precision agriculture. To ensure generalization, models with accuracy values above the average (97.86%) but below the perfect 100.00% were prioritized for implementation. In the proposed web-based application, the K-Nearest Neighbors (KNN) algorithm as the core model for providing crop recommendations based on input features such as soil parameters, climate data, and historical crop yields. Therefore, this model was selected due to its ability to effectively analyze and classify data based on soil parameters and nutrient values, ensuring accurate and reliable crop suggestions for users. This approach balances high performance with practical reliability, minimizing overfitting risks and maintaining robust predictions.
The subsequent step involves providing crop or fertilizer recommendations based on data collected by soil sensors and processed through the web-based UG-AgroPlan system system, which has already been deployed. Soil sensors, such as the NPK Sensor, detect nutrient levels and soil parameters in a specific agricultural field [47]. The collected data is transmitted to the UG-AgroPlan system system, with KNN Models where the machine learning system analyzes it to recommend the most suitable crops based on current soil conditions.
The K-Nearest Neighbors (KNN) algorithm is employed to recommend the most suitable crops based on soil nutrient levels and other parameters. The process begins by considering the sensor data, such as nitrogen (N), phosphorus (P), potassium (K) levels, pH, moisture, and temperature. These parameters are used to represent the data point for the agricultural field in a multidimensional space.
The KNN algorithm operates by calculating the distance between new soil data inputs and all data in the dataset. To determine the similarity between current soil conditions and existing crop data, the system uses the Euclidean distance formula in the K-Nearest Neighbors (KNN) algorithm. The distance between the input soil feature vector and each training data point is calculated as:
Where is the value of the Euclidean distance for each raw data, n is the total number of parameters, represent the values of the soil parameters of the new input from the prototype sensor, and denotes the values of the soil parameters from the data set. The variables are the values of the soil parameter (for example for nitrogen (N), for phosphorus (P), for potassium (K), for pH, for moisture, for temperature and for Rain Intensity) in the input and training sample, respectively. The KNN algorithm selects the top-k crops with the smallest distance as the most suitable for the current soil profile.
After calculating the distances, the algorithm identifies the K nearest neighbors, where K is the number of data points with the smallest distance from the new input. The majority class or crop label of these nearest neighbors is then used to determine the crop recommendation. In this study, the system uses , balancing accuracy and computational efficiency. For example, if the new input data (output sensor) closely matches the data for "Corn" in the dataset, the algorithm will recommend "Corn" as the most suitable crop.
The dataset utilized in this study includes soil parameters for various crops under optimal growth conditions. The test results demonstrated that KNN effectively provides accurate crop recommendations by considering the non-linear relationships between soil parameters and crop types. For instance, in a trial scenario, new soil data with parameters: N=50 ppm, P=30 ppm, K=20 ppm, pH=6.5, Moisture=40%, Temperature=25 ∘C, rainfall=120 mm were processed using KNN. The distance results to three crops in the dataset were: Corn: 5.39, Mango: 3.61, Rice: 10.34. With , the nearest neighbors were Mango and Corn, leading the algorithm to recommend "Mango" as the most suitable crop.
The implementation of the KNN algorithm yielded satisfactory results for soil data-based crop recommendation applications. With its simple yet effective capabilities, KNN can accommodate various data variability, making it an ideal choice to support precision agriculture. This study also adopted a rigorous evaluation approach to ensure that the model provides recommendations that are not only accurate but also practically relevant.
This method ensures that the recommendation is tailored to the specific soil conditions of the field. Additionally, if adjustments to nutrient levels are required to optimize the soil for the recommended crop, the system provides detailed guidance for such adjustments. By leveraging KNN, the UG-AgroPlan system system offers accurate and actionable crop recommendations based on real-time soil data.
In addition, the system offers flexibility by providing recommendations for nutrient adjustments when the soil is intended for crops other than those initially suggested by the AI-based machine learning model. If the user chooses to plant alternative crops, the UG-AgroPlan system system generates fertilizer recommendations based on soil data analysis, including nitrogen, phosphorus, potassium (NPK) requirements, and other key parameters such as soil pH, moisture, and temperature. For instance, if a farmer opts to grow a crop that requires higher nitrogen levels than currently available in the soil, the application will recommend appropriate nitrogen supplementation. Similarly, if phosphorus levels are too high for the selected crop, the system will suggest adjustments to optimize soil conditions, ensuring successful cultivation.
Calculating surpluses or deficits of nutrients (also other parameters) begins by defining the standard nutrient requirements of the crop to be cultivated, such as nitrogen (N), phosphorus (P), potassium (K), soil pH, moisture, rainfall, and temperature. These standards serve as benchmarks for comparison. Subsequently, soil sensors collect real-time data on the actual nutrient content and soil conditions in the targeted area. To determine the suitability of current soil conditions for a target crop, the UG-AgroPlan system performs a comparative analysis between sensor readings and the reference average values for each nutrient and parameter. The difference is calculated by subtracting the sensor value from the standard reference (mean) value:
Where X are mean of represents each parameter (e.g., N, P, K and soil parameters). The interpretation of the result is as follows:
- If , this indicates a deficiency, meaning the parameter is below the optimal range and must be increased—for nutrients such as nitrogen, phosphorus, and potassium, this triggers a fertilizer recommendation.
- If , this indicates a surplus, meaning the parameter is above the recommended level. In such cases, no fertilizer application is advised, and the system may suggest delaying further nutrient input to prevent over-fertilization.
That rule-based logic allows the UG-AgroPlan system to provide dynamic and precise recommendations, particularly for macronutrients (N, P, K), which have a significant influence on plant growth. Adjustments for other environmental parameters such as pH, temperature, and moisture are noted but not automatically corrected within the current system and require agronomic intervention or separate ecosystem management.
To illustrate the application, consider a set of real soil data with the following values: N = 50 ppm, P = 30 ppm, K = 20 ppm, pH = 6.5, Moisture = 40%, Temperature = 25°C, and Rainfall = 120 mm. When the farmer intends to cultivate rice (Oryza sativa) on this field, it becomes necessary to compare these soil conditions against the optimal nutrient and environmental requirements for rice, as presented in Table 2. This comparison enables the UG-AgroPlan system to identify which nutrients require adjustment through fertilization, while also highlighting non-nutrient parameters that may limit crop suitability and should be managed through external interventions such as irrigation, drainage, or microclimate modification.
In this study, adjustment of soil conditions is carried out using Equation (3), for example demonstrate Nitrogen of the nutrient adjustment process, consider the nitrogen (N) content detected by the soil sensor. In this case, the sensor reading shows a nitrogen concentration of 50 ppm, while based on the crop requirement listed in Table 2, the acceptable nitrogen range for optimal rice cultivation is from 60 ppm to 99 ppm. For standardization in this study, the system uses the average required value as the reference target, calculated as:
The difference between the average target value and the actual sensor reading is then computed to determine the nitrogen deficit by Equation (3):
The result indicates that the soil is lacking 29.50 ppm of nitrogen compared to the standard requirement for rice. This value is then used by the UG-AgroPlan system to calculate the appropriate fertilizer dosage needed to close the nitrogen gap.
For the crop rice, based on the analyzed data, the following are the recommended adjustments for nutrients and soil parameters for rice cultivation:
- The nitrogen (N) level needs to be increased by 29.50 ppm from the current level.
- The phosphorus (P) level needs to be increased by 17.50 ppm to reach optimal levels.
- The potassium (K) level needs to be increased by 20.00 ppm.
- The soil temperature needs to be reduced by -1.51°C to reach optimal conditions.
- Soil humidity needs to be increased by 42.55%.
- The soil pH needs to be adjusted with a reduction of -0.06 to match the optimal pH for apple cultivation.
- Rainfall also needs to be increased by 120.56 mm to meet water requirements.
The focuses on balancing the three primary macronutrients: nitrogen (N), phosphorus (P), and potassium (K). The adjustment process is executed by applying fertilizers specifically formulated to address deficiencies or surpluses of these macronutrients, ensuring the soil meets the nutritional requirements of the intended crop. Other environmental parameters—such as pH, moisture, temperature, and rainfall—are not yet adjusted within the current system framework and would require additional treatment strategies and ecosystem management practices specific to the agricultural land’s characteristics.
To convert the nutrient deficit from ppm to kilograms per hectare (kg/ha), the following general formula is used:
Where the soil depth of 20 cm, representing the effective root zone and a bulk density of 1.3 g/cm³, which is the typical average for mineral soils.
These calculated values represent the recommended amount of nutrients that need to be added to the soil via fertilization in order to meet the average optimal requirements for rice cultivation, and are used by UG-AgroPlan to generate precise fertilizer recommendations in the field.
To address nutrient imbalances, the system provides targeted recommendations. Excess nutrients can be managed by reducing fertilizer application or employing soil leaching techniques, while deficits are addressed by adding specific amounts of fertilizer. For example, if the deficit for nitrogen is 20 kg/ha, and Urea (46% nitrogen content) is used, the required amount of Urea is calculated as 20/0.46≈43.5 kg/ha. This process ensures precise nutrient management, and when integrated into the UG-AgroPlan system system, it automates recommendations for maintaining optimal soil conditions for crop cultivation.
3. Results
3.1. Sensor Calibration Process and Laboratory Benchmarking
To ensure the accuracy and reliability of the developed NPK sensor system, a calibration process was conducted by comparing the sensor readings with laboratory-based measurements across a total of 50 soil samples. These samples were collected from various agricultural fields in West Java, Indonesia, representing a wide range of soil conditions, including differences in fertility levels, pH, moisture content, and texture. This diversity was critical to assess the sensor’s generalization capability under real-world conditions.
Each soil parameter—namely nitrogen (N), phosphorus (P), potassium (K), soil pH, temperature, moisture, and electrical conductivity (EC)—was calibrated using an absolute error evaluation formula. A regression-based correction algorithm was applied iteratively to minimize discrepancies.
The calibration process of the soil sensing system was conducted to evaluate the accuracy of the custom-designed NPK sensor prototype developed in this study. The calibration involved a comparative assessment between the readings from the prototype device and those from standard laboratory instruments. In this procedure, only one (1) unit of the UG-AgroPlan using NPK sensor (labeled as SS) was used to measure multiple parameters simultaneously, including nitrogen (N), phosphorus (P), potassium (K), temperature, pH, electrical conductivity (EC), and humidity.
In contrast, the laboratory benchmarking setup required five (5) separate specialized instruments, each dedicated to measuring a specific soil parameter. These instruments are labeled as follows:
- AL-1: for temperature, pH, and humidity,
- AL-2: for electrical conductivity (EC),
- AL-3: for nitrogen (N),
- AL-4: for phosphorus (P),
- AL-5: for potassium (K).
The calibration process involved collecting simultaneous readings from both the prototype and the laboratory instruments under identical soil conditions. The data were then analyzed using statistical methods (1), to assess the accuracy and reliability of the prototype sensor.
An illustration of the overall calibration setup and workflow is presented in Figure 5, while the results of the calibration test—including accuracy percentages for each parameter—are summarized in Table 3. These results serve as a validation of the system’s capacity to provide accurate real-time soil measurements, which are critical for supporting precision agriculture recommendations and the calibrated sensor system achieved an average accuracy of over 97% across all parameters when benchmarked against certified laboratory results.
This validation confirms that the sensor prototype delivers measurements that are highly comparable to laboratory standards, thereby supporting its application for real-time data acquisition in precision agriculture. The validated data were subsequently integrated into the training and testing phases of the machine learning models used within the UG-AgroPlan system system. These results demonstrate the sensor’s robustness and scientific reliability, making it a viable component for AI-based crop and fertilizer recommendation systems.
The prototype NPK nutrient detection system has been successfully developed, and to detect soil nutrients, a system is required to assess the nutrient status in plants, determining whether nutrients are sufficient, excessive, or lacking based on the gap from the plant’s nutrient requirements. To test the system’s functionality from our prototype, detection tests were conducted on several soil samples using the system developed in this research, with laboratory instruments as a comparison. The results of the system testing on several soil samples were then calibrated to achieve the model with the highest accuracy and precision, with an average error evaluation of each value being around 3% or close to 0% (see Table 3). The system achieved higher calibration accuracy (ranging from 97.41% to 97.61%) compared with previous studies using similar NPK sensor systems [18].
Based on the accuracy results presented in the Table 3, after recalibrate the prototype sensor demonstrated high accuracy across all measured parameters. The accuracy of results for our prototype sensor showcases its exceptional performance across various soil parameters. For macronutrient detection, nitrogen (N) achieved an accuracy of 97.5%, phosphorus (P) 97.41%, and potassium (K) 97.53%, demonstrating precise nutrient measurement capabilities. The sensor also excelled in assessing soil pH with an accuracy of 97.52%, ensuring reliable monitoring of soil acidity or alkalinity levels.
Additionally, the prototype effectively measured soil electrical conductivity (EC) with an accuracy of 97.44%, highlighting its ability to evaluate salinity conditions. The highest accuracy, 97.61%, was recorded for soil moisture, critical for optimizing irrigation strategies. Similarly, the soil temperature sensor attained an accuracy of 97.42%, further confirming its reliability in capturing environmental conditions.
Overall, these results validate the calibration process and affirm the sensor’s potential for practical application in precision agriculture, achieving laboratory-grade accuracy across all tested parameters.
3.2. The Machine Learning Model for Soil-based Crop Recommendations
3.2.1. Training Process of the 7’s Model
The training data process for this plant recommendation system involves the use of several machine learning algorithms to ensure the most accurate predictions for recommendations. Each algorithm has a different approach to processing data and providing recommendation results. Therefore, each algorithm will be tested to evaluate its performance in predicting fertilization recommendations based on the collected dataset. The goal of this process is to find the algorithm that yields the highest accuracy, ideally close to best accurated predictions (nearly 100%). In this study, seven algorithms are used for training data, namely: Decision Tree, Naive Bayes, Support Vector Machine (SVM), Logistic Regression, Random Forest, K-Nearest Neighbor (KNN), and XGBoost.
After evaluating the performance of these seven algorithms, the one with the highest accuracy can be selected as the main model for the fertilization recommendation system. This training process not only ensures that the system can provide accurate predictions but also considers efficiency in processing soil data and delivering appropriate fertilizer recommendations, ultimately enhancing crop yields and improving fertilizer use efficiency for farmers.
Based on the accuracy results, Figure 6 for all algorithms used demonstrate very good performance with high accuracy values. The Decision Tree and Logistic Regression algorithms have the lowest accuracy at 95%, which is still considered excellent in the context of agricultural data processing and fertilization recommendations. Meanwhile, the algorithms with the highest accuracy are Random Forest and XGBoost, achieving a perfect accuracy value of 100%. This indicates that Random Forest and XGBoost algorithms are more effective in handling the complexities of soil nutrient data and other parameters, such as nitrogen (N), phosphorus (P), potassium (K), pH, soil conductivity, and temperature. An accuracy of 100% also reflects the capability of these two algorithms to produce highly accurate predictions for precise fertilization recommendations. The Random Forest and XGBoost algorithms can provide optimal recommendations for farmers, assisting them in determining the appropriate types of crops and fertilizer doses according to soil conditions, thereby enhancing productivity and efficiency in agricultural management.
During the data testing process using machine learning models, tests were conducted by inputting the following soil parameter data: nitrogen (N) concentration of 64.37 ppm, phosphorus (P) of 68.17 ppm, potassium (K) of 60.94 ppm, soil temperature of 13.68°C, humidity of 75.18%, soil pH of 6.78, and rainfall of 23.97 mm. This data was then processed through several previously trained machine learning algorithms, including KNN, Random Forest, XGBoost. and the accuracy results are shown in Figure 7.
Based on the analysis results from several algorithms, various types of plants were recommended as suitable candidates for planting in the area. However, among all the tested models, algorithms such as Random Forest and KNN consistently recommended papaya as the most suitable crop for the soil conditions. While Random Forest and XGBoost achieved perfect accuracy (100%) during training, the decision to deploy K-Nearest Neighbors (KNN) in the UG-AgroPlan system system was driven by practical and technical considerations. First, KNN demonstrated a high level of accuracy (98%)—well above the average of all models tested—while maintaining simplicity in implementation and interpretability. This balance makes KNN more suitable for real-time deployment on edge devices or web-based systems with limited computational resources. After this data is entered into the UG-AgroPlan system, the machine learning system within the application will analyze the data and compare it with the pre-trained reference dataset. The result of this analysis produces the recommended crop that is most suitable for current soil conditions, which is the recommendation for papaya crops.
Models with perfect training accuracy often raise concerns of overfitting, particularly in cases where the dataset is limited in size or diversity. KNN, in contrast, is more robust against such risks, especially when the training data is periodically updated with new field samples, as is the case in our application. Its non-parametric nature also allows for continuous adaptation without requiring model retraining, which aligns with the real-time, user-driven architecture of UG-AgroPlan system.
Moreover, from a usability perspective, KNN’s recommendation results are easier to trace and explain, allowing agricultural extension workers and farmers to understand the basis of each crop suggestion. This transparency fosters trust in the system, which is crucial for technology adoption in rural and smallholder farming contexts. Therefore, the selection of KNN was not only based on its strong predictive performance but also its suitability for real-world agricultural applications, where generalization, adaptability, and simplicity are equally critical.
This recommendation is based on the balance of nutrient levels (NPK), temperature, humidity, and pH that meet the growth needs of papaya, as well as environmental conditions such as rainfall that support optimal papaya growth in the area. Based on the testing results using the obtained data, the plant recommendation generated by the K-Nearest Neighbors (KNN) algorithm indicates that papaya is a suitable crop for cultivation. However, if farmers choose to plant apples in the same agricultural land, machine learning provides an in-depth analysis of the nutrient needs and other soil parameters. With this analysis, farmers can make more informed decisions regarding fertilization and soil management for apple cultivation, thus aiming to enhance productivity and harvest success.
3.2.2. Training Process of the K-Nearest Neighbors (KNN) Model
In Figure 8, our research to develop a reliable machine learning model for soil-based crop recommendations, the K-Nearest Neighbors (KNN) algorithm was selected due to its simplicity, interpretability, and proven robustness in classification tasks using small-to-medium datasets. The training process of the KNN model involved several systematic stages to ensure the accuracy and generalizability of the model.
Dataset Preparation and Labeling
Soil data were collected from agricultural fields located in Jawa Barat, Indonesia, using the custom-built soil sensor module. Each data record contained seven soil parameters: nitrogen (N), phosphorus (P), potassium (K), pH, electrical conductivity (EC), soil moisture, and soil temperature. The sensor readings were calibrated using laboratory-based measurements to ensure their validity and accuracy. After calibration, the dataset underwent cleaning, removal of outliers, and handling of missing values to enhance data quality.
Each record was then labeled based on standard agronomic nutrient sufficiency thresholds provided by the Minister of Agriculture of Indonesia (MoA). The labeling process classified each sample into nutrient categories (Low, Medium, or High) for N, P, and K, as well as associated each soil condition profile with specific crop types that are suitable for those conditions. This process transformed the soil data into a multi-class classification dataset suitable for supervised learning.
In this study, a comprehensive soil dataset was collected using our custom-built soil sensor system to support the development of the UG-AgroPlan recommendation platform. The data acquisition was conducted across several agricultural field sites located in Indonesia. The dataset consists of soil nutrient and environmental parameter measurements associated with 18 different crops, coded from C-1 to C-18, as detailed in Table 4.
Each of 17 crops — namely apple (C-1), banana (C-2), coconut (C-3), coffee (C-4), cotton (C-5), grapes (C-6), kidneybeans (C-7), maize (C-8), mango (C-9), mothbeans (C-10), mungbean (C-11), muskmelon (C-12), orange (C-13), papaya (C-14), pomegranate (C-15), rice (C-16), and watermelon (C-18) — we collected approximately 200 samples per crop.
Additionally, for Uzbekistan melon (C-17), which serves as the primary target crop in this study, we collected a more extensive dataset of 300 samples to establish a precise reference for its ideal nutrient and environmental requirements. This larger sample size provides a more robust basis for training and validating the recommendation model for this specific crop.
Data sample in the dataset includes measured values for Macro-nutrients: Nitrogen (N), Phosphorus (P), and Potassium (K). Also Soil and climate parameters: Soil temperature (°C), humidity (%), soil pH, and rainfall (mm)
In Table 4 presents the minimum and maximum observed values of these parameters for each crop,. These ranges represent the boundary conditions of soil profiles associated with successful crop growth observed in the field. For instance, crops like apple (C-1) require relatively high potassium (195–205) and moderate humidity (90–95%). In contrast, Uzbekistan melon (C-17) shows a preference for high potassium (70–110) and relatively low rainfall (40–60 mm), which differs from most other crops.
Dataset Splitting and Normalization
To ensure the robustness and generalization capability of the classification model, the collected dataset was first subjected to a systematic splitting and normalization procedure. The full dataset consisted of soil parameter records from 18 crops, including 17 crops with 200 data samples each and Uzbekistan melon (C-17) with 300 samples, resulting in a total of 3,700 individual records. Each record comprised seven attributes: nitrogen (N), phosphorus (P), potassium (K), soil temperature, soil humidity, soil pH, and rainfall.
Before training the model, the dataset was randomly shuffled and partitioned into two subsets using a stratified random split to preserve the proportional distribution of each crop class. The initial dataset preparation, the full dataset of 3,700 samples (17 crops × 200 samples, and Uzbekistan melon (C-17) equal 300 samples) was successfully partitioned using a stratified random split. This produced two subsets with the following distribution: a). training set: 3,040 samples (80%) and testing set: 760 samples (20%)
The stratified splitting preserved the class balance, with each of the 17 crops contributing 160 samples to training and 40 to testing, and Uzbekistan melon contributing 240 samples to training and 60 to testing. This ensured that all crop classes were adequately represented during both the learning and evaluation phases, preventing class imbalance bias in the K-Nearest Neighbors (KNN) classifier.
Prior to training, all numeric features (N, P, K, temperature, humidity, pH, and rainfall) were normalized using Min–Max scaling. Since the soil parameter values vary on different scales (e.g., nitrogen can reach >100, while pH values range from 3.5–9.9), feature scaling was applied to eliminate magnitude-based bias during distance computation in the K-Nearest Neighbors (KNN) algorithm, which is sensitive to feature scale.
Normalization was performed using Min–Max scaling as defined in Equation (7) :
where: x is the original value, and is the normalized value scaled between 0 and 1. The values were computed from the training data for each feature to avoid data leakage.
After normalization, the value ranges of all features were successfully transformed into the interval [0, 1] as shown Table 5. This normalization ensures that all soil attributes contribute equally to the distance metric during KNN classification. No information leakage was detected during this process because the normalization parameters ( and ) were calculated exclusively from the training set and then applied to the testing set. After scaling, all features (N, P, K, temperature, humidity, pH, and rainfall) had values within the range [0,1], allowing the KNN model to rely on the relative patterns among features rather than their absolute magnitudes.
Parameter Tuning and Model Training
The KNN algorithm requires selecting the hyperparameter k, representing the number of nearest neighbors considered for classification. Several candidate values of k were tested, including 1, 3, 5, 7, 9, 11, 13, and 15. For each k, the model was trained using the training dataset and evaluated on the testing dataset. Performance metrics, including overall accuracy, precision, recall, F1-score, and confusion matrix, were computed to assess the classification quality. Cross-validation was also conducted to verify model stability and reduce the risk of overfitting.
Table 6 presents the performance of the K-Nearest Neighbors (KNN) classifier under different values of k when applied to the soil nutrient classification task using the UG-AgroPlan dataset. The results show a clear trend: as the increases from 1 to 5, the classification accuracy improves from 96.2% to 98.1%, indicating a reduction in model variance and improved generalization capability. However, beyond , the accuracy begins to decline slightly, with 97.8% at and 96.5% at , suggesting that higher may lead to over-smoothing and potential underfitting.
Model Selection and Finalization
The comparative evaluation showed that the accuracy tended to increase when k increased from 1 to 5, Then plateaued or slightly decreased at higher k values. While achieves relatively high accuracy, it shows signs of overfitting as it is highly sensitive to noise and outliers in the training data. In contrast, provides the optimal balance between bias and variance, producing the highest accuracy and stable performance across multiple validation trials.
In particular, the configuration using consistently achieved the highest accuracy ( 98%) with stable performance across multiple runs, while avoiding overfitting. Therefore, was selected as the final configuration for the KNN model in this study, as it effectively captures the complex patterns of soil nutrient variability without compromising generalization to unseen data and integrated into the UG-AgroPlan system for real-time field deployment.
3.3. UG-AgroPlan Application
UG-AgroPlan system is an innovative application designed to assist farmers in making optimal fertilization decisions. This application accepts various input parameters such as soil parameters, crop types, nitrogen (N), phosphorus (P), potassium (K), pH, temperature, humidity, and rainfall values obtained from rainfall station information. AgroPlan provides two options for users to input data: through Manual Input or Sensoric System. Manual Input allows farmers to directly enter data into the application, while the Sensoric System enables automatic data collection from sensor systems integrated with the Internet of Things (IoT) platform.
This simulation was conducted to evaluate the ability of the UG-AgroPlan system to provide crop and fertilization recommendations based on soil nutrient data and environmental parameters. The UG-AgroPlan system is designed to help farmers analyze land conditions in real-time using sensors that measure nutrient levels and soil parameters such as nitrogen (N), phosphorus (P), potassium (K), temperature, humidity, pH, and rainfall.
The illustrates the fertilizer dosage recommendations generated by the UG-AgroPlan system for each growth stage of the selected crop see Figure 9). The values are based on real-time soil nutrient analysis and crop-specific nutrient requirements. The system adjusts nitrogen (N), phosphorus (P), and potassium (K) applications accordingly, ensuring optimal supply for each phase. Notably, nitrogen is emphasized in the early vegetative phase, phosphorus is focused around root development and flowering, while potassium increases significantly during fruit development to improve quality and yield.
In Figure 9, Electrical Conductivity (EC) data was excluded from the machine learning training and classification process. Although EC was measured as part of the soil monitoring parameters, it was not considered in the model due to inconsistent correlation patterns observed during preliminary analysis. Additionally, rainfall data was not directly measured through on-site sensors but was instead obtained from an external meteorological source that provides historical and real-time rainfall intensity data specific to the experimental farming location.
The input data collected from the integrated soil sensor system is as follows: Nitrogen (N) = 64.37 ppm, Phosphorus (P) = 68.17 ppm, Potassium (K) = 60.94 ppm, Soil Temperature = 13.68 ∘C, Soil Humidity = 75.18 %, Soil pH = 6.78, and Rainfall = 23.97 mm. Each of these parameters is evaluated against a corresponding minimum limit, maximum limit, and average value as presented in Table 7, which outlines the optimal range requirements for the target crop.
As described in the previous, the implementation of the UG-AgroPlan system in this study provides two types of recommendations based on soil data collected by our sensor system: (i) crop recommendation, which identifies the most suitable crop according to the measured soil nutrient and environmental parameters using the K-Nearest Neighbors (KNN) classification model, and (ii) fertilizer dosage recommendation, which determines the required amount of macronutrients (N, P, and K) for the selected crop.
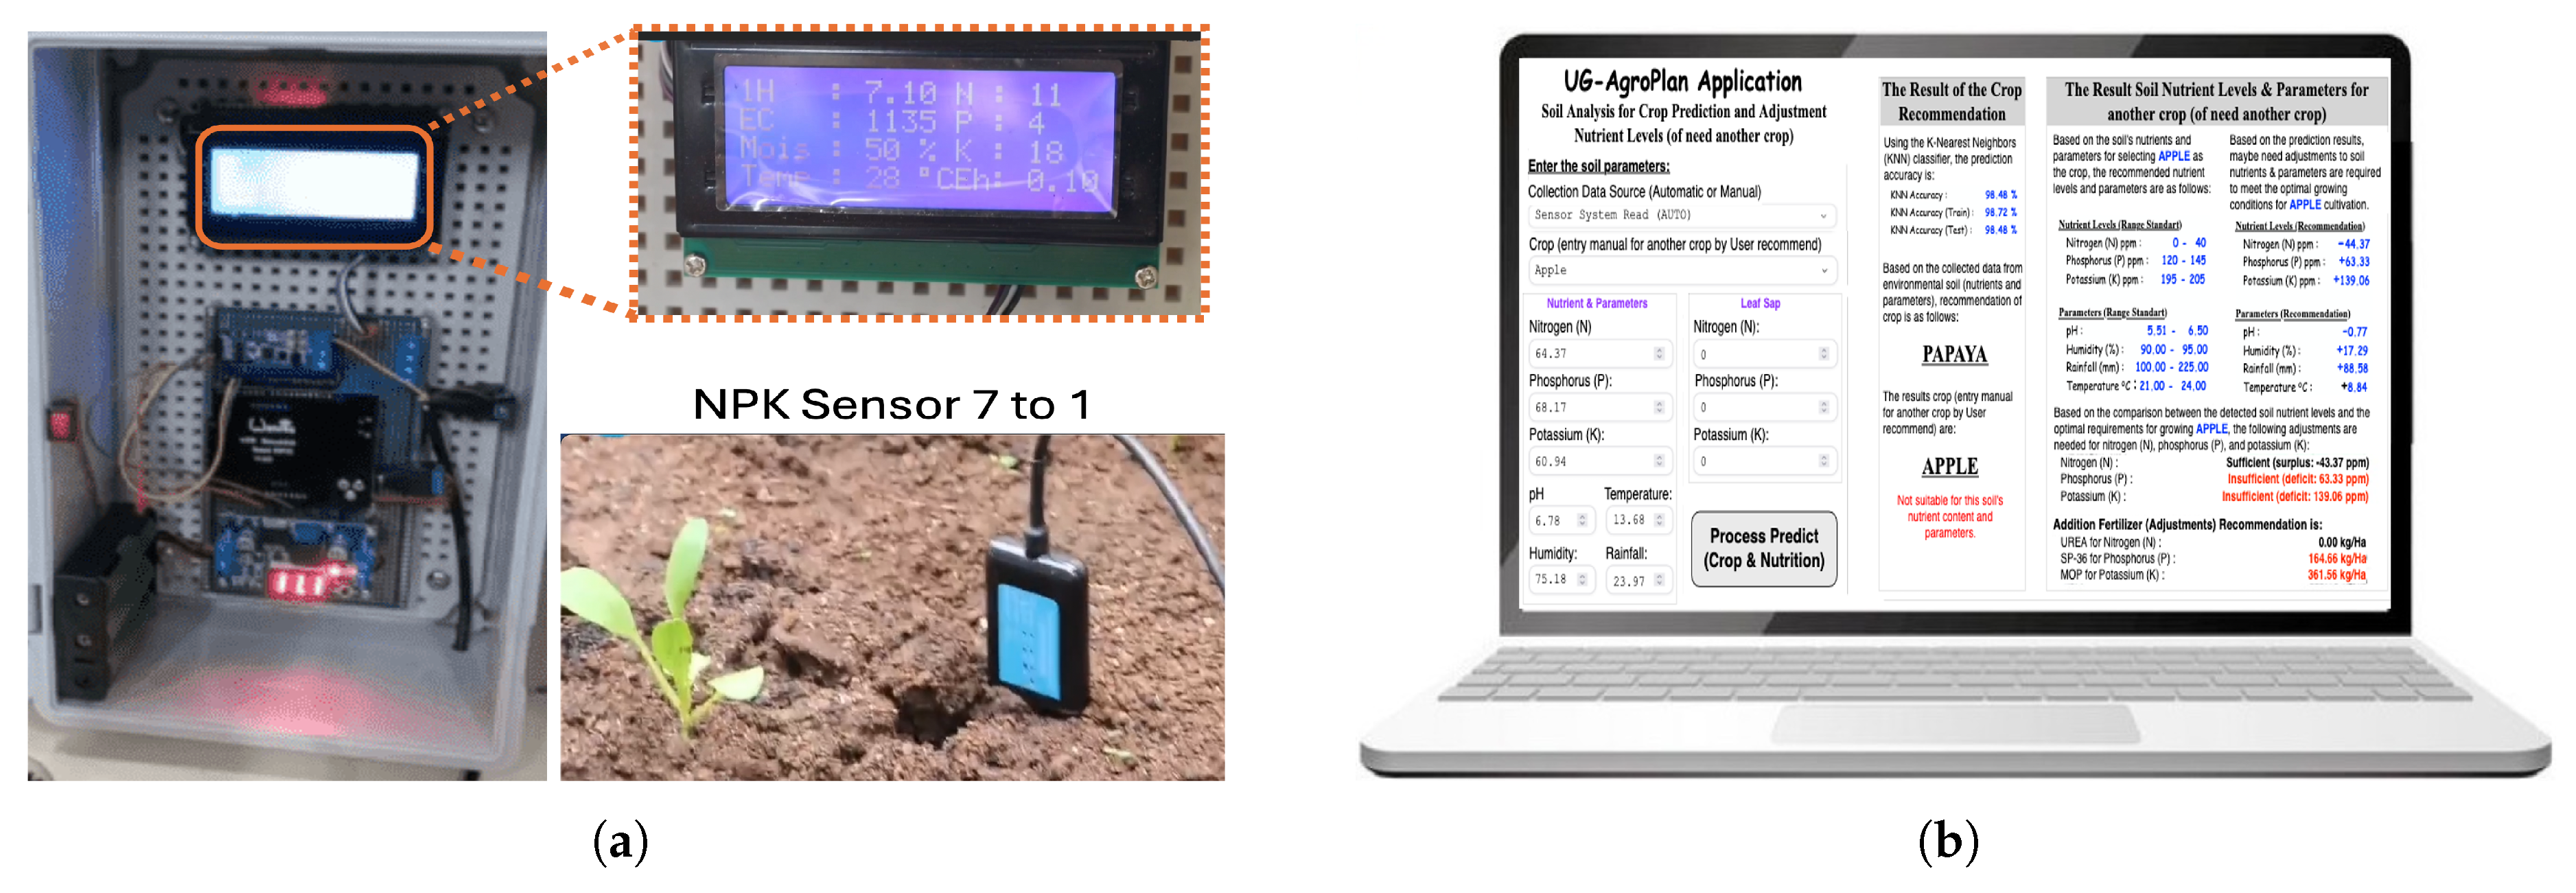
The fertilizer recommendation as illustrated in Figure 9, an example scenario is presented showing two crops: apple as the crop chosen manually by the farmer (user input) and papaya as the crop predicted by the KNN model based on the measured soil data.
The system supports two operational scenarios for fertilizer recommendation:
-
Scenario 1 (Matching Recommendation):If the crop selected by the farmer matches the crop recommended by the KNN model (e.g., both are papaya), the system directly provides the appropriate fertilizer dosage based on the measured soil nutrient values without requiring any adjustment. In this case, the soil profile already aligns with the optimal nutrient and environmental conditions of the selected crop, and the system simply informs the user of the exact N, P, and K amounts needed (see Figure 10(a)).
- Scenario 2 (Non-matching Recommendation): If the crop selected by the farmer (e.g., apple) does not match the crop predicted by the KNN model (e.g., papaya), the system calculates the difference between the current soil nutrient levels and the ideal nutrient requirements of the farmer-selected crop. It then recommends an adjusted NPK dosage to achieve the target soil composition suitable for the desired crop (see Figure 10(b)).
In both scenarios, the UG-AgroPlan system operates in real time, providing immediate feedback on nutrient sufficiency or deficiency for the target crop. This feature enables farmers to make informed decisions about fertilization, reducing the risk of over- or under-application and optimizing soil nutrient management to support sustainable crop production.
3.3.1. Two-Stage Crop Recommendation (Manual or Automatic) Using the KNN Method
The crop recommendation testing was conducted using a two-stage approach based on the K-Nearest Neighbors (KNN) classification method. In both stages, the same soil sensor input data was utilized, including parameters such as nitrogen (N), phosphorus (P), potassium (K), temperature, humidity, pH, and rainfall.
In the first stage, the user manually proposed papaya as the crop to be cultivated on the given agricultural land. The UG-AgroPlan system processed the soil data using the KNN model and returned papaya as the most suitable recommendation—confirming the user’s initial proposal. As shown in Figure 10(a), the soil condition already met the crop requirements for papaya, and thus, no additional fertilization or parameter adjustment was necessary. However, if the measured values of one or more soil parameters—particularly macronutrients such as nitrogen (N), phosphorus (P), and potassium (K)—fall outside the defined lower or upper limits for papaya cultivation (as listed in Table 7), the system triggers an adjustment procedure. This involves calculating the deviation from the optimal range and recommending precise fertilizer inputs to bring the nutrient levels within the acceptable thresholds. This ensures that even when the crop recommendation aligns with the user’s intent, correction actions are still advised if the soil conditions do not fully meet crop-specific requirements.
In the second stage, using the same sensor data, the user requested apple as the intended crop for cultivation. However, the KNN model determined that papaya remained the most suitable crop for the given soil profile. Since the user’s preference was to plant apple instead, the UG-AgroPlan system automatically performed an adjustment analysis using Equation (3) to identify the nutrient and environmental gaps between the actual soil conditions and the optimal requirements for apple.
The system then generated specific fertilizer and parameter adjustment recommendations to support the successful cultivation of apple under the existing conditions. These recommended interventions—such as increasing phosphorus and potassium levels or optimizing moisture—are visualized in Figure 10(b), demonstrating how the system adapts to user preferences even when the initial conditions are suboptimal for the desired crop.
Two-stage test highlights the flexibility of UG-AgroPlan in accommodating both data-driven recommendations and user-defined crop preferences, while providing actionable insights to achieve optimal growing conditions.
3.3.2. Evaluation Fertilizer Recommendation: Soil Parameter and Adjustment Nutrient
Based on Equation (3), the system calculates the deviation between the sensor-measured values and the optimal average values for each parameter. These differences are used to determine whether an adjustment is necessary—either through fertilization (for macronutrients such as N, P, and K) or through agronomic interventions (for environmental parameters such as temperature, humidity, pH, and rainfall). In this simulation, the input data collected from soil sensors is as follows; Nitrogen (N) is 64.37 ppm, Phosphorus (P) is 68.17 ppm, Potassium (K) is 60.94 ppm, Soil temperature is 13.68°C, Soil humidity is 75.18%, Soil pH: 6.78, and Rainfall: 23.97 mm.
The calculated adjustment results for each parameter are visualized in Figure 10, which illustrates the direction and magnitude of deviation from the standard reference values. This process ensures that decision-making for crop selection and fertilization is both data-driven and adaptive to real-time soil conditions. Ug-AgroPlan has dual-mode functionality—manual input versus real-time IoT sensing—highlights the adaptability and precision of the UG-AgroPlan system in supporting smart agriculture practices under diverse operational scenarios. Figure 10(a) illustrates a simulation scenario in which soil nutrient and environmental parameters are manually inputted into the UG-AgroPlan system. In this case, the user specifies papaya as the desired crop to be cultivated. The system processes the manually provided values of nitrogen (N), phosphorus (P), potassium (K), pH, moisture, temperature, and rainfall to evaluate the suitability of papaya for the selected soil conditions. If the soil profile matches the crop’s optimal requirements, the system confirms the feasibility of cultivation without requiring fertilizer adjustment (see Figure 9).
In contrast, Figure 10(b) demonstrates a simulation scenario in which the system receives real-time soil data from the IoT-based nutrient monitoring prototype. This configuration allows the UG-AgroPlan system to automatically retrieve current field conditions and process them using the integrated K-Nearest Neighbors (KNN) model. In this case, the selected crop for evaluation is apple. Based on the AI-driven classification outcome, if the soil conditions are not optimal for apple cultivation, the system does not recommend apple as a suitable crop. Consequently, UG-AgroPlan provides specific fertilizer adjustment recommendations to improve soil nutrient balance and environmental parameters, thereby enabling the farmer to make informed decisions for potential crop suitability (see Figure 9).
The analysis shows that the nitrogen (N) nutrient level in the soil is 20.00 ppm on average, while the sensor measurement indicates 64.37 ppm. Therefore, an adjustment of -44.37 ppm is needed to achieve the ideal balance. The phosphorus (P) nutrient level has an average of 132.50 ppm, with the sensor reading 68.17 ppm. This indicates that an adjustment of 63.33 ppm is required for phosphorus, showing a significant deficiency in the soil. For potassium (K), the average level is recorded at 200.00 ppm, while the sensor indicates 60.94 ppm. Thus, an addition of 139.06 ppm is necessary to meet the optimal potassium requirement.
In terms of soil parameters, the average temperature is recorded at 22.52 °C, but the sensor shows 13.68 °C. Therefore, an adjustment of 8.84 °C is needed to create a more conducive environment for plant growth. The average soil humidity is 92.47%, while the sensor measurement shows 75.18%. This indicates that an adjustment of 17.29% is necessary to reach the ideal humidity level. Lastly, the average soil pH is recorded at 6.01, while the sensor shows 6.78, requiring an adjustment of -0.77 to achieve the optimal pH level. As for rainfall, the average is recorded at 112.55 mm, while the sensor measurement indicates 23.97 mm, showing a need for an adjustment of 88.58 mm to ensure the soil receives adequate moisture.
Figure 10.
UG-AgroPlan application for crops and fertilizer recommendations.
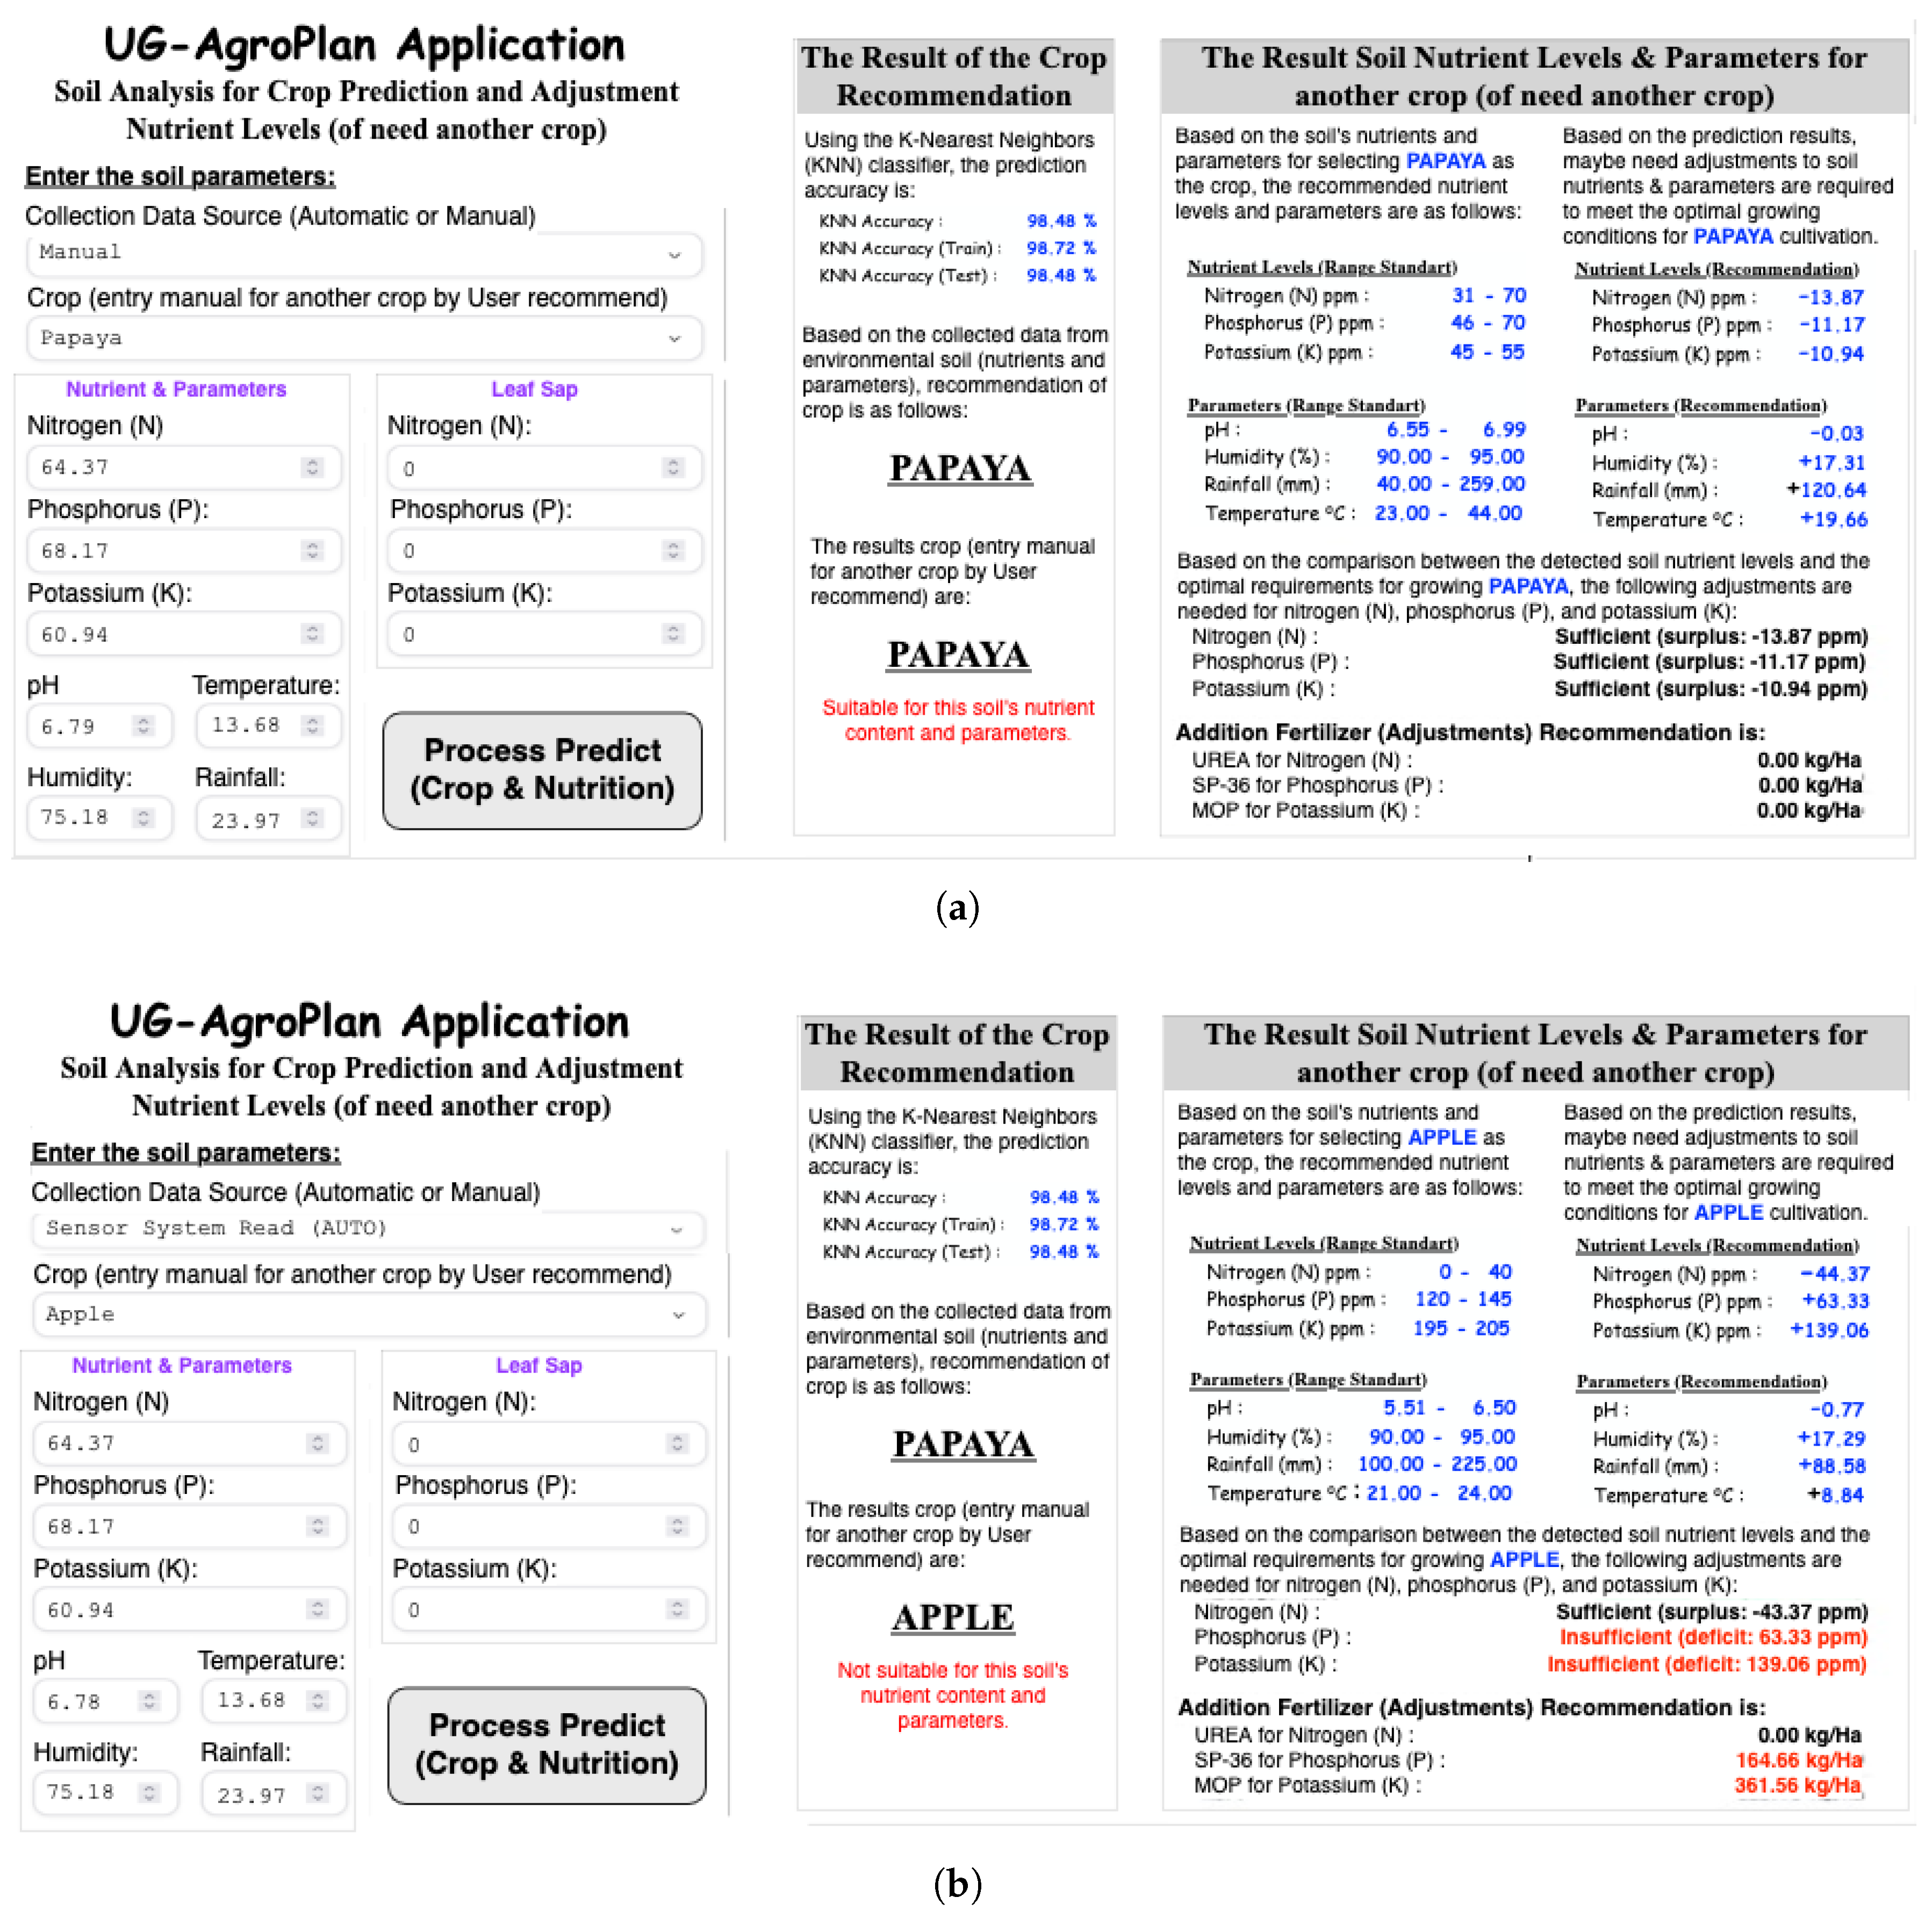
However, this simulation also allows farmers to choose other crops they wish to grow, even if they are not recommended by the system. For example, if a farmer chooses to plant apples on the land, UG-AgroPlan will provide guidance on adjusting the nutrients and soil parameters to needs of the apple crop. But, if the desired crop is papaya and the prediction result using the KNN classifier also indicates papaya, the system confirms that papaya is suitable to be cultivated on the current soil. Therefore, no nutrient adjustment is required.
This simulation demonstrates that the UG-AgroPlan system can provide accurate and detailed guidance on soil nutrients and parameters. With these adjustment recommendations, farmers can efficiently modify land conditions, allowing the desired crop to grow optimally, even if the initial soil conditions are not ideal. This adjustment is formulated based on real-time monitoring results using the UG-AgroPlan system, which accurately detects the actual soil condition and provides precise fertilization recommendations. According to the UG-AgroPlan system, nitrogen fertilization should be reduced or temporarily halted, with a recommended dosage of 0.00 kg/ha, until nitrogen levels return to an optimal balance for apple cultivation.
Meanwhile, the phosphorus deficit requires the application of phosphate fertilizer (SP-36) at 164.66 kg/ha to support strong root development and flowering. Additionally, the potassium deficiency must be addressed promptly by applying MOP (Muriate of Potash) at 361.56 kg/ha, as potassium is essential for improving fruit quality and enhancing the plant’s resistance to environmental stress. UG-AgroPlan helps farmers optimize fertilizer use and maintain environmental balance more efficiently. The results on UG-AgroPlan demonstrate that the application provides recommendations consistent with the previous data testing process using machine learning.
The UG-AgroPlan system generates fertilizer dosage recommendations based on the comparison between the measured soil nutrient levels and the ideal nutrient ranges for the selected crop. The system uses a simple annotation mechanism to guide the user’s corrective actions:
- A “+” sign next to a nutrient or soil parameter indicates a deficit condition, meaning that the current value is below the optimal range. In this case, the system recommends adding additional fertilizer containing the deficient macronutrient (N, P, or K) or applying specific soil treatments to raise the corresponding parameter.
- A “–” sign indicates a surplus condition, meaning that the current value exceeds the recommended range. In this situation, the system advises reducing the fertilizer dosage or applying mitigation treatments (e.g., leaching, soil amendments) to lower the excess nutrient or parameter level.
- If symbol (“–” or “+” sign) is not shown, the nutrient (NPK) levels and other soil parameters are considered within the acceptable range, and no fertilizer adjustment is required value from the sensor falls within the recommended range.
The annotation-based approach allows farmers to quickly interpret the system’s recommendations and take appropriate action to correct nutrient imbalances, ensuring more precise and sustainable fertilizer management.
The application successfully identifies the most suitable crops for the soil conditions and provides fertilization recommendations based on the analysis of soil nutrients and parameters. These findings confirm that the UG-AgroPlan system can reliably deliver accurate recommendations, aligning with the predictions from the tested machine learning algorithms. Additionally, UG-AgroPlan provides fertilizer dosage recommendations for SP-36 and MOP fertilizers. This feature allows farmers to determine the correct fertilizer dosage based on soil analysis performed by the sensor. As illustrated in Figure 10 (in the lower right section of the image), the application presents recommended dosages for various types of fertilizer, assisting farmers in applying the correct nutrients to the crops they cultivate. These suggestions enable more efficient and effective fertilizer use, enhancing crop productivity while preserving the soil’s nutrient equilibrium.
3.4. Field Trial: Crop Recommendation and Fertilization Adjustment for Uzbekistan Melon Cultivation
The practical effectiveness of the UG-AgroPlan system, a field trial was conducted on the Uzbekistan melon (Cucumis melo)—a premium melon variety known for its sweetness and sensitivity to soil nutrient balance. The trial was carried out on a 100 m² test plot at University of Gunadarma Technopark in Cikalong Village, Cianjur, West Java, characterized by loamy soil with moderate drainage.
To evaluate the effectiveness of the UG-AgroPlan system, field experiments were conducted using Uzbekistan melon (Cucumis melo). Two distinct fertilization scenarios were implemented to compare conventional fixed-schedule practices with the proposed precision-based approach.
In the conventional fertilization scenario, nutrient application was performed according to a predetermined schedule commonly used by local farmers. Fertilizers were applied at fixed intervals and uniform rates throughout the crop cycle without considering the real-time soil nutrient status. No daily soil measurements were taken, and nutrient management decisions were based solely on general agronomic recommendations. This scenario served as the control to assess the baseline performance of standard fertilization practices.
In contrast, the precision fertilization scenario utilized real-time soil data and machine learning-driven recommendations generated by the UG-AgroPlan system. The experimental field was divided into three separate monitoring areas to assess the impact of different fertilization frequencies: daily, weekly, and monthly application intervals. This design enabled a comprehensive comparison between conventional fertilization and the proposed sensor- and machine learning-based adaptive approach. Soil measurements of macronutrients (N, P, K) and soil parameters (pH, electrical conductivity, temperature, and moisture) were collected using in-field NPK sensors. These data were transmitted to the UG-AgroPlan platform, which employed a K-Nearest Neighbors (KNN)-based classification model to determine the current nutrient sufficiency status of the soil. The system then calculated the specific fertilizer dosage required to correct any detected nutrient deficiencies, and only the necessary amounts of fertilizers were applied on that day for Uzbekistan Melon Cultivation. This adaptive, data-driven approach allowed continuous adjustment of fertilization doses throughout the crop cycle.
In the precision fertilization scenario, real-time soil nutrient and environmental data were collected continuously from in-field NPK sensors installed in the root zone. These sensors measured macronutrients (N, P, K) and key soil parameters including pH, electrical conductivity (EC), temperature, and moisture content. The collected data were transmitted to the UG-AgroPlan platform, which employed a K-Nearest Neighbors (KNN)-based classification model to determine the daily nutrient sufficiency status of the soil. Based on the gap between current and optimal nutrient conditions, the system calculated precise daily fertilizer dosages, ensuring that only the required amount of nutrients was applied each day or per week or per monthly. This adaptive, data-driven approach enabled continuous fine-tuning of nutrient supply throughout the crop cycle, The experiment aimed to determine the most effective fertilization strategy and to quantify the advantages of real-time sensor-based and machine learning-guided nutrient management compared to conventional fixed-schedule practices.
3.4.1. Soil Parameter Measurement
These initial measurements serve as a critical reference for assessing soil readiness and determining whether additional soil amendments or nutrient adjustments are required prior to planting. Establishing accurate pre-planting soil conditions is essential to ensure that subsequent nutrient recommendations generated by the UG-AgroPlan system are based on reliable baseline data. These baseline measurements were obtained using the custom-built soil sensor system developed in this study to characterize the nutrient content and physical properties of the soil prior to crop establishment. Table 8 summarizes the initial soil conditions measured at the experimental field before planting the Uzbekistan melon (Cucumis melo) using the UG-AgroPlan sensor system, the following soil parameters were recorded before planting:
The UG-AgroPlan application analyzed this data and recommended melon as one of the suitable crops based on historical data from regions with similar profiles. However, when selecting "Uzbekistan melon" specifically, the system flagged several nutrient deficiencies compared to the ideal soil profile for this cultivar, as outlined below:

Table 9.
Nutrient deficiencies for crops Uzbekistan melon with soil profile in Cikalong village
| Parameter | Ideal | Adjustment Fertilizer Recommendation |
|---|---|---|
| Nitrogen | 70 ppm | Add ± 30 kg Urea/ha |
| Phosphorus | 60 ppm | Add ± 46 kg SP-36/ha |
| Potassium | 90 ppm | Add ± 109 kg MOP/ha |
| pH | 6.5 | Apply dolomite if needed |
3.4.2. Fertilization and Monitoring
Based on UG-AgroPlan’s recommendations, fertilization was adjusted accordingly before transplanting. The system also scheduled a 3-phase nutrient evaluation (vegetative, flowering, and fruiting stages). At each stage, new sensor readings were input, and the system re-evaluated the soil status, adjusting fertilizer applications dynamically. After 80 Days, the UG-AgroPlan system significantly improved fertilizer efficiency and allowed precise intervention, reducing excess fertilizer use by 18% compared to conventional practice while maintaining high crop quality. The Results are:
- Germination rate: 95% (high vigor observed)
- Fruit set rate: 87% (above local average of 70%)
- Average fruit weight maximum : 3.2 kg per melon (typical target: > 3 kg).
- Average fruit circumference maximum : 30 cm per melon (typical target: > 28 cm).
- Brix (sweetness) maximum: 15.59% (typical target: >14%). Maintaining elevated potassium levels during flowering and fruiting stages was essential for enhancing fruit sweetness and structural firmness, as supported by the Brix result (15.59%).
- Leaf chlorophyll index (measured with SPAD): increased from 38 (initial) to 48 (mature). The increase in SPAD index from 38 to 48 further confirms improved nitrogen uptake and leaf photosynthetic efficiency following nutrient optimization by UG-AgroPlan.
The Table 10 summarizes the soil nutrient dynamics monitored during the melon growth cycle. The adjustments recommended by the UG-AgroPlan application successfully guided nutrient enrichment toward the optimal range needed for high fruit quality and yield. The table presents the temporal dynamics of three primary macronutrients—nitrogen (N), phosphorus (P), and potassium (K)—across four key phenological stages: pre-planting, vegetative, flowering, and fruiting phases.
During the pre-planting phase, the soil contained baseline nutrient levels, with N at 58.25 ppm, P at 42.10 ppm, and K at 47.85 ppm, which were sufficient to support early seedling establishment. In the vegetative phase, nutrient concentrations increased, particularly nitrogen (66.50 ppm) and potassium (60.10 ppm), reflecting the crop’s higher demand for vegetative growth and leaf development.
As the plants transitioned to the flowering phase, a further increase was observed in all three nutrients, especially potassium (82.50 ppm), which is critical for flower initiation and reproductive development. The highest nutrient concentrations were recorded during the fruiting phase, reaching 70.10 ppm for nitrogen, 60.20 ppm for phosphorus, and 89.70 ppm for potassium. This aligns with the crop’s peak nutrient demand to support fruit enlargement and sugar accumulation.
Based on real-time soil monitoring and analysis conducted using the UG-AgroPlan system with Equation 6, the application generated dynamic fertilizer dosage recommendations tailored to each growth phase of the Uzbekistan melon. Table 11 are illustrate the prescribed quantities of Urea (for nitrogen), SP-36 (for phosphorus), and MOP (for potassium) per hectare.
The UG-AgroPlan system generated fertilizer dosage recommendations tailored to each growth phase of the Uzbekistan melon, optimizing nutrient input based on real-time soil analysis and follow a phase-specific strategy for each macro-nutrient:
- Urea (Nitrogen) was applied at the highest rate during the pre-planting phase (30 kg/ha) to support early vegetative growth and leaf development. The application rate was then gradually reduced across the vegetative (9 kg/ha), flowering (4 kg/ha), and fruiting stages (0 kg/ha) to avoid excessive nitrogen accumulation, which could hinder fruit quality and increase vegetative overgrowth.
- SP-36 (Phosphorus) application was concentrated during the pre-planting and vegetative phases (46 and 21 kg/ha, respectively), supporting root development and energy transfer essential for early plant establishment and flower formation. The dosage was reduced during flowering and fruiting (4 and 0 kg/ha), as phosphorus demand typically decreases once reproductive structures are established.
- MOP (Potassium) showed a marked increase during the flowering and fruiting stages (19 and 1 kg/ha, respectively), in alignment with the crop’s physiological need for enhanced sugar transport, cell wall strengthening, and resistance to biotic stress during fruit development. A foundational dose of 109 kg/ha was applied pre-planting and vegetative phases 77 kg/ha to ensure sufficient baseline availability.
The fertilizer input was minimized to maintain soil nutrient balance and prevent excess salt accumulation, which could negatively affect fruit sweetness and shelf life. The application’s algorithm also prevented unnecessary over-application, supporting both environmental sustainability and cost efficiency. By optimizing fertilizer dosage and minimizing overuse, the system reduced input costs by approximately 10% until 20% per hectare compared to traditional practices.
3.4.3. Melon Fruit Quality (Uzbekistan Melon)
The assessment of Uzbekistan melon quality was carried out by measuring three primary parameters: sweetness level (Brix %), fruit weight (kg), and fruit length (cm). The experiment applied four fertilization treatment scenarios using the UG-AgroPlan system, which provided fertilization recommendations based on real-time soil nutrient and other environmental parameters and the treatment scenarios were as demonstrate in Figure 11.
The four treatment scenarios illustrated in Figure 11 represent different approaches to fertilization strategies, varying in intensity and the use of the UG-AgroPlan monitoring system. Each scenario is designed to evaluate how effectively real-time for monitoring of the soil nutrient can influence the quality of Uzbekistan melon yields. Figure 11 visually presents these four scenarios, which include:
- Daily Fertilization with UG-AgroPlan Monitoring Fertilization was performed daily using real-time sensor data to adjust nutrient delivery based on soil levels of nitrogen (N), phosphorus (P), potassium (K), pH, temperature, and moisture. This approach yielded the highest fruit quality, with a sweetness level of 15.59% Brix, an average weight of 3.69 kg, and a length of 30.14 cm.
- Weekly Fertilization with UG-AgroPlan Monitoring In this scenario, fertilization occurred every seven days using aggregated weekly sensor data. The results showed good fruit quality, with a sweetness of 12.54% Brix, weight of 3.17 kg, and length of 30.13 cm.
- Monthly Fertilization with UG-AgroPlan Monitoring Fertilization was based on average monthly data, which proved less responsive to changes in plant nutrient demands. As a result, fruit quality declined, with a sweetness of 10.53% Brix, weight of 2.56 kg, and length of 26.31 cm.
- Manual Fertilization (Without UG-AgroPlan Monitoring) This control treatment followed conventional melon cultivation practices commonly used in Indonesia, without digital monitoring support. The fruit quality was the lowest, with a sweetness of 8.65% Brix, weight of 2.13 kg, and length of 24.21 cm.
These findings confirm that precision fertilization supported by intensive (daily) soil nutrient monitoring significantly enhances crop quality. Weekly and monthly fertilization schedules still produced satisfactory results, though slightly reduced. In contrast, the manual fertilization without UG-AgroPlan monitoring yielded the poorest outcomes, emphasizing the critical role of technology-assisted monitoring in modern agriculture.
The field trial demonstrated that the UG-AgroPlan application, integrated with real-time soil sensors and machine learning models, can effectively support crop selection and nutrient management for sensitive varieties like Uzbekistan melon. The system not only improved crop performance but also promoted more sustainable use of fertilizer, aligning with precision agriculture goals. Addition, these findings underscore the capacity of UG-AgroPlan to provide phase-specific, adaptive fertilization strategies that align with physiological needs of the crop and field conditions, reinforcing its utility for smart and sustainable farming.
4. Discussion
The results of this study highlight the practical effectiveness and accuracy of the UG-AgroPlan system in providing real-time soil-based crop and fertilizer recommendations. The sensor calibration results showed an accuracy ranging from 97.41% to 97.61% for all measured parameters. This high level of accuracy indicates that the developed sensor prototype can reliably capture real-time soil conditions, which is crucial for precision fertilization., and confirms that the prototype can reliably replicate laboratory-level measurements. Compared to previous soil sensor studies reporting 90-95% accuracy, our system achieved higher performance, suggesting that the calibration and regression-based correction process was effective. This finding is critical, as accurate detection of soil nutrient levels forms the foundation for any data-driven agricultural recommendation system.
Among the seven models tested, Random Forest and XGBoost achieved perfect accuracy (100%), while K-Nearest Neighbors (KNN) achieved 98%. Despite its slightly lower accuracy, KNN was chosen due to its simplicity, interpretability, and lower risk of overfitting. This finding aligns with prior studies that emphasize the robustness of KNN on small-to-medium datasets, while complex ensemble models often overfit when data diversity is limited. However, in future work, an ensemble or hybrid model may be considered to combine accuracy and responsiveness.
The fertilizer adjustment simulation also demonstrates UG-AgroPlan’s ability to not only identify the most suitable crop for the current soil conditions but also provide specific nutrient recommendations to optimize growth. In the case of apple cultivation, the system correctly detected nitrogen surplus and recommended withholding further nitrogen fertilization (0.00 kg/ha), while suggesting phosphorus and potassium additions of 164.66 kg/ha and 361.56 kg/ha, respectively. Conversely, when papaya was both the desired and recommended crop, the system confirmed soil suitability and prescribed no nutrient adjustment, demonstrating its flexibility and responsiveness.
The substantial improvement in fruit quality parameters observed under the daily precision fertilization regime can be attributed to the system’s ability to dynamically monitor and adjust soil nutrient availability, particularly during the critical reproductive phase. Daily nutrient corrections maintained potassium (K) levels near their optimal range (≈ 89.7 ppm during fruiting), which is physiologically essential for carbohydrate translocation, fruit development, and enhancement of fruit firmness and sweetness. This aligns with the observed increase in soluble solids content (Brix) to 15.59% under the daily treatment, representing an 80.2% improvement over the control (daily fertilization without UG-AgroPlan Monitoring).
Concurrently, the system-supported optimization of nitrogen (N) supply was reflected in a marked rise in leaf chlorophyll content (SPAD index increased from 38 to 48), indicating enhanced photosynthetic activity and nitrogen use efficiency. Elevated N availability promotes leaf area development and photosynthetic capacity, which are directly linked to assimilate production and fruit biomass accumulation. These physiological responses explain the 73.2% increase in average fruit weight (3.69 kg) and the 24.5% increase in fruit length under daily fertilization compared to the conventional manual treatment.
Beyond quality improvement, the UG-AgroPlan system demonstrated improved input efficiency, reducing fertilizer use by approximately 18% without compromising yield quality. This efficiency likely results from the system’s adaptive nutrient recommendation engine, which applies fertilizers only when deficits are detected, thereby eliminating redundant applications typical of fixed-schedule fertilization. Such targeted nutrient delivery ensures the “right rate” and “right timing” principles of Precision Agriculture are consistently met, reducing nutrient losses while improving plant physiological performance.
Overall, the integration of Internet of Things-based sensing and Machine Learning-driven decision support allowed the system to synchronize nutrient supply with plant demand on a real-time basis. This synergy appears to be the key factor driving the enhanced fruit quality and input efficiency observed in the field experiment with Uzbekistan melon.
While these results are promising, several limitations remain. First, the system has only been validated on a limited number of crops (18 crops) and soil types, and the field experiments were conducted solely within agricultural areas in Indonesia. Broader testing across various agroecological zones and crop varieties is needed to confirm the model’s generalizability. Second, the current model does not yet integrate external variables such as rainfall forecasts or pest/disease risks, which are also important in farm-level decision-making. Additionally, while the prototype works well in controlled conditions, large-scale deployment may face infrastructure challenges related to sensor maintenance, connectivity, and user training.
Despite these limitations, UG-AgroPlan demonstrates considerable potential to support precision agriculture, especially in developing countries. Its integration of sensor data, AI-based classification, and dynamic fertilization recommendations offers a scalable, sustainable, and cost-effective tool to reduce fertilizer waste, increase crop quality, and promote environmentally friendly farming practices.
5. Conclusions
This study demonstrated that integrating Internet of Things (IoT)-based soil sensors with Machine Learning algorithms in the UG-AgroPlan system enables precise, real-time nutrient management that significantly improves crop quality and input efficiency.
The system achieved the following key outcomes:
- Implemented a prototype of an NPK nutrient detection tool that can detect the content of nitrogen (N), phosphorus (P), and potassium (K), along with other parameters (such as moisture, temperature, electrical conductivity, and pH) in the soil in real-time.
- Implemented a web-based application as a machine learning-based system for plant and fertilization recommendations called UG-AgroPlan. The data input into the UG-AgroPlan system can be done in two ways: real-time automatically (our prototype) and manually.
- Accurate crop recommendation through K-Nearest Neighbors (KNN) classification based on real-time soil data.
- High sensor accuracy, achieving 97.41% - 97.61% calibration performance, ensuring reliable nutrient detection.
- Dynamic, phase-specific fertilization recommendations for N, P, and K, tailored to each stage of crop growth, making it suitable for providing precise fertilization recommendations.
- Field trials on Uzbekistan melon showed that daily precision fertilization increased fruit sweetness (Brix) by 80.2%, fruit weight by 73.2%, and fruit length by 24.5% compared to conventional manual fertilization, while simultaneously reducing fertilizer usage by approximately 18%. These findings indicate that adaptive fertilization based on real-time nutrient gaps can enhance plant physiological performance, minimize input waste, and support sustainable agricultural practices.
The results highlight the potential of UG-AgroPlan as an innovative decision support tool for farmers to improve productivity while conserving resources. Future work will focus on expanding the training dataset to include a broader range of soil types and crops, conducting multi-site field validations, and integrating economic analysis modules to evaluate cost-benefit performance under diverse farming conditions.
Author Contributions
Conceptualization, Herik Sugeru, Purnawarman Musa. and Eri Prasetyo Wibowo; methodology, Purnawarman Musa. Robby Kurniawan Harahap and Eri Prasetyo Wibowo; software, Herik Sugeru, Purnawarman Musa. Robby Kurniawan Harahap and Suryadi Harmanto; validation, Heriku Sugeru, Suryadi Harmanto, and Eri Prasetyo Wibowo; formal analysis, Herik Sugeru and Robby Kurniawan Harahap; investigation, Herik Sugeru and Eri Prasetyo Wibowo; resources, Robby Kurniawan Harahap; data curation, Herik Sugeru; writing—original draft preparation, Herik Sugeru; writing—review and editing, Eri Prasetyo Wibowo; visualization, Purnawarman Musa; supervision, Eri Prasetyo Wibowo; project administration, Suryadi Harmanto; funding acquisition, Eri Prasetyo Wibowo.
Funding
This document is the results of the research project funded by the Ministry of Education, Culture, Research, and Technology of Indonesia under the Doctoral Dissertation Research Grant “PPS-PDD”, Contact Number: 105/E5/PG.02.00.PL/2024 for its financial assistance
Institutional Review Board Statement
Not applicable for studies not involving humans or animals.
Informed Consent Statement
Not applicable for studies not involving humans.
Data Availability Statement
Unavailable due to privacy or ethical restrictions
Acknowledgments
The authors extend heartfelt appreciation to the Rector of Universitas Gunadarma for the invaluable support provided throughout this research, which was carried out at the Universitas Gunadarma Technopark. Such support played a crucial role in facilitating the successful implementation of field trials and the development of the UG-AgroPlan system.
Special acknowledgment is also given to the committed students who significantly contributed to the project,
notably Iqdam Alfatih and Abdul Muiz, for their dedication to data collection, sensor calibration, system testing,
and conducting field experiments. The contributions of these individuals substantially enriched the depth and
quality of the research. Additionally, the authors appreciate the technical support provided by the Technopark
staff, whose guidance and expertise were critical in ensuring the accuracy and reliability of the system developed.
Finally, the authors are grateful to all those who, directly or indirectly, supported this research, helping to make it
a valuable contribution to the advancement of smart farming and agricultural technology.
Conflicts of Interest
The authors declare no conflicts of interest and the funders had no role in the design of the study; in the collection, analyses, or interpretation of data; in the writing of the manuscript; or in the decision to publish the results.
References
- Hou, D. Sustainable soil management for food security. Soil Use and Management 2023, 39, 1–7, _eprint: https://bsssjournals.onlinelibrary.wiley.com/doi/pdf/10.1111/sum. [Google Scholar] [CrossRef]
- Khatri, N.; Vyas, A.K.; Iwendi, C.; Chatterjee, P. Internet-of-Things-Enabled Precision Agriculture for Sustainable Rural Development. In Precision Agriculture for Sustainability, 1 ed.; Das, S., Ghosh, A., Pal, S., Eds.; Apple Academic Press: New York, 2023; pp. 343–372. [Google Scholar] [CrossRef]
- Cheruvu, B.; Latha, S.B.; Nikhil, M.; Mahajan, H.; Prashanth, K. Smart Farming System using NPK Sensor. In Proceedings of the 2023 9th International Conference on Advanced Computing and Communication Systems (ICACCS), Coimbatore, India, Mar 2023; pp. 957–963. [Google Scholar] [CrossRef]
- Solanki, P.S.; Joshi, G. Internet of Things: A Growing Trend in India’s Agriculture And Linking Farmers to Modern Technology. In Precision Agriculture for Sustainability; Apple Academic Press, 2024. Num Pages: 10.
- Tondhare, P.R.; Raut, R.R. Review on NPK Sensor Used on Soil. IJAS 2025, 16, 38–46. [Google Scholar] [CrossRef]
- Meena, D.K.; Lamani, H.D.; Yadav, R.; Saikanth, R.K.; Singh, O.; Yerasi, S.; Rai, S. Soil Science and Sustainable Farming: Paving the Way for Food Security. IJECC 2023, 13, 2419–2424. [Google Scholar] [CrossRef]
- Gao, C.; El-Sawah, A.M.; Ali, D.F.I.; Alhaj Hamoud, Y.; Shaghaleh, H.; Sheteiwy, M.S. The Integration of Bio and Organic Fertilizers Improve Plant Growth, Grain Yield, Quality and Metabolism of Hybrid Maize (Zea mays L.). Agronomy 2020, 10, 319. [Google Scholar] [CrossRef]
- Hafez, M.; Popov, A.I.; Rashad, M. Integrated use of bio-organic fertilizers for enhancing soil fertility–plant nutrition, germination status and initial growth of corn (Zea Mays L.). Environmental Technology & Innovation 2021, 21, 101329. [Google Scholar] [CrossRef]
- Barłóg, P.; Grzebisz, W.; Łukowiak, R. Fertilizers and Fertilization Strategies Mitigating Soil Factors Constraining Efficiency of Nitrogen in Plant Production. Plants 2022, 11, 1855. [Google Scholar] [CrossRef]
- Prity, F.S.; Hasan, M.M.; Saif, S.H.; Hossain, M.M.; Bhuiyan, S.H.; Islam, M.A.; Lavlu, M.T.H. Enhancing Agricultural Productivity: A Machine Learning Approach to Crop Recommendations. Hum-Cent Intell Syst 2024, 4, 497–510. [Google Scholar] [CrossRef]
- Rachman, B.; Sudaryanto, T. Impacts and Future Perspectives of Fertilizer Policy in Indonesia. In Proceedings of the Analisis Kebijakan Pertanian, Aug 2016, Vol. 8, p. 193, Vol. 8, Aug 2016; p. 193. [Google Scholar] [CrossRef]
- Taj, A.; Bibi, H.; Akbar, W.A.; Rahim, H.U.; Iqbal, M.; Ullah, S. Effect of Poultry Manure and NPK Compound Fertilizer On Soil Physicochemical Parameters, NPK Availability, and Uptake by Spring Maize (Zea mays L.) in Alkaline-calcareous Soil. Gesunde Pflanzen 2023, 75, 393–403. [Google Scholar] [CrossRef]
- Marler, T.E. NPK Fertilization of Serianthes Plants Influences Growth and Stoichiometry of Leaf Nutrients. Horticulturae 2022, 8, 717. [Google Scholar] [CrossRef]
- Amin, M.R.; Islam, M.A.; Afroz, M.; Suh, S.J. Abundance of sucking insect pests on some flowering plants in relation to weather parameters. Bangladesh Journal of Scientific and Industrial Research 2021, 56, 241–248. [Google Scholar] [CrossRef]
- Ning, C.c.; Gao, P.d.; Wang, B.q.; Lin, W.p.; Jiang, N.h.; Cai, K.z. Impacts of chemical fertilizer reduction and organic amendments supplementation on soil nutrient, enzyme activity and heavy metal content. Journal of Integrative Agriculture 2017, 16, 1819–1831. [Google Scholar] [CrossRef]
- Singh, B. Are Nitrogen Fertilizers Deleterious to Soil Health? Agronomy 2018, 8, 48. [Google Scholar] [CrossRef]
- Li, Z.; Zhang, R.; Xia, S.; Wang, L.; Liu, C.; Zhang, R.; Fan, Z.; Chen, F.; Liu, Y. Interactions between N, P and K fertilizers affect the environment and the yield and quality of satsumas. Global Ecology and Conservation 2019, 19, e00663. [Google Scholar] [CrossRef]
- Musa, P.; Sugeru, H.; Wibowo, E.P. Wireless Sensor Networks for Precision Agriculture: A Review of NPK Sensor Implementations. Sensors 2023, 24, 51. [Google Scholar] [CrossRef]
- Jain, N.; Kumar, R. A Review on Machine Learning & It’s Algorithms. IJSCE 2022, 12, 1–5. [Google Scholar] [CrossRef]
- Jin, W. Research on Machine Learning and Its Algorithms and Development. J. Phys.: Conf. Ser. 2020, 1544, 012003. [Google Scholar] [CrossRef]
- Waliyansyah, R.R.; Umar Hafidz Asy’ari Hasbullah. Comparison of Tree Method, Support Vector Machine, Naïve Bayes, and Logistic Regression on Coffee Bean Image. emitter 2021, 9, 126–136. [CrossRef]
- Bansal, M.; Goyal, A.; Choudhary, A. A comparative analysis of K-Nearest Neighbor, Genetic, Support Vector Machine, Decision Tree, and Long Short Term Memory algorithms in machine learning. Decision Analytics Journal 2022, 3, 100071. [Google Scholar] [CrossRef]
- Senapaty, M.K.; Ray, A.; Padhy, N. A Decision Support System for Crop Recommendation Using Machine Learning Classification Algorithms. Agriculture 2024, 14, 1256. [Google Scholar] [CrossRef]
- Khan, A.A.; Faheem, M.; Bashir, R.N.; Wechtaisong, C.; Abbas, M.Z. Internet of Things (IoT) Assisted Context Aware Fertilizer Recommendation. IEEE Access 2022, 10, 129505–129519. [Google Scholar] [CrossRef]
- Harkare, A.H. Intelligent Crop Management Optimization using Machine Learning Algorithms: A Linear Analytical Approach. Advances in Nonlinear Variational Inequalities 2024, 27, 198–210. [Google Scholar] [CrossRef]
- Zhang, C.; Liu, Y.; Tie, N. Forest Land Resource Information Acquisition with Sentinel-2 Image Utilizing Support Vector Machine, K-Nearest Neighbor, Random Forest, Decision Trees and Multi-Layer Perceptron. Forests 2023, 14, 254, Publisher: Multidisciplinary Digital Publishing Institute. [Google Scholar] [CrossRef]
- Ramamoorthy, P.; Sathiyamurthi, S.; Pavithra, A.; Sivasakthi, M.; Praveen Kumar, S. Impact of Major Nutrients Fertilizer Application on Soil Pollution and Management Measures. In Soil, Water Pollution and Mitigation Strategies; Adhikary, P.P., Shit, P.K., Laha, J., Eds.; Springer Nature Switzerland: Cham, 2024; pp. 301–314, Series Title: Environmental Science and Engineering. [Google Scholar] [CrossRef]
- Badshah, A.; Yousef Alkazemi, B.; Din, F.; Zamli, K.Z.; Haris, M. Crop Classification and Yield Prediction Using Robust Machine Learning Models for Agricultural Sustainability. IEEE Access 2024, 12, 162799–162813. [Google Scholar] [CrossRef]
- Barbosa, M.W. Uncovering research streams on agri-food supply chain management: A bibliometric study. Global Food Security 2021, 28, 100517. [Google Scholar] [CrossRef]
- Bertel, C.; Hacker, J.; Neuner, G. Protective Role of Ice Barriers: How Reproductive Organs of Early Flowering and Mountain Plants Escape Frost Injuries. Plants 2021, 10, 1031. [Google Scholar] [CrossRef] [PubMed]
- Muthukrishnan, T.; Pandi, V.; Thiruvenkadam, K. IoT-Enabled Smart Fertilizer Recommendation System Using Machine Learning. International Journal of Creative Research Thoughts (IJCRT) 2025, 13. [Google Scholar]
- Patel, K.; B. Patel, H. Multi-criteria Agriculture Recommendation System using Machine Learning for Crop and Fertilizesrs Prediction. Curr Agri Res Jour 2023, 11, 137–149. [Google Scholar] [CrossRef]
- Prathik, K.; Madhuri, J.; Bhanushree, K.J. Deep Learning-Based Fertilizer Recommendation System Using Nutrient Deficiency Prediction. In Proceedings of the 2023 7th International Conference on Computation System and Information Technology for Sustainable Solutions (CSITSS), Bangalore, India, Nov 2023; pp. 1–6. [Google Scholar] [CrossRef]
- Devan, K.P.K.; Swetha, B.; Uma Sruthi, P.; Varshini, S. Crop Yield Prediction and Fertilizer Recommendation System Using Hybrid Machine Learning Algorithms. In Proceedings of the 2023 IEEE 12th International Conference on Communication Systems and Network Technologies (CSNT), Bhopal, India, Apr 2023; pp. 171–175. [Google Scholar] [CrossRef]
- Panwar, N. Designing an Intelligent Fertilizer Recommendation System for Small-scale Farmers. MSEA 2021, 70, 1393–1399. [Google Scholar] [CrossRef]
- Sharma, S. Precision Agriculture: Reviewing The Advancements, Technologies, And Applications In Precision Agriculture For Improved Crop Productivity And Resource Management. Reviews in Food and Agriculture (RFNA) 2023, 4, 45–49. [Google Scholar] [CrossRef]
- Prabu, M.; Abhinav B., S.; Narayanan B., H.; Sugandhi, S.S.; Rajeshkumar, D. Design of water quality and soil macronutrients measuring device using TDS and NPK sensor. JEAS 2023, 1923–1931. [Google Scholar] [CrossRef]
- Mavlyanova, R.F.; Eisenman, S.W.; Zaurov, D.E. Melons of Central Asia: Kazakhstan, Kyrgyzstan, Tajikistan, Turkmenistan, and Uzbekistan. In Natural Products of Silk Road Plants; CRC Press, 2020; pp. 133–151.
- Rustamova, I.; Primov, A.; Karimov, A.; Khaitov, B.; Karimov, A. Crop Diversification in the Aral Sea Region: Long-Term Situation Analysis. Sustainability 2023, 15. Publisher: MDPI. [Google Scholar] [CrossRef]
- Zokirov, K.; Sullieva, S.; Abdullayev, D.; Abdinazarova, X.; Tojiyeva, F.; Naurizbaev, A.; Qodirov, F. Watermelon yield in both mulched and unmulched fields: The impact of drip irrigation on watermelon production. In Proceedings of the BIO Web of Conferences. EDP Sciences, 2024, Vol. 130, p. 01030. [CrossRef]
- Harikumaran, M.; Vijayalakshmi, P. Optimizing fertilizer recommendations in precision agriculture: A novel defuzzification approach with adaptive intelligent optimization. Know.-Based Syst. 2025, 321. [Google Scholar] [CrossRef]
- Sonal, D.; Azhar Wasi, M.A.; Krishna, A.; Kumari, S. Evaluating the impact of real-time NPK sensor integration on crop productivity in smart farming systems. Land and Architecture 2025, 4, 154. [Google Scholar] [CrossRef]
- Dey, B.; Ferdous, J.; Ahmed, R. Machine learning based recommendation of agricultural and horticultural crop farming in India under the regime of NPK, soil pH and three climatic variables. Heliyon 2024, 10, e25112. [Google Scholar] [CrossRef]
- Alzeyani, E.M.M.; Szabó, C. Comparative Evaluation of Model Accuracy for Predicting Selected Attributes in Agile Project Management. Mathematics 2024, 12. [Google Scholar] [CrossRef]
- Omar, A.; Delnaz, A.; Nik-Bakht, M. Comparative analysis of machine learning techniques for predicting water main failures in the City of Kitchener. Journal of Infrastructure Intelligence and Resilience 2023, 2, 100044. [Google Scholar] [CrossRef]
- Karimi, M.; Zhou, M.; Li, Q.; Zhang, Y. Statistical Learning in Medical Research with Decision Threshold and Accuracy Evaluation. Journal of Statistical Computing and Applications 2024, 42, 215–232. [Google Scholar] [CrossRef]
- Qazi, M.A.; Iqbal, M.N.; Ashraf, M.; Khan, N.I.; Ahmad, R.; Umar, F.; Naeem, U.; Mughal, K.; Khalid, M.; Iqbal, Z. NPK Requirements of Turmeric for Cultivation in Punjab. PJS 2022, 72. [Google Scholar] [CrossRef]
Figure 3.
Illustration of the research method.
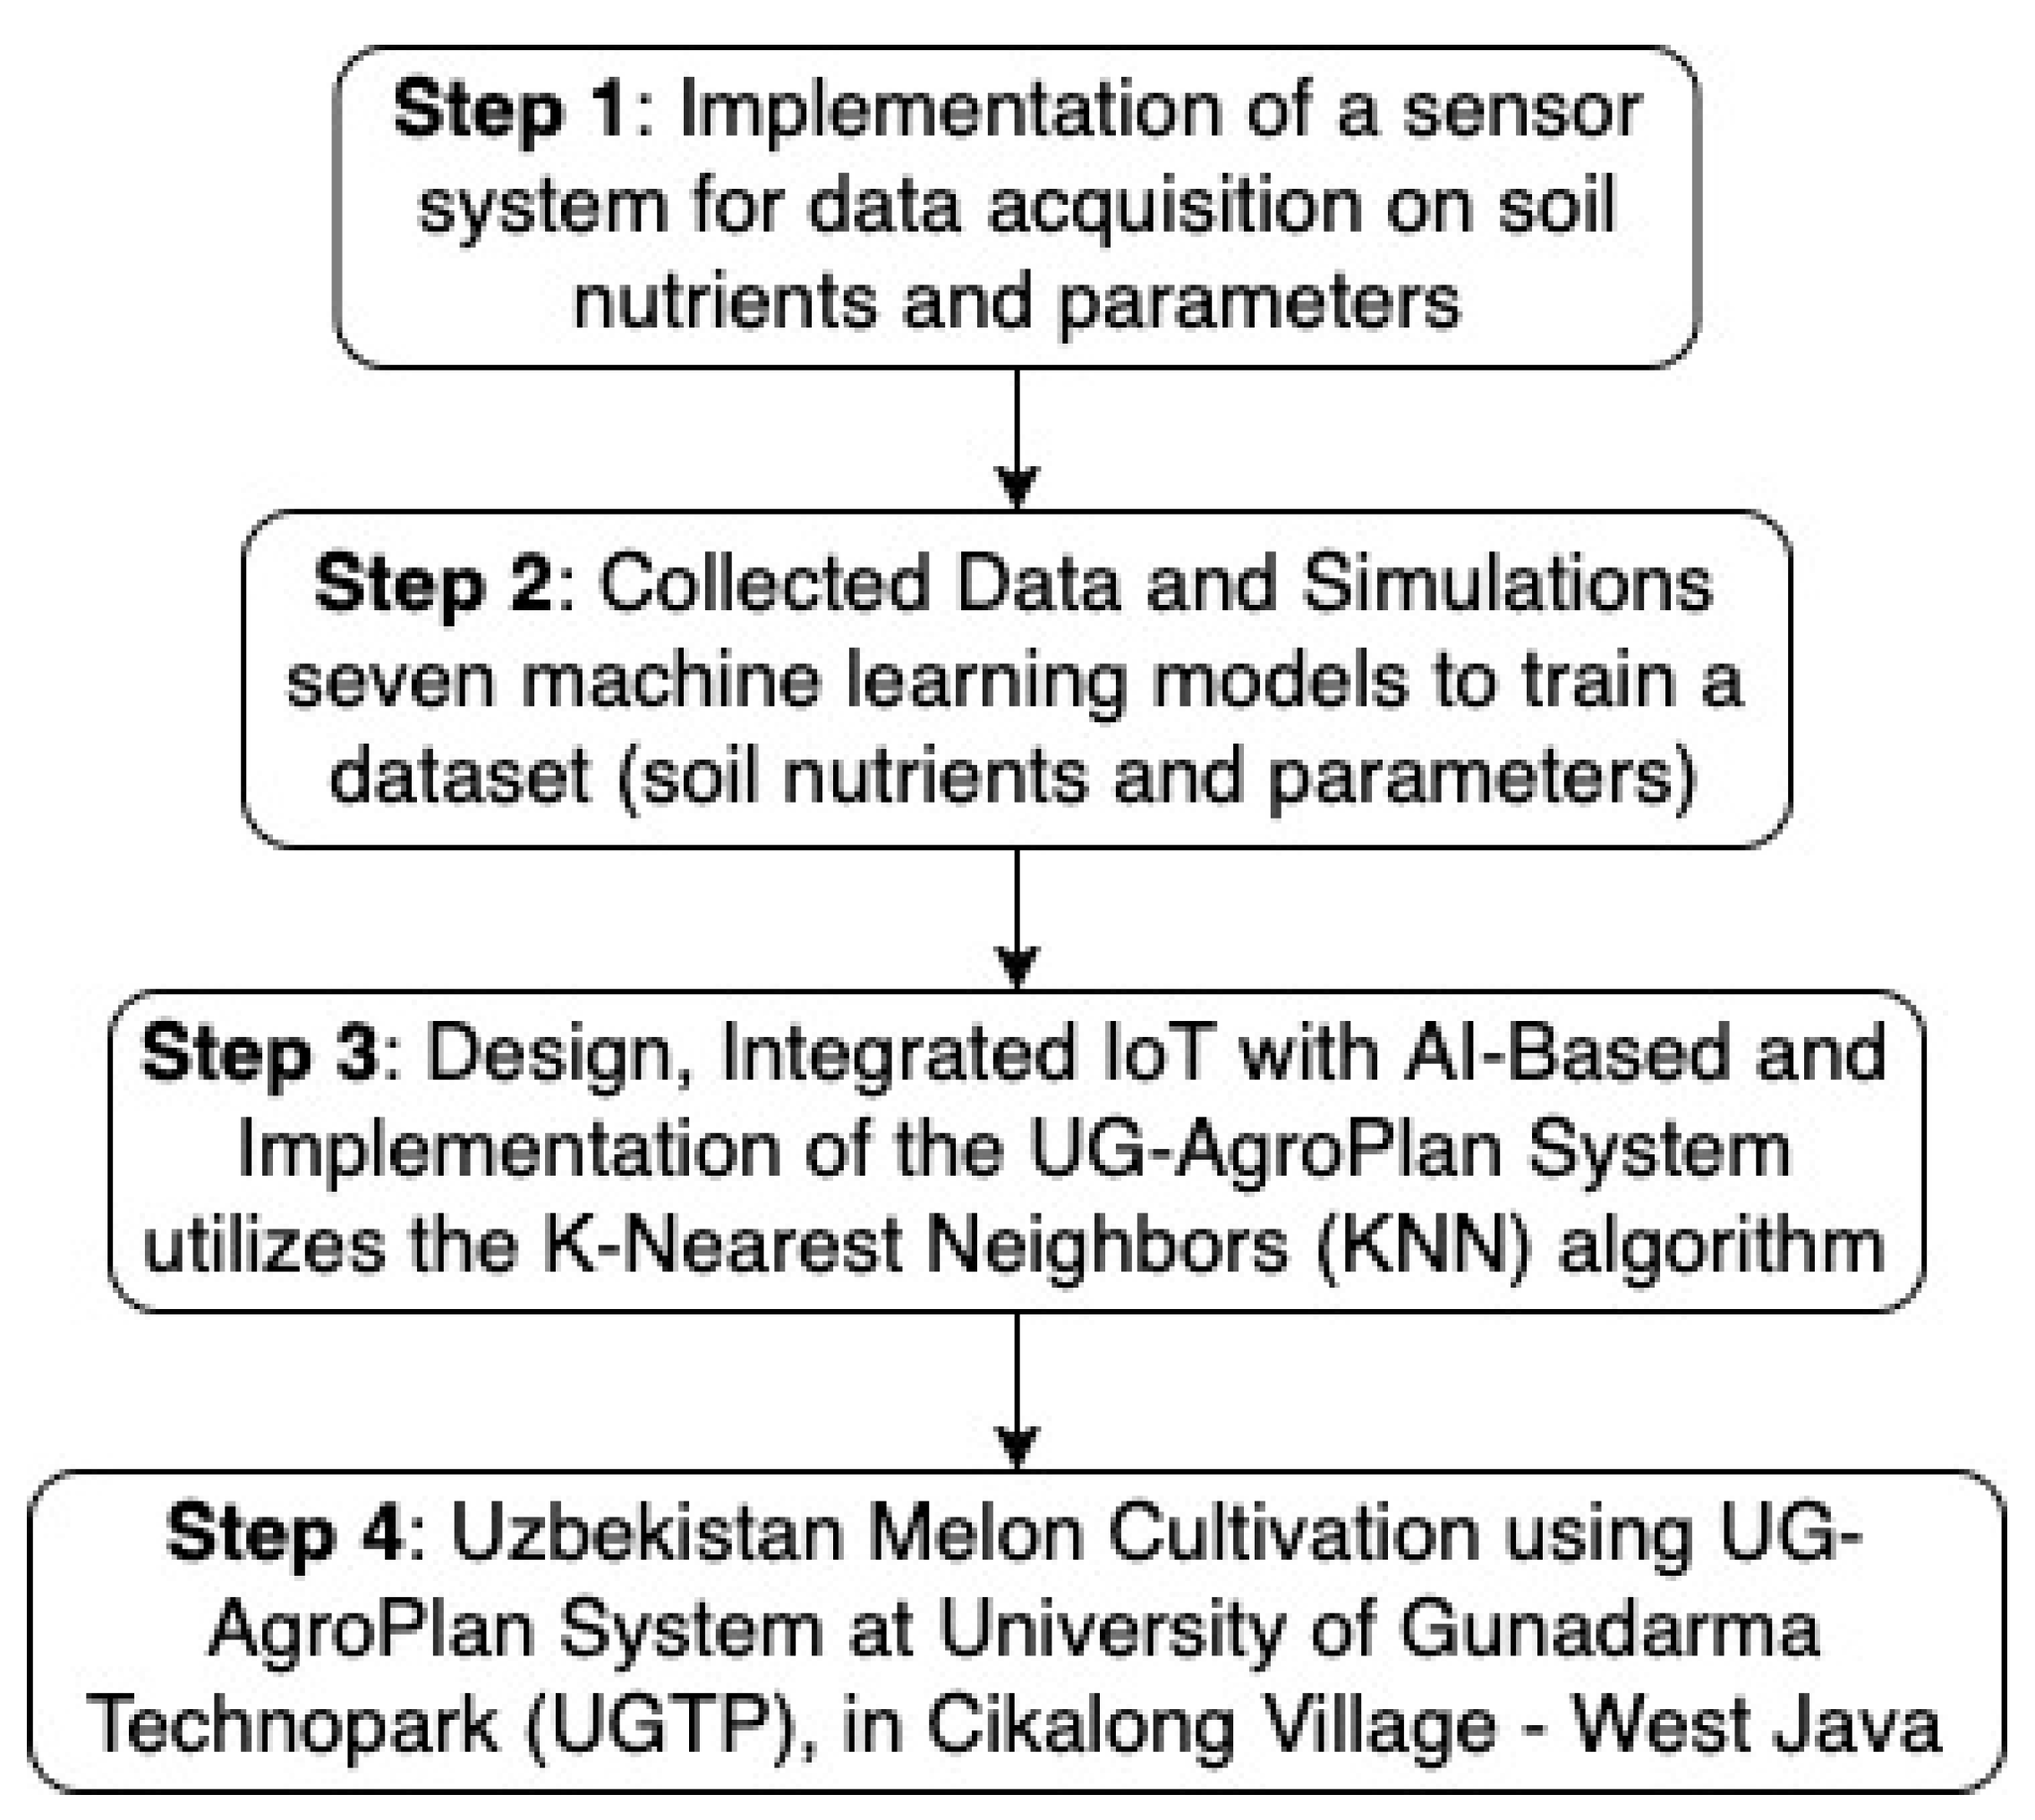
Figure 4.
Proposed research architecture: A comprehensive framework integrating soil nutrient detection, machine learning-based crop recommendations, fertilization recommendations and real-time data processing to optimize agricultural productivity.
Figure 4.
Proposed research architecture: A comprehensive framework integrating soil nutrient detection, machine learning-based crop recommendations, fertilization recommendations and real-time data processing to optimize agricultural productivity.
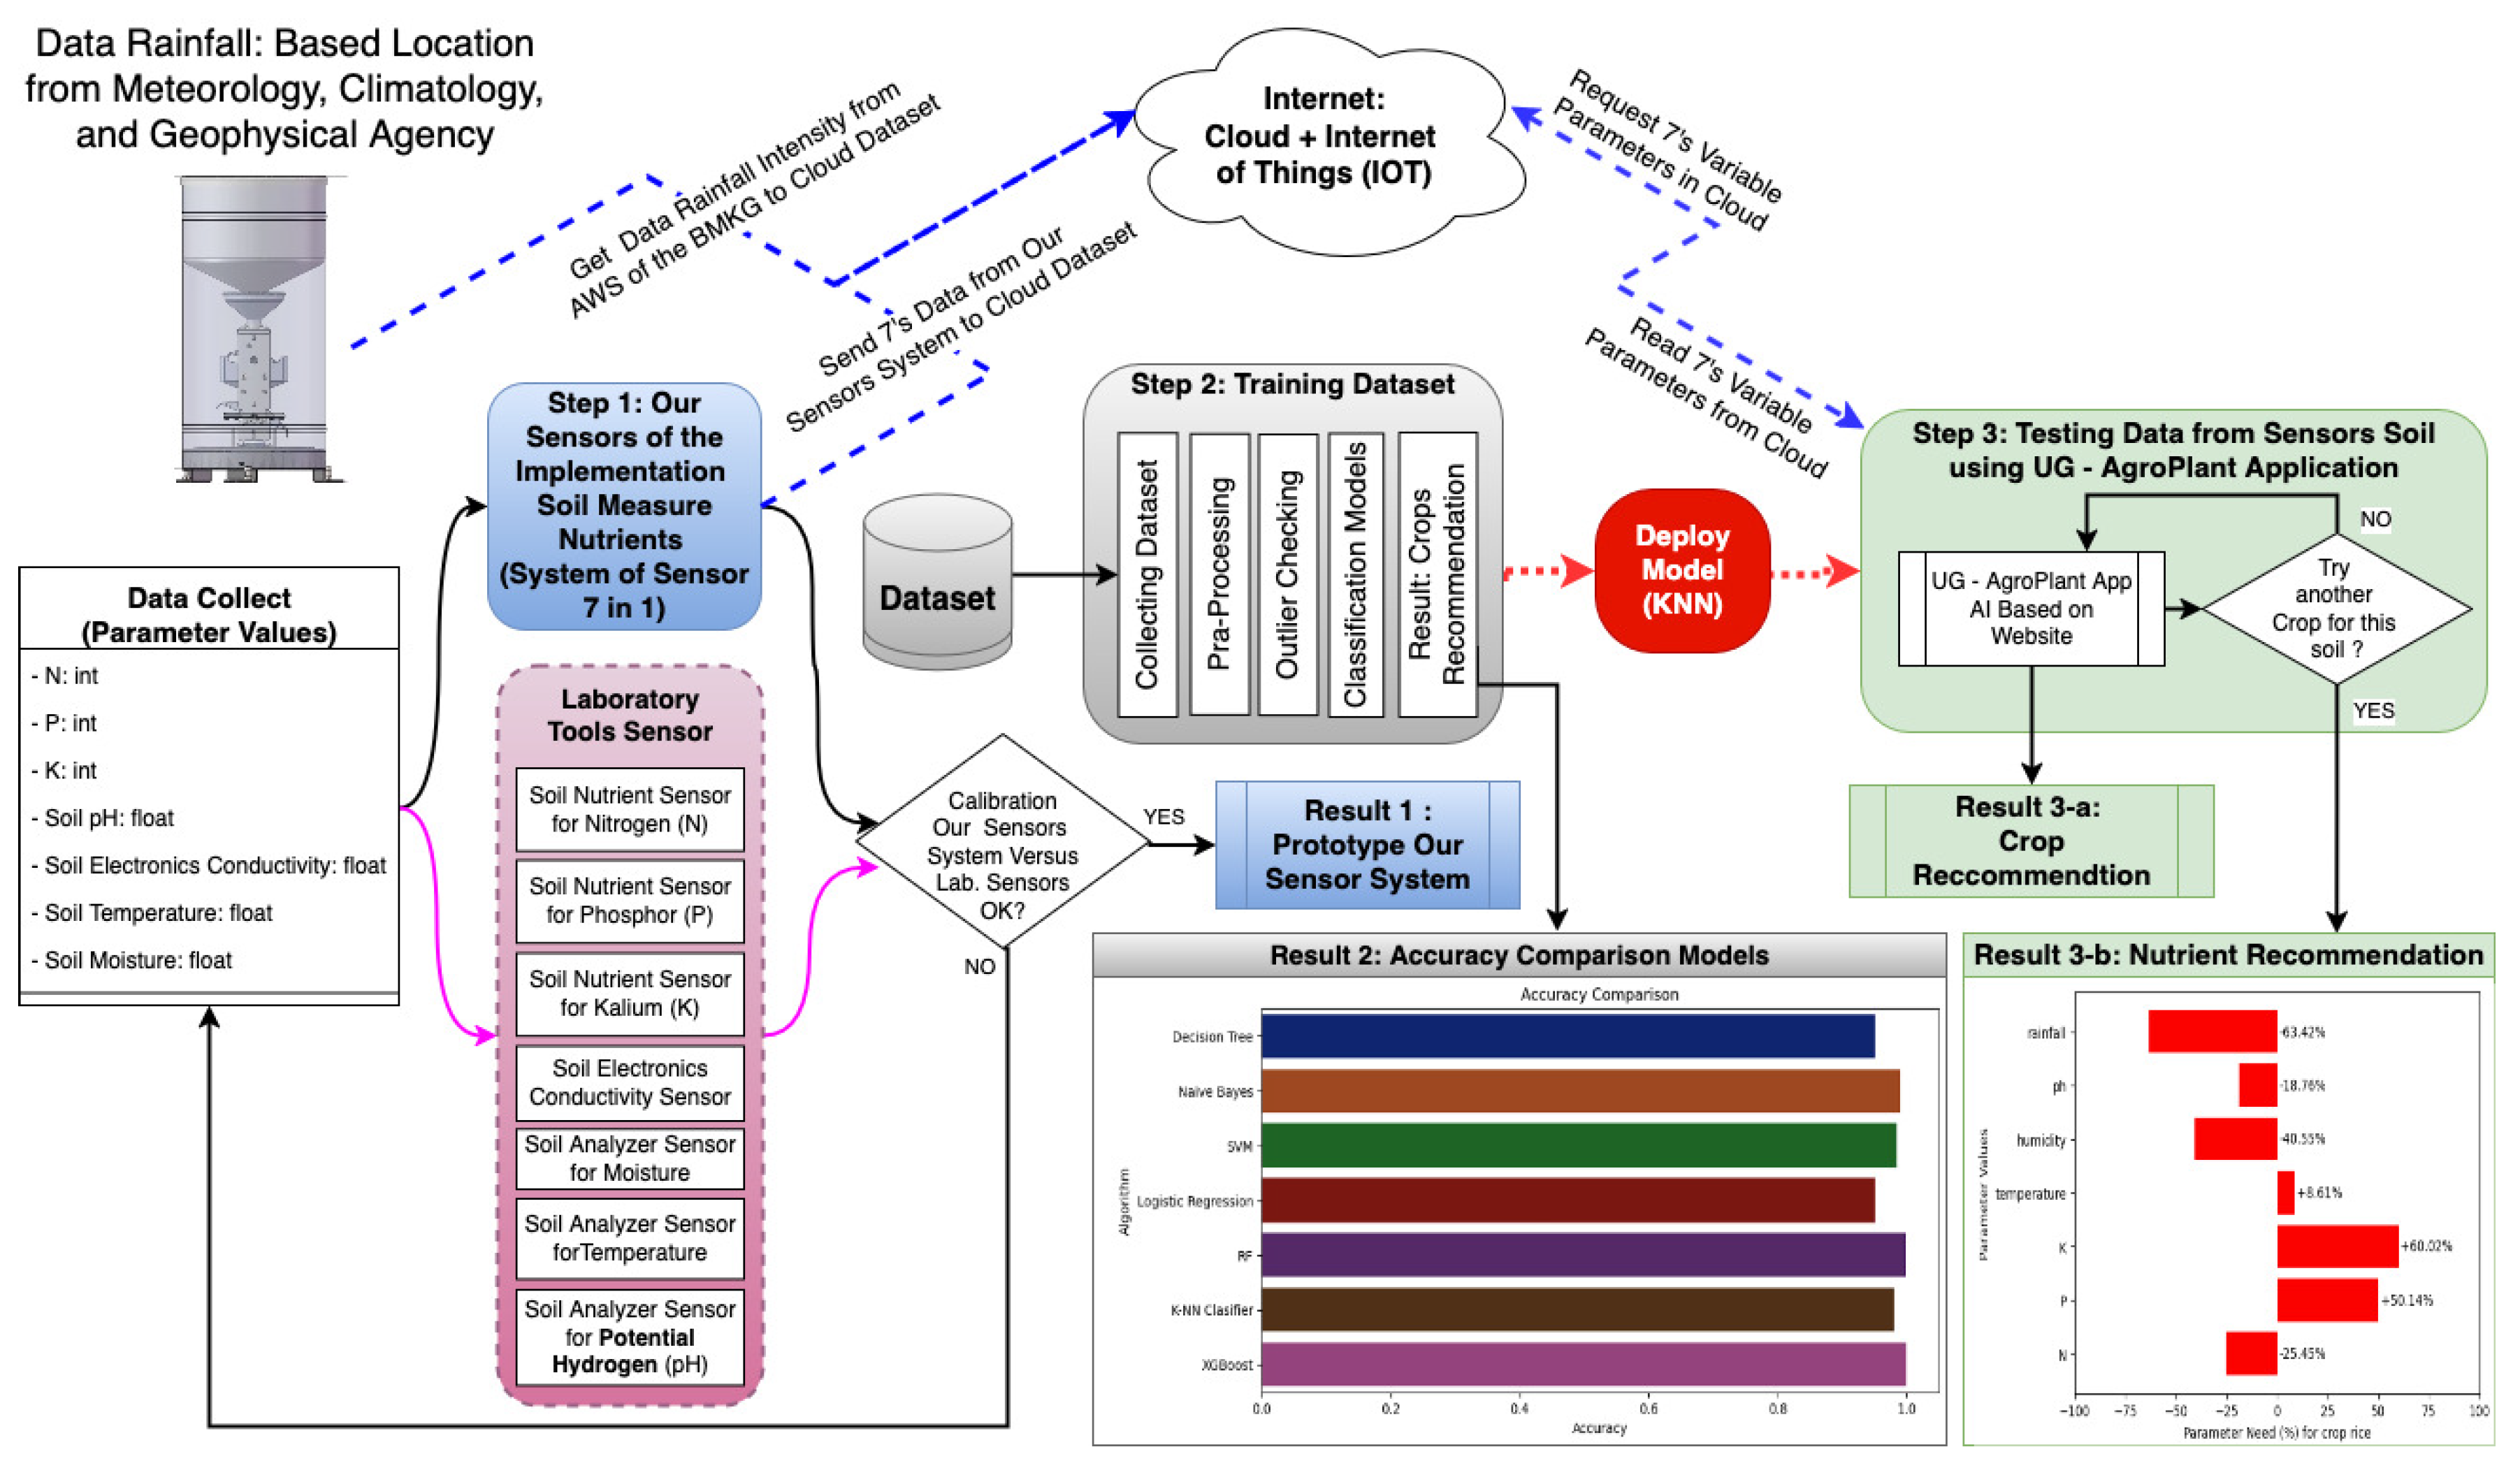
Figure 5.
Calibration process our prototype sensor.
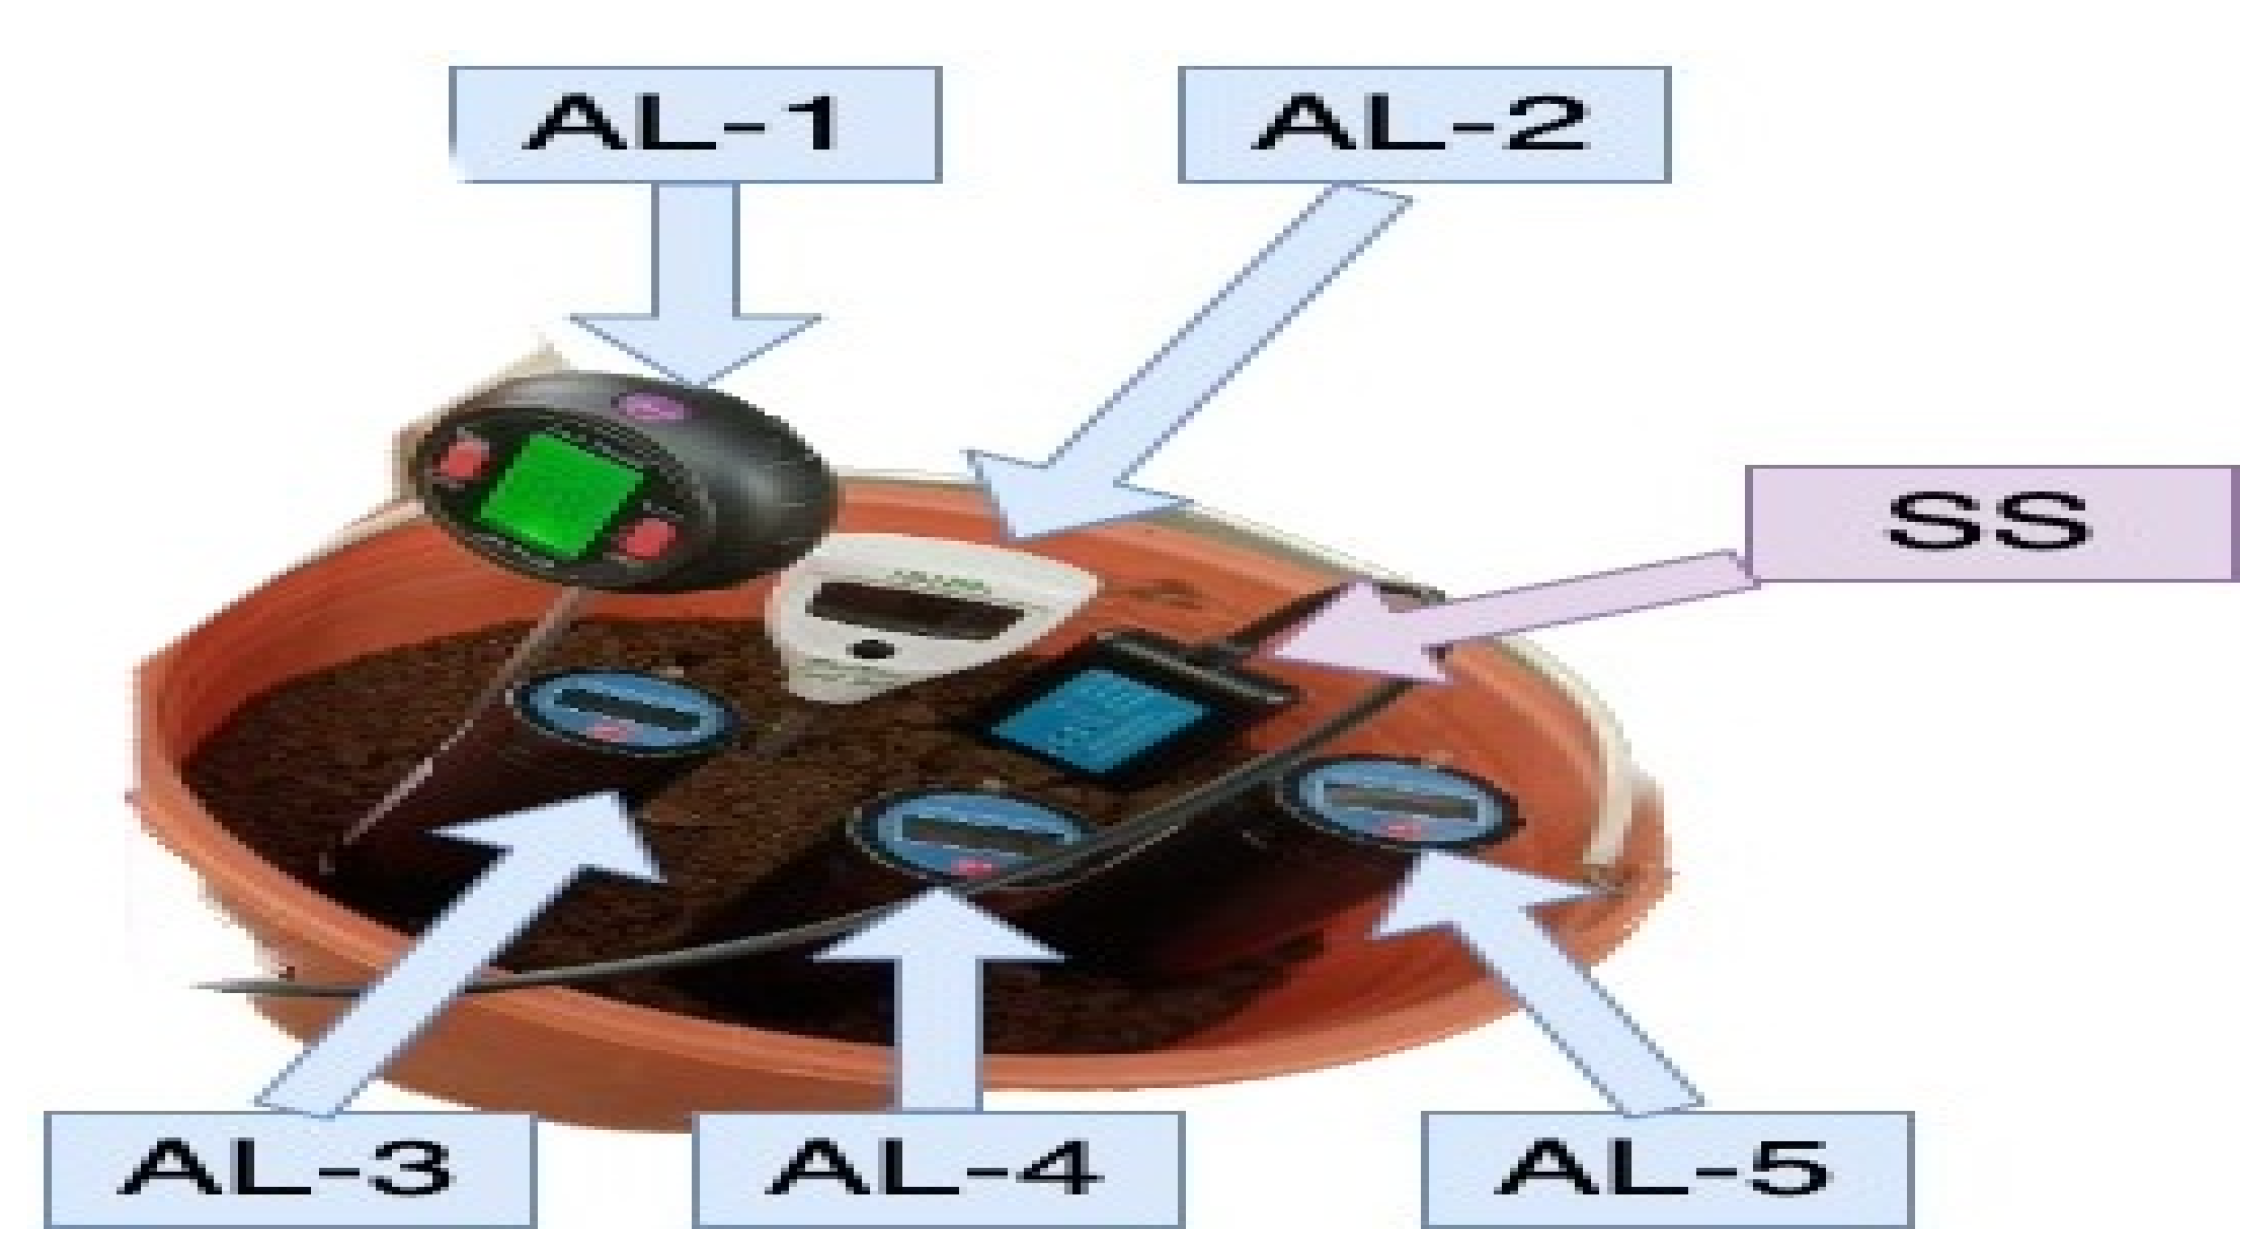
Figure 6.
Comparison of the accuracy of the machine learning algorithms used from 7 models.
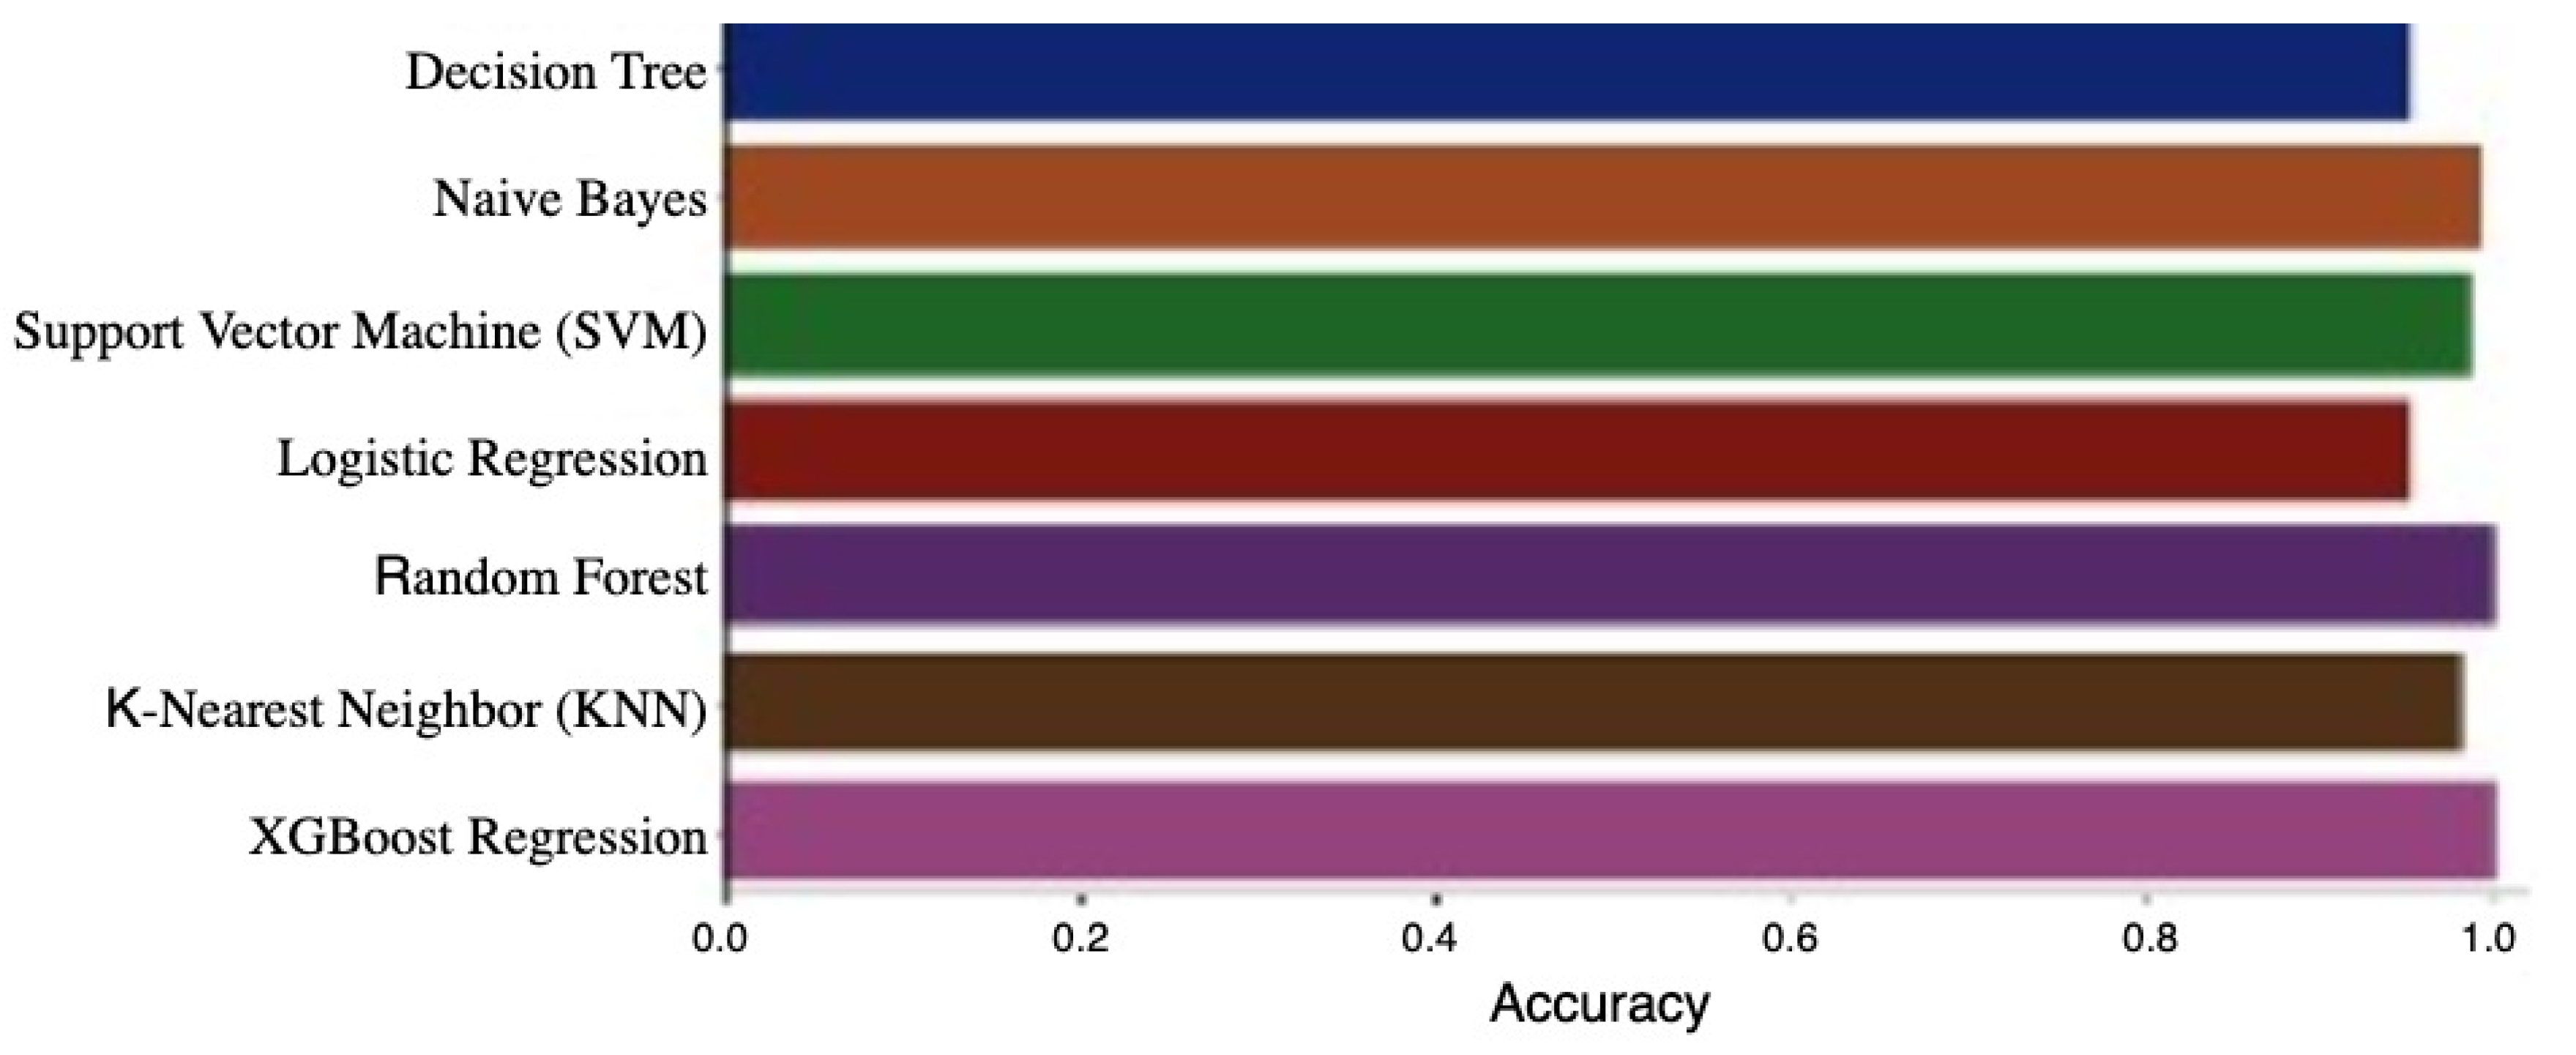
Figure 7.
Plant recommendation results from 7 models.
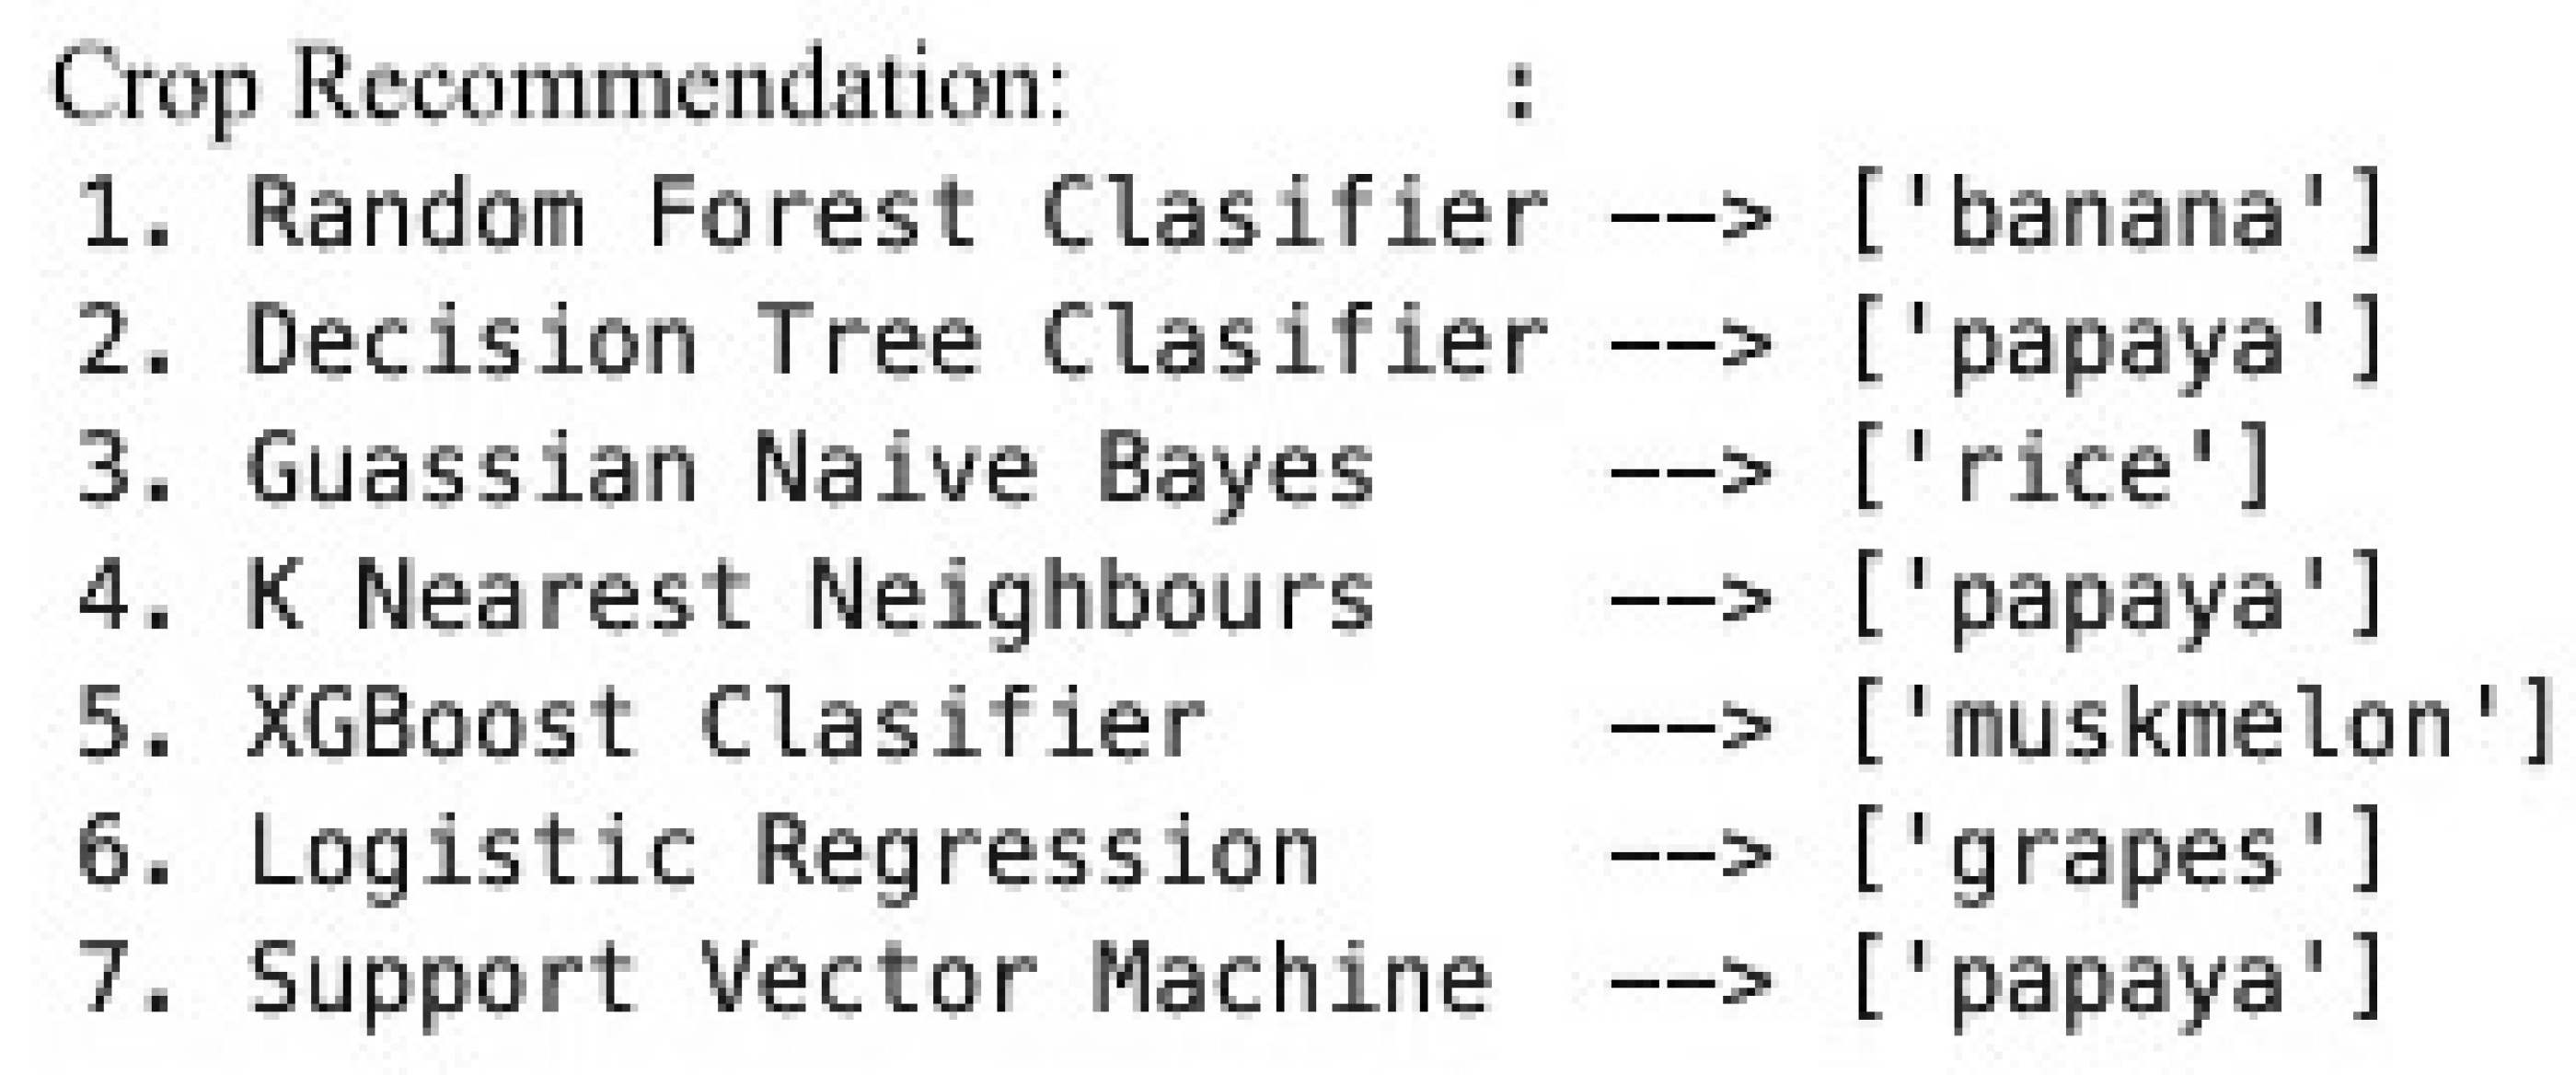
Figure 8.
Workflow of dataset preprocessing. The raw dataset was first divided into training and testing subsets using an 80:20 stratified split, followed by Min–Max normalization applied to each feature to produce standardized train and test sets for model training.
Figure 8.
Workflow of dataset preprocessing. The raw dataset was first divided into training and testing subsets using an 80:20 stratified split, followed by Min–Max normalization applied to each feature to produce standardized train and test sets for model training.
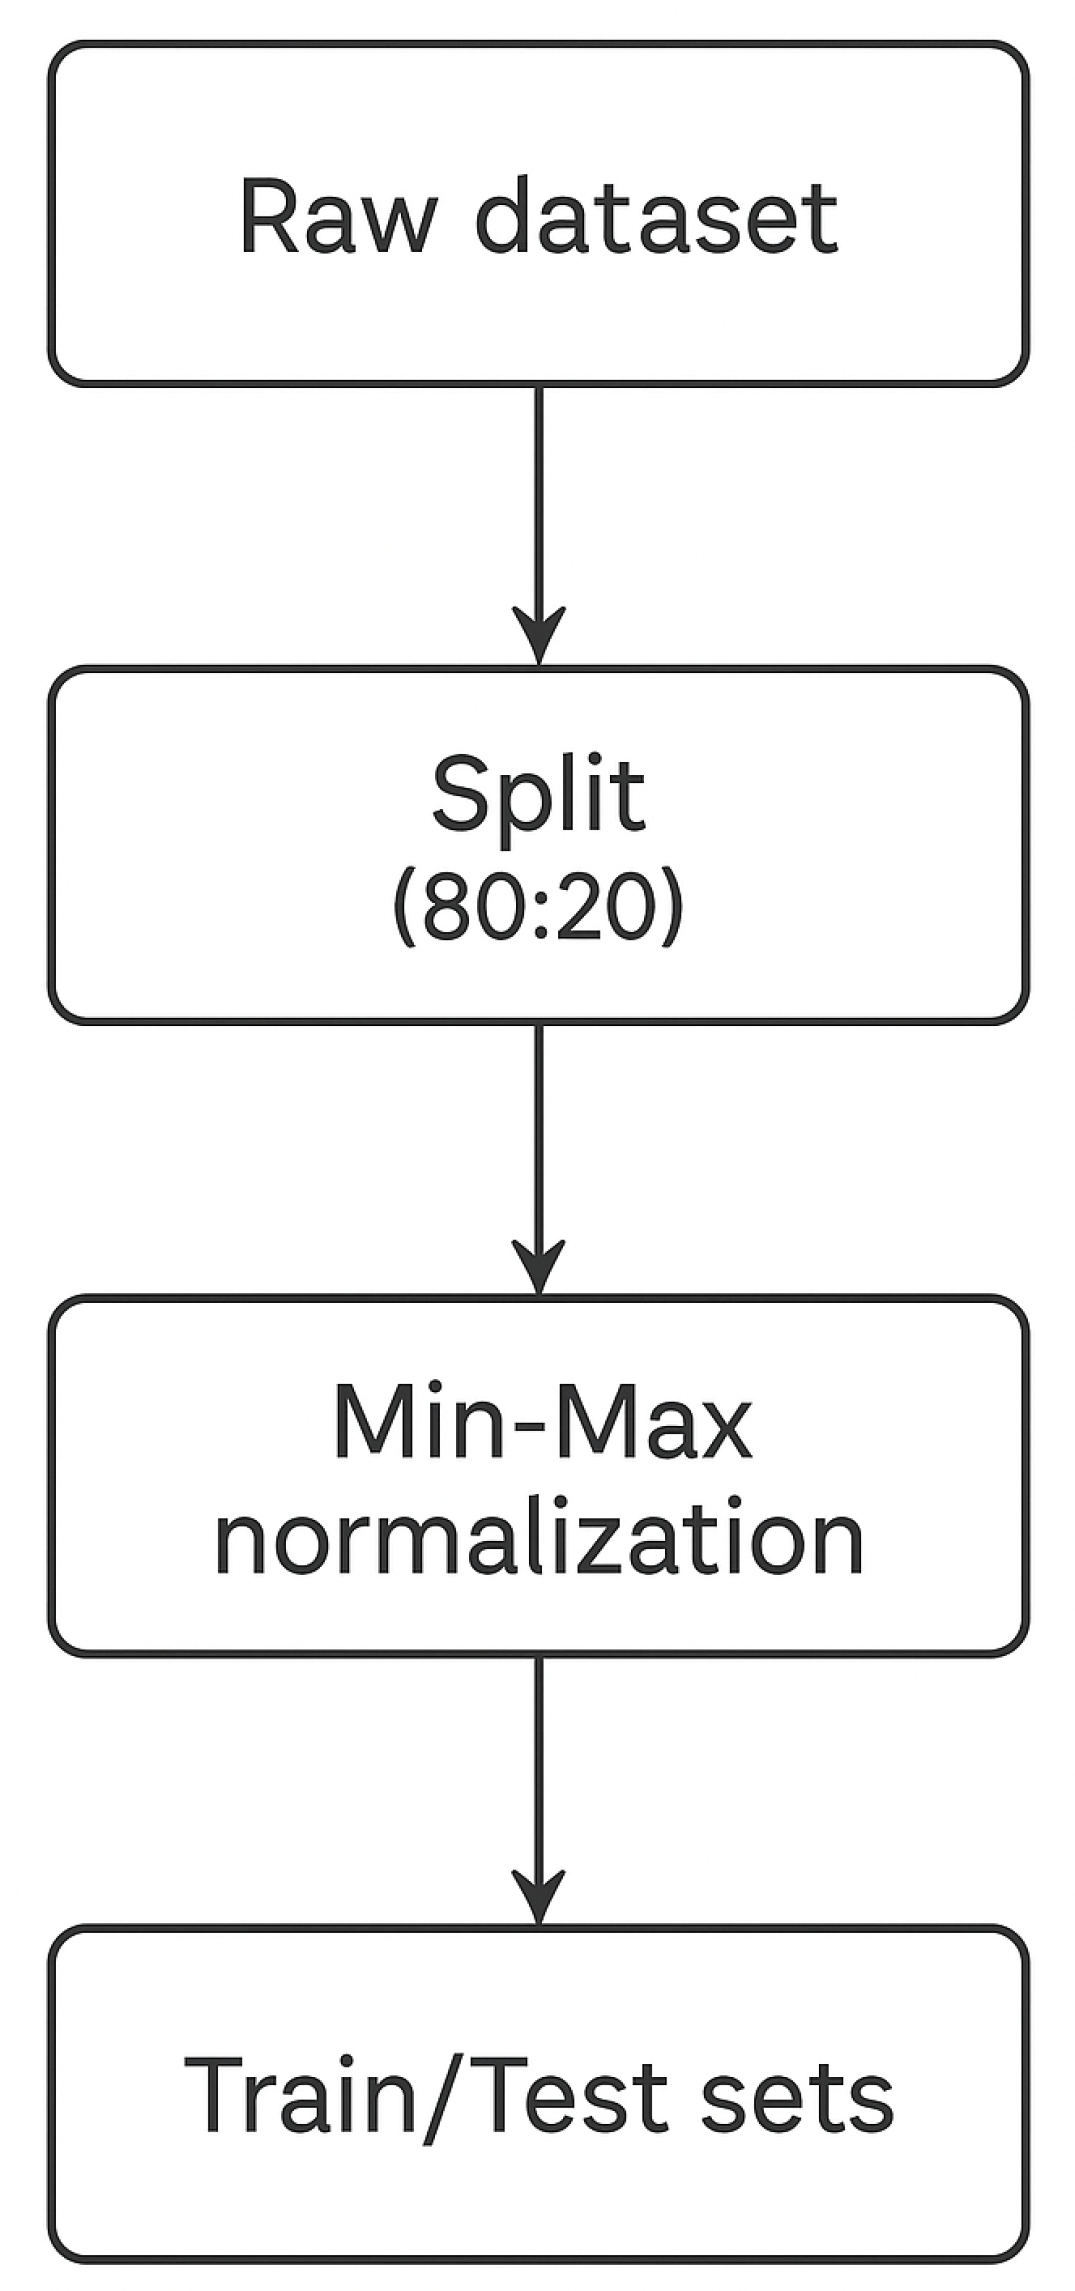
Figure 9.
Illustration of the UG-AgroPlan system.
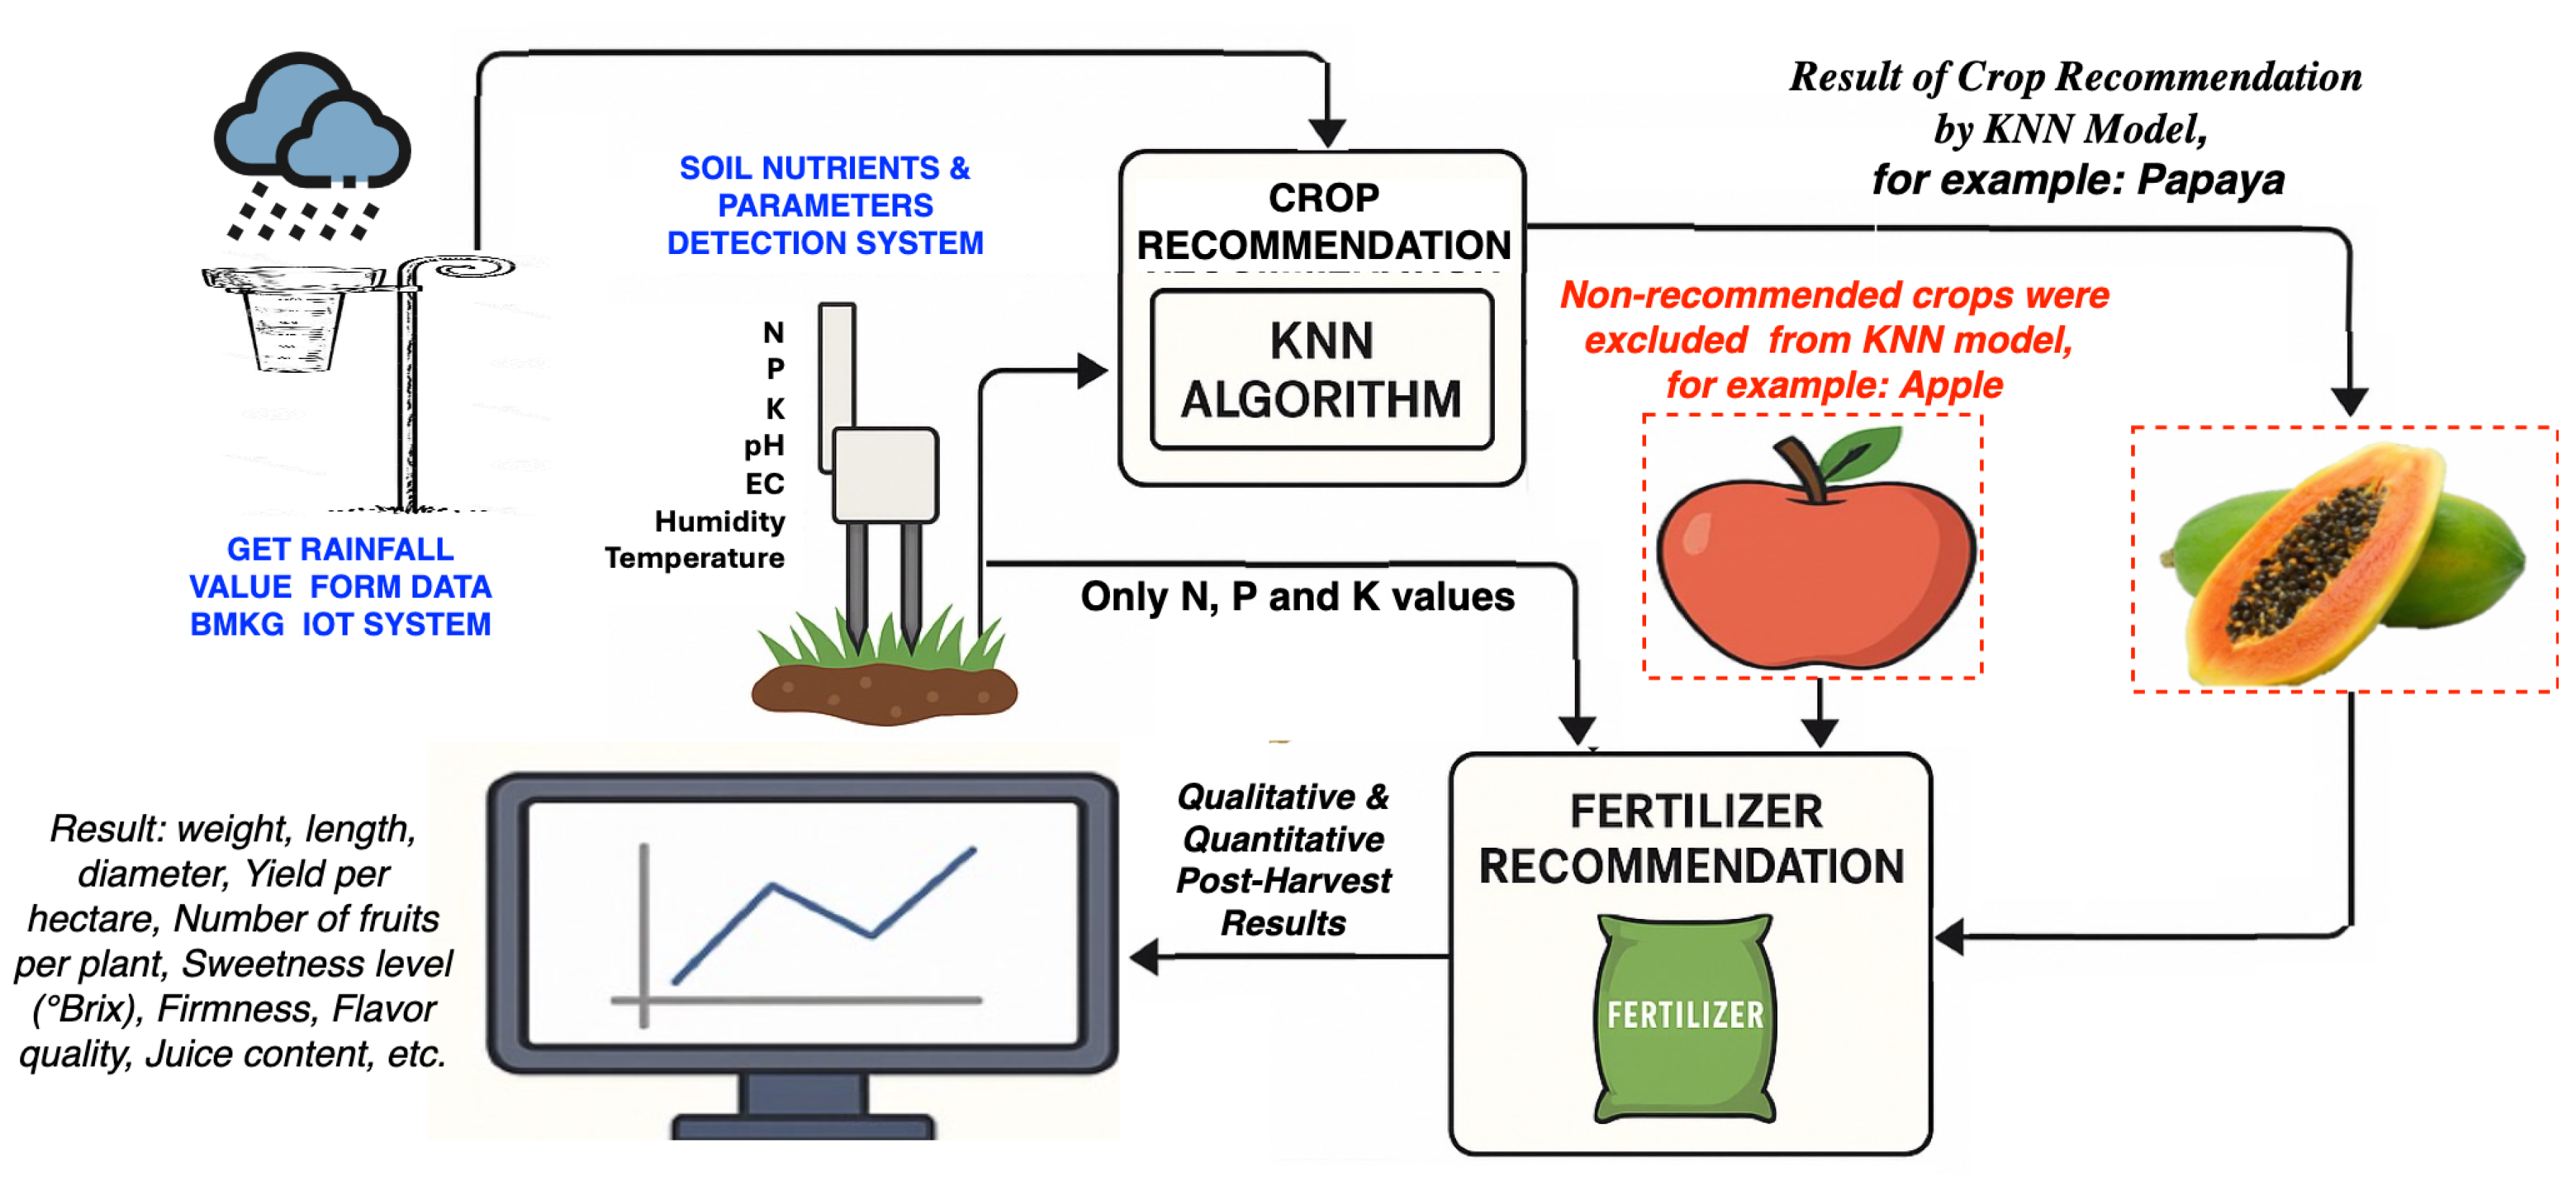
Figure 11.
Uzbekistan melon fruit qualities on each treatment.
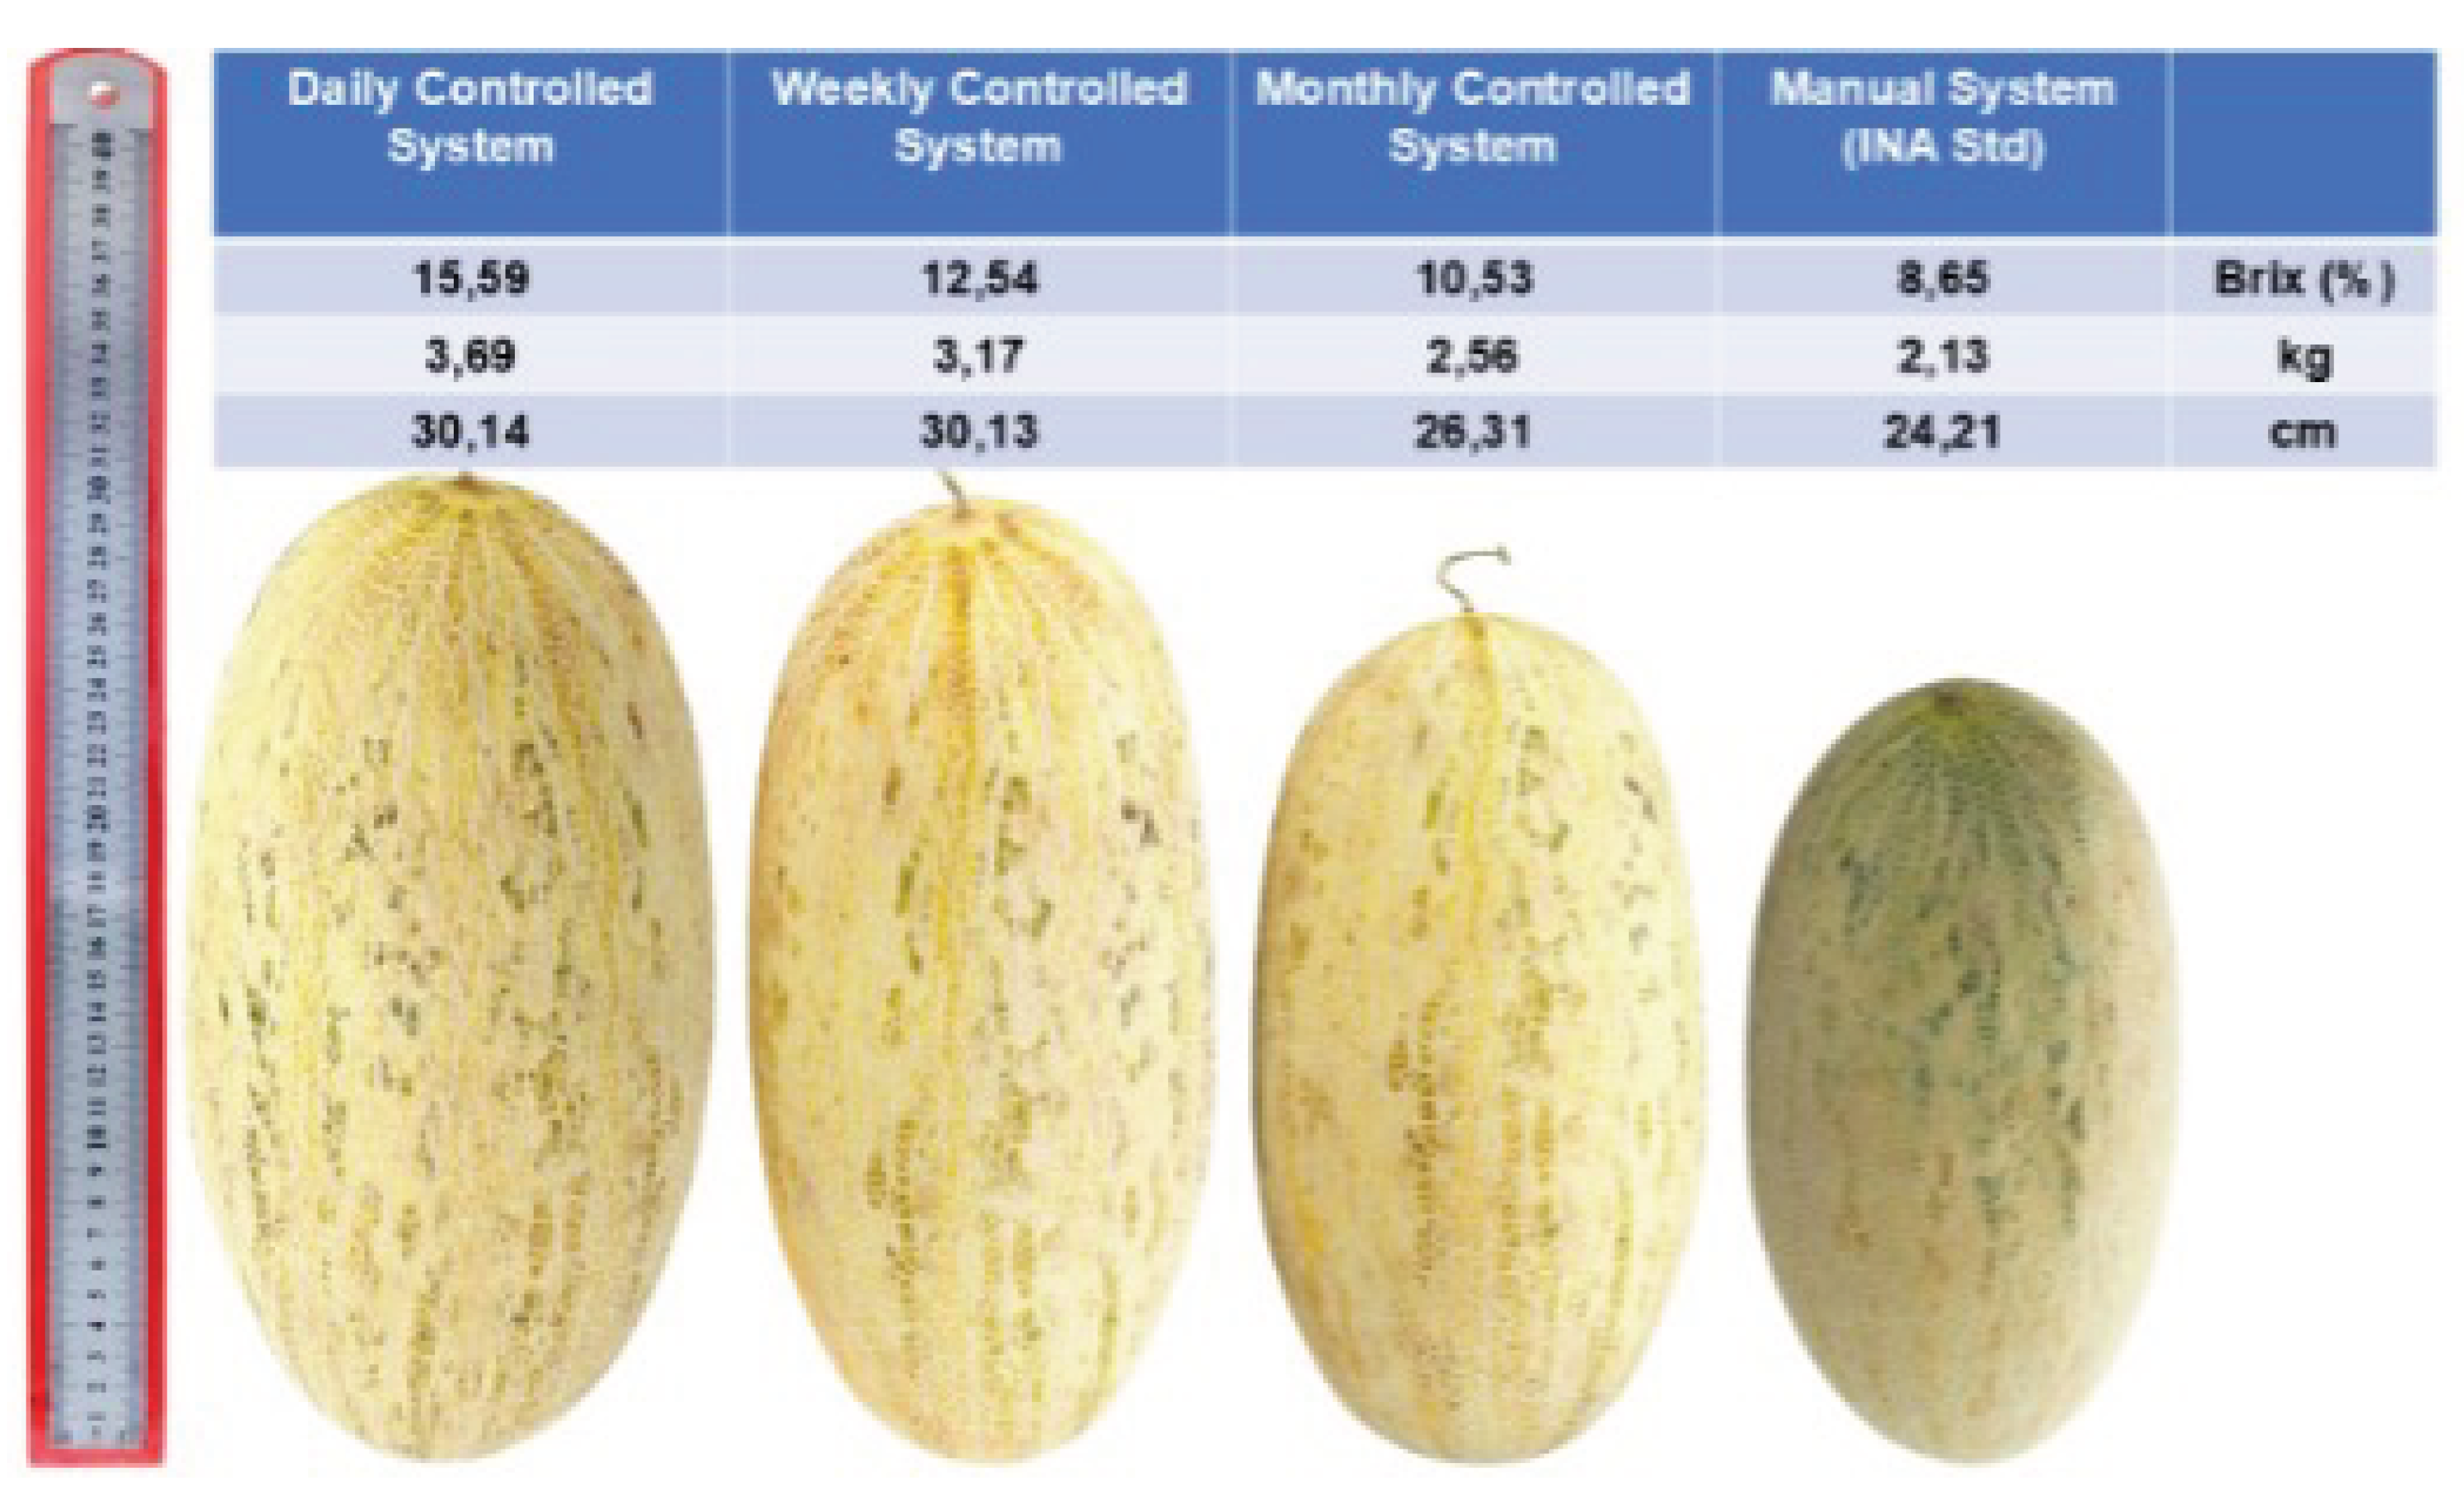
Table 1.
Accuracy results from 7 models.
| Model | Accuracy (%) |
|---|---|
| Logistic Regression | 95.00 % |
| Decision Tree | 95.00 % |
| Support Vector Machine (SVM) | 98.00 % |
| K-Nearest Neighbors (K-NN) | 98.00 % |
| Naïve Bayes | 99.00 % |
| Random Forest | 100.00 % |
| XG Boosting | 100.00 % |
Table 2.
Optimal nutrient and environmental parameters for rice
| Soil Parameters | Unit | Minimum | Maximum | Average |
|---|---|---|---|---|
| Nitrogen (N) | ppm | 60 | 99 | 79.50 |
| Phosphor (P) | ppm | 35 | 60 | 47.50 |
| Potassium (K) | ppm | 35 | 45 | 40.00 |
| Soil Temperature | °C | 20 | 27 | 23.49 |
| Soil Moisture (Humidity) | % | 80 | 85 | 82.55 |
| Soil pH (potential of Hydrogen) | 5.01 | 7.87 | 6.44 | |
| Rainfall (intensity) | mm | 183 | 299 | 240.56 |
Table 3.
The accuracy of results for our prototype sensor
| No | Variables | Accuracy (%) |
|---|---|---|
| 1 | N (ppm) | 97.50 |
| 2 | P (ppm) | 97.41 |
| 3 | K (ppm) | 97.53 |
| 4 | pH | 97.52 |
| 5 | EC (S/cm3) | 97.44 |
| 6 | Soil Moisture (%) | 97.61 |
| 7 | Soil Temperature (°C) | 97.42 |
Table 4.
Dataset from our prototype of sensor soil system for nutrient and other paramters
| Crops | Nitrogen (N) | Phosphor (P) | Potassium (K) | Temperature | Humidity | pH | Rainfall | |||||||
|---|---|---|---|---|---|---|---|---|---|---|---|---|---|---|
| Min. | Max. | Min. | Max. | Min. | Max. | Min. | Max. | Min. | Max. | Min. | Max. | Min. | Max. | |
| C-1 | 0 | 40 | 120 | 145 | 195 | 205 | 21 | 24 | 90 | 95 | 5.51 | 6,50 | 100 | 125 |
| C-2 | 80 | 120 | 70 | 95 | 45 | 55 | 25 | 30 | 75 | 85 | 5.51 | 6.49 | 90 | 120 |
| C-3 | 0 | 40 | 5 | 30 | 25 | 35 | 25 | 30 | 90 | 100 | 5.50 | 6.47 | 131 | 226 |
| C-4 | 80 | 120 | 15 | 40 | 25 | 35 | 23 | 28 | 50 | 70 | 6.02 | 7.49 | 115 | 199 |
| C-5 | 100 | 140 | 35 | 60 | 15 | 25 | 22 | 26 | 75 | 85 | 5.80 | 7.99 | 61 | 100 |
| C-6 | 0 | 40 | 120 | 145 | 195 | 205 | 9 | 42 | 80 | 84 | 5.51 | 6.50 | 65 | 75 |
| C-7 | 0 | 40 | 55 | 80 | 15 | 25 | 15 | 25 | 18 | 25 | 5.50 | 6.00 | 60 | 150 |
| C-8 | 60 | 100 | 35 | 60 | 15 | 25 | 18 | 27 | 55 | 75 | 5.51 | 7.00 | 61 | 110 |
| C-9 | 0 | 40 | 15 | 40 | 25 | 35 | 27 | 36 | 45 | 55 | 4.51 | 6.97 | 89 | 101 |
| C-10 | 0 | 40 | 35 | 60 | 15 | 25 | 24 | 32 | 40 | 65 | 3.50 | 9.94 | 31 | 74 |
| C-11 | 0 | 40 | 35 | 60 | 15 | 25 | 27 | 30 | 80 | 90 | 6.22 | 7.20 | 36 | 60 |
| C-12 | 80 | 120 | 5 | 30 | 45 | 55 | 27 | 30 | 90 | 95 | 6.00 | 6.78 | 20 | 30 |
| C-13 | 0 | 40 | 5 | 30 | 5 | 15 | 10 | 35 | 90 | 95 | 6.01 | 8.00 | 100 | 120 |
| C-14 | 31 | 70 | 46 | 70 | 45 | 55 | 23 | 44 | 90 | 95 | 6.50 | 6.99 | 40 | 249 |
| C-15 | 0 | 40 | 5 | 30 | 35 | 45 | 18 | 25 | 85 | 95 | 5.56 | 7.20 | 103 | 112 |
| C-16 | 60 | 99 | 35 | 60 | 35 | 45 | 20 | 27 | 80 | 85 | 5.01 | 7.87 | 183 | 299 |
| C-17 | 50 | 90 | 40 | 80 | 70 | 110 | 10 | 15 | 90 | 120 | 6.00 | 7.00 | 40 | 60 |
| C-18 | 80 | 120 | 5 | 30 | 45 | 55 | 24 | 27 | 80 | 90 | 6.00 | 6.96 | 40 | 60 |
| Labelling of the Crops: apple (C-1), banana (C-2), coconut (C-3), coffee (C-4), cotton (C-5), grapes (C-6), kidneybeans (C-7), maize (C-8), mango (C-9), mothbeans (C-10), mungbean (C-11), muskmelon (C-12), orange (C-13), papaya (C-14), pomegranate (C-15), rice (C-16), Uzbekistan Melon (C-17), and watermelon (C-18) | ||||||||||||||
Table 5.
The value ranges of all features of the normalization
| Feature | Raw Value Range (min–max) | Normalized Range |
|---|---|---|
| Nitrogen (N) | 0 – 140+ | 0 – 1 |
| Phosphorus (P) | 5 – 145 | 0 – 1 |
| Potassium (K) | 5 – 205 | 0 – 1 |
| Temperature (°C) | 9 – 44 | 0 – 1 |
| Humidity (%) | 14 – 120 | 0 – 1 |
| Soil pH | 3.50 – 9.94 | 0 – 1 |
| Rainfall (mm) | 20 – 299 | 0 – 1 |
Table 6.
Performance of KNN with various k values on soil nutrient classification
| k Value | Accuracy (%) | Remarks |
|---|---|---|
| 1 | 96.2 | Slight overfitting; high variance |
| 3 | 97.4 | Stable classification, lower variance |
| 5 | 98.1 | Best performance, balanced bias-variance |
| 7 | 97.8 | Stable but slightly lower than |
| 9 | 96.5 | Declining accuracy, possible underfitting |
Table 7.
Soil parameter minimum. maximum and average for crops of papaya and apple
| Soil Parameters | Unit | Papaya | Apple | ||||
|---|---|---|---|---|---|---|---|
| Min. | Max. | Average | Min. | Max. | Average | ||
| Nitrogen (N) | ppm | 31 | 70 | 50.50 | 0 | 40 | 20.00 |
| Phosphor (P) | ppm | 46 | 70 | 58.00 | 120 | 145 | 132.50 |
| Potassium (K) | ppm | 45 | 55 | 50.00 | 195 | 205 | 200.00 |
| Temperature | °C | 23 | 44 | 33.34 | 21 | 24 | 22,52 |
| Humidity | % | 90 | 95 | 92.49 | 90 | 95 | 92.49 |
| pH | 6.50 | 6.99 | 6.75 | 5.51 | 6.50 | 6.01 | |
| Rainfall | mm | 40 | 249 | 144.61 | 100 | 125 | 112,56 |
Table 8.
The soil parameters before planting for crop of the Uzbekistan melon (cucumis melo)
| Parameter | Measured Value |
|---|---|
| Nitrogen (N) | 58.25 ppm |
| Phosphorus (P) | 42.10 ppm |
| Potassium (K) | 47.85 ppm |
| pH | 6.3 |
| Soil Moisture | 44% |
| Soil Temperature | 26.2 °C |
| Electrical Conductivity (EC) | 180 µS/cm³ |
Table 10.
Soil nutrient levels during Uzbekistan melon growth cycle (ppm)
| Growth Phase | Nitrogen | Phosphorus | Potassium |
|---|---|---|---|
| Pre-planting | 58.25 | 42.10 | 47.85 |
| Vegetative | 66.50 | 51.70 | 60.10 |
| Flowering | 68.30 | 58.40 | 82.50 |
| Fruiting | 70.10 | 60.20 | 89.70 |
Table 11.
Fertilizer recommendations per growth phase
| Growth Phase | Urea (kg/ha) | SP-36 (kg/ha) | MOP (kg/ha) |
|---|---|---|---|
| Pre-planting | 30 | 46 | 109 |
| Vegetative | 9 | 21 | 77 |
| Flowering | 4 | 4 | 19 |
| Fruiting | 0 | 0 | 1 |
Disclaimer/Publisher’s Note: The statements, opinions and data contained in all publications are solely those of the individual author(s) and contributor(s) and not of MDPI and/or the editor(s). MDPI and/or the editor(s) disclaim responsibility for any injury to people or property resulting from any ideas, methods, instructions or products referred to in the content. |
© 2025 by the authors. Licensee MDPI, Basel, Switzerland. This article is an open access article distributed under the terms and conditions of the Creative Commons Attribution (CC BY) license (http://creativecommons.org/licenses/by/4.0/).
Copyright: This open access article is published under a Creative Commons CC BY 4.0 license, which permit the free download, distribution, and reuse, provided that the author and preprint are cited in any reuse.


