
Submitted:
18 July 2024
Posted:
19 July 2024
You are already at the latest version
Abstract
This study develops a hybrid machine learning (ML) algorithm integrated with IoT technology to improve the accuracy and efficiency of soil monitoring and tomato crop disease prediction in Anakapalle, a south Indian station. An IoT device collected one-minute and critical soil parameters—humidity, temperature, pH values, nitrogen (N), phosphorus (P), and potassium (K)—essential for assessing soil health and optimizing crop growth. Kendall's correlations were computed to rank these parameters for utilization in hybrid ML techniques. Various ML algorithms including K-Nearest Neighbors (KNN), Support Vector Machines (SVM), Decision Tree (DT), Random Forest (RF), and Logistic Regression (LR) were evaluated. A novel hybrid algorithm, 'Bayesian Optimization with KNN', was introduced to combine multiple ML techniques and enhance predictive performance. The hybrid algorithm demonstrated superior results with 95% accuracy, precision, and recall, and an F1 score of 94%, while individual ML algorithms achieved varying results: KNN (80% accuracy), SVM (82%), DT (77%), RF (80%), and LR (81%) with differing precision, recall, and F1 scores. This hybrid ML approach proved highly effective in predicting tomato crop diseases in natural environments, underscoring the synergistic benefits of IoT and advanced ML techniques in optimizing agricultural practices.
Keywords:
IoT
; soil monitoring
; ML algorithms
; tomato crop disease prediction
; soil parameter analysis
; precision agriculture
1. Introduction
Precision agriculture technology has revolutionized crop management and disease control. Managing plant diseases in profitable crops like tomatoes is a significant concern for farmers because diseases can reduce tomato yield and quality. It is known that tomato plants are mostly affected by living things like fungi, bacteria, viruses, and worms, as well as non-living things like temperature, sunlight, and lack of nutrients [1]. Various diseases associated with tomato crops are Early blight, Septoria crop spot, Late blight, and Cercospora crop mold [1], which are caused by fungal diseases.
Disease diagnosis involves skilful, time-consuming, and error-prone visual exams. To properly address crop diseases, they must be quickly and accurately identified. Researchers have developed effective machine-learning approaches to predict tomato crop disease [2], due to the fact that ML approaches improve accuracy, efficiency, and scalability. Crop visual differences can help ML approaches discover and classify disorders [3,4]. Specifying disease indicator threshold values significantly enhances the accuracy of machine learning models in predicting plant illnesses, as evidenced by recent advancements in agricultural technology.
This methodology leverages both professional agronomic insights and historical data analytics, enabling a nuanced comparison that underscores the importance of integrated approaches for precise diagnosis. In particular, the severity of plant diseases, such as those affecting tomatoes, can be meticulously quantified through observable parameters like crop coloration, spot patterns, and lesion appearances, as detailed in [5]. Table 1 lists tomato crop infection symptoms and signs.
2. Mater
The efficacy of ML techniques hinges on the comprehensive collection of sensor data to train algorithms for detecting disease-specific patterns and anomalies. Among these techniques, convolutional neural networks (CNNs) are particularly noteworthy for their superior performance in image recognition tasks, offering a promising avenue for enhancing disease diagnosis accuracy [6]. This integration of machine learning with traditional agronomic knowledge heralds a new era in the precision agriculture landscape, promising significant improvements in disease management and crop yield optimization.
Machine learning offers a superior approach to detecting diseases in tomato leaves, outperforming traditional diagnostic methods such as visual inspection or manual sample testing. By analysing vast datasets and employing sophisticated algorithms, this technology equips farmers with powerful tools to identify and address plant diseases, thus enhancing farming efficiency, productivity, and environmental sustainability. Precision agriculture, facilitated by these advancements, optimizes resource usage and crop management [7]. It has been emphasized that the challenges faced by experts in the agricultural domain are also overcome largely by the introduction of ML techniques [8].
The health and yield of tomato crops are influenced by several key soil parameters such as pH value, soil nutrients including, nitrogen (N), phosphorus (P), potassium (K), which are collectively called as NPK, humidity as well as weather conditions, soil temperature, availability of water, sunlight, wind, and pollution level, etc. [9]. Appropriate levels of these elements are crucial, and deviations can lead to nutrient imbalances, adversely affecting crop health and predisposing the plants to various diseases.
Machine learning models utilize these parameters, among others, to predict disease outbreaks by establishing risk thresholds and identifying data patterns indicative of potential health issues [7,10]. For instance, a detailed analysis [10] provided a comprehensive table that correlates specific soil conditions—highlighting the optimal and critical threshold values for pH, NPK, humidity, and water content—with the likelihood of disease occurrence in tomato plants. This evidence-based approach enables targeted early intervention strategies, paving the way for more effective disease management and ultimately securing crop health and yield.
Table 2 underscores the critical role of various soil parameters in cultivating tomatoes, illustrating how extremes—either too acidic or too alkaline—can predispose plants to Early blight. Similarly, an excess of nitrogen promotes overly lush vegetation, which is particularly vulnerable to Late blight, while deficiencies in potassium and phosphorus elevate the risk of Cercospora crop mold [11]. Furthermore, humidity and soil moisture levels are paramount; overwatering or inadequate drainage foster environments conducive to late blight and crop mold. Excessive wetness harms plant health, emphasizing the importance of balanced soil moisture management. These specific correlations and threshold values are instrumental in predicting potential disease outbreaks using machine learning techniques. By continuously monitoring soil conditions, these techniques can alert farmers to emerging risks, enabling pre-emptive actions to prevent disease onset. This approach enhances productivity, reduces reliance on pesticides, and promotes overall plant health.
Using real-time data and machine learning to optimise agricultural methods, the current study establishes a clear correlation between plant illnesses and soil conditions. By combining IoT and ML technology to create a reliable and effective system for soil monitoring and tomato crop disease prediction, precision agriculture may be advanced in this way.
The current paper is structured as follows: A review of the literature is provided in Section 2, and the goals of the suggested study are discussed in Section 3. The study methodology is then presented in Section 4, which comes after the findings and analysis in Section 5. The results of this study are included in conclusion and are given in Section 6, where we also talk about the present research future scope.
2. Literature Survey
The journey of agricultural discovery commenced with detailed investigations into the intricate relationships between soil nutrient variations and their impact on plant health and disease susceptibility. Early research laid foundational insights into how fluctuations in nitrogen, phosphorus, and potassium (NPK) levels influence the incidence of diseases such as early and late blight in tomatoes [12]. These findings highlighted the critical role of balanced soil nutrition in mitigating disease risks and optimizing crop yield.
As academic inquiry progressed, it embraced sophisticated analytical methodologies, culminating in the integration of cutting-edge technologies like Internet of Things (IoT) and machine intelligence. This evolutionary leap towards precision agriculture enabled farmers to harness data-driven insights for more informed decision-making, thereby significantly enhancing agricultural productivity and sustainability [13].
One of the pivotal advancements was the development of predictive models that not only quantified the impact of specific NPK levels on disease likelihood but also incorporated soil pH as a determinant factor. This holistic approach underscored the nuanced interactions between soil chemistry and plant health, illustrating how subtle variations can profoundly influence disease susceptibility [14].
The application of deep learning techniques, notably convolutional neural networks (CNNs), represented a paradigm shift in disease prediction accuracy. By analyzing vast datasets comprising soil profiles and high-resolution crop imagery, CNNs facilitated more precise and early detection of diseases, thereby enabling proactive disease management strategies [13]. This technological breakthrough not only improved diagnostic accuracy but also streamlined agricultural practices by optimizing resource allocation and reducing reliance on chemical interventions.
Expanding disease prediction models to encompass micronutrients and trace minerals has significantly enriched our understanding of the intricate relationships within the soil-health-disease nexus, thereby advancing the accuracy and reliability of disease forecasts [15]. This holistic approach not only enhances predictive capabilities but also underscores the critical role of balanced nutrition management in sustainable agriculture practices.
By integrating soil health assessments with disease prediction models and advocating for sustainable farming practices, this novel approach emphasizes the reduction of pesticide dependence, thereby promoting environmental sustainability [16]. Moreover, research exploring the impact of water availability and soil humidity on NPK levels and disease occurrence has provided deeper insights into the multifaceted factors influencing plant health [17]. Such investigations are pivotal in refining agricultural practices to optimize nutrient utilization and disease management strategies.
In the realm of classification methods, Support Vector Machines (SVMs) have demonstrated success in plant disease detection due to their ability to handle complex datasets and nonlinear relationships [18,19]. However, SVMs require meticulous kernel selection and parameter tuning to achieve optimal performance, which can be resource-intensive. Concurrently, dense convolutional neural networks (DCNNs) and other deep learning architectures have emerged as powerful tools for high-accuracy plant disease detection [20]. While CNNs excel in extracting intricate patterns from data, their computational demands and reliance on large training datasets pose challenges in practical implementation [21,22]. These limitations underscore the ongoing need for efficient computational resources and robust data management strategies to harness the full potential of deep learning in agricultural applications.
Machine learning models, exemplified by XGBoost, have proven effective in predicting greenhouse tomato crop evapotranspiration through the analysis of meteorological data [23]. This capability extends to disease prediction by integrating diverse environmental and soil parameters as input features, thereby enhancing the models' predictive power across varying agricultural contexts. Furthermore, hybrid machine learning approaches integrating spectral and structural data from UAV and satellite imagery have shown significant improvements in monitoring crop health and predicting yield-related metrics, underscoring their potential for comprehensive agricultural management [24].
In a notable study [25], advanced AI and computer vision techniques were employed to classify tomato diseases at early stages. DenseNet121 exhibited outstanding performance with 99.88% training and 99.00% testing accuracy, while ResNet50V2 and ViT also achieved high accuracies (95.60% and 98.00%, respectively). Despite their efficacy in disease detection, these models face challenges such as high computational demands and rigorous data preparation requirements. Nonetheless, their ability to efficiently diagnose diseases is crucial for enhancing crop yield and quality.
Similarly, research employing convolutional neural networks (CNNs) achieved a remarkable 98.49% accuracy in diagnosing tomato leaf diseases using a dataset of 3000 images [26]. However, the computational intensity of CNNs poses challenges for real-time field applications, necessitating ongoing dataset updates to maintain accuracy amidst evolving disease strains.
Comparative studies across diverse climates emphasize the necessity of region-specific models in crop disease detection [27]. These studies recognize that environmental factors such as temperature, humidity, rainfall patterns, and soil characteristics vary significantly between regions, influencing crop health, disease prevalence, and nutritional imbalances. For instance, diseases thriving in humid, warm climates may not manifest in arid, cooler regions. Addressing these variations is crucial for ensuring precise disease detection and effective management strategies tailored to local agricultural conditions.
3. Objectives of the Present Research
According to the literature review, hybrid machine learning is required since it can analyse complicated data more thoroughly than traditional methods. Secondly, and most importantly, region-specific models based on real-time data are scarce. In a broader sense, as different regions have distinct climatic factors, including varying degrees of humidity, different types of soil, and varying rates of disease, it is essential to develop machine learning models that are specifically tailored to each location. Thirdly, comprehensive analyses of metrics are needed to improve resource management.
Therefore, the current research study aims to:
- a)
- Develop a hybrid machine-learning technique that yields optimal results.
- b)
- Research on crop disease detection in various climates results in the creation of models unique to a given area.
- c)
- Offer a comprehensive list of evaluation metrics, such as accuracy, precision, recall, and F1-score, ROC-AUC.
4. Data and Methodology
4.1. Tomato Crop Location
The present study considered tomato fields located at Anakapalle (Geographic Latitude 17.6896° N, Geographic Longitude 83.0024° E, MSL ~ 29 m), a major municipality in the state of Andhra Pradesh, south India. Figure 1 shows the map of India and the locaiton of Anakaplle. Tomatoes (Solanum lycopersicum) flourish in Andhra Pradesh's diverse agro-climatic conditions, which span from coastal regions to fertile interior plains. The state's strategic location and varied seasons enable year-round cultivation, ensuring a steady supply of this essential vegetable. Andhra Pradesh, the largest tomato-producing state in India, achieved a notable production of 2,744.32 thousand metric tonnes last financial year, i.e., FY 2023-2024.
This study utilized one-minute datasets gathered meticulously from fields in Anankapalle (India) over five consecutive days, from 27 November to 01 December 2023. For clarity, Figure 2 presents probability density functions (PDFs) of these datasets collected during our research.
The provided histograms with PDFs for Nitrogen (%), Potassium (%), Phosphorus (%), Humidity (%), Soil pH, and Temperature (°C) all display approximately normal distributions, with most data points clustering around the mean values. Nitrogen is centered around 2%, Potassium around 3%, Phosphorus around 1%, Humidity around 80%, Soil pH around 6.5, and Temperature around 25°C, each showing a slight right skew. The close alignment of the PDFs with the histograms indicates that the datasets are well-behaved and suitable for statistical analysis and modeling.
4.2. Data Collection- Arduino Microcontroller
In the pursuit of agricultural excellence, modern farms employ a suite of sophisticated sensors, each designed to unravel the environmental intricacies of soil and air that critically influence crop health and yield. The sensor array, a fusion of metal and plastic engineering, operates in a symphony of data collection and analysis. One such sensor, adept at monitoring thermal variations, vigilantly regulates the temperature within the fields, safeguarding the warmth essential for the optimal growth of grapevines [20]. Figure 3 shows an Arduino microcontroller to collect soil parameters, pH value, temperature, humidity, and others in the presenet research.
A GPS sensor surveys the farm's topology, ensuring uniform sunlight distribution for even growth. An RGB color sensor, called Sarah’s tool, monitors soil hues to assess health and fertility, essential for vine sustenance [28]. An air quality sensor discreetly measures particulate matter [29], wirelessly sending data to Sarah's mainframe to maintain pure air. Temperature and humidity sensors protect the fruits, with their crucial readings streamed to the cloud via an ESP8266 Wi-Fi microcontroller, enabling real-time data processing [30].
A dedicated NPK sensor ensures optimal nutrient levels and balanced pH for the vines, streaming data to a cloud-based platform via an Arduino board. This board acts as the farm's AI, learning, adapting, and issuing directives based on continuous data flow, maintaining vigilant environmental monitoring. Powered by a 24V battery system, this network of sensors and technology upholds the necessary equilibrium for the vineyard’s flourishing, as shown in the attached diagram [31]. Table 3 depicts various sensors used in the present study.
An attempt is also made to make a comparison between soil parameters (temperature and humidity) measured by the Arduino sensor and those provided by the India Meteorological Department (IMD, https://mausam.imd.gov.in/), and almost a one-to-one similitude has been found, which implies that this research used only quality data.
4.3. Calculation of Kendall’s Correlation (τ)
Kendall's correlation, named after Maurice Kendall, is essential in hybrid machine learning for feature selection and model evaluation due to its robustness to outliers and ability to handle ordinal data. In agricultural data management, it analyses datasets comprising temporal markers, temperature, and humidity, pH, and NPK levels. The process begins with rigorous data preparation, addressing missing values through imputation or removal to prevent bias. Categorical and timestamp data are encoded to numerical values to calculate Kendall's correlation.
The Kendall correlation coefficient (τ) is calculated as:
where nc is the number of concordant pairs, nd is the number of discordant pairs, and n is the total
number of pairs.
The algorithm iteratively evaluates all column pairs, identifying concordant and discordant pairs based on their relative order. Concordant pairs are those where both elements are greater or lesser than another pair, while discordant pairs have differing orders. The coefficient τ ranges from -1 (complete disagreement) to 1 (perfect agreement), with 0 indicating no association. Interpreting these coefficients reveals intervariable relationships, aiding in factor selection, trend analysis, and predictive modeling. This process unveils insights for informed decision-making and strategic planning in agricultural management.
4.4. Bayesian Optimization with the KNN Algorithm
Bayesian optimization is a powerful method for optimizing objective functions, especially in hyperparameter tuning, where each evaluation requires significant computational resources and time [32]. It is effective for finding the optimal hyperparameters for a K-Nearest Neighbors (KNN) model by defining an objective function, such as model accuracy. The process starts with setting a prior distribution over the hyperparameters and using an acquisition function like Expected Improvement (EI) to balance exploration and exploitation.
The algorithm begins with random initial hyperparameters, evaluates the objective function, and updates a surrogate model that approximates the objective function. Iteratively, it uses the surrogate model and acquisition function to select new hyperparameters, refining the model until convergence criteria or iteration limits are met. The optimal hyperparameters are then used to train the KNN model on the entire dataset, aiming to outperform models trained with randomly chosen hyperparameters. Finally, the fine-tuned KNN model is tested on an independent dataset to assess its generalization and performance, efficiently reducing the computational cost and time of exhaustive search methods.
4.5. Data Preparation and Plant Health Classification
To leverage IoT, a complex Arduino-based circuit terminal was used to systematically collect soil samples and gather data on environmental parameters such as humidity, temperature, and nutrient content. After data collection, the data is securely transmitted to the cloud for further analysis. The first step is data cleansing, which is accurately performed using Python. This involves removing any extraneous or disruptive information to retain only the most pertinent data. Python's capabilities are then used to optimize and synchronize the data structure. Next, Python's analytical tools are employed for correlation research to uncover links and trends within the processed data, essential for gaining insights into environmental factors affecting crop health.
In the predictive modeling stage, sophisticated algorithms like KNN and Bayesian approaches are applied. Python's scikit-learn and Matplotlib are used for comparative analysis of various prediction techniques. This research demonstrates that incorporating IoT technology into data processing and analysis can enhance agricultural operations and open new avenues in precision farming. It illustrates the potential success of integrating traditional farming with cutting-edge technology. Field IoT peripherals provide real-time farm data with time-stamped entries, offering minute-by-minute time series updates. This granularity allows for precise monitoring of field conditions. Table 5 shows how we prepared collected data to propose a hybrid model, while Table 6 shows how the disease classification has done.
- a)
- Each record is annotated with a date and time stamp. The format is consistent with DD-MM-YYYY dates and HH:MM times, suggesting one-minute automated logging.
- b)
- NPK Level: This measures how much nitrogen (N), phosphorus (P), and potassium (K) are in the soil. It's given as a number between 1 and 3, indicating low, medium, or high levels of these nutrients.
- e)
- Temperature (°C): The ambient temperature is recorded in degrees Celsius (°C), ranging from 21°C to 24°C and this tight range reflects consistent weather during data collection.
- f)
- Humidity (%): Measures air moisture, ranging from 45% to 50%. Paddy fields are usually moderately humid.
- g)
- pH value: Recorded soil acidity or alkalinity ranges.
- h)
- Diseased: This binary classification serves as the target variable for machine learning models, where '1' represents the presence of disease and '0' signifies a healthy state.
5. Results and Discussion
By applying the Kendall correlation coefficient, the study seeks to establish monotonic relationships between environmental factors and the health status of the plants. The non-parametric nature of this correlation is suitable for datasets that may not adhere to a normal distribution and can handle ordinal and continuous variables alike. The processed data set is thus poised for use in classification algorithms, such as decision trees (DT), support vector machines (SVM), or neural networks (NN), to predict disease presence in the paddy field. The goal is to leverage this model to forecast and mitigate crop diseases, thereby enhancing yield and reducing losses due to plant health issues. The dataset provides a basis for developing a predictive model that can be trained, tested, and validated for accuracy and reliability in real-world agricultural settings.
Figure 4 shows the proposed framework, where a hybrid ML enabled is proposed that is backed by an IoT system for soil nutrients monitoring in a real-time environment.
The various phases of the present research framework are explained, as under:
- a)
- Data Collection Phase: The first step is to collect environmental data using an IoT device. It's very important that this data is accurate and complete because it forms the basis for all future analysis and decisions.
- b)
- Data Processing and Evaluation: After ensuring the data is accurate and complete, it goes through processing where we assess soil health. This step is key because it turns raw data into useful information about soil health, which is important for good crop management.
- c)
- Data Analysis and ML Implementation: The processed data is then analysed to see if it meets our standards. If it does, we move on to using machine learning (ML) algorithms. In this stage, we compare different ML algorithms to find the best one for improving soil health.
- d)
- Model Assessment and Adjustment: After implementing the ML algorithms, we check how well the model performs. If it doesn't meet our standards, we make adjustments or retrain the model. If it does meet the standards, we analyse its performance based on set metrics.
- e)
- Operational Implementation and Continuous Evaluation: Once the model proves it can improve crop management, it is used in real-world settings. This step is critical to see how well the technology works in practical situations.
The model yields good results over a wide range of criteria. The accuracy rate is 95 out of 100 instances, which is almost 95.35%. The model's precision allows it to generate precise predictions, which is useful in practical applications. Table 7 shows various performance metrics obtained using the hybrid ML.
The hypothetical ROC curve, shown in Figure 5, with an AUC (area under the curve) of 0.95, demonstrates a highly effective classifier. Recent publications highlight the significant impact of soil nutrients on managing tomato crop diseases and improving productivity. Soil amendments with green manures like fodder radish and bio-enriched organic manures combined with macro and micronutrients enhance soil fertility, growth, yield, and disease resistance in tomato crops [33,34]. The ROC curve likely represents the effectiveness of these nutrient management strategies in improving tomato crop health, with an AUC of 0.95 indicating high discriminative ability in distinguishing healthy from diseased crops.
The graph shown in Figure 6 presents a comparative analysis of the performance metrics between training and testing datasets for a machine learning model. Observing the minimal divergence between the training and testing results, we can infer a consistent pattern across all evaluated metrics: accuracy, precision, recall, and F1 score. The closeness of these metrics signifies that the model generalizes well to new, unseen data, indicative of a well-tuned model that avoids overfitting. In particular, the training metrics exhibit a slight elevation, which is expected as models typically perform better on data they have been trained on. However, the test metrics are not far behind, suggesting that the model retains its performance robustness when exposed to new data. This alignment between train and test performance is crucial for ensuring that the model is reliable and effective when deployed in real-world scenarios.
The graph reflects strong overall performance, with high values in accuracy, precision, recall, and the F1 score. These metrics collectively point towards the model's capability to correctly identify positive cases, precisely predict the positive class, and balance the trade-off between precision and recall effectively. Such a performance profile indicates the model's suitability for practical application, although careful consideration for potential false positives and negatives remains necessary to fine-tune its predictive accuracy further. This vigilance will enhance the model's utility and trustworthiness in practical settings, solidifying its strength as a predictive tool.
The graph presented in Figure 7, an assumed confusion matrix, displays the model's prediction abilities. With 5900 true positives and 315 genuine negatives, the model can accurately classify situations as healthy or unhealthy. It must be admitted that the model made 315 false positives and 670 false negatives in disease diagnosis. The statistics indicate that classifier performs exceptionally well in identifying positive instances, as evidemced by the high number of true postiives (5900). On the other other, with 315 fasle postiives, the classifier oftentimes incorrectly identifies negtiave isntances as postive and the classifier misses 670 positive instances, which could be critical depending on the application context.
Performance metrics, shown in Figure 8, highlight similarities among various machine learning algorithms. The best algorithm is "Bayesian Optimization with KNN," with an accuracy, precision, and recall of 0.95, and an F1 score of 0.94, making it highly adaptable. "SVM" and "Logistic Regression" also perform well, with accuracies of 0.82 and 0.81, respectively. "Logistic Regression" excels in recall at 0.94, ideal for applications prioritizing true positives. Conversely, "Decision Tree" underperforms across all metrics, facing accuracy and precision challenges. "Random Forest" achieves balanced performance, fitting all criteria. A comparison between the hybrid model (Bayesian Optimisation with KNN) and other models show how much better the hybrid model performs overall. It is expected that data scientists and practitioners may find these insights useful in choosing the right algorithms. Table 8 provides an overview of earlier studies and sets our work apart from theirs.
6. Conclusion
Modern agriculture faces significant challenges in soil monitoring and disease prediction for crop management. Integrating advanced machine learning algorithms with IoT technology offers a potential solution, particularly for tomato crops. Using ML techniques this research reports that tomato crop disease detection performance can be improved that subsequently improve farming operations. The present study proposes a hybrid ML, which combines multiple ML techniques to improve predictive performance.
Importantly, to fine-tune the model’s hyperparameters, this study has used a sophisticated optimisation method, i.e., Bayesian optimisation with KNN. The performance metrics, as depicted in Figure 8, demonstrate that the proposed optimisation model outperforms existing methods, achieving high accuracy (95%), precision (95%), and recall (95%). Its steady F1 score of 0.94 shows its forecasting accuracy. By leveraging IoT for real-time data acquisition and hybrid ML for sophisticated data analysis, this integrated approach aims to enhance decision-making in tomato cultivation, thereby improving yield quality and quantity.
Secondly, the present study has considered tomato crop prediction from a relatively new area in south India, where no such studies have been reported to the best of the authors’ knowledge. The present research, therefore, can be considered a case study by the agriculture scientists, farmers, and other stakeholders who will benefit from it.
Coming to the future scope, to further improve the performance of these creative works, future research should concentrate on enhancing the scalability and accuracy of machine learning algorithms, consumer food security, and the integration of other data sources. Future research should also focus on expanding the dataset to include more diverse agricultural environments and disease types. Research efforts should focus on developing robust and scalable ML algorithms to handle complex soil nutrient data and integrate ML techniques with sensor networks and remote sensing (satellite-based) data to fully realise its potential in soil science.
Author Contributions
Mr. Gurujukota Ramesh Babu conducted the main research and collected data, analysed and interpreted the data. Mr. M. Gokuldhev M conceived the idea and developed the theory, supervised the research, and reviewed and edited the manuscript before submission and Dr. P S Brahmanandam drafted the manuscript and revised it critically. All authors discussed the results, contributed to the final manuscript, have read and approved the final version, and agree with the order of presentation of the authors.
Funding
This research received no external funding.
Institutional Review Board Statement
Not Applicable.
Informed Consent Statement
Not Applicable.
Data Availability Statement
Not applicable.
Conflicts of Interest
The authors declare no conflict of interest
Acknowledgments
Authors acknowledge the managements of both institutes, Veltech Rangarajan Dr. Sagunthala R&D Institute of Science and Technology (Chennai, Idnia) and Shri Vishnu Engineering College for Women (Bhimavaram, India) for providing infrastructural facilities that enabled us to carry out this important research work.
References
- Blanchard, D. A colour atlas of tomato disease; Wolfe Pub. Ltd., Brook House, London, 1992; pp. 298.
- Arup Chattopadhyay, A.; Asit Kumar Mandal. ; Praveen Kumar Maurya.; Subrata Duttal. Effective Management of Major Tomato Diseases in the Gangetic Plains of Eastern India through Integrated Approach. Agricultural Research & Technology: Open Access Journal 2017, 10. [Google Scholar] [CrossRef]
- Ubalanka, V.; Jose, A.; Viswanath, D. Machine Learning Strategies for Predicting Crop Diseases. Journal of Physics. (2021). Conference Series, 1850, 012119. [CrossRef]
- Ahmed, I.; Habib, G.; Yadav, P. K. An Approach to Identify and Classify Agricultural Crop Diseases Using Machine Learning and Deep Learning Techniques. 2023 International Conference on Emerging Smart Computing and Informatics (ESCI), 1–6. /: https. [CrossRef]
- Sandeep K, H.; Rakesh B, S. Prediction of Disease in Tomato Leaves with use of Machine Learning Technique. International Journal of Advanced Research in Science, Communication and Technology 2023, 251–256. [CrossRef]
- Balu, V.; P, S. Wearable Multi-Sensor Data Fusion Approach for Human Activity Recognition Using Machine Learning Algorithms. SSRN Electronic Journal 2023. [Google Scholar] [CrossRef]
- Spiga, O.; Cicaloni, V.; Fiorini, C.; Trezza, A.; Visibelli, A.; Millucci, L.; Santucci, A. Machine learning application for development of a data-driven predictive model able to investigate quality of life scores in a rare disease. OrpHanet Journal of Rare Diseases 2020, 15. [Google Scholar] [CrossRef] [PubMed]
- CABI.; EPPO. 2016. Tomato leaf curl New Delhi virus. Distribution Maps of Plant Diseases. [CrossRef]
- Blesslin Sheeba, T.; Anand, L. ; D. Vijay,.; Manohar.; Gunaselvi Selvan.;Saravana Wilfred, C.; Bazil Muthukumar, K.; Padmavathy, S.; Ramesh Kumar, P.; Asfaw Belete Tessema. Machine Learning Algorithm for Soil Analysis and Classification of Micronutrients in IoT-Enabled Automated Farms, Journal of Nanomaterials 2022, 5343965, 7 pages, 2022. [CrossRef]
- Senapaty, M.K.; Ray, A.; Padhy, N. IoT-Enabled Soil Nutrient Analysis and Crop Recommendation Model for Precision Agriculture. Computers 2023, 12, 61. [Google Scholar] [CrossRef]
- Kitila,C.; Olana,G. Influence of farmyard manure and NPS fertilizer on Hot Pepper (Capsicum annuum L.) growth and yield variables at Western Ethiopia. Plant Science Today, 2024; 11, 397–404.
- Zhu, L.; Liao, Q.; Wang, Z.; Chen, J.; Chen, Z.; Bian, Q.; Zhang, Q. Prediction of Soil Shear Strength Parameters Using Combined Data and Different Machine Learning Models, Applied Sciences, 2022, 12, 5100. [CrossRef]
- Medvedkova, S.O. Relationship of melatonin and serotonin levels with clinical neurological data in patients with cerebral ischemic hemispHeric stroke during the early recovery stage of disease. Zaporozhye Medical Journal 2017. [CrossRef]
- Rajyaguru, D. J.; Borgert, A. J.; Halfdanarson, T. R.; Truty, M. J.; Kurup, A. N.; Go, R. S.; Reply to E.L. Pollom et al, N. Ohri et al, A. Fiorentino et al, D.R. Wahl et al, N. Kim et al, J. Boda-Heggemann et al, S. Rana et al, N. Sanuki et al, J.R. Olsen et al, G.L. Smith et al, and A. Shinde et al. Journal of Clinical Oncology 2018, 36, 2567–2569. [CrossRef]
- Aljumaily, A.; Kashmolaa, A. Building predictive models to assess degradation of soil organic matter over time using remote sensing data. Mesopotamia Journal of Agriculture 2022, 50, 19–27. [Google Scholar] [CrossRef]
- Chandra, R. ; Role of trace elements for health promotion and disease prevention. Nutrition Research 2003, 23, 23–1745. [Google Scholar] [CrossRef]
- Challet, D.; Ragel, V. Recurrent Neural Networks With More Flexible Memory: Better Predictions Than Rough Volatility. SSRN Electronic Journal 2023. [Google Scholar] [CrossRef]
- Ansari Arshiya.S.; Jawarneh.; Malik.; Ritong.; Mahyudin Jamwal.; Pragti Mohammadi.; Mohammad Sajid.; Veluri Ravi Kishore Kumar.; Virendra Shah.; Mohd Asif, Improved Support Vector Machine and Image Processing Enabled Methodology for Detection and Classification of Grape Leaf Disease, Journal of Food Quality, 2022, 9502475, 6 pages. [CrossRef]
- Aravind Reddy, Y.; M. Adimoolam; Efficient plant leaf disease detection using support vector machine algorithm and compare its features with Naive Bayes classification. AIP Conf. Proc. 7 February 2024; 2729 (1): 060015. [CrossRef]
- G. Shobana.; K. Vignesh .; S. Sree Dharshan, Plant Disease Detection Using Deep Neural Network, 2023 2nd International Conference on Advancements in Electrical, Electronics, Communication, Computing and Automation (ICAECA), Coimbatore, India, 2023, pp. 1-6. [CrossRef]
- Attallah, O. ; Tomato Leaf Disease Classification via Compact Convolutional Neural Networks with Transfer Learning and Feature Selection. Horticulturae 2023, 9, 149. [Google Scholar] [CrossRef]
- J. Garcia Arnal Barbedo et al., Annotated Plant Pathology Databases for Image-Based Detection and Recognition of Diseases. IEEE Latin America Transactions, vol. 16, no. 6, pp. 1749-1757, June 2018.
- Ge, J. , Zhao, L., Yu, Z., Liu, H., Zhang, L., Gong, X., & Sun, H. Prediction of Greenhouse Tomato Crop Evapotranspiration Using XGBoost Machine Learning Model. Plants, 2022, 11. [CrossRef]
- Maimaitijiang, M. , Sagan, V., Sidike, P., Daloye, A.M., Erkbol, H., & Fritschi, F. Crop Monitoring Using Satellite/UAV Data Fusion and Machine Learning. Remote. Sens., 2020, 12, 1357. [CrossRef]
- Alzahrani, M.S.; Alsaade, F.W. Transform and Deep Learning Algorithms for the Early Detection and Recognition of Tomato Leaf Disease. Agronomy 2023, 13, 1184. [Google Scholar] [CrossRef]
- Trivedi, N.K.; Gautam, V.; Anand, A.; Aljahdali, H.M.; Villar, S.G.; Anand, D.; Goyal, N.; Kadry, S. Early Detection and Classification of Tomato Leaf Disease Using High-Performance Deep Neural Network. Sensors 2021, 21, 7987. [Google Scholar] [CrossRef] [PubMed]
- Newlands, N.K. (2018). Model-Based Forecasting of Agricultural Crop Disease Risk at the Regional Scale, Integrating Airborne Inoculum, Environmental, and Satellite-Based Monitoring Data. Frontiers in Environmental Science. [CrossRef]
- Deshannavar, U. ; High dimensional weather data used in a deep generative model to predict trajectories of aircraft. Journal of Airline Operations and Aviation Management 2022, 1, 80–88. [Google Scholar] [CrossRef]
- H.S. Sridhar.; N. S. M. P. Latha Devi.; G. Uma.; Auromeet Saha.; P. S. Brahmanandam.; K. Raghavendra Kumar. First-Time Observations of Fine Particle Matter (PM2.5) at a Rural Site in South India – A Case Study, PES journal 2024. [CrossRef]
- Luo, D.; Wen, X.; Xu, J. (2022). All-Sky Soil Moisture Estimation over Agriculture Areas from the Full Polarimetric SAR GF-3 Data. Sustainability, 14, 10866. [CrossRef]
- Wang, B.; Qiu, W.; Hu, X.; Wang, W. A rolling bearing fault diagnosis technique based on Recurrence Quantification Analysis and Bayesian optimization SVM. Applied Soft Computing, 2024, 111506. [CrossRef]
- Srithai ,V. C.; Barroso .; P. Phunchongharn, Computing Resource Optimization for a Log Monitoring System, 2022 IEEE 5th International Conference on Knowledge Innovation and Invention (ICKII ), Hualien, Taiwan, 2022, pp. 99-102. [CrossRef]
- Aydi Ben Abdallah, R. , Jabnoun-Khiareddine, H., Ayed, F., & M. Daami-Remadi. A Three-Year Study of Comparative Effects of Four Organic Amendments on Soil Health Dynamics, Tomato Production, and Rhizosphere Microbial Community. Communications in Soil Science and Plant Analysis, 2023, 54, 2439–2458. [Google Scholar] [CrossRef]
- GP Shetty, A Meghana, Sangeetha CG, Niranjan HG, Mahesh G Shetty, M Narayanaswamy. Impact of multiplex yield enhancer on the growth, yield, disease, and insect incidence of tomato crop. Int J Adv Biochem Res 2024, 8, 49–57. [CrossRef]
- Hang, Zhang, Chen, Zhang, Wang, Classification of Plant Crop Diseases Based on Improved Convolutional Neural Network. Sensors, 2019, 19, 4161. [CrossRef]
- Gadade .; Kirange, Machine Learning Approach towards Tomato Leaf Disease Classification, IJATCSE, 2020, 9, 490–495. [CrossRef]
- K. Kapucuoglu.; M. Kirci, Tomato Leaf Disease Detection Using Hyperparameter Optimization in CNN, 2021, 13th International Conference on Electrical and Electronics Engineering (ELECO), (IEEE, Bursa, Turkey, 2021), pp. 373–377.
- Y. A. Reddy .; A. M. A Framework System for Plant Leaf Disease Detection using K-Nearest Neighbours and comparison of its features with Naive Bayes Classification. 2022, International Conference on Business Analytics for Technology and Security (ICBATS), Dubai, United Arab Emirates, 2022, pp. 1-4. [CrossRef]
- Nikith, B. V.; Keerthan, N. K. S.; Praneeth, M.S.; Amrita, D. T. (2023). Leaf Disease Detection and Classification. Procedia Computer Science, 218, 291–300. [CrossRef]
- Najim, Mohammed Hussein, Salwa Khalid Abdulateef, and Abbas Hanon Alasadi. Early Detection of Tomato Leaf Diseases Based on Deep Learning Techniques. IAES International Journal of Artificial Intelligence (IJ-AI) 2024, 13. [CrossRef]
- M. Chilakalapudi, S. Jayachandran, Multi-classification of disease induced in plant leaf using chronological Flamingo search optimization with transfer learning, Peer J Computer Science 2024, 10, e1972.
Figure 1.
depicts a map of India illustrating the location of Anakapalle. Natural Earth data, https://www.naturalearthdata.com, was utilized to generate this figure.
Figure 1.
depicts a map of India illustrating the location of Anakapalle. Natural Earth data, https://www.naturalearthdata.com, was utilized to generate this figure.
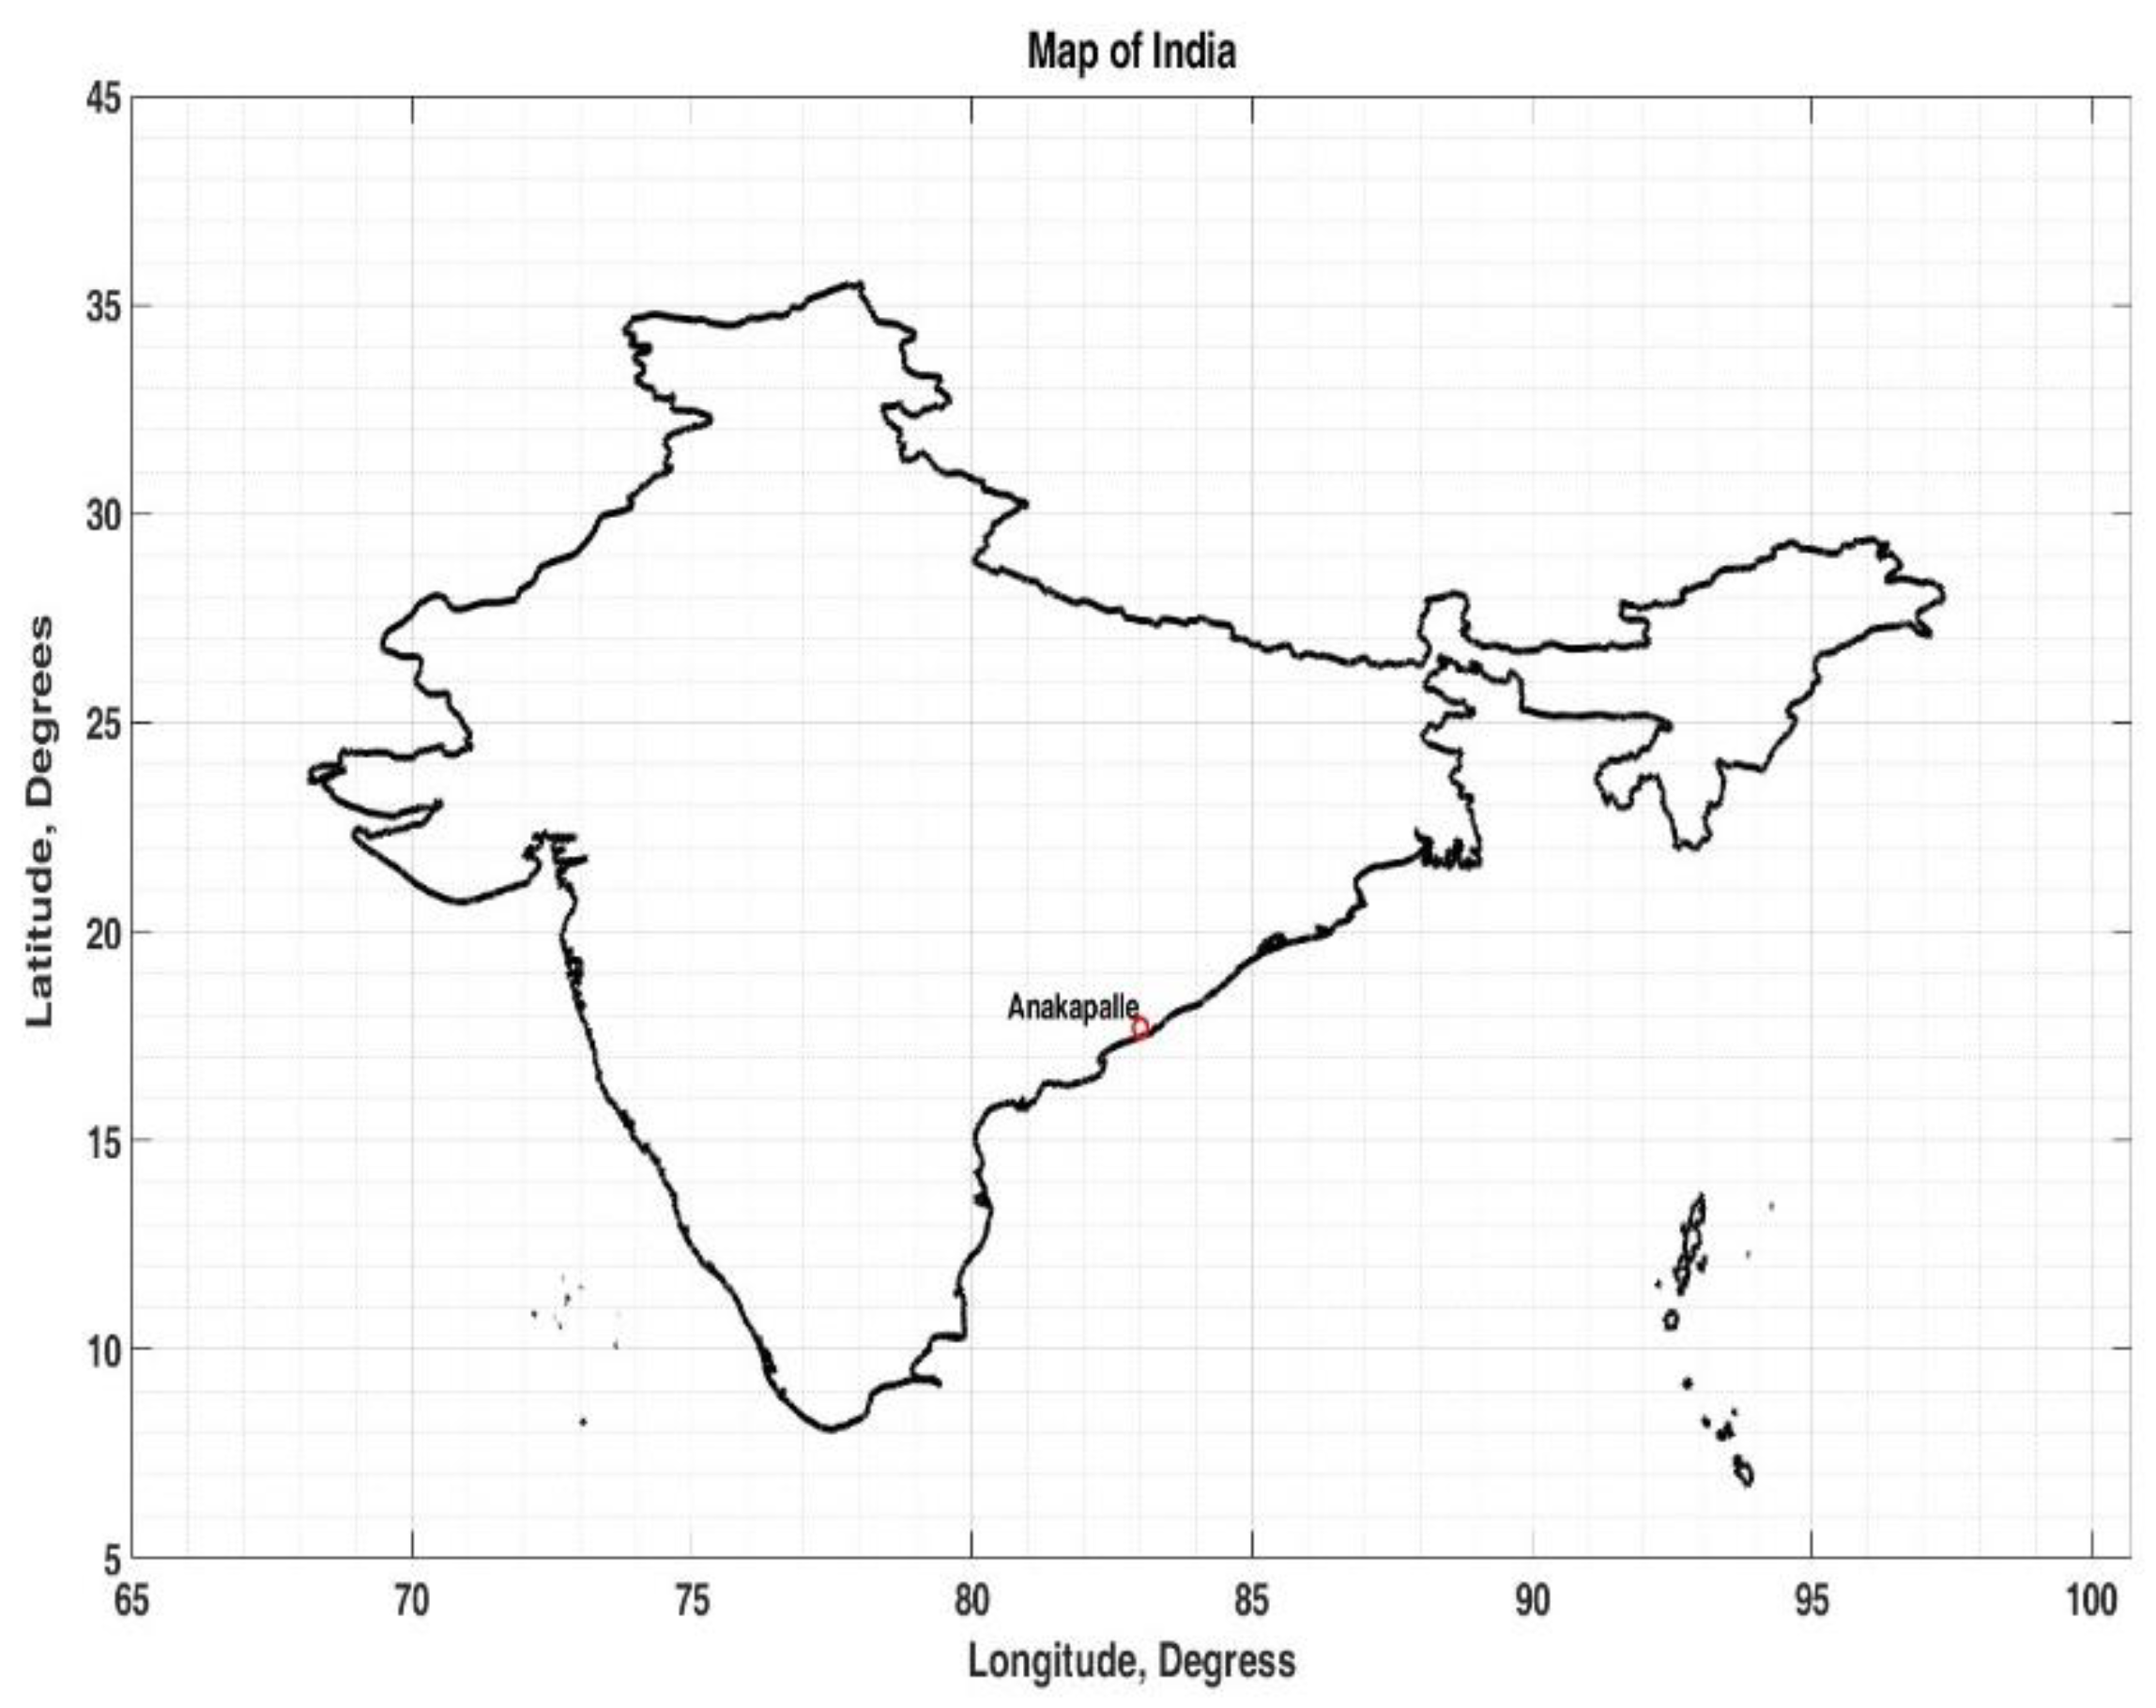
Figure 2.
Probability density functions (PDFs) of datasets we colleted as part of this research.
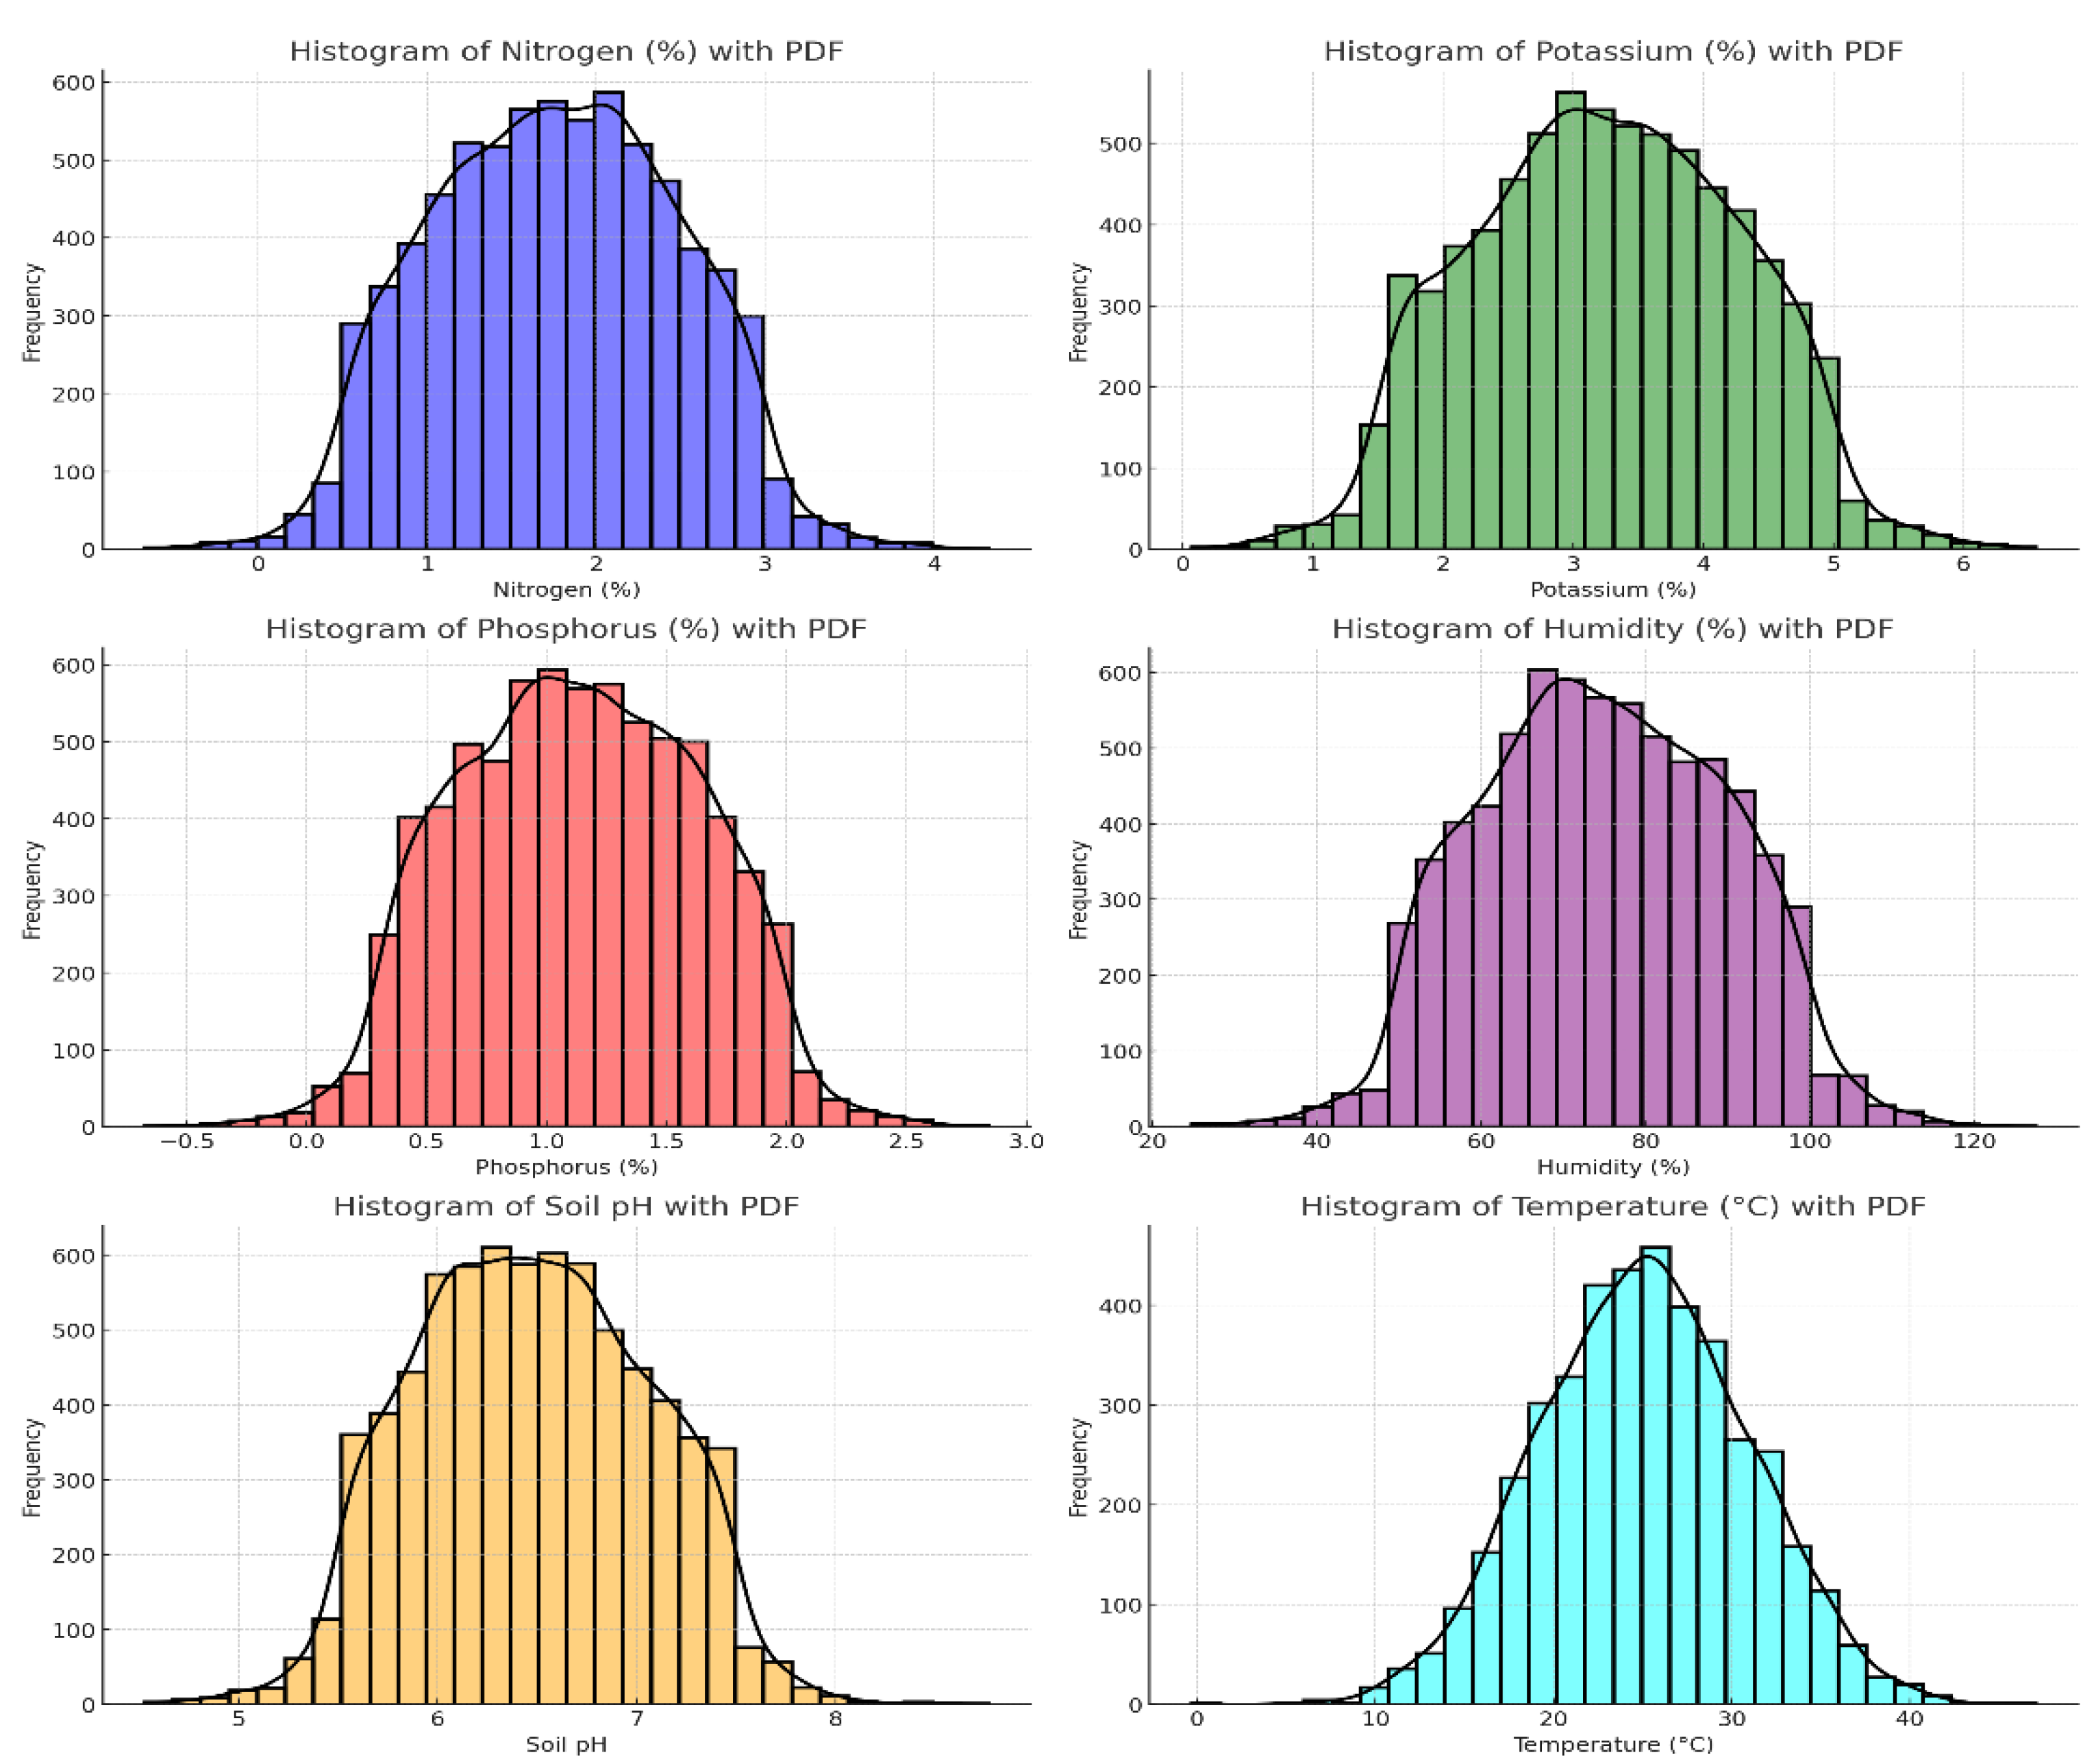
Figure 3.
Arduino microcontroller used in the present research.
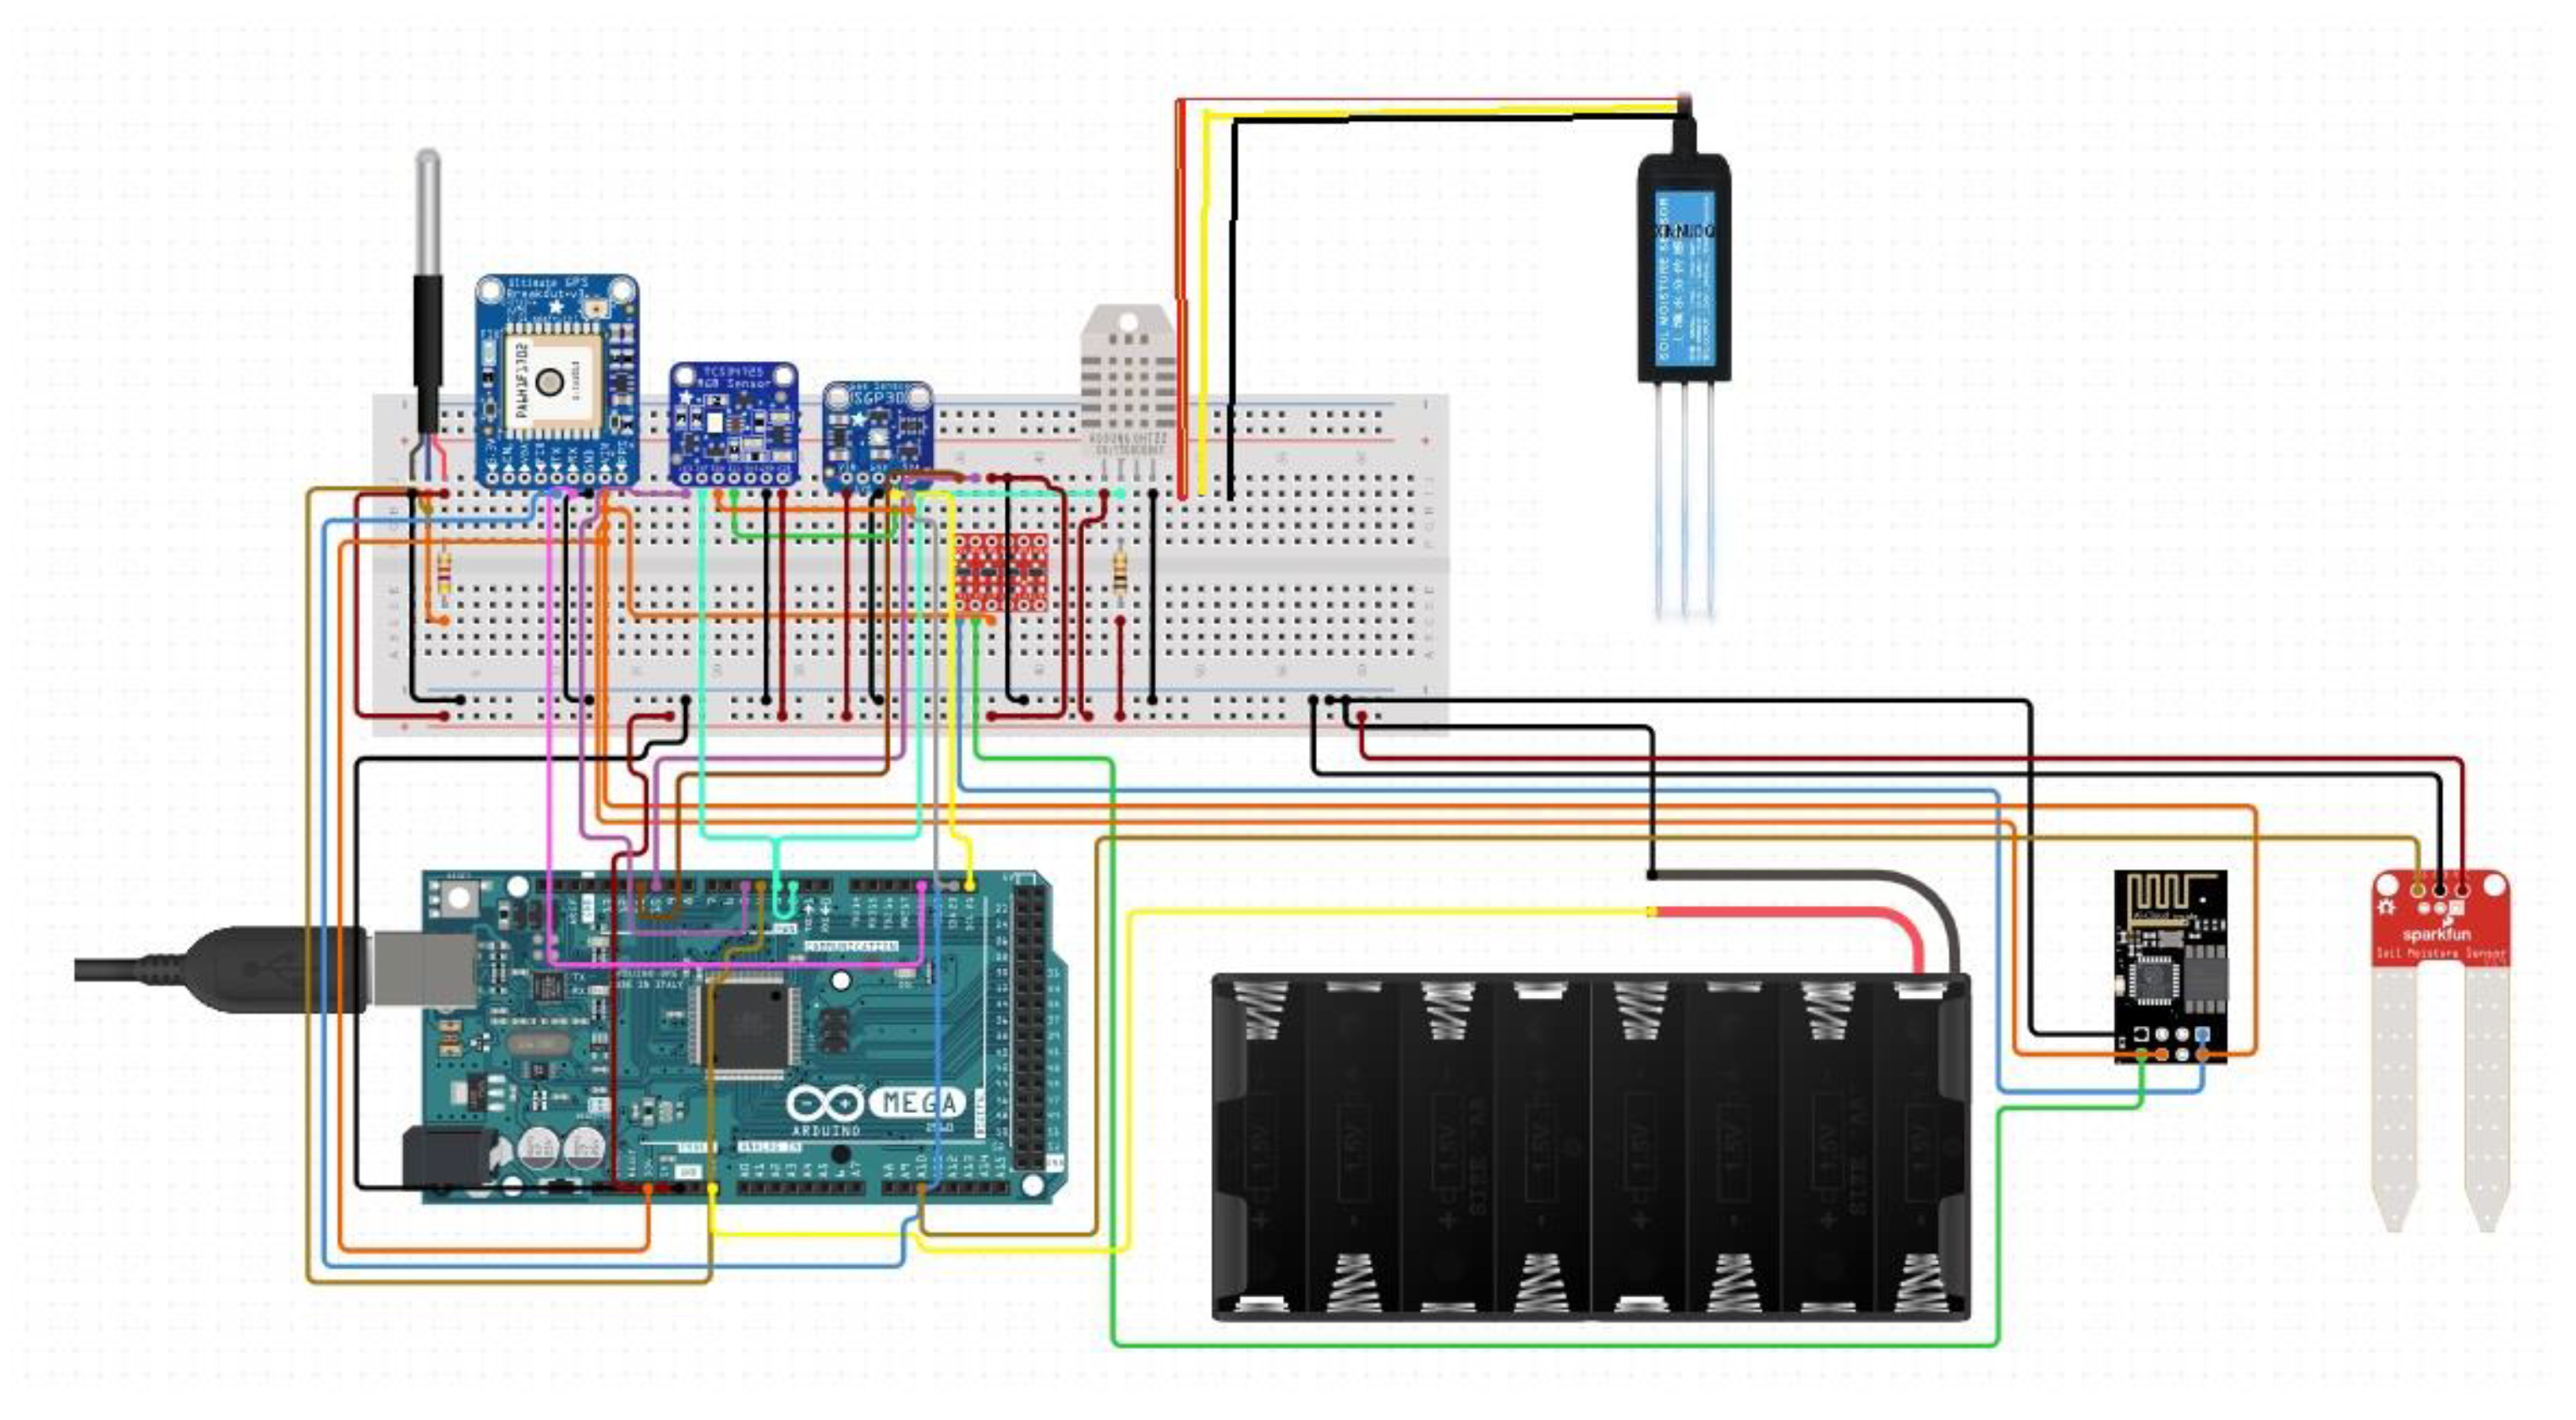
Figure 4.
Proposed framework of the present research study.
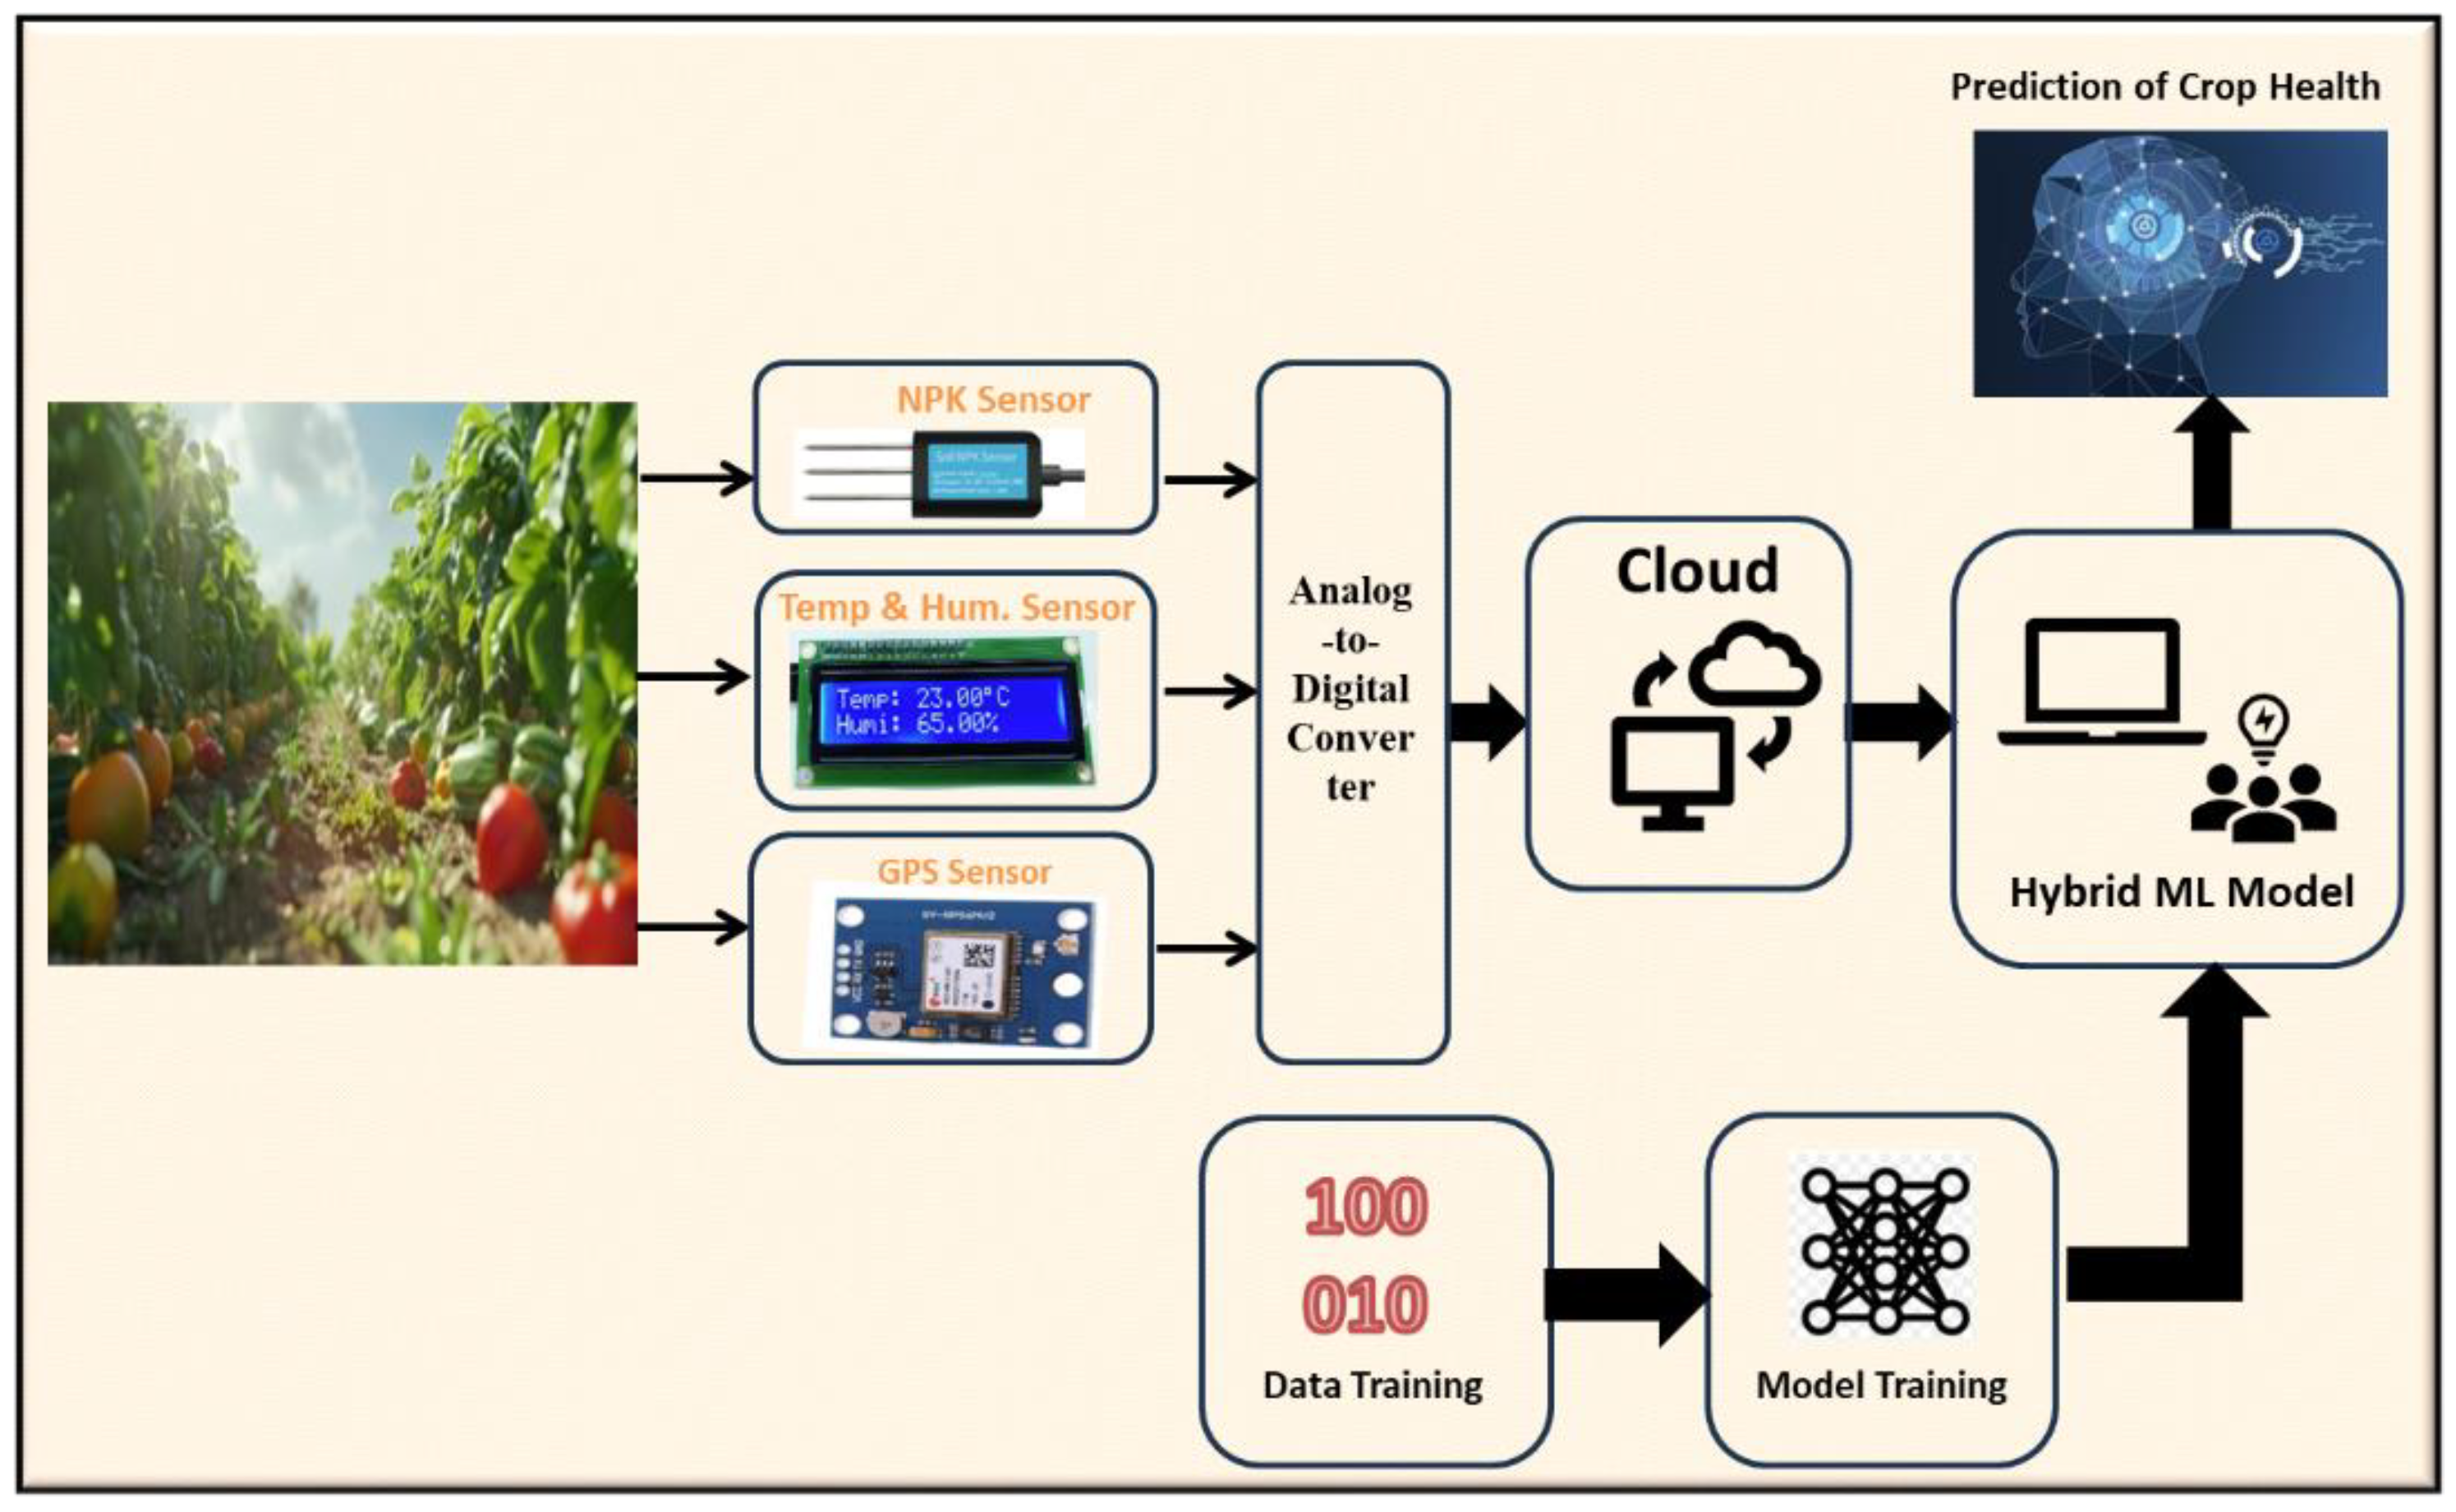
Figure 5.
ROC Curve.
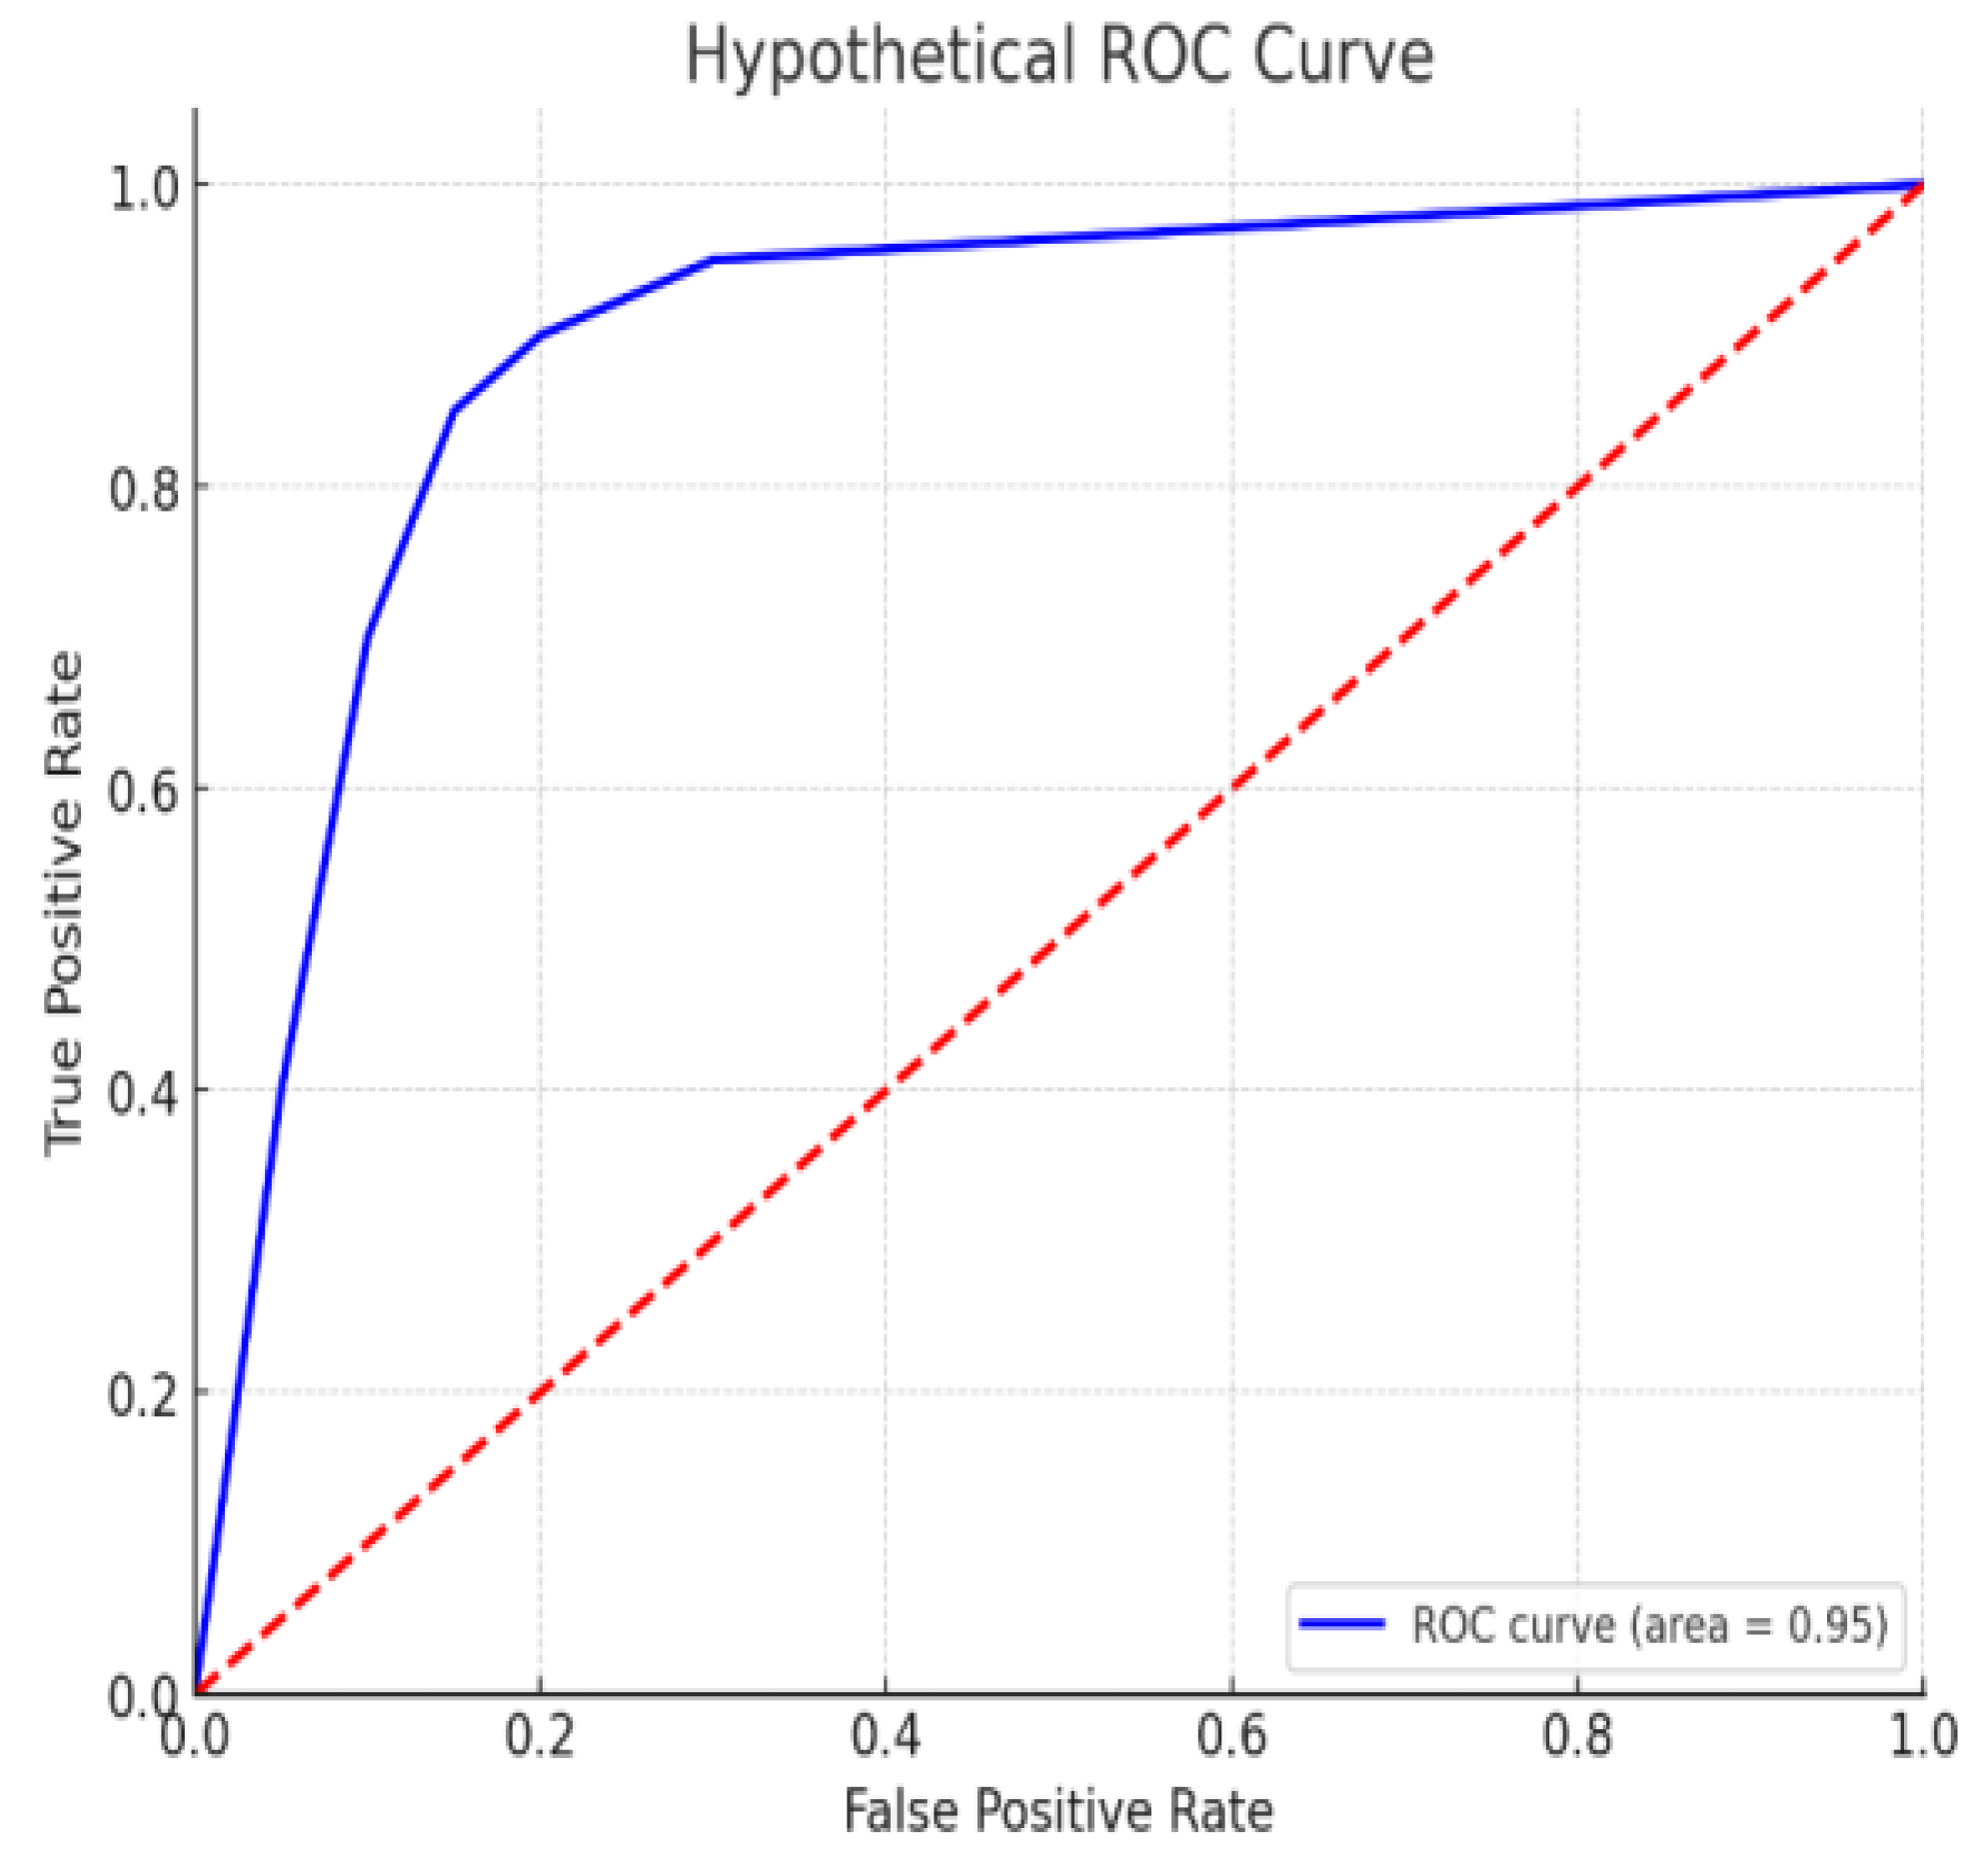
Figure 6.
Train and test line graph.
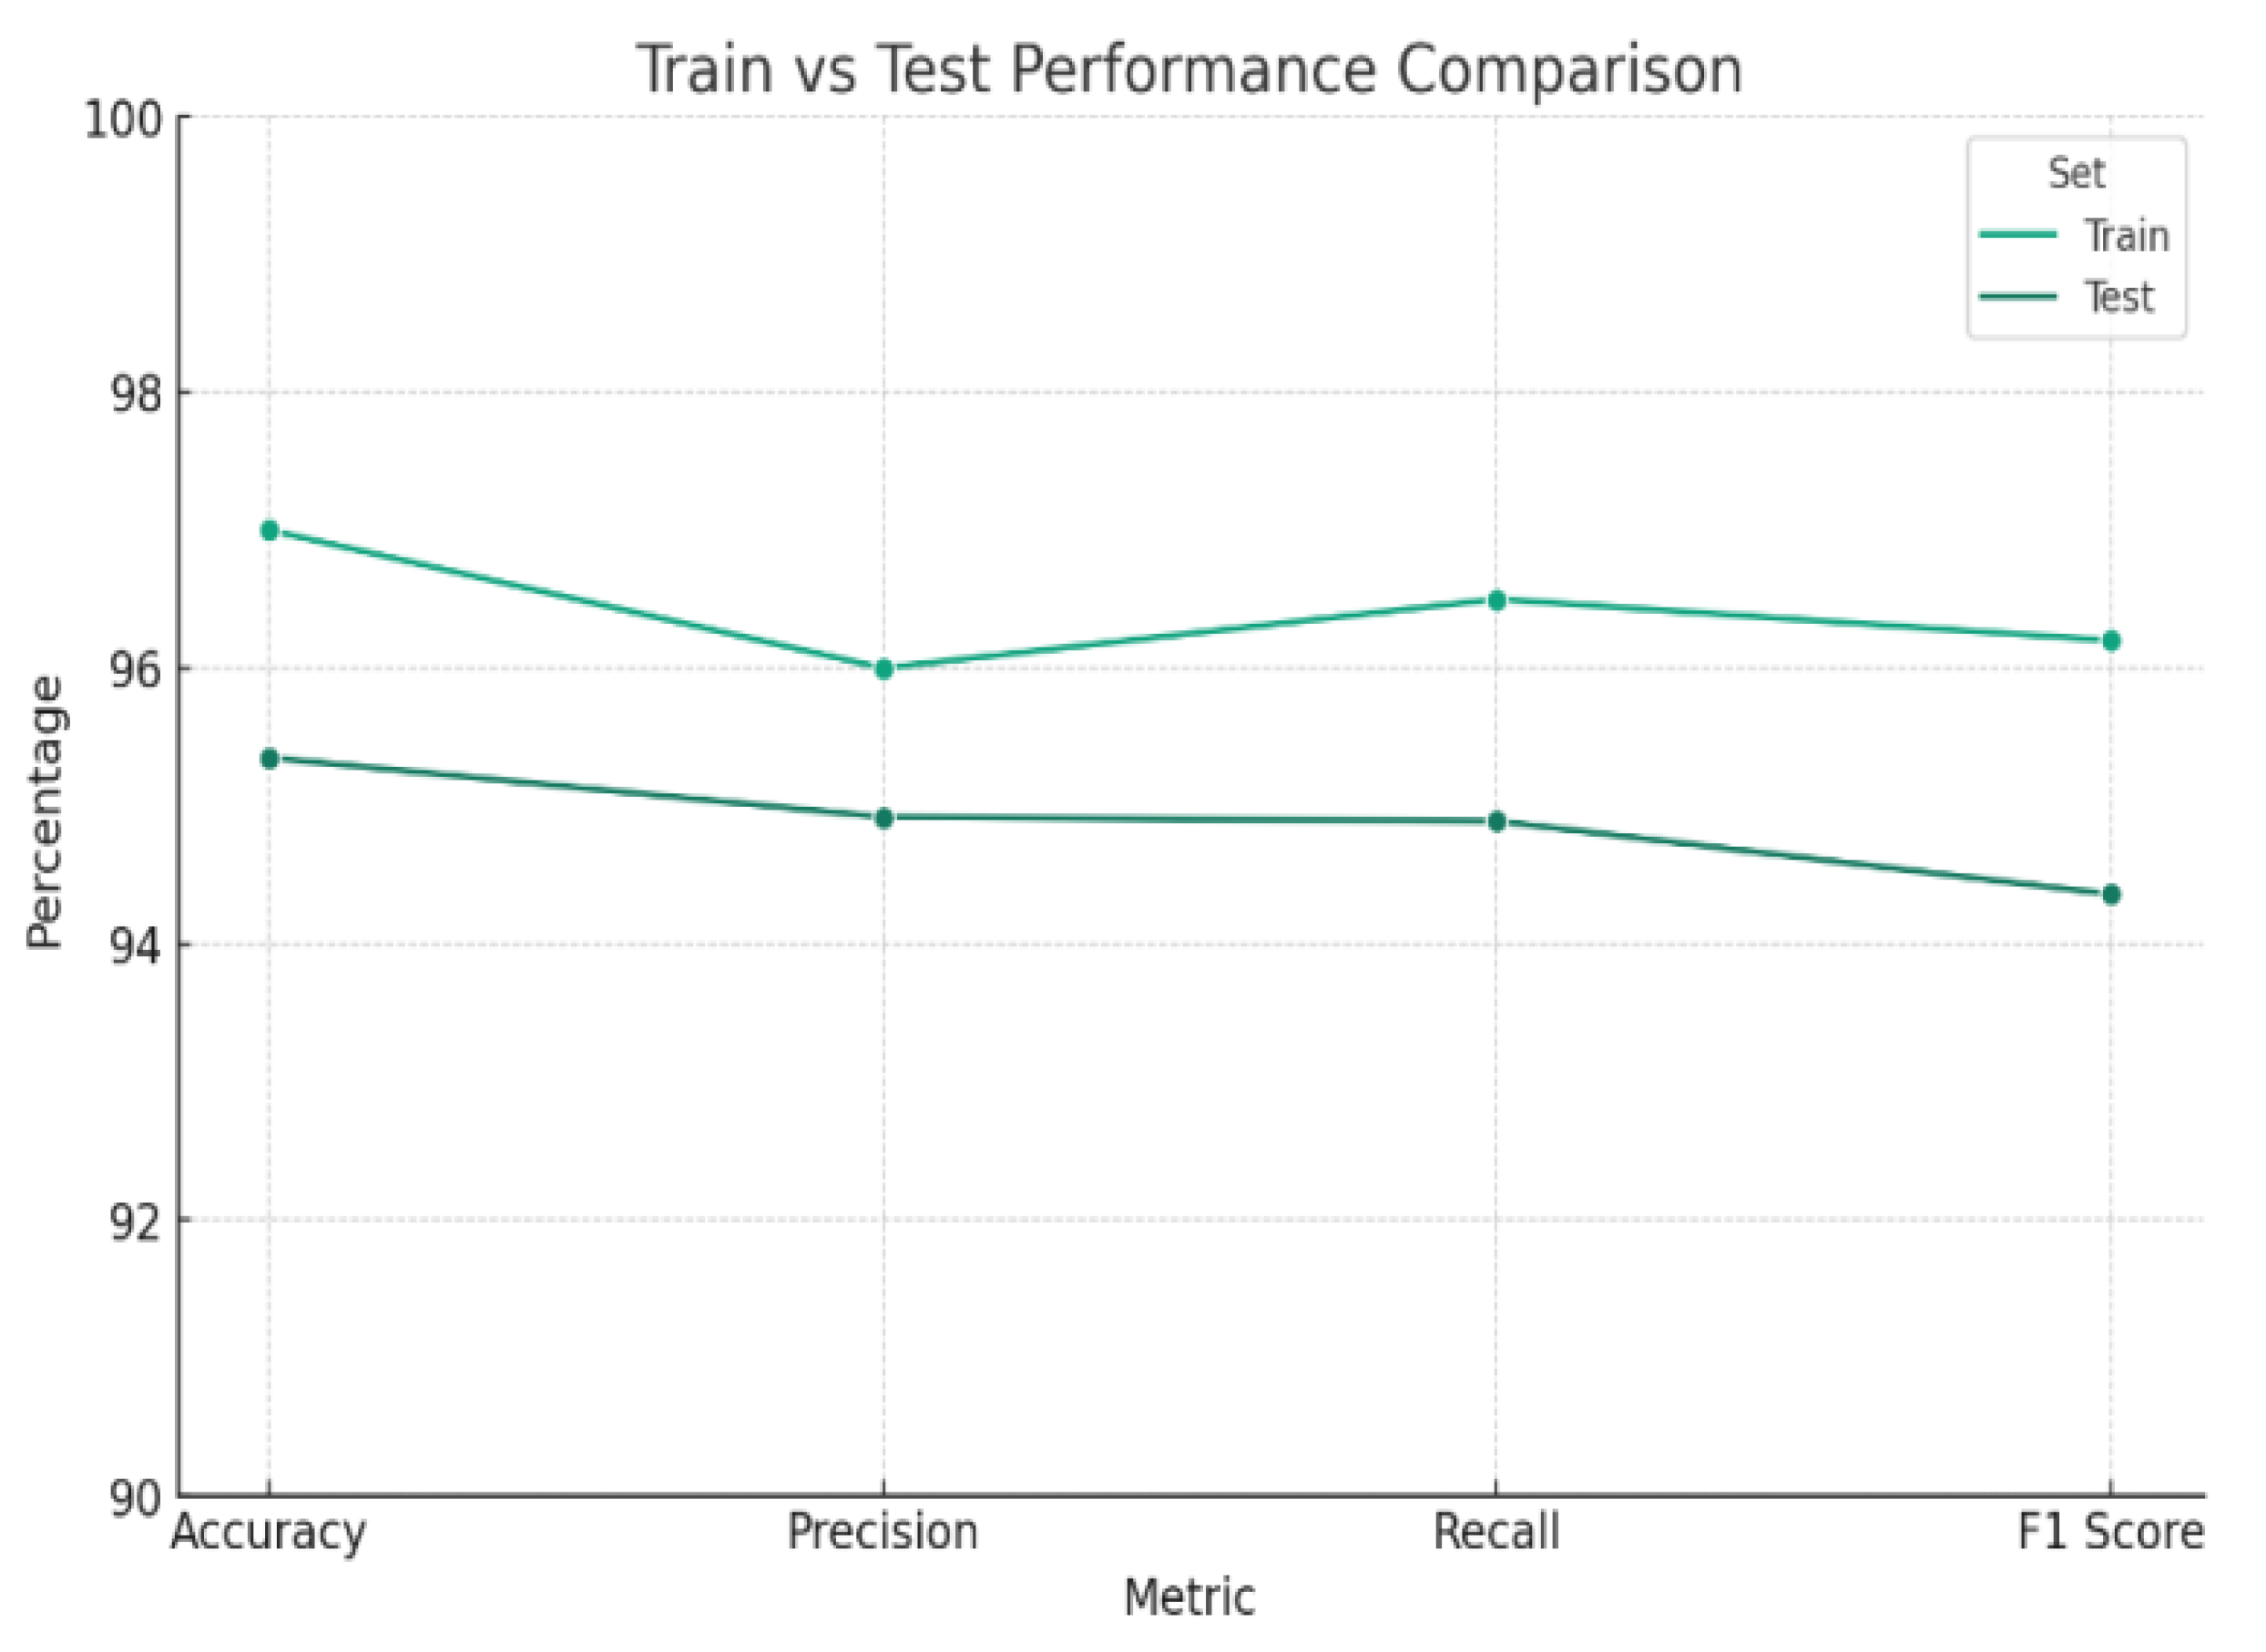
Figure 7.
Confusion Matrix.
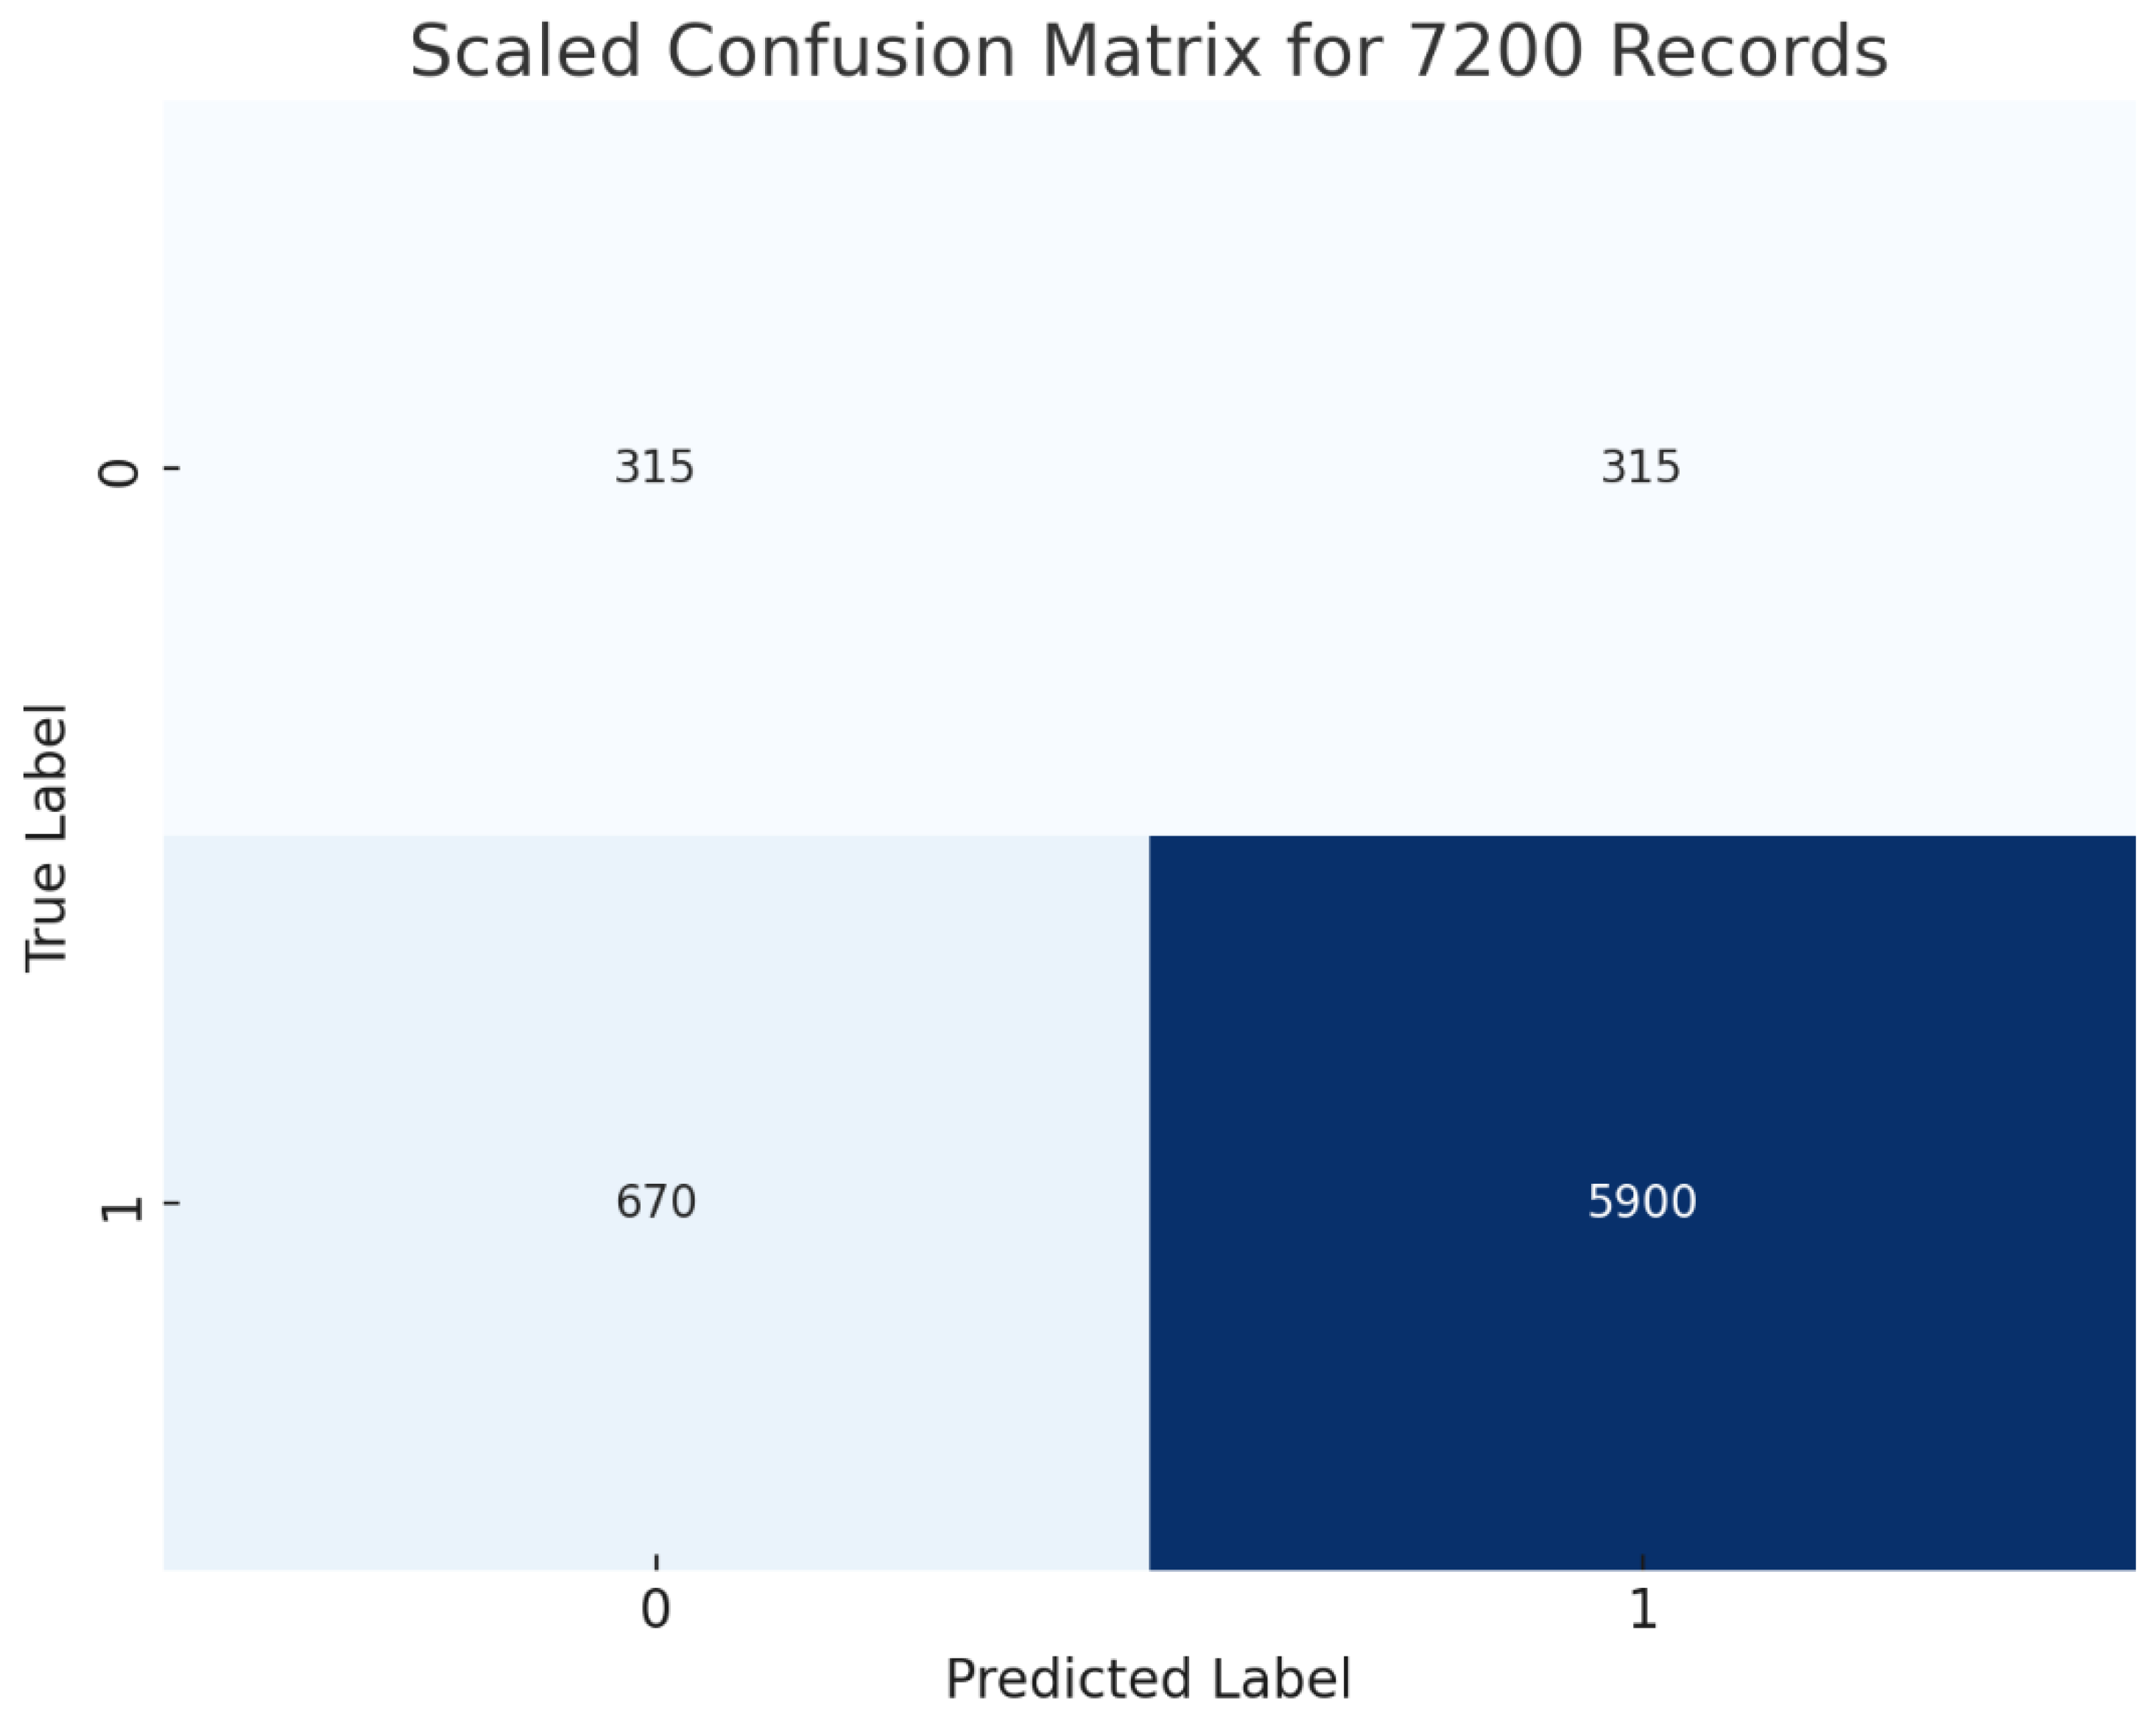
Figure 8.
Comparison of performance metrics between various ML algorithms.
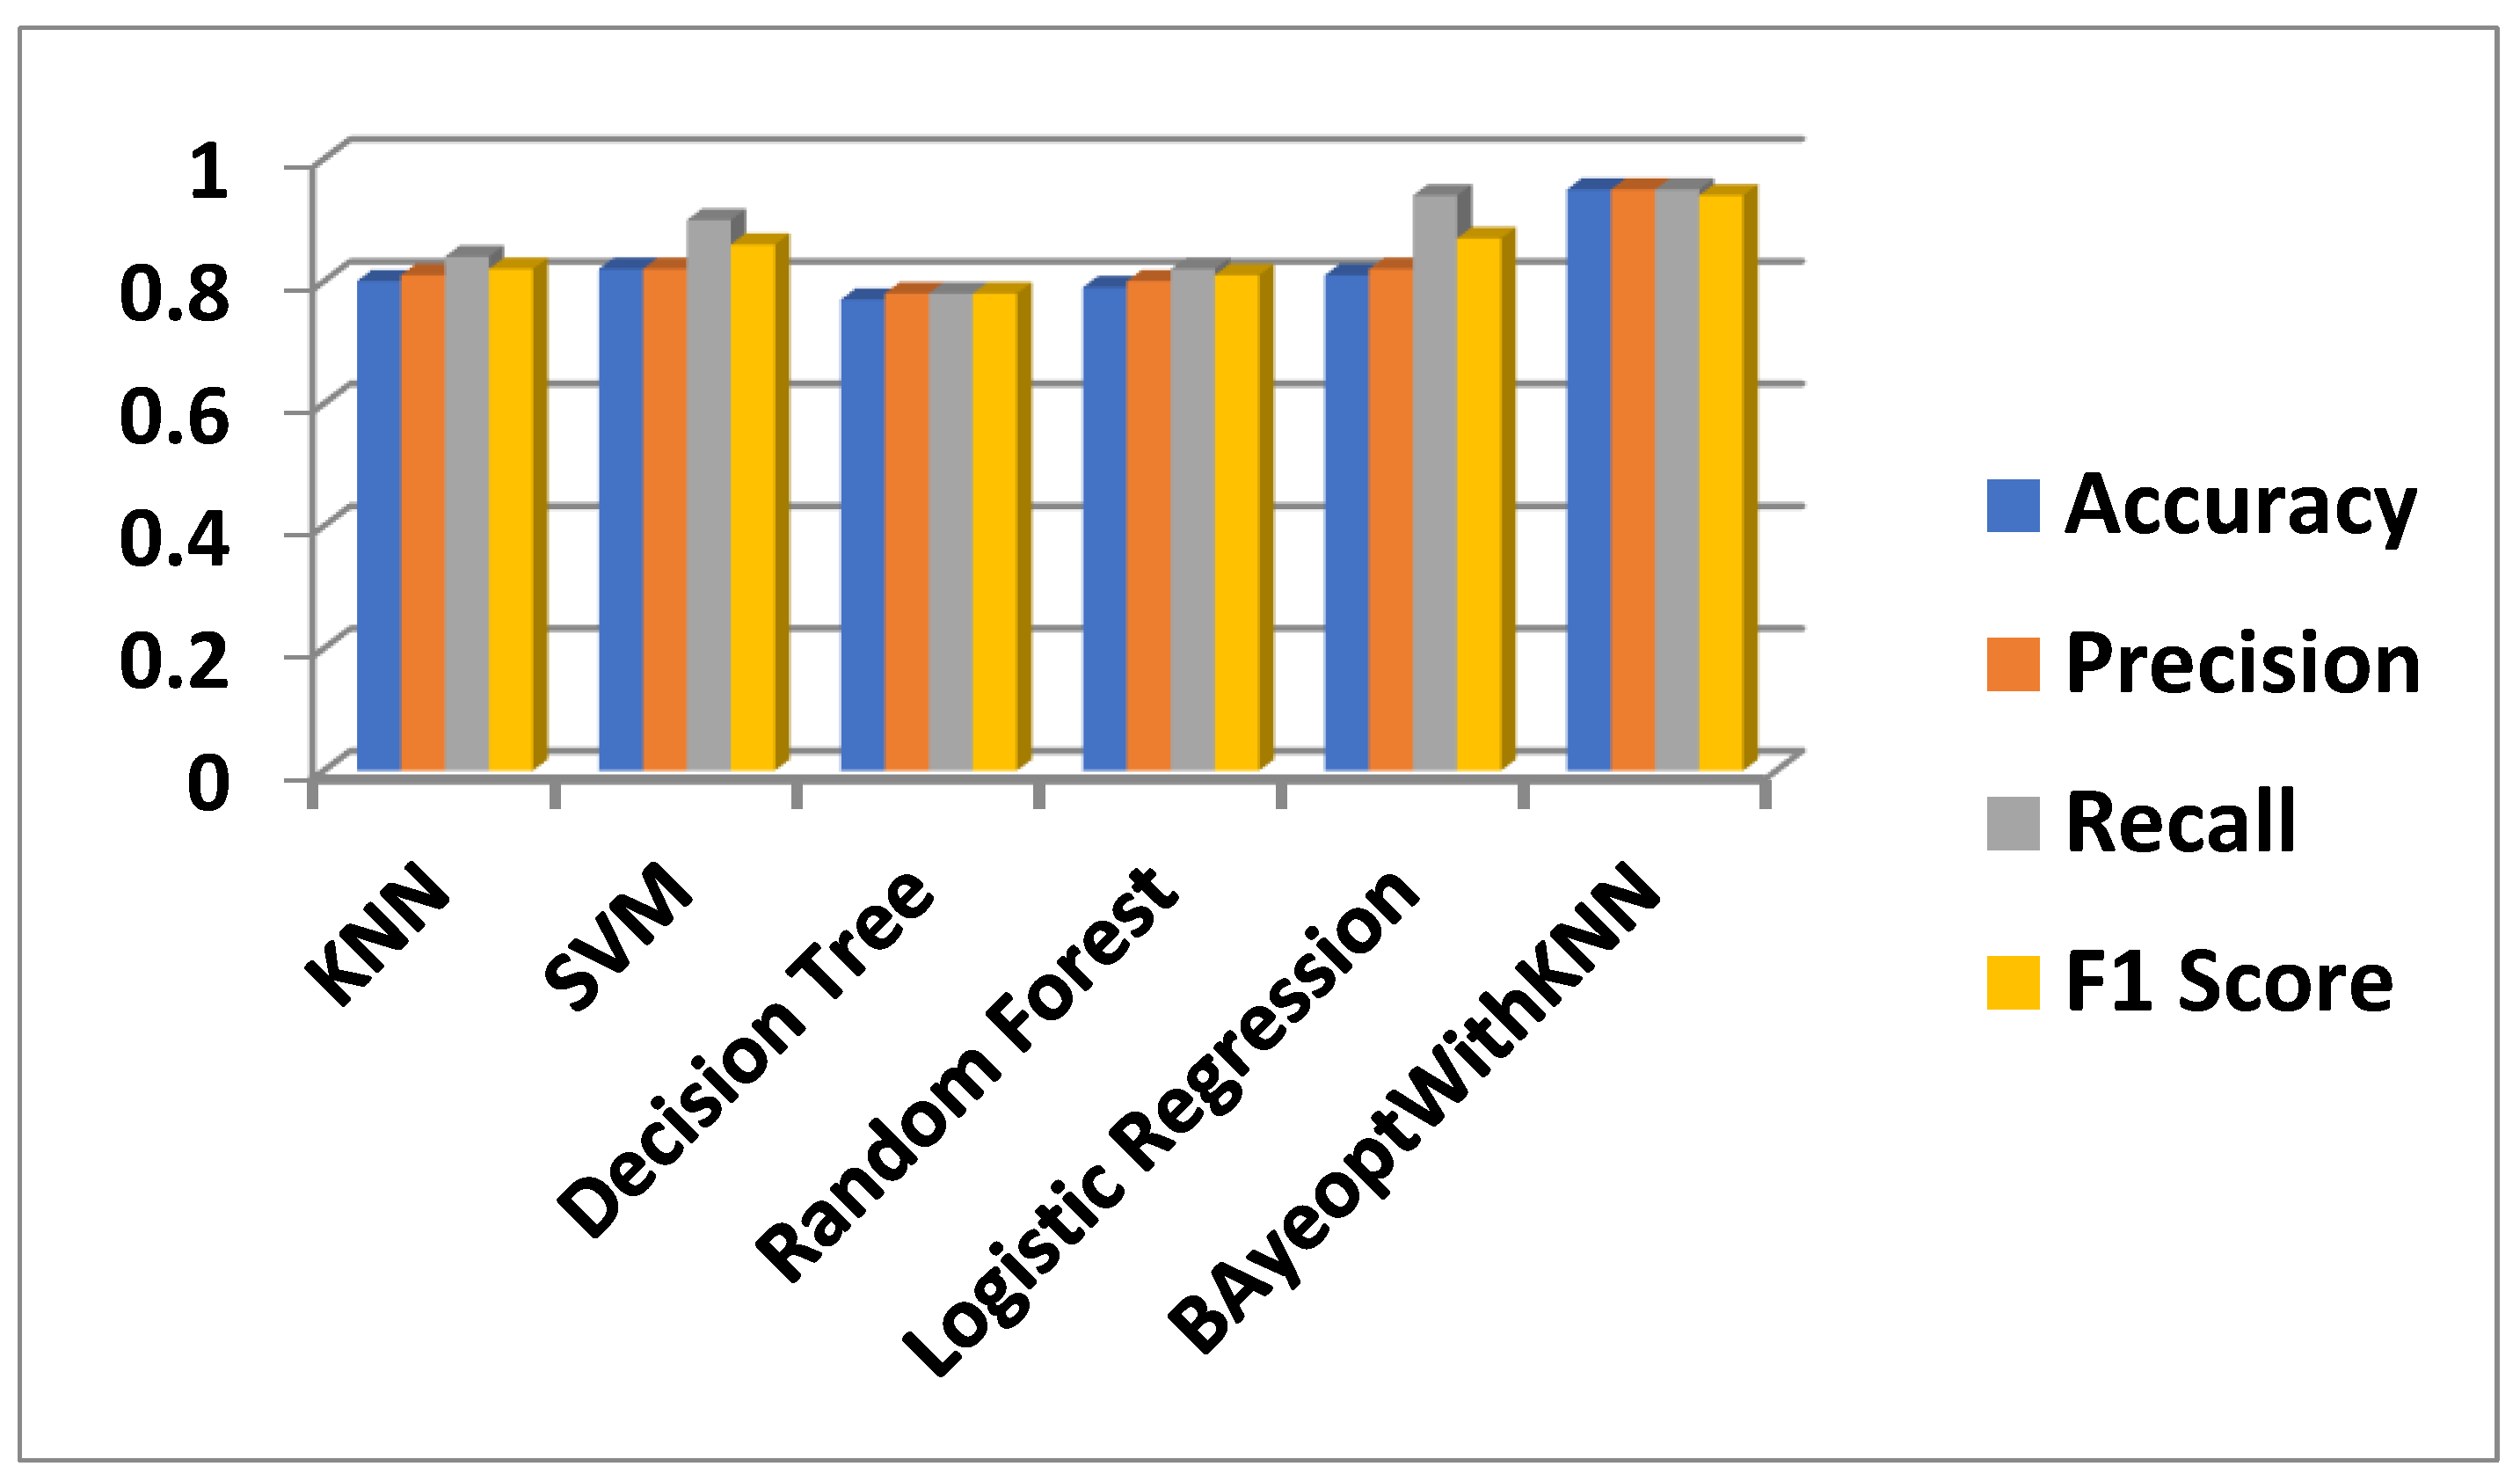

Table 1.
Tomato crop’s disease features [1].
Table 1.
Tomato crop’s disease features [1].
| Indicator/Symptom | Early blight | Late blight | Cercospora crop mold |
|---|---|---|---|
| Lesion shape | Circular | Irregular | Irregular |
| Lesion color | Brown | Grey | Pale green |
| Crop spotting | Common | Common | Rare |
| Lesion margin | Defined | Undefined | Undefined |
| Sporulation | Moderate | High | Low |
Table 2.
Threshold levels of and Correlation Table [10].
Table 2.
Threshold levels of and Correlation Table [10].
| Soil Parameter | Optimal Range/Threshold | Early blight | Late blight | Cercospora crop mold |
|---|---|---|---|---|
| pH Value | 6.0 - 7.0 | High Risk | Moderate Risk | Low Risk |
| Nitrogen (N) | Moderate | Moderate Risk | High Risk | Low Risk |
| Phosphorus (P) | Moderate | Low Risk | Moderate Risk | High Risk |
| Potassium (K) | Moderate | Low Risk | Low Risk | Moderate Risk |
| Soil Humidity | 60-80% | Moderate Risk | High Risk | High Risk |
| Water Level | Well-Drained | Low Risk | High Risk | Moderate Risk |
Table 3.
Various sensors used in this study & their operating ranges, data format, and threshold band.
Table 3.
Various sensors used in this study & their operating ranges, data format, and threshold band.
| Sensor Type | Current | Voltage | Data Format | Threshold Band |
|---|---|---|---|---|
| NPK Sensor | 10-20 mA | 3.3-5V | Analog | Low, Medium, and High nutrient levels |
| Temperature Sensor | 0.5-10 mA | 3-5V | Analog | Temperature range (e.g., -40°C to 125°C) |
| Humidity Sensor | 0.5-15 mA | 2.5-5V | Analog | Humidity range (e.g., 0-100% RH) |
| GPS Sensor (NEO-6m) | 20-100 mA | 3-5V | Digital (NMEA, etc.) | Geographical coordinates |
| Wi-Fi Sensor | 15-200 mA | 3.3-5V | Digital (TCP/IP, etc.) | Signal strength (dBm) |
| RGB Color Sensor | 10-30 mA | 2.7-5.5V | Digital (RGB values) | Color intensity range |
Table 5.
Data preparation stage.
| Timestamp | NPK Level | Temperature (°C) | Humidity (%) | pH Value |
|---|---|---|---|---|
| 27-11-2023 10:00 | 2 | 22 | 45 | 6.7 |
| 27-11-2023 10:01 | 1 | 23 | 47 | 5.6 |
| 27-11-2023 10:02 | 3 | 22 | 50 | 6.7 |
| 27-11-2023 10:03 | 2 | 21 | 48 | 6.8 |
| 27-11-2023 10:04 | 1 | 22 | 46 | 5.5 |
| 27-11-2023 10:05 | 3 | 23 | 49 | 4.4 |
| 27-11-2023 10:06 | 2 | 24 | 45 | 6.7 |
| 27-11-2023 10:07 | 1 | 21 | 47 | 6.6 |
| 27-11-2023 10:08 | 3 | 22 | 50 | 6.7 |
| 27-11-2023 10:09 | 2 | 23 | 48 | 6.6 |
Table 6.
The dataset classifies plant health using ambient and soil parameters and it also has a 'diseased' column.
Table 6.
The dataset classifies plant health using ambient and soil parameters and it also has a 'diseased' column.
| Timestamp | NPK Level | Temperature (°C) | Humidity (%) | pH Value | Diseased |
| 27-11-2023 10:00 | 2 | 22 | 45 | 6.7 | 1 |
| 27-11-2023 10:01 | 1 | 23 | 47 | 5.6 | 0 |
| 27-11-2023 10:02 | 3 | 22 | 50 | 6.7 | 0 |
| 27-11-2023 10:03 | 2 | 21 | 48 | 6.8 | 0 |
| 27-11-2023 10:04 | 1 | 22 | 46 | 5.5 | 0 |
| 27-11-2023 10:05 | 3 | 23 | 49 | 4.4 | 0 |
| 27-11-2023 10:06 | 2 | 24 | 45 | 6.7 | 1 |
| 27-11-2023 10:07 | 1 | 21 | 47 | 6.6 | 0 |
| 27-11-2023 10:08 | 3 | 22 | 50 | 6.7 | 0 |
| 27-11-2023 10:09 | 2 | 23 | 48 | 6.6 | 0 |
Table 7.
Performance metrics obtained using the hybrid ML.
| Accuracy | 95.35% |
| Precision | 94.92% |
| Recall | 94.89% |
| F1 Score | 94.36% |
Table 8.
A tabular summary of earlier ML models along with the present research results.
| S. No | Reference | Classification method | Database | ML-IoT Enabled | Main findings | Limitations | Accuracy Measure |
|---|---|---|---|---|---|---|---|
| 1. | Hang et al. [2019] [35] | Improved CNN | Plant crop diseases Library | No | Yielded better performance | Lack of real-world testing | 91.7 % |
| 2. | Gadade & Kirange [2020] [36] | DT, SVM, KNN with Gabor feature, NB |
Plant Village Datasets | No | KNN classification performed better than SVM | The study does not consider the impact of varying environmental conditions, a major let down. | 67% 73% 73% 67% |
| 3. | Kapucuoglu and Kirci [2021] [37] | CNN with hyperparameter optimisation | New Plant Diseases Dataset- Kaggle | No | Accuracy increased from 92% to 98 % once a proper hyperparameter tuning is done | Only accuracy test was performed | 98% |
| 4. | Reddy and Adimulam [2022] [38] | KNN & Naïve Bayes (NB) | Plant Village Dataset | No | NB’s accuracy was more than KNN | The comparative analysis is limited to KNN and NB and only reported accuracy as the evaluation metric. | 91 % |
| 5. | Nikhith et al. [2023] [39] | SVM, KNN, CNN | Net-based Images | No | CNN achieved 96% | Limited evolutions | Accuracy- 96 % |
| 6. | Najim [2024] [40] | CNN-based model | Plant Village Dataset | No | The present model outperforms traditional CNN models in terms of speed and storage | Model is not scalable | Accuracy- 92 % |
| 7. | Chilakalapudi & Sheela [2024] [41] | CFSA-TL-based CNN | Plant Village Dataset | No | Identified and classified the disease in its early. stage | Over dependency on high-quality images that may be challenging due to varying environmental conditions | Accuracy- 95.7 % |
| 8. | The present study | Bayesian optimization with KNN | Real-time and high-resolution data | Yes | Bayesian Optimisation with KNN | Lack of diversified databases to use in the present study. | Accuracy-95% Precision-95% Recall- 95% F1Score- 94% |
Disclaimer/Publisher’s Note: The statements, opinions and data contained in all publications are solely those of the individual author(s) and contributor(s) and not of MDPI and/or the editor(s). MDPI and/or the editor(s) disclaim responsibility for any injury to people or property resulting from any ideas, methods, instructions or products referred to in the content. |
© 2024 by the authors. Licensee MDPI, Basel, Switzerland. This article is an open access article distributed under the terms and conditions of the Creative Commons Attribution (CC BY) license (http://creativecommons.org/licenses/by/4.0/).
Copyright: This open access article is published under a Creative Commons CC BY 4.0 license, which permit the free download, distribution, and reuse, provided that the author and preprint are cited in any reuse.


