
Submitted:
23 September 2025
Posted:
24 September 2025
You are already at the latest version
Abstract
Photoacoustic tomography is an innovative non-ionizing imaging technique that combines optical contrast with ultrasound resolution for 3D object characterization. While promising, its broader adoption is limited by challenges such as shallow penetration depth and strong optical scattering. To address these issues, this study introduces a dual illumination and detecting photoacoustic tomography method, specifically designed for symmetrical objects like hollow metallic cylinders. The illumination system plays a critical role in determining the quality of photoacoustic signals and, thus, the final image. This approach enhances spatial resolution and contrast by using complementary light delivery and signal detection. In industrial settings, where accurate and efficient non-destructive testing is essential, traditional techniques often lack the precision required. The dual illumination and detecting strategy offer significant improvements in resolution, contrast, defect detection, and artifact reduction, surpassing the limitations of unidirectional approaches. This technique not only strengthens the characterization of metal structures but also contributes to a deeper understanding of their physical behavior. Applications extend across various fields, including aerospace and biomedical engineering. This paper explores the underlying principles and potential of this advanced imaging modality, highlighting its value in modern diagnostic and inspection technologies.
Keywords:
photoacoustic tomography
; 2D imaging
; dual detecting
; dual illumination
; signal processing
; hollow
; metal cylinder
; non-destructive testing
; acoustic impedance contrast
1. Introduction
Photoacoustic (PA) tomography is an imaging technique that combines optical and ultrasound information, a hybrid imaging modality that continues to evolve, especially for applications of medicine and biology [1]. The integration of high-resolution optical imaging with the depth penetration of ultrasound represents a major advancement in biomedical imaging. Although Rosencwaig reported the first application of PA imaging in solids in 1973 [2,3], subsequent advances in laser technology and instrumentation have established PA imaging as a powerful tool for diagnosis, monitoring, and therapeutic guidance in medicine [4,5], as well as for industrial non-destructive testing [6,7,8].
The technique relies on the PA effect, wherein material absorbs pulsed or modulated light and subsequently emits ultrasound waves, thereby enabling the visualization of its structural and functional characteristics. Efficient PA absorbers convert absorbed light into acoustic waves, and wavelength-dependent absorption properties and the efficiency of light energy deposition determine their performance. The nonradiative decay processes and the mechanism of nonradiative energy transfer that play an important role in the generation of PA signals from solids are discussed in [9]. Quantitative PA imaging techniques aim to extract quantitative information from PA signals to provide precise measurements of various tissue properties. This approach enhances the diagnostic capabilities of PA imaging beyond mere qualitative assessments. A critical component is the illumination of the experimental PA system, as it directly determines the generation of PA signals and influences image quality. Common techniques employ multispectral imaging and structured illumination strategies [10,11]. Those approaches offer microscale resolution and a wide range of contributions but are still limited in the penetration depth [1]. However, challenges such as object geometry, light fluence attenuation, acoustic heterogeneity, and ill-posed inverse problems on image reconstruction necessitate advanced techniques and regularization strategies to improve the image quality, i.e., accuracy and stability. To address this problem, many regularization techniques have been developed [12]. Other studies [13] use contrast agents to improve the image quality.
Despite significant progress in PA tomography for biomedical and industrial applications, substantial challenges persist, particularly in achieving high-resolution imaging of deep internal structures. These limitations are primarily due to the shallow light penetration, optical scattering, and restricted angular coverage inherent in systems that employ unidirectional illumination and detection.
In industrial manufacturing, where ensuring product integrity is critical, non-destructive testing (NDT) is essential for identifying defects, discontinuities, or material degradation without compromising the component’s usability or structure [4,14,15]. However, commonly used unidirectional NDT techniques—such as contact ultrasound (pulse-echo), direct transmission ultrasound, and laser-induced ultrasound—often suffer from limited contrast, structural artifacts, and incomplete internal visualization [16,17,18]. These shortcomings hinder the accurate detection of subsurface flaws, internal cavities, and weak joints.
Furthermore, many current experimental setups rely on contact-based measurements, which can be inadequate in scenarios where preserving structural integrity or avoiding environmental contamination is crucial. These constraints highlight the need for advanced imaging strategies that can deliver high-quality results while minimizing physical interaction.
To overcome these limitations, dual-illumination and dual-detection PA tomography represent a promising alternative [19,20]. By exploiting the axial symmetry of immersed objects and acquiring signals from opposing directions, dual-illumination and detection enhance angular coverage, improve the signal-to-noise ratio, and reduce spatial ambiguities. This approach enables more accurate and robust reconstruction of internal features, effectively addressing many of the deficiencies associated with traditional unidirectional methods.
The present work explores how dual illumination and detection of the object of interest can overcome some depth limitations of PA tomography and offers a special emphasis on industrial applications. The PA effect is observed in solids with a simple geometry [2]. In the realm of dual illumination PA tomography, inspired by the progress of Fukutani et al. [11], the mechanisms underpinning signal enhancement are integral to optimizing imaging performance, particularly when applied to metal cylinders. The regularization problem is attained by improving the illumination and extending the amount of data with respect to noise. By exploiting the PA effect, which generates ultrasonic waves after energy absorption, research can significantly improve an image’s spatial resolution and contrast in general.
In PA tomography, image reconstruction plays a crucial role in transforming time-resolved pressure signals into spatially resolved images. Reconstruction algorithms can be broadly categorized into analytical, geometric, and model-based approaches. Among them, geometric algorithms stand out for their simplicity, computational efficiency, and ease of implementation, especially when the speed of sound is assumed to be homogeneous. Commonly used geometric methods include back projection (BP), filtered back projection (FBP), time reversal (TR), and Delay-And-Sum (DAS). These algorithms estimate the location of the initial pressure sources by summing time-shifted signals based on the calculated time-of-flight between each detector and image pixel. In this study, we employed the DAS algorithm due to its widespread use in circular acquisition geometries and its proven ability to reconstruct high-contrast features with relatively low computational cost [21].
2. Materials and Methods
2.1. Physical Transport Considerations
The initial pressure measured in Pascals (1 Pa = 1 N/m2) generated by a PA wave is expressed as
where is the temperature-dependent Grüneisen parameter, the absorption coefficient, and F(J/cm2) the optical fluence [22,23]. The Grüneisen parameter contains, in turn, the thermoelastic parameters, as Γ=βKTV/CV; with as the thermal expansivity, KT as the bulk modulus, and CV as the specific heat, with respect to constant temperature and volume [24]. All of these parameters are directly proportional to PA amplitude. The PA effect relies on the photothermal effect to produce sound, although not all photothermal processes necessarily lead to PA signals.
The theory of Rosencwaig and Gersho in 1975 predicts the dependence of the PA signal of a solid on the optical absorption coefficient of the solid for the wavelength [2]. The main source of the acoustic signal of a solid arises from the heat flow. The thermal diffusion equation in the solid can be written in terms of the temperature
where κ = k /ρCV is the thermal diffusivity of the material with thermal conductivity and density ; A = αI0/2k with the incident monochromatic light flux I0, assuming full efficiency of the light to heat conversion.
The incremental pressure of a metal piece under chopped light is
where p0, V0 are the pressure and the volume of the metal piece at ambient temperature, and is the ratio of specific heats; is proportional to the envelope of the sinusoidal pressure variation . For optically opaque solids, as is the case for metals of thickness with optical absorption length , that are thermally thick, i.e., with a thermal diffusion length ,
Furthermore, Gutierrez-Reyes et al. confirm that for an aluminum slab of width , under thermal confinement, the time derivative of the temperature field is the source of the acoustic field within the solid [25] or within a layered medium [26]. Moreover, they express the relationship between thermal diffusivity and viscous and elastic properties of the sample, which we will not detail in the present scope.
2.2. Material Characterization
The object of interest is a series of five metallic cylinders (aluminum, brass, bronze, copper, and stainless steel), all with an inner diameter din and an outer diameter dout, as shown in Figure 1. The density, sound velocity, and acoustic impedance are shown in Table 1. In PA as well as ultrasound imaging, we are concerned about the difference in between two adjacent materials: a small difference implies greater energy transmission, whereas a mismatch induces energy reflection, which typically results in more image artifacts and noise.
The metal sound velocity was obtained experimentally from the arrival time of the PA signal from each of the cylinders, placed in direct contact on the cylinder’s flat, round face with the sensor, and without the beam path passing through the cylinder gap. The arrival time is obtained directly from the signal recorded by the oscilloscope, using the expression of the sound velocity vs = h/ta, with respect to the cylinder’s height .
2.3. Experimental Setup
The photoacoustic experimental setup consisted of: (1) two Quantel Brilliant b pulsed Nd:YAG lasers operating at the second harmonic (532 nm), with a pulse width of 5 ns and a repetition rate of 10 Hz; (2) a Tektronix DPO5204B digital oscilloscope with 2 GHz bandwidth and a 10 GS/s sampling rate; (3) two Olympus A326S-SU immersion transducers with a central frequency of 5 MHz, a bandwidth of 2.57 MHz, and an element diameter of 9.52 mm; (4) a laptop for data acquisition and processing; (5) a set of metallic cylinders with a central hole, used in computed tomography; and (6) a Thorlabs PDA10A amplified silicon detector.
The sample was mounted on a rotating stage inside an acrylic water tank. Sequential illumination was performed on two diametrically opposite sides of the cylinder (N-S), while acoustic detection was carried out in a forward configuration on the same plane, as illustrated in Figure 2. The cylinder was then rotated by 90°, and the procedure was repeated for the other two sides (E-W). Thus, four sequential measurements were obtained for each sample, corresponding to the cardinal positions where the laser beam impinged. The total acquisition time for each experiment was approximately 10 seconds.
2.4. PATLAB Simulation
The PA simulation setup offers the important benefit of validating adequate signal processing and noise reduction with respect to the forward problem, as well as the choice of the reconstruction algorithm that solves the inverse problem of tomography.
PATLAB [27] is a specialized software toolbox in MATLAB for PA tomography simulation and reconstruction, offering a comprehensive interface for 2D and 3D reconstruction, including the k-Wave toolbox for the acoustic wave transport model. It allows the software user to facilitate and evaluate the effectiveness of the advanced acquisition techniques as proposed in this study. PATLAB consists of four modules: 1) loading/simulating inputs, 2) pre-processing, 3) image reconstruction, and 4) display & save.
The PA simulation images were reconstructed using the Delay-and-Sum (DAS) method [28], one of the most widely adopted beamforming algorithms in ultrasound imaging. Due to its computational simplicity and ease of implementation, DAS has also been commonly applied in photoacoustic tomography (PAT) [29]. The algorithm calculates the sum of the time points associated with each corresponding grid point, assuming that the detectors have omnidirectional sensitivity and that the signal acquisition is an integration over circular curves for 2D images [27]. Although the method is fast and straightforward, it is inherently an intuitive and empirically driven approach that provides only an approximate reconstruction of the underlying structures [30]. Consequently, its performance is often limited in terms of resolution and artifact suppression when compared to more advanced model-based or iterative reconstruction techniques [31].
To simulate PA signals and reconstruct 2D images of a metal cylinder with a central cavity, we used PATLAB [27], a MATLAB-based graphical interface designed for PA tomography. PATLAB integrates the k-Wave toolbox to model acoustic wave propagation and supports both signal simulation (forward problem) and image reconstruction (inverse problem).
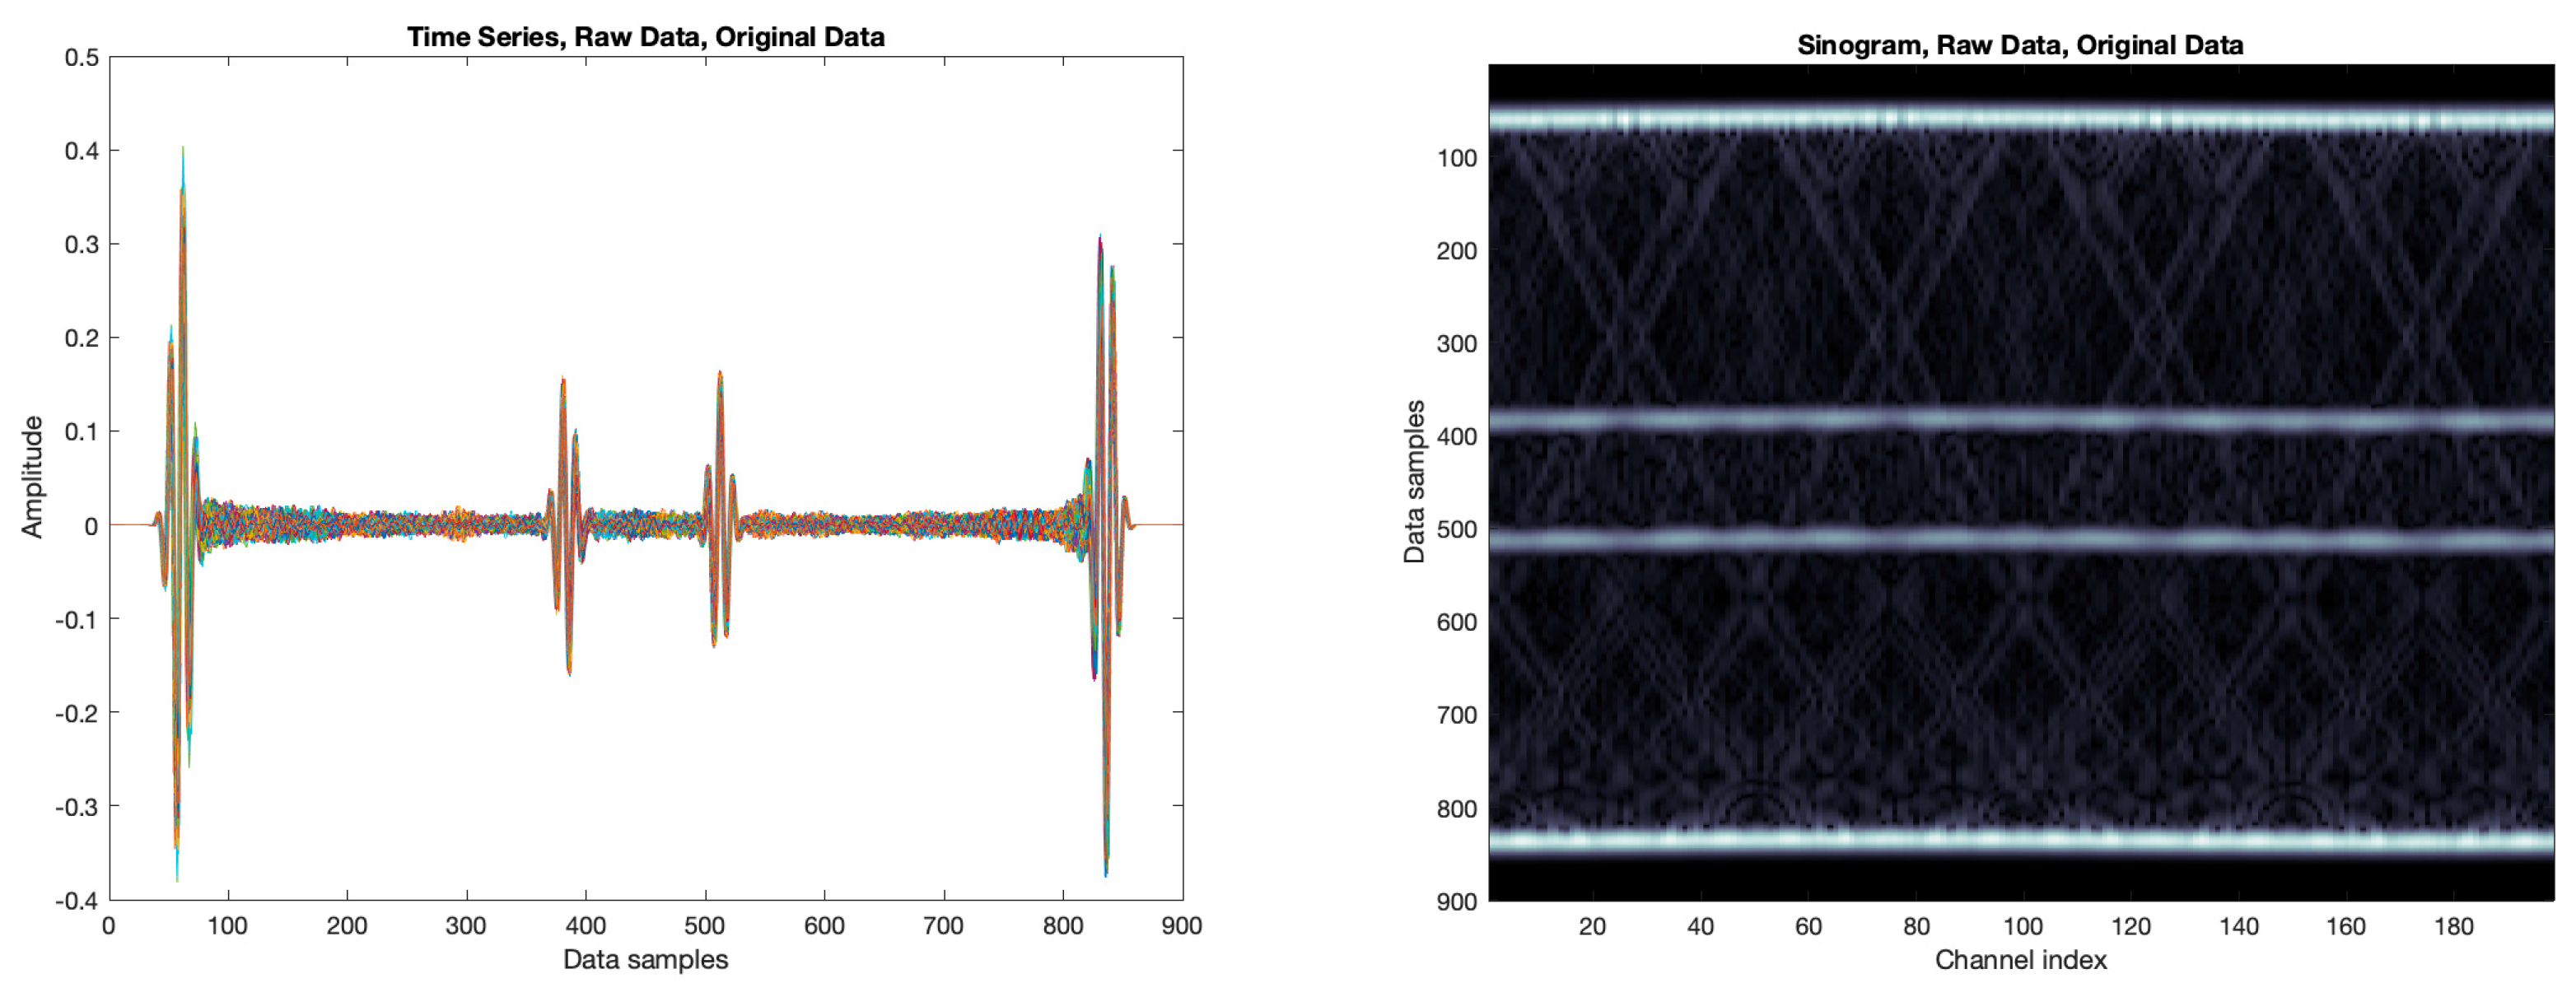
Figure 3.
(Left) All 180 detectors measure the simulated time series data. (Right) Acquired sinogram information from the implemented circular detector array.
Figure 3.
(Left) All 180 detectors measure the simulated time series data. (Right) Acquired sinogram information from the implemented circular detector array.
2.4.1. Signal Simulation
The simulation of acoustic propagation involved defining the four essential components of k-Wave: the computational grid, the acoustic properties of the medium, the sensor configuration, and the acoustic source. A 2D computational domain of 35 × 35 mm² was used, with a grid spacing of 0.1 mm and centered at (0, 0) mm. The sensor array consisted of 180 equally spaced detectors arranged in a circle of 15.8 mm radius. Two opposite sensor positions are operated 90 times, rotating the cylinder every 2 degrees sequentially, and simulated by a 2x90 equidistantly distributed circular detector array, respectively. The detector response was modeled with a center frequency of 5 MHz and a 52% bandwidth. The medium was assigned an effective speed of sound of water, without additional attenuation. The acoustic source was defined as a binary image of the object under study, a hollow metal cylinder as described in Subsection 2.2, assuming omnidirectional illumination and perfect thermoelastic conversion. A sampling frequency of 50 MHz and a time window of 30 µs were used, consistent with experimental parameters. The simulation generated 180 time-series pressure signals, which were arranged into a sinogram of size 180 × , where is the number of time samples.
2.4.2. Image Reconstruction
The PA signals generated in the simulation were used to reconstruct the 2D cross-sectional image of the metal cylinder. The Delay-And-Sum (DAS) algorithm was applied using the same computational grid and sampling parameters defined during the simulation. We assumed a sensor directivity of 30 degrees, along with omnidirectional sensitivity. The resulting image clearly delineates the inner and outer edges of the cavity as regions of maximum intensity.
The simulation considered ideal conditions, including uniform acoustic propagation in a non-dispersive, non-attenuating medium and full-field omnidirectional illumination (Figure 4). Although these assumptions do not fully represent real experimental data, appropriate signal processing can help mitigate such limitations. The reconstructed images were normalized and contrast-enhanced to facilitate qualitative and quantitative analysis. Both the preprocessed sinograms and final images were exported for further evaluation using image quality metrics to optimize the reconstruction parameters in future iterations.
2.5. Primal and Dual Experimental PA Signal Processing
Since the object of interest is axisymmetric concerning the centerline of rotation, the experimental setup of Subsection 2.3 can be realized by four distinct detector positions labeled as “north” (N), “east” (E), “south” (S), and “west” (W). Their measurement should give an equivalent amount of information as attained by the simulation 2.4.1. By the interpretation that the time sequence reflects the projection of the geometric object of interest, we identify the need to align the time-amplitude signal with the dimensional center of the metal cylinder. Since the time to space projection depends on the acoustic transport velocity, a balance between the sound velocity in water and the corresponding metal is demanded. To attain this balance with an average propagation velocity , the intensity reflection coefficient R2, the squared pressure reflection coefficient R, as contemplated in [32], is taken into account. The intensity reflection coefficient from metal to water equals the intensity from water to metal. The pressure reflection coefficient from the solid metal, where the PA effect initiates, to water, the coupling medium, is calculated by
where Z = ρv describes the characteristic impedance of the penetrating sound wave (see Table 1); hence, for the solid one calculates Zsolid = ρsolidvsolid, while Zwater = ρwatervwater ≈ 1.481x10⁶(kg/m2s) = 1.481 MRayl. Table 2 contains the evaluation results of the pressure reflection coefficients of the present materials in this study.
Furthermore, we propose the average propagation velocity of the plotted PA signal, knowing about the material layers that the induced acoustic wave likely interacts with in a linear wave towards the detector (e.g. metal, water, metal, water),
We simplify the propagation within the two media by approximating the manifold by accentuating the first interface of metal to water and observing the probability that the majority of the reflected part of the acoustic wave will be reflected again and propagate a distance that is three times as long as the non-reflecting part of the wave. According to this average propagation of the acoustic PA wave in Figure 5, we center the PA time sequence over the metal cylinder.
The experimental setup with two opposing forward PA detection systems will offer temporal sequences each, but the direction of the underlying PA transport is not linked to the spatial coordinates. We propose to interpret one forward PA signal g in the backward direction and register its mirrored time sequence g’ in the temporal system of the other PA signal. Both signals are represented in vectors of the same length, and we look for their element-wise Hadamard product . This way, we realize all possible combinations of detector positions evaluated in the experimental setup (labeled by N,E,S,W): (N,E), (N,S), (N,W), (E,S), (E,W), (S,W).
Figure 6 shows the dual PA signals of the different metals obtained from the positions of the detectors located in opposite positions (N,S) and (E,W). These positions are highlighted with a dominant line width, while the other combinations based on the geometric symmetry of the cylinder are represented by thinner lines.
The derived six dual time sequences of every metal define dual sinogram information that offers 2D tomographic reconstructions. In this regard, we proceed as in the PATLAB simulation of section 3.3 and obtain dual DAS reconstruction in Figure 7 for the five cylinder sections. Once the 1D PA signals are processed according to the dual illumination methodology, the tomographic section image of the cylinder can be reconstructed according to filtered backprojection methods.
3. Results
According to the image reconstruction strategy in 2.4.2, we develop 2D PA tomography with the experimental primal and dual signals (Subsection 2.5). We compare the results as illustrated in Figure 7, presenting the DAS PA tomographic section image of the bronze cylinder.
The primal image contains many artifacts that are likely to result from internal acoustic reflections. The dual image represents a much smoother domain over the metal area, but requires further signal enhancement to visualize the internal structure (hollow cylinder). To prevent loss of information, no filters or pre-processing strategies are implemented in PATLAB or externally. At first sight, the dual reconstruction resembles more the simulation section image in Figure 4 (right). In order to evaluate the results more objectively, we implement several measures to quantify the error and the similarity between the experimental approach and the simulated study.
3.1. Dissimilarity
Three distance measures are used to evaluate the signal processing approach for PA image reconstruction. The less the difference, the better the match between the experimental performance and the computational simulation. The dissimilarity quantification of the PA results is listed in Figure 8. Excluding the material with the highest acoustic impedance, stainless steel, the dual processing results in a profitable outcome for PA tomographic image reconstruction.
The -distance between the PATLAB simulation and an experimental measurement (primal or dual), also known as the Manhattan distance or the mean error performance, is evaluated according to
The -distance between and , or the Euclidean distance or the root mean squared error, is defined by
The entropy of an image is a quantitative measure of its information content [32]. Based on this information the entropy distance between the simulation image of all PA time sequences and the experimental image for the j-th measurement is calculated following
The MATLAB function entropy is a measure that quantifies the information about the image content, taking into account the histogram information. The entropy gives a clue about the uncertainty or randomness in the PA data. Higher entropy indicates a richer distribution of pixel intensities, meaning more detail and texture, whereas lower entropy suggests redundancy or loss of information.
3.2. Similarity
In order to quantify how similar the experimental PA information with respect to the PATLAB simulation is, we implement three structural measures. Two of them refer to the space or time domain and offer a direct overall comparison between two images. Images that reveal patterns, textures, and orientations are typically evaluated in the Fourier or frequency domain. By looking at the structure globally, we evaluate a third image measure by incorporating the Fourier transform of the PA information. The similarity quantification of the PA results is listed in Figure 9.
4. Discussion
The implementation of a dual illumination and detection strategy in PA tomography for hollow metallic cylinders has demonstrated significant advantages over traditional unidirectional (primal) approaches. The results confirm that this method effectively mitigates several key limitations inherent in conventional PAT systems, particularly those related to artifacts, resolution, and contrast in industrial non-destructive testing applications.
The acoustic impedance of the materials plays a critical role in both signal processing and image quality. The high impedance mismatch between the metals and water results in a high pressure reflection coefficient (R > 69.8% for all materials), meaning a large portion of the generated acoustic energy is reflected at the interface. While this strong reflection is needed for the detection principle, it also leads to complex internal reverberations that manifest as artifacts in the primal reconstructions. The dual processing approach appears to compensate for these effects, unless the artifacts dominate the space; stainless steel apparently passes this limit and fails the distance measure under the implemented experimental parameters.
The sound velocity within each metal, which we measured experimentally, is another crucial parameter. The sequence of sound velocities (Aluminum > Stainless steel > Copper > Bronze ≈ Brass) directly influences the time-of-flight of acoustic waves and thus the accuracy of the reconstruction algorithm in the primal mode. The proposed average propagation velocity model for the dual processing, which weights the sound velocity in metal and water by the reflection coefficient, apparently balances this influence.
The thermal properties, specifically the thermal diffusion length, also influence the PA signal generation. Materials with a shorter thermal diffusion length (like bronze) confine heat more effectively (see Subsection 2.1), leading to a more efficient thermoelastic expansion and a stronger initial PA signal. This may explain why the numerical evaluation of the bronze is quantitatively much better than that of brass, although both materials have similar acoustic impedance and sound velocity.
The quantitative metrics presented in Figure 8-9 provide objective evidence of the dual method’s superiority. For all metals except stainless steel, the dual processing yielded lower distances to the simulated ideal signal, indicating a closer match to the expected outcome. The increase in cross-correlation and structural similarity values for the dual images further confirms their enhanced fidelity and closer resemblance to the simulated benchmark. This suggests that the dual processing successfully reduced the randomness and uncertainty in the data, resulting in a cleaner, less noisy image that contains more structured information.
A limitation of this study is the assumption of ideal conditions in the simulation (e.g., uniform illumination, no acoustic attenuation). In practice, dual PA illumination and detection are limited in space and the sensitivity of the detectors. Future work will focus on denser dual measurement strategies, incorporating different volumes, geometries, and materials, and exploring iterative reconstruction algorithms that can further suppress artifacts and improve quantitative accuracy.
5. Conclusions
This study successfully developed and validated a dual illumination and detection photoacoustic tomography strategy specifically designed for the non-destructive evaluation of hollow metallic cylinders. The key conclusions are enhanced image quality by effective dual signal processing for metals with acoustic impedance < 42 x 106 kg/(m2s) = 42 MRayl, as demonstrated by quantitative PA signal evaluation. This technique addresses critical limitations of existing non-destructive testing methods for the industry by offering a non-contact, high-contrast, and high-resolution imaging solution for detecting internal structures and potential defects in symmetric metal components.
Author Contributions
All authors participated in the conceptualization, methodology, analysis, and writing of the manuscript, review and editing; software, V.M.M., R.E.C.L., and M.P.C.G.; validation and resources, M.P.C.G., R.E.C.L., O.E.M.T., and A.P.P.; investigation and project administration, V.M.M., and A.P.P.; data curation and funding acquisition, V.M.M.; visualization, M.P.C.G.; supervision, A.P.P. All the authors have read and approved the final manuscript.
Funding
This research was funded by DGAPA PAPIIT, grant number IN113824.
Informed Consent Statement
Not applicable.
Acknowledgments
The experimental implementation was carried out at the Research and Technological Development Unit (UIDT) of the General Hospital of Mexico (HGM). We are grateful for all the support provided there.
Conflicts of Interest
The authors declare no conflicts of interest.
References
- Zhang, S.; Miao, J.; Li, L.S. Challenges and Advances in Two-Dimensional Photoacoustic Computed Tomography: A Review. J. Biomed. Opt. 2024, 29. [CrossRef]
- Rosencwaig, A.; Gersho, A. Theory of the Photoacoustic Effect with Solids. J. Appl. Phys. 1976, 47, 64–69. [CrossRef]
- Srirang Manohar, D.R. Photoacoustics a Historical Review. Advances in optics and photonics 2016, 8, 586–617. [CrossRef]
- Chen, S.-L.; Tian, C. Review Recent Developments in Photoacoustic Imaging and Sensing for Nondestructive Testing and Evaluation. Vis. Comput. Ind. Biomed. Art 2021, 4, 6. [CrossRef]
- Lopez-Marin, A.; Daeichin, V.; Hunt, A.; Springeling, G.; Beurskens, R.; van der Steen, A.F.W.; van Soest, G. Acoustic Stack for Combined Intravascular Ultrasound and Photoacoustic Imaging. IEEE Trans. Ultrason. Ferroelectr. Freq. Control 2025, 72, 77–86. [CrossRef]
- Peng, J.; Xu, W.; Lai, Y.; Mu, S.; Fu, L.; Zhang, J.; Zhang, J.; Jiang, Y.; Lu, P. High-Sensitive Fabry-Perot Cavity-Enhanced Optical Resonator for Photoacoustic Sensing. Opt. Express 2024, 32, 44841. [CrossRef]
- Tong, Y.; Pan, C.; Li, Z.; Chen, H.; Xue, D.; Cheng, L.; Zhen, Y.; Zhang, T.; Gao, Y.; Zhang, L.; et al. High-Sensitivity Fiber-Tip Acoustic Sensor with Ultrathin Gold Diaphragm. Opt. Express 2024, 32, 14674–14684. [CrossRef]
- Nteroli, G.; Podoleanu, A.; Bradu, A. Combining Photoacoustic and Optical Coherence Tomography Imaging for Nondestructive Testing Applications. In Proceedings of the Advances in 3OM: Opto-Mechatronics, Opto-Mechanics, and Optical Metrology; Rolland, J.P., Duma, V.-F., Podoleanu, A.G.H., Eds.; SPIE, May 6 2022.
- Rai V. N.; Rai, V.N.; Thakur, S.N.; Thakur, S.N. Physics and Instrumentation of Photothermal and Photoacoustic Spectroscopy of Solids. Photoacoustic and Photothermal Spectroscopy Principles and Applications, pp. 21–49 2022.
- Yao, J.; Xia, J.; Wang, L.V. Multiscale Functional and Molecular Photoacoustic Tomography. Ultrason. Imaging 2016, 38, 44–62. [CrossRef]
- Fukutani, K.; Someda, Y.; Taku, M.; Asao, Y.; Kobayashi, S.; Yagi, T.; Yamakawa, M.; Shiina, T.; Sugie, T.; Toi, M. Characterization of Photoacoustic Tomography System with Dual Illumination. In Proceedings of the Photons Plus Ultrasound: Imaging and Sensing 2011; Oraevsky, A.A., Wang, L.V., Eds.; SPIE, February 10 2011.
- Tarvainen, T.; Cox, B. Quantitative Photoacoustic Tomography: Modeling and Inverse Problems. J. Biomed. Opt. 2024, 29, S11509. [CrossRef]
- Sridharan, B.; Lim, H.G. Advances in Photoacoustic Imaging Aided by Nano Contrast Agents: Special Focus on Role of Lymphatic System Imaging for Cancer Theranostics. J. Nanobiotechnology 2023, 21. [CrossRef]
- gupta1969.pdf.
- Hellier, C. Handbook of Nondestructive Evaluation, Second Edition; Hellier, C., Ed.; McGraw Hill Professional, 2013; ISBN 9780071777148.
- Selim, H.; Delgado-Prieto, M.; Trull, J.; Picó, R.; Romeral, L.; Cojocaru, C. Defect Reconstruction by Non-Destructive Testing with Laser Induced Ultrasonic Detection. Ultrasonics 2020, 101, 106000. [CrossRef]
- Zhang, Y.; Zhang, F.; Zhang, W.; Yang, Q.; Krishnaswamy, S.; Wei, H.; Liu, Y.; Du, W.; Wang, T. Laser-Induced Ultrasound Imaging of Multi Metal Laminate with Complex Interface. Mater. Des. 2023, 232, 112095. [CrossRef]
- Andrei B. Karpiouk, Salavat R. Aglyamov, Frederic Bourgeois, Adela Ben-Yakar, Stanislav Y. Emelianov Quantitative Ultrasound Method to Detect and Monitor Laser-Induced Cavitation Bubbles. Infrared Phys. 1991, 32, 489–515. [CrossRef]
- Yao, J.; Maslov, K.I.; Puckett, E.R.; Rowland, K.J.; Warner, B.W.; Wang, L.V. Double-Illumination Photoacoustic Microscopy. Opt. Lett. 2012, 37, 659–661. [CrossRef]
- Lin, X.; Liu, C.; Meng, J.; Gong, X.; Lin, R.; Sun, M.; Song, L. Dual-Foci Detection in Photoacoustic Computed Tomography with Coplanar Light Illumination and Acoustic Detection: A Phantom Study. J. Biomed. Opt. 2018, 23, 1–4. [CrossRef]
- Perrot, V.; Polichetti, M.; Varray, F.; Garcia, D. So You Think You Can DAS? A Viewpoint on Delay-and-Sum Beamforming. Ultrasonics 2021, 111, 106309. [CrossRef]
- Kim, J.; Lee, D.; Jung, U.; Kim, C. Photoacoustic Imaging Platforms for Multimodal Imaging. Ultrasonography 2015, 34, 88–97. [CrossRef]
- Zhou, Y.; Yao, J.; Wang, L.V. Tutorial on Photoacoustic Tomography. J. Biomed. Opt. 2016, 21, 61007. [CrossRef]
- Anderson, O.; Oda, H.; Chopelas, A.; Isaak, D.G. A Thermodynamic Theory of the Grüneisen Ratio at Extreme Conditions: MgO as an Example. Physics and Chemistry of Minerals 1993, 19, 369–380. [CrossRef]
- Gutiérrez-Reyes, E.; García-Segundo, C.; García-Valenzuela, A.; Ortega, R.; Buj, C.; Filbir, F. Heat Transport Considerations in the Mathematical Analysis of the Photoacoustic and Photothermal Effects. J. Phys. Commun. 2019, 3, 085007. [CrossRef]
- Gutiérrrez-Reyes, E.; García-Segundo, C.; García-Valenzuela, A.; Reyes-Ramírez, B.; Gutiérrez-Juárez, G.; Guadarrama-Santana, A. Analysis of the Transfer Function for Layered Piezoelectric Ultrasonic Sensors. AIP Adv. 2017, 7, 065106. [CrossRef]
- Omidi, P.; Yip, L.C.M.; Rascevska, E.; Diop, M.; Carson, J.J.L. PATLAB: A Graphical Computational Software Package for Photoacoustic Computed Tomography Research. Photoacoustics 2022, 28, 100404. [CrossRef]
- Mozaffarzadeh, M.; Mahloojifar, A.; Orooji, M.; Adabi, S.; Nasiriavanaki, M. Double-Stage Delay Multiply and Sum Beamforming Algorithm: Application to Linear-Array Photoacoustic Imaging. IEEE Trans. Biomed. Eng. 2018, 65, 31–42. [CrossRef]
- Paul, S.; Thomas, A.; Singh, M.S. Delay-and-Sum-to-Delay-Standard-Deviation Factor: A Promising Adaptive Beamformer. Opt. Lett. 2021, 46, 4662–4665. [CrossRef]
- Tian, C.; Shen, K.; Dong, W.; Gao, F.; Wang, K.; Li, J.; Liu, S.; Feng, T.; Liu, C.; Li, C.; et al. Image Reconstruction from Photoacoustic Projections. Photonics Insights 2024, 3, R06. [CrossRef]
- Wang, Y.; Li, C. Comprehensive Framework of GPU-Accelerated Image Reconstruction for Photoacoustic Computed Tomography. J. Biomed. Opt. 2024, 29, 066006. [CrossRef]
- Rafael C. Gonzalez, Richard E. Woods Digital Image Processing Using MATLAB; Pearson, 2018;
- Phan, D.T.; Phan, T.T.V.; Bui, N.; Park, S.; Choi, J.; Oh, J. A Portable Device with Low-Power Consumption for Monitoring Mouse Vital Signs during in Vivo Photoacoustic Imaging and Photothermal Therapy. Physiol. Meas. 2020, 41. [CrossRef]
- De Santi B.; De Santi, B.; Kim, L.; Kim, L.; Bulthuis R. F.; Bulthuis, R.F.G.; Lucka, F.; Lucka, F.; Manohar, S.; Manohar, S. Automated Three-Dimensional Image Registration for Longitudinal Photoacoustic Imaging. Journal of Biomedical Optics, 29 2024.
- Najafzadeh, E.; Farnia, P.; Lavasani, S.N.; Basij, M.; Yan, Y.; Ghadiri, H.; Ahmadian, A.; Mehrmohammadi, M. Photoacoustic Image Improvement Based on a Combination of Sparse Coding and Filtering. J. Biomed. Opt. 2020, 25. [CrossRef]
- Colín-García, M.P.; Ruiz-Veloz, M.; Gutiérrez-Juárez, G.; Montoya-Ayala, G.; Ramírez-Chavarría, R.G.; Castañeda-Guzmán, R.; Pérez-Pacheco, A. Photoacoustic Tomography in Forward-Detection Mode for Monitoring Structural Changes in an Extracted Wisdom Tooth. Appl. Sci. (Basel) 2025, 15, 9146. [CrossRef]
- Khansari, A.; Ranjbaran, S.M.; Zafar, M.; Beirami, M.; Avanaki, K. Evaluation of Algorithms to Decompose Signals in MS PAM. Progress in Biomedical Optics and Imaging Proceedings of SPIE, 13319, 1331920 2025, 13319, 1331920–1331920 – 10. [CrossRef]
Figure 1.
From left to right: aluminum, steel, copper, bronze, and brass (marked with black duct tape for better distinction due to its similarity to bronze) cylinders, viewed from above.
Figure 1.
From left to right: aluminum, steel, copper, bronze, and brass (marked with black duct tape for better distinction due to its similarity to bronze) cylinders, viewed from above.
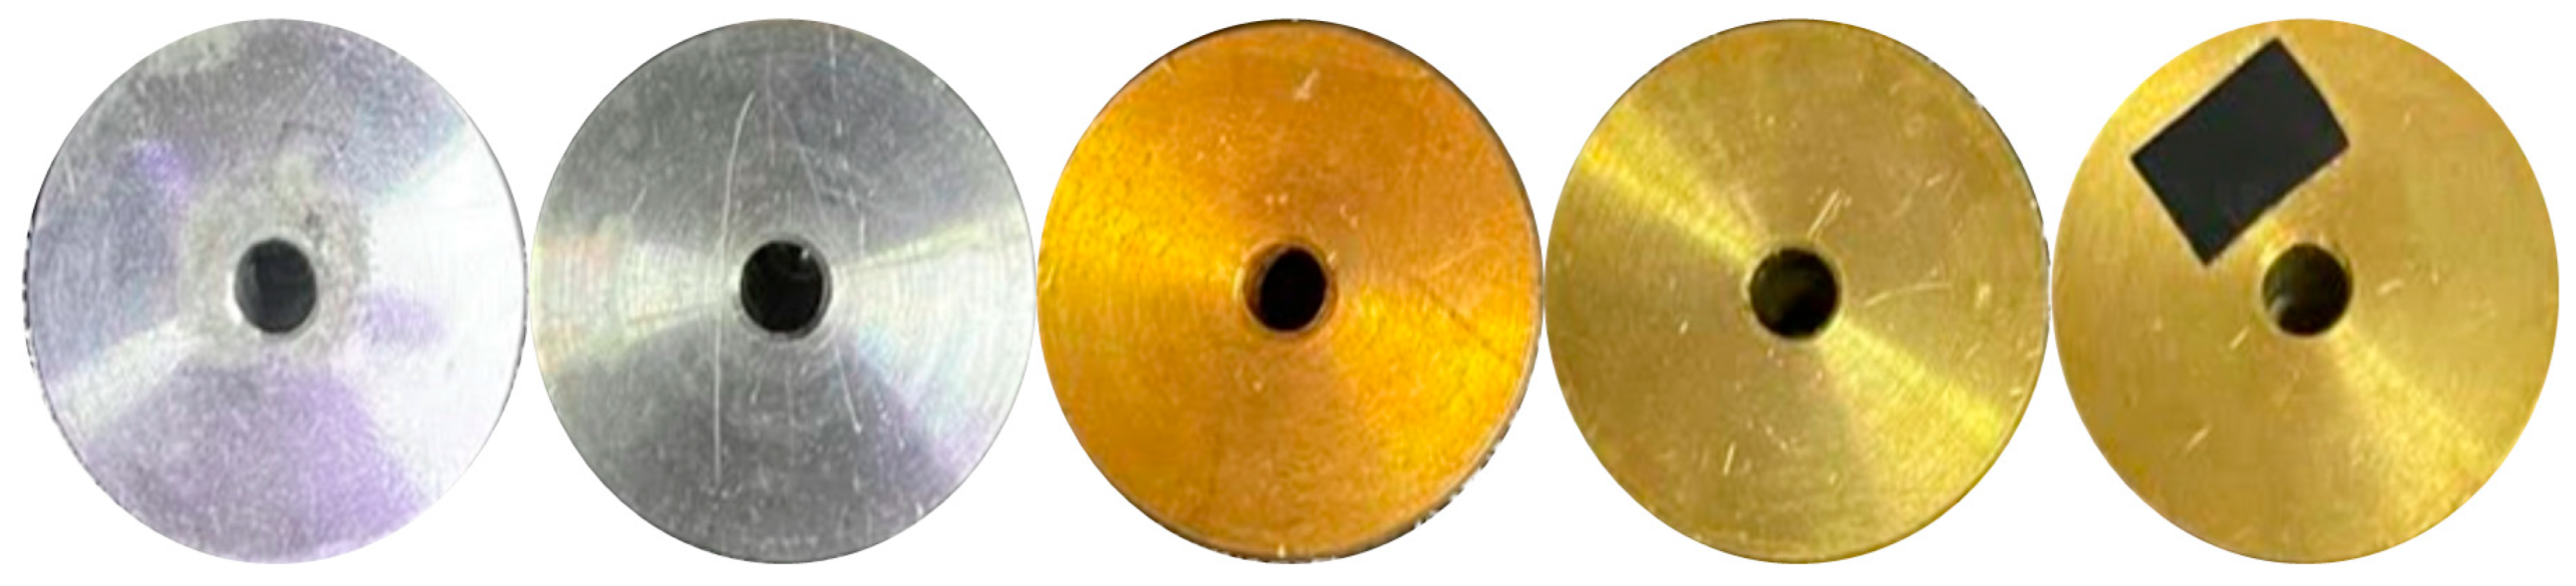
Figure 2.
Schematic of the experimental photoacoustic setup. (1) pulsed lasers, (2) oscilloscope, (3) transducers, (4) laptop, and (5) metallic cylinder phantom. Two lasers and two detectors are shown only to illustrate the sequential illumination and detection procedure; however, all measurements were carried out in the same plane. The photodetector is not depicted here to avoid visual saturation of the figure.
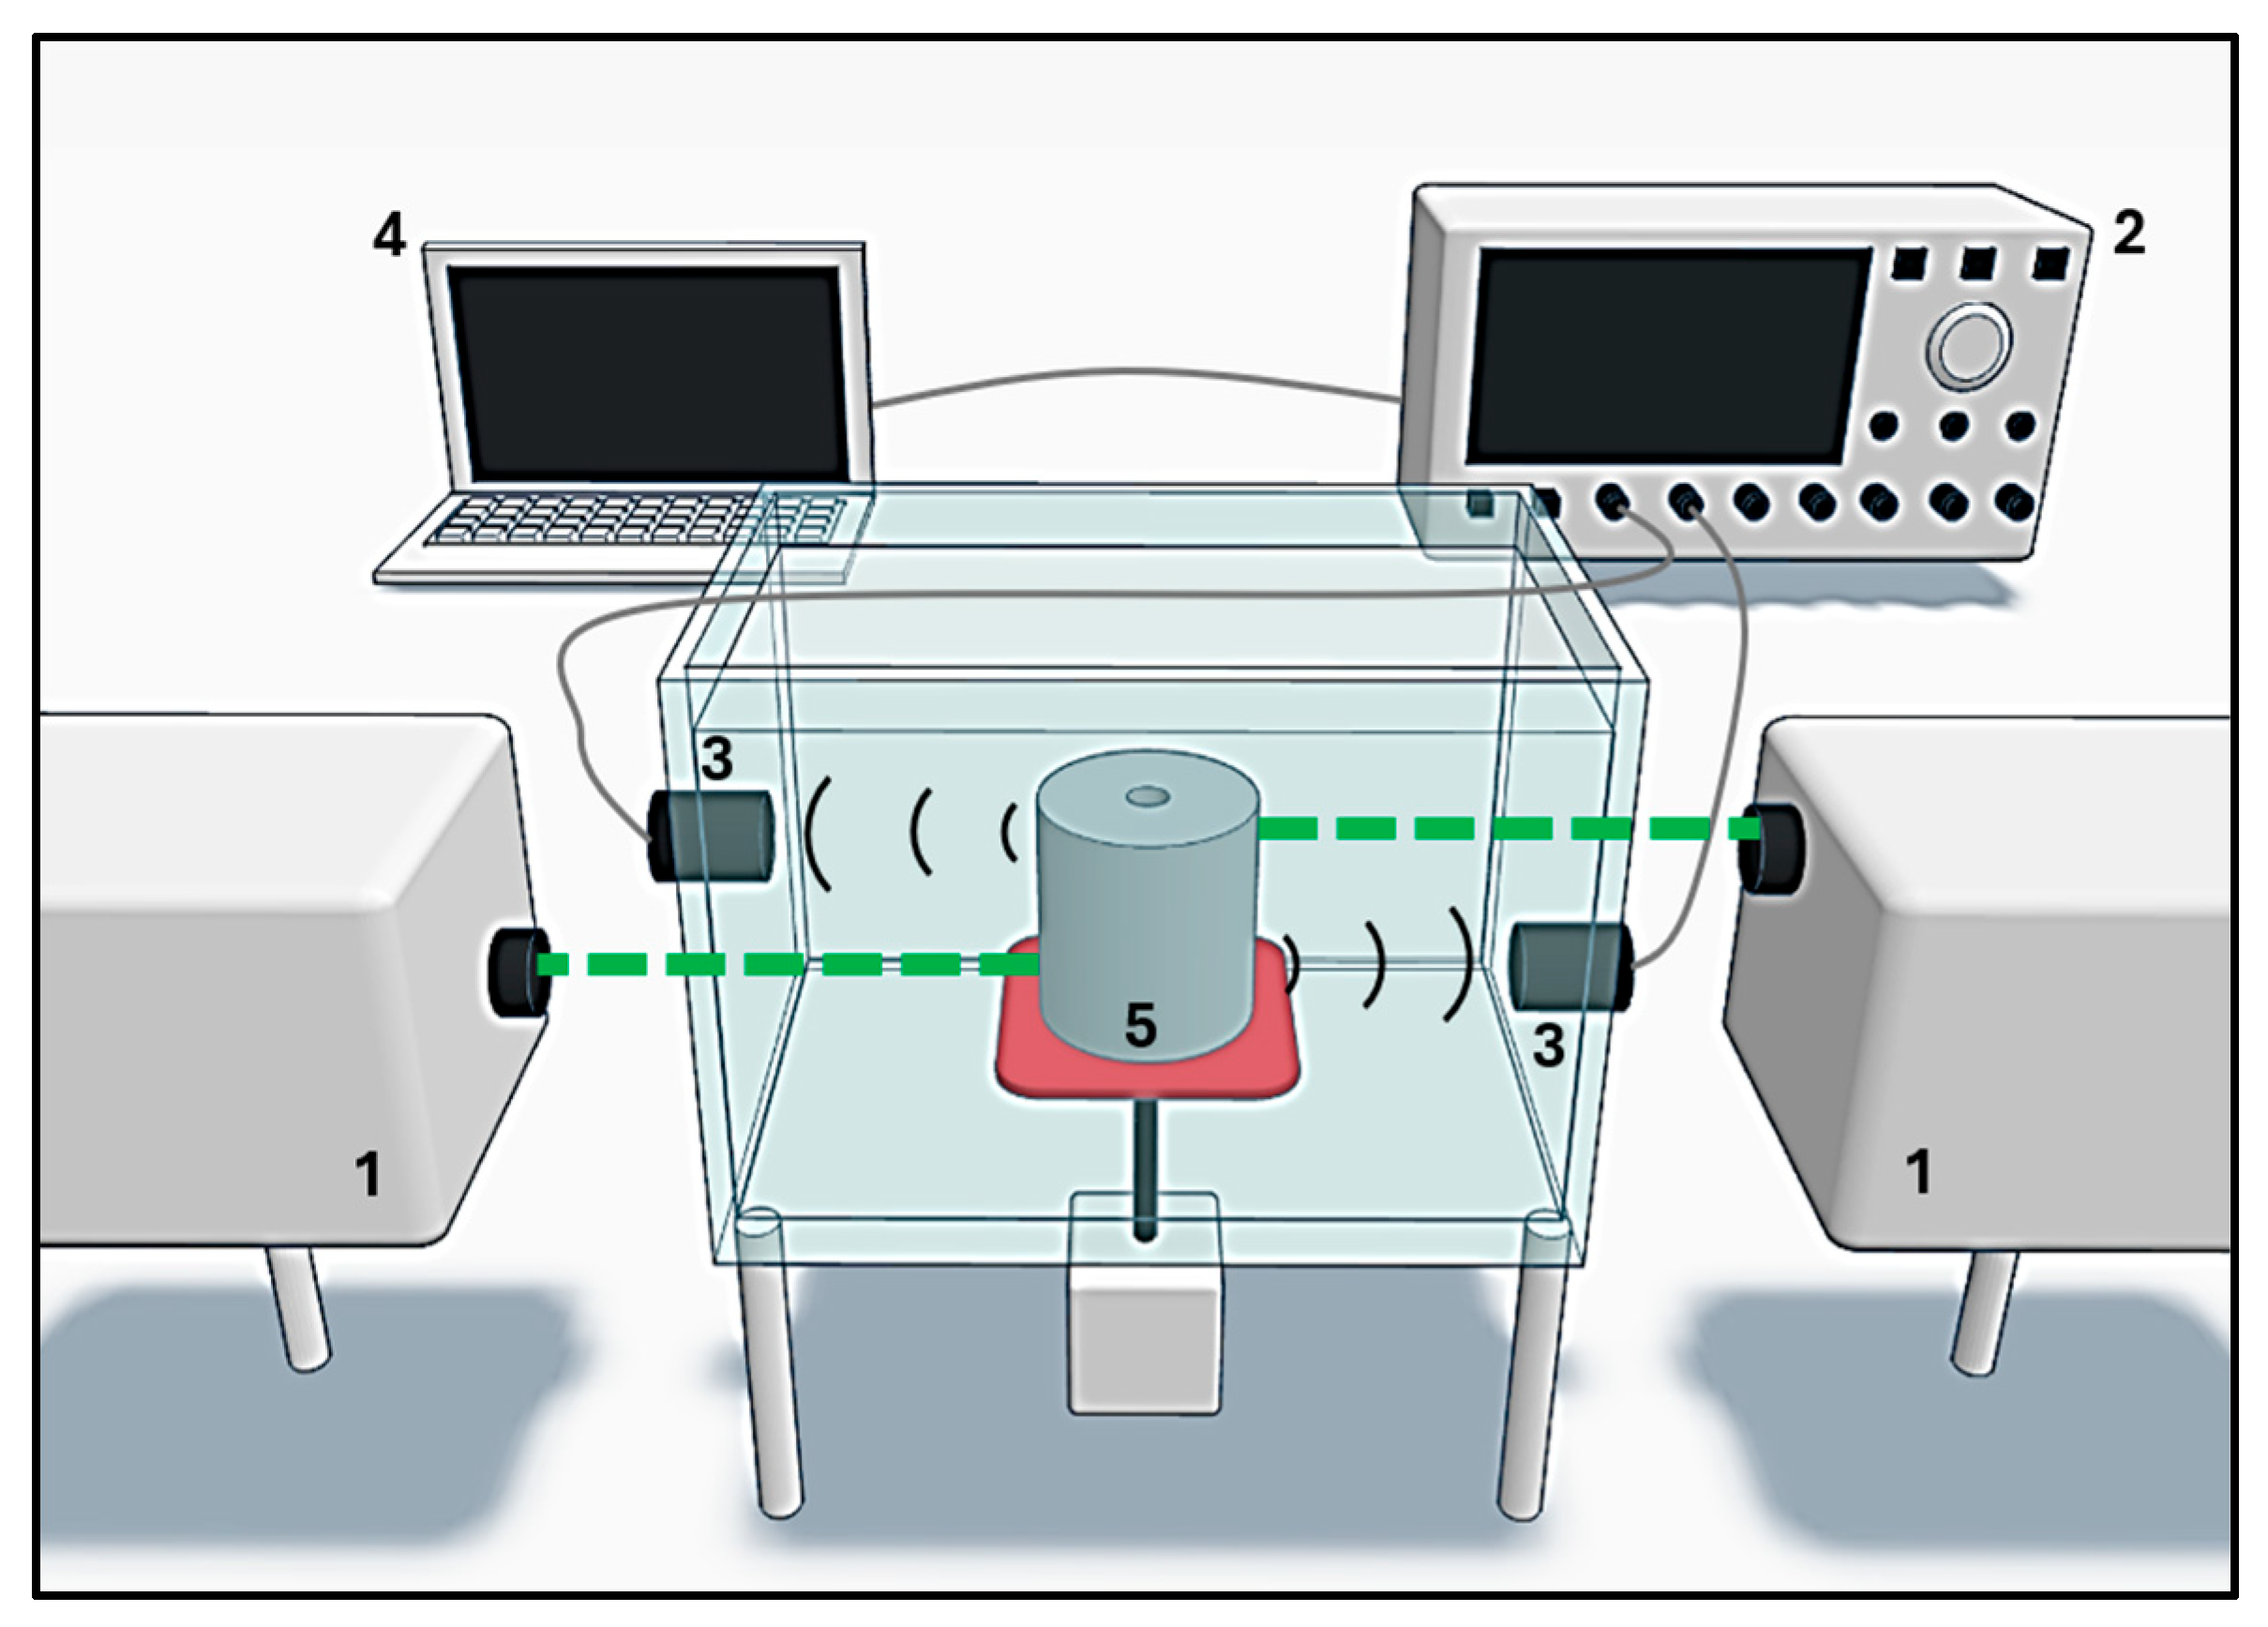
Figure 4.
Designed image of the binary physical section of the cylinder’s geometry (left) and the DAS reconstruction of this object with PATLAB (right).
Figure 4.
Designed image of the binary physical section of the cylinder’s geometry (left) and the DAS reconstruction of this object with PATLAB (right).
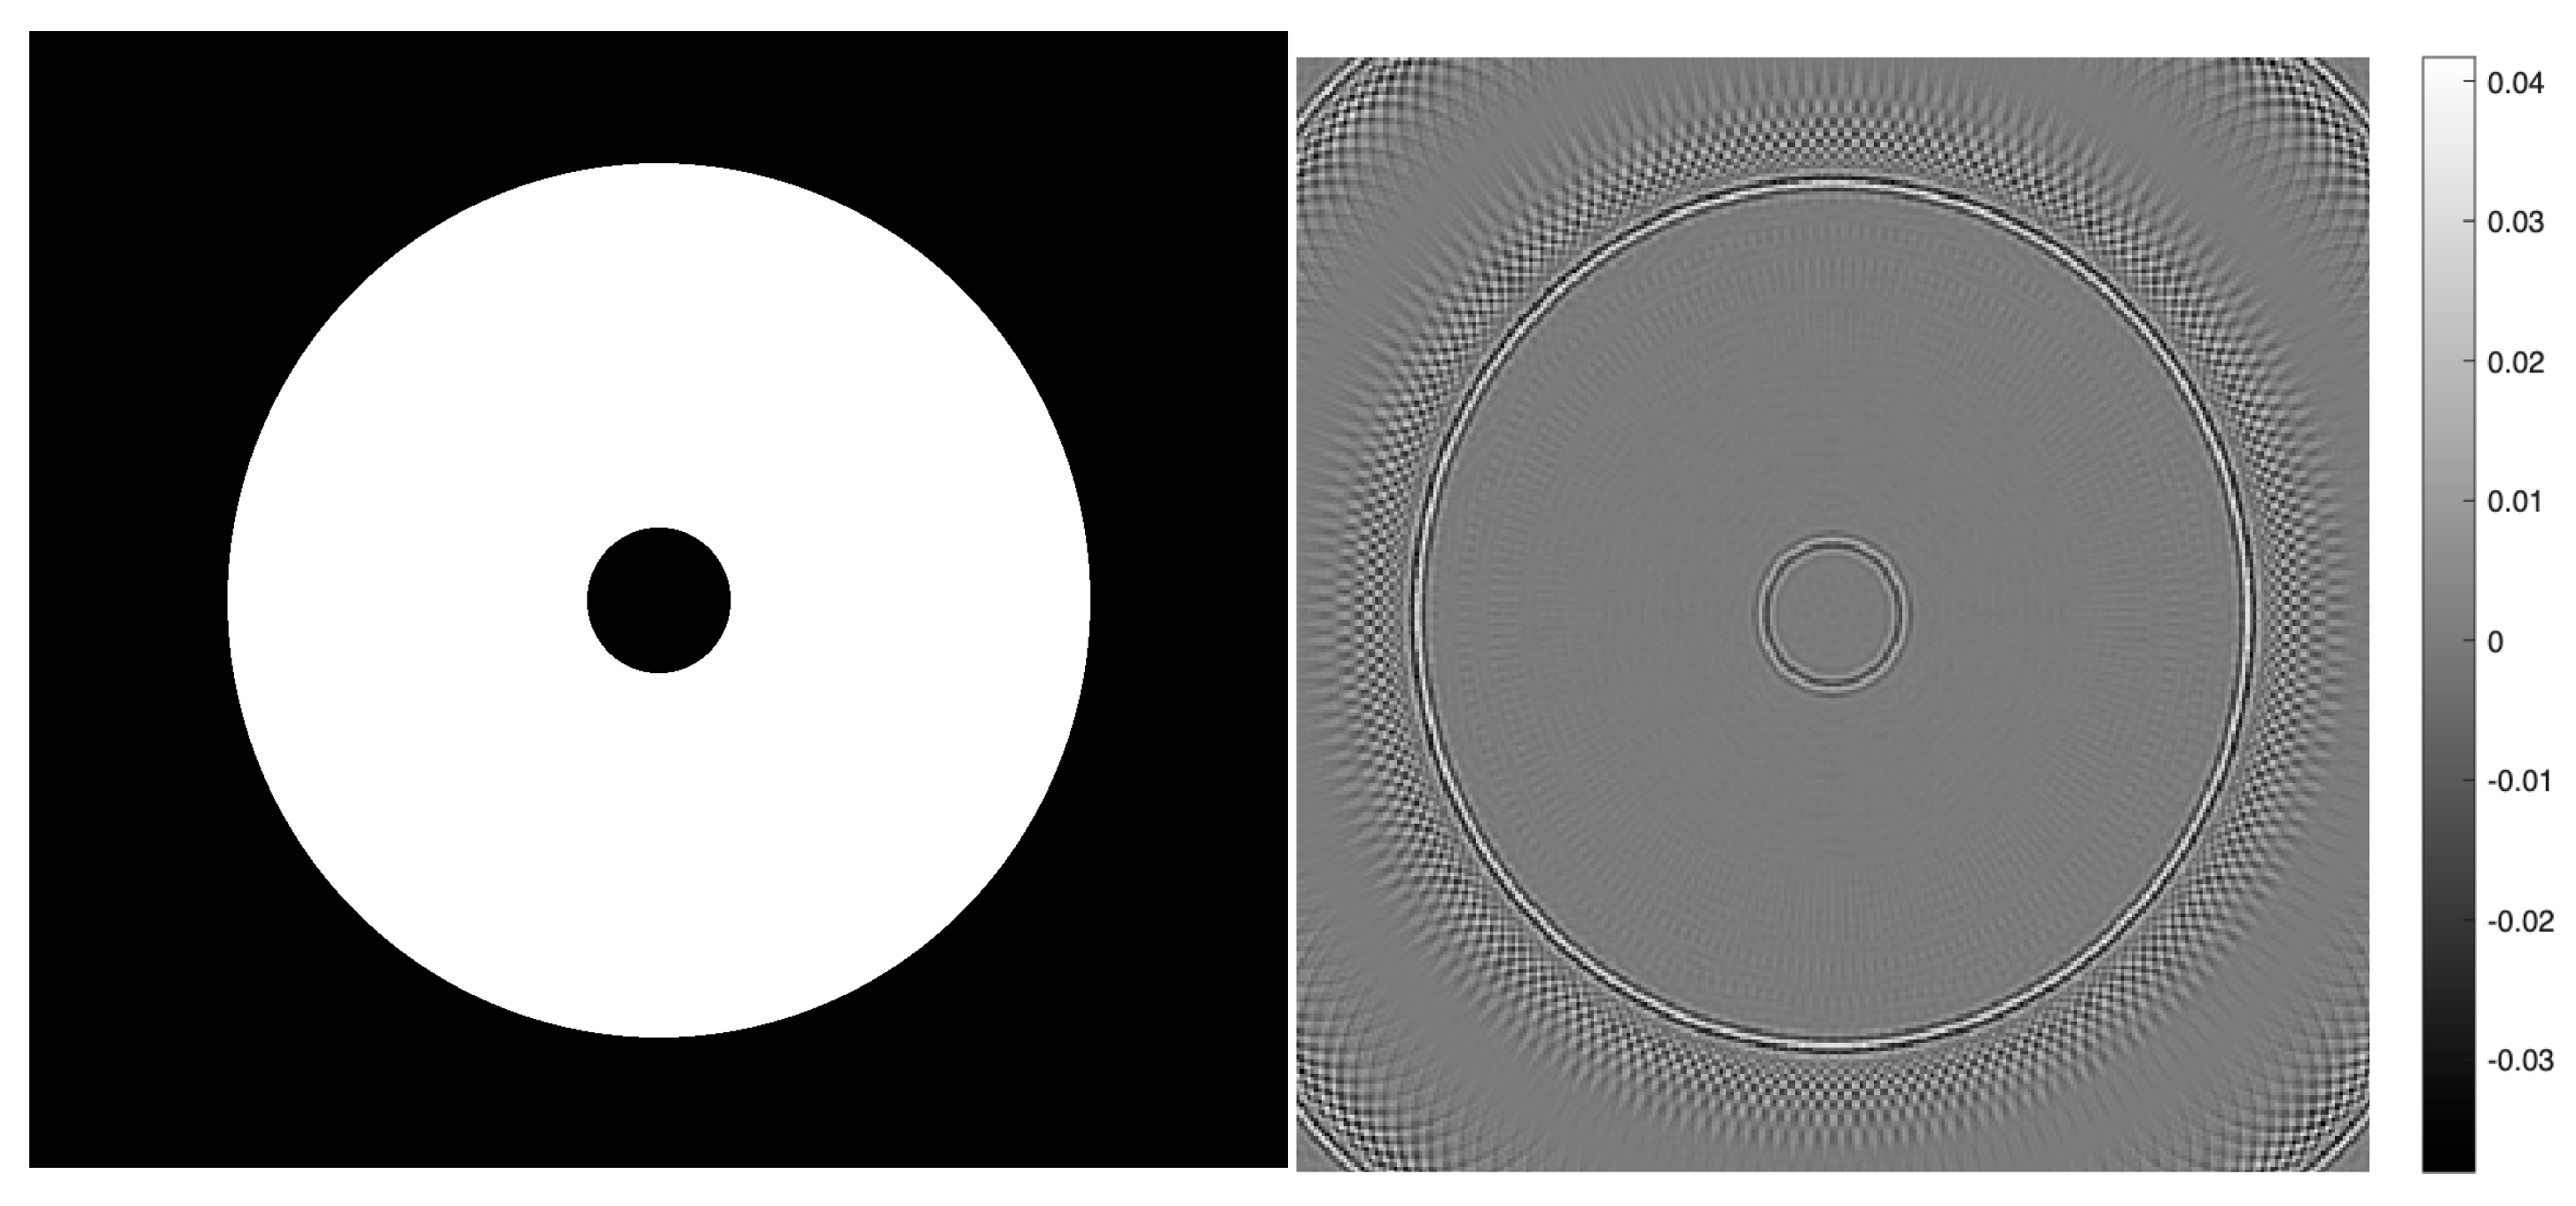
Figure 5.
Primal normalized PA signals, centered over the cylinder according to the average propagation velocity v.
Figure 5.
Primal normalized PA signals, centered over the cylinder according to the average propagation velocity v.
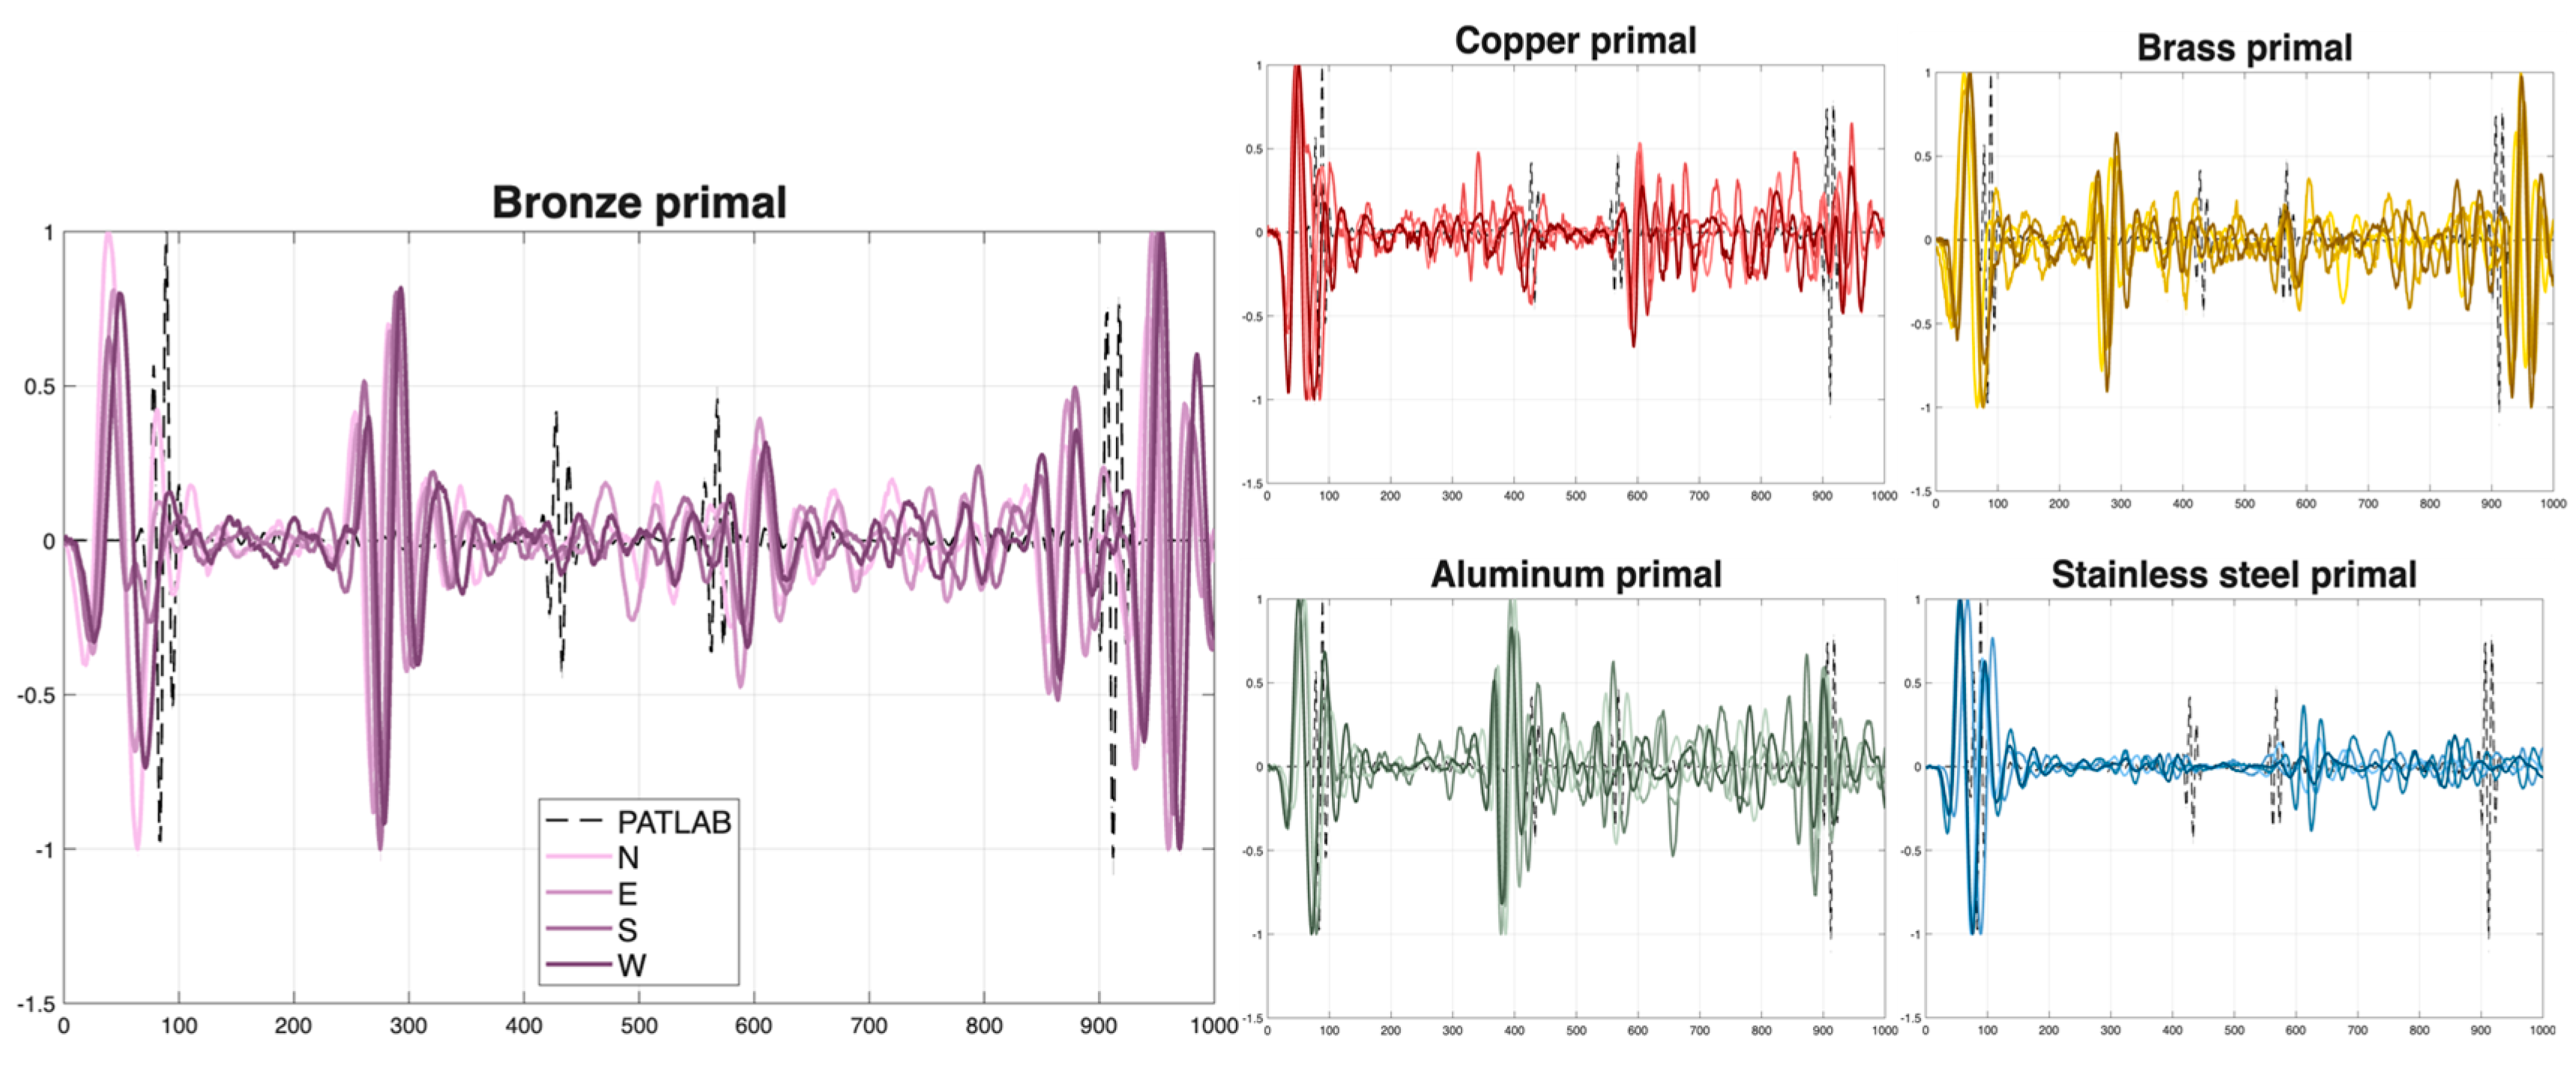
Figure 6.
Dual normalized PA signals of metals.
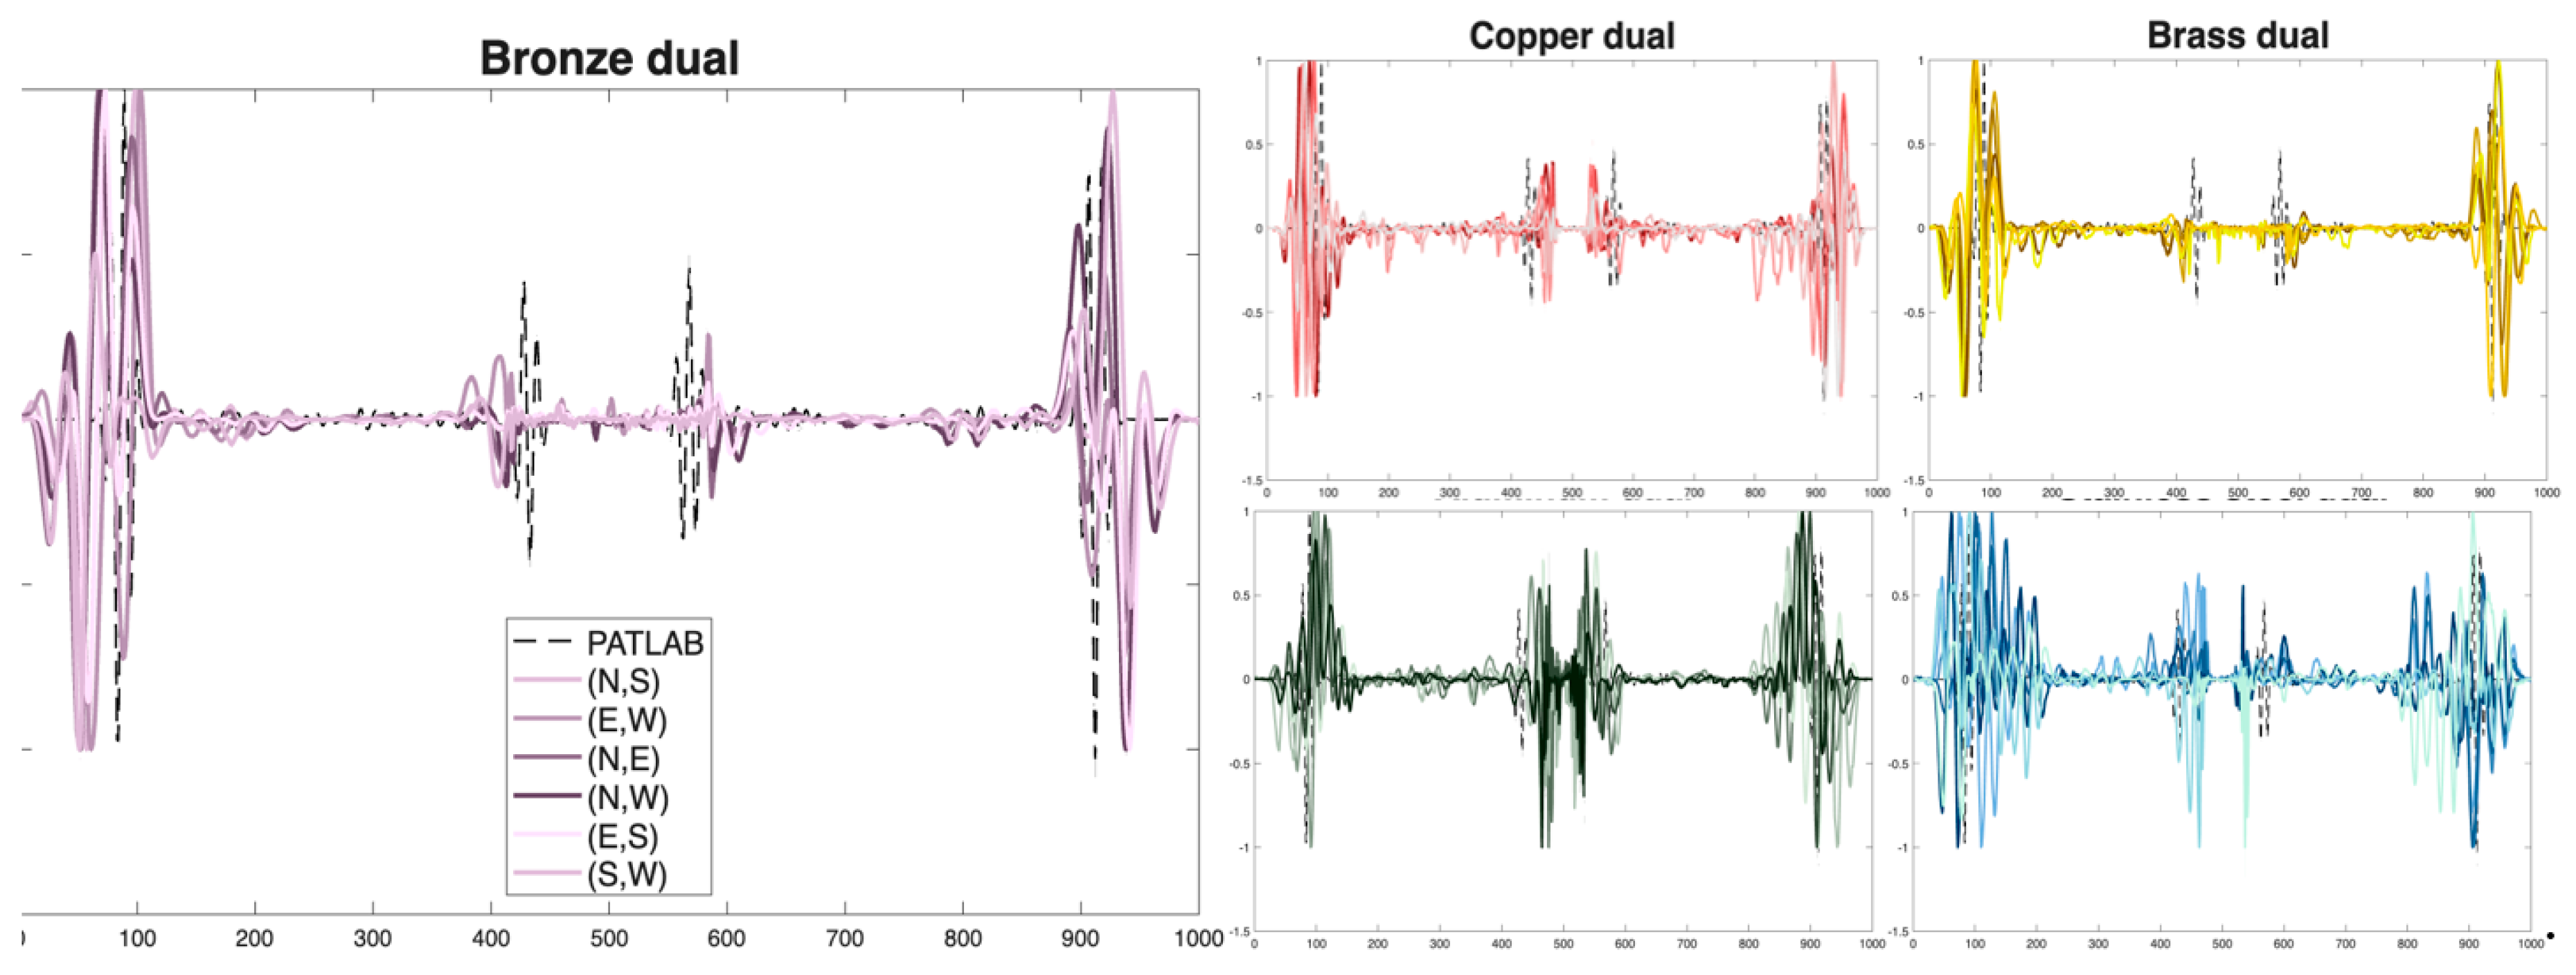
Figure 7.
Primal (left) and dual (right) DAS reconstruction of the bronze cylinder.

Figure 9.
Similarity evaluation of primal and dual PA time signals with respect to the PATLAB simulation using the three measures CCF, SSIM and F-SSIM. The greater the resulting value, the better the match between experiment and prediction.
Figure 9.
Similarity evaluation of primal and dual PA time signals with respect to the PATLAB simulation using the three measures CCF, SSIM and F-SSIM. The greater the resulting value, the better the match between experiment and prediction.
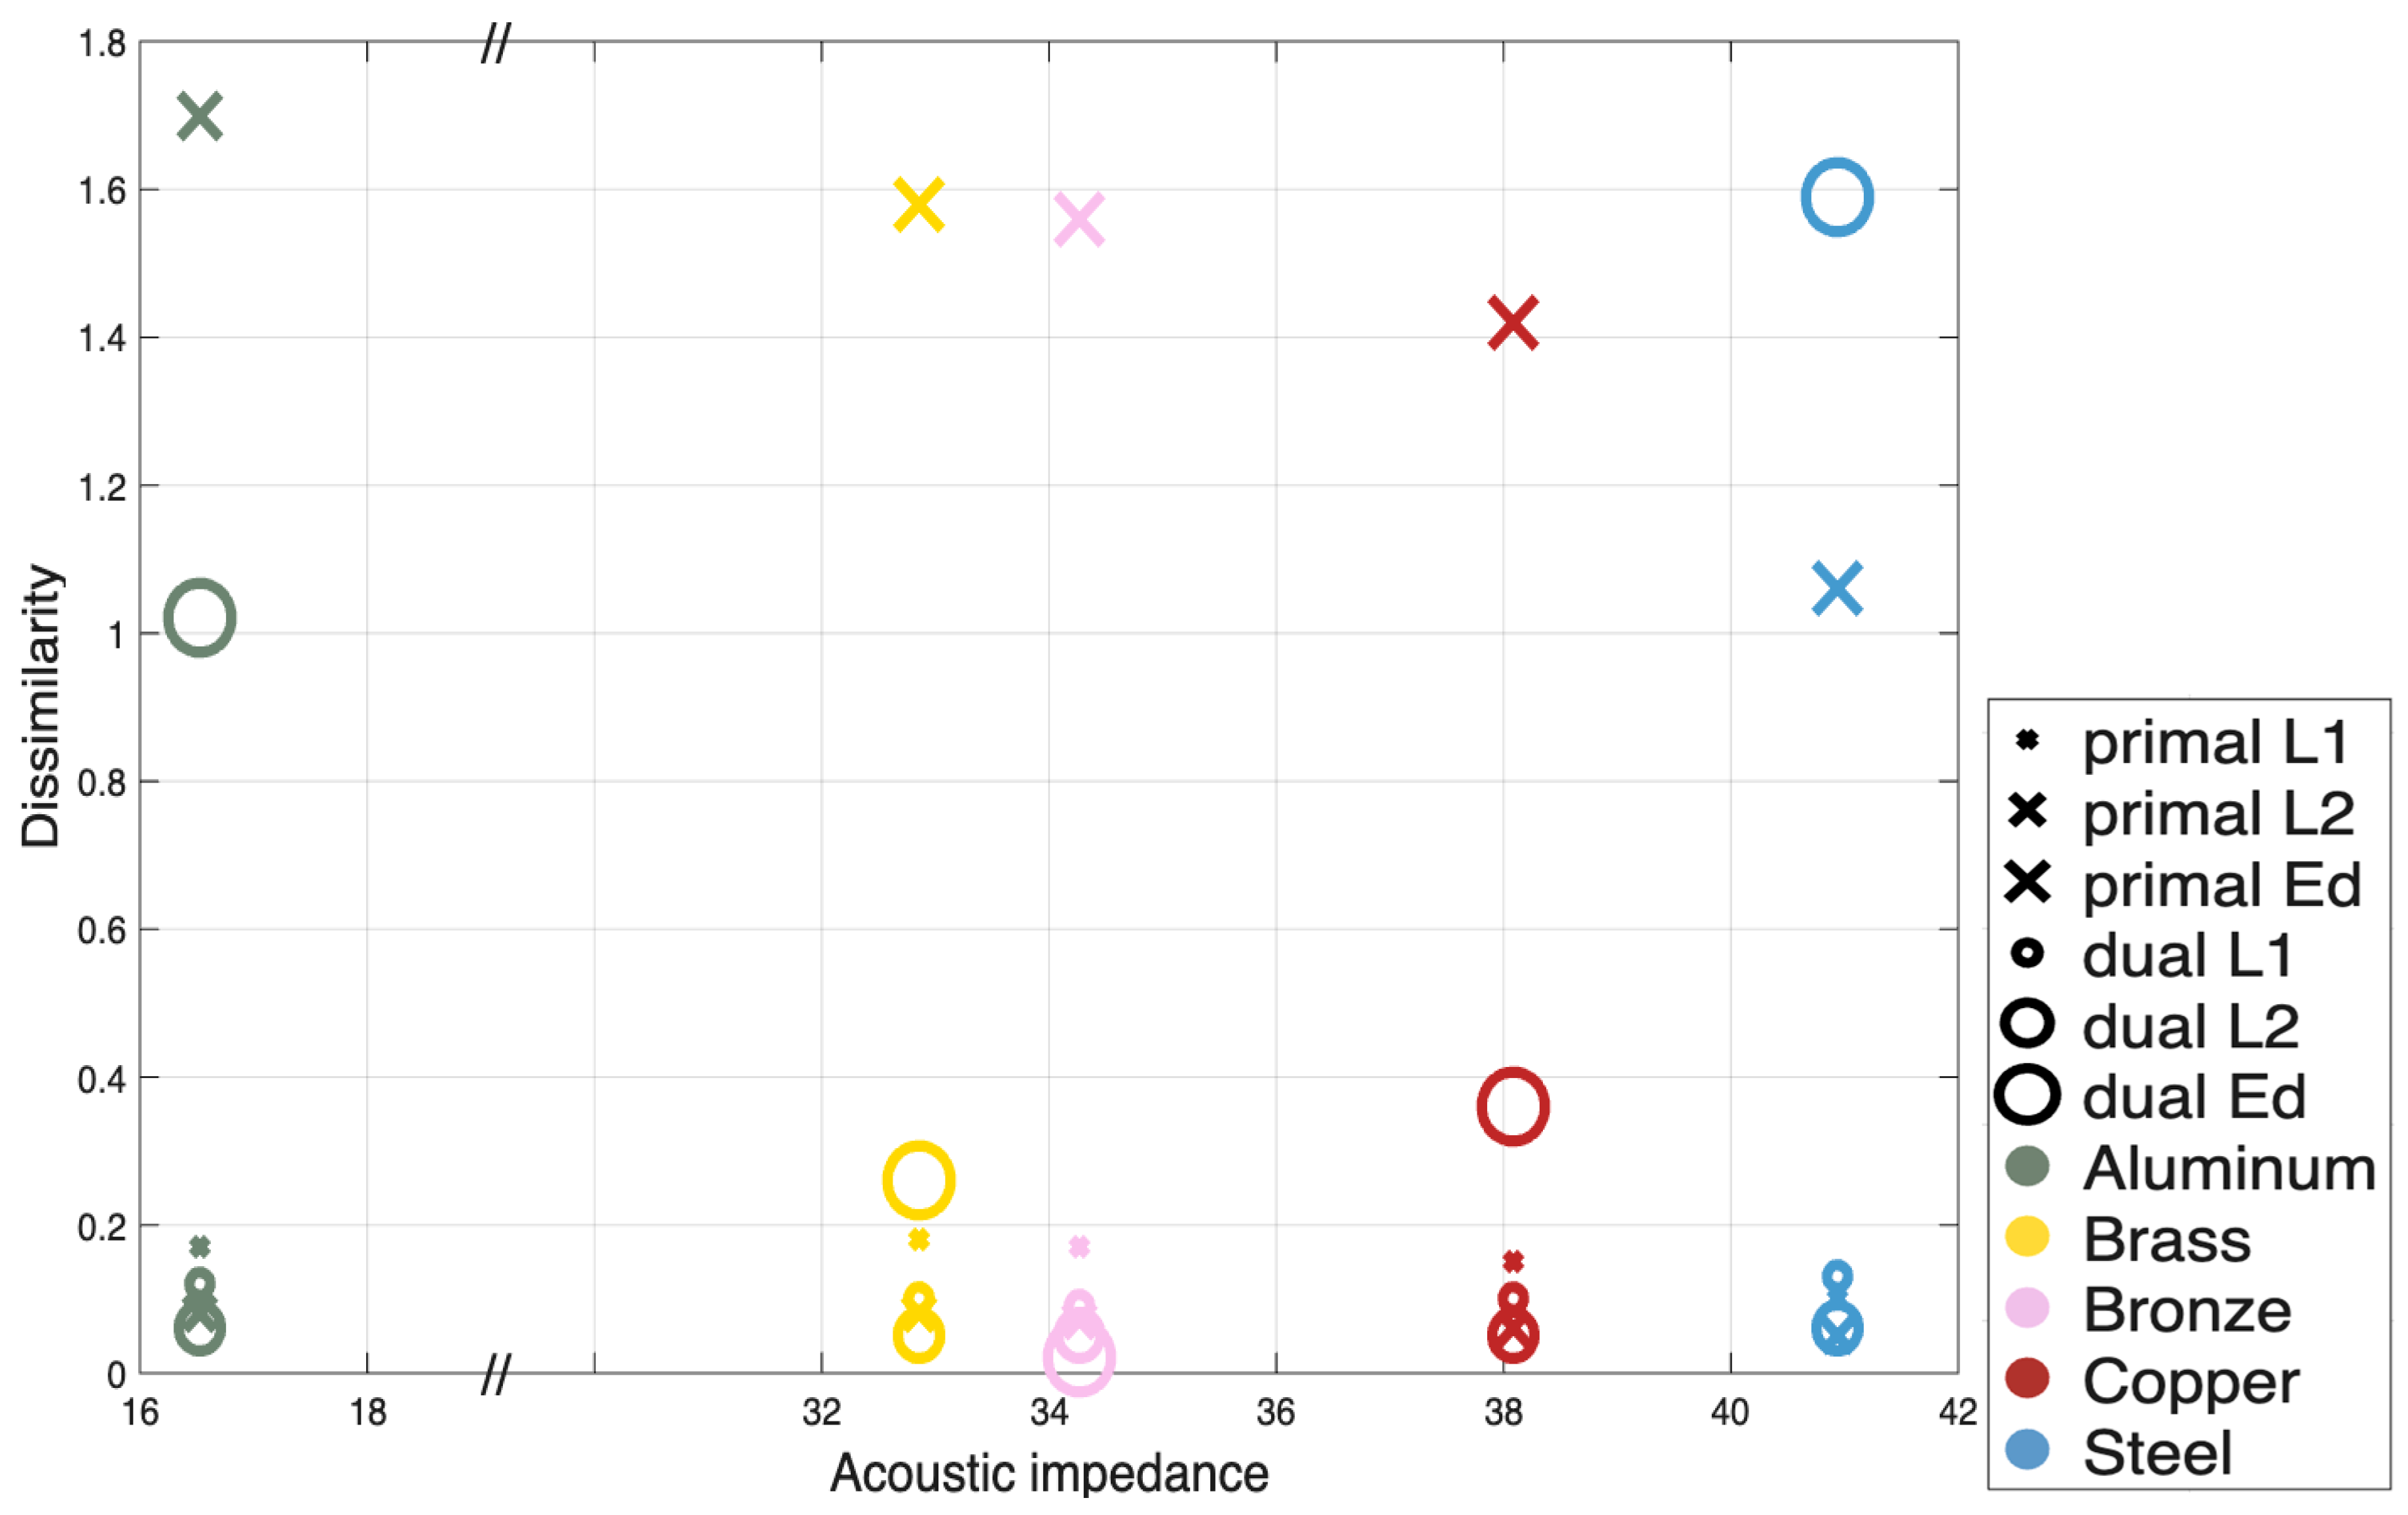
Figure 8.
Dissimilarity evaluation of primal and dual PA time signals with respect to the PATLAB simulation using the three measures L1, L2 and Ed. The smaller the resulting distance, the better the match between experiment and prediction.
Figure 8.
Dissimilarity evaluation of primal and dual PA time signals with respect to the PATLAB simulation using the three measures L1, L2 and Ed. The smaller the resulting distance, the better the match between experiment and prediction.
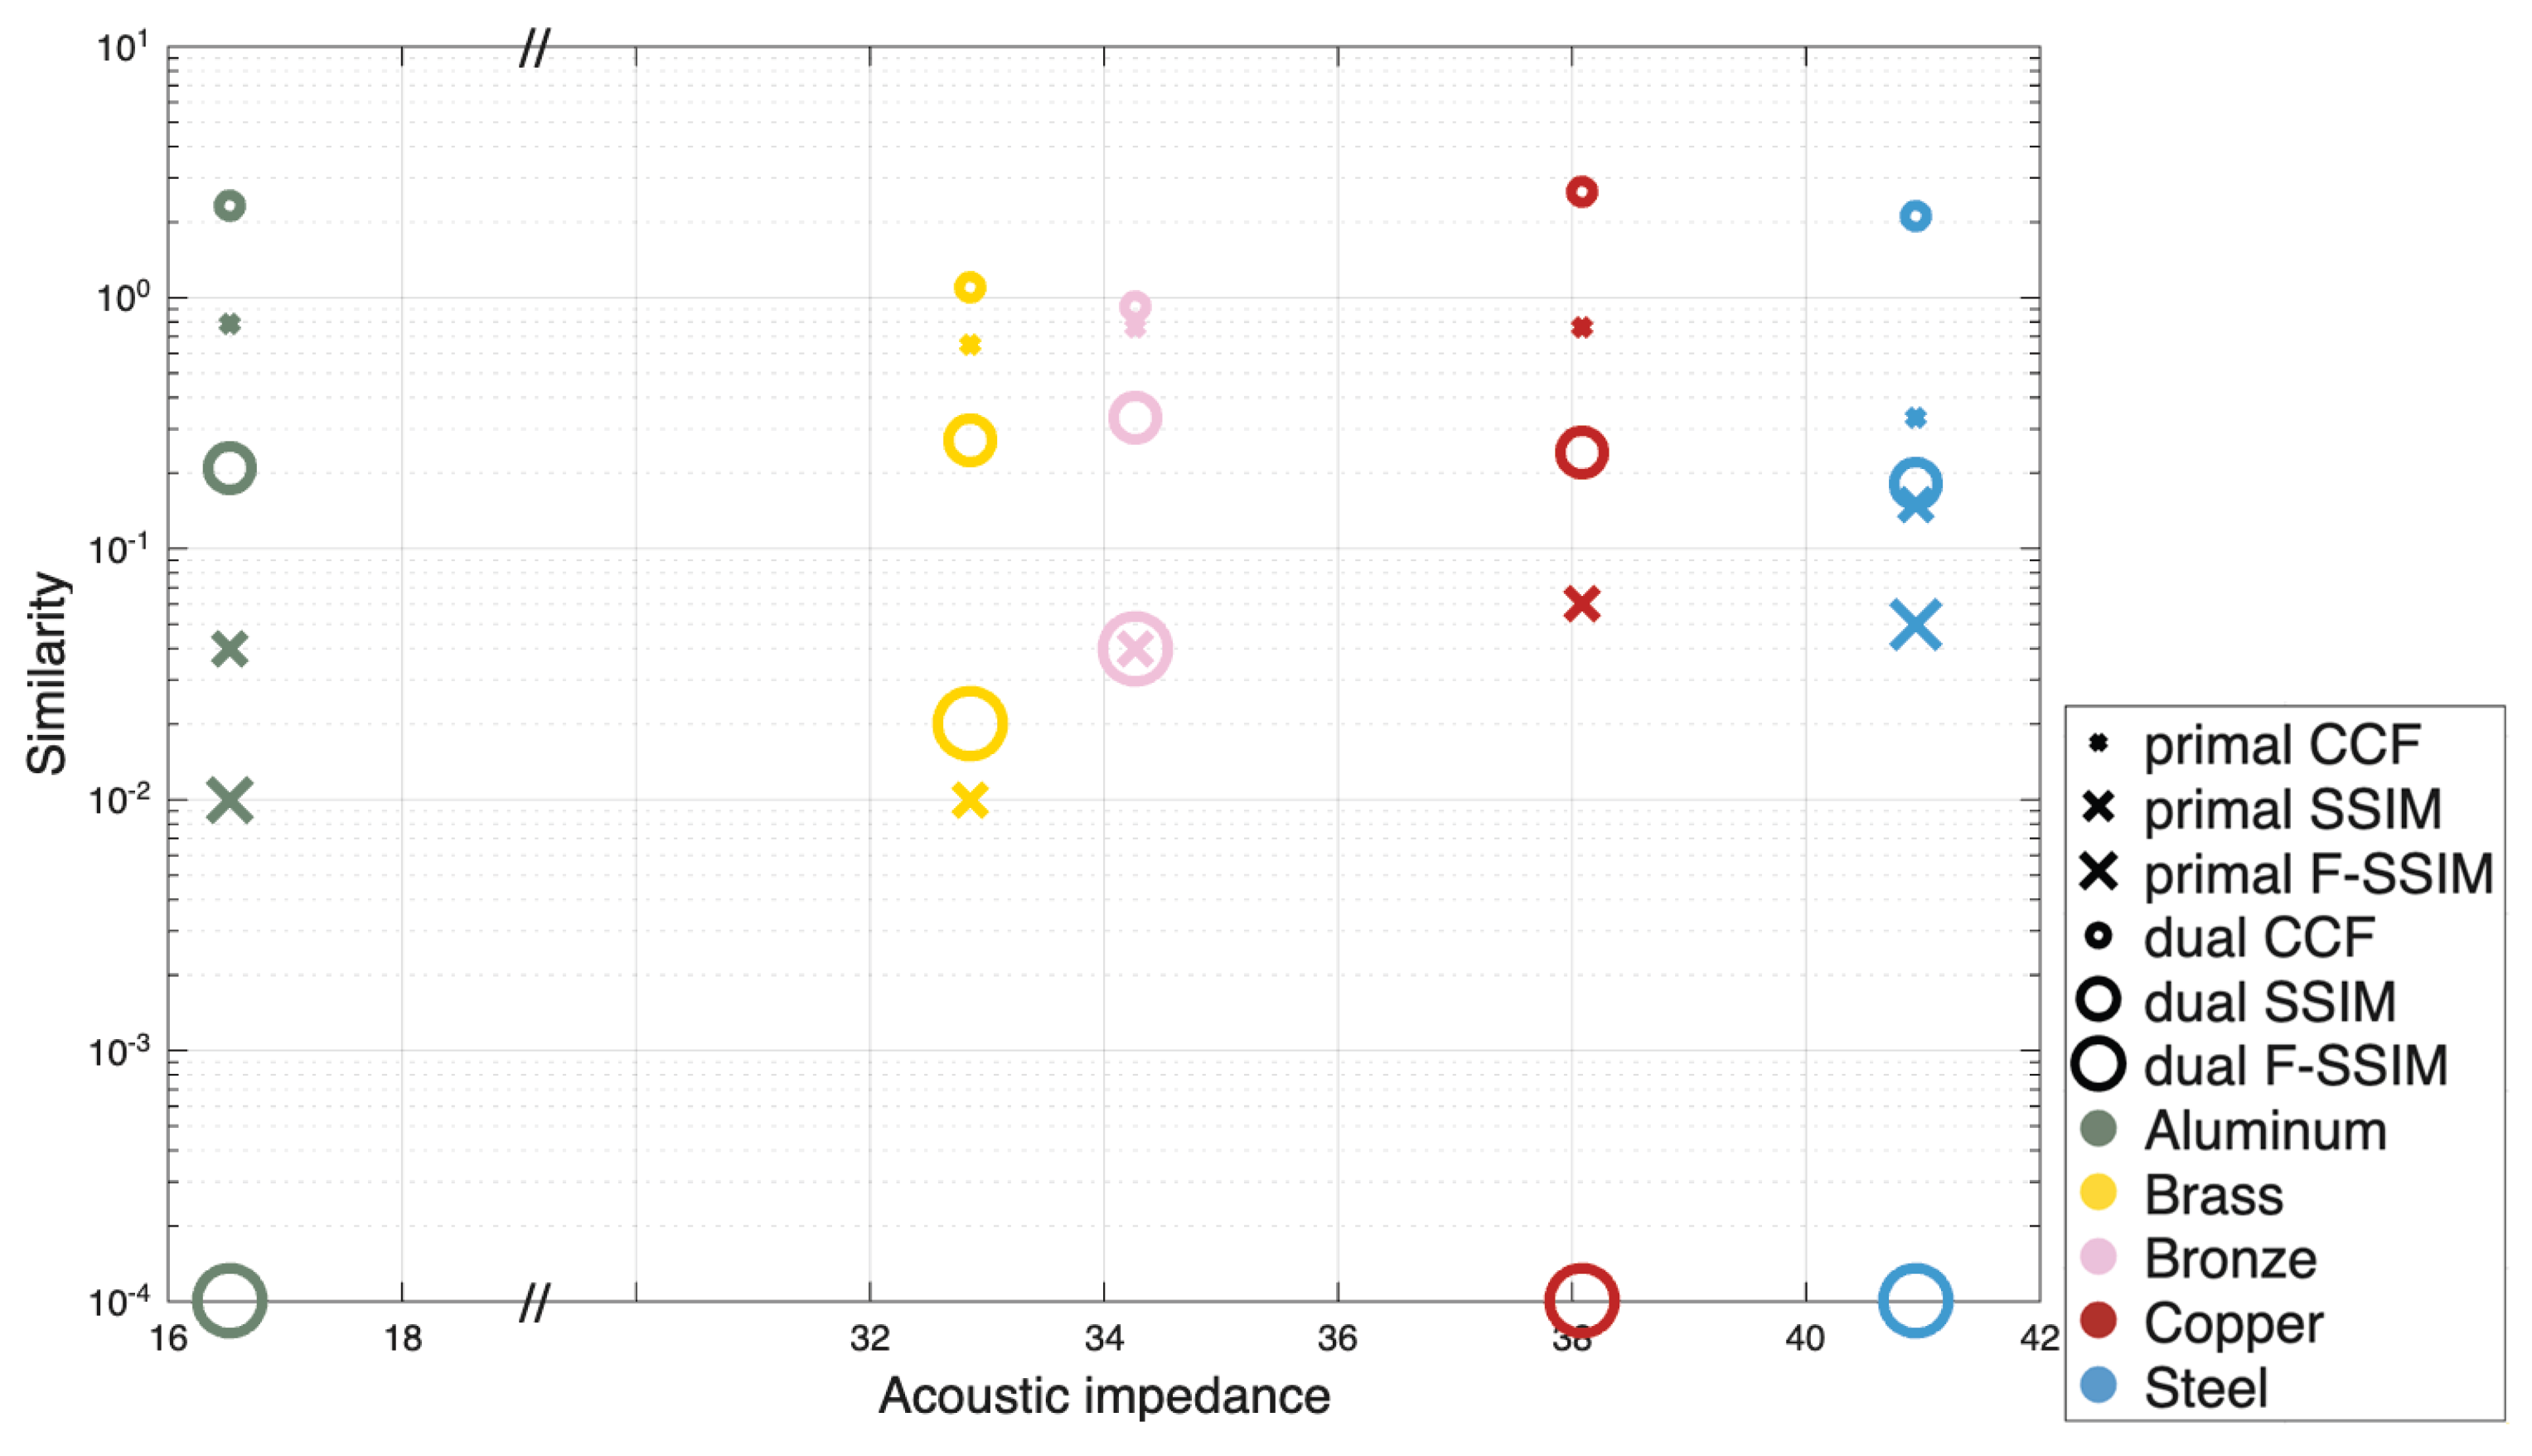

Table 1.
Density and sound velocity of the five metal cylinders in a water tank, ordered by acoustic impedance.
Table 1.
Density and sound velocity of the five metal cylinders in a water tank, ordered by acoustic impedance.
| Material | Density |
Sound Velocity |
Acoustic Impedance |
|---|---|---|---|
| Water | 1.0 | 1.48 | 1.48 |
| Aluminum | 2.7 | 6.119 | 16.52 |
| Brass | 8.0 | 4.358 | 34.86 |
| Bronze | 8.3 | 4.369 | 36.26 |
| Copper | 8.6 | 4.662 | 40.09 |
| Stainless steel | 7.6 | 5.650 | 42.94 |
Table 2.
Density and sound velocity of the five metal cylinders.
| Material | Acoustic Intensity Reflection Coefficient |
Thermal Diffusion Length |
|---|---|---|
| Aluminum | 69.8 | 5.2 |
| Brass | 84.4 | 3.3 |
| Bronze | 84.9 | 2.6 |
| Copper | 86.3 | 5.9 |
| Stainless steel | 87.1 | 1.1 |
Disclaimer/Publisher’s Note: The statements, opinions and data contained in all publications are solely those of the individual author(s) and contributor(s) and not of MDPI and/or the editor(s). MDPI and/or the editor(s) disclaim responsibility for any injury to people or property resulting from any ideas, methods, instructions or products referred to in the content. |
© 2025 by the authors. Licensee MDPI, Basel, Switzerland. This article is an open access article distributed under the terms and conditions of the Creative Commons Attribution (CC BY) license (http://creativecommons.org/licenses/by/4.0/).
Copyright: This open access article is published under a Creative Commons CC BY 4.0 license, which permit the free download, distribution, and reuse, provided that the author and preprint are cited in any reuse.


