1. Introduction
1.1. Overview
Protected areas represent a significant global strategy for mitigating biodiversity loss [
1,
2,
3], and to support contribute to climate change mitigation efforts [
4]. The provision of drinking water for urban areas is one of the benefits that populations, including those in distant regions, derive from protected areas [
5]. For instance, forests and woodlands located within protected natural areas significantly contribute to the quality of drinking water for urban populations, generating substantial economic and health benefits through their conservation [
6]. These ecosystem services further underscore the strategic importance of protected areas in international environmental policy. In this context, Target 3 of the Kunming-Montreal Global Biodiversity Framework (GBF), established under the United Nations Convention on Biological Diversity, aims to safeguard at least 30% of terrestrial, inland water, and marine areas by 2030.This is a goal explicitly enshrined in the European Union's 2030 Biodiversity Strategy [
7], which aims to protect at least 30% of the country's terrestrial and marine areas by designating them as protected areas; an objective in line with the United Nations' expectations, as set out in the Convention on Biological Diversity [
8].
In Italy, the system of protected areas increased significantly between 1960 and 2018, both in the number of sites established and in their territorial extent. Today, Italy counts 26 national parks covering a total area of just under 16,000 square kilometers, equal to about 5.3% of the national territory. These areas represent an environmental heritage of great importance, heterogeneously distributed along the peninsula and often located in contexts characterized by socio-economic fragility, yet at the same time of high ecological and landscape value.
Ecosystem services are the direct and indirect benefits that humans derive from ecosystems [
9,
10], and are commonly classified into four main categories: supporting, provisioning, regulating, and cultural services [
11]. Protected areas play a crucial role in ensuring the provision of these multiple ecosystem services that natural systems offer to society [
12,
13]. Among these are provisioning services such as food, access to fresh water, timber, and biomass [
14]; regulating and maintenance services such as carbon storage [
15], flood control, climate regulation, and protection against soil erosion [
16]; and cultural services including recreational use and aesthetic value [
17,
18]. Ultimately, protected areas provide essential socio-ecological benefits both to the local population and to the broader community [
19]. However, the ability of protected areas to deliver ecosystem services is increasingly challenged by anthropogenic pressures [
20]. Major threats include urbanization [
21], deforestation [
22], agricultural intensification [
23], pollution [
24], and the spread of invasive alien species [
25]. Changes in land use and land cover also strongly affect the structure and functioning of ecosystems, influencing ecological security [
26] and the capacity to provide ecosystem services [
27,
28,
29,
30,
31,
32].
At the international level, several studies have investigated the ability of protected areas to produce measurable changes both in environmental terms (forest cover, carbon sequestration, reduced fragmentation) and socio-economic terms (poverty, household income, employment) [
33,
34,
35,
36,
37]. For example, the study by [
37] found that the establishment of protected areas contributed to a 10% reduction in deforestation in Costa Rica between 1960 and 1997. [
34], on the other hand, analyzed the environmental and socio-economic impacts of three different Payment for Ecosystem Services (PES) programs implemented within two protected areas in northern Cambodia. The results of the study indicate that such instruments can effectively support the achievement of conservation goals while also generating benefits for local communities.
The effectiveness of protected areas may also depend on various factors, including territorial location, local governance, and the presence of management tools. In Italy, many national parks fall within so-called Inner Areas, characterized by geographic marginality and difficulties in accessing essential services [
38]. The term “Inner areas” is employed to denote regions that are characterised by a considerable distance from the primary hubs of supply for essential services, including but not limited to health, education and mobility. These territories are distinguished by the presence of significant environmental and cultural resources [
38]. The concept of peripherality, however, is a dynamic concept, which implies the absence of socio-economic connections and exclusion from political power in the decision-making process. This relational type of distance is further elaborated upon in the following section, drawing upon the work of [
39]. The Italian National Strategy for Inner Areas (SNAI) is predicated on the place-based approach [
40,
41], which is founded on the observation that the impact of public investments is highly differentiated at a local scale. The primary objective of SNAI is to reverse the negative demographic trend that is prevalent in Inner areas. In this regard, a long-term strategy is envisaged to address the persistent underutilisation of human, economic, cultural and environmental resources in these territories [
38]. [
20] highlights the strategic role of governance in ensuring the continuous supply of ecosystem services, both quantitatively and qualitatively. Effective park management could be enhanced by the use of spatial information [
42,
43], including mapping and modelling of ecosystem services [
44].
1.2. Spatial Framing
In Italy, conservation policy has its roots in the early decades of the twentieth century, when the first national parks were established: Gran Paradiso (1922), Abruzzo (1923), Circeo (1934), and Stelvio (1935) [
45]. These pioneering experiences, although embedded in a fragmented regulatory framework mainly oriented towards aesthetic-landscape protection, marked the beginning of a conservation pathway that would only be systematized several decades later. The real turning point came with Framework Law No. 394 of 1991 [
46], which introduced an organic system of protected natural areas. However, in addition to the conservation objective, there is the sustainable valorisation of environmental and cultural resources, which can be achieved through the promotion of economic activities, including sustainable tourism. Thanks to this legislative framework, the 1990s witnessed a rapid expansion of national parks, in line with Italy’s international commitments under the Convention on Biological Diversity [
8].
The total surface area of national parks, which in the 1960s amounted to less than 300,000 hectares, grew rapidly to exceed 1.5 million hectares in the 1990s, reaching approximately 1.68 million hectares in 2018 [
47,
48]. Currently, the 26 national parks cover about 5% of the national territory, while the entire system of protected areas—including regional parks, reserves, and Natura 2000 sites—extends over more than 20% of Italy’s surface, thus constituting one of the pillars of conservation policy [
47]. At the same time, the period 1960–2018 was characterized by wide-ranging socioeconomic and territorial transformations. Initially, mountain and inland areas experienced widespread depopulation, accompanied by agricultural abandonment and processes of natural reforestation. Subsequently, these territories underwent renewed valorization, through the development of high-quality extensive agriculture (PDO/PGI and organic products) and the growth of nature-based tourism [
47,
48,
49,
50]. Spatial analyses conducted using GIS have highlighted how long-term land cover dynamics are closely connected to variations in ecosystem services, confirming the role of national parks as true territorial laboratories of sustainability [
28].
At the European level, recent studies have documented trends in ecosystem services linked to land use changes between 2000 and 2018, showing significant variations in the provision of provisioning, regulating, and cultural services depending on land cover distribution [
51]. Particular attention has been devoted to ecosystem service flows from mountain areas, as in the case of the Alps, which underscore the functional interconnections between supply areas and demand areas [
52].
Within the Italian socioeconomic context, nature-based tourism represents a crucial driver. In the municipalities located within national parks alone, around 20 million tourist overnight stays were recorded in 2016 [
47], with an estimated economic impact ranging between €5 and €5.5 billion annually and over 100,000 jobs in the supply chain prior to the pandemic [
53]. At the global level, nature-based tourism accounts for about 10% of GDP and employment, confirming its strategic importance [
54,
55]. At the same time, agricultural intensification remains one of the main threats to global biodiversity, being responsible for substantial terrestrial habitat loss [
56].
The analysis of land use and land cover changes in Italian national parks between 1960 and 2018 highlights complex and interconnected dynamics. On the one hand, there has been a transition from traditional agricultural and pastoral landscapes towards scenarios characterised by forest expansion and the transformation of farming practices, a phenomenon observed in many European mountain contexts [
57,
58]. On the other hand, the growing relevance of nature-based tourism has emerged, playing a dual role as both an economic driver and a lever for the valorisation of natural capital, often in synergy with multifunctional agriculture [
59].
The observed transformations significantly affect the provision of ecosystem services. Reforestation and sustainable soil management have strengthened regulating services, such as carbon sequestration and hydrogeological stabilization [
30,
51]. At the same time, cultural and provisioning services have become more prominent, supported by high-quality agricultural products and nature-based tourism experiences [
60]. These dynamics highlight the existence of trade-offs and synergies between ecological, economic, and social dimensions: while forest expansion enhances regulating services, multifunctional agriculture and tourism sustain cultural and economic services.
In parallel, regulatory evolution and the expansion of protected areas intersect with demographic dynamics within national park territories. Following significant growth in the period 1951–1981 [
45], from the 1990s onwards a progressive decline of the resident population has been observed: between 1991 and 2012, the population decreased on average by 5.6%, compared to a national increase of 5.1% [
47,
61]. This depopulation, coupled with aging and low birth rates, reflects the structural fragility of local communities, which nonetheless remain custodians of environmental and cultural heritage of extraordinary value.
In conclusion, regulatory evolution, the expansion of protected areas, and demographic trends outline a framework in which Italian national parks function as complex socio-ecological laboratories. They play an essential role in biodiversity conservation and in the provision of ecosystem services, while simultaneously requiring governance strategies capable of integrating environmental protection with the sustainable development of local communities [
28,
53].
1.3. Objective of the Paper
The objective of our study is to investigate whether the transformations observed in Italian National Parks between 1960 and 2018 can be attributed to a specific “park effect” or rather represent the outcome of broader territorial dynamics affecting central and inner areas. To this end, we analysed long-term changes in land use and land cover (LUMCs) and variations in ecosystem services (ES), both inside and outside park boundaries, taking into account the SNAI delimitation. Our research thus aims to distinguish the actual contribution of protected areas from general national trends, providing useful insights for conservation policies and territorial governance.
2. Materials and Methods
Starting from previous studies [
29,
30,
62], and in order to define if it can be observable a park effect or if parks transformation is consequence of a general nation trend linked to the dynamics of inner and central areas, this study the methodological approach was based on the following step (
Figure 1)
Step 1 -LUMCs multitemporal changes inside and outside NPs
Looking forward to a multi- temporal analysis of land use and cover changes, the used data have been derived by the Italian Touring Club cartography (TCI- 1960) and the Corine Land Cover (CLC) database for 1990 and 2018. The land use data at level III of the CLC hierarchical classification were aggregated into 9 land-use macro-classes (LUMCs): (i) urban, (ii) arable land, (iii) permanent crops as vineyards, orchards and olive groves, (iv) pastures, (v) heterogeneous agriculture, (vi) forests, (vii) scrublands, (viii) sparse vegetation, (ix) wetlands and water bodies. In order to further investigate whether changes in land use depend on a park effect rather than dynamics common to inland areas, this study analysed the dynamics of macroclasses in the following SNAI areas: central areas or hubs (A), inter-municipal hubs (B), belt (C), intermediate (D), peripheral (E), ultra-peripheral areas (F). Areas have been investigated both as absolute values(km2) both as growth rate (%), and a comparison between inside and outside areas have been carried out.
Step 2 – Multitemporal quantification of ecosystem service provision inside and outside NPs
In line with the benefit transfer approach [63,64;65;66,67], unit economic coefficients (€/ha) for the ecosystem services supply associated with land use/land cover were extracted from scientific literature.These coefficients have been multiplied by the specific areas of the macroclasses in each park, in order to obtain i) a snapshot of the ESs supply in each reference year and ii) a basis for the comparative analysis of ESs changes between 1960 - 1990 and 1990 - 2018. The ecosystem services analysed are: provision of agricultural products, fodder, timber and mushrooms (provisioning services) and regulation of global climate, air and water purification, groundwater recharge, erosion protection and flood mitigation (regulating services).
Area of Study
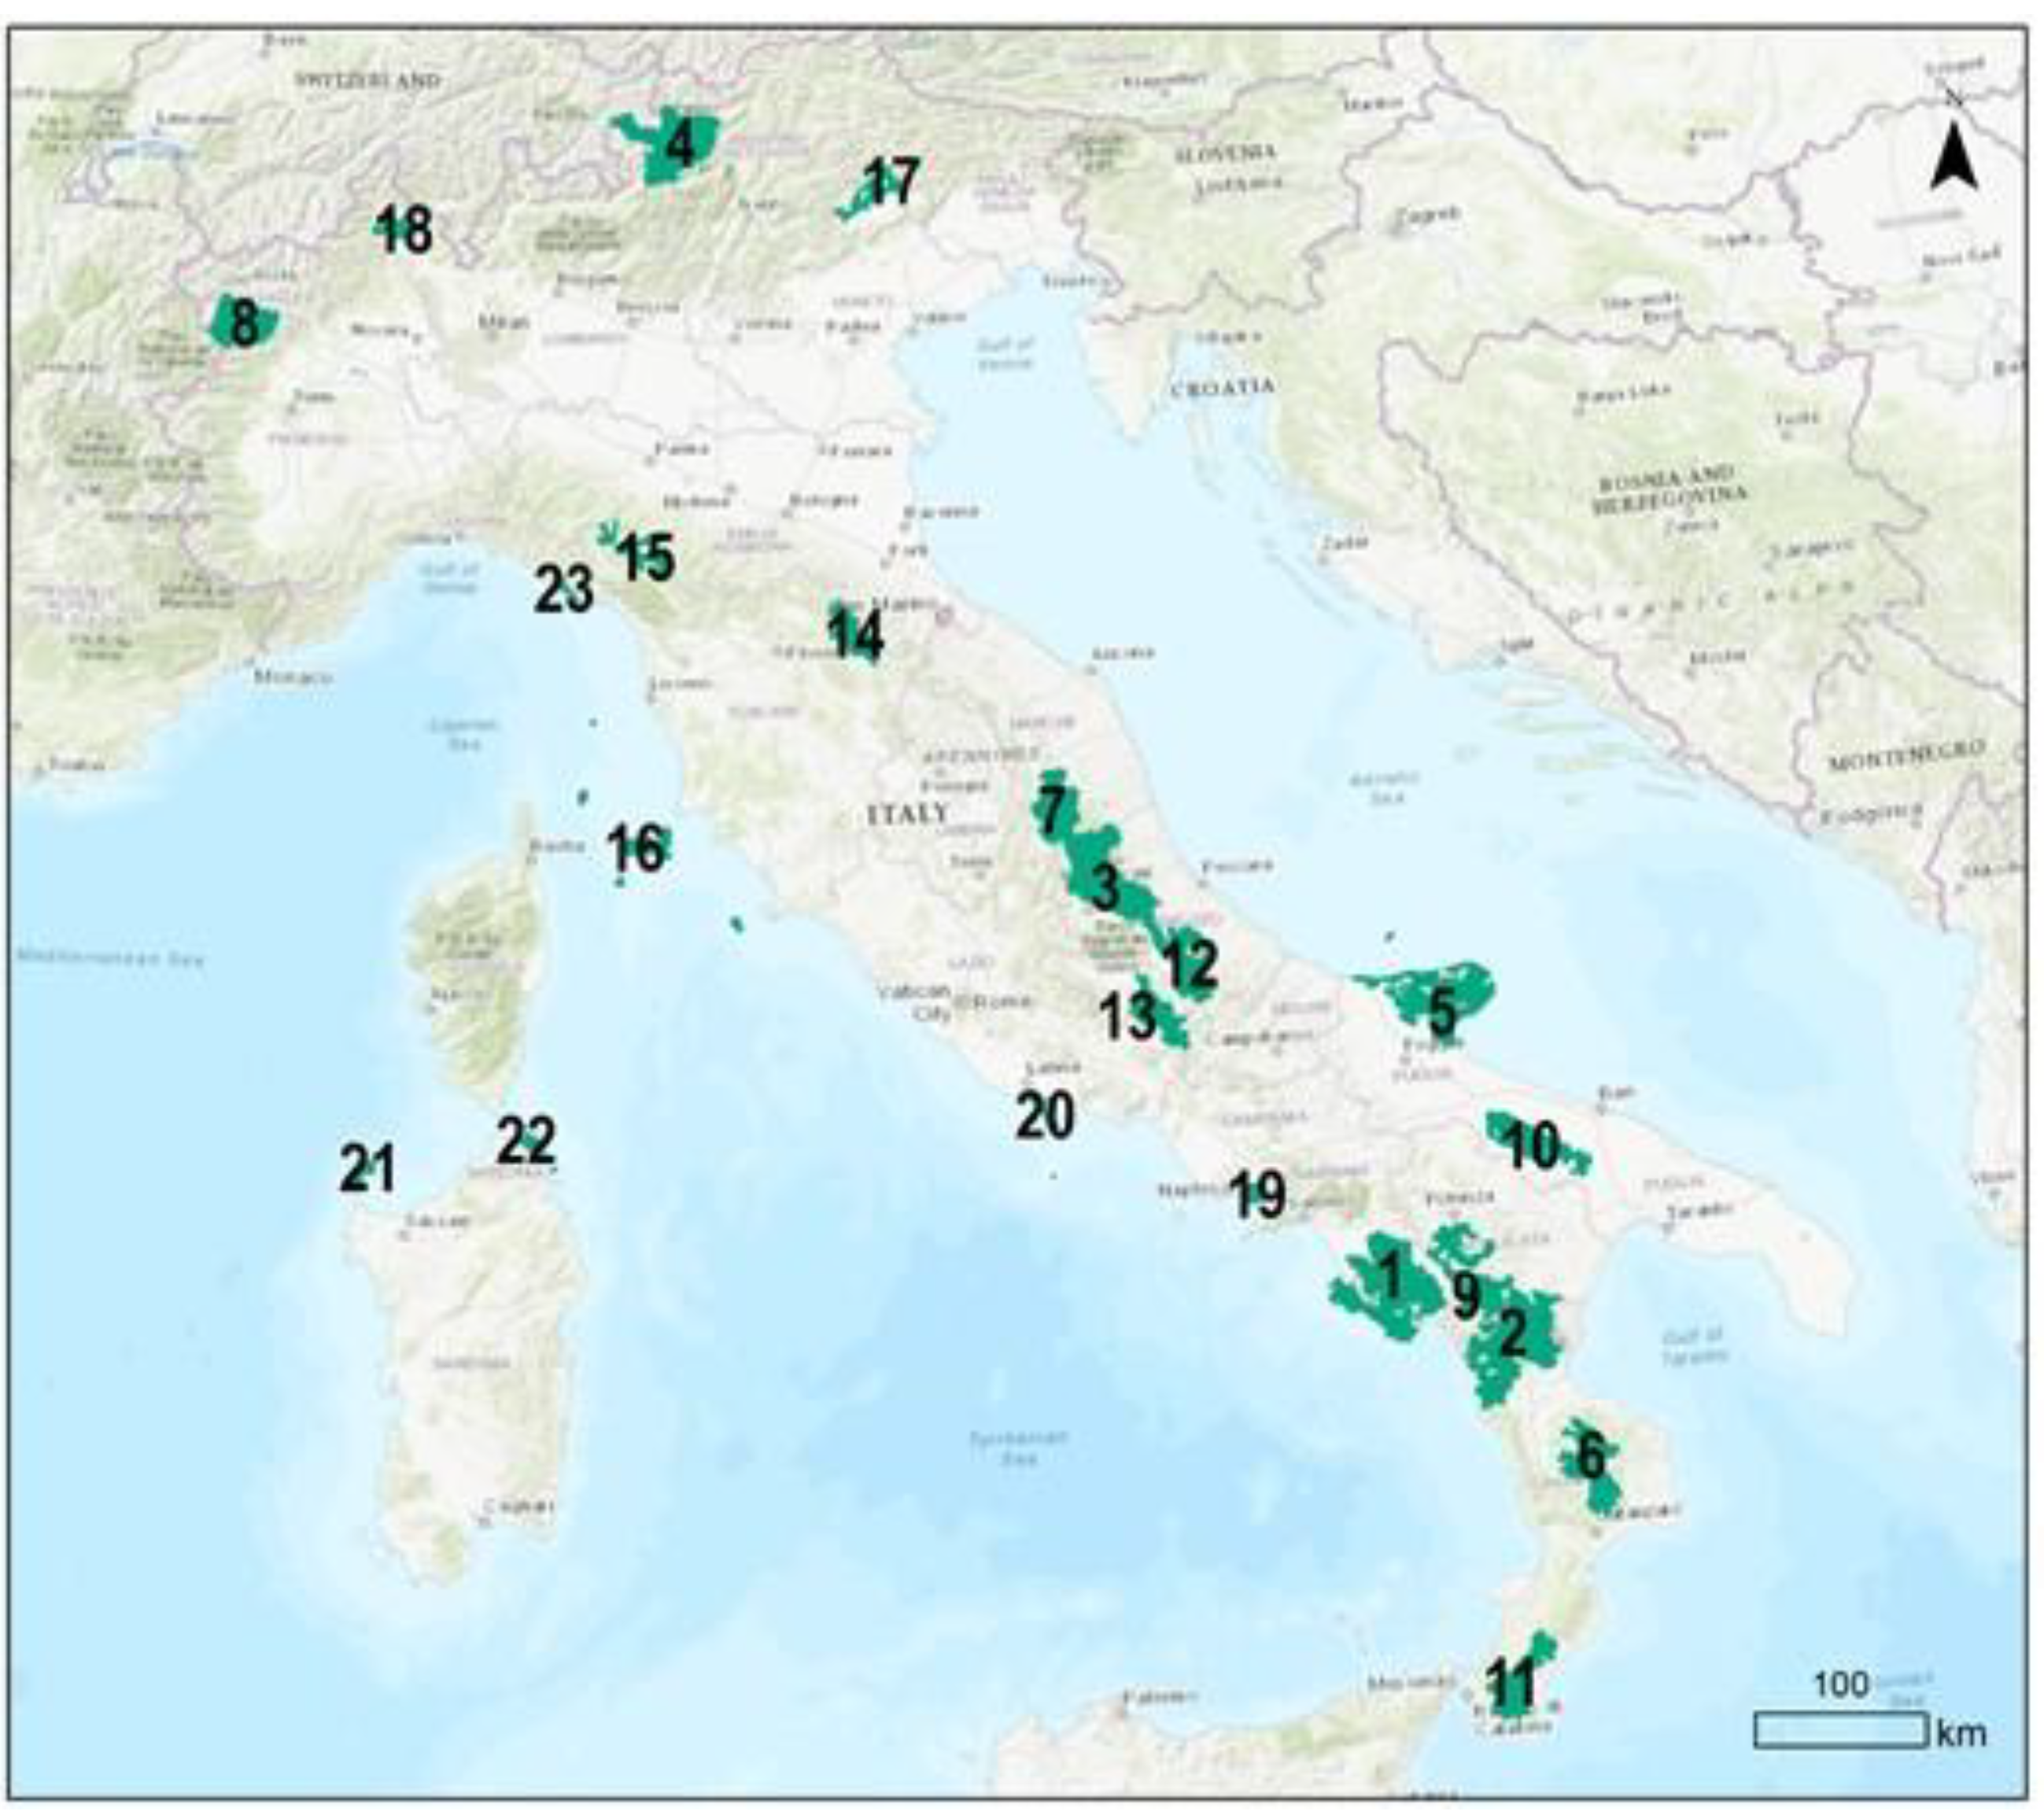
The total territory of the 23 Italian NPs considered in this study (
Figure 1) covers about 1.4 million hectares, mainly located in mountain environments such as the Alps and the Apennines. They are located in all Italian regions except Friuli Venezia Giulia and Sicily. Calabria and Abruzzo are the regions with the highest density of parks: in fact, in Calabria there are the Pollino, Aspromonte and Sila; in Abruzzo the Lazio-Abruzzo-Molise park, the Gran Sasso and the Lega mountains and, finally, the Maiella. The analysis does not include the Matese National Park, the Portofino National Park, and the Pantelleria National Park, as they were recently established with provisional boundaries, nor the Gennargentu National Park, which has been formally established but is not yet operational.
The vector information layer of NPs has been downloaded from the Official List of Protected Natural Areas updated in 2010. Based on these data, the largest parks are: Cilento e Vallo di Diano (1840 km²), Pollino (1728 km²), Gran Sasso e Monti della Laga (1418 km²). The LUMCs analysis has been carried out exploring the general composition of all parks in 2018 and, which pointed out that 46.5% is represented primarily by forests and 26.1% by scrubs. The rest of the LUMCs is representative of a scarse coverage rate. On the other hand, looking at the territory outside the NPs, it emerged that forests are not the prevailing use, and that is exceeded by arable land (respectively 25.4% and 28.7%).
Table 1 illustrates the classification of Italian national parks into five clusters (historic, alpine, Apennine, tourist, and southern agricultural) [
62], reflecting different phases of establishment from 1922 to the present. Historic parks represent the original core of conservation, while more recent ones respond to emerging needs of protection and socio-economic development. The main land cover types range from forests and shrublands to agricultural areas and sparse vegetation, highlighting the ecological specificities of each context. This distribution emphasises the biogeographical differences and conservation challenges distinctive to each cluster.
3. Results
3.1. Multi-Temporal Analysis of Land-Use Macroclasses (LUMCs) Changes in NPs
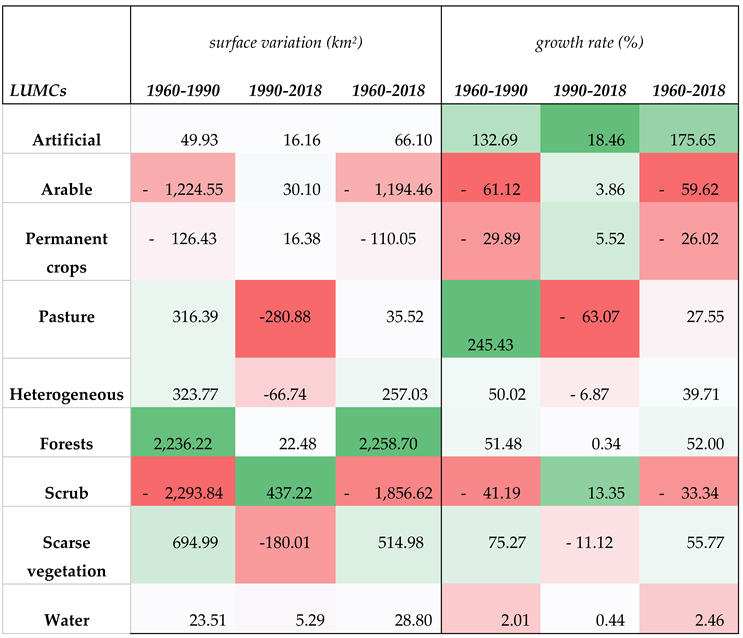
With regard to changes in land use macroclasses (LUMCs) observed in national parks, several dynamics can be highlighted (
Table 2). A common thread running through all LUMCs dynamics is that the most significant changes occurred in the first period rather than the second. The general trends between 1960 and 2018 show (i) an increase in artificial fabrics of 66.1 km² (+175.6%); (ii) growth in forests and sparse vegetation of 2,258.7 km² and 514.9 km² (respectively +52.0% and +55.7%); an increase in heterogeneous areas and pastures of 35.5 km² and 257.0 km² (corresponding to +39.7% and +27.5%). As regards agricultural areas, while the latter two categories are undergoing expansion, analysis of the data shows a sharp decrease in arable land, that reduces by -1,194.4 km² (-59.6%), and, to a lesser extent, in permanent crops thet decline by 110.0 km² (-26.0%).
Examining the differences between the first and second periods in LUMCs with major surface changes between 1960 and 2018, it emerges that forests, of the total growth, increased in the first period, recording a +51.4% (+2,236.2 km²), opposed to the insignificant variation in the second time period. Alta Murgia is the NO with major increases up to 1990, while Gargano recorded major growth in the second period. Scrublands underwent a significant decrease over the entire period; nevertheless, in the first period, it fell sharply, while in the second, it showed a slight rise (-41.1% opposed to +13.3%). Observing arable land changes, data analysis shows a strong decrease of -61.1% in the first period, opposed to an irrelevant growth in the second period. The NP where the major decreases in arable lands occurred between 1960 and 1990 is in Cinque Terre, while between 1990 and 2018 in Asinara. Soil sealing, which is one of the most impactful processes of land use change, has slowed down in recent times, whereas in the early stages it was much more significant: in fact, of the total sealed soil, 76% (49.9 km² ) has been built between 1960 and 1990, while the remaining 24% (16.1 km²) refers to the second time period. The few NPs where urbanisation is stronger in the second period than in the first are Alta Murgia, Cilento, and Vallo di Diano, with growth rates of, respectively, +2,595.2% in the first period compared to +150.8% in the second; +76.6% compared to +56.2%.
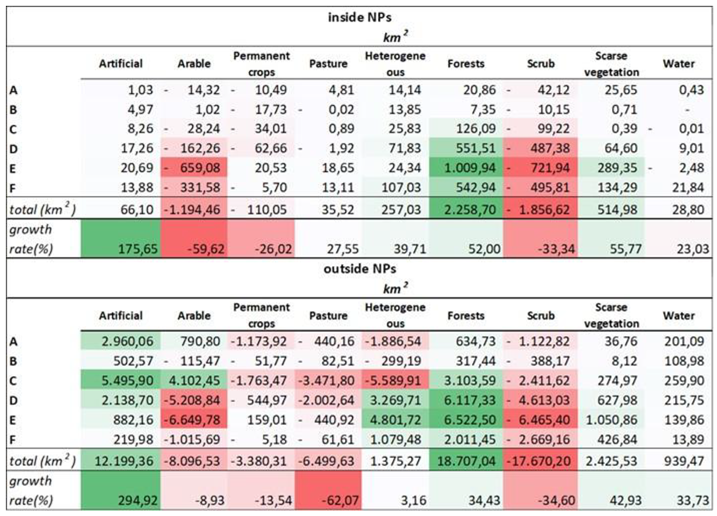
In order to verify the hypothesis that land use change dynamics within parks are aligned with those of SNAI areas, data from inside and outside the parks were processed and reported in the table below (
Table 3). The results show that the changes in the parks are only partly linked (in the inland areas) to the changes observed in the areas outside the parks. In the central areas, the changes inside and outside the parks diverge in some cases, such as in arable land, hill farms and heterogeneous areas.
Data representing the 1960 - 2018 changes, shows that the expansion of forests in NPs took place in all SNAI areas with an overall increase of 2,258.7 km², has occurred especially in peripheral areas (+1,009.9 km²). Outside the perimeter of the parks, forests are increasing particularly in the more inland areas, but in this case more significantly also in the intermediate areas (+6,117.3 km² and +6,522.5 km²). Looking outside parks, agricultural arable lands have increased mostly in the belts SNAI areas and, in a lower manner, in hubs (+4,102.4 km² and +790,8 km² ). Inside NPs, contrarywise, arable land have experienced a decline in all SNAI areas, except for an insignificant increase of 1 km² in inter-municipal centres.
Looking at the growth rate values and comparing the results inside and outside NPs, it is evident that forests have been successfully encouraged and incremented in the parks (+52.0%) than in the rest of the Italian territory (+34.43%). A similar trend regards heterogeneous agricultural areas that grow by 39.7% in parks compared to 3.1% outside parks. As it regards the scrublands, in markedly declining, the highest decreases are concentrated in inner areas and in particular in peripheral SNAI areas both in NPs both outside. Artificial soil extension occurred evidently outside NPs (+12,199.3 km²). Percentage growth is also significantly higher outside the parks (+249.9%). Another of the most notable differences concerns arable land and pastures. The analysis highlighted that the decrease in arable land was more pronounced in the parks (-1,994 km²) than in the rest of the territory (-8,093.5 km²). In terms of percentage change, this represents a -59.6% compared to 8.93%. Finally, looking at the results for pastures, the data show a slight increase (+27.5%) in parks, in contrast to the sharp decline in the rest of the territory (-62,0%).
Changes in land use inside and outside parks coincide, in terms of sign and relative intensity, mainly in inner SNAI areas. Conversely, for central areas, this convergence is not entirely observable: in fact, urban areas are clearly growing outside parks, especially in belt areas, while in the case of parks, they are prevalent in peripheral areas; arable land is decreasing in parks and increasing outside them, orchards are decreasing slightly in parks and decreasing sharply outside them, pastures are in sharp decline outside parks and remain more or less stable in central areas beyond parks.
3.2. Economic Value of Ecosystem Services in National Parks: Amount and Changes Over Time
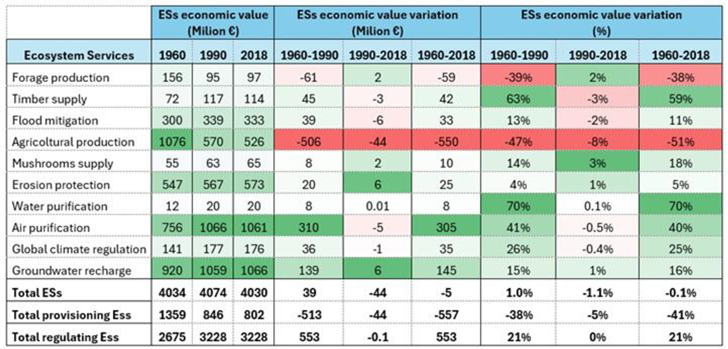
As shown in the results reported in
Table 4 below, in the last year available for analysis (2018), the territories included in national parks provided ecosystem services worth approximately €4030. In particular, regulating services accounted for approximately 80% of the total (€3228 million/year). Among the most significant regulating services in terms of economic value are groundwater recharge (€1066 million/year), air purification (€1061 million/year) and erosion protection (€573 million/year). Among the provisioning services, agricultural production remains significant, with an estimated value of approximately €576 million/year.
Changes in LUMC over time have led to changes in the supply of the ecosystem services analyzed. In general, the total economic value of ES provided by NPs increased slightly between 1960 and 1990 (+0.34%) and decreased slightly between 1990 and 2018 (-0.45%), with the total value of ES remaining just above €4 billion per year.
The results show greater differences when the type of services is distinguished: a marked decrease in provisioning services (-41% from 1960 to 2018) and an increase in regulating services (+20% from 1960 to 2018). Consistent with the findings on land use changes, it should be noted that the most significant changes for all services surveyed occurred between 1960 and 1990 (+21% in regulating ESs and -38% in provisioning ESs), while between 1990 and 2018 the changes were much less significant (substantial stability of regulating ESs and 5% decrease for provisioning ESs.
By analysing the absolute values of the single services and their fluctuation over time, it can be noted that, among the three ESs with the greatest weight in the three years considered, groundwater recharge and air purification have increased the overall value of the parks over time (from €920 million to €1066 million and from €756 million to €1061 million, respectively), erosion protection has grown by €547 million to €573 million, while agricultural production, which accounted for a large part of the supply in 1960, halved in value from €1076 million to €526 million.
Looking at the economic growth rate, the data show that in the first period there was a significant decline in agricultural production of up to €506 million (-45%) compared to a more modest loss of €44 million in the second period (-8%). Fodder production also fell sharply in the first period, by €61 million (-39%), while in the second period it recorded a very small increase of €2 million (+2%). Looking at the increase in ES, It emerges that the most significant percentage changes over the entire period were achieved by water purification (+70%), timber supply (+49%) and air purification (+40%), all driven by changes that occurred mainly in the first period analyzed. It should be noted that over the entire period analyzed, only agricultural and fodder production show a net decrease, while the other ES grow.
4. Discussion
Results of the first step of our methodology pointed out that land use composition in parks is different compared to the territory outside them: in fact, NPs, are prevalently forested, while outside protected areas, arable land and forests account for a similar percentage. Changes in LUMCs inside and outside parks coincide, in terms of sign and relative intensity, mainly in inner SNAI areas; conversely, for central areas, this convergence is not entirely observable: in fact, urban areas are clearly growing outside parks, especially in belt areas, while in the case of parks, they are prevalent in peripheral areas; arable land has decreased in parks and increased outside them, orchards have decreased slightly in parks and decreased sharply outside them, pastures undergo in sharp decline outside parks and remained more or less stable in central areas beyond parks. In conclusion, observing the changes that have taken place, it can be affirmed that the park effect is particularly evident in central areas, while in inner ones the dynamics are similar in most LUMCss.
The first step of the analysis, i.e. multi-temporal analysis of land use changes, showed the most relevant phenomena mainly concerned forestation, especially of inland areas, and the decrease of shrublands. This dynamic is in line with what has been studied in the literature [
68,
69,
70] regarding the socio-economic dynamics of depopulation of inland areas and consequent abandonment of traditional agricultural and pastoral activities [
71]. The “park effects” observed in this step of the study highlighted two fundamental elements: on the one hand, the expansion of urban areas was strongly arrested in all NPs, especially in those that had seen the greatest soil sealing in the first interval On the other, the abandonment of agriculture and spontaneous forestation, not necessarily attributable to the establishment of parks but rather to the socio-economic dynamics of the post World War II period [
72] have eroded the typical heterogeneity of Mediterranean cultural landscapes.of many NPs [
68].
The value of ES generated by parks in 2018 amounts to approximately 4.13% of the total value of services at national level (over 97 billion, according to the study by [
29], which is in line with the percentage of national territory covered by national parks (4.92% in 2018), although we would probably have expected a higher percentage. This is probably due to the fact that, in general, much of the economic value of services is attributable to the agricultural sector, which in turn is not very significant within national parks compared to the entire nation (as of 2018, only about 8% of national agricultural land is included in national parks). The results on the supply of ES in the NPs in fact clearly show (as expected) a vocation for the provision of regulating ES rather than provisioning ESs. This orientation has become more pronounced over time, mainly due to the abandonment of agriculture. With regard to the territorial dynamics analysed, these led to a decrease in provisioning services and an increase in regulation services throughout the entire period from 1960 to 2018. These changes can be interpreted as “expected”, considering the role that protected areas play in relation to the territory, namely promoting conservation over (agricultural) exploitation. However, net of the above, if we also consider the date of establishment of the parks, a revealing pattern emerges: after a considerable increase in the period 1960-1990 (with only four “historic” parks active), regulation services slowed down considerably (almost stabilizing) in the subsequent period 1990-2018, when 22 new parks were established. This pattern is noteworthy because we would have expected a prosecution of the upward trend in ecosystem services and certainly not such a marked slowdown. This phenomenon may depend on various causes, including delays in the implementation of management plans, financial limitations or the achievement of the maximum potential supply of ecosystem services within the park. This aspect certainly needs further investigation.
The approach adopted in this study provides an innovative contribution as it combines a long-term temporal perspective (1960–2018) with a spatial comparison inside and outside national parks, stratified by SNAI classes. This design makes it possible to assess not only the role of national parks in territorial management between inner and central areas, but also the effectiveness of governance in conserving ecosystems. Our contribution integrates spatial and temporal dynamics with the monetary valuation of ecosystem services, thereby enriching a scientific debate that often relies on shorter temporal horizons or on specific indicators [
73,
74]. The diachronic analysis of long-term changes in land use and land cover transformations highlights the increase in regulating services within parks and the contraction of provisioning services, providing an innovative interpretative key for ongoing territorial transition processes.
Our results are consistent with international literature. For instance, [
75] report similar trade-offs in Alpine contexts, where provisioning services are more evident outside protected areas and regulating services prevail inside them. Furthermore, [
76] show how protected areas can generate cultural and recreational benefits with direct effects on community well-being, thus integrating ecological and economic dimensions. In addition, our findings support previous evidence that the effectiveness of protected areas is not homogeneous but varies along gradients of accessibility and anthropogenic pressure: in more accessible areas subject to higher pressures (central areas), the “park effect” is more evident, whereas in marginal areas (inner areas), land use dynamics are predominantly driven by broader socio-economic factors [
77]. Overall, this study strengthens empirical evidence on the role of national parks as multifunctional natural infrastructures, capable of integrating conservation goals with territorial cohesion and community well-being.
5. Conclusions
This research is based on a diachronic analysis of land-use/land-cover transformations and the associated variation of ecosystem services (ES) in Italian National Parks between 1960 and 2018. The results highlighted the interaction between broader dynamics affecting inner areas and possible effects linked to the establishment of protected areas. However, the interpretation of these results must consider several limitations. First, we relied on the most recent park boundaries, without accounting for their historical evolution. Second, the study did not include the internal zoning (A, B, C, D zones), which defines different levels of protection and land-use practices and may strongly influence territorial dynamics. A further limitation concerns the delays between the formal establishment of the parks and the approval and implementation of their management plans, which are indispensable instruments for territorial governance. In many cases, these plans were adopted only years or even decades later (e.g., the Sila National Park), thus reducing the ability of protected areas to promptly influence transformation processes.
At the same time, these limitations provide relevant insights for the governance of protected areas. In particular, there is an urgent need for dynamic and updated monitoring tools that take into account the evolution of park boundaries and internal zoning, in order to evaluate more precisely the effectiveness of conservation policies [
30]. Furthermore, the integration of park management plans with other territorial policies, especially the Italian National Strategy for Inner Areas (SNAI), represents a necessary condition for harmonising conservation objectives with socio-economic development goals. Previous studies have shown that an integrated reading of territorial transformations, based on the interplay between natural, social, and economic capital, can significantly enhance the effectiveness of sustainability strategies [
30]. At the same time, innovative governance models are needed, capable of combining public expenditure with private payments for ecosystem services, in order to mobilise new resources and foster shared responsibilities [
78].
In conclusion, Italian National Parks represent strategic socio-ecological laboratories, where the continuous interaction between natural, social, and economic capital generates flows of benefits with both local and global relevance [
28]. To fully realize their potential, more timely, dynamic, and integrated management is required. Only in this way can National Parks evolve from simple conservation strongholds into true engines of territorial resilience and social cohesion, as already highlighted by recent studies on the effectiveness of protected areas in the Italian context [
79,
80], with an increasingly strategic role in the wider Mediterranean and European framework.
Italian national parks have a strategic potential not only as protected natural areas but also as drivers of territorial resilience and social cohesion, capable of significantly contributing to the environmental, economic and social sustainability goals (Agenda 2030). To improve the management of protected areas, greater coordination among territorial policies, more effective implementation of management tools (park plans), and the adoption of innovative governance strategies involving all stakeholders are considered essential, promoting a lasting balance between environmental protection and sustainable development.
Author Contributions
: Conceptualization, D.M. and M.P.; methodology, D.M., M.P., A.M. and A.B.; software, A.B. and S.P.; formal analysis, A.B. and S.P.; investigation, A.B., A.M. and M.P.; data curation, A.B. and A.M.; writing—original draft preparation, A.B., M.P., A.M. and V.G. writing—review and editing, M.P., A.M., A.B., S.P and V.G.; visualization, A.B. and S.P.; supervision, D.M., A.M. and M.P. All authors have read and agreed to the published version of the manuscript.
Funding
This research received no external funding.
Data Availability Statement
The data presented in this study are available on request from the corresponding author.
Conflicts of Interest
The authors declare no conflict of interest.
Abbreviations
The following abbreviations are used in this manuscript:
| LUMCs |
Land-use macro-classes |
| EC |
Ecosystem services |
| SNAI |
Italian National Strategy for Inner Areas |
| GBF |
Global Biodiversity Framework |
| PES |
Payment for Ecosystem Services |
| CLC |
Corine Land Cover |
| GDP |
Gross domestic product |
| NPs |
National parks |
References
- Velazco, S.J.E.; Bedrij, N.A.; Rojas, J.L.; Keller, H.A.; Ribeiro, B.R.; De Marco, P. Quantifying the role of protected areas for safeguarding the uses of biodiversity. Biol. Conserv. 2022, 268, 109525. [Google Scholar] [CrossRef]
- Leroux, S.J.; Krawchuk, M.A.; Schmiegelow, F.; Cumming, S.G.; Lisgo, K.; Anderson, L.G.; Petkova, M. Global protected areas and IUCN designations: Do the categories match the conditions? Biol. Conserv. 2010, 143, 609–616. [Google Scholar] [CrossRef]
- Sobhani, P.; Esmaeilzadeh, H.; Dinan, N.M. Prioritization and valuation of ecosystem services in protected areas. J. Nat. Conserv. 2025, 84, 126804. [Google Scholar] [CrossRef]
- Watson, J.; Dudley, N.; Segan, D.; et al. The performance and potential of protected areas. Nature 2014, 515, 67–73. [Google Scholar] [CrossRef]
- WWF. Così le zone umide sane creano benefici per l'uomo. Available online: https://www.wwf.it/pandanews/ambiente/zone-umide-sane-creano-benefici-per-uomo (accessed on 15 August 2025).
- Dudley, N.; Stolton, S. Running Pure : The Importance of Forest Protected Areas to Drinking Wate; World Bank Publications - Books, The World Bank Group, 2003. [Google Scholar]
- European Commission. EU Biodiversity Strategy for 2030: Bringing Nature Back into our Lives; Publications Office of the European Union: Bruxelles, Belgium, 2021. [Google Scholar]
- UN. Convention on biological diversity (CBD). 1992: 79.
- Díaz, S.; Demissew, S.; Carabias, J.; Joly, C.; Lonsdale, M.; Ash, N.; Larigauderie, A.; Adhikari, J.R.; Arico, S.; Báldi, A.; et al. The IPBES Conceptual Framework — connecting nature and people. Curr. Opin. Environ. Sustain. 2015, 14, 1–16. [Google Scholar] [CrossRef]
- Silvestri, S.; Zaibet. L.; Said, M.J.; Kifugo, S.C. Valuing ecosystem services for conservation and development purposes: A case study from Kenya. Env. Sci. Policy 2013, 31, 23–33. [Google Scholar] [CrossRef]
- Millennium Ecosystem Assessment (MEA). Ecosystems and Human Well-being: Synthesis, 2005.
- Hummel, C.; Provenzale, A.; van der Meer, J.; Wijnhoven, S.; Nolte, A.; Poursanidis, D.; et al. Ecosystem services in European protected areas: Ambiguity in the views of scientists and managers? PLoS ONE, 2017, 12, e0187143. [Google Scholar] [CrossRef] [PubMed]
- Bongaarts, J. , IPBES. Summary for policymakers of the global assessment report on biodiversity and ecosystem services of the Intergovernmental Science-Policy Platform on Biodiversity and Ecosystem Services. Popul. Dev. Rev. 2019, 45, 680–681. [Google Scholar] [CrossRef]
- Prowse, T.A.; O’Connor, P.J.; Collard, S.J.; Rogers, D.J. Eating away at protected areas: total grazing pressure is undermining public land conservation. Glob. Ecol. Conserv. 2019, 20, e00754. [Google Scholar] [CrossRef]
- Babbar, D.; Areendran, G.; Sahana, M.; Sarma, K.; Raj, K.; Sivadas, A. Assessment and prediction of carbon sequestration using Markov chain and InVEST model in Sariska Tiger Reserve, India. J. Clean. Prod. 2021, 278, 123333. [Google Scholar] [CrossRef]
- Emed Kauano, E.; Cardoso Silva, J.A.; Diniz-Filho, J.A.F.; Michalski, F. Do protected areas hamper economic development of the Amazon region? An analysis of the relationship between protected areas and the economic growth of Brazilian Amazon municipalities. Land. Use Policy 2020, 92, 104473. [Google Scholar] [CrossRef]
- Rossi, S.D.; Barros, A.; Walden-Schreiner, C.; Pickering, C. Using social media images to assess ecosystem services in a remote protected area in the Argentinean Andes. Ambio 2019, 49, 1146–1160. [Google Scholar] [CrossRef] [PubMed]
- Schirpke, U.; Scolozzi, R.; Da Re, R.; Masiero, M.; Pellegrino, D.; Marino, D. , Recreational ecosystem services in protected areas: a survey of visitors to Natura 2000 sites in Italy. J. Outdoor Recreat. Tour. 2018, 21, 39–50. [Google Scholar] [CrossRef]
- Puhakka, R.; Pitkänen, K.; Siikamäki, P. The health and well-being impacts of protected areas in Finland. J. Sustain. Tour. 2016, 25, 1830–1847. [Google Scholar] [CrossRef]
- Kalinauskas, M.; Shuhani, Y.; Pinto, L.; Inácio, M.; Pereira, P. Mapping ecosystem services in protected areas. A systematic review, Sci. Total Env. 2020, 912, 169248. [Google Scholar] [CrossRef]
- Gonzalez-García, A.; Palomo, I.; Gonzalez, J.A.; García-Díez, V.; García-Llorente, M.; Montes, C. Biodiversity and ecosystem services mapping: can it reconcile urban and protected area planning? Sci. Total Env. 2022, 803, 150048. [Google Scholar] [CrossRef]
- Allen, T.; Murray, K.A.; Zambrana-Torrelio, C.; et al. Global hotspots and correlates of emerging zoonotic diseases. Nat. Commun. 2017, 8, 1124. [Google Scholar] [CrossRef]
- Raven, P.; Wagner, D. Agricultural intensification and climate change are rapidly decreasing insect biodiversity. Proc. Natl. Acad. Sci. USA 2021, 118, e2002548117–10.1073. [Google Scholar] [CrossRef]
- Soto-Navarro, J.; Jorda, G.; Campa, M.; Alomar, C.; Fossi, M.C.; Deudero, S. Impact of the marine litter pollution on the Mediterranean biodiversity: a risk assessment study with focus on the marine protected areas. Mar. Pollut. Bull. 2021, 165, 112169. [Google Scholar] [CrossRef]
- Giakoumi, S.; Pey, A.; Di Franco, A.; Francour, P.; Kizilkaya, Z.; Arda, Y.; Raybaud, V.; Guidetti, P. Exploring the relationships between marine protected areas and invasive fish in the world’s most invaded sea. Ecol. Appl. 2019, 29, e01809. [Google Scholar] [CrossRef]
- Li, Y.; Liu, W.; Feng, Q.; Zhu, M.; Yang, L.; Zhang, J.; Yin, X. The role of land use change in affecting ecosystem services and the ecological security pattern of the Hexi Regions, Northwest China, Sci. Total Env. 2023, 855, 2023–158940. [Google Scholar] [CrossRef]
- Xiao, J.; Zhang, Y.; Xu, H. Response of ecosystem service values to land use change, 2002–2021, Ecol. Indic. 2024, 160, 111947. [Google Scholar] [CrossRef]
- Marino, D.; Palmieri, M.; Marucci, A.; Pili, S. Long-term land cover changes and ecosystem services variation: have the anthropogenic transformations degraded human well-being in Italy? Ital. Rev. Agric. Econ. 2022, 77, 7–23. [Google Scholar] [CrossRef]
- Marino, D.; Barone, A.; Marucci, A.; Pili, S. , Palmieri, M. Impact of Land Use Changes on Ecosystem Services Supply: A Meta Analysis of the Italian Context. Land 2023, 12, 2173. [Google Scholar] [CrossRef]
- Marino, D.; Barone, A.; Marucci, A. , Pili, S., Palmieri, M. The Integrated Analysis of Territorial Transformations in Inland Areas of Italy: The Link between Natural, Social, and Economic Capitals Using the Ecosystem Service Approach. Land 2024, 13, 1455. [Google Scholar] [CrossRef]
- Marucci, A.; Marino, D.; Palmieri, M.; Pili, S. Il ruolo delle aree agroforestali nella fornitura potenziale di servizi ecosistemici: il caso della Regione Molise. L’Italia Forestale e Montana 2022, 77, 153–163. [Google Scholar] [CrossRef]
- Madrigal-Martínez, S.; Miralles i García, J.L. Dinamiche del cambiamento del territorio e tendenze dei servizi ecosistemici nella Puna centrale alto-andina. Sci. Rep. 2019, 9, 9688. [Google Scholar] [CrossRef]
- Ma, B.; Zhang, Y.; Hou, Y.; Wen, Y. Do Protected Areas Matter? A Systematic Review of the Social and Ecological Impacts of the Establishment of Protected Areas. Int. J. Environ. Res. Public. Health 2020, 17, 7259. [Google Scholar] [CrossRef]
- Clements, T.; Milner-Gulland, E.J. Impact of payments for environmental services and protected areas on local livelihoods and forest conservation in northern Cambodia. Conserv. Biol. 2015, 29, 78–87. [Google Scholar] [CrossRef]
- Ferraro, P.J.; Hanauer, M.M. Protecting ecosystems and alleviating poverty with parks and reserves: ‘Win-win’ or tradeoffs? Environ. Resour. Econ. 2011, 48, 269–286. [Google Scholar] [CrossRef]
- Joppa, L.N.; Pfaff, A. High and Far: Biases in the Location of Protected Areas. PLoS ONE 2009, 4, e8273. [Google Scholar] [CrossRef] [PubMed]
- Andam, K.S.; Ferraro, P.J.; Pfaff, A.; Sanchez-Azofeifa, G.A.; Robalino, J.A. Measuring the effectiveness of protected area networks in reducing deforestation. Proc. Natl. Acad. Sci. USA 2008, 105, 16089–16094. [Google Scholar] [CrossRef] [PubMed]
- Department for Economic Development and Cohesion (DPS). National Strategy for Internal Areas. Annex 1. Partnership Agreement 2014-2020. 2014. www.dps.gov.it/it/arint/index. (accessed on 16 August 2025).
- Lucatelli, S. Strategia Nazionale per le Aree Interne: un punto a due anni dal lancio della Strategia. Agriregionieuropa 2016, 45, 4–10. [Google Scholar]
- Barca, F. An Agenda for a reformed cohesion policy; European Communities: Brussels, Belgium, 2009. [Google Scholar]
- Barca, F. Un progetto per le “aree interne” dell’Italia. In Aree interne e progetti d’area; Meloni, B., Ed.; Rosenberg & Sellier: Torino, Italy, 2015; pp. 29–35. [Google Scholar]
- Geldmann, J.; Manica, A.; Burgess, N.D.; Coad, L.; Balmford, A. A global-level assessment of the effectiveness of protected areas at resisting anthropogenic pressures. Proc. Natl. Acad. Sci. USA 2019, 116, 23209–23215. [Google Scholar] [CrossRef]
- Rodrigues, A.S.L.; Cazalis, V. The multifaceted challenge of evaluating protected area effectiveness. Nat. Commun. 2020, 11, 5147. [Google Scholar] [CrossRef]
- Pereira, P.; Brevik, E.; Trevisani, S. Mapping the environment. Sci. Total Env. 2018, 610, 17–23. [Google Scholar] [CrossRef]
- Carbone, F. Il territorio dei parchi nazionali italiani; Gangemi Ed.: Rome, Italy, 2004. [Google Scholar]
- Senato della Repubblica. Legge quadro sulle aree protette (n. 394/1991) – Dossier; Senato della Repubblica: Roma, Italy, 1991. [Google Scholar]
- ISPRA. Annuario dei dati ambientali 2018; Istituto Superiore per la Protezione e la Ricerca Ambientale: Roma, Italy, 2018. [Google Scholar]
- MASE/Federparchi. Rapporto sullo stato delle aree protette 2010–2021; Ministero dell’Ambiente e della Sicurezza Energetica & Federparchi: Roma, Italy, 2021. [Google Scholar]
- ISMEA-RRN. Agriturismo e multifunzionalità – scenario e prospettive; Rete Rurale Nazionale, 2020. [Google Scholar]
- ISTAT. Le aziende agrituristiche in Italia. Anno 2018; Istituto Nazionale di Statistica: Roma, Italy, 2019. [Google Scholar]
- Schirpke, U.; Tasser, E. Trends in ecosystem services across Europe due to land-use/cover changes. Sustain. 2021, 13, 7095. [Google Scholar] [CrossRef]
- Grêt-Regamey, A.; Sirén, E.; Brunner, S.H.; Weibel, B. Review of decision support tools to operationalize the ecosystem services concept. Ecosyst. Serv. 2017, 26, 306–315. [Google Scholar] [CrossRef]
- Federparchi/Unioncamere. Rapporto sul turismo nei parchi; Federparchi: Roma, Italy, 2019. [Google Scholar]
- UNWTO (World Tourism Organization). Tourism and the Sustainable Development Goals; UNWTO: Madrid, Spain, 2017. [Google Scholar]
- Buckley, R. Sustainable tourism: Research and reality. Ann. Tour. Res. 2012, 39, 528–546. [Google Scholar] [CrossRef]
- Tilman, D.; Clark, M.; Williams, D.R.; Kimmel, K.; Polasky, S.; Packer, C. Future threats to biodiversity and pathways to their prevention. Nature 2017, 546, 73–81. [Google Scholar] [CrossRef]
- MacDonald, D.; Crabtree, J.R.; Wiesinger, G.; Dax, T.; Stamou, N.; Fleury, P.; Gutiérrez Lazpita, J.; Gibon, A. Agricultural abandonment in mountain areas of Europe: Environmental consequences and policy response. J. Environ. Manag. 2000, 59, 47–69. [Google Scholar] [CrossRef]
- Lasanta, T.; Arnáez, J.; Pascual, N.; Ruiz-Flaño, P.; Errea, M.P.; Lana-Renault, N. Pastoralism versus abandonment in European mountain regions: Driving forces and consequences for landscapes and ecosystem services. Landsc. Ecol. 2017, 32, 2061–2079. [Google Scholar] [CrossRef]
- TEEB (The Economics of Ecosystems and Biodiversity). Ecological and Economic Foundations; Kumar, P., Ed.; Earthscan: London, UK, 2010. [Google Scholar]
- Mazzocchi, C.; Bernués, A.; et al. Tourists' perception of ecosystem services provided by mountain agriculture: choice experiments. Sustain. 2022, 14, 12171. [Google Scholar] [CrossRef]
- Ministero dell’Ambiente. Aree naturali protette italiane: dati e statistiche; MATTM: Roma, Italy, 2014. [Google Scholar]
- Marino, D.; Barone, A.; Marucci, A.; Pili, S.; Palmieri, M. How Do Territorial Relationships Determine the Provision of Ecosystem Services? A Focus on Italian Metropolitan Regions in Light of Von Thunen’s Theorem. Urban Sci., 2025, 9, 87. [Google Scholar]
- Bateman, I.J.; Brouwer, R.; Ferrini, S.; Schaafsma, M.; Barton, D.N.; Dubgaard, A.; et al. Making Benefit Transfers Work: Deriving and Testing Principles for Value Transfers for Similar and Dissimilar Sites Using a Case Study of the Non-Market Benefits of Water Quality Improvements Across Europe. Environ. Resour. Econ. 2011, 50, 365–387. [Google Scholar] [CrossRef]
- Boutwell, J.L.; Westra, J.V. Benefit Transfer: A Review of Methodologies and Challenges. Resources 2013, 2, 517–527. [Google Scholar] [CrossRef]
- Brouwer, R. Environmental Value Transfer: State of the Art and Future Prospects. Ecol. Econ. 2000, 32, 137–152. [Google Scholar] [CrossRef]
- Desvousges, W.H.; Naughton, M.C.; Parsons, G.R. Benefit Transfer: Conceptual Problems in Estimating Water Quality Benefits Using Existing Studies. Water Resour. Res. 1992, 28, 675–683. [Google Scholar] [CrossRef]
- Rosenberger, R.S.; Stanley, T.D. Measurement, Generalization, and Publication: Sources of Error in Benefit Transfers and Their Management. Ecol. Econ. 2006, 60, 372–378. [Google Scholar] [CrossRef]
- Malavasi, M.; Carranza, M.L.; Moravec, D.; Cutini, M. Reforestation dynamics after land abandonment: a trajectory analysis in Mediterranean mountain landscapes. Reg. Environ. Change 2018, 18, 2459–2469. [Google Scholar] [CrossRef]
- Pallotta, E.; Boccia, L.; Rossi, C.M.; Ripa, M.N. Forest Dynamic in the Italian Apennines. Appl. Sci. 2022, 12, 2474. [Google Scholar] [CrossRef]
- Santoro, A.; Venturi, M.; Piras, F.; Fiore, B.; Corrieri, F.; Agnoletti, M. Forest Area Changes in Cinque Terre National Park in the Last 80 Years. Consequences on Landslides and Forest Fire Risks. Land. 2021, 10, 293. [Google Scholar] [CrossRef]
- Costanza, R. Valuing natural capital and ecosystem services toward the goals of efficiency, fairness, and sustainability. Ecosyst. Serv. 2020, 2020.43, 101096. [Google Scholar] [CrossRef]
- Sereni, E. History of the Italian agricultural landscape; Princeton University Press: Oxford, UK, 2014; pp. 1–436. [Google Scholar]
- Neal, T. Estimating the effectiveness of forest protection using regression discontinuity. J. Environ. Econ. Manag. 2024, 127, 103021. [Google Scholar] [CrossRef]
- Yu, H.; Zhang, Z.; Jeppesen, E.; Gao, Y.; Liu, Y.; Liu, Y.; Lu, Q.; Wang, C.; Sun, X. Assessment of the effectiveness of China’s protected areas in enhancing ecosystem services. Ecosyst. Serv. 2024, 65, 101588. [Google Scholar] [CrossRef]
- Lin, K.; Zhang, Q.; Lu, Q.; Meng, F.; Chen, C. Assessing ecosystem services in protected areas: Trade-offs and hotspots in Friuli Venezia Giulia region (northeastern Italy). Biodiversity. 2025. [Google Scholar]
- Lin, K. , Zhang, Q., Lu, Q., Meng, F., & Chen, C. Linking protected areas with health and well-being: Reconstructing the recreational amenity experience model in the Chinese context. J. Outdoor Recreat. Tour. 2025, 50, 100867. [Google Scholar]
- Feng, Y.; Wang, Y.; Su, H.; Pan, J.; Sun, Y.; Zhu, J.; Fang, J.; Tang, Z. Assessing the effectiveness of global protected areas based on the difference in differences model. Ecol. Indic. 2021, 130, 108078. [Google Scholar] [CrossRef]
- Marino, D.; Palmieri, M. Investing in Nature: Working with Public Expenditure and Private Payments for a New Governance Model. In Re-connecting Natural and Cultural Capital. Contributions from Science and Policy; Paracchini, M.L., Zingari, P.C., Blasi, C., Eds.; Office of Publications of the European Union: Luxembourg, 2016. [Google Scholar]
- Marino, D. , Palmieri, M.; Marucci, A.; Tufano, M. Comparison between demand and supply of some ecosystem services in national parks: A spatial analysis conducted using Italian case studies. Conservation 2021, 1, 36–57. [Google Scholar] [CrossRef]
- Marino, D.; Marucci, A.; Palmieri, M.; Gaglioppa, P. Monitoring the Convention on Biological Diversity (CBD) Framework using Evaluation of Effectiveness methods. The Italian case. Ecol. Indic. 2015, 55, 172–182. [Google Scholar] [CrossRef]
|
Disclaimer/Publisher’s Note: The statements, opinions and data contained in all publications are solely those of the individual author(s) and contributor(s) and not of MDPI and/or the editor(s). MDPI and/or the editor(s) disclaim responsibility for any injury to people or property resulting from any ideas, methods, instructions or products referred to in the content. |
© 2025 by the authors. Licensee MDPI, Basel, Switzerland. This article is an open access article distributed under the terms and conditions of the Creative Commons Attribution (CC BY) license (http://creativecommons.org/licenses/by/4.0/).