
Submitted:
22 September 2025
Posted:
24 September 2025
You are already at the latest version
Abstract
This study deals with the effectiveness of casing-injection for a few squealer tip designs in a turbine stage to mitigate tip leakage penalties. Seventy-two Unsteady Reynolds-Averaged Navier–Stokes (URANS) simulations were conducted. Five factors were examined: number of injection holes, axial position, jet inclination, blowing ratio, and hole diameter. The ideal configuration demonstrated the highest aerodynamic loss reduction compared to the baseline flat tip by 2.66%. The optimal injection scheme was integrated with three tip-rim topologies: complete channel squealer, suction-side partial squealer, and pressure-side partial squealer. The channel squealer enhances the advantageous effects of injection; the injected jets produce a counter-rotating vortex pair that disturbs the tip leakage vortex core, while the cavity formed by the squealer rim captures low-momentum fluid, thus thermally protecting the tip surface. The injection combined with channel squealer had the highest stage isentropic efficiency and the lowest total-pressure loss, thereby validating the synergy between active jet momentum augmentation and passive geometric sealing. The best configuration shows a 2.87% total pressure loss decrement and a 4.49% total-to-total efficiency increment compared to the baseline design. The best configuration not only improved stage efficiency but also achieved a 43.9% decrease in the tip heat transfer coefficient.
Keywords:
tip leakage flow
; casing injection
; HP turbine
; squealer
; partial squealer
; axial turbine
; annular cascade
; turbine experiments
; URANS
; CFD
1. Introduction
In unshrouded axial turbines, the pressure differential between the pressure and suction sides of the rotor blade propels a high-momentum jet through the blade tip gap. The leaking jet forms a coherent tip leakage vortex (TLV) that interacts with secondary flow structures, including the passage vortex and scrape vortex, leading to intricate three-dimensional loss processes. The amalgamation of this leakage flow with the primary passage flow not only disturbs blade loading but also elevates entropy formation adjacent to the casing. Tip leakage flow may constitute as much as one-third of the overall aerodynamic loss in axial turbine stages, rendering it a pivotal focus for performance enhancement [1]. In addition to diminishing efficiency by tip gap effects, bigger gaps markedly enhance heat-transfer coefficients at the blade tip, suction-side wall, and casing. Tip leakage significantly contributes to the deterioration of efficiency and the induction of thermal stress in unshrouded turbines [2]. Langston emphasized that two significant causes of aerodynamic loss are tip leakage and secondary vortices in his examination of secondary flows in axial turbines. The study demonstrated how performance loss results from the interactions of these flow structures with the main channel flow [3]. Camci et al. examined partial squealer rims in a rotating turbine, confirming that their implementation improves local aerodynamic conditions. The results showed that the suction-side partial squealers are more capable than the pressure-side ones in reducing the stage exit total pressure defect [4]. In another study, Camci et al. [5] examined the aerodynamic properties of full and partial-length squealer rims in an axial turbine stage. They found that suction-side partial squealers are more efficient in reducing aerodynamic losses and weakening tip leakage vortices. Kavurmacıoğlu et al. [6] employ three-dimensional Reynolds-Averaged Navier-Stokes simulations to study partial squealer tip designs in an axial flow turbine. The study examines how aerodynamic losses and tip leakage vortex dynamics are altered by partial squealer rims. The study validates that squealer tips improve turbine performance by weakening the tip vortex and reducing leakage mass flow through intricate flow visualizations. The findings indicate that chordwise length variations have little influence on desensitization and that suction-side partial squealers are effective at reducing tip leakage losses. Additionally, the study demonstrates that partial squealer rims are feasible substitutes for full squealer designs in enhancing turbine efficiency as they can similarly achieve tip leakage management. Kavurmacıoğlu et al. created a computational framework to evaluate aerodynamic losses near a high-pressure turbine blade’s tip region. The main goal of their investigation was to optimize the design of the tip section to reduce thermal and aerodynamic losses. The findings demonstrated that while parametric optimization helps lower leakage-induced performance deterioration, increasing tip clearance height significantly raises aerodynamic losses. The study concludes that sophisticated passive control methods, such as trenching and tip shaping, could further increase turbine efficiency [7].
Senel et al. investigated the influence of squealer width and height on the aerothermal performance of a high-pressure turbine blade using computational fluid dynamics simulations. Their study analysed four different squealer heights and seven squealer width values, revealing that increasing squealer height and reducing squealer width enhance cavity vortex structures, leading to lower tip leakage mass flow rates and reduced aerodynamic losses. The results also showed that heat transfer to the blade tip decreases with increasing squealer height due to the blockage effect of the enlarged tip vortex structures. The results highlight the importance of choosing the correct squealer width and height to maximize thermal performance and aerodynamic efficiency [8].
Kavurmacıoğlu et al. examined the effect of circumferential casing grooves on a high-pressure axial turbine blade’s aerodynamic performance. Their study, based on computational fluid dynamics analysis, demonstrated that casing grooves can effectively alter the tip leakage vortex structure and reduce aerodynamic losses. The research showed that while single grooves increased leakage mass flow, multiple grooves improved aerodynamic efficiency by weakening the tip passage vortex. Among various groove designs, diverging grooves provided the best performance, achieving notable reductions in total pressure loss while maintaining low leakage flow rates [9]. Andichamy et al. proposed Tip Leakage Interrupters, small vortex generators placed near the suction side of the turbine blade. They demonstrated their ability to weaken leakage vortices and enhance turbine efficiency [10]. Da Soghe et al. investigated the role of rim seal configurations in turbine cavity sealing, revealing that optimized rim geometries can significantly reduce secondary air leakage and improve sealing effectiveness [11]. Kavurmacıoğlu et al. analysed the aerothermal performance of different squealer tip configurations in a linear turbine cascade, demonstrating that cavity and partial squealer tips can effectively reduce aerodynamic losses and heat transfer to the blade [12].
Mischo et al. demonstrated that adding cooling air from the casing changes the vortex shapes and boosts efficiency through numerical research on casing air injection in a high-work turbine [13]. Behr et al. analysed the impact of rotor tip-gap height on aerodynamic efficiency and showed that casing-air injection can mitigate performance sensitivity to tip clearance variations [14]. Behr et al. experimentally studied the use of casing cooling air injection for rotor tip leakage control in a high-work turbine. By varying the injection location, injection direction, and injection mass flow rates, they were able to evaluate eight distinct injection configurations. According to their findings, injection close to the leading edge, especially when directed in the direction of flow, considerably decreased the intensity of turbulence, moved the tip leakage vortex, and increased isentropic efficiency by as much as 0.55%. The study made clear how vital injection position and direction are for mitigating loss and controlling vortices [15]. Niu and Zang explored the active control of tip clearance flow using casing air injection. Their numerical study confirmed that injecting cooling air at strategic positions significantly reduces vortex-induced losses and improves turbine efficiency [16]. Yang et al. introduced an air-curtain injection method for rotor tip leakage control, demonstrating that this technique enhances aerodynamic efficiency while also providing secondary cooling for rotor tips; however, excessive injection can lead to unwanted aerodynamic effects [17]. Their subsequent study investigated the cooling effects of air-curtain injection on the rotor casing, confirming its effectiveness in reducing heat loads while maintaining aerodynamic benefits [18]. Abbasi and Gholamalipour conducted a parametric study on casing injection in axial turbines, showing that the injection mass flow rate and placement significantly influence efficiency, with the optimal injection location near the leading edge [19]. Abbasi and Gholamalipour employed response surface methodology to optimize casing air injection and concluded that the injection mass flow rate is the most critical factor in enhancing turbine efficiency [20]. Zhang et al. investigated the effect of casing air injection on the performance of film cooling in an axial turbine cascade. According to their research, contoured holes and ideal injection placement increase isentropic efficiency and film cooling efficacy [21]. Yildiz et al. most recently used artificial neural networks to maximize the positions of film cooling holes on the squealer tip of a high-pressure turbine blade, leading to notable gains in aerodynamic efficiency and cooling efficacy [22].
In this paper, various injection parameters are exploited to distinguish the best design in terms of total pressure loss in the unshrouded HP (high pressure) turbine stage of the Penn State Research Turbine AFTRF (Axial Flow Turbine Research Facility). The best injection-enhanced design is used to identify the most efficient design of injection combined with recessed tips based on the total pressure loss coefficient and heat transfer, as well as isentropic total-to-total efficiency. The recessed tip designs used in this study are shown in Figure 1. Squealer tip designs are obtained from two different studies, which are the most efficient designs based on the given results [4,8].
2. Method
2.1. Baseline Turbine Experiments:
The current research deals with casing air injection against the rotor blade tips in an HP turbine stage. The investigation is conducted to distinguish the best design in terms of total pressure loss, total-to total stage efficiency and convective heat transfer. Extensive unsteady computations of the flow and heat transfer in the unshrouded HP turbine stage of the AFTRF of the Pennsylvania State University are performed. The baseline computations of the aerodynamic flow and heat transfer are assessed and validated against the measured data from the AFTRF and a large-scale wind tunnel. The large-scale turbine research facility is shown in Figure 2.
Table 1 and Table 2 summarize the design parameters and the operating conditions of the HP turbine stage in AFTRF. The computed baseline flow field is compared against available experimental data from AFTRF obtained by [23,24,25]. A set of computational flow visualizations extracted from unsteady computations with high spatial resolution is presented for the current turbine rotor including discrete hole injection jets from the casing.
Figure 3 presents the measured inlet velocity and the turbulent kinetic energy profile at one chord length upstream of the NGV. These two profiles form the upstream boundary conditions for all unsteady turbine stage computations.
2.2. Turbine Stage Geometry for the Computations
The turbine stage geometry at the tip section is presented in Figure 4 as the projection of the cylindrical plane passing through the baseline tip platform. 23 frames for the NGV (Nozzle Guide Vane) and 29 frames for the rotor are modelled with periodicity imposed in the circumferential direction. The coordinates of the tip airfoil of the AFTRF rotor are presented in Appendix A. The domain consists of 4 zones, such as inlet, NGV, rotor and outlet. For the flat tip, the NGV and rotor zones are separated into 15 and 30 blocks, respectively. For the rotor zone the H-Grid methodology is employed with an O-Grid around the blade to create a boundary layer grid with reasonable y+ values. For recessed tips, one additional O-Grid block is added to the rotor zone; this multizone approach allows for the creation of a fully hexahedral mesh to reduce computational time and increase accuracy. For all blade tip walls, including blade and recessed tips, the y+ value is less than one.
Mesh consists of 148, 267 and 161 elements in rotor zone in the spanwise, streamwise and pitchwise directions, respectively. For flat tip simulations, 24 elements are placed in the spanwise direction of the tip gap region to identify accurate flow characteristics at this section. The squealer rim width possesses 12, 24, and 27 elements, and the squealer rim height consists of 33, 15, and 16 elements for channel squealer, suction side squealer, and pressure side squealer, respectively. The NGV region has 1.4 million elements in all analyses while the rotor domain has 3 million elements for flat tip and 3.5-4.5 million elements for recessed tip designs. Figure 5 shows the fully hexahedral mesh arrangement for the channel squealer tip design.
2.3. Discrete Hole Cooling Jets on the Casing
Cooling air at 220 K is injected through the casing using an injection region approach, which applies subsonic inlet and outlet boundary conditions based on specified injection parameters. This method maintains accuracy with the fine mesh, like the one used in this study, while being computationally efficient. The free stream temperature and the wall temperature for all computations are 310 K and 295 K, respectively. Figure 6 shows the arrangement of 15 injection holes design in the case of the channel squealer tip; in the provided image, injection points angle is 30 degrees related to the shroud placed at 30% percent of blade axial chord. Boundary conditions have been obtained from AFTRF test rig measurements [26]. Air is imposed at 310K at the stage inlet by an average total pressure of 101360 Pa and average turbulent kinetic energy of 1.85 m2/s2 while mass flow is determined at the outlet. Since maximum Mach number is well below the compressible threshold, compressibility effects are neglected in computations. Pitchwise periodicity is imposed, and casing is modelled as a stationary wall.
In this study, 5 different injection parameters are exploited to obtain the best injection conditions to be used together with recessed tip designs. These parameters are shown in Table 3. Injection holes for all injection numbers are distributed evenly on the shroud. Injection angles are set circumferentially at the opposite side of the leakage flow from the suction side to the pressure side; this condition is shown in Figure 6.
The blowing ratio is defined as follows:
where and are densities and Vb and V2 are velocities of injection and mainstream absolute flow at the rotor inlet, respectively.
2.4. Unsteady Computations of Flow and Heat Transfer in the Stage
The CFD (computational fluid dynamics) code employed in this study is built upon the finite-volume solution of the three-dimensional Unsteady Reynolds-averaged Navier–Stokes (URANS) equations, executed within ANSYS CFX 2025 R1. The solver applies a fully coupled approach in which the momentum and continuity equations are solved simultaneously, ensuring stability and accuracy in vortex-dominated flows such as those encountered in the turbine tip gap. The coupled solver treats the momentum and continuity equations simultaneously. The two-equation turbulence shear stress transport k-ω model is used for turbulence modelling, which shows good agreement with experimental results based on information in literature [27]. Pressure–velocity coupling is handled internally through a coupled algebraic multigrid scheme that accelerates convergence for high-Reynolds number turbomachinery flows. Spatial discretization is achieved through a high-resolution advection scheme which preserves the sharp gradients and coherent structures associated with the tip leakage vortex and secondary corner vortices. Temporal discretization is carried out using a second-order implicit backward Euler method, selected for its robustness and ability to maintain accuracy during long-duration unsteady simulations spanning multiple rotor revolutions.
2.5. Turbulence Closure, Convergence and Mass Imbalance
For turbulence closure, the two-equation shear stress transport (SST) k-ω model is adopted due to its proven capability in predicting separation, tip-leakage mixing, and adverse pressure gradient flows. Near-wall resolution is ensured by maintaining y+ values close to unity throughout the computational domain, allowing integration of the boundary layer without resorting to wall functions. Convergence criteria are defined rigorously: residuals for continuity, turbulence transport, momentum, and energy equations are reduced below 10−5, 10−5, 10−7, and 10−5, respectively. Once this level is achieved, calculations are extended for an additional 300 iterations to confirm solver stability and numerical smoothness. Mass imbalance is further monitored, and the difference between inlet and outlet mass flow rates is required to remain below 0.002%, ensuring global conservation.
2.6. Unsteady Simulations
In transient simulations, each case is initialized from a steady-state solution before advancing under URANS for six complete rotor revolutions. This strategy ensures that coherent vortex structures are fully developed and statistically stable before data extraction. The solver’s implicit time-stepping algorithm allows large-scale simulations to progress efficiently while maintaining numerical accuracy. Together, these discretization strategies, turbulence closure, and convergence controls form the backbone of the CFD code, providing a reliable and validated computational framework for analyzing unsteady secondary flows and leakage phenomena in axial turbines.
2.7. Rotor Time-Stepping During URANS Calculations
Combining all injection parameters leads to 72 time-dependent analyses in which six revolutions of the rotor are analysed to create time-dependent values of aerodynamic variables. The computational domain was divided into stationary and rotating components, corresponding to the nozzle guide vanes (NGVs) and the rotor, respectively. The interaction between these two domains was treated using a Stage interface in ANSYS CFX, which transfers the fluxes of mass, momentum, and energy in a conservative manner. This approach enables a consistent coupling between adjacent blade rows while maintaining numerical stability throughout the transient calculation. A constant physical time step of 0.0001 s was employed, corresponding to approximately 462 time steps per rotor revolution, which translates to a rotor advancement of about 0.78° per step. This setting provides roughly 16 time steps per blade pitch, ensuring sufficient temporal resolution to capture the unsteady flow structures within the passage. Arithmetic time-averaging of the instantaneous flow variables and turbulence quantities was carried out over all time steps. This procedure provided representative mean distributions of the relevant quantities, which were subsequently used for detailed comparison and analysis of the flow field. Also, for the transient scheme, the second-order backward Euler scheme is employed. To have the best results using SST k-ω turbulence scheme, y+ values should be close to unity [28]. All computational domains used in this study have y+ less than 1 around the blade profile for h>0.95 with an average value of 0.79.
2.8. Mesh Dependency and Validation of the Computations for the Baseline Case
2.8.1. Mesh Dependency of Computed Stage Total Pressure Loss and Heat Transfer
As the criteria, the full stage total pressure loss and the bulk heat transfer coefficient at the rotor blade tip platform have been employed. The mesh dependency results for five different mesh measures are shown in Table 4. Static pressure coefficient is defined as,
where is static pressure at measurement location, is mass-averaged static pressure at rotor outlet and is streamwise velocity component at rotor inlet. Total pressure coefficient is defined as,
where is the total pressure at the rotor exit plane 0.25cx downstream of the trailing edge, is the mass-averaged total pressure at the NGV inlet and is the blade speed at the midspan. The mass-averaged total pressure loss coefficient at rotor exit is defined as,
where is the local total pressure coefficient at the rotor exit plane. When errors presented in Table 4 went below 1%, the mesh independence was accepted as satisfactory. As observed from Table 4, the tip stage values exhibit negligible mesh sensitivity between CM4 (computational mesh) and CM5. As a result, CM4 was selected to be used throughout this study.
2.8.2. Mesh Dependency and Validation of Blade Loading on the Rotor Mid-span
The mesh independence test was also done with static pressure coefficient values at rotor blade mid-span using solid circular symbols as shown in Figure 7. The experimental loading data for the rotor were obtained by pressure transducers mounted in the rotating instrumentation drum of the AFTRF, as shown in Figure 2. The radial position of the rotor airfoil static pressure taps, and the location of the rotating pressure transducers mounted in the rotating drum are measurably different in the AFTRF. The measured rotor airfoil surface static pressure data was corrected for the rotation of the pressure tubing between the airfoil static pressure measurement tap and the rotating transducer near the axis of rotation of the rotating drum. An accurate measurement of this rotor data is absolutely required for successful measurements to be used in computational benchmarking, [23,24,29]. Figure 7 presents that the measured AFTRF rotor data and the current URANS computations from CM4 show very good agreement.
2.8.3. Validation of the Three-Dimensional Flow at NGV Exit
The intra-stage measurements are from an axial measurement station located at x/c=1.025, measured from the leading edge of the NGV. All three components of the velocity vector in the nozzle guide vane exit flow are measured with a sub-miniature five-hole probe, as shown in Figure 8. The relative uncertainty for velocities is estimated as 0.6% for V, 2.5% for Vx, 0.5% for Vθ, and 22% for Vr. A detailed description of the five-hole probe approach is presented in Zaccaria [23]. The uncertainties for total pressure and static pressure measurements are estimated as ±30 Pa and ±33 Pa, respectively. The relative uncertainties in the total pressure and static pressure are approximately 0.03% and 0.033% of the total pressure at the NGV exit. Figure 8 compares the URANS based computed velocity components against the five-hole probe measurements at the NGV exit. The velocity magnitude, the tangential component and the axial component match the measured components very well from hub to tip. The measured radial component has typically a minimal magnitude and a relatively considerable uncertainty inherent to the specific five-hole probe technique. In general, the URANS-based computed velocities at the exit of the NGV and the local static pressure at the mid span of the rotor are predicted well when compared to the AFTRF measured data.
2.8.4. Validation of Convective Heat Transfer Computation
The performance criteria in the current investigation are the full-stage total pressure loss and the bulk heat transfer coefficient at the rotor blade tip platform. The present unsteady heat transfer computations for the casing injection designs are assessed against a ‘benchmark’ airfoil heat transfer data set measured by Klaput [30]. Bulk heat transfer coefficient is defined as,
where is the magnitude of local wall heat flux, is the mass-averaged total temperature at NGV inlet, and is wall temperature. The Area-averaged convective heat transfer coefficient on the tip platform is defined as follows:
Figure 9 presents the averaged rotor tip contours for various computational mesh densities. When errors given in Table 4 went below 1%, the mesh independence was accepted as satisfactory. As observed in Table 4 and Figure 9, the tip region heat transfer values exhibit negligible mesh sensitivity between CM4 and CM5. The results demonstrate minimum sensitivity to mesh resolution starting with CM4. As a result, CM4 was selected to be used throughout this study.
2.8.5. Comparison of Heat Transfer Computations and Measured Data
To verify the accuracy of the current heat transfer computations, numerical predictions were compared against the experimental heat transfer data set obtained by Klaput [30] on the suction side of the SM701 airfoil. This airfoil, with a chord length of 304.8 mm, was specifically chosen because high-resolution convective heat transfer measurements are available for its suction surface. The geometric definition of the SM701 airfoil is provided in Appendix B. The Reynolds number for the heat transfer experiment was 315,000 based on airfoil chord. The Re range of the experimental effort is very close to the Re range of the computations. The heat transfer experiments performed at the Pennsylvania State University Low Speed Low Turbulence Wind Tunnel captured the coexistence of laminar, transitional, and turbulent flow regimes, making this data set particularly suitable for validation purposes. The estimated uncertainty of the experimental heat transfer coefficient measurements, based on thermographic liquid crystals, was reported as δh/h = ± 6%.
Figure 10 presents the comparison between the experimental heat transfer coefficients and the present CFD predictions obtained with the Two Equation Gamma Theta Transition Model implemented in ANSYS CFX. The laminar region close to the leading edge (0<x/Cx<0.2) shows a slight shift between experiment and computation. Beyond this point, the numerical results closely follow the experimental trends, capturing both the gradual decrease in heat transfer and the rapid increase associated with boundary-layer transition around x/Cx≈0.7–0.8. The onset and extent of transition are reproduced with good agreement, and the rise of h values in the turbulent region is also well predicted. Some deviations are observed near the trailing edge (x/Cx>0.8), where local separation and experimental uncertainties related to the heating surface exist. The short region after x/Cx=0.80 is a relatively high uncertainty zone for the heat transfer experiments because the copper electrodes of Inconel constant heat flux surface tend to disturb the otherwise smooth heat transfer surface slightly.
3. Results and Discussion
3.1. Influence of Casing Injection on Stage Total Pressure Loss
The results from the 72 individual URANS computations on the baseline/flat tip with and without casing injection are given in Table 5. shows the mass averaged total pressure loss coefficient difference between inlet and outlet of the stage as defined in equation 4. For all other designs with recessed tips, indicates the normalized change of the total pressure loss coefficient,
where and are the total pressure loss coefficient of the related design and baseline respectively.
Each injection configuration is represented by a five-parameter set in the form Cx–A–M–D–N, denoting the axial injection location, injection angle, blowing ratio, hole diameter, and number of injection holes, respectively. For example, the case 0.3–30–1.22–0.7–7 corresponds to injection at 30% of the axial chord with a 30° hole inclination, a blowing ratio of 1.22, a hole diameter of 0.7 mm, and seven holes in each pitch.
The maximum improvement rate for the total pressure loss for the baseline/flat tip is 2.66% for the case with 15 injections from 1mm holes blowing at 30% of the axial chord with an angle of 50 ° and a blowing ratio of 1.85. As a result, the attributes of this design were selected to be used with recessed tips for further studies. The computational results of the best injection-enhanced flat tip design in combination with recessed tips are shown in Table 6. ε, ϑ and Г show the normalized difference in total pressure loss coefficient, isentropic total-to-total efficiency and average heat transfer coefficient at blade tip, respectively, between baseline and related design. To create a clear image of injection effect with recessed tips, channel squealer (SQ) results without injection are also provided. ISSSQ and IPSSQ stand for suction side and pressure side squealers plus injection, respectively. In comparison to the baseline, results show that the injection with a channel squealer tip (ISQ) achieves the best performance in all aspects, with a decrement of 2.87% and 4.91% in total pressure loss coefficient and tip , respectively. Moreover, ISQ led to a 4.49% increase in isentropic total-to-total efficiency.
The total pressure coefficient of the designs in Table 6 are shown in Figure 11. The application of the channel squealer tip leads to a moderate reduction in the tip leakage vortex. Although other configurations also influence the vortex behaviour, the most significant suppression is observed when the channel squealer tip is combined with casing injection. Figure 12 provides insight into the aerodynamic impact of the observed phenomenon on the 0.05 Cx downstream of the blade. The baseline has the largest and most severe total pressure loss region at the tip. The SQ alone and the baseline with injection (IBL) design both notably shrink the tip loss zone relative to baseline.
The combination of injection plus SSSQ/PSSQ further reduces losses, and the injection plus channel squealer (ISQ) case nearly eliminates the high-loss core. Mid-span losses were low in the baseline and remained low in all modified cases. The ISQ design achieves the most uniform flow. The SSSQ plus Injection (ISSSQ) case yields a very smooth profile with only a negligible tip deficit. PSSQ plus injection (IPSSQ) also improves uniformity significantly, though a slight tip deficit persists. The SQ-only and injection-only cases have moderate improvements, reducing the tip losses substantially, but not as completely as the combined ones.
Distribution of mass averaged Cpt values in the spanwise direction for all squealer designs and the baseline case is shown in Figure 13. The BL and SQ cases exhibit the most significant pressure drop near the tip region above 70% span, reflecting intense tip leakage flow driven by the large pressure differential. In the SQ case, although the cavity rim partially blocks the tip gap, the lateral leakage paths remain active, sustaining the adverse pressure gradient and causing unsteady pressure oscillations close to the shroud. This is evident from the Cpt values between 0.75 and 1.0 span in the current URANS results. The implementation of casing injection (IBL) markedly reduces the pressure drop near the flat tip. The injected flow forms a counter-jet opposing the leakage path, thereby redistributing local total pressure and suppressing the leakage vortex. This effect is further amplified in the ISQ case, where the combined barrier and jet create the most uniform Cpt profile near the tip. Both ISSSQ and IPSSQ designs, featuring partial squealers, show intermediate performance; the pressure side squealer (IPSSQ) maintains a lower Cpt near the shroud, suggesting suppression of the leakage from the pressure side, whereas the suction side configuration (ISSSQ) shows greater pressure retention in the 0.85–0.95 span range. Overall, designs incorporating full squealers with injection (ISQ) offer the most stable and elevated tip-region pressure distribution, directly correlating with minimized leakage driving forces.
To observe the squealer and injection effects on the vortex mechanism and secondary flow structure, tip mid-gap streamlines are shown in Figure 14. All streamlines color-coded with velocity magnitude are taken from the same surface with the same attributes for all designs. In the baseline tip design, the mid-gap flow shows a large, well-defined and strong tip leakage vortex (TLV) on the suction side. This high-pressure-to-low-pressure leak flow produces strongly curved streamlines bending toward the suction-side near the trailing edge, and a pronounced low-velocity core near the tip. Adding a full-width squealer rim markedly alters the tip leakage pattern. The flow into the tip cavity is evident; some streamlines recirculate within the cavity rather than spilling freely into the main flow. The strong TLV of the baseline is effectively suppressed, leading to weaker vortical structures downstream. In the SQ design, the suction-side streamlines are less curved in the free flow, and more fluid is contained in the cavity. In essence, the squealer’s cavity creates a localized recirculation zone that intercepts the leakage flow. In the IBL design a vertical high-speed jet emerges from the suction-side tip, disrupting the normal leakage flow. This flow injection interference bends and distorts the streamlines near the tip; the jet injects momentum against the low-speed core of the TLV. As a result, the tip leakage vortex is partly broken up—the core of the vortex is less coherent downstream. The IBL design interferes with the TLV and shifts flow momentum, partially reducing leakage transport. Still, the tip vortex remains visible, and the flow blockage is only reduced relative to the baseline. Combining injection with a suction side partial squealer (ISSSQ) leads to a blockage of the primary leakage path at the suction side and further disturbance with the injection jet. The streamlines show hardly any strong TLV extending downstream; most leakage flow is confined near the tip. Almost no strong vortex is convected downstream; the tip flow is largely captured in the cavity or washed out by the jet. Mid-gap streamlines are much straighter, and the overall blockage is minimal.
With injection plus a partial squealer on the pressure side (IPSSQ) the effect on the TLV is intermediary. The pressure-side rim does not intercept the suction-side leakage flow, so the TLV remains substantial. At the mid-gap, a swirl region is seen on the suction side, indicating a moderately large vortex. The injection jet again interferes with flow, so the TLV core is somewhat disrupted. There are some additional mixing and curvature caused by the pressure-rim vortex, but the suction-side leak flow is not strongly suppressed. In sum, the IPSSQ design yields intermediate TLV reduction. The injection combined with a full squealer rim (ISQ) largely encloses the tip flow in a cavity on both sides. In this case, the suction-side rim still plays the dominant role in taming the TLV, and the injection jet further weakens any remaining leakage. The streamlines show a weak vortex; most flow is circulating within the enclosed cavity. The TLV is almost entirely confined and prevented from traveling downstream. The squealer cavity effects dominate here, and the strong jet momentum further prevents leakage outflow. The result is minimal flow blockage at mid-gap, with streamlines much less curved than baseline. Overall, the injection plus channel squealer produces a flow field with very little free leakage vortex, combining the benefits of a full rim and injected momentum.
To further study these phenomena, mid-gap velocity vectors are shown in Figure 15. The baseline case (BL) shows a large, coherent TLV rolling from the pressure side across the gap to the suction side. In the mid-gap plot, this appears as a swirling region spanning the gap, indicating strong low-speed recirculation. This TLV is long and energetic, inducing significant mixing and non-uniform downstream flow. Flow uniformity is poor with large reverse flow near the suction side.
At the channel squealer tip (SQ), the TLV still forms from the PS (pressure side) gap, but the vortex core is partly trapped in the tip channel. The mid-gap vectors show a narrower, weaker vortex than BL; the TLV is confined and somewhat displaced toward the cavity. Peak velocities in the gap are reduced, and downstream flow becomes more uniform. Overall, SQ weakens the TLV and lowers losses compared to BL, at the cost of introducing a channel vortex inside the cavity.
Adding an injection jet to the flat tip (IBL) dramatically alters the TLV. A high-momentum jet issues into the gap, acting like a momentum barrier that splits and weakens the TLV core. The TLV is forced to break up earlier and is less coherent. The mid-gap flow is dominated by this injection jet rather than a single vortex. As a result, the velocity field is more uniform: the strong recirculation on the suction side seen in BL is largely absent. Aerodynamic losses fall relative to BL because the injection suppresses leakage, although the jet itself creates localized high-speed shear at the tip. In short, this design shows a much weaker TLV and smoother passage flow than BL.
The suction-side squealer combined with injection (ISSSQ) provides strong TLV trapping. The TLV core is now nearly contained by the SS (suction side) cavity. The injection jet fills most of the gap, yielding a very uniform velocity field with minimal backflow. The TLV that does form is very compact and weak. Because the SS rib blocks the vortex exit, leakage flow is greatly reduced. A small, disturbed region near SS is seen, but a smooth flow elsewhere. Overall, this design has much lower TLV strength and more uniform flow than BL at the expense of some concentrated vortex loss near the rib.
The pressure side squealer combination with injection (IPSSQ) captures the trailing-edge portion of the TLV, and the injection jet still impinges into the gap. The mid-gap vectors indicate the TLV is disturbed; the vortex near the PS side is fragmented by the rib, and the injection further drives flow into the tip gap. Flow is again more uniform than BL due to injections, and losses are reduced. In summary, the design shows moderate TLV suppression and improved uniformity, but without an SS rib, some leakage persists.
Combining a full channel squealer with injection (ISQ) yields the best TLV suppression and flow uniformity. The mid-gap plot for this design shows almost no coherent TLV core. The TLV is essentially broken up by the dual cavities and injection. The velocity field is highly even, with very little low-energy recirculation. This design produces the lowest aerodynamic losses; the leakage flow is minimized, and the passage flow is smooth. In short, this configuration shows the weakest TLV and most uniform outlet flow of all cases, indicating the best overall aerodynamic performance and TLV control.
3.2. Wall Shear Stress on the Investigated Designs
Figure 16 reveals how wall shear stress patterns reflect tip leakage vortex behaviour, directly impacting aerodynamic losses. The baseline flat tip (BL) shows moderate-to-high shear over most of the tip, with a localized low-shear separation region on the suction-side near mid-chord. Computed equal shear stress lines similar to conventional oil flow visualizations reveal a coherent tip-leakage vortex originating near the pressure-side leading corner and sweeping across the tip to reattach on the suction-side. This strong TLV implies large mixing losses. In summary, BL has widespread shear on the tip, except at the separation line, and the vortex reattaches along the suction-side before the trailing edge.
The channel squealer tip dramatically alters the over-tip flow. The computed equal shear stress lines show a large low-shear region over much of the tip, with only a narrow high-shear band along the cavity rim. This indicates that much of the leakage flow is trapped inside the rim cavity. Equal shear stress lines show that a vortex still forms, but it is weaker and split; a suction-side cavity vortex and a pressure-side cavity vortex develop inside the rim. A portion of the flow recirculates in the cavity while the remaining leakage flows over the rim and exits toward the suction side. Because the cavity scrapes and dissipates leakage energy, the TLV leaving the squealer rim is weaker. As a result, SQ produces significantly lower leakage loss than BL. Overall, SQ concentrates shear near the rim edges and leaves the tip center largely separated, indicating effective TLV control and reduced loss.
IBL tip disrupts the leakage vortex. The oil flow pattern is relatively uniform with a curtain effect at the injection location. Equal shear stress lines show that the coherent TLV is essentially broken up; instead of one strong swirl from PS to SS, the injection jet produces a vertical plume at the tip and disperses leakage flow. This delays and weakens vortex formation. The vortex trajectory is shifted upward, and the breakout point moves downstream. Consequently, TLV strength is reduced, and the mixing losses diminish. In this case, the flow from the injection holes appears to remain attached along the tip, with no large separation zone visible. Aerodynamic loss is lower than BL because of the weakened TLV.
The ISSSQ design’s oil flow map suggests extensive low shear stress area. The equal shear stress lines show very low shear stress through the suction side increasing smoothly around 70% of the axial chord. As a result, the tip leakage vortex is weaker in this design. The suction-side rim acts to trap flow locally; the TLV itself is carried to downstream location compared to baseline. The leakage loss is much lower, but the flow does not reattach. It effectively skips over the tip. In short, this design shifts TLV downstream, yielding strong vortex control despite the rim.
The IPSSQ oil flow visualization shows moderate shear over the suction side, with a small high-shear region on the pressure side. Oil visualization, however, reveals TLV with a strong red streak from the PS mid-chord edge to SS. In other words, leakage still rolls up similarly to the ISSSQ design. The pressure-side rim slightly redirects part of the flow, and reattachment on the suction side occurs far upstream. Combining a full squealer rim with injection yields mixed results. The oil flow visualization again shows only small high-shear patches at the rim corners. The oil flow still contains a robust vortex along with evidence of the cavity swirl. The injection jet appears to block the tip leakage at the injection location, and the tip leakage vortex is delayed downstream, circulating within the cavity before exiting. Vortex breakdown may occur inside the cavity, raising some mixing losses, but the cavity trapping increases leakage path length.
3.3. Local Leakage Mass Flow Rate Distribution Exiting the Blade Tip
Figure 17 shows the local leakage mass flow rate distribution exiting the blade tip suction side corner for various tip configurations. To create this chart, the blade tip was partitioned into 20 equal sections along the chord. In the BL design, the leakage mass flow initiates near the leading edge and steadily rises, peaking at approximately 60% of the axial chord (x/Cₓ ≈ 0.6), before gradually declining toward the trailing edge. This pattern reflects the progressive development and strengthening of the tip leakage vortex (TLV) due to the unrestrained pressure differential across the tip. The introduction of a squealer tip (SQ) significantly alters the leakage trajectory. By forming a pressure cavity and geometric barrier, the squealer reduces the leakage initiation and delays the peak flow rate downstream, achieving a more distributed and flattened mass flow curve. This implies a suppression of early vortex formation and a reduction in peak TLV strength. The implementation of casing injection in IBL design further suppresses the leakage flow, especially in the front 40% of the chord. The injected jets counteract the pressure-driven flow from the PS to the SS, lowering the local mass flow and contributing to a gentler rise in leakage along the chord. Among the hybrid strategies, the ISQ case shows the most dramatic suppression, with both a delayed onset and reduced peak leakage rate, showcasing the synergistic effect of geometric containment and upstream jet momentum. Comparatively, the ISSSQ configuration achieves moderate leakage reduction, primarily in the latter half of the chord, indicating its influence on downstream vortex behaviour rather than initial blockage. The IPSSQ case, in contrast, demonstrates an earlier and more uniform reduction throughout the chord, as pressure-side injection effectively attenuates the leakage mass flow at its source. Collectively, these results confirm that combining squealer geometry with strategic injection placement, particularly near the pressure-side leading edge, is the most effective in minimizing tip leakage flow. This reduction directly translates to lower aerodynamic losses and improved turbine efficiency.
3.4. Total Tip Leakage Mass Flow Rate of the Investigated Designs
Figure 18 presents the total tip leakage mass flow exiting from the suction side corner of the tips for all design configurations. The BL design demonstrates the highest tip leakage mass flow (~12.5 g/s), primarily driven by a strong pressure differential between the pressure and suction sides at the tip and the absence of any sealing geometry. The introduction of a squealer tip (SQ) results in a noticeable reduction in leakage (to ~10.5 g/s), due to the formation of a partial cavity that inhibits lateral leakage paths and reduces tip driving pressure. A more substantial reduction is observed with the application of casing injections (IBL), where the mass flow decreases to ~8.5 g/s. The injected jets create a counter-flow near the casing, weakening the tip leakage vortex and acting as a virtual seal. The most effective configuration is the combined injection and full squealer (ISQ), where the total leakage drops further to ~6.8 g/s.
This synergistic effect is attributed to both geometric blockage by the squealer cavity and momentum opposition by the jets, which collectively minimize leakage-driving forces and stabilize near-tip flow. The partial squealer variants, namely suction side (ISSSQ) and pressure side (IPSSQ), exhibit slightly increased leakage rates (~8 g/s and ~7.2 g/s, respectively) compared to the full squealer counterpart. The partial cavity coverage does not entirely obstruct leakage paths, allowing some residual flow, particularly along the uncovered side. The observed trends are consistent with the spanwise pressure distribution and mid-gap vector plots discussed earlier, confirming that both injection and squealer designs contribute to effective tip sealing, with ISQ offering the highest suppression of tip leakage mass flow.
3.5. Convective Heat Transfer on the Tip Surfaces of the Designs
Figure 19 shows the contour plots of the local heat transfer coefficient (h) of inspected tip designs. All the contours have been created with the same value range at the blade surface. The BL tip’s heat-transfer coefficient map is relatively uniform and moderate. The highest heat transfer occurs near the trailing edge suction side, where the main leakage flow vortex is present. In contrast, the leading-edge region on the pressure side shows lower h because the flow there is weaker. Overall, BL has a smooth h gradient with no extreme hotspots reflecting the relatively gentle shear and mild recirculation. The SQ tip’s h distribution is notably higher in the pressure-side region than BL. The trapped recirculation drives high local shear, elevating local heat transfer.
In particular, the area near mid-chord on the pressure surface has a higher h compared to BL’s relatively uniform map. The leading edge has still lower h since little through-flow reaches it. Overall, the squealer tends to raise tip heat loads in local regions consistent with the idea that the large circulation enhances heat transfer in the cavity region. However, its total value is lower than BL since most of the blade surface has lower h values. The h distribution for IBL design is much lower than BL or SQ. Casing injection provides cooling, reducing tip surface temperature rise. Consistent with prior findings, relative casing motion significantly reduced the local heat transfer on the frontal tip region. In the map, the leading edge and much of the suction side have low h, with only a small region of mild h near the mid-chord. Essentially, the coolant flushes the tip, cutting heat transfer nearly in two-thirds relative to the no-injection case.
The h for ISSSQ is similar to IPSSQ and IBL, largely low with mild variation. Cavity concentrates heating on its floor, but injection cools most of the surface. There are no hot spots, but most of the blade surface after mid-chord has high h values as a result of mixing of injection fluid with trapped recirculating vortex in the cavity. So, the average h has a higher value. The IPSSQ h map resembles injection-only case, mostly low values with slight peaks near the trailing edge. The coolant still suppresses heat transfer broadly, but the partial rim may enhance it a bit under the rim ends. Compared to the injection-only design, any increase is minor. The result is a relatively low tip h overall, with only small high patches. The ISQ design’s h map remains much cooler than the no-injection squealer. The injected coolant significantly reduces surface h. The map shows mostly low h, with only a few mild patches. The rim cavity floor might still see a bit of heating since the flow circulates there, but it is much less than the hot spot in the SQ case. Thus, even though the flow is mostly intense, the presence of coolant keeps h lower overall.
3.6. Comparison of Tip Averaged Heat Transfer Coefficients
A comparison of blade tip area-averaged heat transfer coefficients for the investigated configurations is shown in Figure 20.
The BL design exhibits the highest h, exceeding 320 W/m2K, primarily due to the unimpeded and energetic tip leakage vortex impinging directly on the tip surface. The absence of flow-blocking or redirection mechanisms allows vigorous mixing and local turbulence, which in turn enhances convective heat transfer to the tip. The implementation of a squealer cavity (SQ) leads to a moderate reduction in h, with values slightly above 300 W/m2K. The squealer wall contains the tip leakage vortex and delays its impingement, thus reducing turbulent momentum exchange at the tip surface and weakening local heat transfer. The flat tip design combined with casing injections (IBL) yields a more substantial reduction in h around 290 W/m2 when compared to BL and SQ. The momentum-added jets of IBL interact with the leakage flow, diffusing its core structure and reducing the vortex-induced turbulence that would otherwise enhance heat transfer. Among all designs, ISQ demonstrates the lowest h around 180 W/m2K, benefiting from both the physical confinement of the squealer and the vortex-weakening effect of the injections. This synergy minimizes vortex impingement and stabilizes the flow near the tip. The suction-side partial squealer with injection (ISSSQ) shows a sharp increase in h relative to ISQ, rising above 270 W/m2K. This indicates that suction-side partial confinement alters the vortex trajectory but does not suppress it as effectively, due to residual leakage pathways and induced secondary interactions near the SS. The pressure-side partial squealer configuration (IPSSQ) falls between the full and suction-side squealer cases, suggesting moderate leakage suppression and heat transfer mitigation.
3.7. Total-to-Total Stage Efficiency of the Designs
Figure 21 presents the isentropic total-to-total efficiency for all blade tip configurations under study.
The BL configuration exhibits the lowest efficiency of 84.3%, attributed to intense tip leakage flow and associated losses, which promote mixing and unsteady vortex formation in the upper passage region. The introduction of a squealer rim (SQ) results in a marginal efficiency gain, as the rim confines the leakage flow path, slightly mitigating mixing losses but without actively suppressing the leakage vortex core. Significant improvement is observed with the incorporation of casing injections, which enhance efficiency by over three percentage points. These jets disrupt the coherence of the tip leakage vortex and energize the near-tip flow, thereby weakening the interaction of leakage structures with the mainstream and reducing entropy generation.
The ISQ configuration achieves the highest efficiency around 88.7%, demonstrating that coupling casing injection with a squealer rim synergistically suppresses both leakage mass flow and vortex intensity. This results in a cleaner passage flow, reduced mixing, and improved aerodynamic performance. Efficiency slightly decreases in the ISSSQ and IPSSQ configurations. The asymmetry introduced by partial squealer rims, either on the suction or pressure side, results in uneven suppression of the leakage vortex, and in some cases, may deflect or reorient it rather than fully dissipate it. This partial control of leakage flow fails to match the performance of the full squealer configuration. Nevertheless, their efficiency remains significantly above the baseline, underscoring the benefit of combining injection and tip geometry modification.
4. Conclusions
This study is set out to reduce turbine-tip aerodynamic losses and thermal loads by coupling casing air-injection with three recessed-tip geometries on an HP rotor blade. The investigation is carried out for the HP stage of the rotating turbine research facility AFTRF. A comprehensive CFD campaign including 72 unsteady cases to screen the optimum injection set-up for three recessed tip designs, is carried out. The computing accuracy of the URANS code is assessed and validated against the baseline aerodynamic measurements obtained in the AFTRF. The heat convective transfer computations are also assessed against a benchmark data set obtained from an airfoil operating at a similar Re number. Performance was evaluated with three key metrics , and ηtt.
The principal findings are:
- Channel squealer plus casing injection (ISQ) delivered the best overall performance, cutting by 2.87%, raising ηtt by 4.5%, and slashing area-averaged tip by 43.9% relative to the flat-tip baseline.
- Injection alone (IBL) already reduced by 2.66%, identifying the most favorable jet parameters for the recessed-tip phase.
- Moving the casing-injection holes progressively upstream exerts the greatest leverage on loss reduction. Placing them at x/Cx = 0.30, rather than 0.50 or 0.70, further weakens the tip-leakage vortex during its formative roll-up and shortens its development path, yielding up to a three-fold drop in total-pressure loss relative to the flat tip. Once the injection is early, performance scales almost linearly with jet momentum and its spatial distribution, larger diameters and a higher blowing ratio supply more kinetic energy to the jet core, while increasing the hole count from 7 to 11 and finally to 15 spreads that momentum over a wider swath of the tip gap, enhancing entrainment and further weakening the TLV. A steeper inclination (50° vs 30°) provides an additional but secondary boost by directing the jet more directly against the cross-gap leakage flow. However, its marginal benefit diminishes when the dominant vortex has already been truncated by upstream, high-momentum, finely distributed injection. Overall, the data indicate a “sooner–stronger–finer” strategy, early introduction, ample momentum, and dense spatial coverage, delivers the most effective aerodynamic mitigation of tip-induced losses while avoiding the diminishing returns observed when any one parameter is optimized in isolation.
- A plain channel squealer without injection gave moderate benefits, ( ↓ 1.03%, h ↓ 9.3%, ηtt ↑ ≈ 0.6 p.p.) showing cavity confinement helps but cannot suppress the leakage vortex entirely.
- Partial squealer rims with injection (ISSSQ & IPSSQ) offered intermediate gains ( ↓ ≈ 2.7–2.8 %, h ↓ 17.9–29.4 %, ηtt ↑ ≈ 4.1–3.9 p.p.) but remained inferior to the full squealer due to asymmetric leakage control.
- Flow-field computations confirmed that the ISQ configuration almost eliminates the tip-leakage vortex core and associated high-loss region, whereas injection or squealer alone only weakens it; the baseline retains the strongest vortex and largest loss zone.
- Recessed tip designed lengthen the leakage flow path and reduce the discharge coefficient, establishing a cavity recirculation that raises static pressure at the rim and weakens the effective cross-gap pressure gradient, thereby diminishing TLV roll-up and near-wall shear production. By shifting the leakage emergence downstream and away from the suction-edge peak-loading region, the squealer lowers vortex-core strength and reduces its residence time near the endwall, cutting entropy generation and wall-parallel velocity gradients. Discrete casing injection introduced upstream and at a shallow inclination lays down a wall-attached momentum sheet that energizes the endwall boundary layer, fills the low-momentum corner, and resists the cross-passage sweep that feeds secondary separation.
- The injected jets also impose counter-circulation and add static pressure locally, partially resisting the inflow into the gap so that vortex–vortex interaction cancels part of the TLV circulation. With an adequate blowing ratio and sufficient hole density, the jets remain attached (avoiding lift-off), limiting extra mixing while providing film cooling that lowers driving temperature differences and further reduces convective coefficients. In combination, the recessed cavity suppresses the leakage source while the injection pre-conditions the endwall flow and preempts TLV formation, yielding a synergistic reduction in aerodynamic loss and heat transfer beyond either strategy alone.
- Partial rims deliver only intermediate gains because residual asymmetric leakage paths remain, sustaining weaker but still organized TLV structures compared with the uniform confinement achieved by a full channel.
- Pairing optimized casing injection with a full channel squealer achieves a synergistic suppression of tip-leakage aerodynamic losses and heat transfer, outperforming either strategy in isolation. The approach offers a 2.9% reduction in stage losses, 43.9% drop in area-averaged tip heat transfer coefficient together with a 5.3% efficiency gain, figures that translate directly into reduced fuel burn or increased turbine life. slashing tip h by 43.9%. Future work should address a more comprehensive optimization of the parameters encompassing all the blade chord as well as higher blowing ratio to assess overblowing effects and lower injection angles.
Author Contributions
Conceptualization, N.C.K., L.A.K. and C.C.; methodology, N.C.K., L.A.K. and C.C.; software, N.C.K.; validation, N.C.K., L.A.K. and C.C.; formal analysis, N.C.K.; investigation, N.C.K., L.A.K. and C.C.; resources, N.C.K., L.A.K. and C.C.; data curation, N.C.K.; writing—original draft preparation, N.C.K.; writing—review and editing, N.C.K., L.A.K. and C.C.; visualization, N.C.K., C.C.; supervision, L.A.K. and C.C.; project administration, L.A.K. and C.C. All authors have read and agreed to the published version of the manuscript.
Funding
This research received no external funding
Data Availability Statement
The datasets presented in this article are not readily available due to technical limitations. Requests to access the datasets should be directed to the corresponding author.
Conflicts of Interest
The authors declare no conflicts of interest.
Abbreviations
The following abbreviations are used in this manuscript:
| Abbreviations | |
| AFTRF | Pennsylvania State University Axial Flow Turbine Research Facility |
| BL | Baseline |
| CM | Computational mesh |
| Exp. | Experimental |
| HP | High pressure |
| IBL | Injection plus baseline |
| IPSSQ | Injection plus pressure side partial squealer |
| ISQ | Injection plus channel squealer |
| ISSSQ | Injection plus suction side partial squealer |
| NGV | Nozzle guide vane |
| Num. | Numerical |
| p.p. | Percentage point |
| PS | Pressure side |
| PSSQ | Pressure side partial squealer |
| Rad. | Radial |
| SQ | Channel squealer |
| SS | Suction side |
| SSSQ | Suction side partial squealer |
| SST | Shear stress transport |
| TLV | Tip leakage vortex |
| URANS | Unsteady Reynolds-averaged Navier–Stokes |
| Vel. | Velocity |
Appendix A

Table A1.
Coordinates of the Rotor Tip Airfoil Section of AFTRF at Penn State.
| Upper Surface | Lower Surface | ||
|---|---|---|---|
| x [mm] | y [mm] | x [mm] | y [mm] |
| -1.512 | 1.906 | 29.33 | -23.823 |
| -4.31 | 4.462 | 30.965 | -28.265 |
| -7.173 | 6.741 | 32.506 | -32.569 |
| -10.096 | 8.716 | 33.952 | -36.731 |
| -13.076 | 10.349 | 35.318 | -40.749 |
| -16.089 | 11.609 | 36.606 | -44.62 |
| -19.099 | 12.49 | 37.823 | -48.344 |
| -22.058 | 13.015 | 38.971 | -51.919 |
| -24.794 | 13.232 | 40.005 | -55.187 |
| -27.277 | 13.263 | 40.931 | -58.146 |
| -29.497 | 13.188 | 41.752 | -60.797 |
| -31.452 | 13.056 | 42.47 | -63.137 |
| -33.145 | 12.919 | 43.089 | -65.167 |
| -34.58 | 12.833 | 43.61 | -66.885 |
| -35.808 | 12.826 | 44.053 | -68.353 |
| -36.838 | 12.905 | 44.43 | -69.587 |
| -37.673 | 13.059 | 44.744 | -70.605 |
| -38.322 | 13.261 | 44.968 | -71.42 |
| -38.792 | 13.489 | 45.062 | -72.063 |
| -39.115 | 13.711 | 44.966 | -72.539 |
| -39.358 | 13.93 | 44.739 | -72.878 |
| -39.526 | 14.13 | 44.492 | -73.091 |
| -39.637 | 14.292 | 44.274 | -73.203 |
| -39.752 | 14.508 | 44.086 | -73.258 |
| -39.869 | 14.813 | 43.827 | -73.292 |
| -39.953 | 15.212 | 43.503 | -73.251 |
| -39.982 | 15.701 | 43.16 | -73.102 |
| -39.921 | 16.351 | 42.808 | -72.725 |
| -39.721 | 17.175 | 42.452 | -72.129 |
| -39.355 | 18.171 | 42.085 | -71.364 |
| -38.784 | 19.327 | 41.697 | -70.593 |
| -38.004 | 20.649 | 41.105 | -69.326 |
| -36.987 | 22.128 | 40.48 | -68.032 |
| -35.701 | 23.816 | 39.741 | -66.503 |
| -34.102 | 25.67 | 38.886 | -64.739 |
| -32.14 | 27.632 | 37.915 | -62.741 |
| -29.729 | 29.584 | 36.828 | -60.509 |
| -26.81 | 31.38 | 35.617 | -58.044 |
| -23.339 | 32.808 | 34.294 | -55.348 |
| -19.512 | 33.645 | 32.901 | -52.538 |
| -15.434 | 33.811 | 31.44 | -49.616 |
| -11.229 | 33.241 | 29.908 | -46.584 |
| -7.031 | 31.901 | 28.301 | -43.443 |
| -2.982 | 29.781 | 26.616 | -40.196 |
| 0.816 | 26.956 | 24.845 | -36.845 |
| 4.341 | 23.558 | 22.986 | -33.394 |
| 7.508 | 19.823 | 21.092 | -29.692 |
| 10.379 | 15.856 | 19.159 | -26.552 |
| 13.025 | 11.736 | 17.176 | -23.17 |
| 15.479 | 7.499 | 15.139 | -19.889 |
| 17.772 | 3.172 | 13.038 | -16.508 |
| 19.925 | -1.226 | 10.878 | -13.241 |
| 21.923 | -5.674 | 8.623 | -10.034 |
| 23.922 | -10.166 | 6.276 | -6.894 |
| 25.791 | -14.692 | 3.813 | -3.844 |
| 27.59 | -19.246 | 1.224 | -0.9 |
Appendix B
Table A2.
Coordinates of SM701 Airfoil.
| Upper Surface | Lower Surface | ||
|---|---|---|---|
| x/c | y/c | x/c | y/c |
| 0.00168 | 0.00771 | 0.00016 | -0.0021 |
| 0.00736 | 0.0191 | 0.00435 | -0.0098 |
| 0.01701 | 0.03121 | 0.01501 | -0.0163 |
| 0.03055 | 0.04344 | 0.03127 | -0.0224 |
| 0.04794 | 0.05534 | 0.05277 | -0.028 |
| 0.06915 | 0.06648 | 0.07923 | -0.0329 |
| 0.09417 | 0.07658 | 0.11036 | -0.0373 |
| 0.12295 | 0.08544 | 0.14575 | -0.041 |
| 0.15541 | 0.09296 | 0.18488 | -0.0442 |
| 0.19133 | 0.09914 | 0.22722 | -0.0467 |
| 0.23041 | 0.10397 | 0.27222 | -0.0485 |
| 0.27229 | 0.10746 | 0.31929 | -0.0494 |
| 0.31654 | 0.10964 | 0.36784 | -0.0494 |
| 0.36268 | 0.11055 | 0.41726 | -0.048 |
| 0.41019 | 0.11018 | 0.46727 | -0.0449 |
| 0.45853 | 0.10853 | 0.51811 | -0.0398 |
| 0.50714 | 0.10557 | 0.56979 | -0.0334 |
| 0.55548 | 0.1012 | 0.62191 | -0.0262 |
| 0.60323 | 0.09517 | 0.67386 | -0.0189 |
| 0.65041 | 0.0876 | 0.72497 | -0.0118 |
| 0.69676 | 0.07903 | 0.77446 | -0.0055 |
| 0.74171 | 0.0699 | 0.82144 | -0.0004 |
| 0.78466 | 0.06055 | 0.86497 | 0.00324 |
| 0.82498 | 0.05125 | 0.90406 | 0.00526 |
| 0.86207 | 0.04221 | 0.93768 | 0.00567 |
| 0.89529 | 0.03348 | 0.96489 | 0.00463 |
| 0.92431 | 0.02493 | 0.98462 | 0.00262 |
| 0.94922 | 0.01669 | 0.99624 | 0.00073 |
| 0.96999 | 0.00946 | 1 | 0 |
| 0.98605 | 0.00405 | ||
| 0.9964 | 0.00095 | ||
| 1 | 0 | ||
References
- Moore, J.; Tilton, J.S. Tip Leakage Flow in a Linear Turbine Cascade. J. Turbomach. 1988, 110, 18–26. [Google Scholar] [CrossRef]
- Ameri, A.A.; Steinthorsson, E.; Rigby, D.L. Effects of Tip Clearance and Casing Recess on Heat Transfer and Stage Efficency in Axial Turbines. J. Turbomach. 1999, 121, 683–693. [Google Scholar] [CrossRef]
- Langston, L.S. Secondary Flows in Axial Turbines—A Review. Ann. N. Y. Acad. Sci. 2001, 934, 11–26. [Google Scholar] [CrossRef] [PubMed]
- Camci, C.; Dey, D.; Kavurmacıoğlu, L. Tip Leakage Flows Near Partial Squealer Rims in an Axial Flow Turbine Stage. In Proceedings of the GT2003; Volume 6: Turbo Expo , Parts A and B, June 16, 2003; pp. 79–90. [Google Scholar]
- Camci, C.; Dey, D.; Kavurmacıoğlu, L. Aerodynamics of Tip Leakage Flows Near Partial Squealer Rims in an Axial Flow Turbine Stage. J. Turbomach. 2005, 127, 14–24. [Google Scholar] [CrossRef]
- Kavurmacıoğlu, L.; Dey, D.; Camci, C. Aerodynamic Character of Partial Squealer Tip Arrangements in an Axial Flow Turbine. Part II: Detailed Numerical Aerodynamic Field Visualisations via Three Dimensional Viscous Flow Simulations around a Partial Squealer Tip. Prog. Comput. Fluid Dyn. Int. J. 2007, 7, 374. [Google Scholar] [CrossRef]
- Kavurmacıoğlu, L.A.; Maral, H.; Senel, C.B. A Parametric Approach to Turbine Tip Leakage Aerodynamic Investigation for Axial Flow Turbine. In Proceedings of the International Symposium on Transport Phenomena and Dynamics of Rotating Machinery; Honolulu, United States; 2016. [Google Scholar]
- Senel, C.B.; Maral, H.; Kavurmacıoğlu, L.A.; Camci, C. An Aerothermal Study of the Influence of Squealer Width and Height near a HP Turbine Blade. Int. J. Heat Mass Transf. 2018, 120, 18–32. [Google Scholar] [CrossRef]
- Kavurmacıoğlu, L.A.; Senel, C.B.; Maral, H.; Camci, C. Casing Grooves to Improve Aerodynamic Performance of a HP Turbine Blade. Aerosp. Sci. Technol. 2018, 76, 194–203. [Google Scholar] [CrossRef]
- Andichamy, V.C.; Khokhar, G.T.; Camci, C. An Experimental Study of Using Vortex Generators As Tip Leakage Flow Interrupters in an Axial Flow Turbine Stage. In Proceedings of the GT2018; Volume 2B: Turbomachinery, June 11 2018. [Google Scholar]
- Da Soghe, R.; Bianchini, C.; Micio, M.; D’Errico, J.; Bavassano, F. Effect of Rim Seal Configuration on Gas Turbine Cavity Sealing in Both Design and Off-Design Conditions. In Proceedings of the GT2018; Volume 5B: Heat Transfer, June 11 2018. [Google Scholar]
- Kavurmacıoğlu, L.; Maral, H.; Senel, C.B.; Camci, C. Performance of Partial and Cavity Type Squealer Tip of a HP Turbine Blade in a Linear Cascade. Int. J. Aerosp. Eng. 2018, 2018, 3262164. [Google Scholar] [CrossRef]
- Mischo, B.; Burdet, A.; Behr, T.; Abhari, R.S. Control of Rotor Tip Leakage Through Colling Injection from Casing in a High Work Turbine: Computational Investigation Using A Feature-Based Jet Model.; American Society of Mechanical Engineers, 2007; Vol. 6, p. 1355.
- Behr, T.; Kalfas, A.I.; Abhari, R.S. Desensitization of the Flowfield from Rotor Tip-Gap Height by Casing-Air Injection. J. Propuls. Power 2008, 24, 1108–1116. [Google Scholar] [CrossRef]
- Behr, T.; Kalfas, A.I.; Abhari, R.S. Control of Rotor Tip Leakage Through Cooling Injection From the Casing in a High-Work Turbine. J. Turbomach. 2008, 130. [Google Scholar] [CrossRef]
- Niu, M.; Zang, S. Active Control of Tip Clearance Flow through Casing Air Injection in Axial Turbines. J. Energy Inst. 2011, 84, 44–51. [Google Scholar] [CrossRef]
- Yang, X.; Zhao, Q.; Liu, Z.; Feng, Z.; Simon, T.W. Controlling Leakage Flows Over a Rotor Blade Tip Using Air-Curtain Injection: Part I — Aero-Thermal Performance of Rotor Tips. In Proceedings of the GT2019; Volume 5B: Heat Transfer, June 17 2019. [Google Scholar]
- Zhao, Q.; Yang, X.; Liu, Z.; Feng, Z.; Simon, T.W. Controlling Leakage Flows Over a Rotor Blade Tip Using Air-Curtain Injection: Part II — Rotor Casing Film Cooling. In Proceedings of the GT2019; Volume 5B: Heat Transfer, June 17 2019. [Google Scholar]
- Abbasi, S.; Gholamalipour, A. Parametric Study of Injection from the Casing in an Axial Turbine. Proc. Inst. Mech. Eng. Part J. Power Energy 2020, 234, 582–593. [Google Scholar] [CrossRef]
- Abbasi, S.; Gholamalipour, A. Performance Optimization of an Axial Turbine with a Casing Injection Based on Response Surface Methodology. J. Braz. Soc. Mech. Sci. Eng. 2021, 43, 435. [Google Scholar] [CrossRef]
- Zhang, S.; Zhang, J.; Tan, X.; Liu, S. Effects of Casing Air Injection on Film Cooling and Aerodynamic Performances of an Axial Turbine Cascade. Therm. Sci. Eng. Prog. 2022, 29, 101209. [Google Scholar] [CrossRef]
- Yıldız, F.; Alpman, E.; Kavurmacıoğlu, L.; Camci, C. An Artificial Neural Network (Ann) Based Aerothermal Optimization of Film Cooling Hole Locations on the Squealer Tip of an Hp Turbine Blade. SSRN Electron. J. 2022. [Google Scholar] [CrossRef]
- Zaccaria, M.A. An Experimental Investigation into the Steady and Unsteady Flow Field in an Axial Flow Turbine. PhD Thesis, The Pennsylvania State University: University Park, PA, 1994. [Google Scholar]
- Lakshminarayana, B.; Camci, C.; Halliwell, I.; Zaccaria, M. Design and Development of a Turbine Research Facility to Study Rotor-Stator Interaction Effects. Int. J. Turbo Jet Engines 1996, 13, 155–172. [Google Scholar] [CrossRef]
- Camci, C. 2004; -02.
- Camci, C. A Turbine Research Facility to Study Tip Desensitization Including Cooling Flows, von Karman Institute Lecture Series VKI-LS 2004-02 Turbine Blade Tip Design and Tip Clearance Treatment; Brussels, 2004; ISBN 2-930389-51-6.
- Menter, F.R. Two-Equation Eddy-Viscosity Turbulence Models for Engineering Applications. AIAA J. 1994, 32, 1598–1605. [Google Scholar] [CrossRef]
- Bourgeois, J.A.; Martinuzzi, R.J.; Savory, E.; Zhang, C.; Roberts, D.A. Assessment of Turbulence Model Predictions for an Aero-Engine Centrifugal Compressor. J. Turbomach. 2010, 133. [Google Scholar] [CrossRef]
- Turgut, Ö.H.; Camci, C. Factors Influencing Computational Predictability of Aerodynamic Losses in a Turbine Nozzle Guide Vane Flow. J. Fluids Eng. 2016, 138, 051103. [Google Scholar] [CrossRef]
- Klaput, T. Control of Near Wall Flow on an Isolated Airfoil at High Angle of Attack Using Piezoelectric Surface Vibration Elements. MSc, Pennsylvania State University: University Park, PA, USA, 1997.
Figure 1.
Conceptual Recessed Tip Designs Studied a) Baseline BL b) Squealer SQ c) Pressure Side Squealer PSSQ d) Suction Side Squealer SSSQ.
Figure 1.
Conceptual Recessed Tip Designs Studied a) Baseline BL b) Squealer SQ c) Pressure Side Squealer PSSQ d) Suction Side Squealer SSSQ.
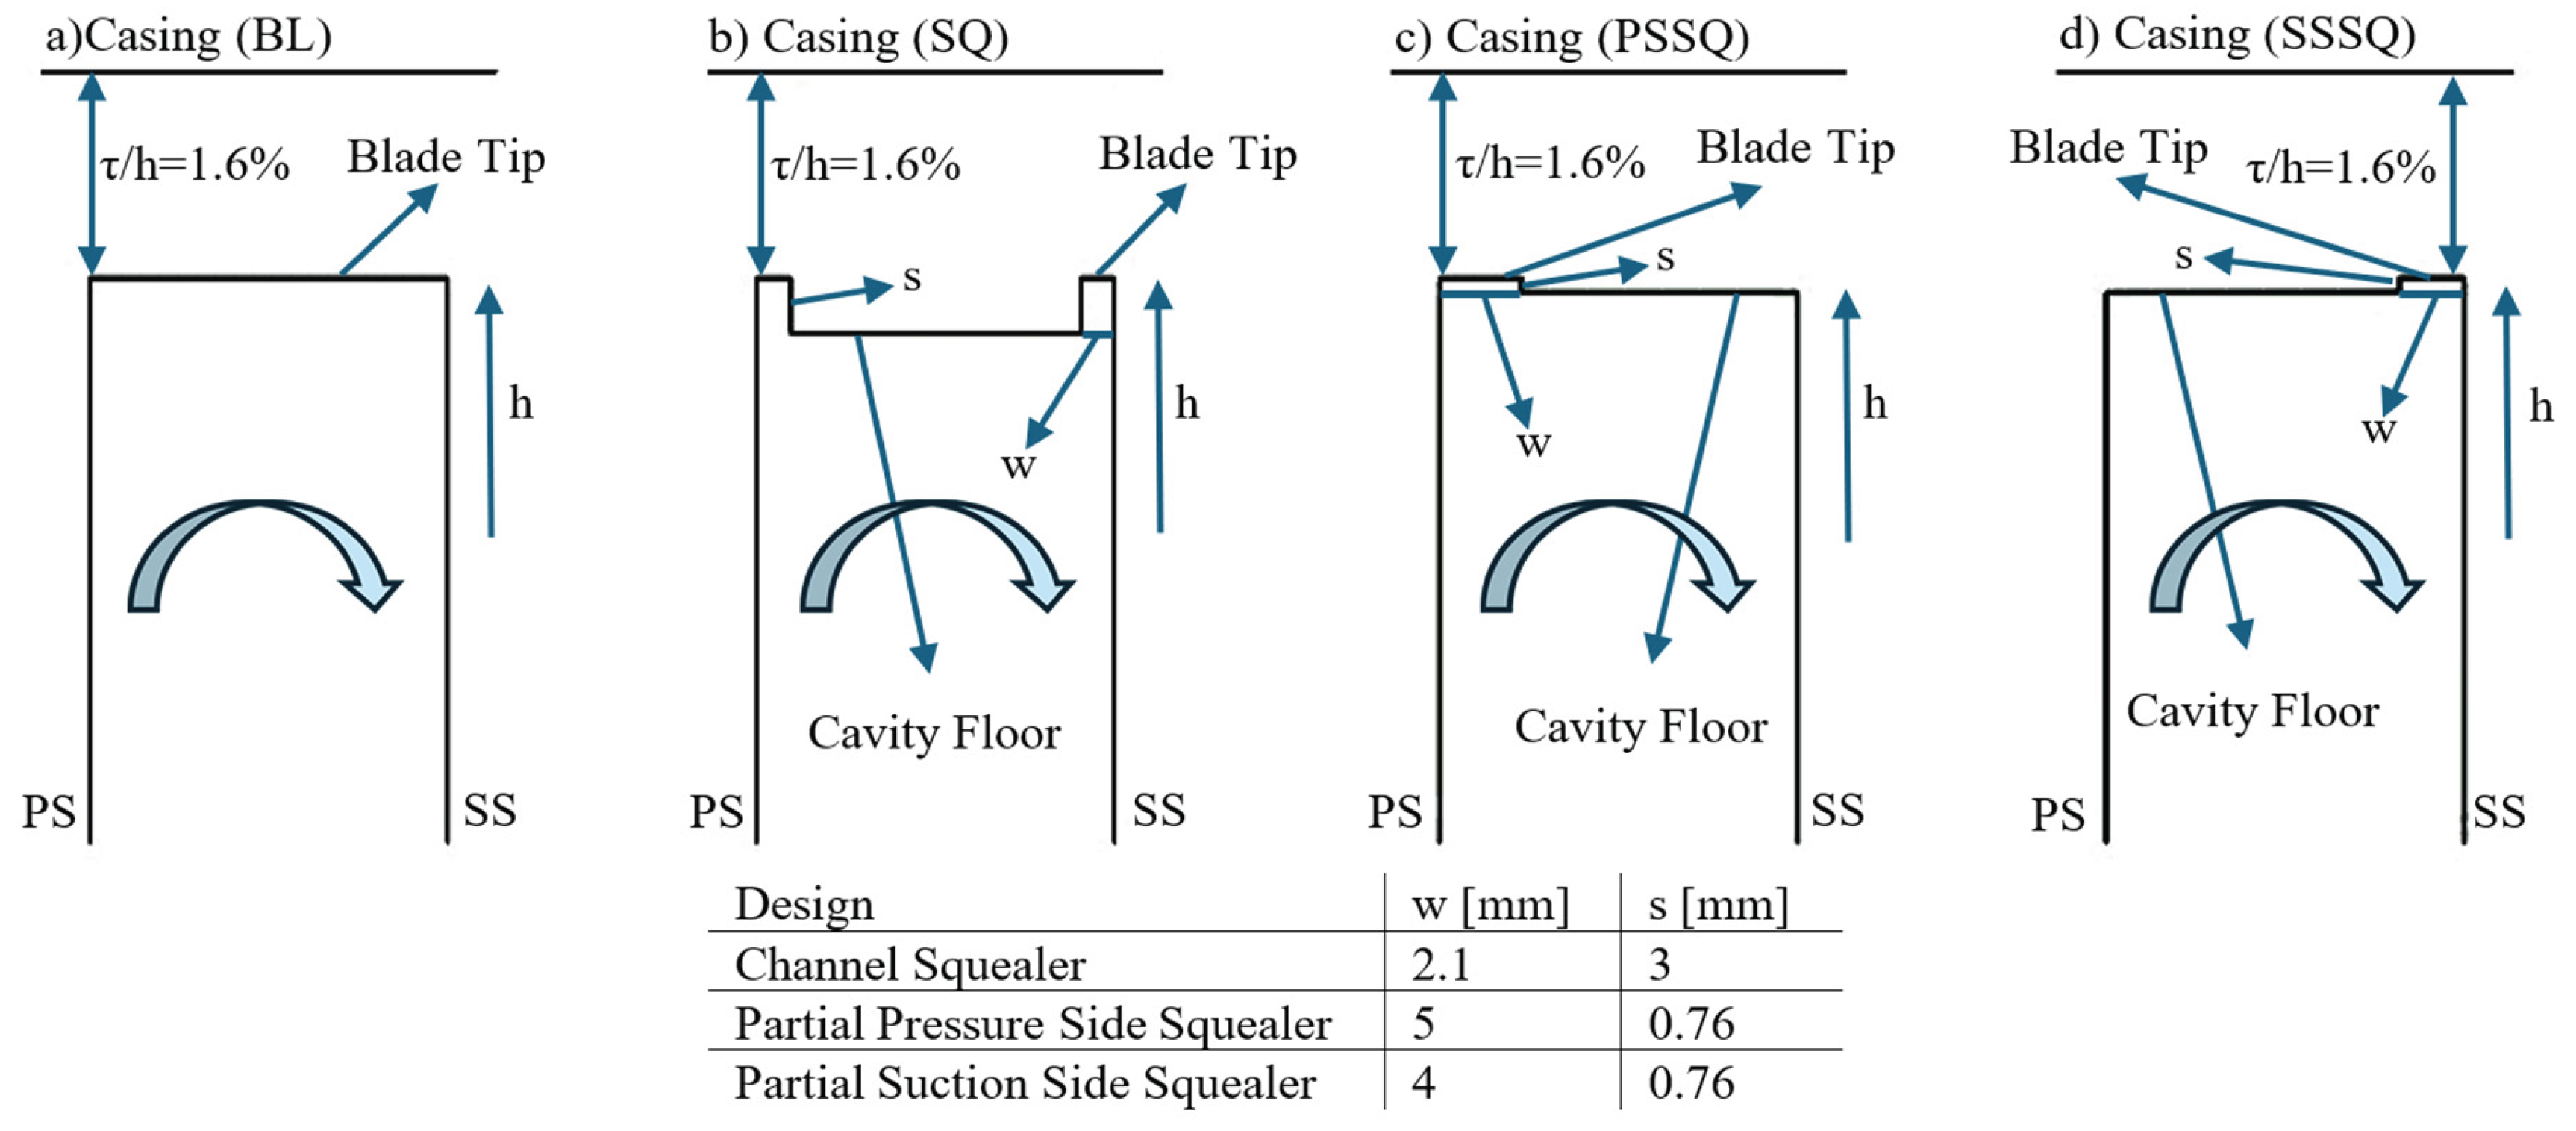
Figure 2.
Schematic of the Large-scale Turbine Research Facility AFTRF.
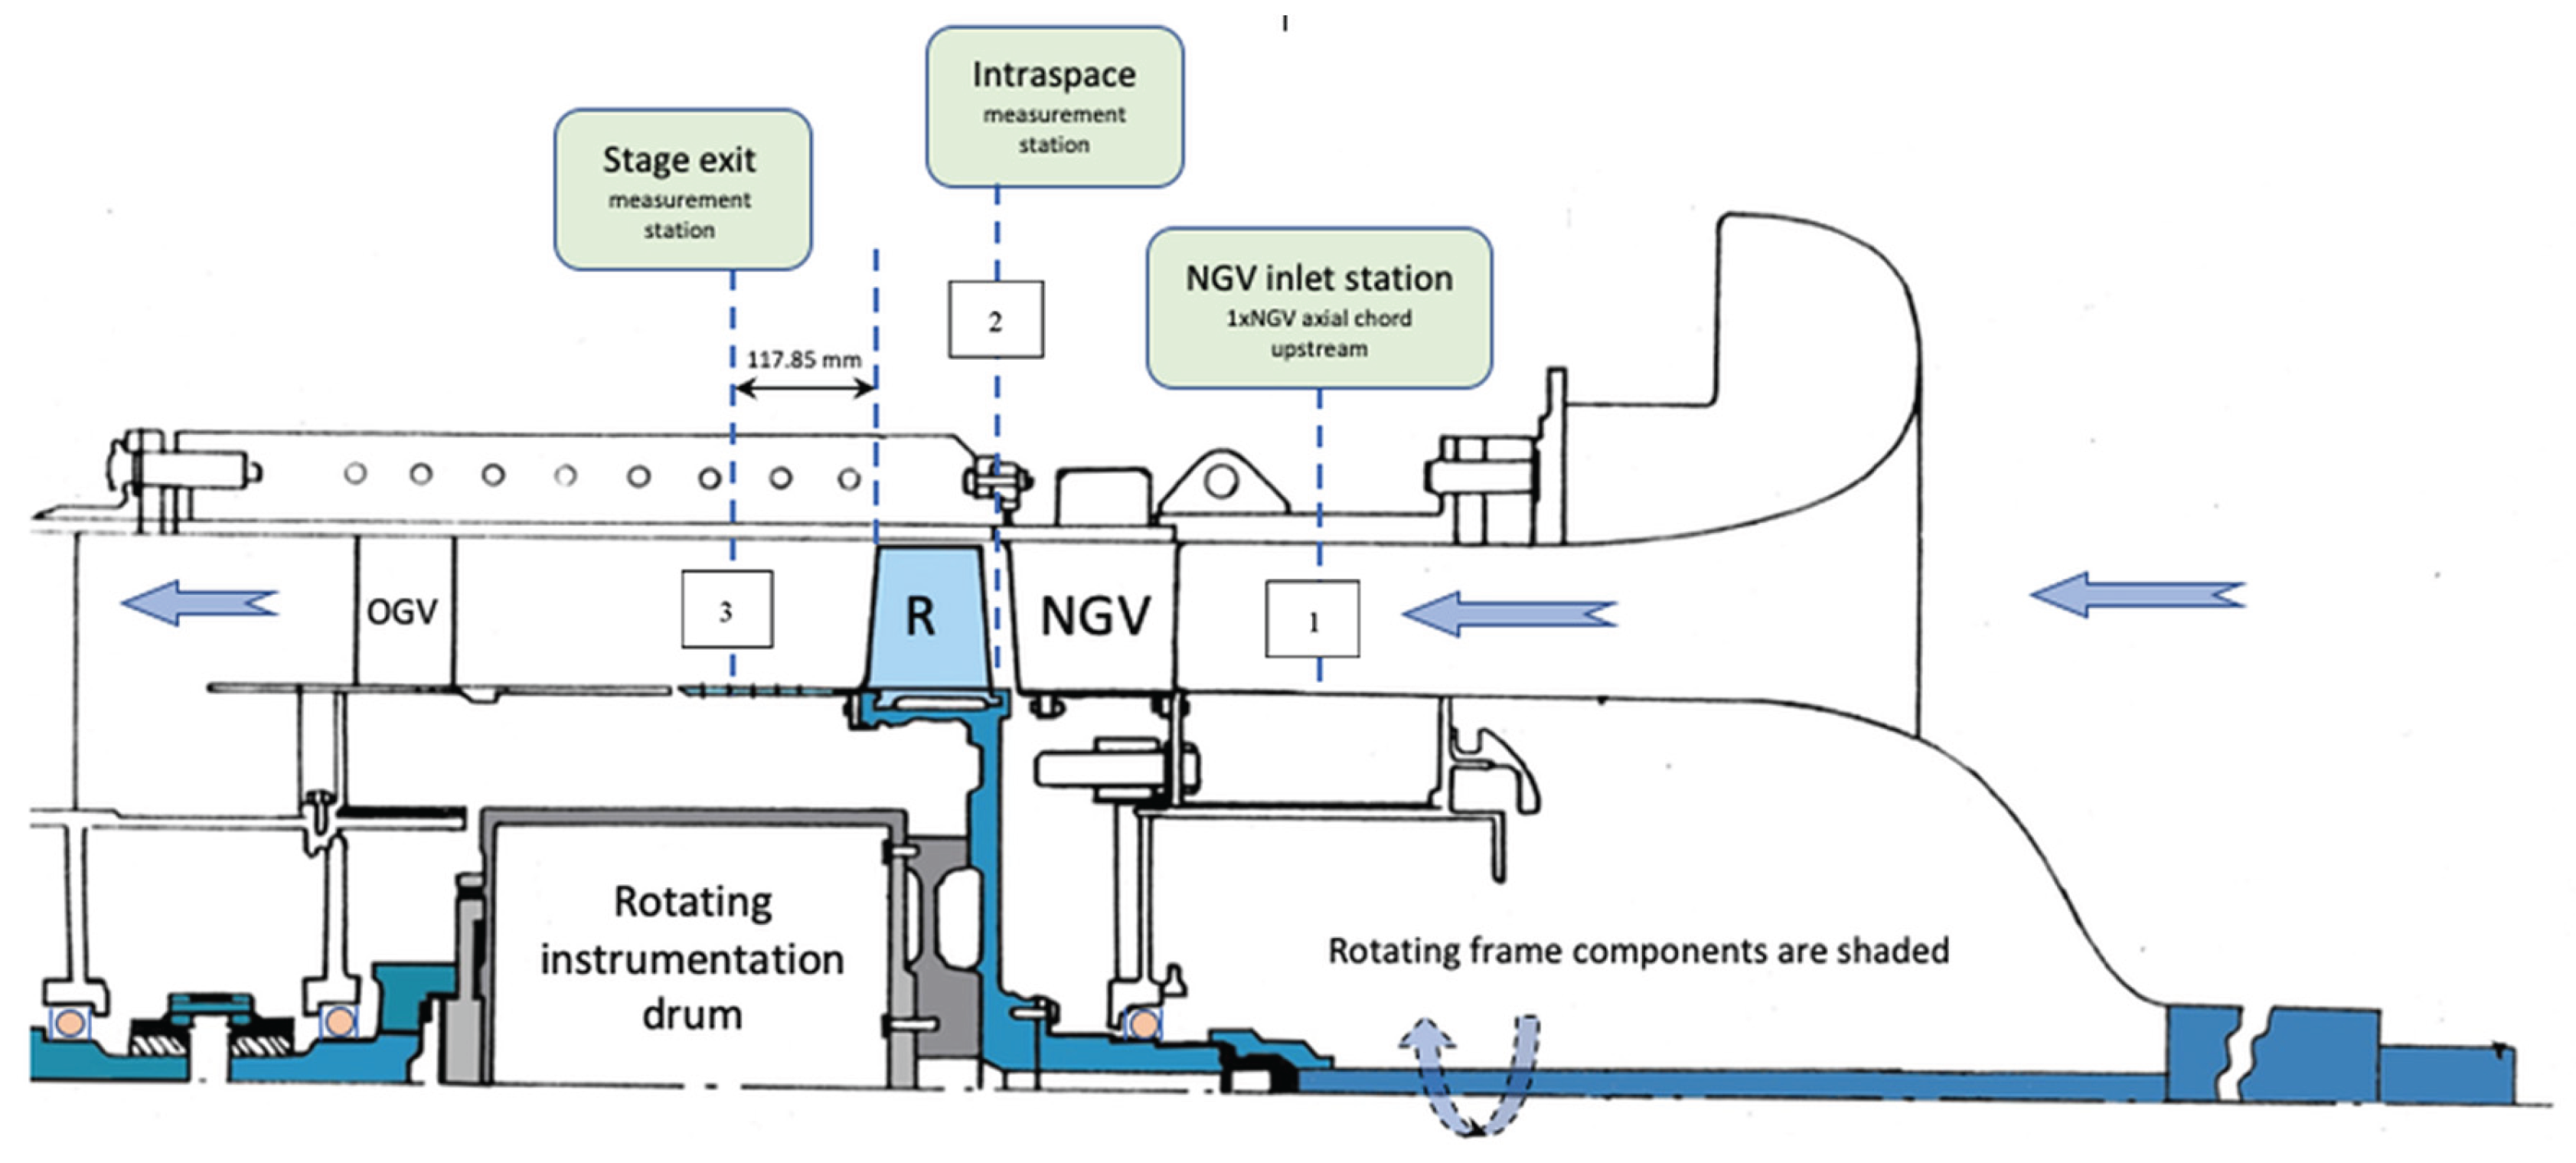
Figure 3.
Measured Turbine Inlet Velocity Magnitude and Turbulent Kinetic Energy Distribution [23,24,25].
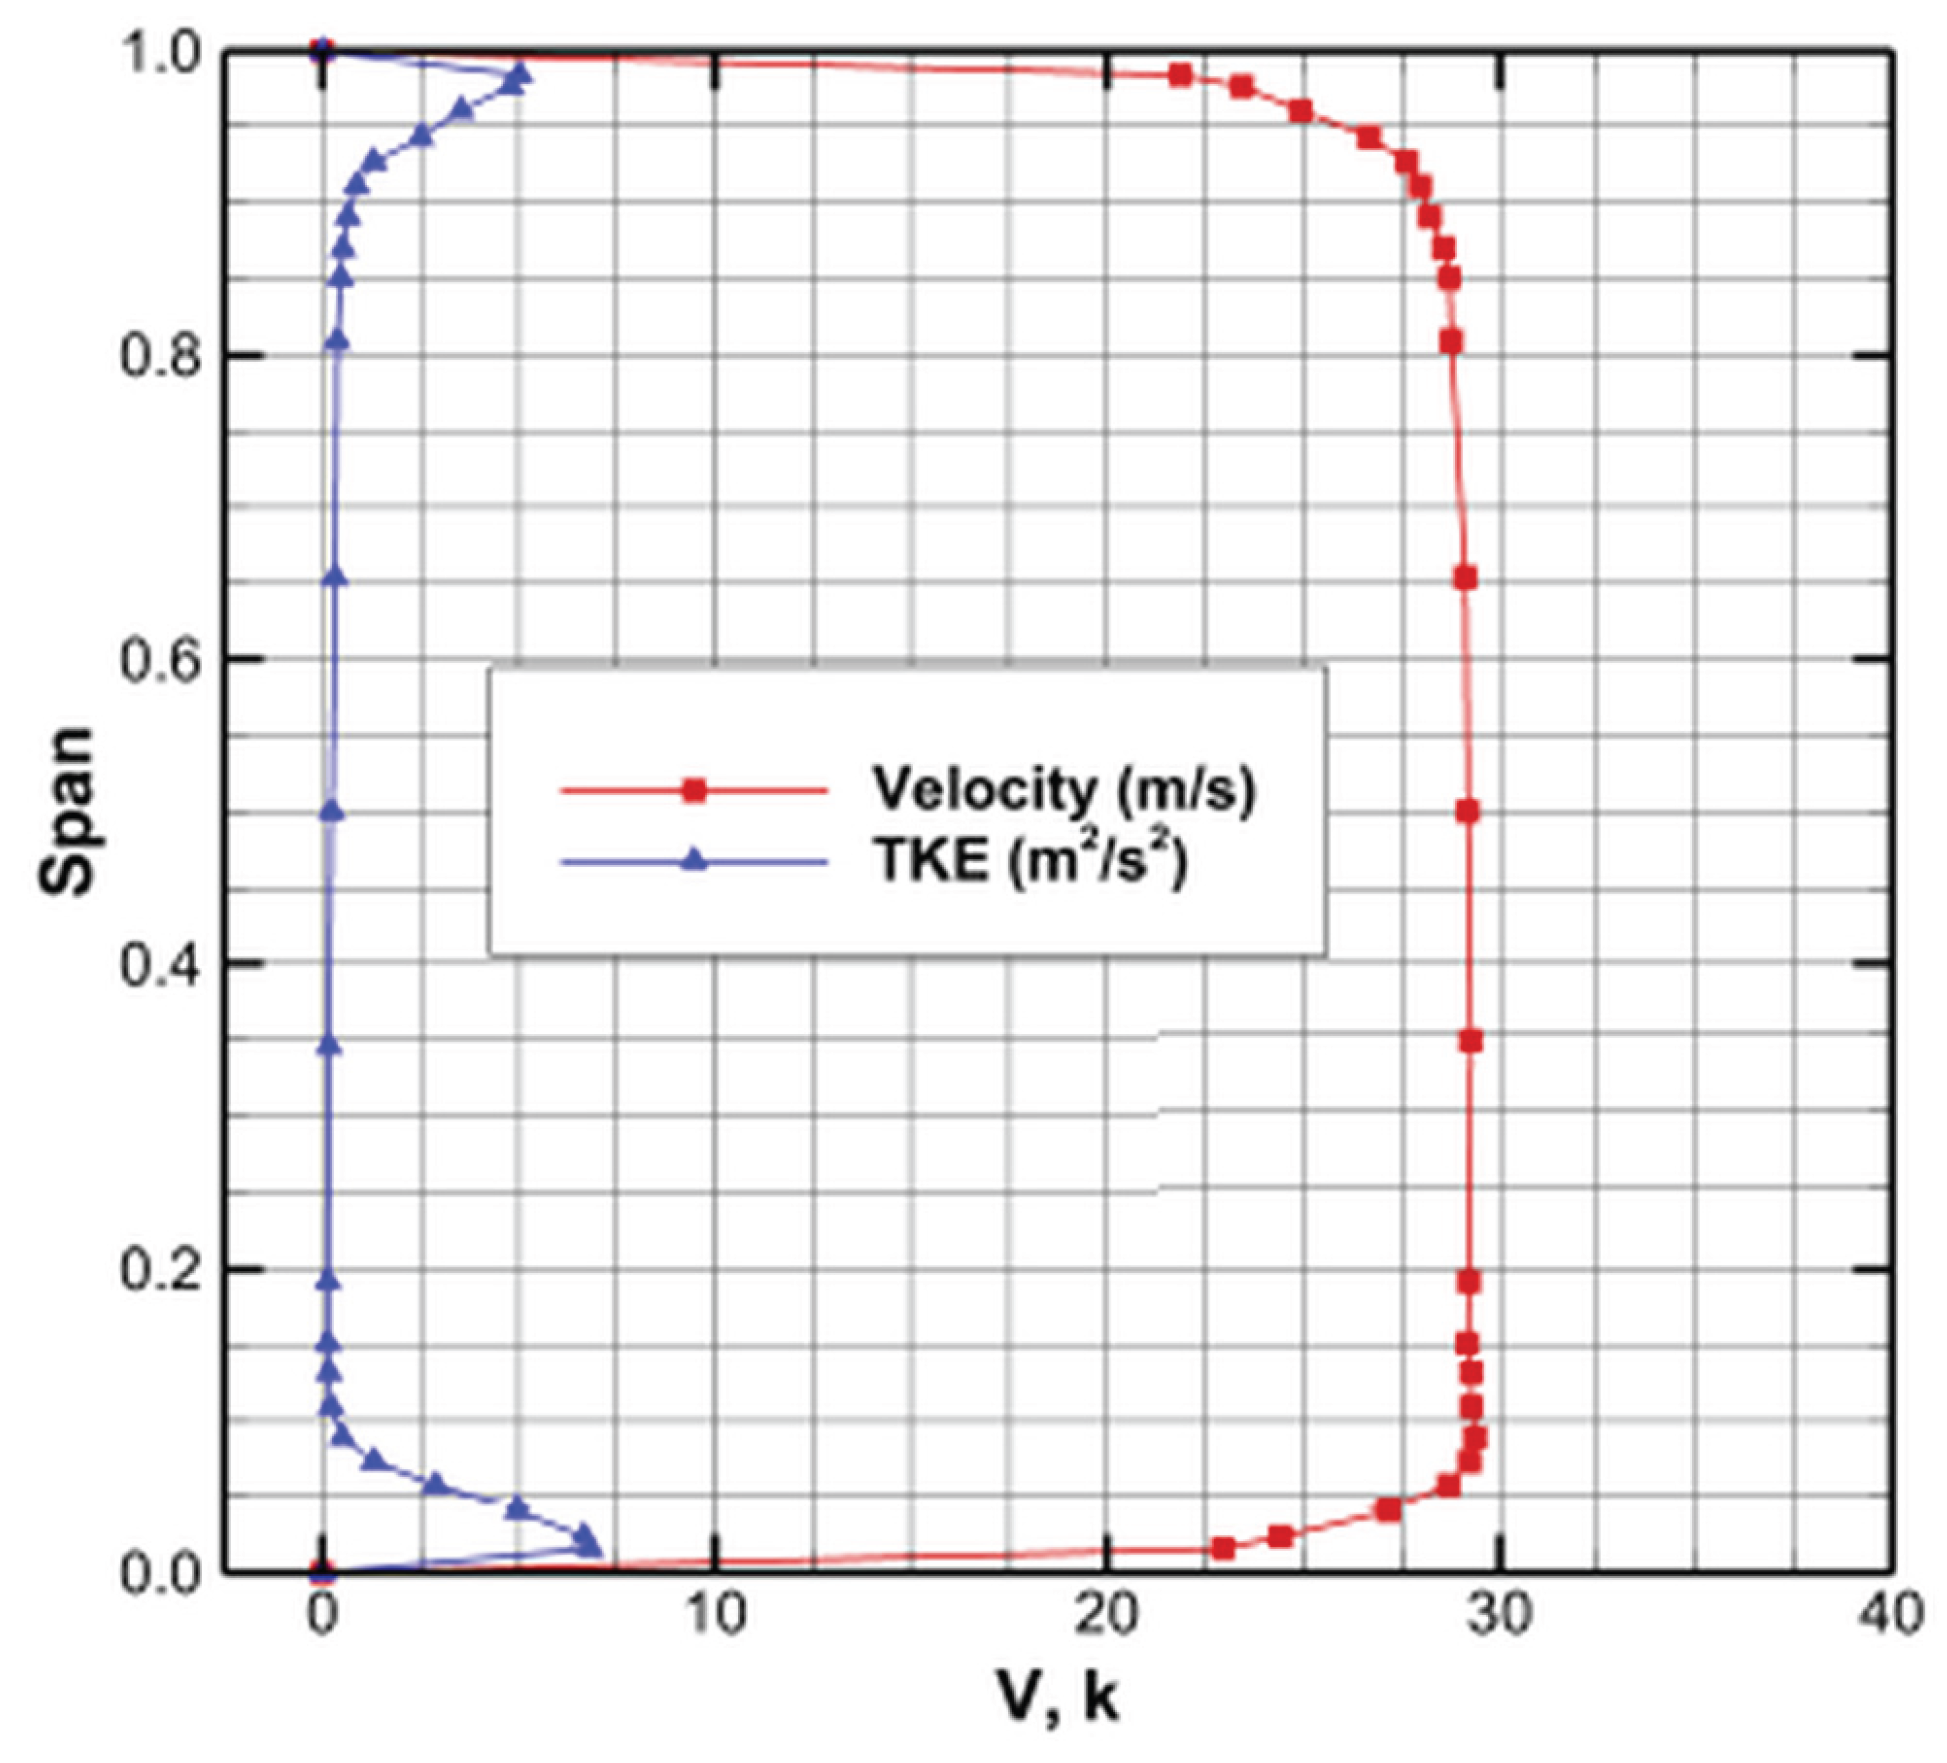
Figure 4.
The Turbine Stage Geometry at the Tip Section, as the Projection of the Cylindrical Plane Passing Through the Baseline Tip Platform.
Figure 4.
The Turbine Stage Geometry at the Tip Section, as the Projection of the Cylindrical Plane Passing Through the Baseline Tip Platform.
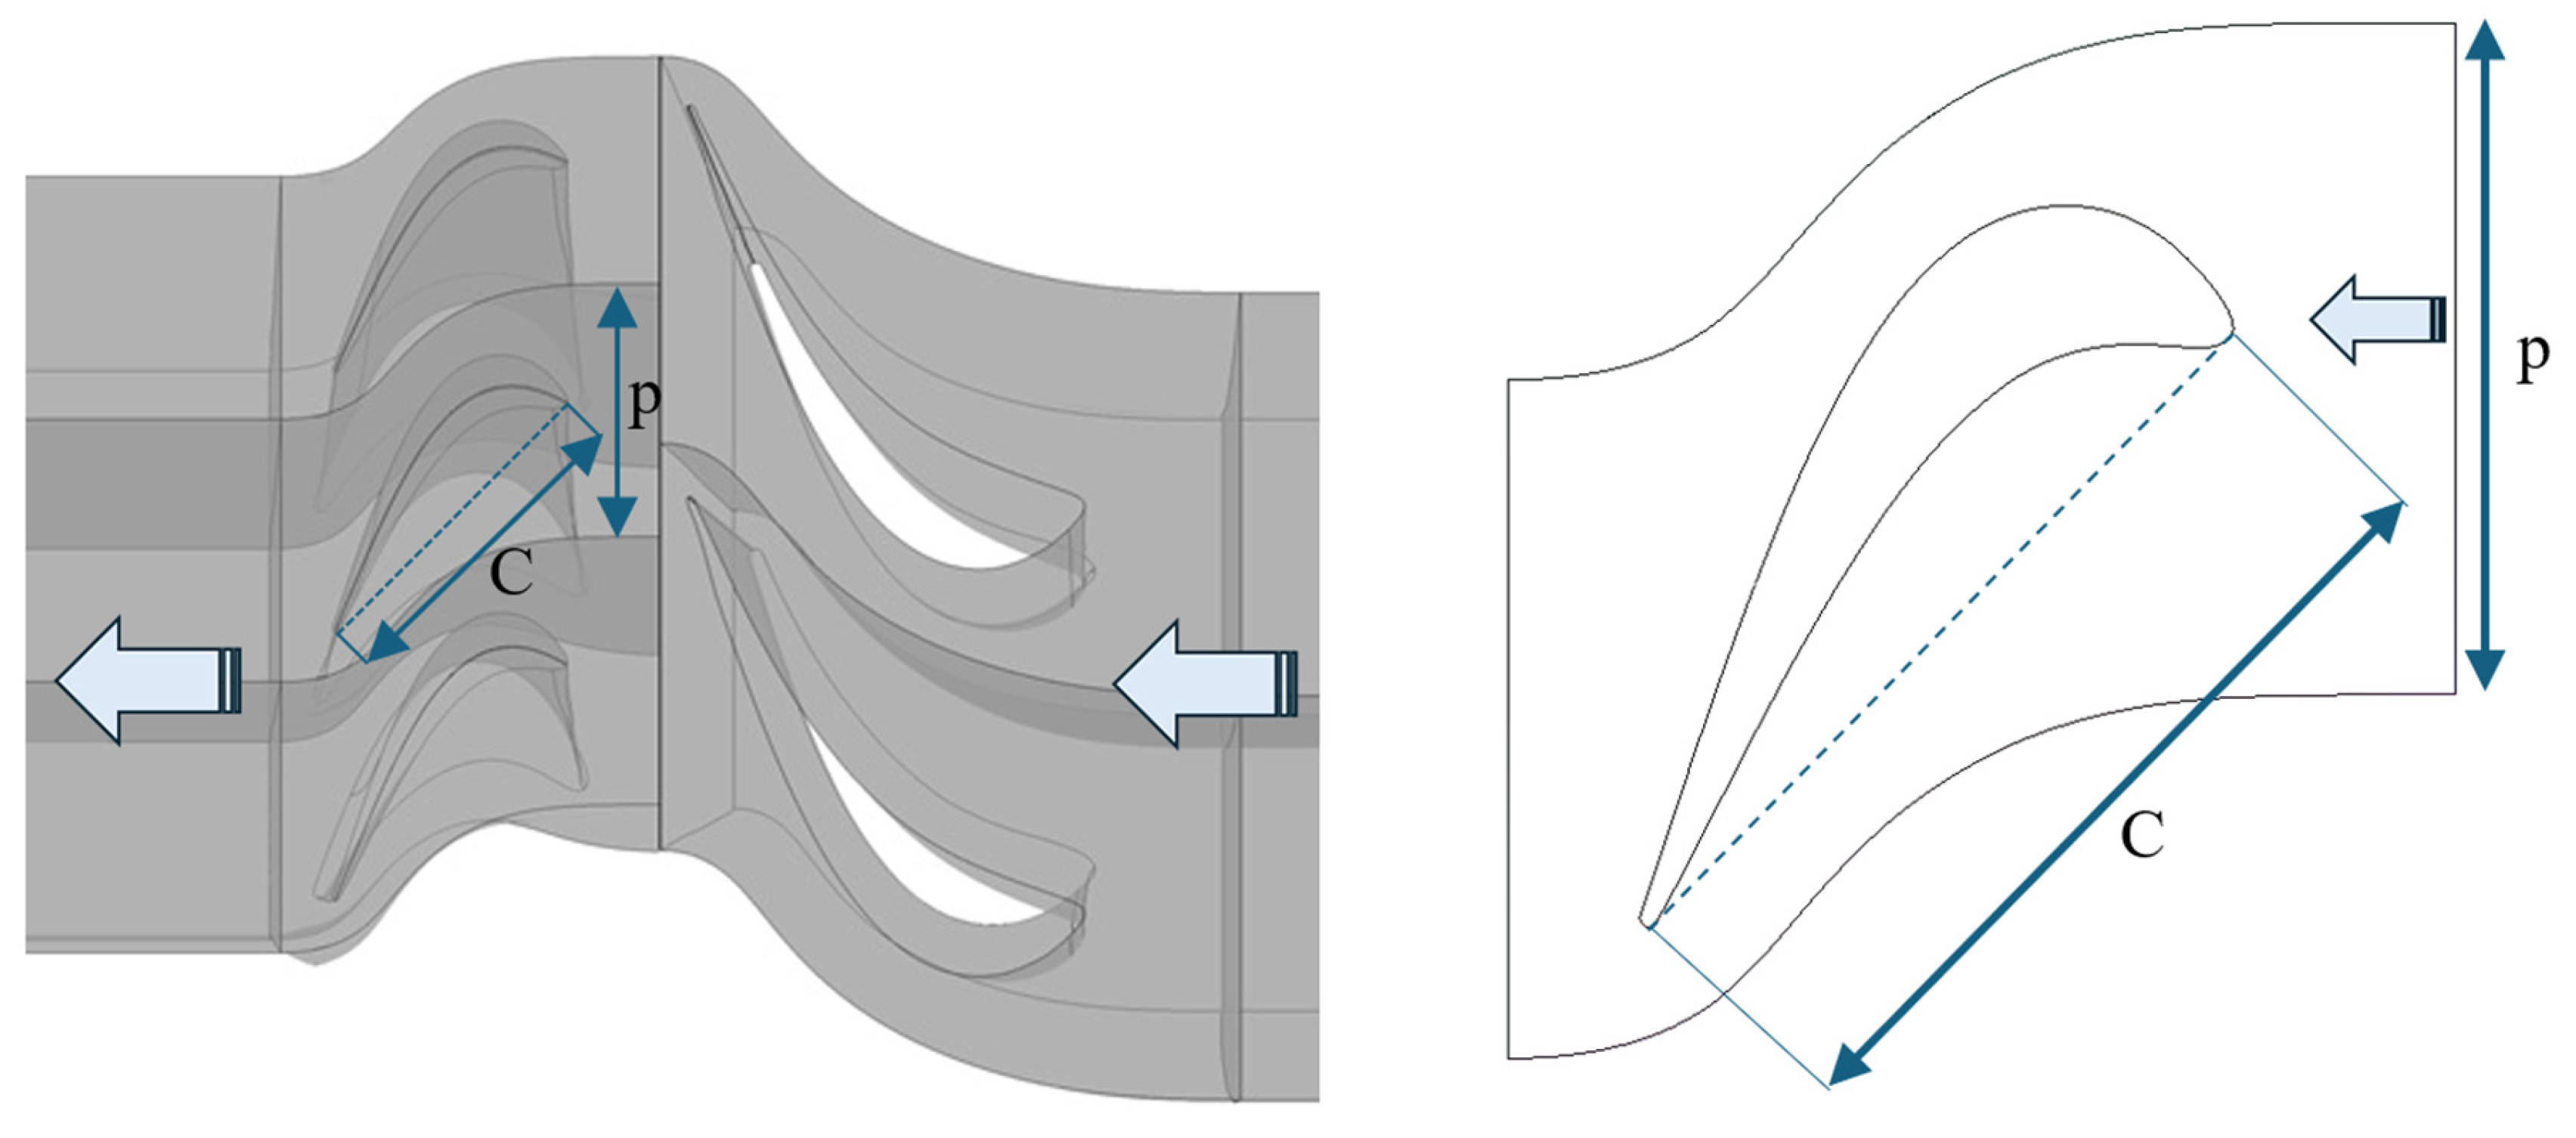
Figure 5.
Fully Hexahedral Mesh for the Case with Channel Squealer.
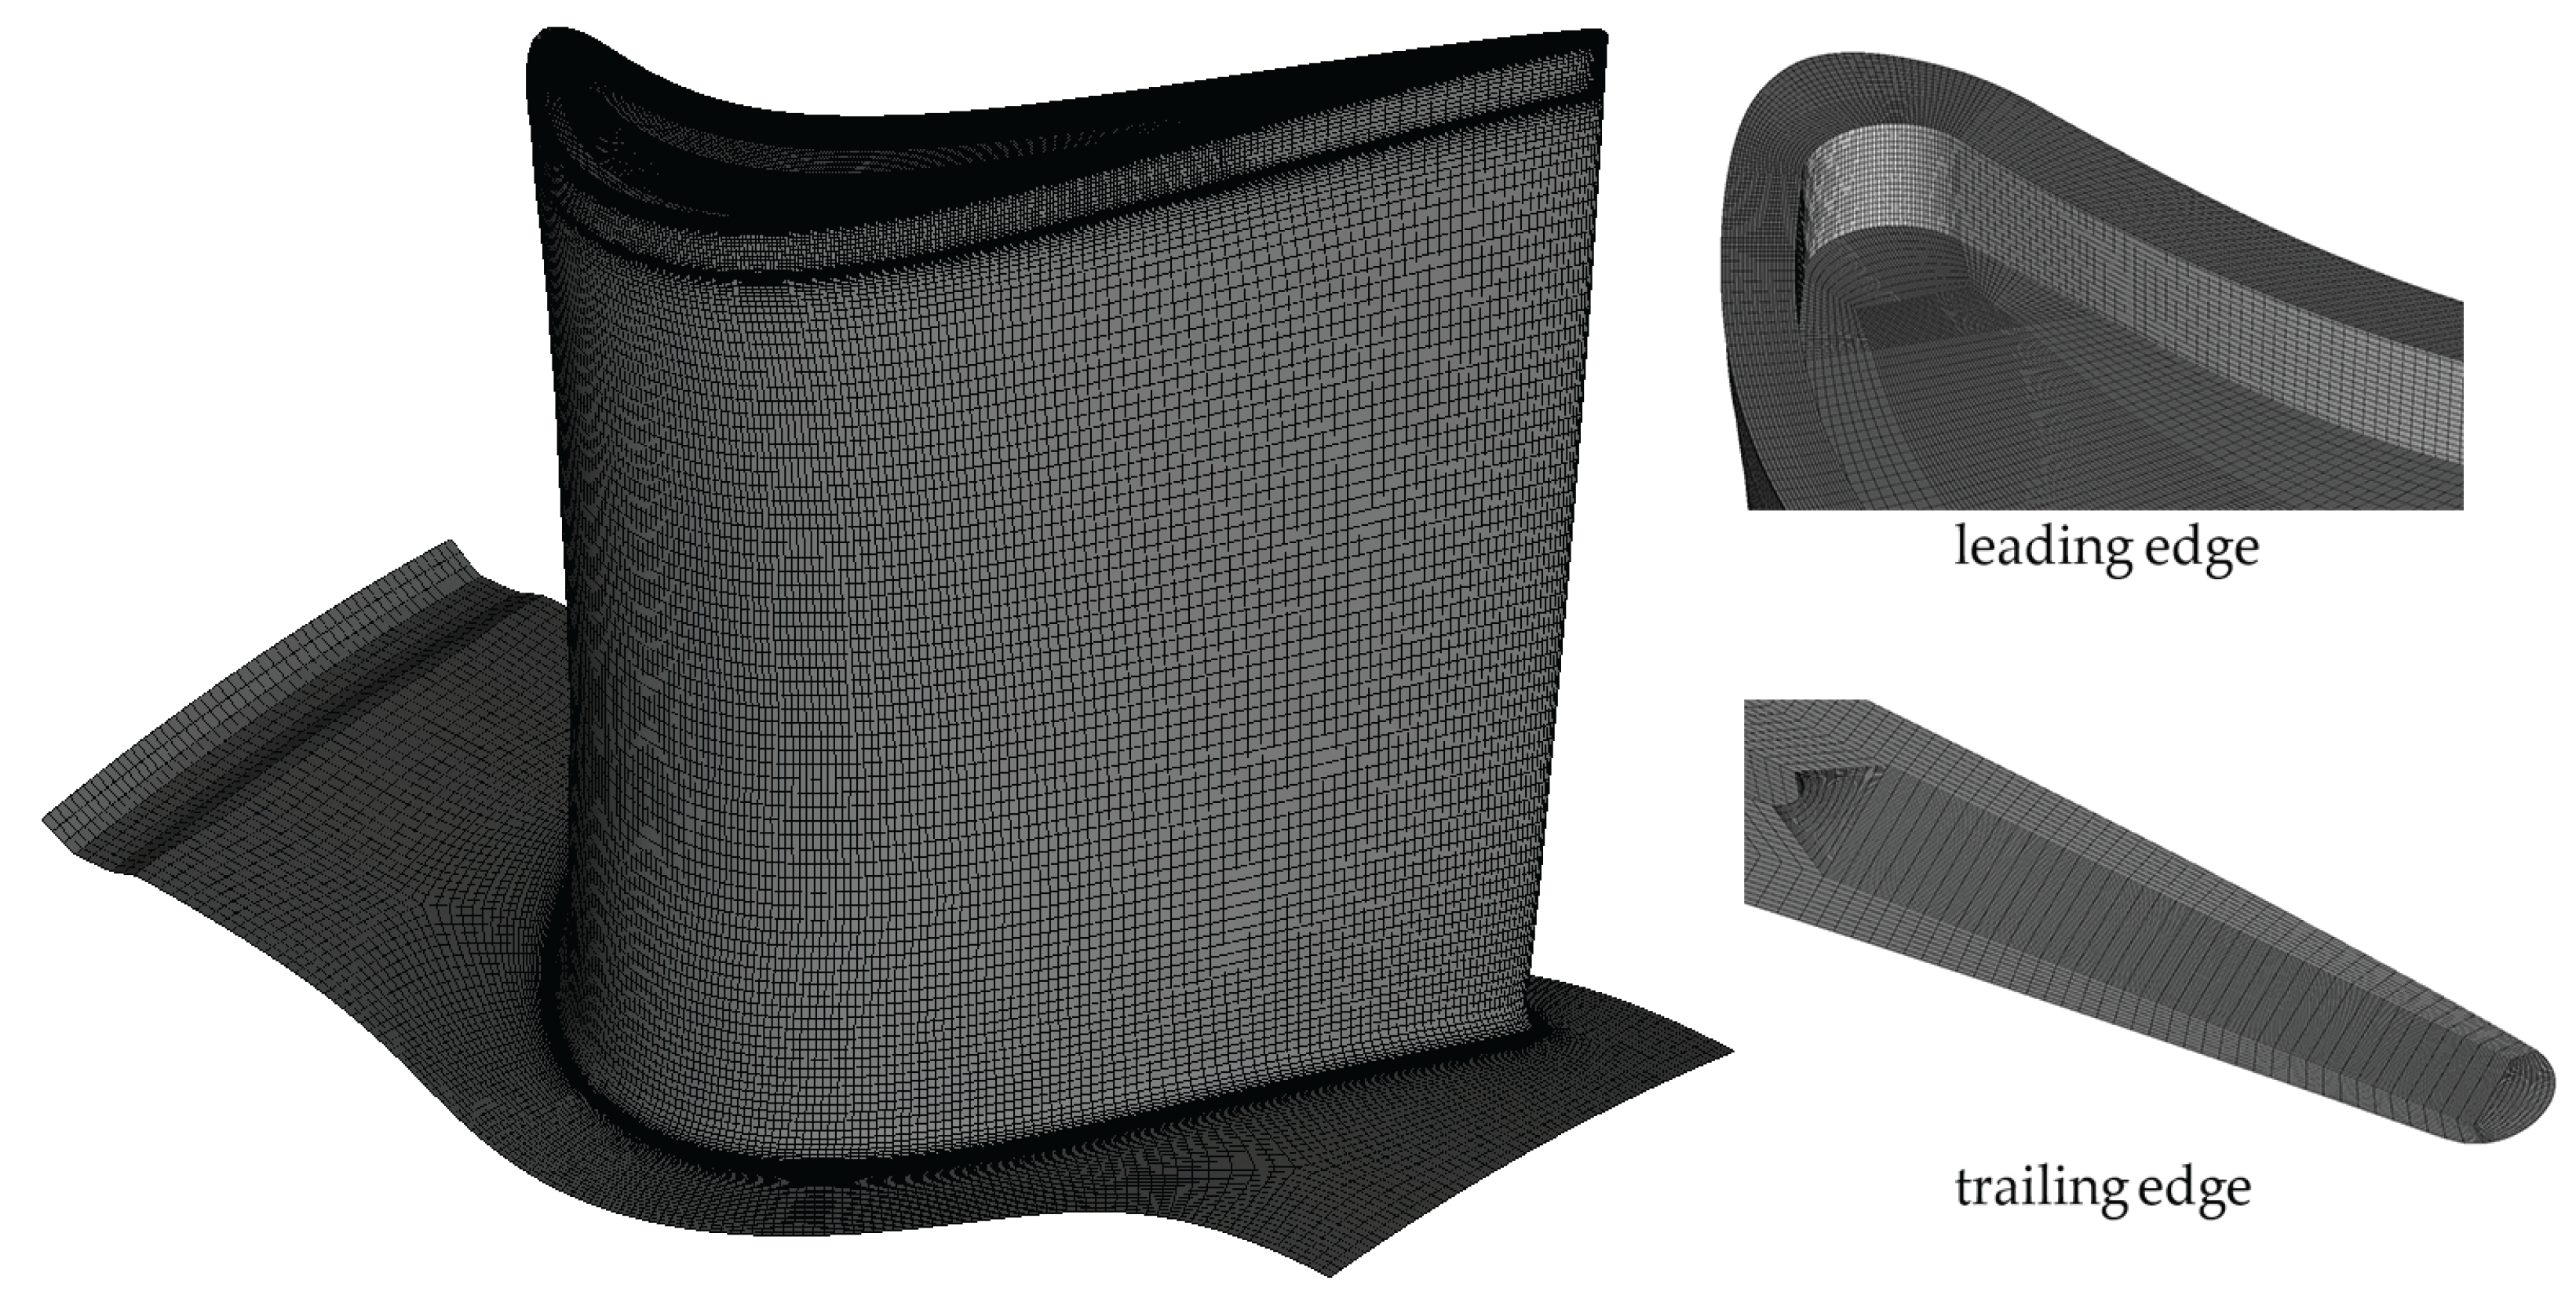
Figure 6.
Injection Holes Arrangement.
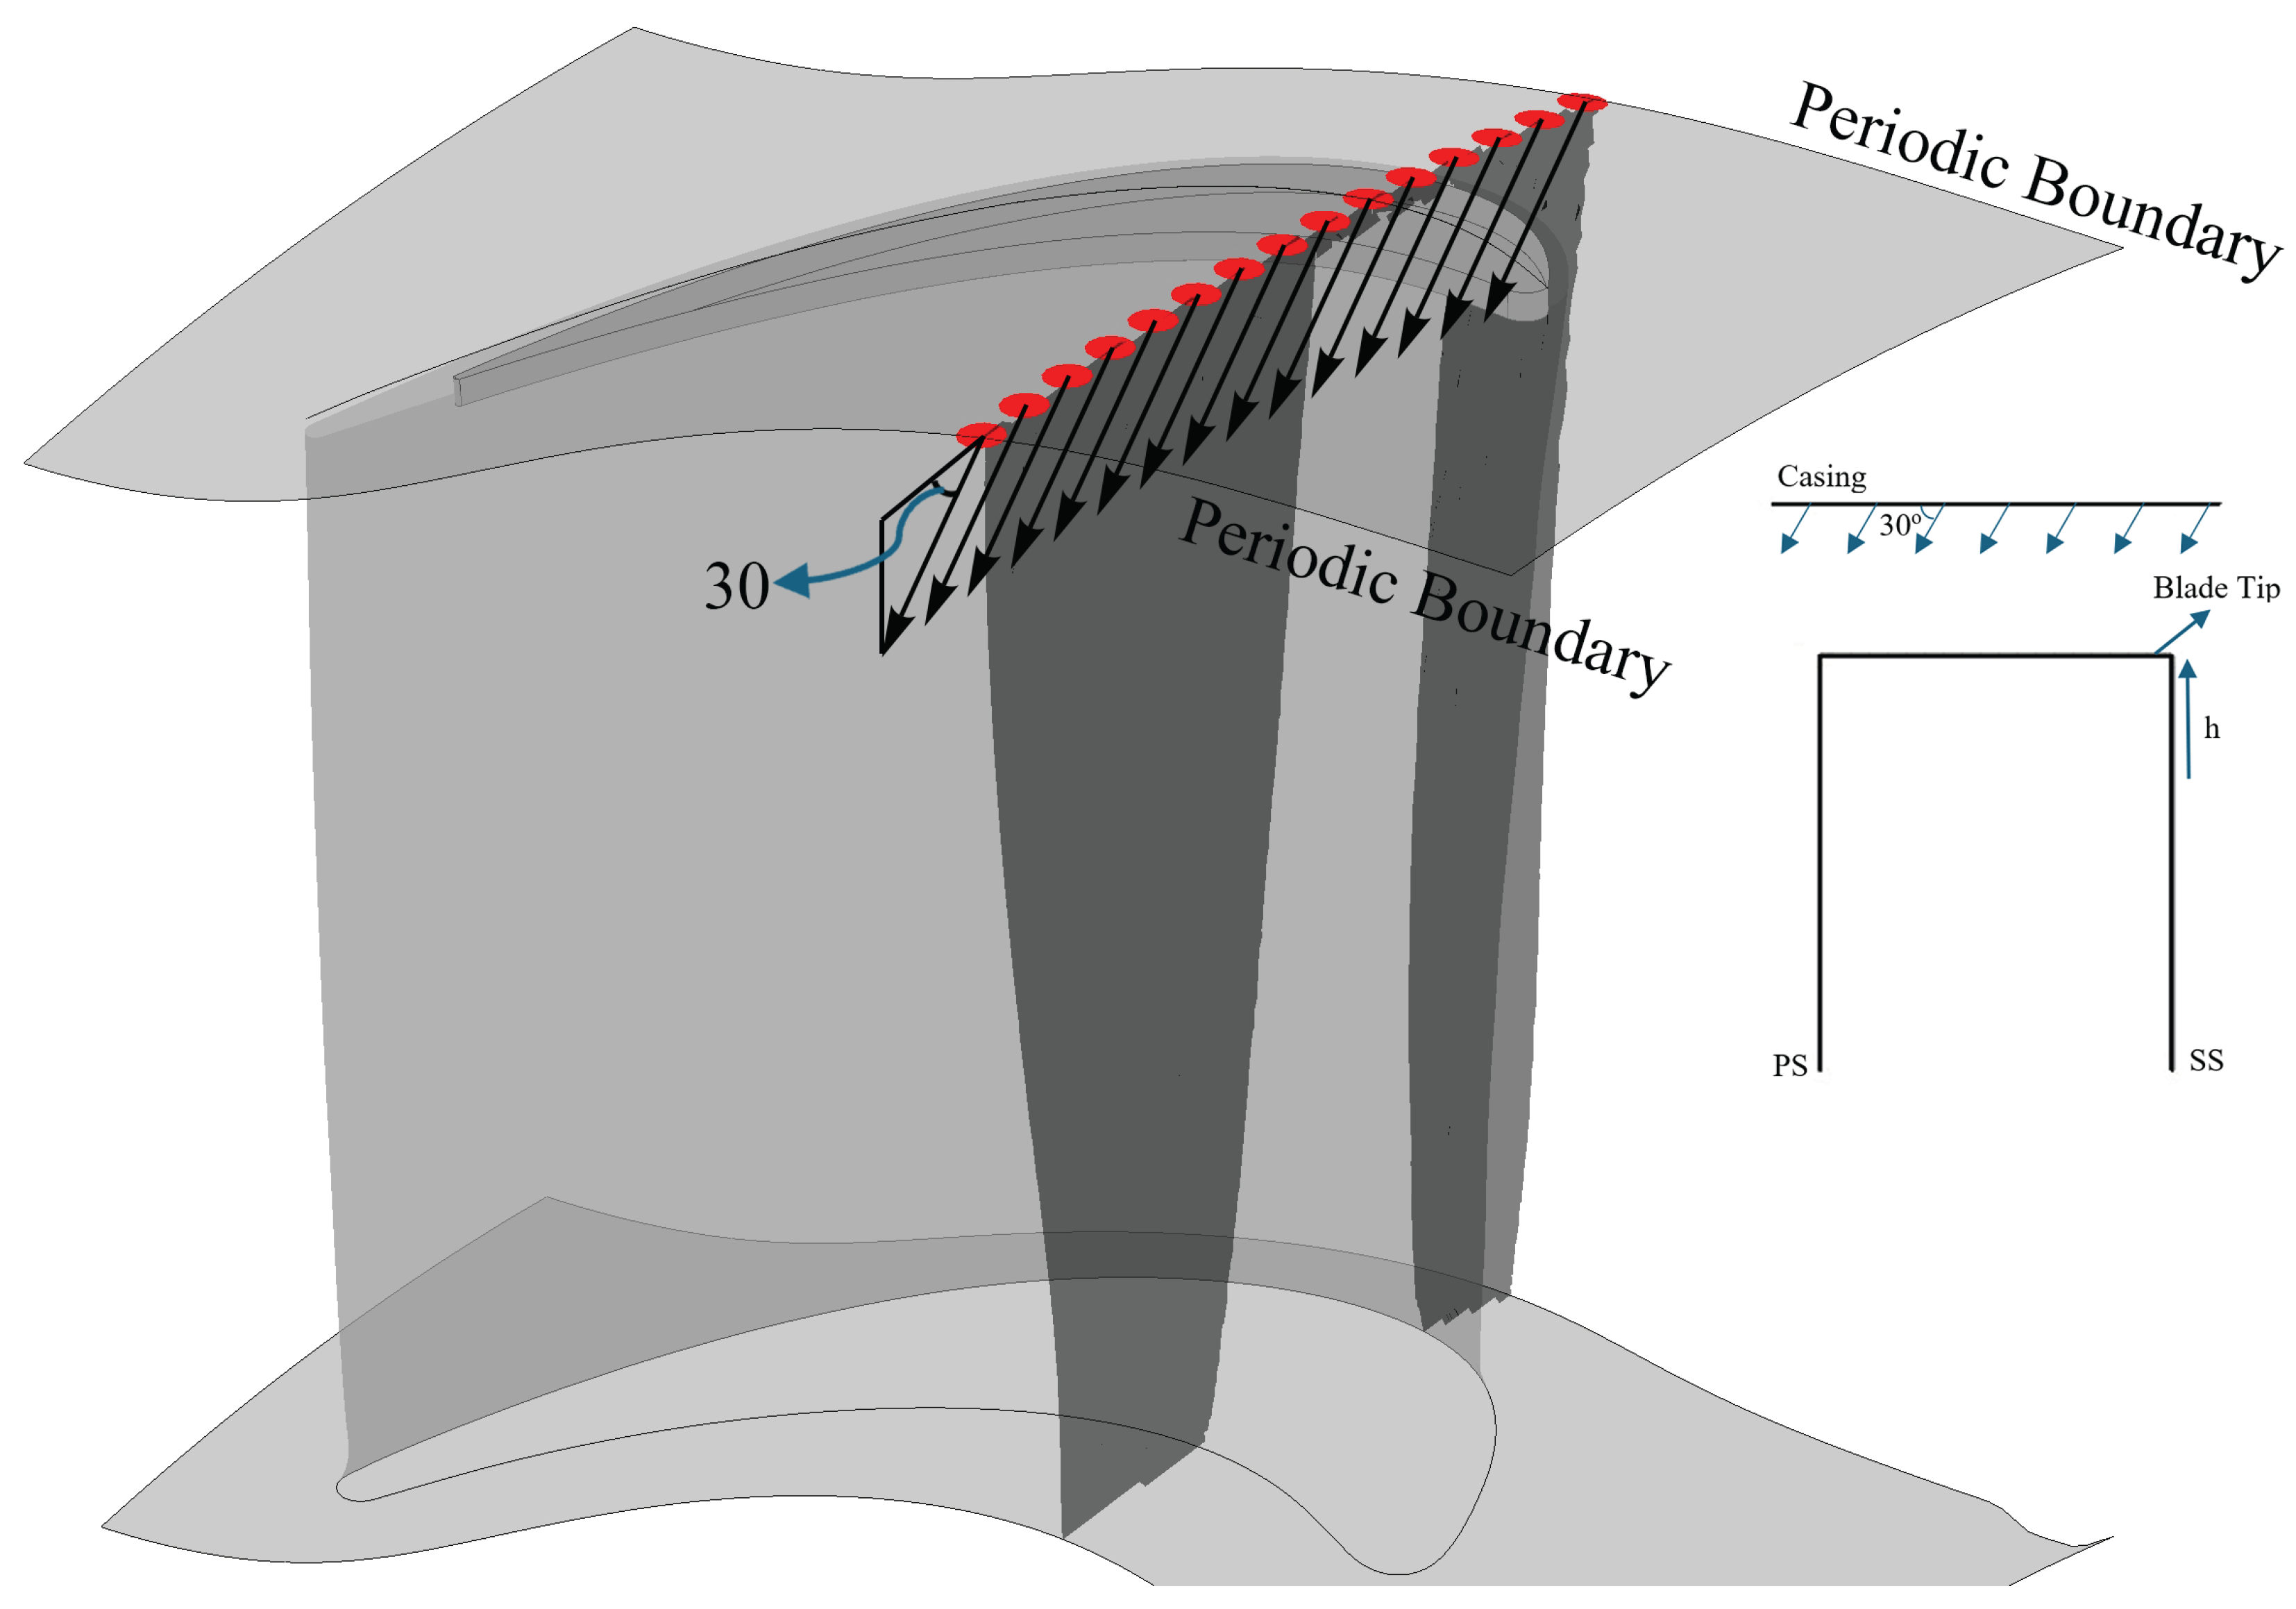
Figure 7.
Mesh Dependency and Comparison of URANS Based Blade Loading Computations Against AFTRF Rotor Mid-span Measurements.
Figure 7.
Mesh Dependency and Comparison of URANS Based Blade Loading Computations Against AFTRF Rotor Mid-span Measurements.
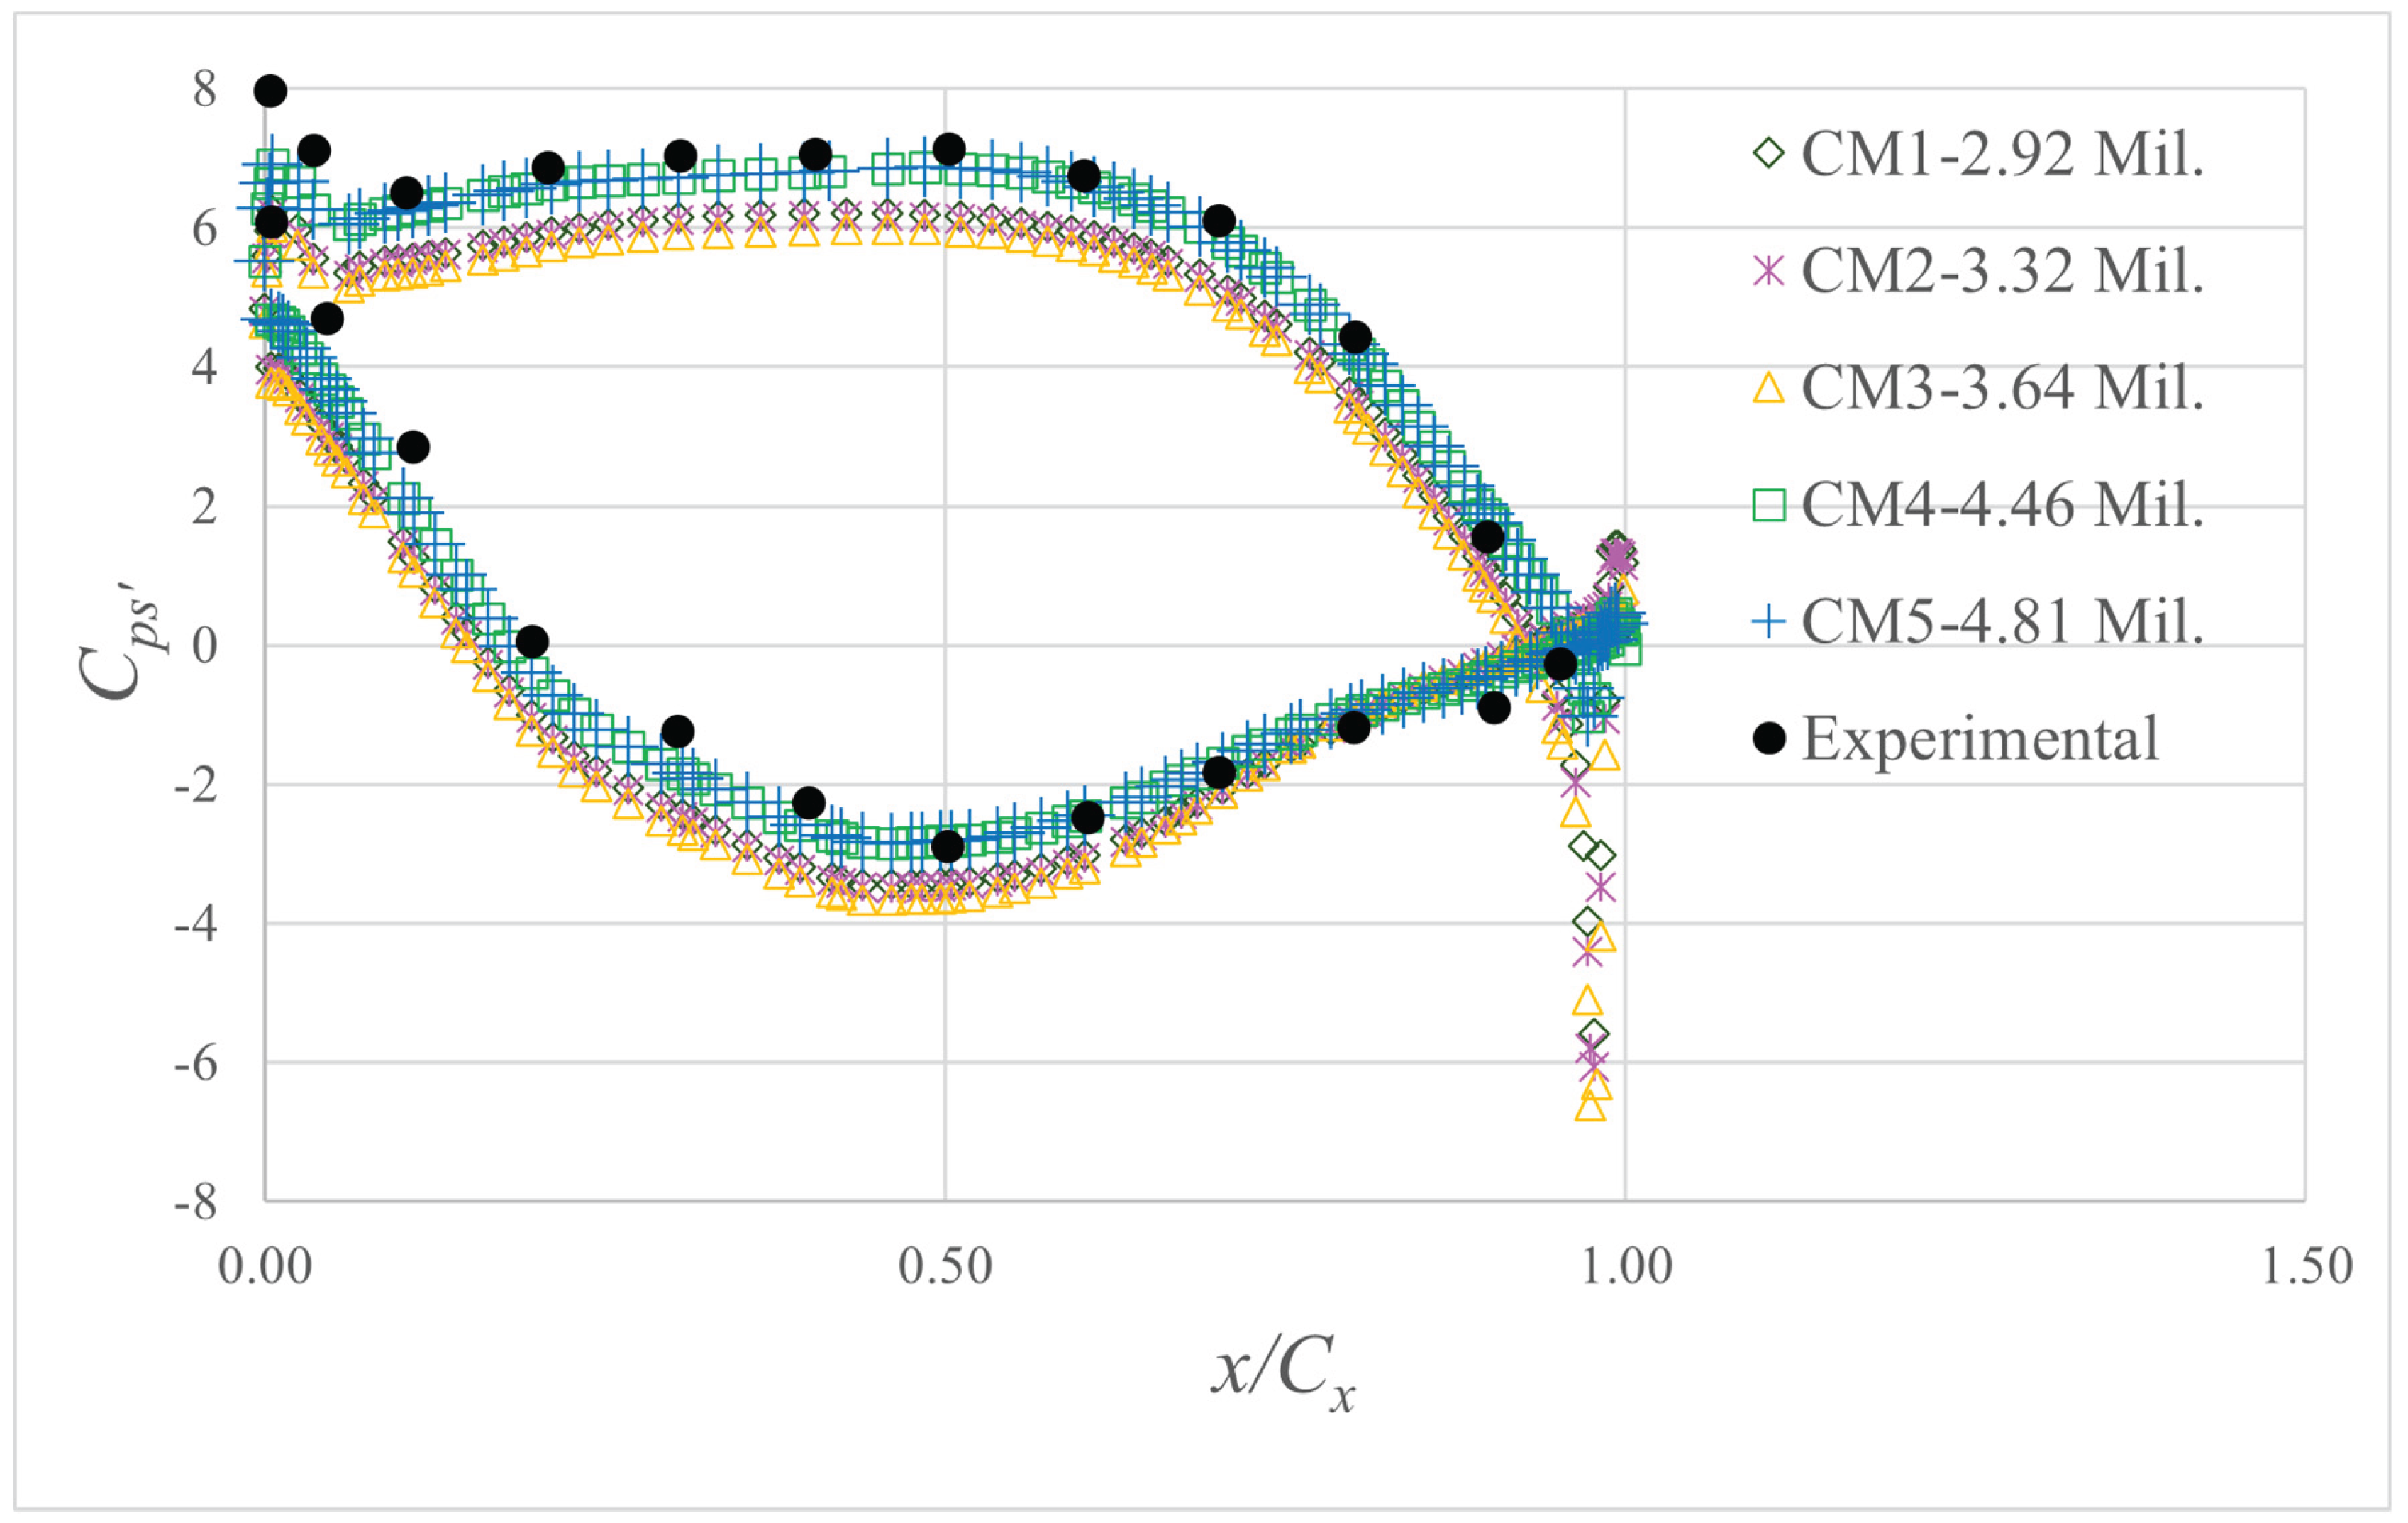
Figure 8.
Three Components of the Measured Velocity Vector Compared to Current URANS Computations at AFTRF NGV Exit.
Figure 8.
Three Components of the Measured Velocity Vector Compared to Current URANS Computations at AFTRF NGV Exit.
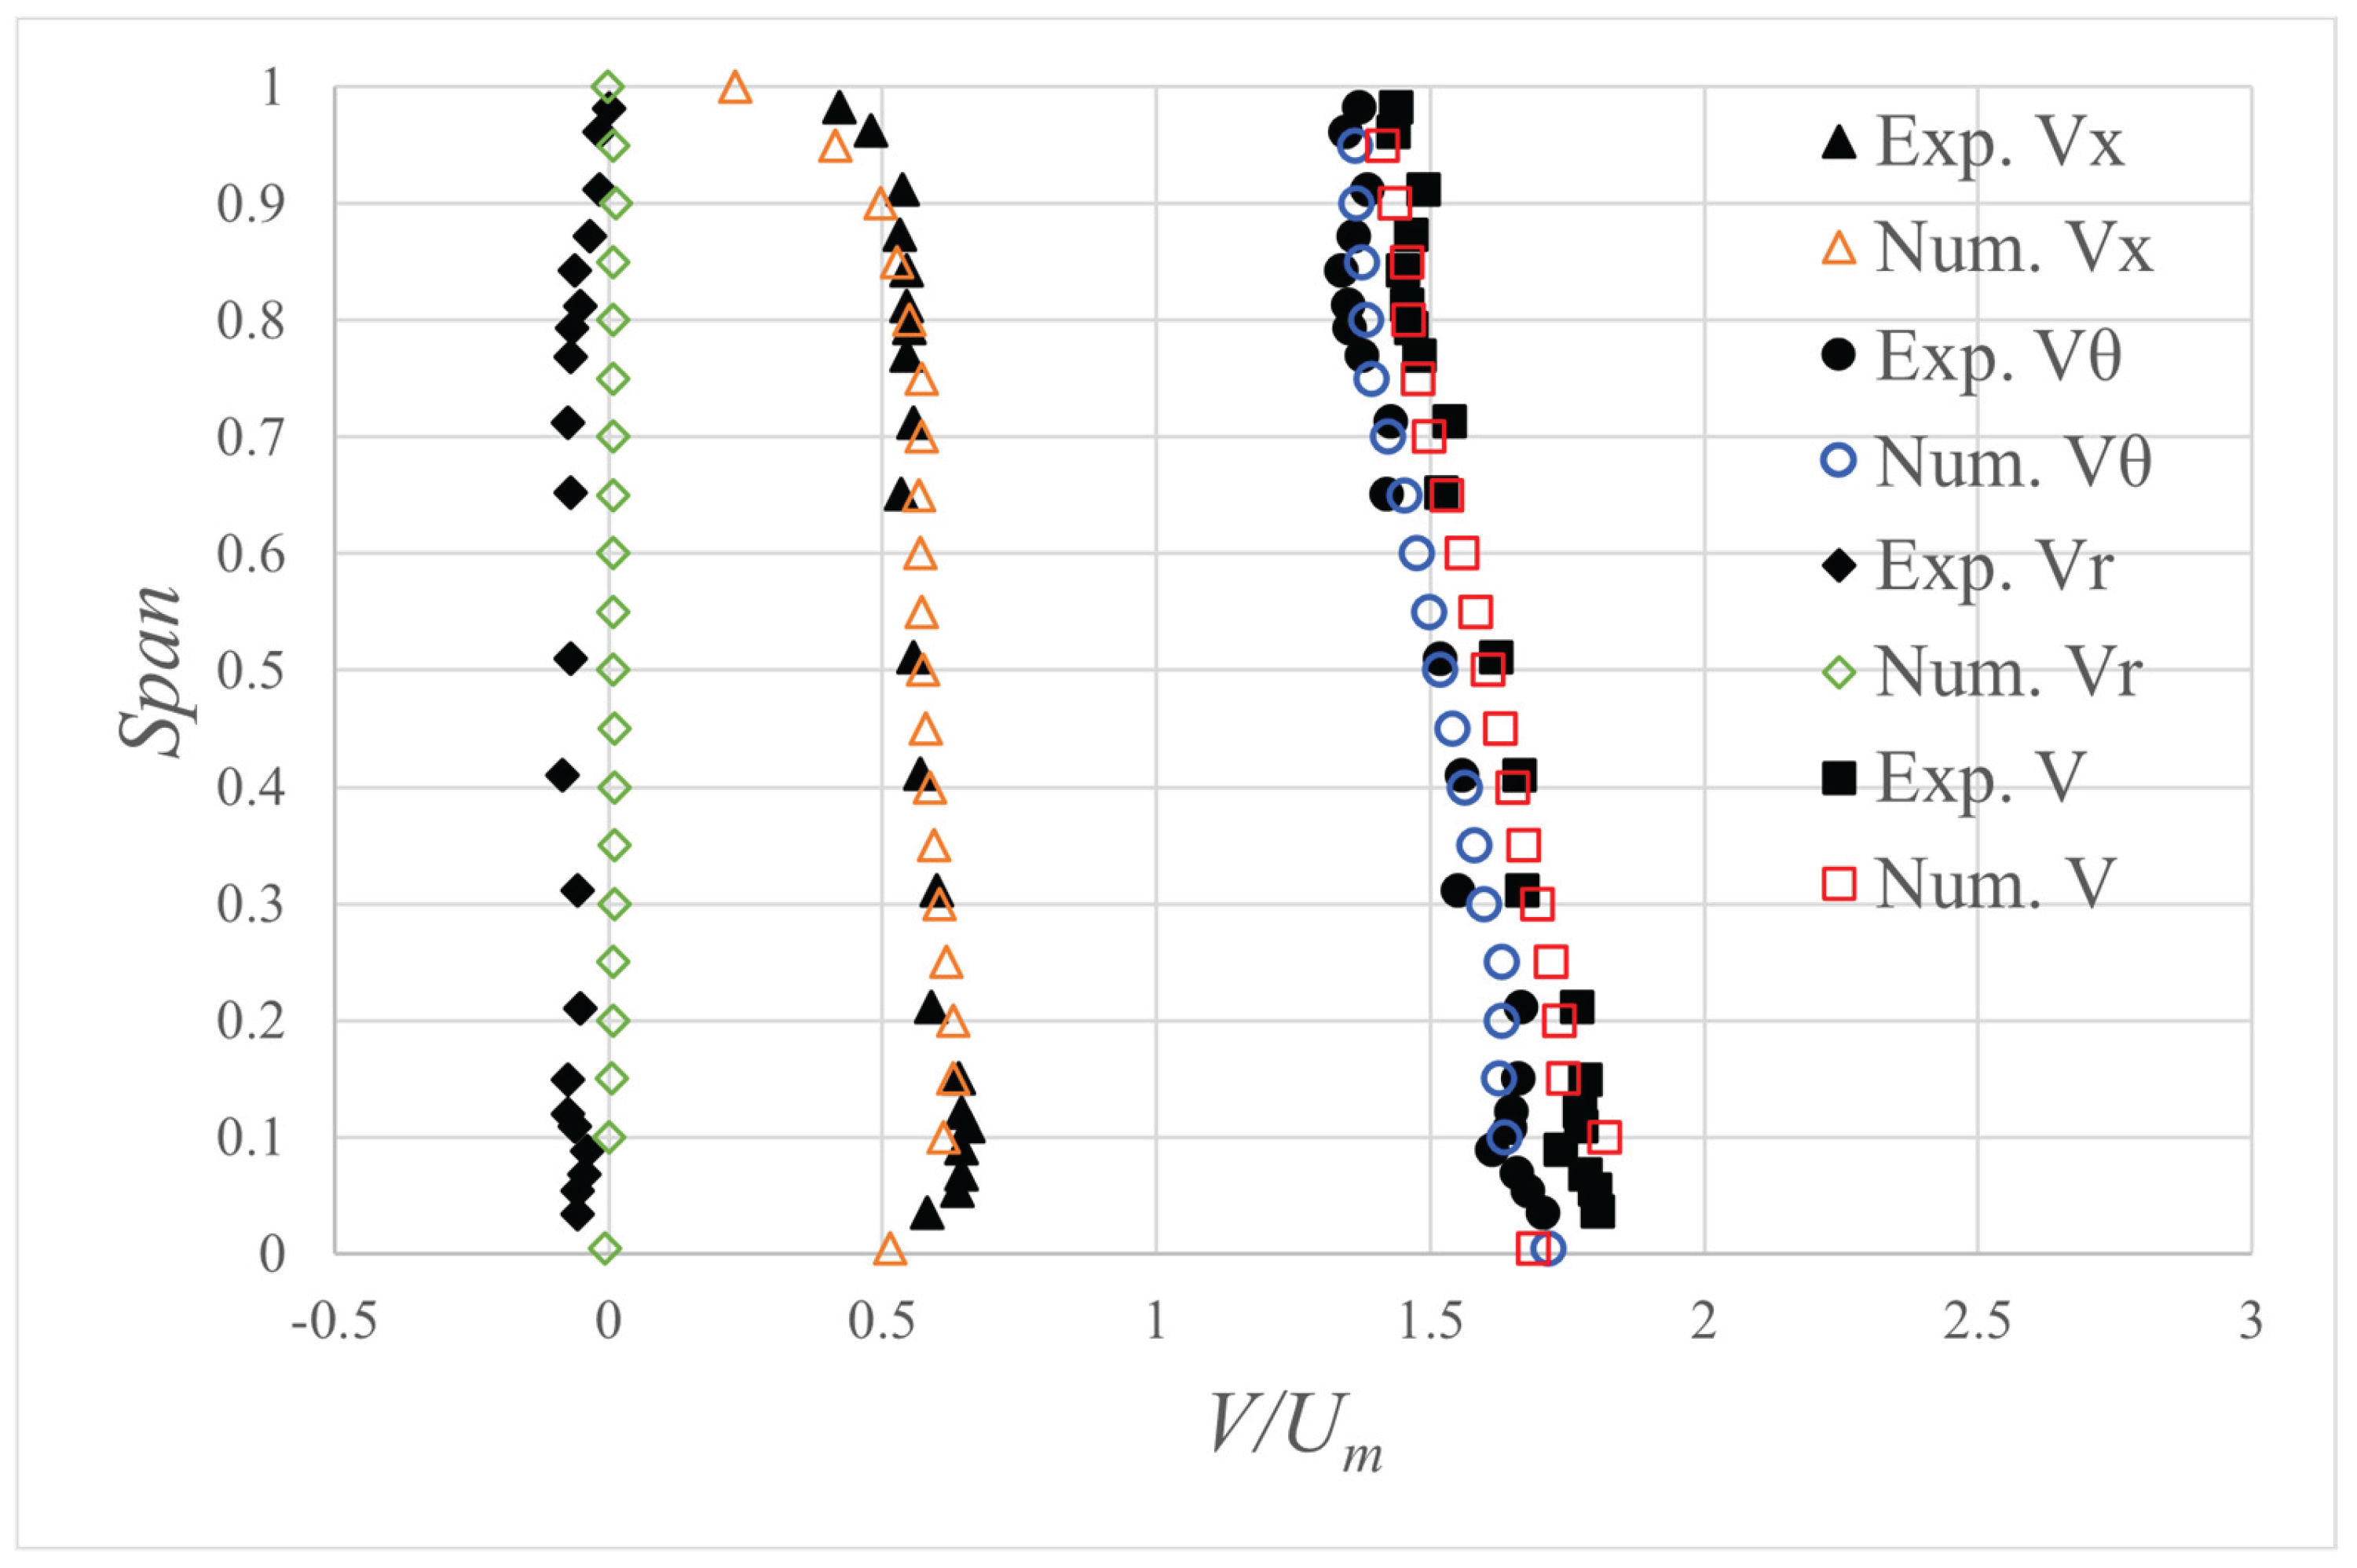
Figure 9.
Blade Tip Heat Transfer Coefficient Comparison of Flat Tip Design for Varying Mesh Resolutions.
Figure 9.
Blade Tip Heat Transfer Coefficient Comparison of Flat Tip Design for Varying Mesh Resolutions.
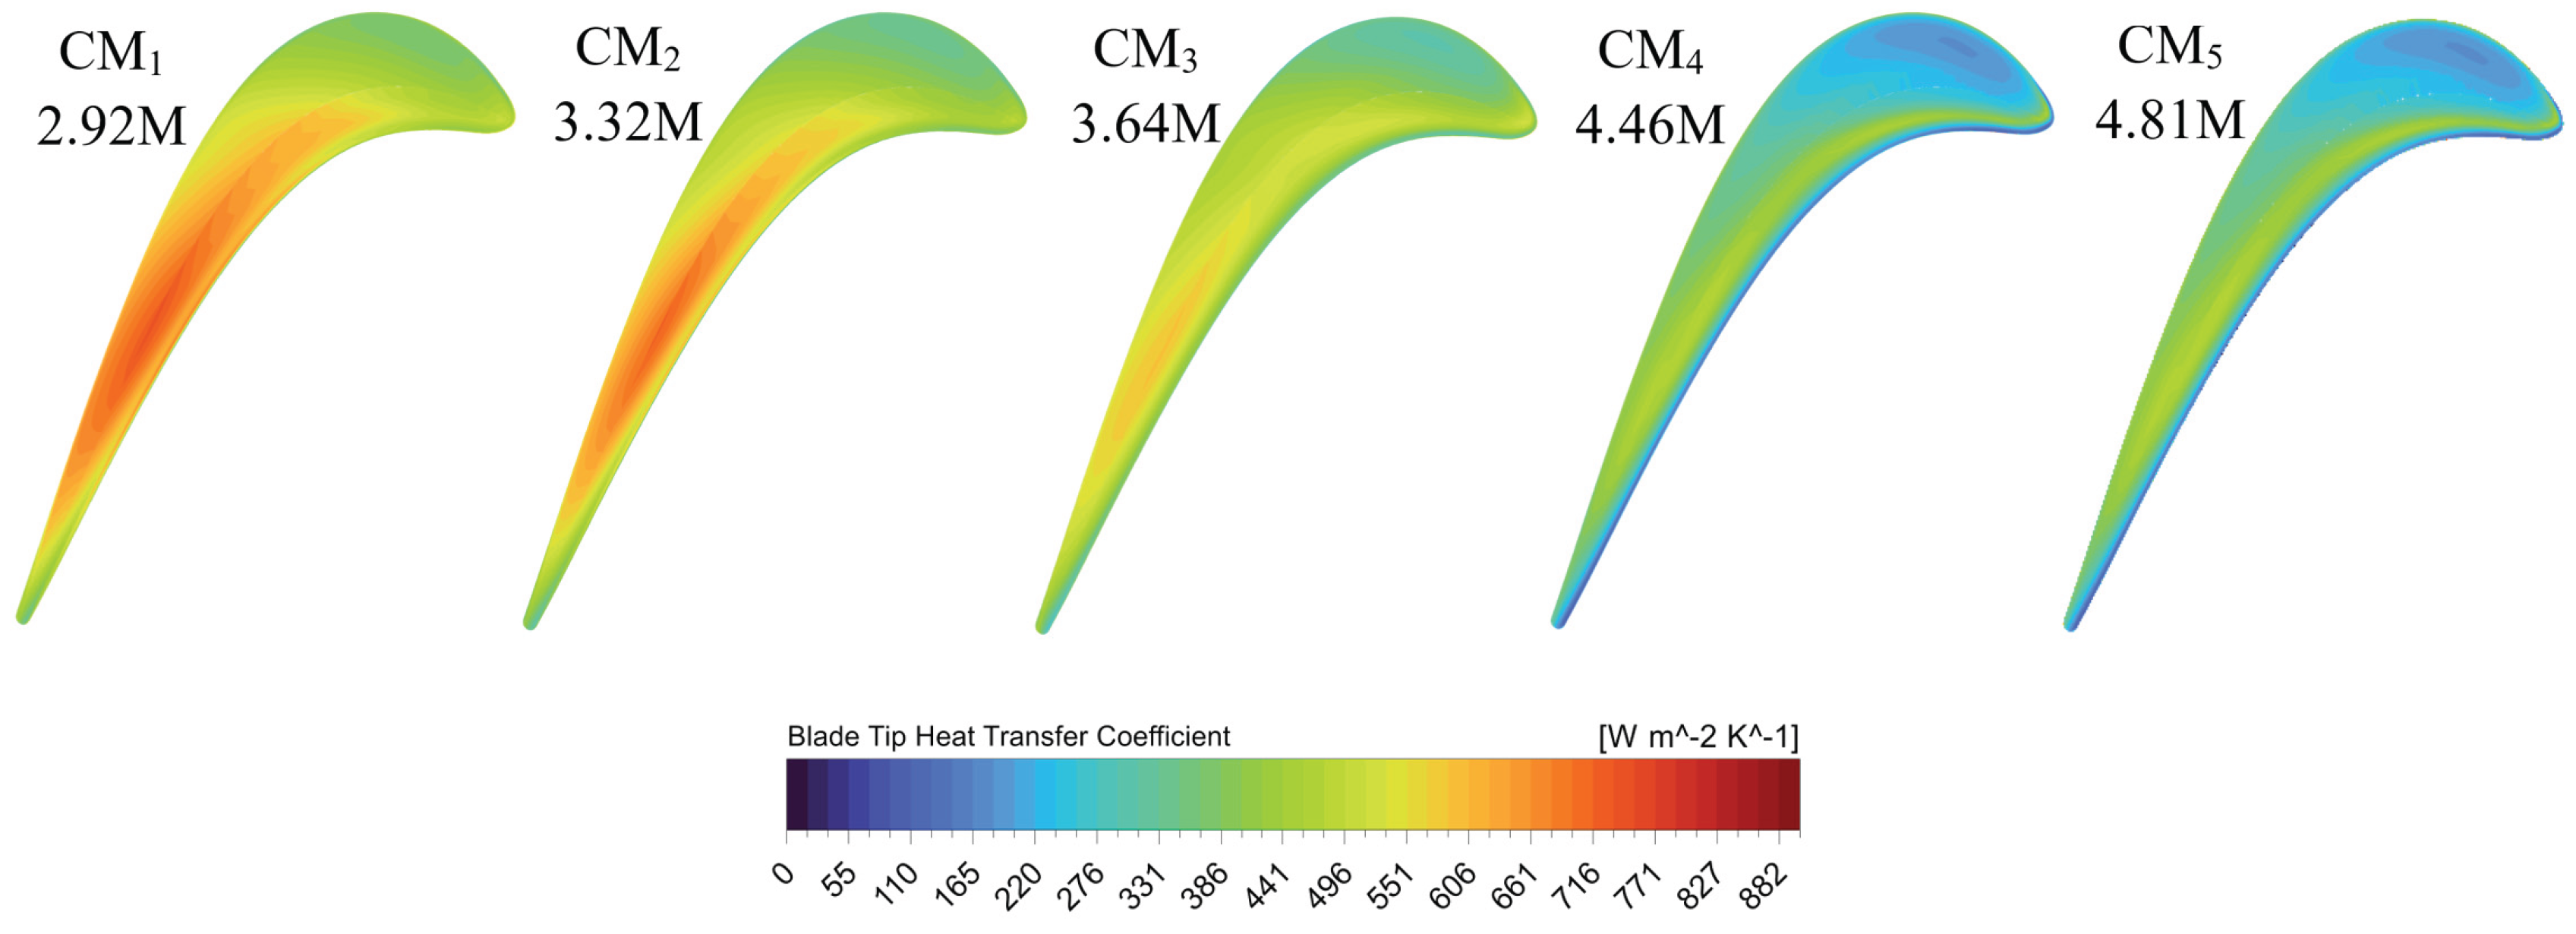
Figure 10.
Comparison Between Experimental Heat Transfer Data and Present CFD Model Results on the Suction Side of the SM701 Airfoil.
Figure 10.
Comparison Between Experimental Heat Transfer Data and Present CFD Model Results on the Suction Side of the SM701 Airfoil.
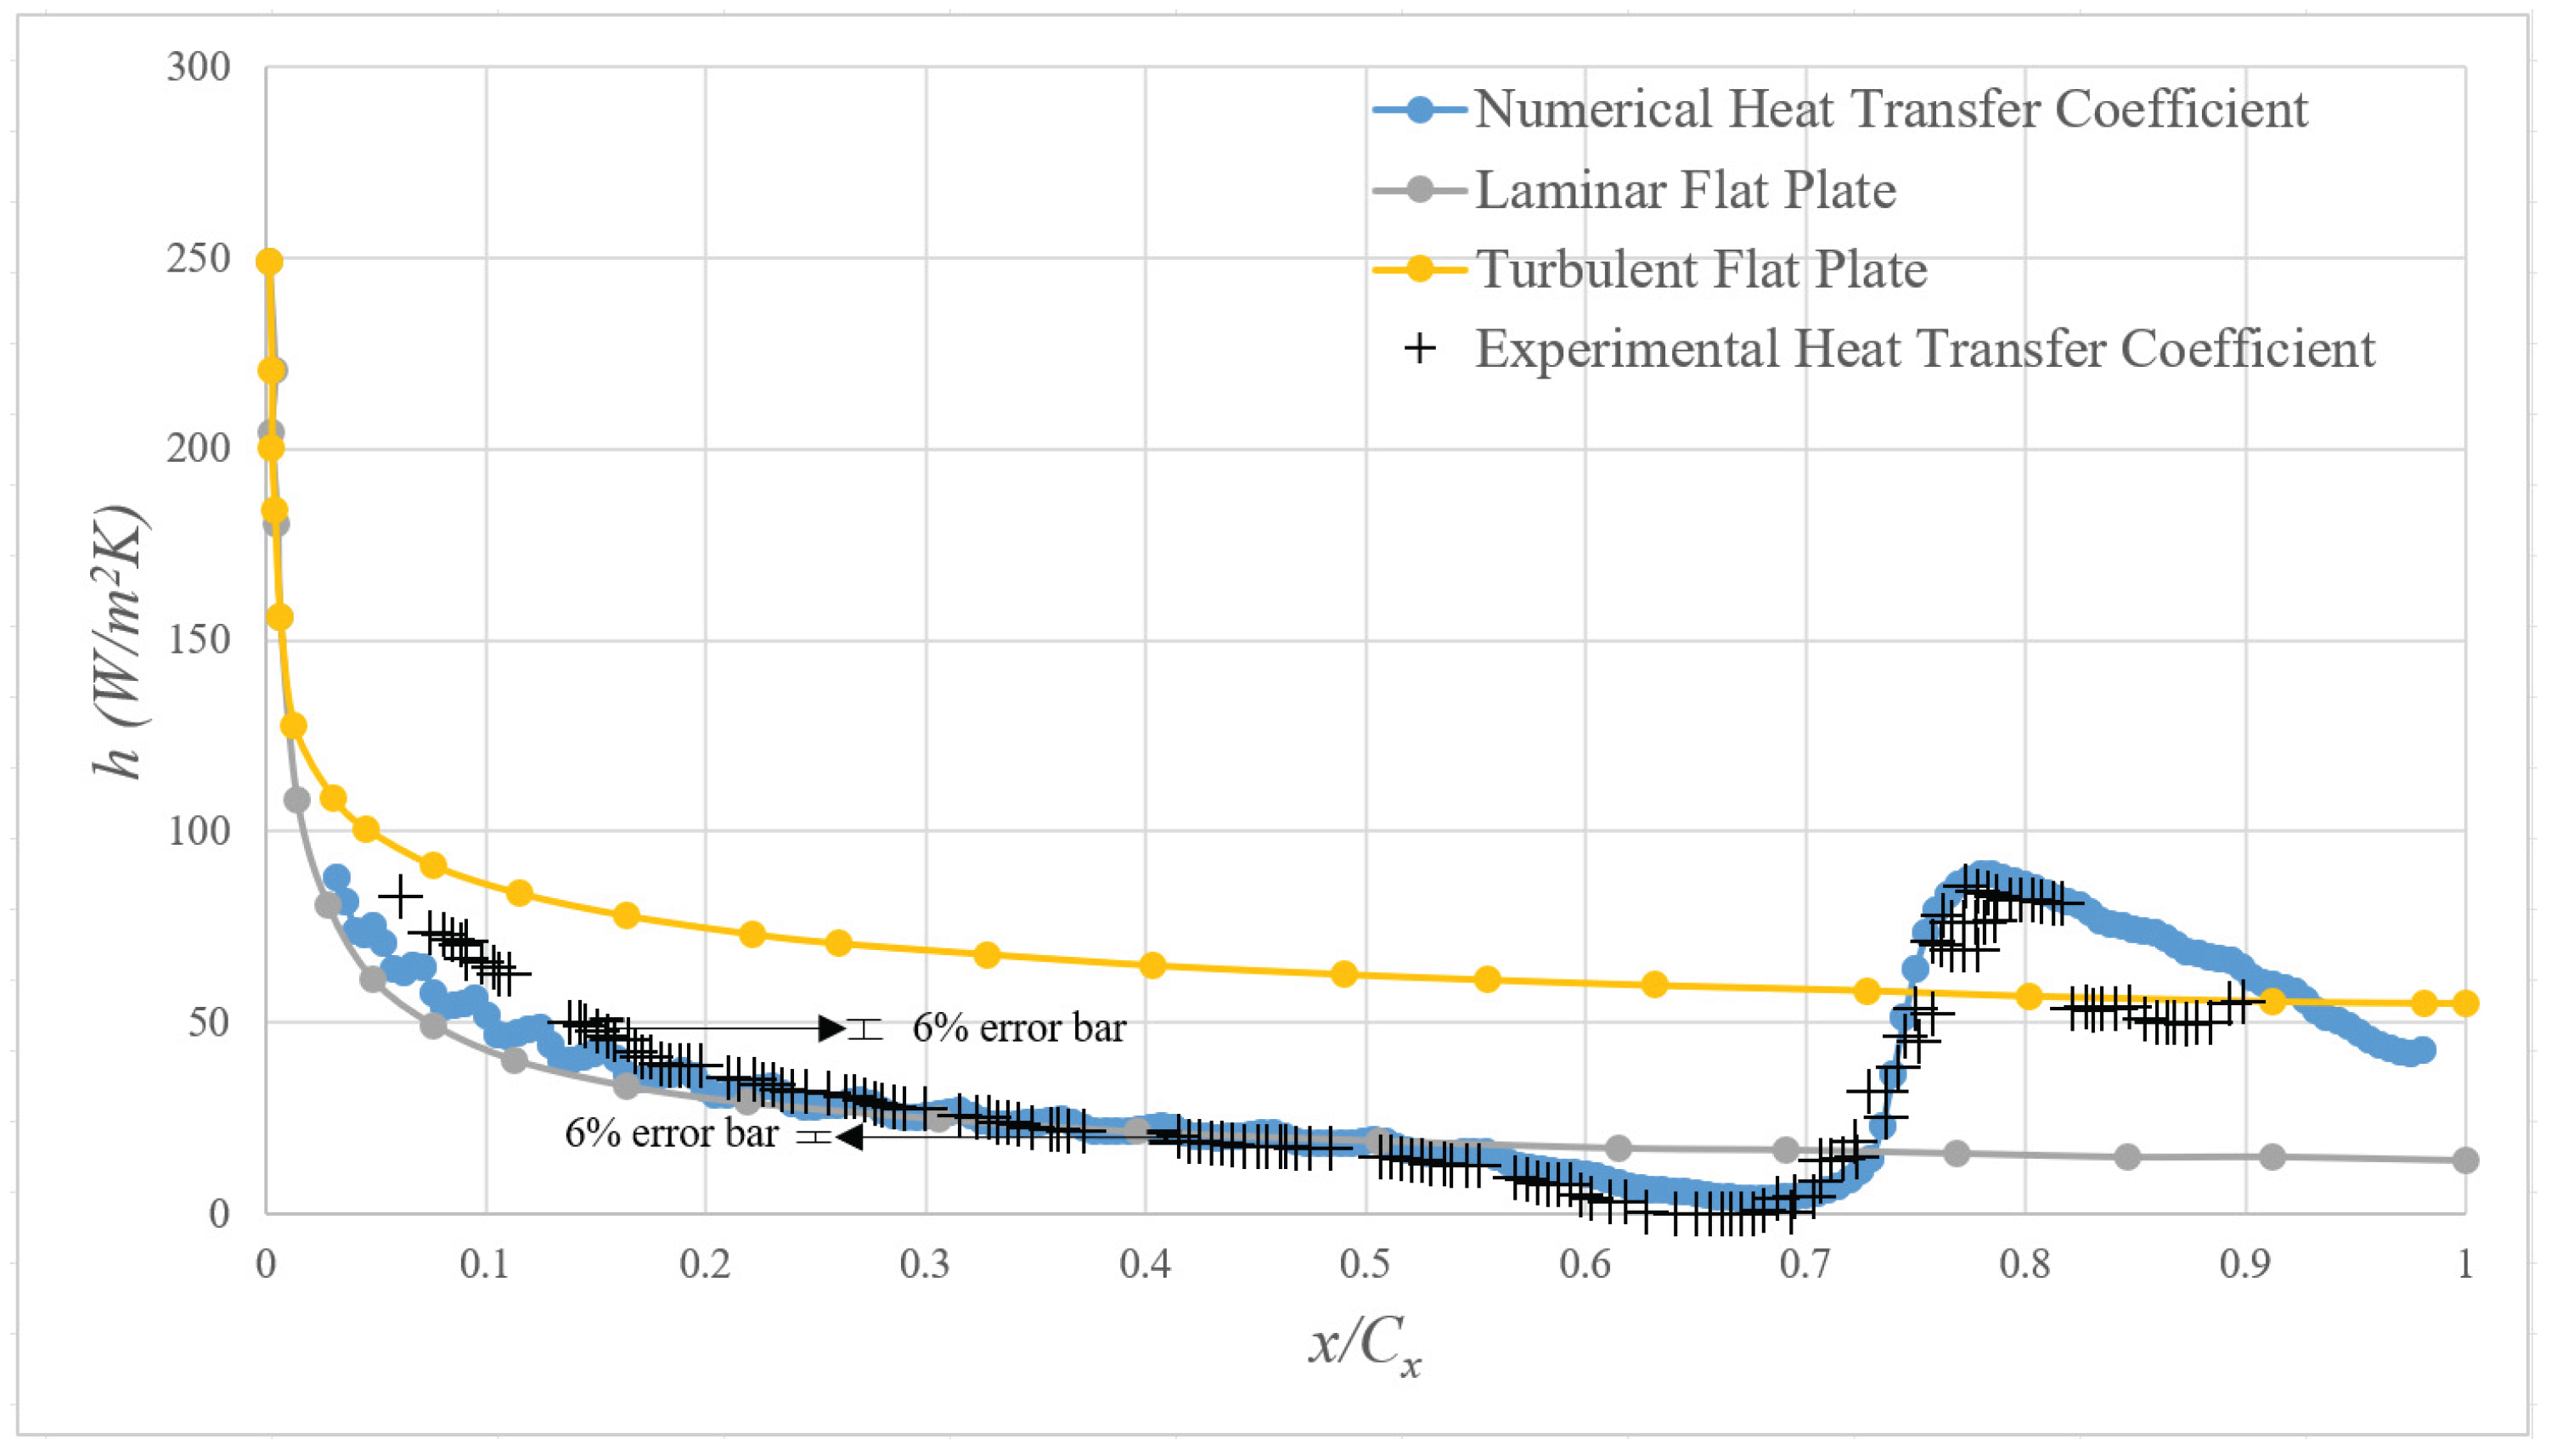
Figure 11.
Comparison of Total Pressure Coefficients Across Design Configurations in Various Cx Locations (Table 6 lists all other pertinent performance values, ε, ϑ and Г).
Figure 11.
Comparison of Total Pressure Coefficients Across Design Configurations in Various Cx Locations (Table 6 lists all other pertinent performance values, ε, ϑ and Г).
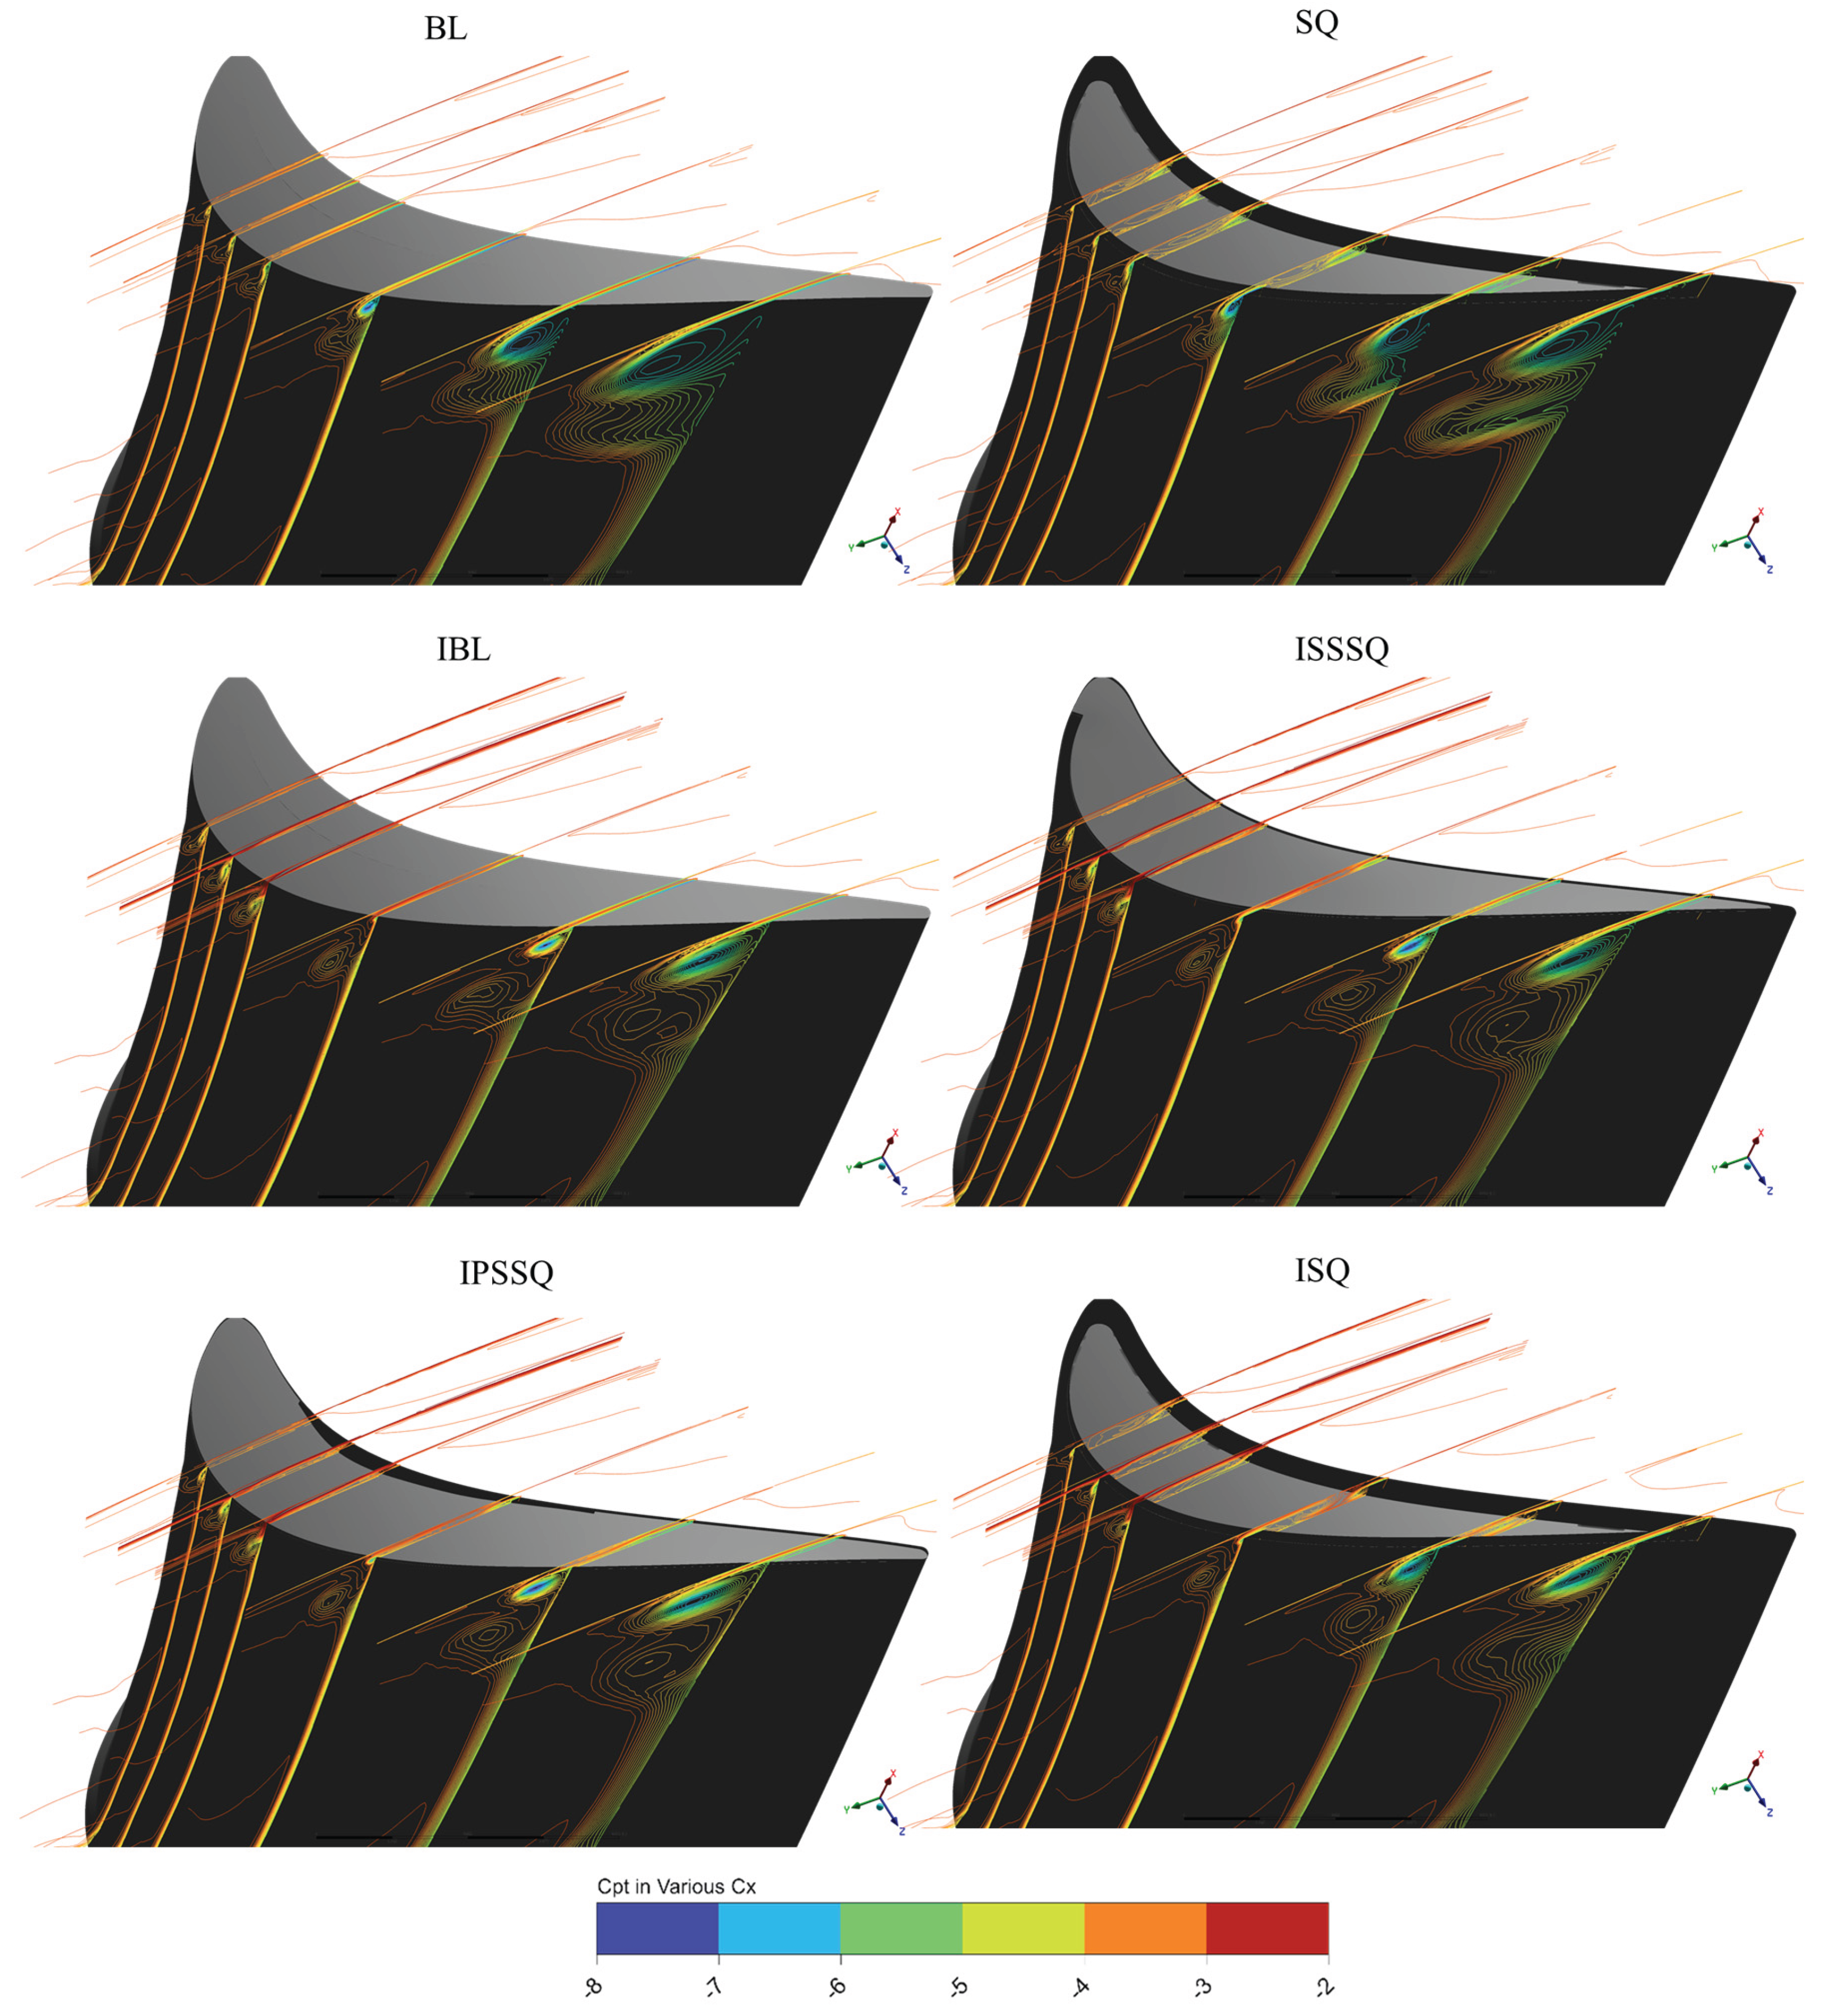
Figure 12.
Total Pressure Coefficient Comparison of Different Designs 0.05 Cx Downstream of Blade.
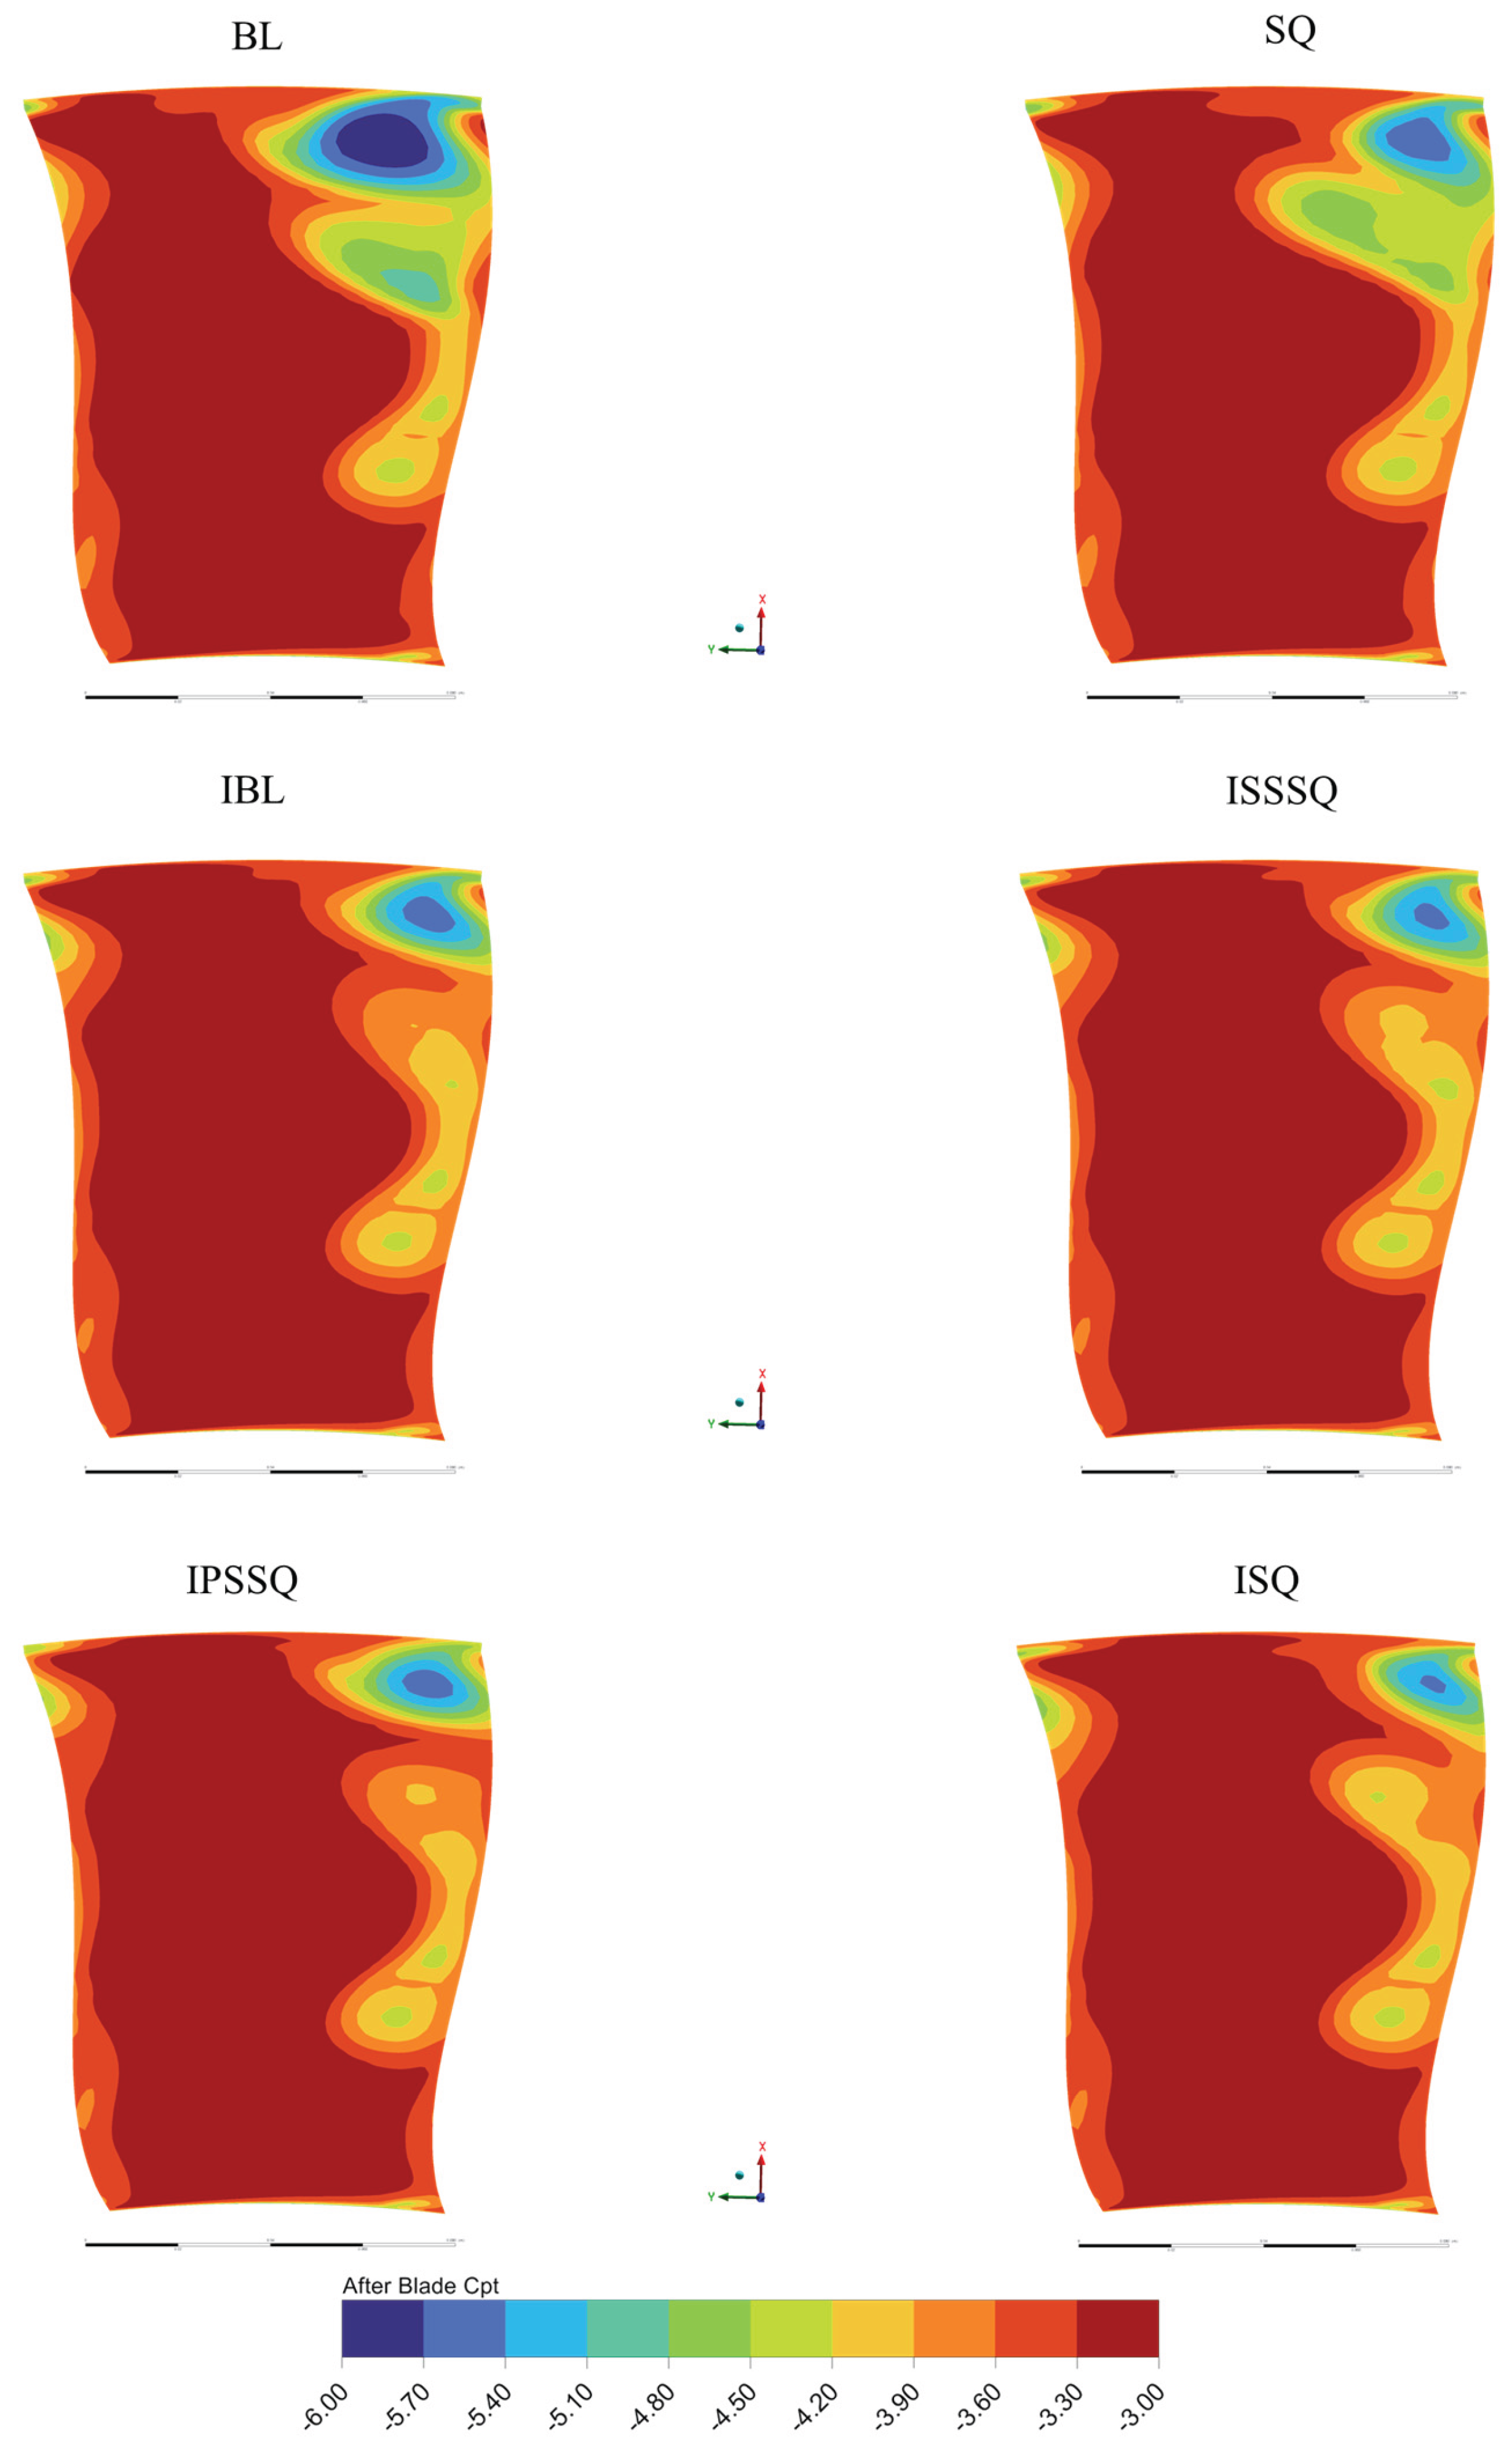
Figure 13.
Mid-Span to Shroud Pressure Coefficient Comparison for Investigated Designs.
Figure 14.
Velocity Streamline Distribution at Mid-Gap for Different Blade Configurations.
Figure 15.
Design-Wise Visualization of Velocity Vectors at the Mid-Gap.
Figure 16.
Computed Equal Shear Stress Lines for All Designs (computed oil flow visualizations).
Figure 17.
The Local Leakage Mass Flow Rate Distribution Exiting the Blade Tip Suction Side Corner for Various Tip Configurations.
Figure 17.
The Local Leakage Mass Flow Rate Distribution Exiting the Blade Tip Suction Side Corner for Various Tip Configurations.
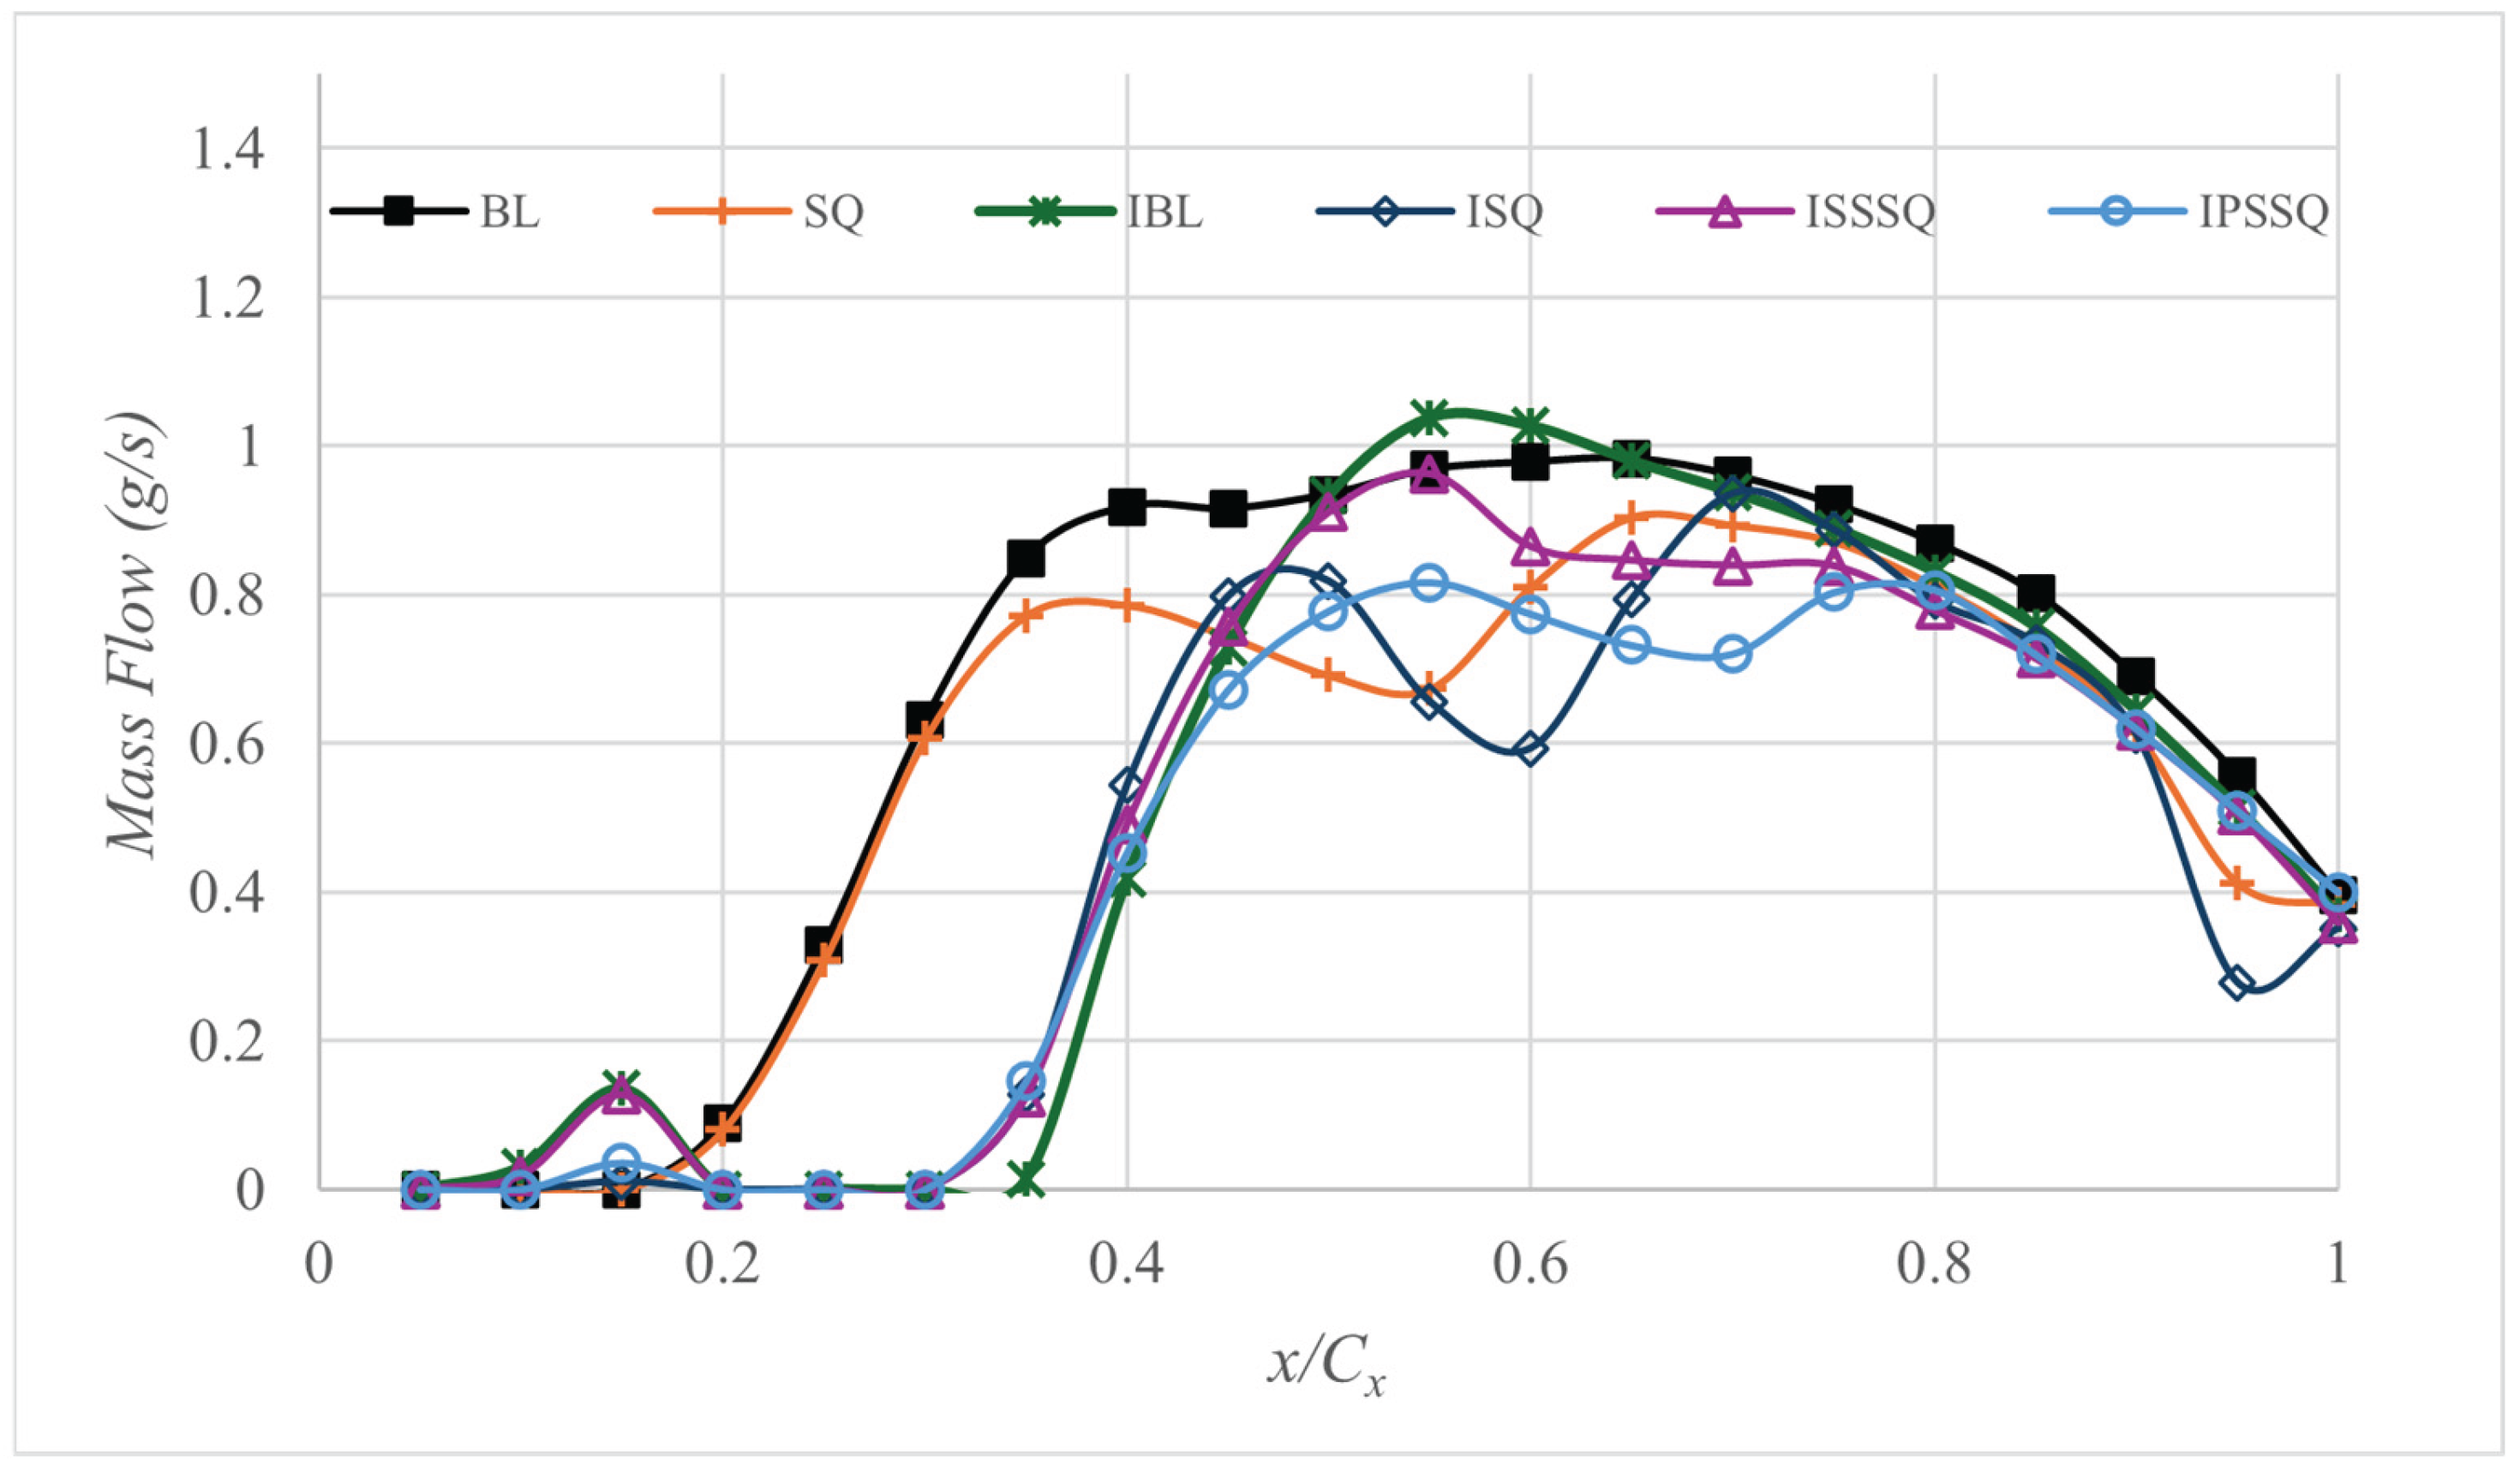
Figure 18.
Total Tip Leakage Flow for Various Designs.
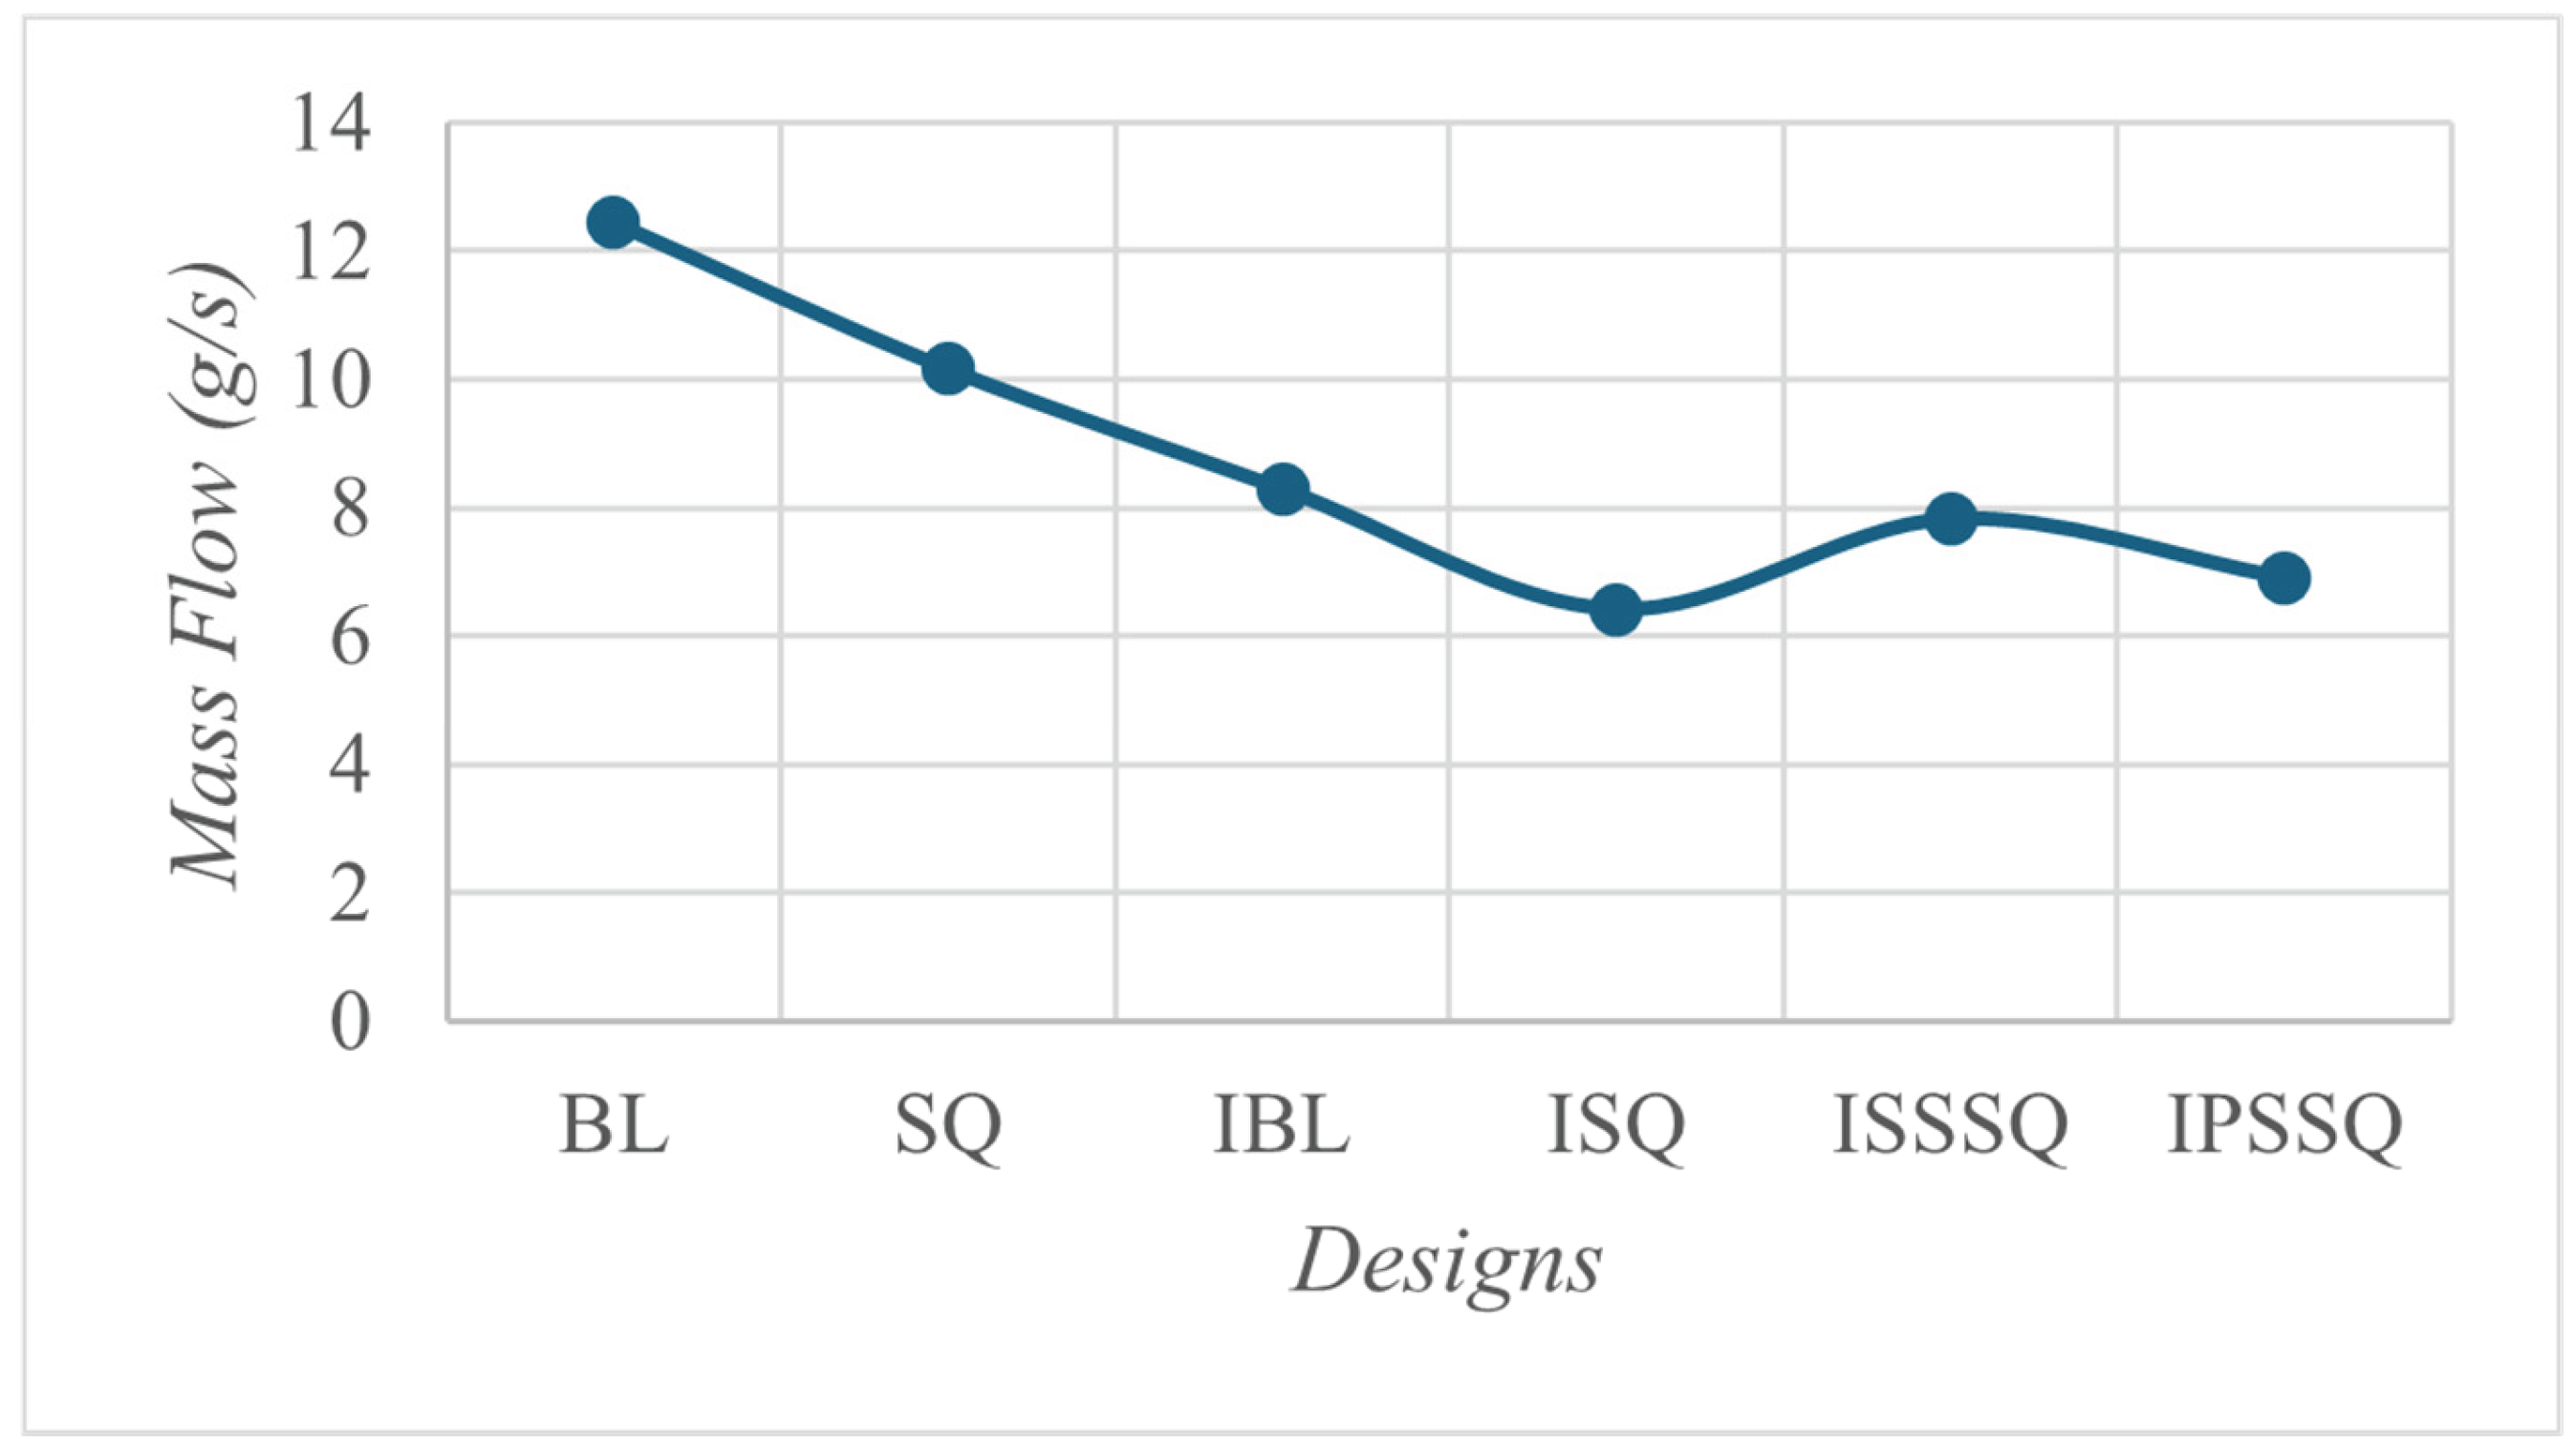
Figure 19.
Blade Tip Heat Transfer Coefficient Distributions of the Investigated Designs.
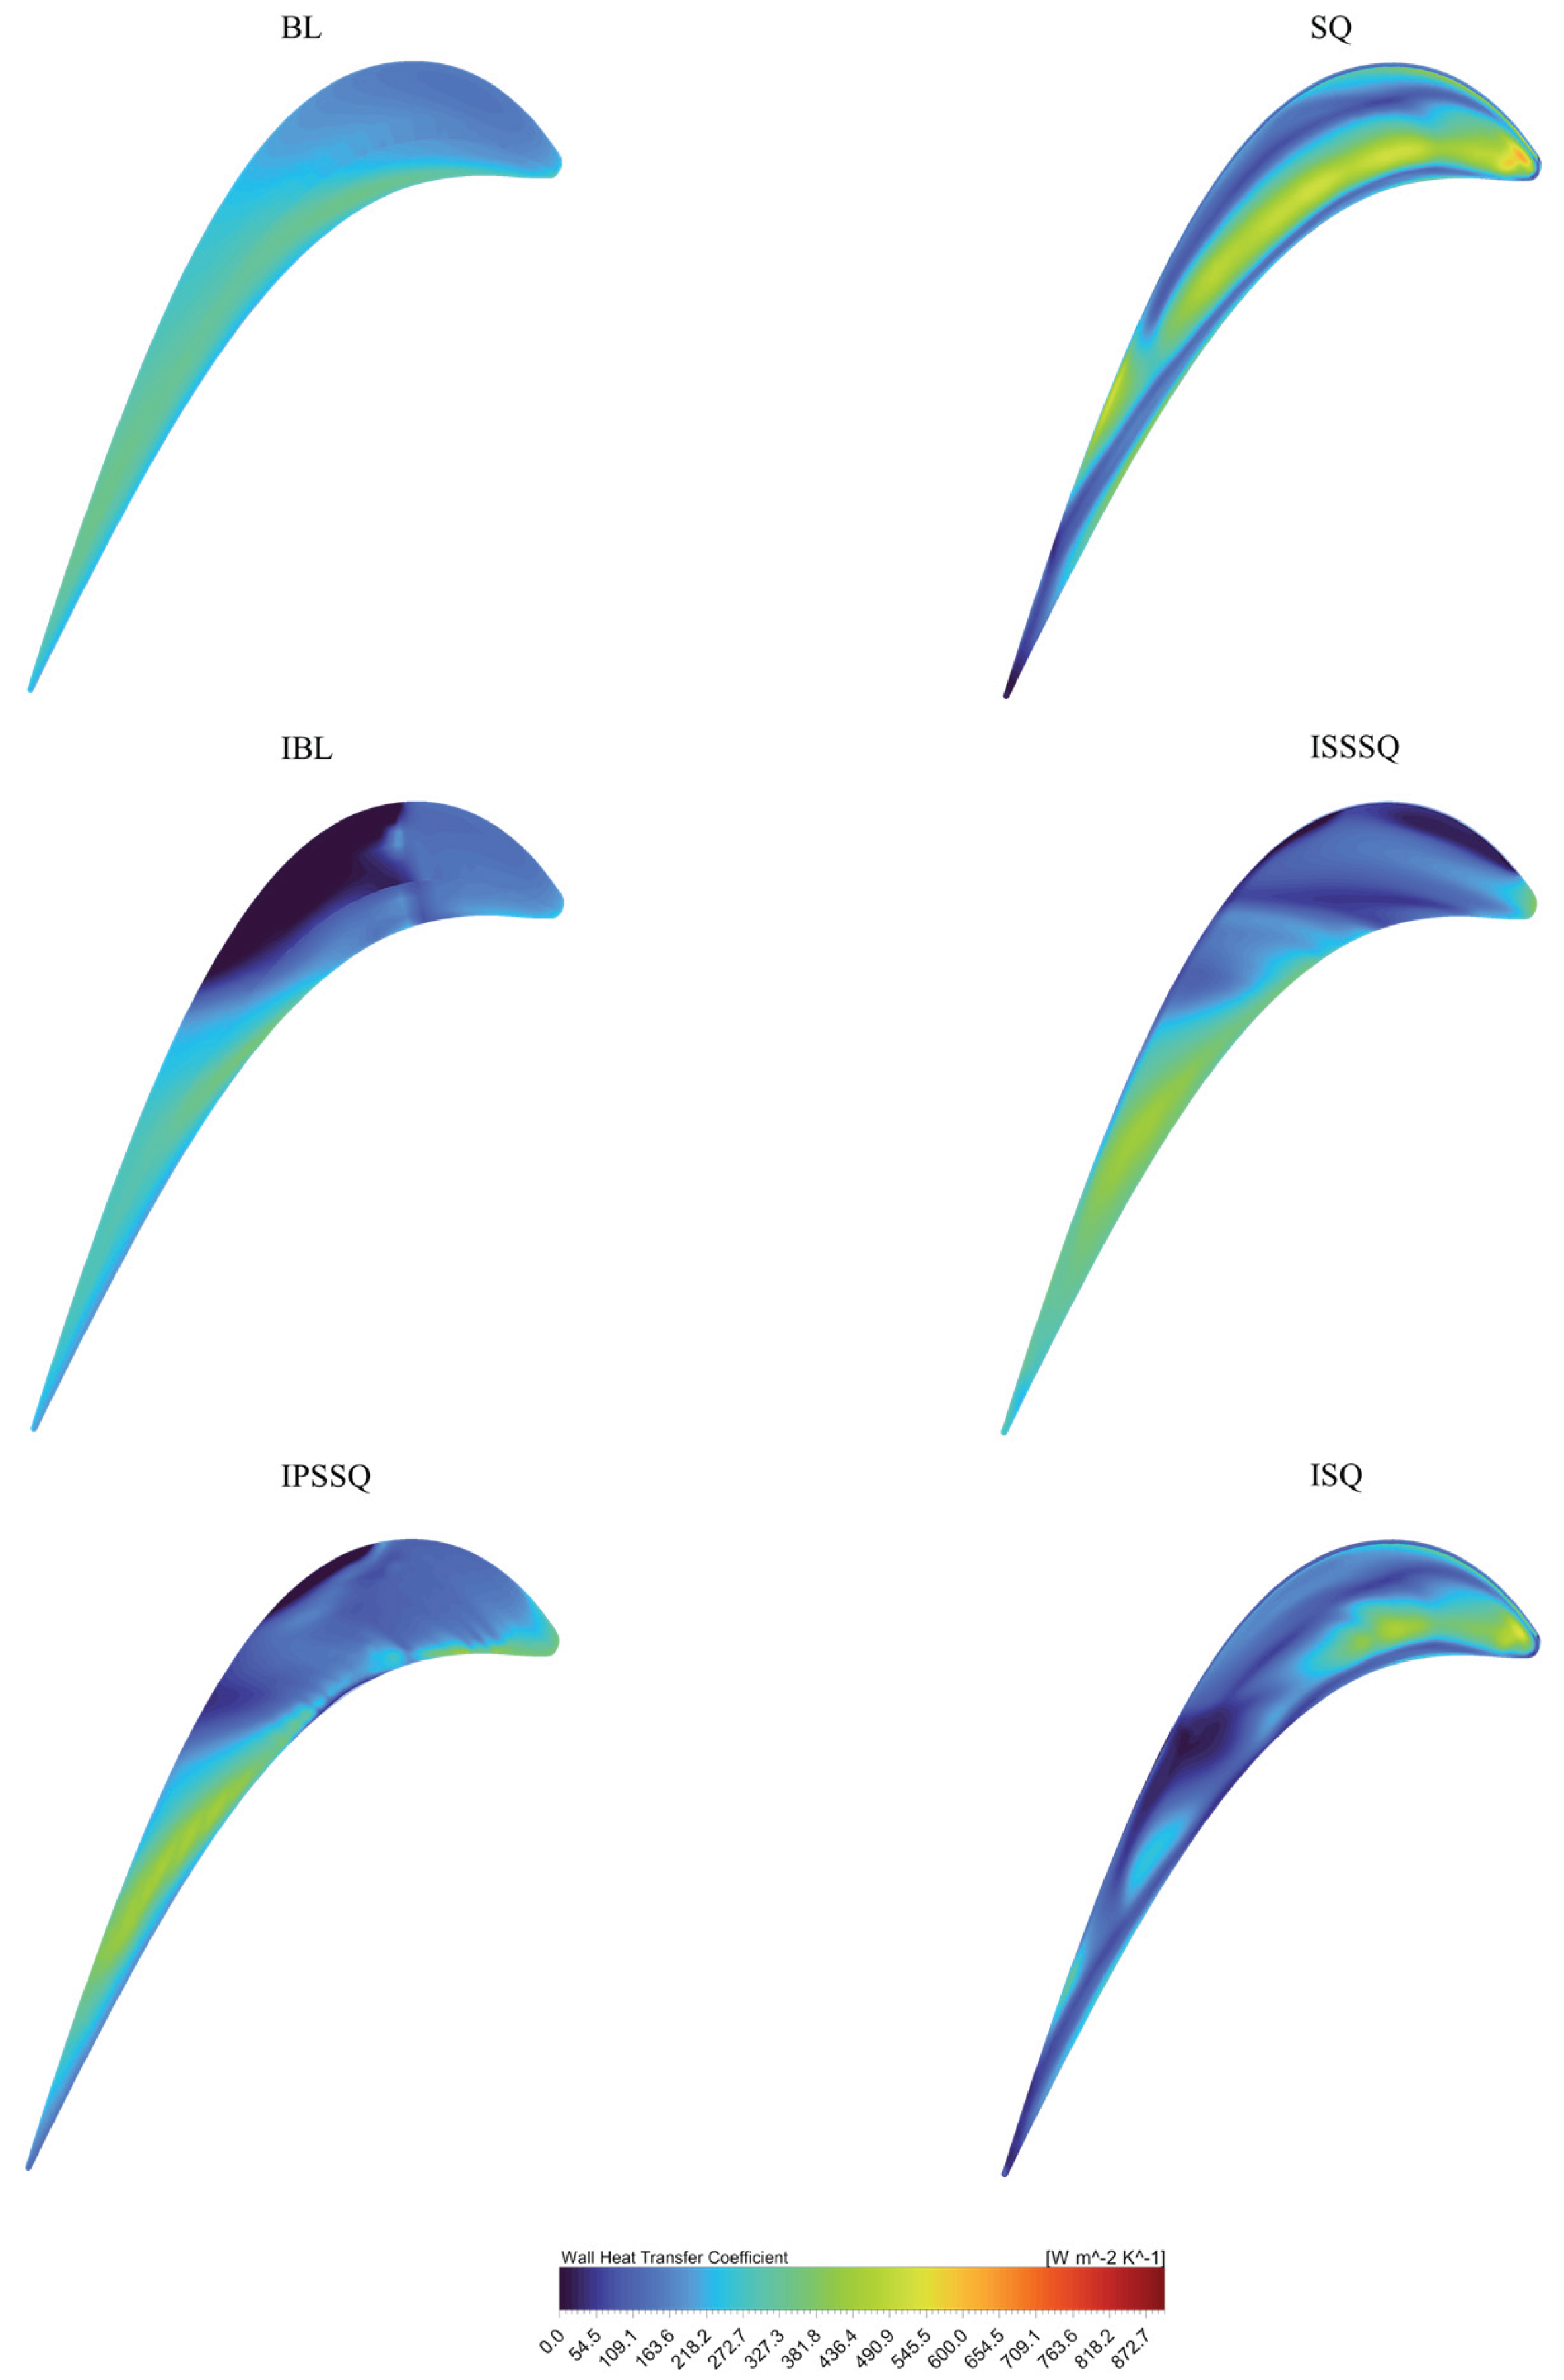
Figure 20.
A Comparison of Blade Tip Area-Averaged Heat Transfer Coefficients for the Investigated Designs.
Figure 20.
A Comparison of Blade Tip Area-Averaged Heat Transfer Coefficients for the Investigated Designs.
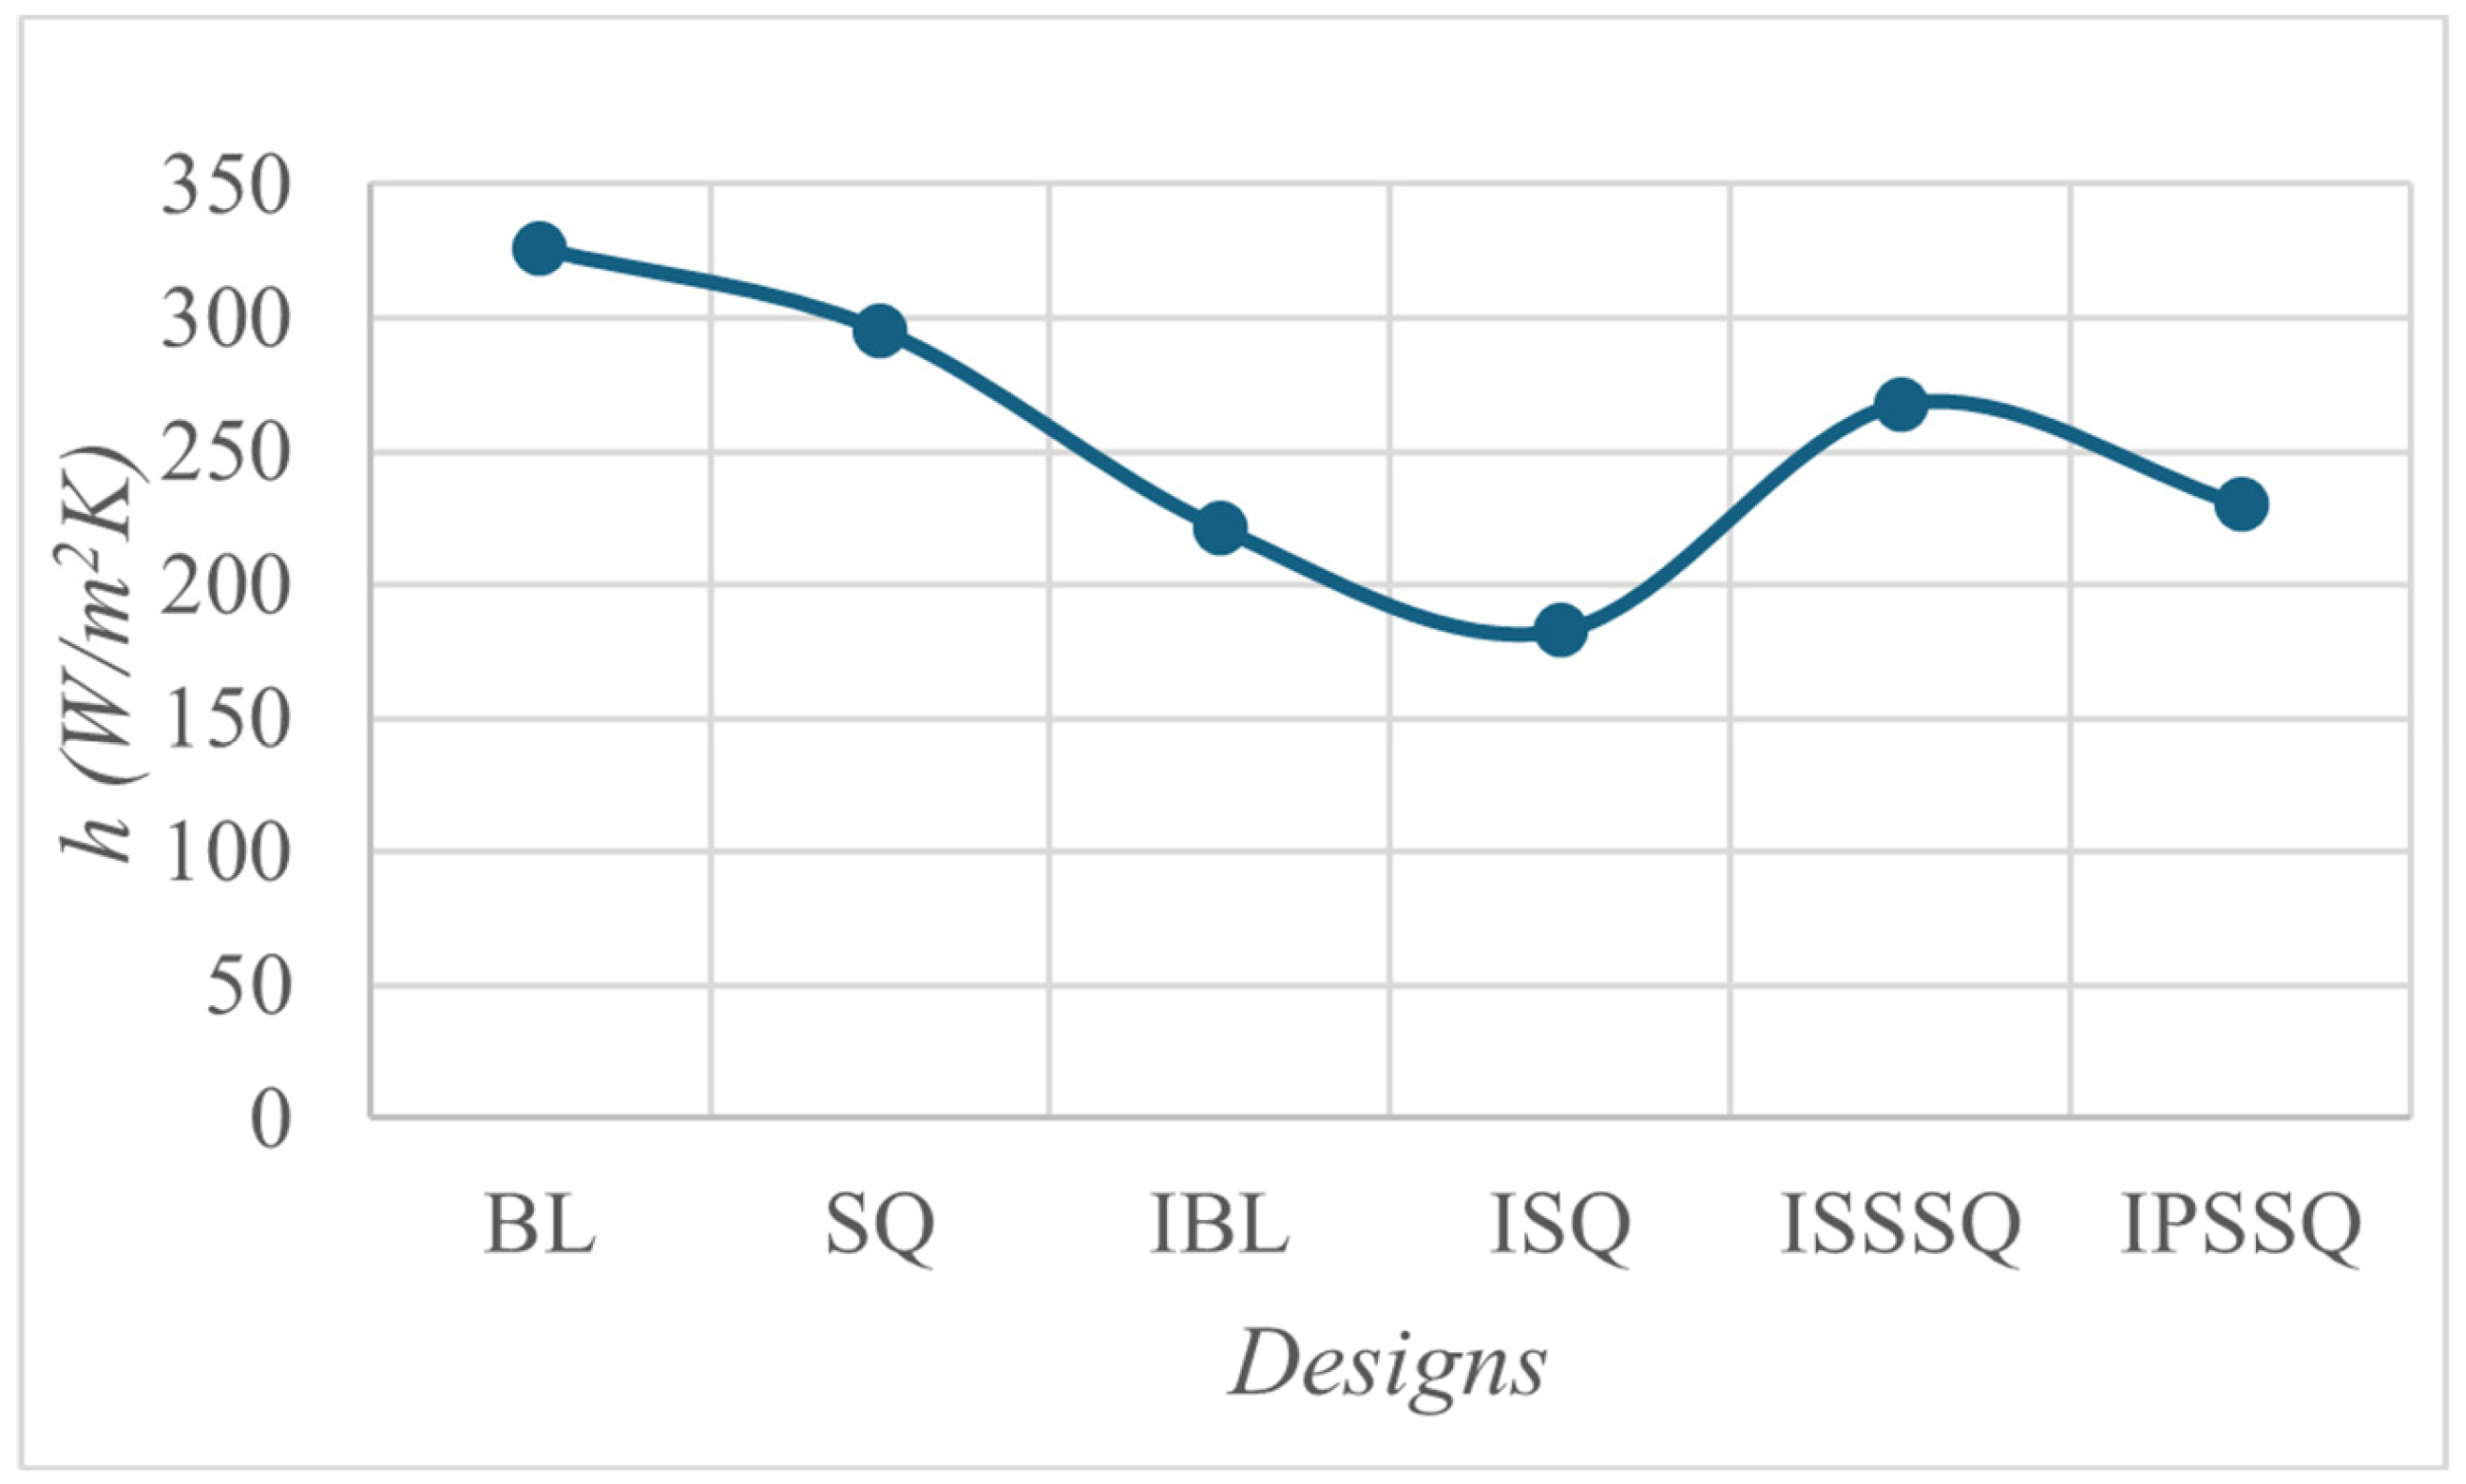
Figure 21.
Isentropic Total to Total Efficiency for Designs Under Study.
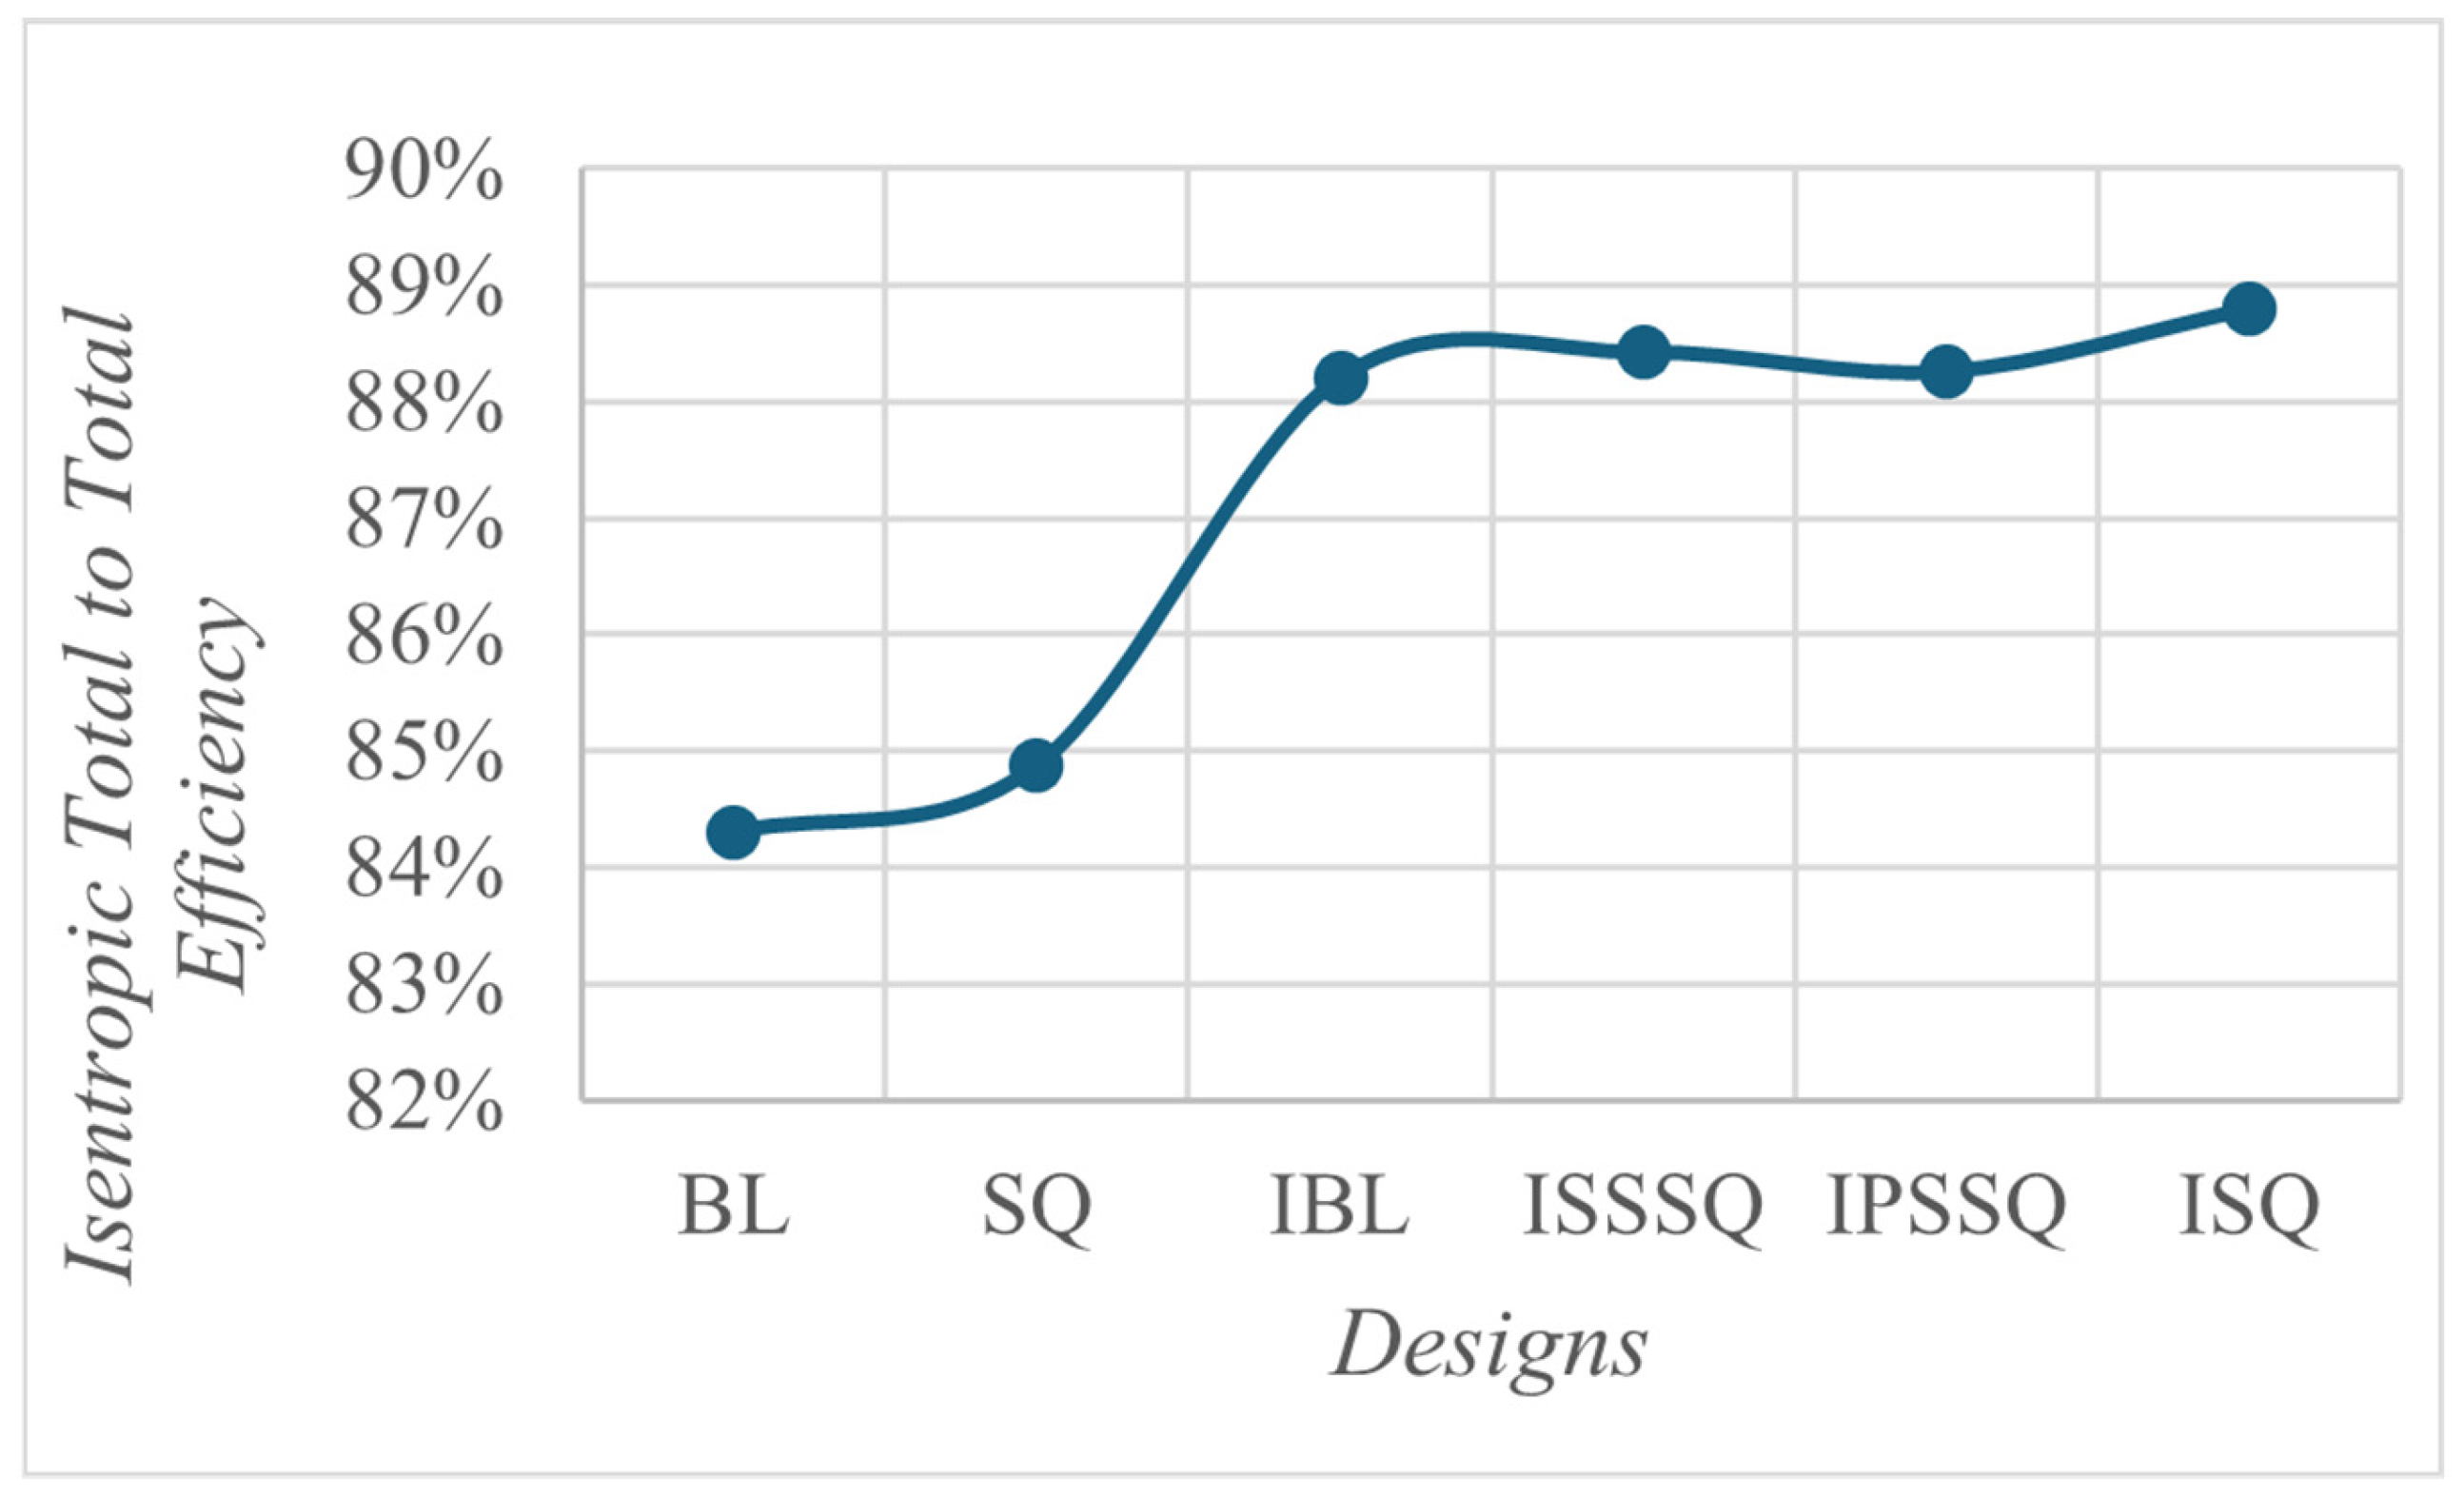
Table 1.
The AFTRF Design Parameters.
| Parameter | Value |
|---|---|
| Rotor Hub Tip Ratio | 0.7269 |
| Tip Radius (m) | 0.4582 |
| Blade Height h (m) | 0.1229 |
| Tip Relative Mach Number | 0.24 (max) |
| Nozzle Guide Vane | |
| Number | 23 |
| Midspan axial chord (m) | 0.1123 |
| Turning angle (deg) | 70 |
| Reynolds number based on inlet velocity | 3~4 x |
| Rotor-stator axial spacing at hub (mm) | 36.32 |
| Rotor Blade | |
| Number | 29 |
| Blade pitch, p (mm) | 99.27 |
| Inlet flow angle [o] | 71.3 |
| Stagger angle [o] | 46.2 |
| Midspan axial chord (m) | 0.0929 |
| Turning at tip angle (deg) Turning angle at hub (deg) |
94.42 125.69 |
| Tip clearance t/h | 0.8 % |
| Reynolds number based on inlet velocity | 2.87x |
Table 2.
The AFTRF Operating Conditions for the Baseline Experiments.
| Operating Condition | Value |
|---|---|
| Inlet Total Temperature (K) | 289 |
| Inlet Total Pressure (KPa) | 101.36 |
| Mass Flow Rate (kg/s) | 11.05 |
| Rotational Speed (RPM) | 1300 |
| Total Pressure Ratio (/) | 1.0778 |
| Total Temperature Ratio (/) | 0.981 |
| Pressure Drop(mmHg) - | 56.04 |
| Inlet Mass Flow Rate [kg/s] | 11.05 |
| Power (KW) | 60.6 |
Table 3.
Injection Parameters.
| Parameter | Values |
|---|---|
| Number of Injection Points | 7, 11 and 15 |
| Injection Axial Chord Position | 0.3, 0.5 and 0.7 |
| Injection Angle, [o] | 30 and 50 |
| Injection Blow Ratio | 1.22 and 1.85 |
| Injection Hole Diameter [mm] | 0.7 and 1 |
Table 4.
Mesh Dependency Studies.
| Mesh | Number of Elements (millions) | Ave. Tip y+ | Error (%) | Blade Tip (W/m2-K) |
Blade Tip Error (%) | |
| CM1 | 2.92 | 24.07 | 3.419 | 0.67% | 548.40 | -25.32 |
| CM2 | 3.32 | 12.52 | 3.442 | 0.61% | 409.54 | -13.43 |
| CM3 | 3.64 | 1.92 | 3.463 | 0.59% | 354.53 | -8.08 |
| CM4 | 4.46 | 0.799 | 3.483 | 0.01% | 325.9 | 0.12 |
| CM5 | 4.81 | 0.774 | 3.484 | - | 326.3 | - |
Table 5.
Total Pressure Coefficient Difference ε with Different Injection Parameters for Flat Tip Design.
Table 5.
Total Pressure Coefficient Difference ε with Different Injection Parameters for Flat Tip Design.
| Design | ε | Design | ε | Design | ε | |||
|---|---|---|---|---|---|---|---|---|
| Baseline (no inj.) | 3.48374 | - | 0.5-30-1.22-0.7-7 | 3.45758 | 0.75% | 0.7-30-1.22-0.7-11 | 3.46077 | 0.66% |
| 0.3-30-1.22-0.7-7 | 3.45343 | 0.87% | 0.5-30-1.22-0.7-11 | 3.45224 | 0.90% | 0.7-30-1.22-0.7-15 | 3.45842 | 0.73% |
| 0.3-30-1.22-0.7-11 | 3.44597 | 1.08% | 0.5-30-1.22-0.7-15 | 3.44549 | 1.10% | 0.7-30-1.22-1-7 | 3.45909 | 0.71% |
| 0.3-30-1.22-0.7-15 | 3.43739 | 1.33% | 0.5-30-1.22-1-7 | 3.44899 | 1.00% | 0.7-30-1.22-1-11 | 3.45694 | 0.77% |
| 0.3-30-1.22-1-7 | 3.44149 | 1.21% | 0.5-30-1.22-1-11 | 3.43751 | 1.33% | 0.7-30-1.22-1-15 | 3.45315 | 0.88% |
| 0.3-30-1.22-1-11 | 3.43029 | 1.53% | 0.5-30-1.22-1-15 | 3.42391 | 1.72% | 0.7-30-1.85-0.7-7 | 3.45984 | 0.69% |
| 0.3-30-1.22-1-15 | 3.41623 | 1.94% | 0.5-30-1.85-0.7-7 | 3.4508 | 0.95% | 0.7-30-1.85-0.7-11 | 3.45883 | 0.72% |
| 0.3-30-1.85-0.7-7 | 3.44395 | 1.14% | 0.5-30-1.85-0.7-11 | 3.44279 | 1.18% | 0.7-30-1.85-0.7-15 | 3.45432 | 0.84% |
| 0.3-30-1.85-0.7-11 | 3.43385 | 1.43% | 0.5-30-1.85-0.7-15 | 3.42902 | 1.57% | 0.7-30-1.85-1-7 | 3.45551 | 0.81% |
| 0.3-30-1.85-0.7-15 | 3.42131 | 1.79% | 0.5-30-1.85-1-7 | 3.43351 | 1.44% | 0.7-30-1.85-1-11 | 3.4515 | 0.93% |
| 0.3-30-1.85-1-7 | 3.43118 | 1.51% | 0.5-30-1.85-1-11 | 3.41992 | 1.83% | 0.7-30-1.85-1-15 | 3.44649 | 1.07% |
| 0.3-30-1.85-1-11 | 3.41334 | 2.02% | 0.5-30-1.85-1-15 | 3.40361 | 2.30% | 0.7-50-1.22-0.7-7 | 3.46087 | 0.66% |
| 0.3-30-1.85-1-15 | 3.39843 | 2.45% | 0.5-50-1.22-0.7-7 | 3.45197 | 0.91% | 0.7-50-1.22-0.7-11 | 3.46034 | 0.67% |
| 0.3-50-1.22-0.7-7 | 3.4493 | 0.99% | 0.5-50-1.22-0.7-11 | 3.44615 | 1.08% | 0.7-50-1.22-0.7-15 | 3.45662 | 0.78% |
| 0.3-50-1.22-0.7-11 | 3.43996 | 1.26% | 0.5-50-1.22-0.7-15 | 3.43606 | 1.37% | 0.7-50-1.22-1-7 | 3.45722 | 0.76% |
| 0.3-50-1.22-0.7-15 | 3.43059 | 1.53% | 0.5-50-1.22-1-7 | 3.44022 | 1.25% | 0.7-50-1.22-1-11 | 3.4557 | 0.80% |
| 0.3-50-1.22-1-7 | 3.43486 | 1.40% | 0.5-50-1.22-1-11 | 3.4267 | 1.64% | 0.7-50-1.22-1-15 | 3.45076 | 0.95% |
| 0.3-50-1.22-1-11 | 3.41857 | 1.87% | 0.5-50-1.22-1-15 | 3.41137 | 2.08% | 0.7-50-1.85-0.7-7 | 3.45758 | 0.75% |
| 0.3-50-1.22-1-15 | 3.40518 | 2.26% | 0.5-50-1.85-0.7-7 | 3.44212 | 1.19% | 0.7-50-1.85-0.7-11 | 3.45684 | 0.77% |
| 0.3-50-1.85-0.7-7 | 3.43597 | 1.37% | 0.5-50-1.85-0.7-11 | 3.42933 | 1.56% | 0.7-50-1.85-0.7-15 | 3.45232 | 0.90% |
| 0.3-50-1.85-0.7-11 | 3.42246 | 1.76% | 0.5-50-1.85-0.7-15 | 3.41243 | 2.05% | 0.7-50-1.85-1-7 | 3.451 | 0.94% |
| 0.3-50-1.85-0.7-15 | 3.4093 | 2.14% | 0.5-50-1.85-1-7 | 3.4185 | 1.87% | 0.7-50-1.85-1-11 | 3.44473 | 1.12% |
| 0.3-50-1.85-1-7 | 3.41465 | 1.98% | 0.5-50-1.85-1-11 | 3.40286 | 2.32% | 0.7-50-1.85-1-15 | 3.43543 | 1.39% |
| 0.3-50-1.85-1-11 | 3.39186 | 2.64% | 0.5-50-1.85-1-15 | 3.39164 | 2.64% | |||
| 0.3-50-1.85-1-15 | 3.39101 | 2.66% | 0.7-30-1.22-0.7-7 | 3.4617 | 0.63% |
Table 6.
Computational Results of the Best Injection-Enhanced Flat Tip Design with Recessed Tips.
| Design | ε | ηtt | ϑ | Г | ||
|---|---|---|---|---|---|---|
| BL | 3.48374 | 0.00% | 84.304% | 0.00% | 325.95 | 0.00% |
| SQ | 3.44781 | 1.03% | 84.874% | 0.57% | 295.49 | 9.34% |
| IBL | 3.39101 | 2.66% | 88.199% | 3.89% | 221.32 | 32.10% |
| ISSSQ | 3.38985 | 2.70% | 88.419% | 4.11% | 267.62 | 17.89% |
| IPSSQ | 3.38673 | 2.78% | 88.253% | 3.95% | 230.06 | 29.42% |
| ISQ | 3.38360 | 2.87% | 88.791% | 4.49% | 182.82 | 43.91% |
Disclaimer/Publisher’s Note: The statements, opinions and data contained in all publications are solely those of the individual author(s) and contributor(s) and not of MDPI and/or the editor(s). MDPI and/or the editor(s) disclaim responsibility for any injury to people or property resulting from any ideas, methods, instructions or products referred to in the content. |
© 2025 by the authors. Licensee MDPI, Basel, Switzerland. This article is an open access article distributed under the terms and conditions of the Creative Commons Attribution (CC BY) license (http://creativecommons.org/licenses/by/4.0/).
Copyright: This open access article is published under a Creative Commons CC BY 4.0 license, which permit the free download, distribution, and reuse, provided that the author and preprint are cited in any reuse.


