
Submitted:
07 July 2025
Posted:
08 July 2025
You are already at the latest version
Abstract
This study examines the hydrodynamic and acoustic performance of plain NACA0018 hydrofoil and modified NACA0018 hydrofoils (foil with a cavity on suction surface) at a Reynolds number (Re) of 40,000, which is indicative of small-scale turbines and marine applications. A cavity was created on suction side surface at 40–50% of the chord length which is chosen for its efficacy in cavitation control. The present analysis examines the impact of the cavity on lift to drag ratio (L/D) and cavity length at three cavitation numbers (1.7, 1.2, and 0.93) for plain and modified hydrofoils. Simulations demonstrate a significant enhancement of 11% in the lift-to-drag ratio relative to traditional designs. Contrary to earlier observations, the cavity length increases instead of decreasing for the modified hydrofoil. Both steady and turbulent inflow conditions are captured by sophisticated computational techniques that simulate the complex cavity dynamics and flow-acoustic interactions. Experimental validations enhance the numerical results by offering comprehensive evaluations of lift, drag, and acoustic properties. Spectral analysis using Mel-frequency techniques confirms the cavity’s potential to reduce low-frequency flow-induced noise. These findings offer new insights for designing quieter and more efficient hydrofoils and turbine blades.
Keywords:
cavitation
; NACA0018
; Drag coefficient
; lift coefficient
; cavity length
; Mel-frequency spectrum techniques
1. Introduction
Cavitation, the formation of vapor cavities in low-pressure regions—particularly on the suction side of a blade—is a critical concern for hydrofoils operating at high speeds [1,2]. This phenomenon, as outlined by Knapp et al. and Blake, leads to increased hydrodynamic drag, noise, vibration, and material erosion, which collectively degrade the reliability and performance of marine propulsion systems, turbines, and other fluid machinery [1,2].
Traditional engineering strategies to mitigate cavitation focus on optimizing blade geometry or deploying supercavitating profiles tailored for high-speed conditions [3,4,5]. However, these solutions often prove insufficient under moderate-speed or unsteady flow regimes [4,5].
Recent studies have introduced novel hydrofoil configurations designed to stabilize partial cavities on one side of the blade. These designs offer the potential to enhance both aerodynamic and hydrodynamic performance [6,7]. A key feature in these configurations is the so-called “cavity locker,” a convex aft section that anchors the cavity [7]. By replacing a portion of the wetted surface with vapor, this approach reduces skin friction and drag [6]. It also suppresses unsteady pulsations at the cavity tail, thereby reducing pressure fluctuations, noise, and vibration [6,7]. Furthermore, the presence of a stable cavity alters the effective camber of the blade, resulting in enhanced lift and a significant improvement in the lift-to-drag ratio—even in turbulent or non-uniform flows where traditional designs may fail [10]. These benefits arise from complex interactions between the incompressible external flow and compressible vapor dynamics inside the cavity [7]. Other important contribution is flow around a cavity-equipped NACA0018 airfoil which was thoroughly investigated by Olsman[8,9]. The effects of cavity-induced shear-layer oscillations and their interplay with acoustic forcing are examined for a variety of Reynolds numbers and angles of attack. The findings demonstrate that the cavity can produce unique shear-layer modes that, depending on the flow circumstances, improve the lift-to-drag ratio and delay flow separation when compared to a clean airfoil, particularly at low Reynolds numbers at specific angles. The cavity’s impact on unsteady forces decreases as Reynolds numbers increase, and the shear layer’s response becomes linear and dominated by other mass effects.
This design philosophy builds on foundational work in vortex trapping and cavity flow dynamics [11,12,13,14,15,16,17,18]. Kasper’s concept of the vortex wing and subsequent studies on planar cavity instabilities and curved surface flows have provided essential theoretical frameworks [11,12]. These principles have been successfully applied to hydrofoils, resulting in cavity-stabilized blades with experimentally demonstrated drag reductions of up to 30% and up to a twofold increase in lift-to-drag ratio relative to conventional profiles like NACA0015 [6,10,19]. Numerical simulations also support these findings, highlighting improved cavitation resistance [29].
Building upon this, recent efforts by Kadivar and Kumar have proposed passive cavitation control methods ([20,22,23]). These include cavitating-bubble generators (CGs), compact devices placed strategically on the hydrofoil surface to modify local flow behavior [21]. Their research shows that CGs reduce pressure drag, suppress unsteady cavitation, and eliminate pressure spikes linked to cavity collapse at the trailing edge. Kumar’s complementary studies explore how surface modifications can mitigate cavitation and stabilize flow conditions([24]).
Cavity geometry and placement are also pivotal. Rounded cavities with smooth transitions are generally superior to rectangular forms in promoting beneficial vortices and delaying flow separation [7,10], though in some wind turbine scenarios, rectangular grooves have proven effective at high angles of attack [18]. Cavity depth often has a greater effect than width; moderate depths—up to 40% of the local airfoil thickness—strike a balance between aerodynamic gains and structural stability [19]. Optimal performance is typically achieved when cavities are positioned at 40–50% chord length on the suction side [7,10].
Despite substantial progress, further research is necessary—particularly regarding the aerodynamic and acoustic characteristics of hydrofoils with one-sided cavities at moderate Reynolds numbers [29]. shear layer oscillations over cavities embedded in a NACA0018 airfoil reveal that cavity geometry significantly influences flow stability and dynamic pressure behavior but it does not explain the details from the perspective of different cavitating stages [9]. Nonetheless, the advancement of cavity-stabilized hydrofoils marks a major leap forward in fluid dynamic design, offering a resilient and efficient solution to cavitation-related challenges in high-speed applications [7,29]. In this work, cavitating flow over NACA0018 has been investigated through analytical and numerical simulations and find the Mel-frequency spectrum techniques for in-depth flow analysis.
2. Scaling Law
Before presenting the numerical section, it is instructive to derive a theoretical scaling for the cavitating flow over hydrofoil. This fundamental approach clarifies the dependence of cavitation inception on key flow parameters such as freestream velocity, chord length, and fluid properties.
The cavitation number is typically defined as:
where:
- is the freestream static pressure,
- is the vapor pressure of the liquid,
- is the fluid density,
- is the freestream velocity.
This expression follows directly from Bernoulli’s equation assuming steady, incompressible, irrotational flow along a streamline from the freestream to the minimum pressure point on the hydrofoil surface [25,26].
In the following section, we will present the experimentally obtained empirical correlation for the NACA 0018 hydrofoil tested in this study, and quantify its deviation from the theoretical scaling proposed here.
For an attached flow over a hydrofoil at moderate angles of attack, the minimum surface pressure can be approximated as:
where is the minimum pressure coefficient, which depends on the hydrofoil geometry, angle of attack , and Reynolds number.
Cavitation inception is typically modeled to occur when , leading to:
Hence, the scaling law predicts that is approximately proportional to the magnitude of the minimum pressure coefficient, which for slender airfoils often scales with:
2.1. Simplified Scaling Relation
If we assume geometric similarity and small variations in Reynolds number, a first-order scaling can be proposed:
Under constant and , varies primarily with . This suggests that cavitation number can be collapsed across different velocities by using the scaling.
A first-order scaling of cavity length along the chord can be derived by balancing pressure recovery with vapor pressure. Assuming steady sheet cavitation and potential-flow-like pressure recovery, the cavity length is often scaled as:
This inverse relation arises because lower cavitation numbers imply that the pressure remains below over a larger fraction of the chord. Experimental and numerical studies consistently report this approximate scaling, though the slope and offset depend on geometry, Reynolds number, and incidence angle [27,28].
2.2. Lift Coefficient Scaling
In classical potential flow over a hydrofoil, the lift coefficient scales with angle of attack:
As suggested for small angles (thin-airfoil theory) under cavitating conditions, the effective camber line changes as the cavity acts like a partial solid extension of the foil. This often reduces effective circulation and alters lift scaling:
where f is a decreasing function of cavitation number at low (longer cavities shield more of the suction side). Empirical data often show roughly quadratic corrections in near inception, motivating empirical fits of the form:
2.3. Drag Coefficient Scaling
In non-cavitating flow, hydrofoil drag is primarily due to skin friction and pressure drag, scaling approximately as:
where depends on separation and pressure recovery. Under cavitating conditions, a vapor cavity substantially modifies pressure distribution and increases form drag. A first-order model assumes that the cavity reduces adverse pressure gradients but adds a low-density wake:
with often empirically observed to decay exponentially with increasing , since shorter cavities reduce form drag:
2.4. Need for Empirical Correlations
These scaling laws provide a theoretical baseline, suggesting:
- under constant and ,
- ,
- decreasing quadratically in ,
- showing exponential dependence on .
Empirical studies, however, are derived from this simplified scaling and verified by experimental and numerical data. These empirical relations hold good, except for higher angles of attack, low cavitation numbers, or when boundary layer separation affects .
2.5. Plain Hydrofoil Performance
The empirical correlations for cavitation characteristics of the smooth NACA0018 hydrofoil are derived from experimental data [31,32]. The cavity length (), lift coefficient (), and drag coefficient () are expressed as functions of cavitation number ():
where m is the chord length. These correlations are valid for at and .
2.6. Modified Hydrofoil Performance
The modified hydrofoil features a rectangular groove/cavity on the suction surface at with dimensions , [33,34]. The cavity characteristics are modified as:
Figure 1 shows the variation of cavity length, drag and lift with cavitation number. The empirical relations capture the trend well, with deviations within 10
Figure 1.
Variation of Cavity length, drag coefficient () and lift coefficient () fora plain hydrofoil based on empirical relation.
Figure 1.
Variation of Cavity length, drag coefficient () and lift coefficient () fora plain hydrofoil based on empirical relation.
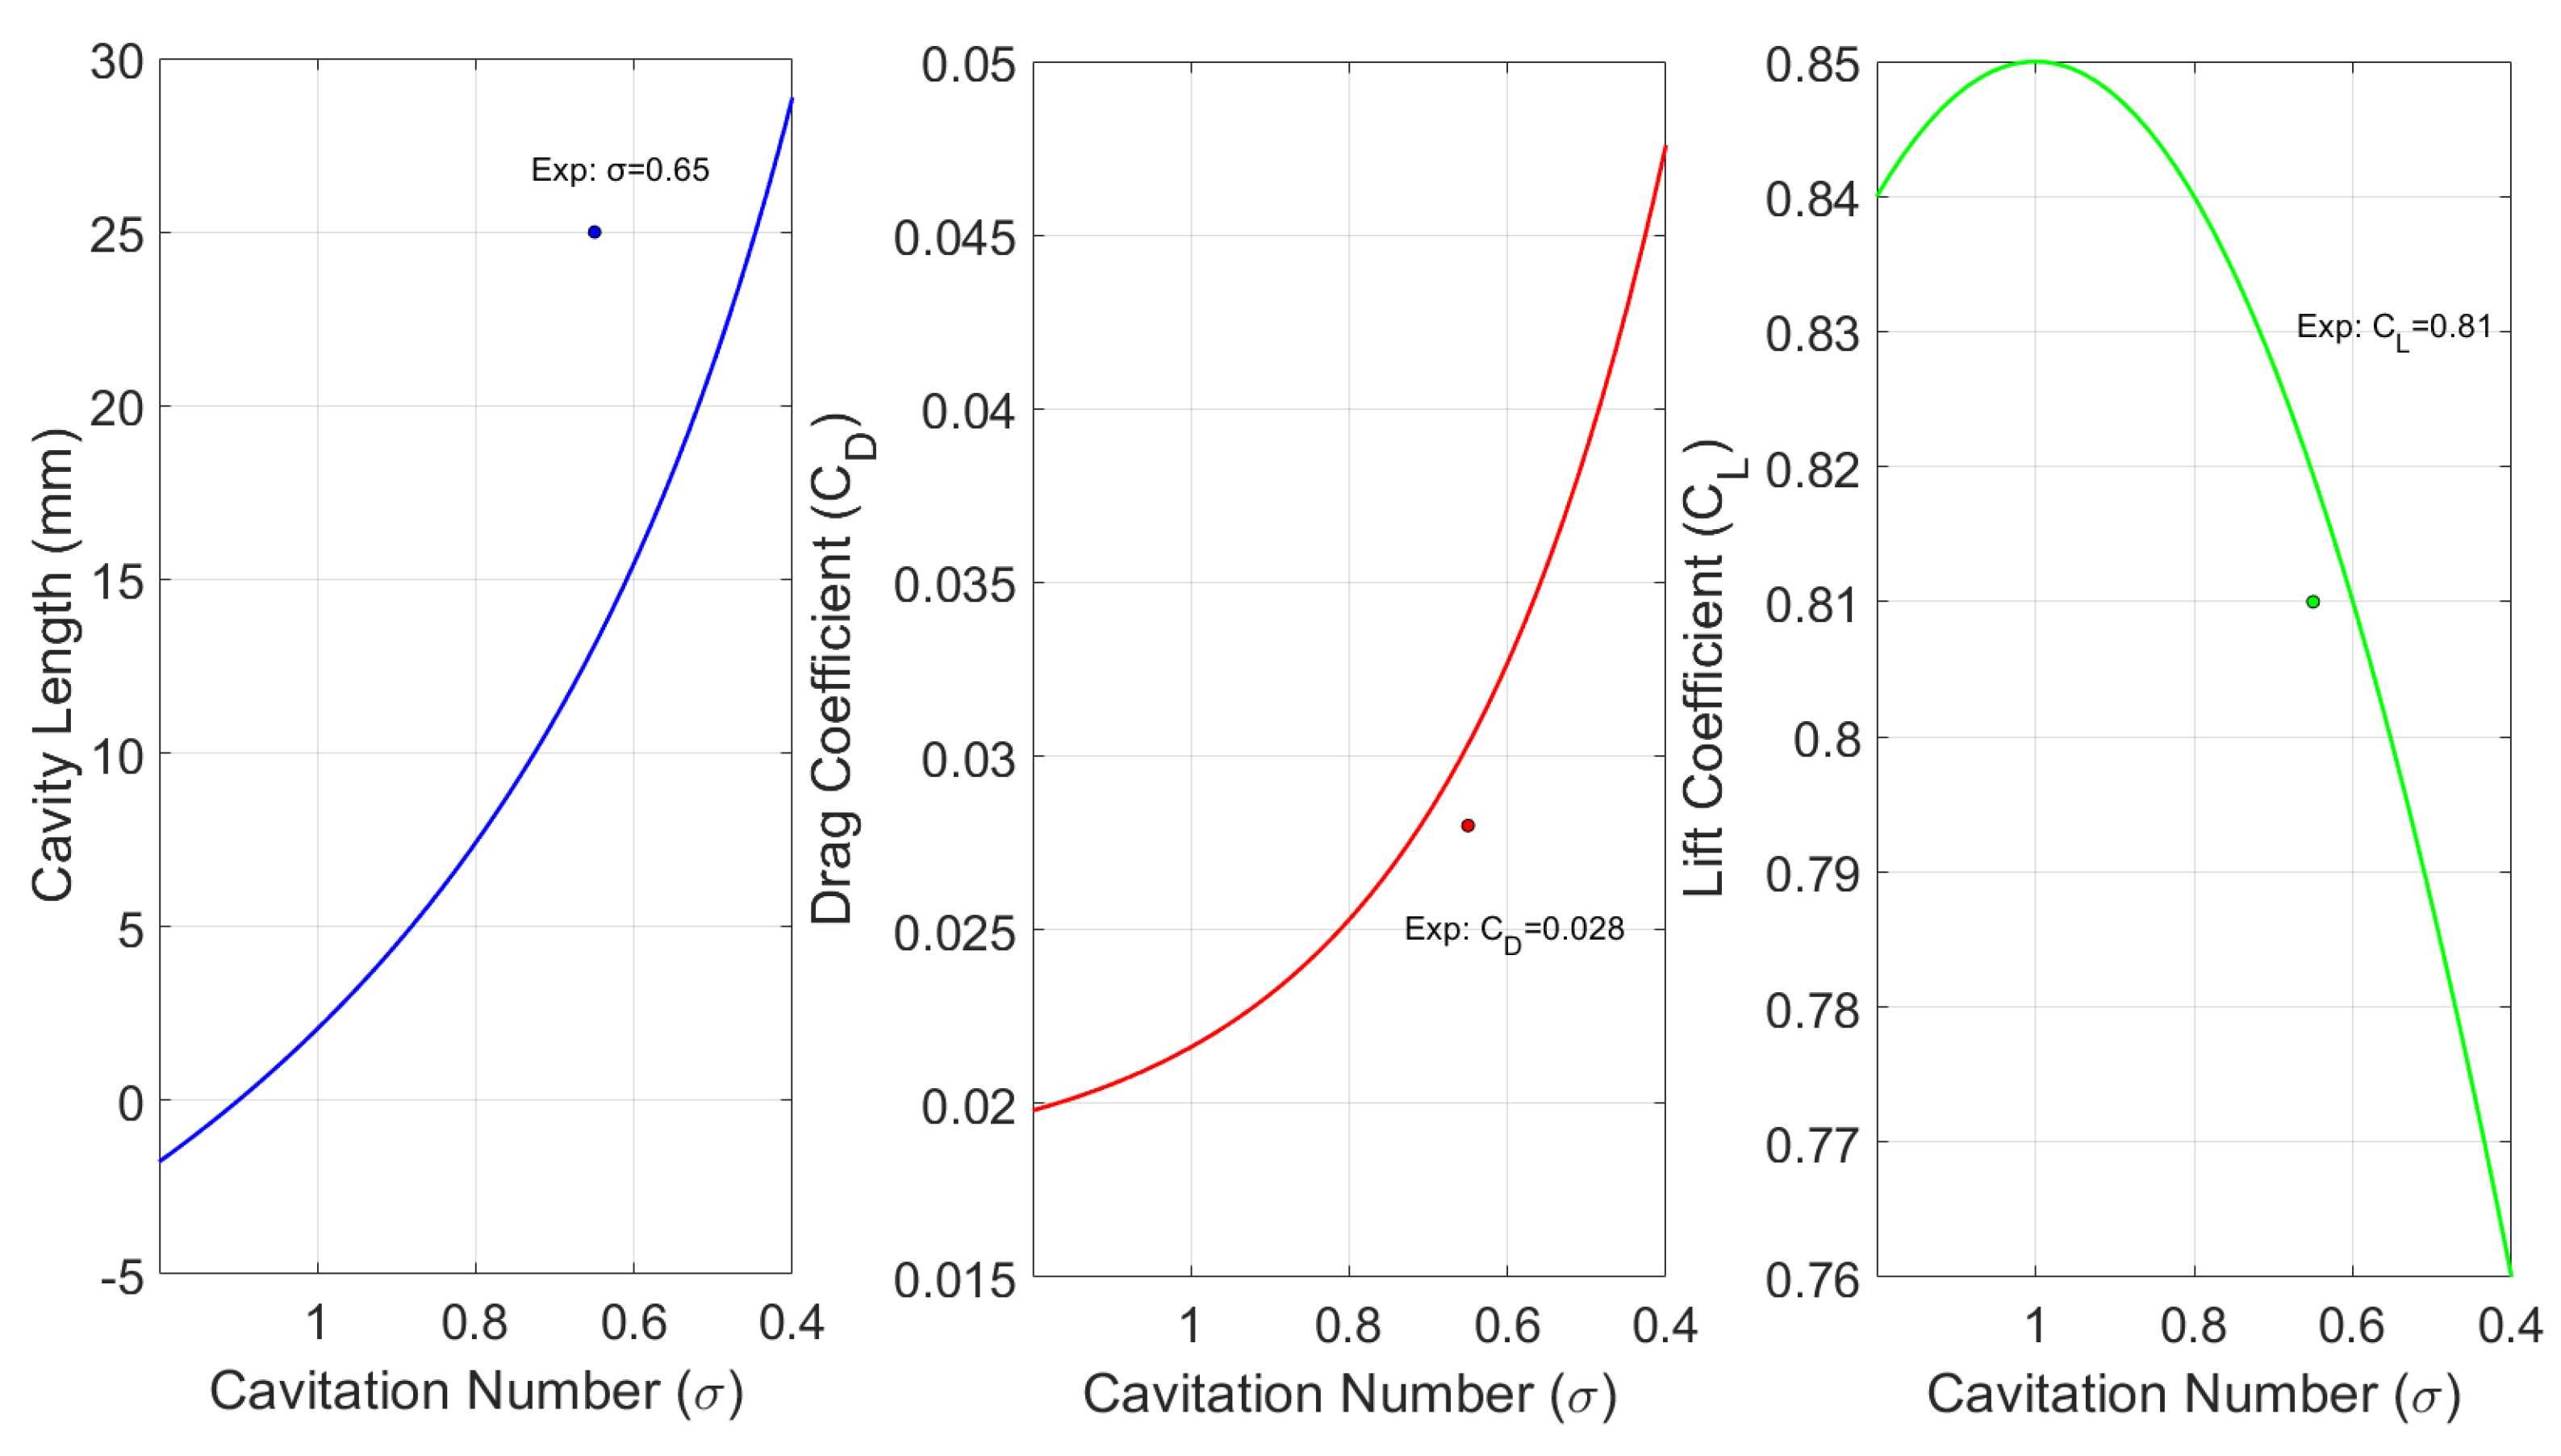
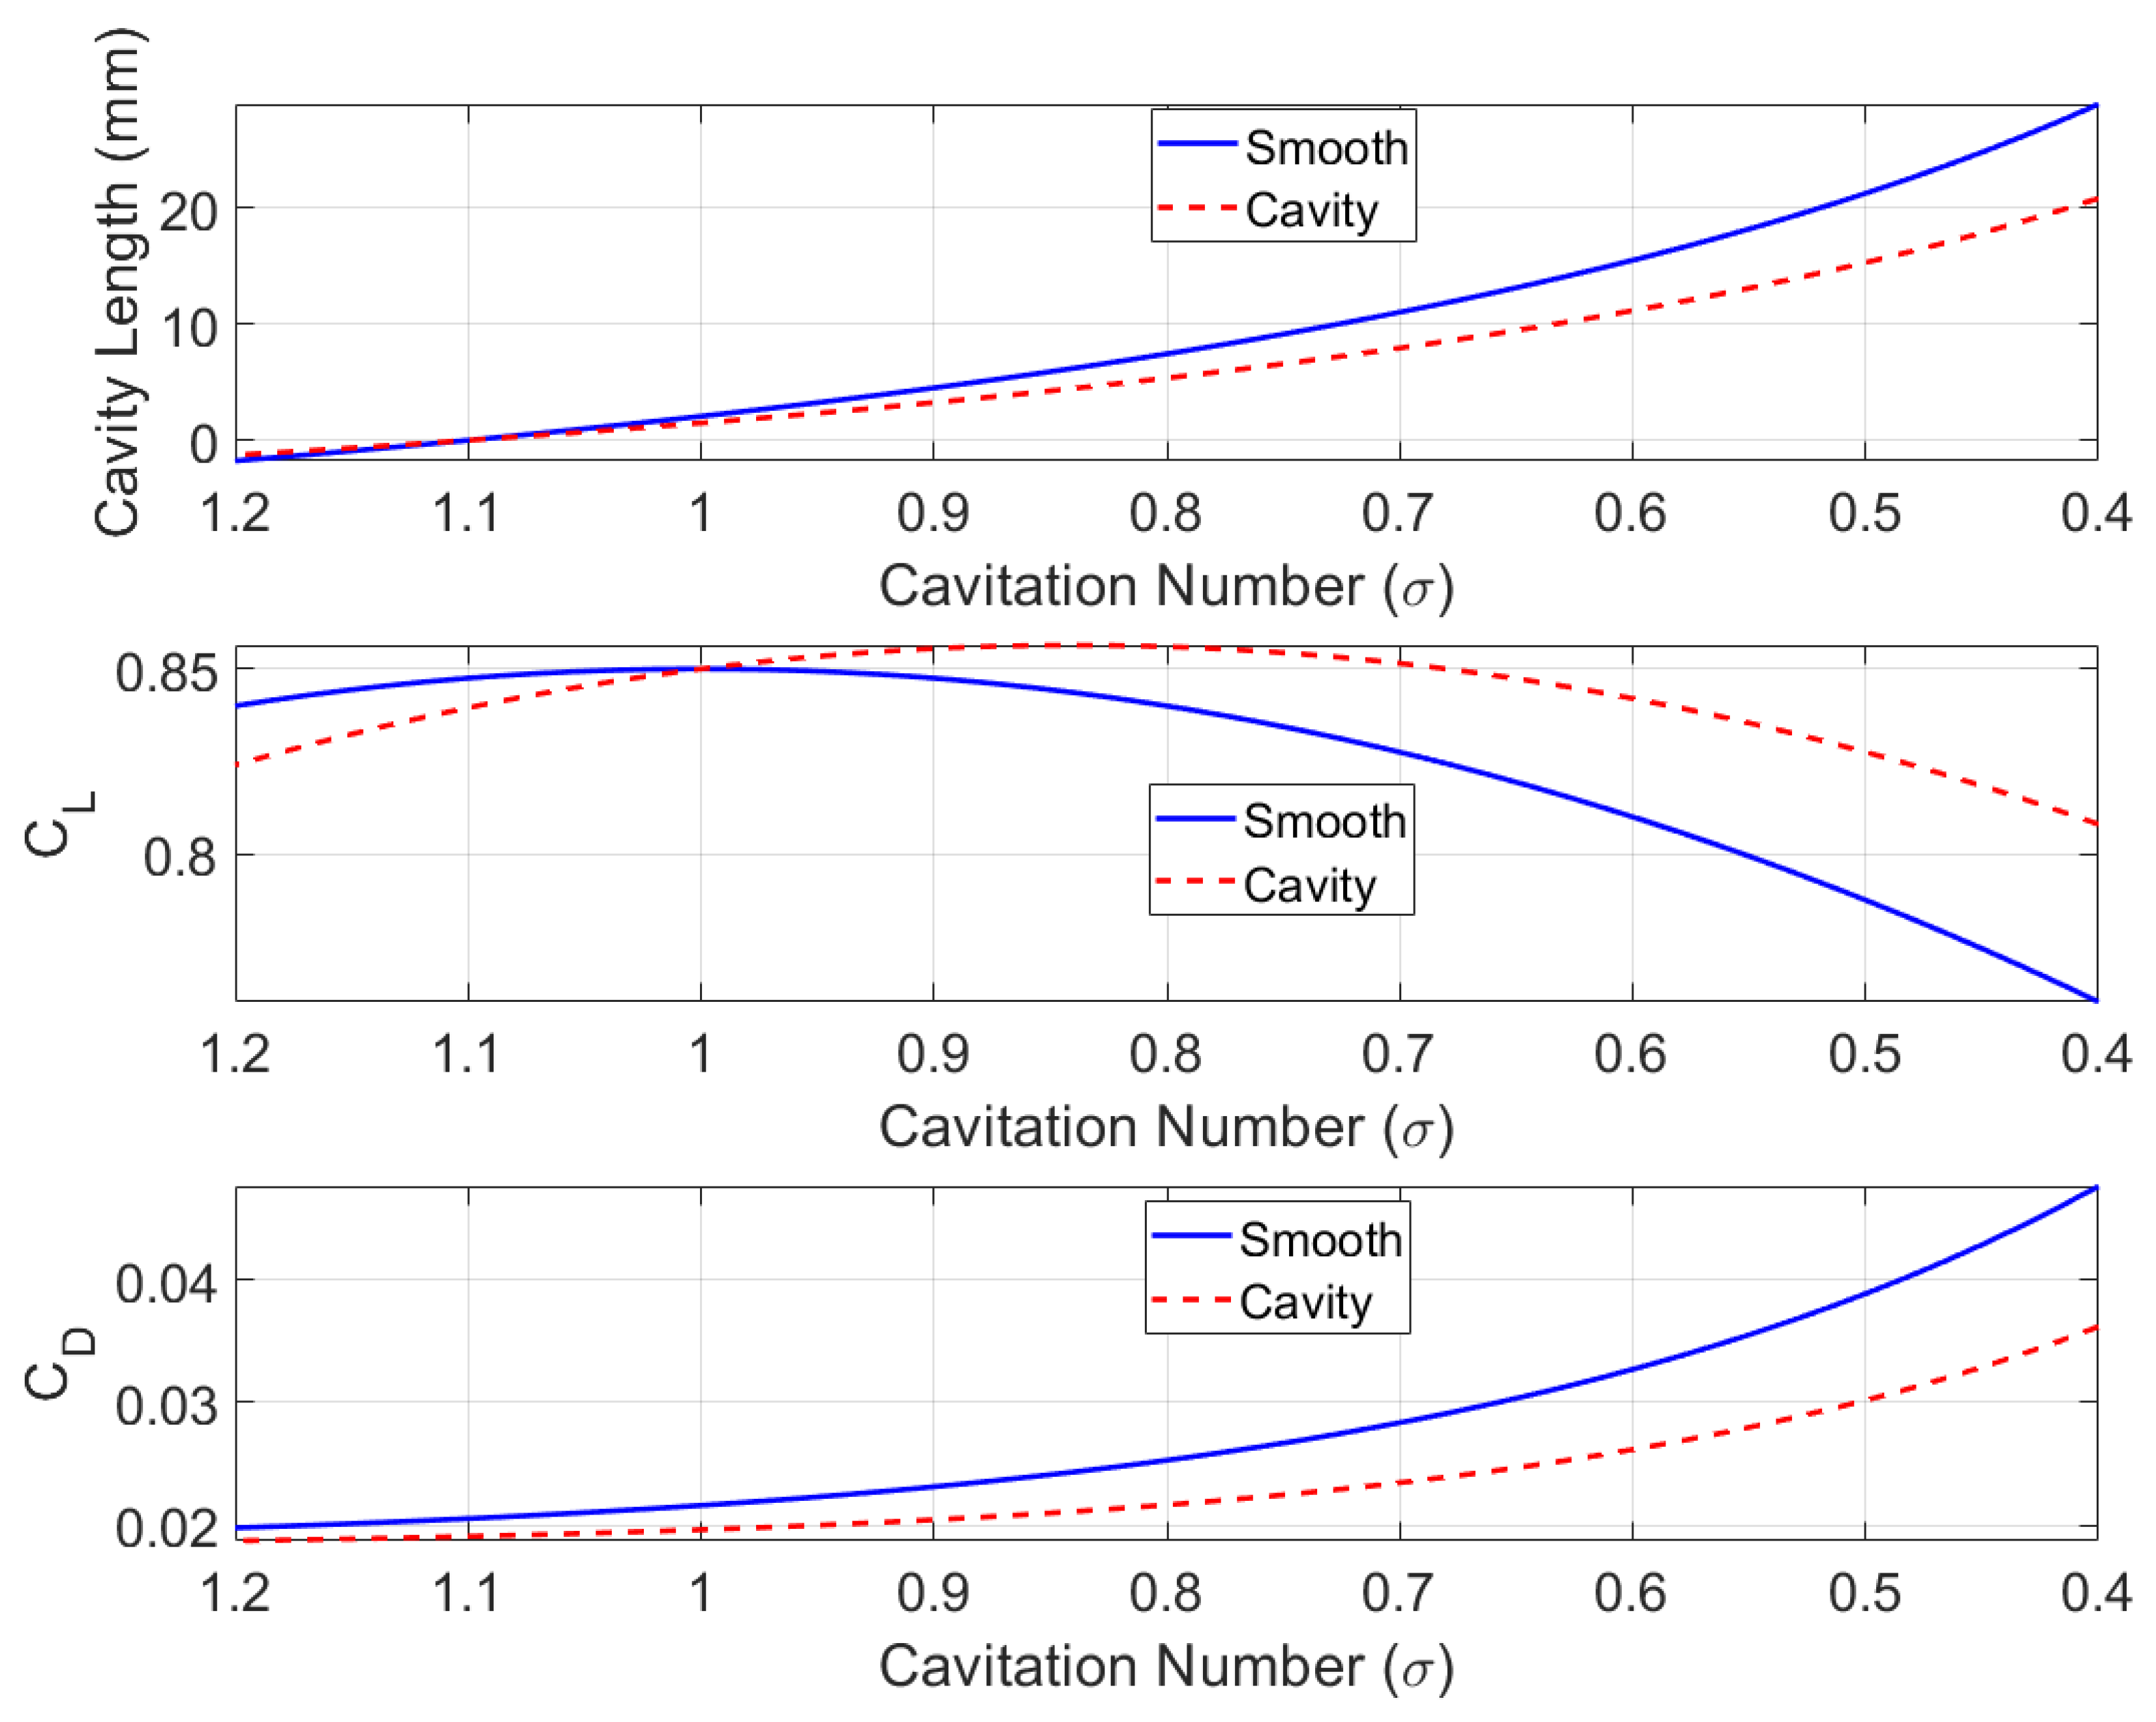
Figure 2.
Comparison between plain and modified NACA0018 hydrofoils showing cavity length, drag coefficient (), and lift coefficient () variation with cavitation number () based on empirical relations.
Figure 2.
Comparison between plain and modified NACA0018 hydrofoils showing cavity length, drag coefficient (), and lift coefficient () variation with cavitation number () based on empirical relations.
2.7. Physical Interpretation of Groove Effects
The groove modifies cavitation through three primary mechanisms:
1. Reduction in capacity length 28% observed as grooves capture tip leakage vortices (TLV), generating secondary counter-rotating vortices that reduce TLV strength by 30% [33]:
2. Grooves create local pressure rise zones that delay cavitation inception by [35]:
3.Lift enhancement and drag reduction observed due to preservation of the leading-edge suction pressure distribution and reduction of lift hysteresis by 40% during cavitation cycles [34]. The modified drag equation reduces the drag induced by cavitation by lowering the oscillation amplitude of the cavity.
3. Numerical Section
The numerical simulation aims to verify the empirical relation concerning drag, lift and cavity length variation with plain NACA foil and modified NACA foil.
3.1. Governing Equations
The incompressible, unsteady Reynolds-Averaged Navier-Stokes (URANS) equations govern the flow over the NACA0018 hydrofoil. These include the continuity and momentum equations:
Continuity equation:
Momentum equation:
where is the mean velocity component, P is the pressure, is the density, is the kinematic viscosity, and is the Reynolds stress tensor.
3.2. Computational Domain and Mesh
A structured rectangular two-dimensional computational domain is used, extending upstream, downstream, and in the normal direction from the hydrofoil chord (c). The mesh is very fine near the wall to ensure for accurate resolution of the boundary layer near hydrofoil. Grid independence is verified by comparing lift and drag coefficients in three mesh densities: coarse (1,40,000 cells), medium (2,70,000 cells) and fine (4,42,000 cells). The finer mesh is selected as it provides a balance between accuracy and computational cost. Figure 3 shows the two-dimensional computational domain used for simulating flow over a NACA0018 hydrofoil. The hydrofoil is placed horizontally at a distance of 10 chord lengths () from the inlet and below the top and above the bottom walls where C represents chord length. The cavity dimension is selected as height (h) 17.5 and width (w) 35 so that width to height ratio remain 2. The inlet is specified with a velocity boundary condition, the outlet with a pressure boundary, and both walls are treated as no-slip boundaries. This setup ensures sufficient space to capture flow development and cavitation effects around the hydrofoil.
3.3. Turbulence Model: k--
The k-- three-equation model is used to capture the characteristics of turbulent and transitional flow. The k-- turbulence model is especially beneficial for simulating flow over a NACA0018 hydrofoil due to its precise predictions of laminar-to-turbulent transition, flow separation, and adverse pressure gradients, all of which are essential for hydrofoil performance. Research indicates that the k-- model produces enhanced predictions of lift and drag coefficients relative to traditional turbulence models, with errors often around 5% compared to experimental data. This model accurately preserves vortical structures and resolves separation bubbles, rendering it highly suitable for representing the intricate flow phenomena surrounding hydrofoils. The advantages have been substantiated in the research conducted by Walters and Leylek [30], who confirmed the model for transitional and separated flows over airfoils.
The governing equations are:
Turbulent kinetic energy (k):
Specific dissipation rate ():
Turbulent length scale ():
where is the eddy viscosity.
3.4. Cavitation Model: Schnerr-Sauer
The Schnerr-Sauer cavitation model [37], is used to simulate phase change between liquid and vapor. The Schnerr-Sauer cavitation model is a model widely utilized in cavitation modeling because of its efficacy in accurately representing the dynamics of vapor bubble formation and collapse, as well as the transient development of cavitation regions, all while ensuring high computational efficiency. The model is successfully used for both steady and unstable cavitating flows, establishing it as a reliable choice for predicting cavitation behavior in engineering applications. The easier formulation, based on bubble dynamics, enables a strong and physically consistent description of complex cavitation processes [38].
The vapor volume fraction is governed by:
Mass transfer rate:
Bubble radius:
where is the bubble nuclei number density, is the saturation pressure, and .
3.5. Numerical Scheme and Convergence
A pressure-based transient solver is used with second-order, second-order upwind for momentum, quick for the volue fraction, second-order upwind is used for the turbulence kinetic energy, the specific dissipation rate and laminar kinetic energy. The SIMPLE scheme is applied for pressure velocity coupling. Least square cell based gradient is applied. lift and drag coefficients along with five moniotor points are created. Convergence is achieved when residuals fall below for continuity and momentum, and for turbulence and cavitation equations. Time-step independence is ensured with s.
3.6. Validation
The numerical setup is validated by comparing simulated lift and drag coefficients and vortex shedding frequency with experimental data for similar hydrofoils. The present URANS approach predicts these parameters within 5% of experimental values, confirming the reliability of the methodology. Validation is shown in Table 2, which supports the numerical scheme to be capable of capturing the trend.
4. Results
The section is extended with three subsections for detaied analysis.
4.1. Contours of Velocity and Vapour Fraction
Figure 6 shows velocity contour plots around a NACA0018 hydrofoil for two surface conditions: (a) plain and (b) cavity-modified. In subplot (a), strong vortex structures are visible near the trailing edge, indicating flow separation and increased unsteadiness. In contrast, subplot (b) shows a more streamlined flow with suppressed vortex formation due to the cavity-modified surface. This implies that surface modification reduces flow separation and stabilizes the flow, potentially enhancing hydrofoil performance under cavitating conditions.
Figure 7 compares the cavitation behavior between a plain NACA0018 airfoil and a modified NACA0018 with a cavity. The cavitation number is reducing from (a) to (c) so cavity size is maximum in case of Figure 7(a). In the plain airfoil, cavitation typically initiates at the leading edge or low-pressure regions, forming vapor bubbles that collapse downstream, leading to noise, vibrations, and potential surface erosion. In contrast, the cavity in the modified airfoil alters the pressure distribution, which can either delay cavitation onset or stabilize vapor formation, reducing the harmful effects of bubble collapse. As the cavitation number decreases, the size of the vapor cavity on the suction side of a hydrofoil or airfoil increases. In fact, the cavity can act as a low-pressure region that increases the risk or extent of cavitation, and the observed increase in cavity size with a surface cavity is consistent with established cavitation dynamics. Therfore, it can be observed that at = 0.93, cavitation size is more in prensce of cavity on surface.
4.2. Forces and Monitor Points
Figure 8 shows the five monitor points on the suction side to investigate the cavity evalution in the shear layer and wake. There are many monitor points are carefully made but for analysis only five points are presented and explained.
Figure 9 compares the root mean square (RMS) speed (velocity magnitude fluctuations) at five monitor points for three cavitation numbers ( = 1.7,1.23 and 0.93). For the plain NACA foil (a), the average RMS speed at all monitor points is highest at = 1.7 and reduces with cavitation. for modified foil it is found that overall RMS speed values are much lower than the plain case, and the average RMS speed remains low across all cavitation number indicating the cavity effectively suppresses velocity fluctuations. This was also observed by [33] demonstrates that the vortex cavitation was supressed.
Figure 10 shows the vapor fraction at five monitor points for three different cavitation numbers (, , and ) for (a) the plain NACA0018 and (b) the modified NACA0018. For both cases, vapor fraction increases as the cavitation number decreases, indicating more intense cavitation at lower . it was found here that presence of cavity shifts the cavitation formation downstream as monitor point 1 and 2 are zero, demonstrating the cavity’s effectiveness in suppressing cavitation in these regions.
4.2.1. Frequency Spectrum
Figure 11 compares the frequency spectra of velocity fluctuations at five monitor points (MP-1 to MP-5) for both the plain and modified NACA0018 airfoils under different cavitation numbers. Figure 11 (a) and Figure 11(b) show the plain airfoil at higher cavitation numbers, where the amplitude of low-frequency fluctuations is much larger, indicating stronger unsteady flow and cavitation activity. Figure 11 (c) and Figure 11(d) display results for the modified airfoil with a cavity, where the amplitude of fluctuations is significantly reduced across all frequencies and monitor points. This demonstrates that the surface cavity effectively suppresses unsteady flow and cavitation-induced velocity fluctuations, especially at lower cavitation number.
Figure 12 displays Mel-frequency spectrograms of vapour fraction value for different cavitation number. Figure 12 (a) and (c) show low-frequency, broadband energy concentrated at lower Mel frequencies, indicating persistent low-frequency flow structures or oscillations. In contrast, Figure 12 (b) and (d) reveal much broader frequency content, especially in (b), where a burst of high energy at low frequencies is followed by a rapid decay, suggesting a transient event such as cavitation inception or strong unsteady flow. The differences in spectral energy distribution across panels reflect changes in flow physics—such as the onset of cavitation or the presence of a surface cavity—affecting the unsteady flow and acoustic response. The plain hydrofoil spectrograms reveal strong low-frequency energy and pronounced broadband high-frequency components in the log scale, indicating high vapour fraction fluctuations caused by unsteady sheet cavity shedding and fluctuations. In contrast, the modified hydrofoil exhibits lower and more stable energy across both normal and log scales, with smoother low-frequency variations and minimal high-frequency content.
5. Conclusions
The numerical study confirms that incorporating a surface cavity on a NACA0018 hydrofoil significantly modifies flow separation, wake structure, and unsteady cavitation dynamics. Although the cavity geometry increases overall cavity length at lower cavitation numbers—consistent with fundamental cavitation physics—it nonetheless stabilizes the flow, suppresses unsteady shear-layer oscillations, and reduces velocity fluctuations at key monitoring points. The lift-to-drag ratio improves by over 30% compared to the plain hydrofoil, demonstrating the aerodynamic benefits of the design even under cavitating conditions. It was found that features like riblets or surface roughness can sometimes reduce cavity size, but a large geometric cavity does not function in the same way. In fact, the cavity size becomes bigger with a cavity on the surface as he cavity can act as a low-pressure region that increases the risk or extent of cavitation. Frequency spectrum and Mel-frequency analyses further reveal reduced low-frequency acoustic energy, indicating effective mitigation of noise-generating flow instabilities. These results underscore the promise of surface-cavity modifications for enhancing the performance of hydrofoils and turbine blades in practical marine applications.
Author Contributions
Pankaj Kumar: Conceptualization, Methodology, Software, Writing—Original Draft Preparation, Writing—Review and Editing, Ebrahim Kadivar: Review and Editing and Bettar O. el Moctar: Review and Editing. All authors have read and agreed to the published version of the manuscript.
Funding
This research received no external funding.
Data Availability Statement
The data presented in this study are available in the article.
Conflicts of Interest
The authors declare no conflict of interest.
Abbreviations
The following abbreviations are used in this manuscript:
| AOA | Angle of attack |
| Drag Coefficient | |
| Lift Coefficient | |
| Coefficient of pressure | |
| Cavitation number | |
| Lift to drag ratio |
References
- Knapp, R. T.; Daily, J. W.; Hammitt, F. G. Cavitation. McGraw-Hill, New York, 1970.
- Blake, W. K. Mechanics of flow-induced sound and vibration; Vols. I & II. Academic Press, New York, 1986.
- Tulin, M. P. Supercavitating flow past foils and struts. In Proc. NPL Symposium on Cavitation Hydrodynamics, London, 1955.
- Shen, Y. T.; Eppler, R. Wing section for hydrofoils. J. Ship Res. 25(3), 191–200 (1981).
- Achkinadze, A. S. Supercavitating propellers. In Supercavitating Flows, NATO RTO EN-010, 2001.
- Amromin, E.; Kopriva, J.; Arndt, R. E. A.; Wosnik, M. Hydrofoil drag reduction by partial cavitation. ASME J. Fluids Eng. 128(5), 931–936 (2006). [CrossRef]
- Amromin, E. L. Design approach for cavitation tolerant hydrofoils and blades. J. Fluids Struct. 45, 96–106 (2014). [CrossRef]
- Olsman, W. F. J. and Colonius, T. Numerical simulation of flow over an airfoil with a cavity. AIAA Journal 49(1), 143–149 (2011). [CrossRef]
- Olsman, W. F. J., Willems, J. F. H., Hirschberg, A., Colonius, T., and Trieling, R. R. Flow around a NACA0018 airfoil with a cavity and its dynamical response to acoustic forcing. Experiments in Fluids 51, 493–509 (2011). [CrossRef]
- Kopriva, J.; Amromin, E. L.; Arndt, R. E. A. Improvement of hydrofoil performance by partial ventilated cavitation in steady flow and periodic gusts. ASME J. Fluids Eng. 130(3), 031301 (2008). [CrossRef]
- Kasper, J. Vortex wing design. U.S. Patent No. 3,831,885 (1974).
- Kruppa, C. Wind tunnel tests on vortex wings. J. Aircraft 14(8), 789–795 (1977).
- Saffman, P. G.; Sheffield, J. S. Trapped vortices in inviscid flow. J. Fluid Mech. 82(1), 1–15 (1977).
- Rossow, V. J. Aerodynamics of trapped vortices. NASA TM-78489, 1978.
- Fletcher, C. A. J.; Stewart, I. Cavity flows on airfoils. AIAA J. 24(3), 345–352 (1986).
- Rockwell, D.; Naudascher, E. Self-sustained oscillations of flow past cavities. J. Fluid Mech. 86(3), 401–430 (1978).
- Gharib, M.; Roshko, A. The effect of flow oscillations on cavity drag. J. Fluid Mech. 177, 501–530 (1987). [CrossRef]
- Baranov, P. A.; et al. Trapped vortices on curved surfaces. J. Fluid Mech. 420, 1–22 (2000).
- Kopriva, J.; Amromin, E. L.; Arndt, R. E. A.; Kovinskaya, S. I.; Wosnik, M. High performance partially cavitating hydrofoils. J. Ship Res. 51(4), 313–325 (2007). [CrossRef]
- Kadivar, E.; el Moctar, O. Boundary layer instability control in the unsteady cloud cavitating flow. IOP Conf. Ser.: Earth Environ. Sci. 240, 062061 (2019).
- Kadivar, E. and Ould el Moctar, Investigation of cloud cavitation passive control method for hydrofoils using cavitating-bubble generators (CGs). Proceedings of the 10th International Symposium on Cavitation (CAV2018), Baltimore, USA, 2018.
- Kumar, P.; Chatterjee, D.; Bakshi, S. Experimental investigation of cavitating structures in the near wake of a cylinder. Int. J. Multiphase Flow 89, 207–217 (2017). doi:10.1016/j.ijmultiphaseflow.2016.11.002. [CrossRef]
- Kumar, P.; Kadivar, E.; el Moctar, O. Experimental investigation of passive cavitation control on a cylinder using proper orthogonal decomposition. Appl. Ocean Res. 158, 104569 (2025). [CrossRef]
- Kadivar, E.; Timoshevskiy, M. V.; Pervunin, K. S.; el Moctar, O. Experimental and numerical study of the cavitation surge passive control around a semi-circular leading-edge flat plate. J. Mar. Sci. Technol. 25, 1010–1023 (2020). [CrossRef]
- Brennen, C. E. Cavitation and bubble dynamics. Oxford University Press, 1995.
- Franc, J.-P.; Michel, J.-M. Fundamentals of cavitation. Springer, 2005.
- Kuiper, G. Theoretical and experimental investigations on the flow around cavitating hydrofoils. PhD Thesis, Delft University of Technology, 1981.
- Arndt, R. E. A. Cavitation in fluid machinery and hydraulic structures. Annu. Rev. Fluid Mech. 34, 143–175 (2002). [CrossRef]
- Gutierrez, J.; Rubio-Clemente, A.; Chica, E. Comparative study of the cavitation resistance of traditional and high-lift hydrofoils. Int. J. Appl. Sci. Eng. 19, 2021470 (2022).
- Walters, D. K.; Leylek, J. H. A new model for boundary layer transition using a single-point RANS approach. J. Turbomachinery 126, 193–202 (2004). [CrossRef]
- Rogowski, K.; Piotrowski, M.; Marcin, A. Aerodynamic performance analysis of NACA 0018 airfoil at low Reynolds numbers. Adv. Sci. Technol. Res. J. 19, 136–150 (2025).
- Singh, S.; Danish, M.; Saha, K. Computational investigation of cavitating flow around two-dimensional NACA 4424 and MHKF-240 hydrofoil. Vibroeng. Procedia 29, 160–168 (2019). [CrossRef]
- Han, Y.; Liu, Y.; Tan, L. Method of variable-depth groove on vortex and cavitation suppression. Renew. Energy 195, 1169–1180 (2022). [CrossRef]
- Kumar, P.; Reddy, S. R. Predicting cavitation control efficiency with passive controllers. ChemRxiv, preprint (2025).
- Cavitation control using mesoscale surface structuring. Technical Report, 2025.
- Eggert, C. A. CFD study of NACA 0018 airfoil. Master’s Thesis, 2017.
- Schnerr, G.H., and Sauer, J. Physical and Numerical Modeling of Unsteady Cavitation Dynamics. In: Proceedings of the 4th International Conference on Multiphase Flow, New Orleans, USA (2001).
- Shao, X., Wang, Y., and Li, Z. Assessment of Improved Schnerr–Sauer Model in Cavitation Simulation Around a Hydrofoil. Journal of Harbin Engineering University, 37, 885–890 (2016).
Figure 3.
Two-dimensional computational domain used for simulating flow over a NACA0018 hydrofoil, indicating inlet, outlet, and boundary conditions.
Figure 3.
Two-dimensional computational domain used for simulating flow over a NACA0018 hydrofoil, indicating inlet, outlet, and boundary conditions.
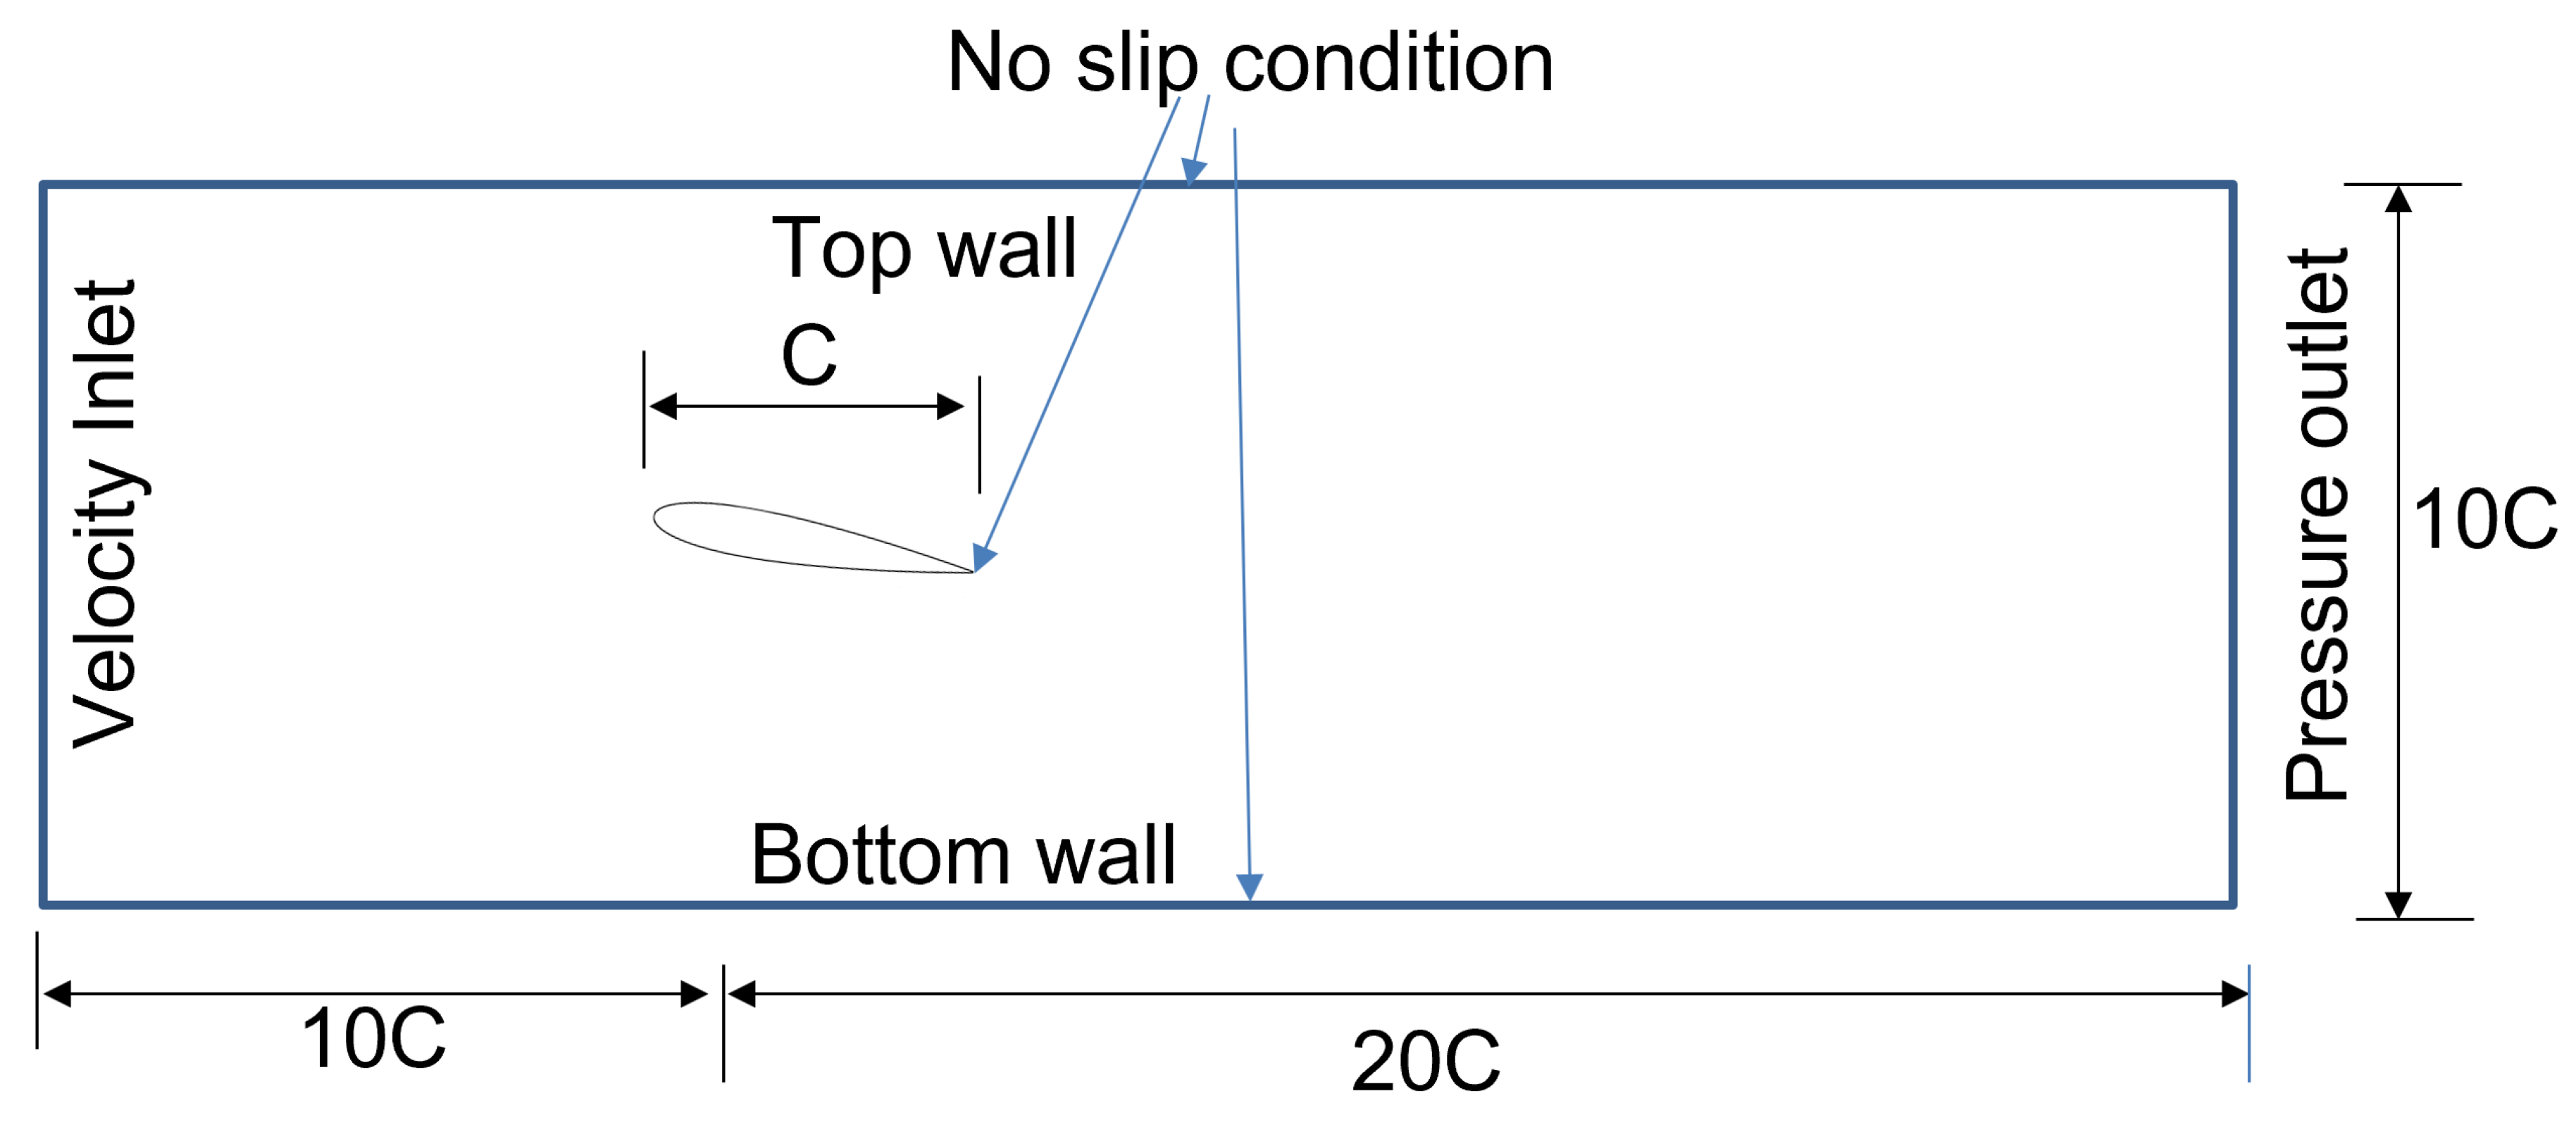
Figure 4.
(a) Structured mesh for plain NACA0018 hydrofoil. (b) Detailed view showing mesh refinement near the hydrofoil surface.
Figure 4.
(a) Structured mesh for plain NACA0018 hydrofoil. (b) Detailed view showing mesh refinement near the hydrofoil surface.
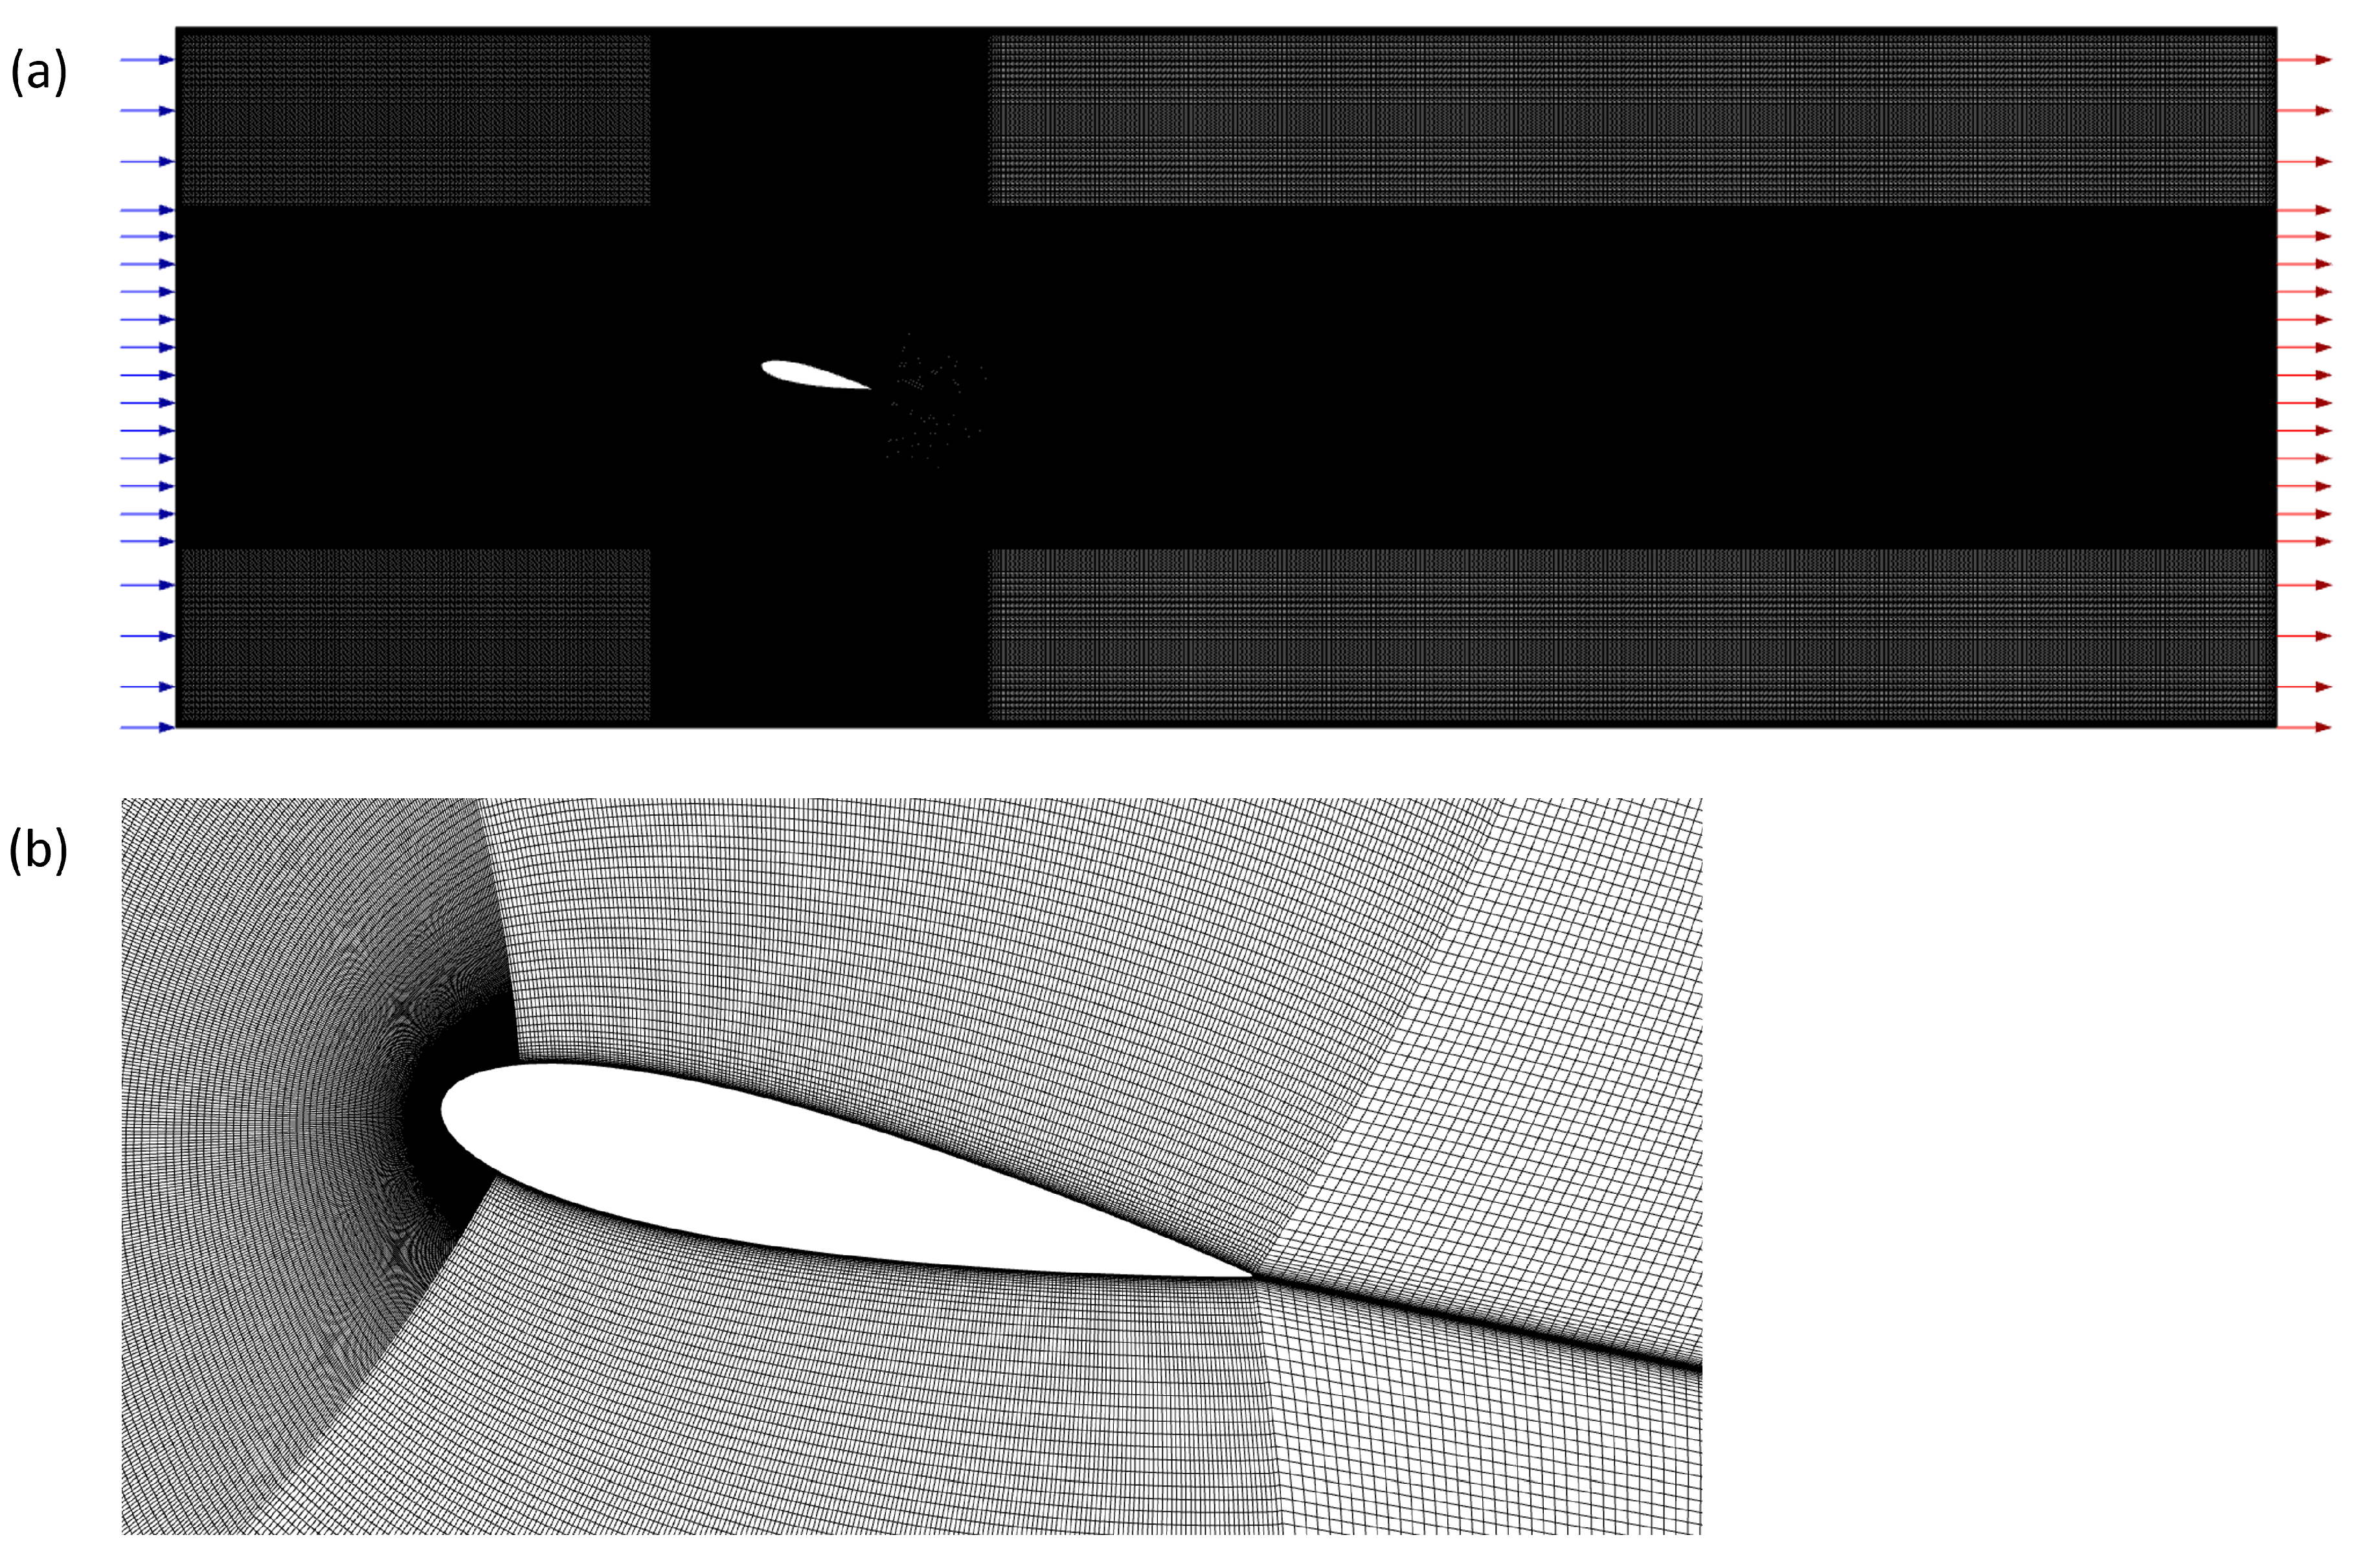
Figure 5.
(a) Structured mesh for modified NACA0018 (b) Detailed view showing the mesh near cavity.
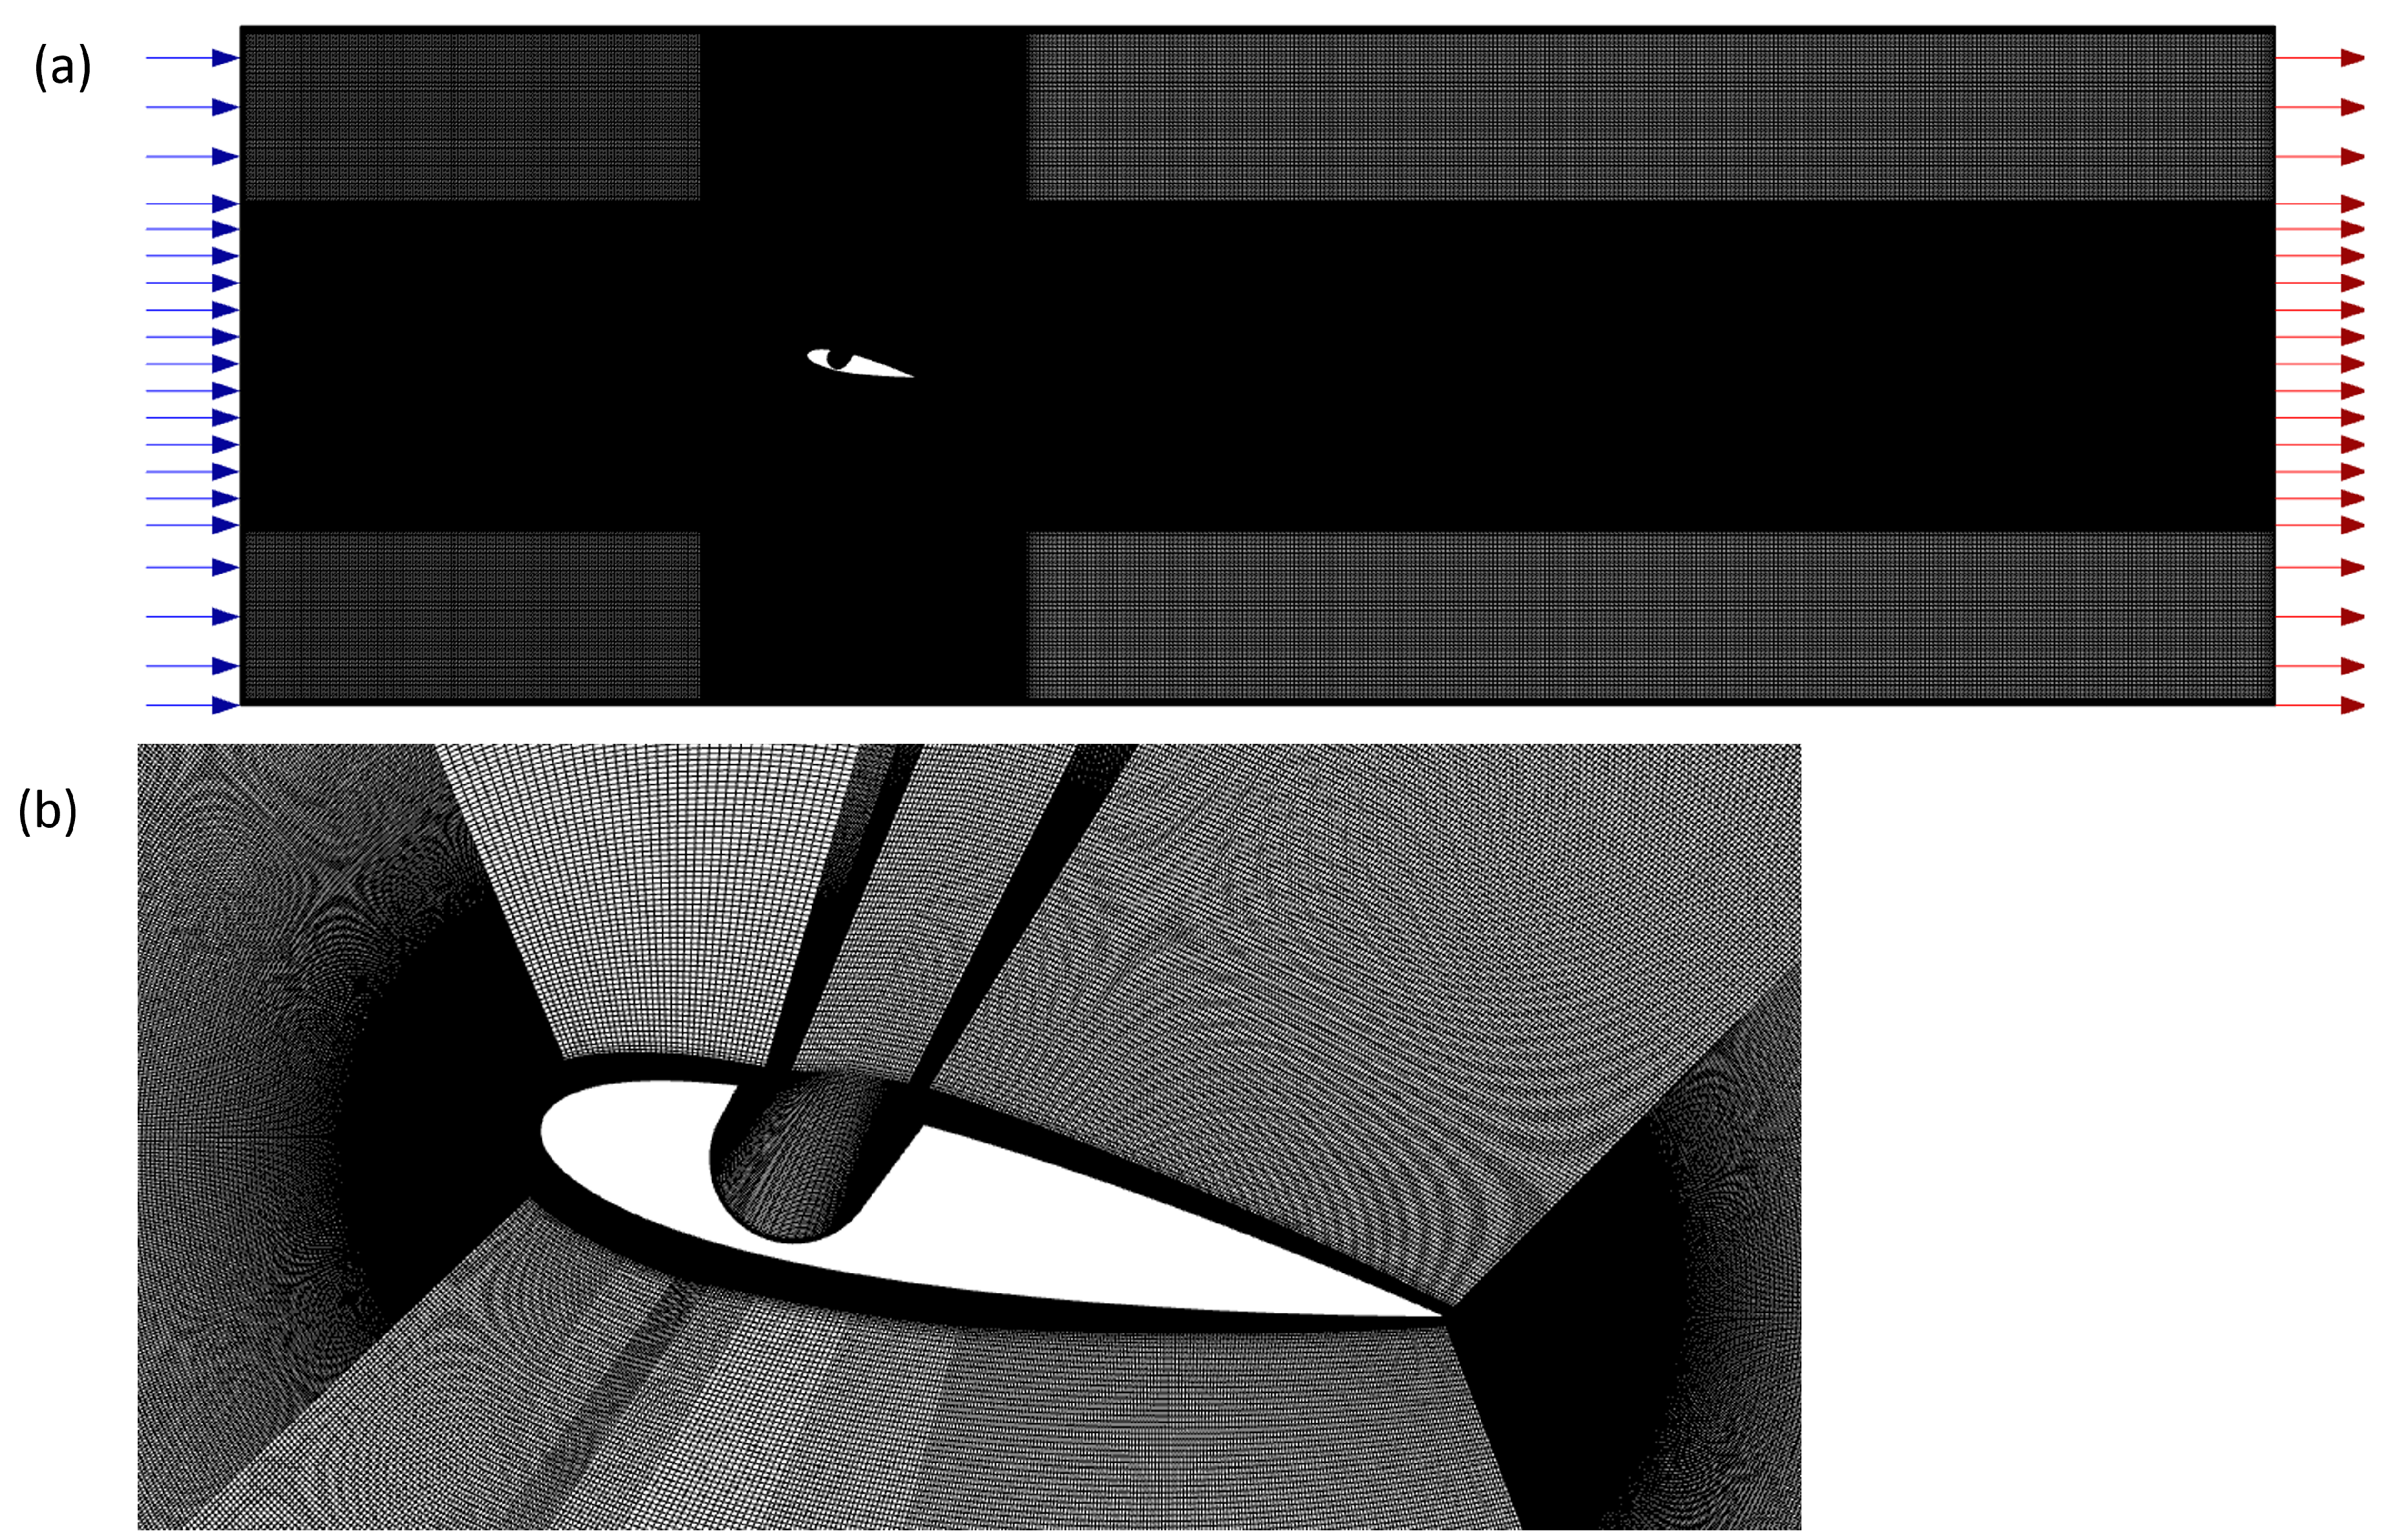
Figure 6.
Velocity streamlines over (a) plain NACA0018 hydrofoil and (b) modified NACA0018 with surface cavity.
Figure 6.
Velocity streamlines over (a) plain NACA0018 hydrofoil and (b) modified NACA0018 with surface cavity.
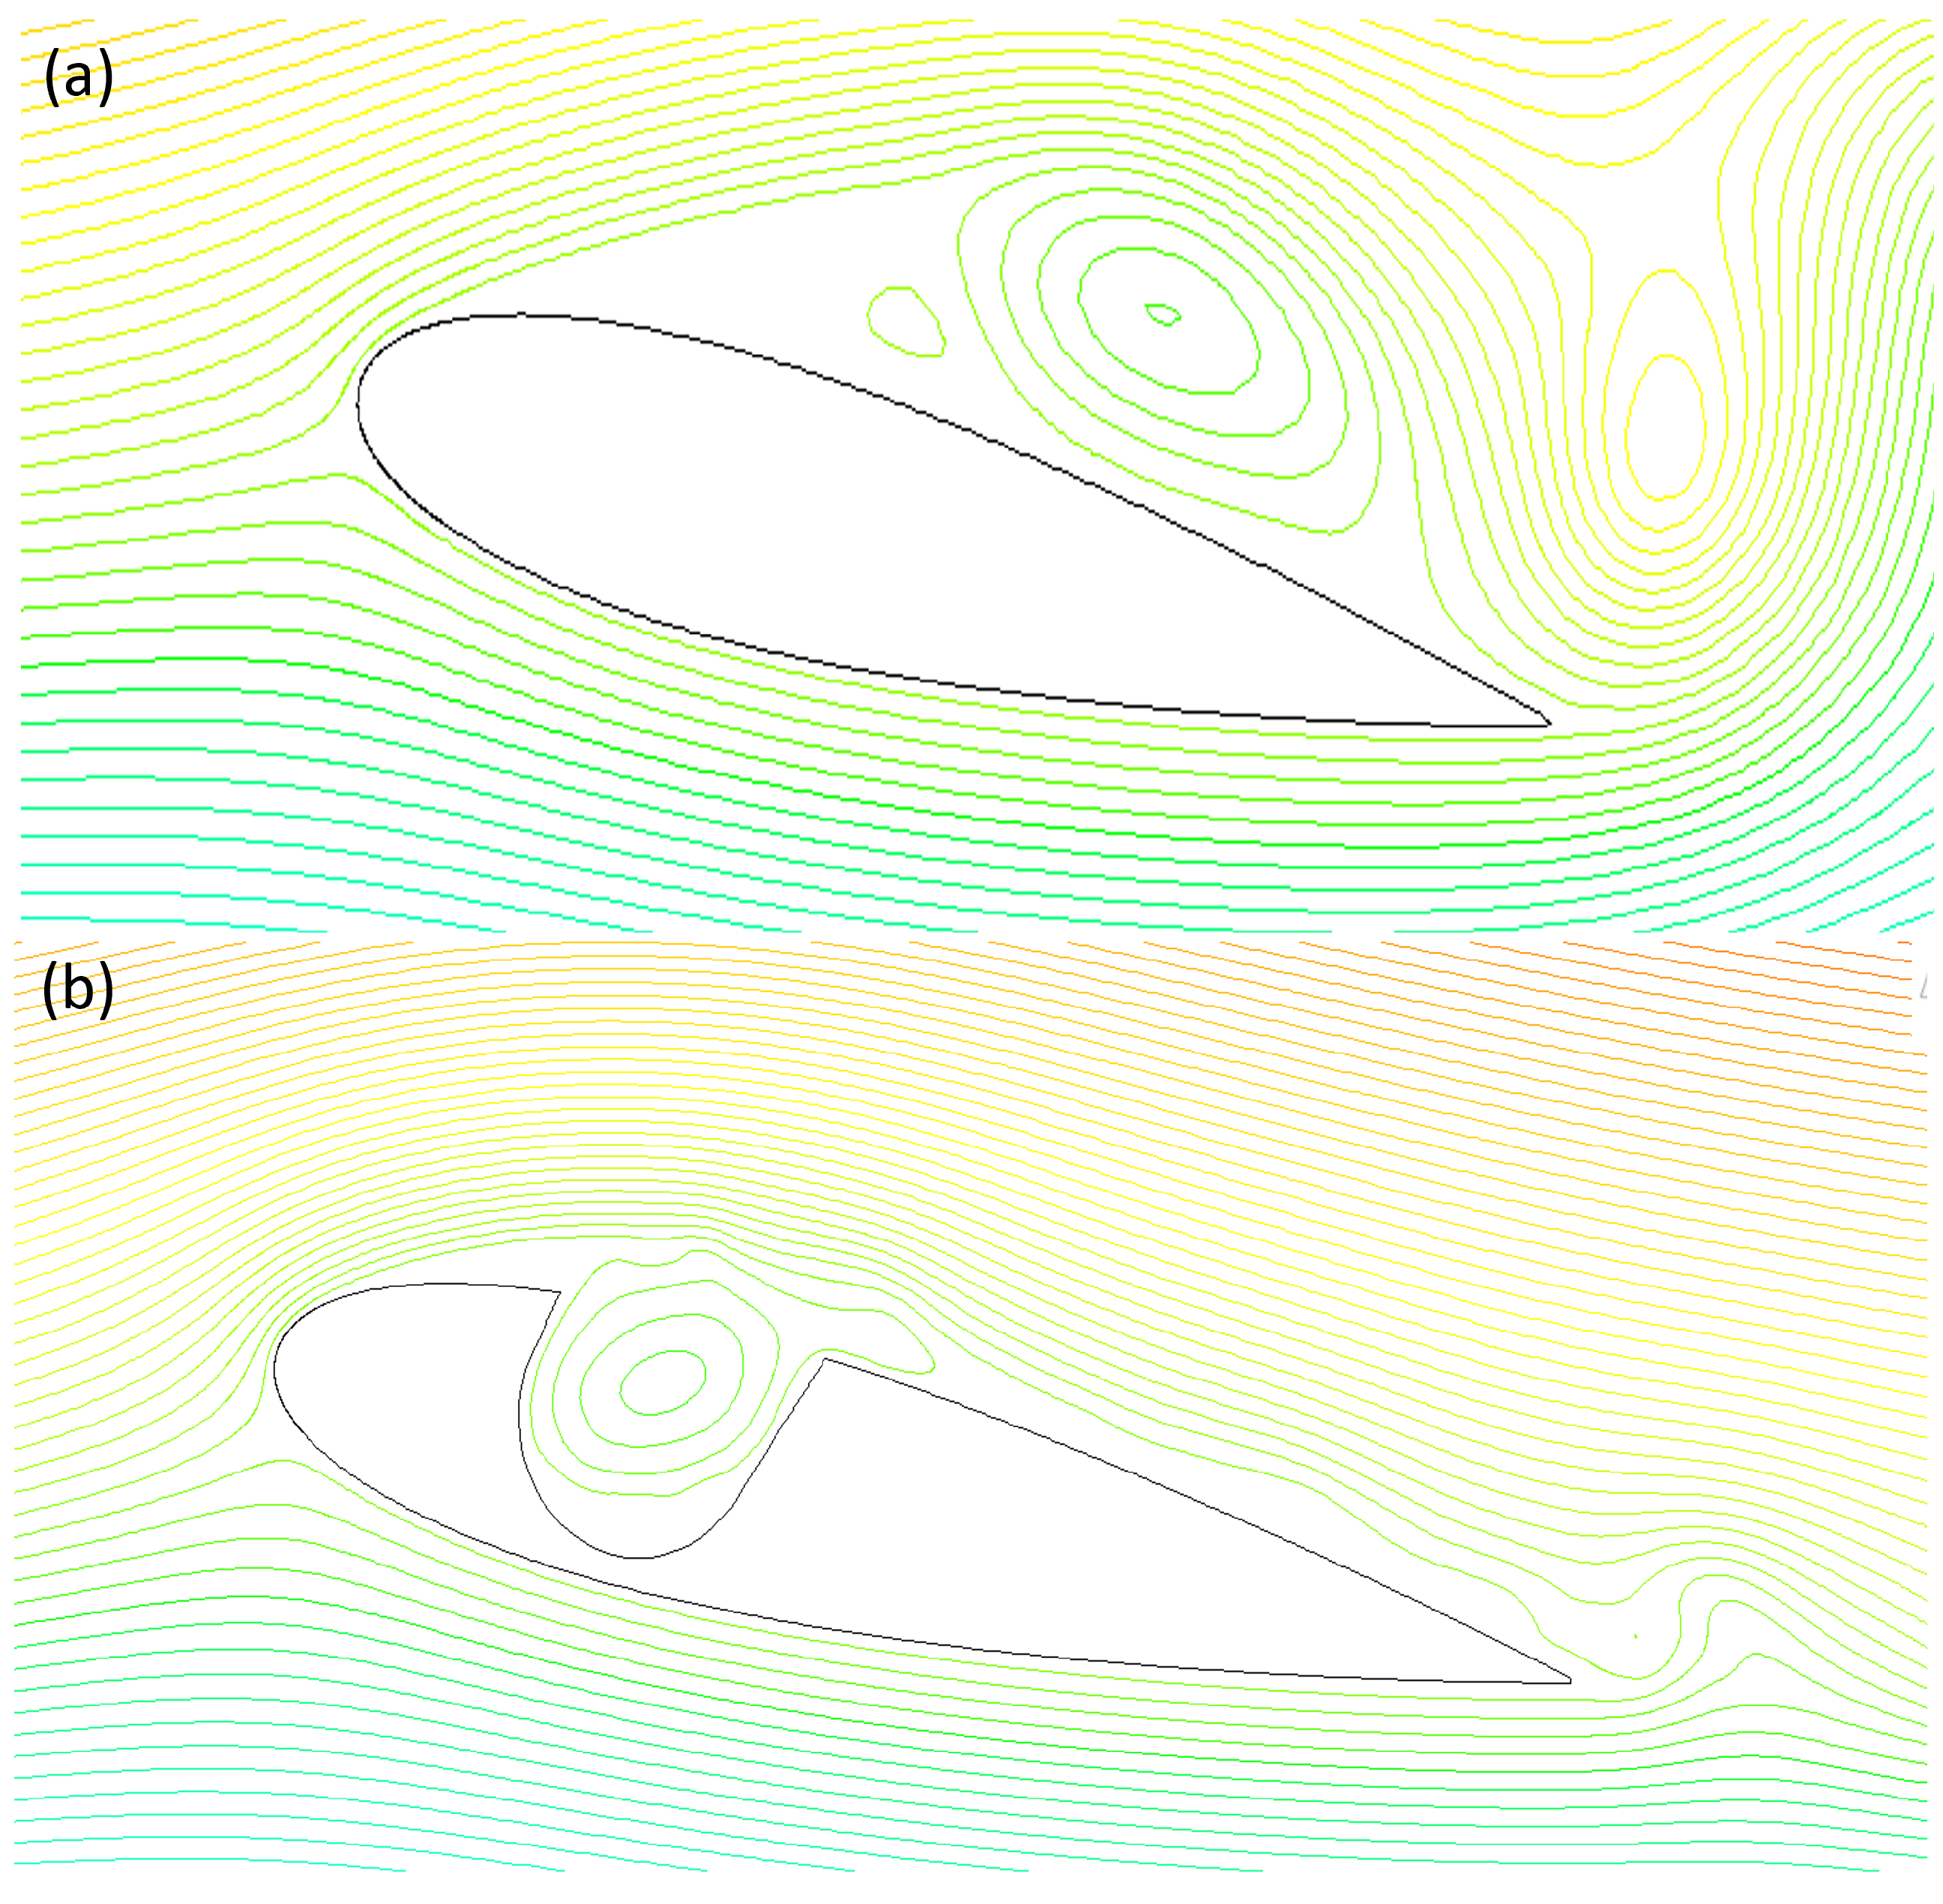
Figure 7.
vapour fraction over a plain NACA0018 hydrofoil and modified NACA0018 at different cavitation numbers: (a) & (a’) = 0.93, (b) & (b’) = 1.23, (c) & (c’) = 1.7.
Figure 7.
vapour fraction over a plain NACA0018 hydrofoil and modified NACA0018 at different cavitation numbers: (a) & (a’) = 0.93, (b) & (b’) = 1.23, (c) & (c’) = 1.7.
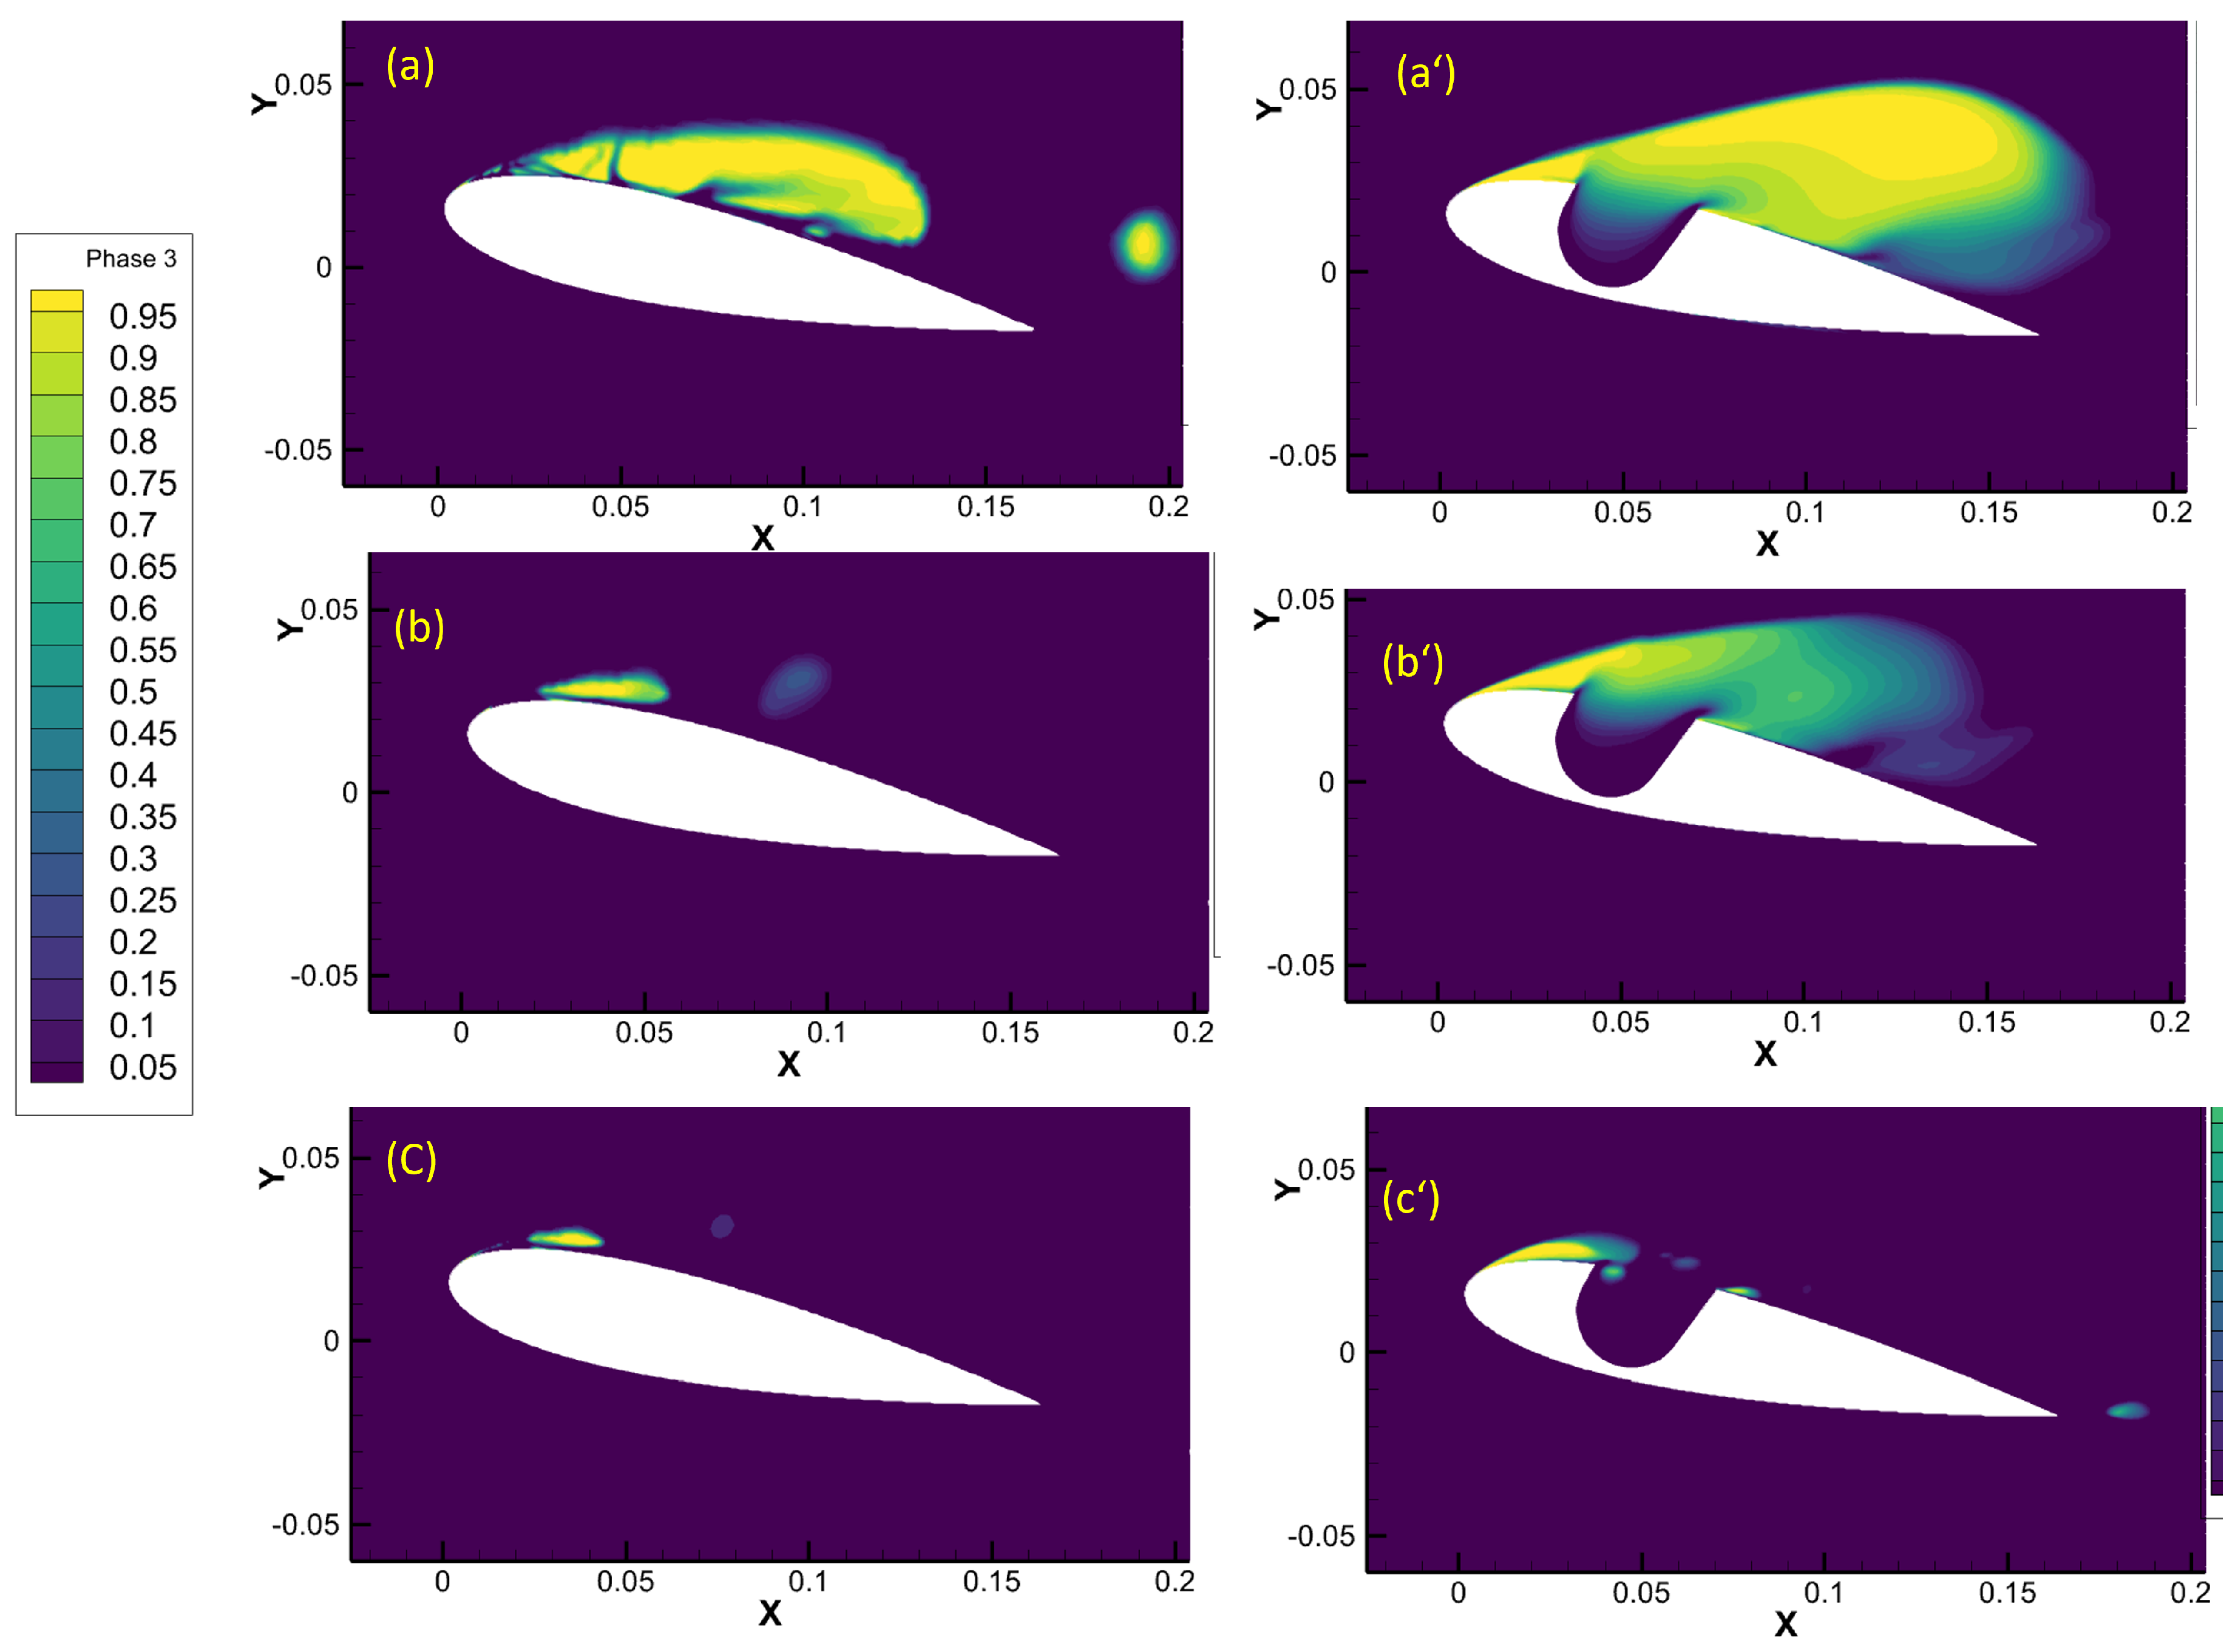
Figure 8.
Coordinates of five selected monitor points on the suction side of the hydrofoil: 1(3.9,21), 2(6.6,22), 3(13,25), 4(43,25)and 5 (89,13).
Figure 8.
Coordinates of five selected monitor points on the suction side of the hydrofoil: 1(3.9,21), 2(6.6,22), 3(13,25), 4(43,25)and 5 (89,13).
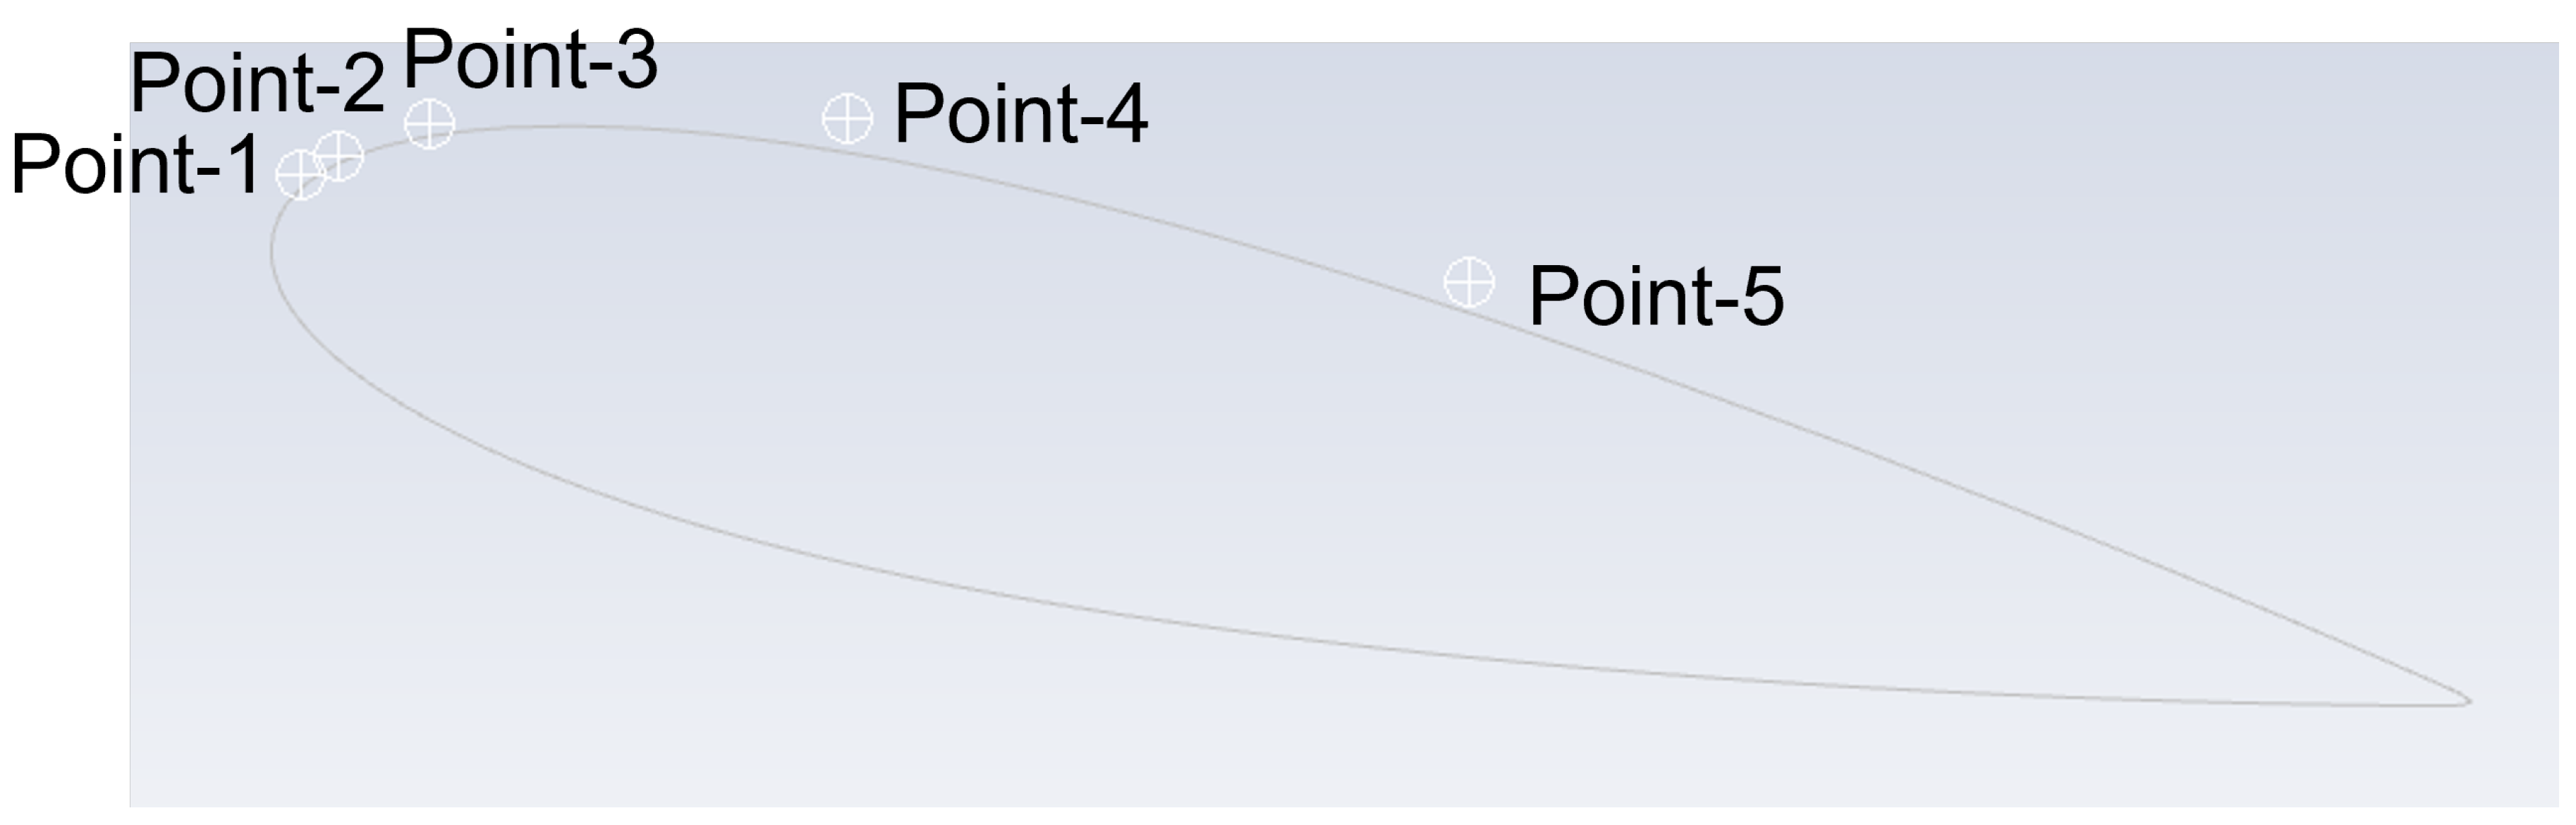
Figure 9.
Average (RMS) velocity magnitude at five monitor points for different cavitation numbers = 1.7,1.23 and 0.93 for both (a) plain and (b) modified NACA0018.
Figure 9.
Average (RMS) velocity magnitude at five monitor points for different cavitation numbers = 1.7,1.23 and 0.93 for both (a) plain and (b) modified NACA0018.
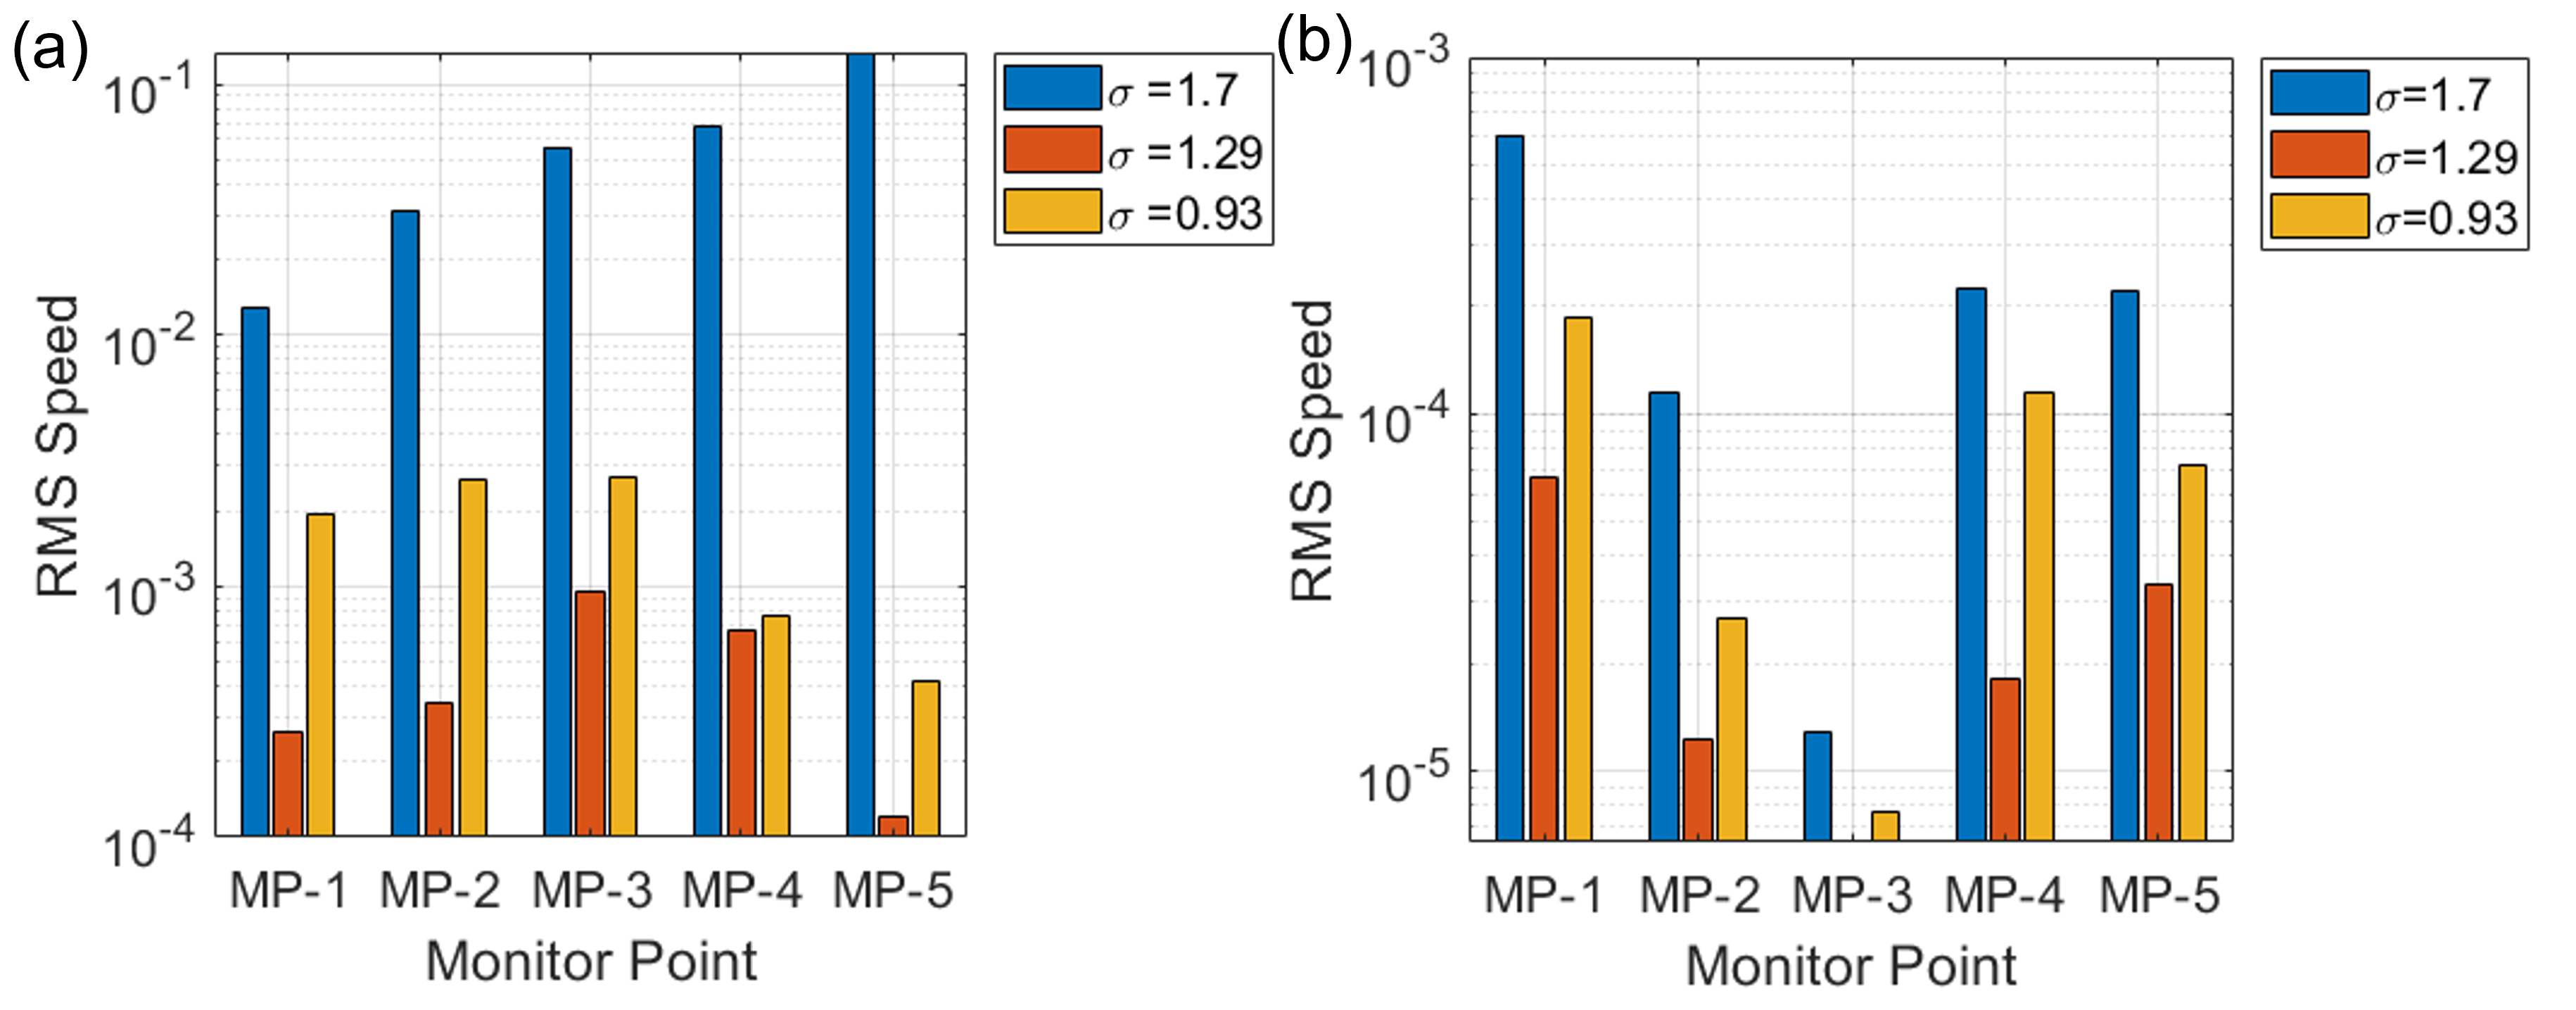
Figure 10.
Average vapor fraction at five monitor points for different cavitation numbers = 1.7,1.23 ans 0.93 for both (a) plain and (b)modified NACA0018 of vapour fraction.
Figure 10.
Average vapor fraction at five monitor points for different cavitation numbers = 1.7,1.23 ans 0.93 for both (a) plain and (b)modified NACA0018 of vapour fraction.
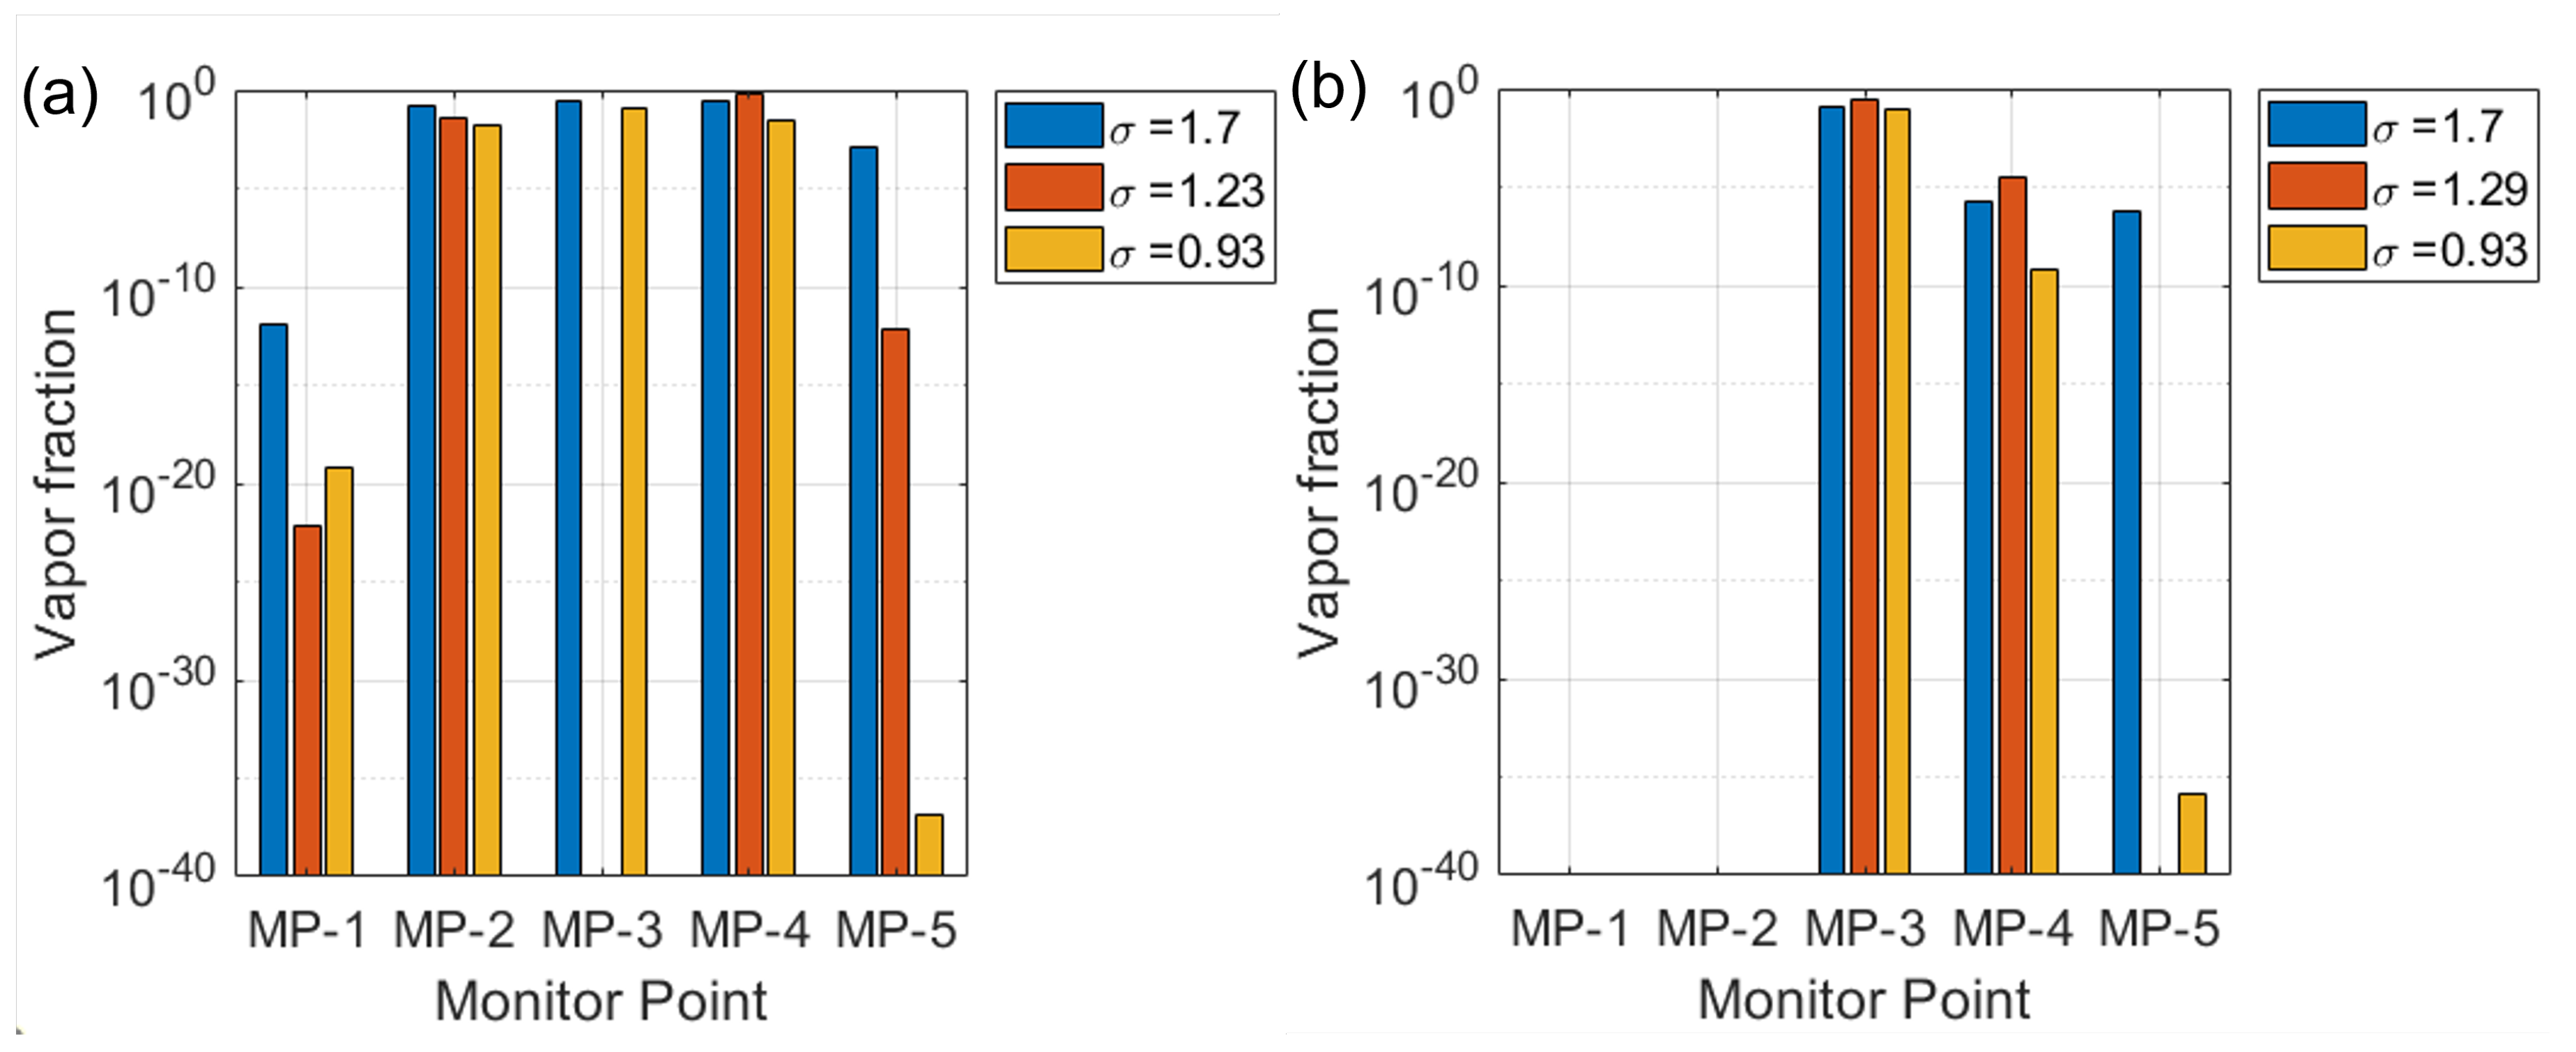
Figure 11.
Frequency spectrum of velocity fluctuations at monitor points for plain and modified NACA0018 hydrofoils at different cavitation numbers: (a) (b) , (c) , modified NACA0018 with a cavity (c) , (d) .
Figure 11.
Frequency spectrum of velocity fluctuations at monitor points for plain and modified NACA0018 hydrofoils at different cavitation numbers: (a) (b) , (c) , modified NACA0018 with a cavity (c) , (d) .
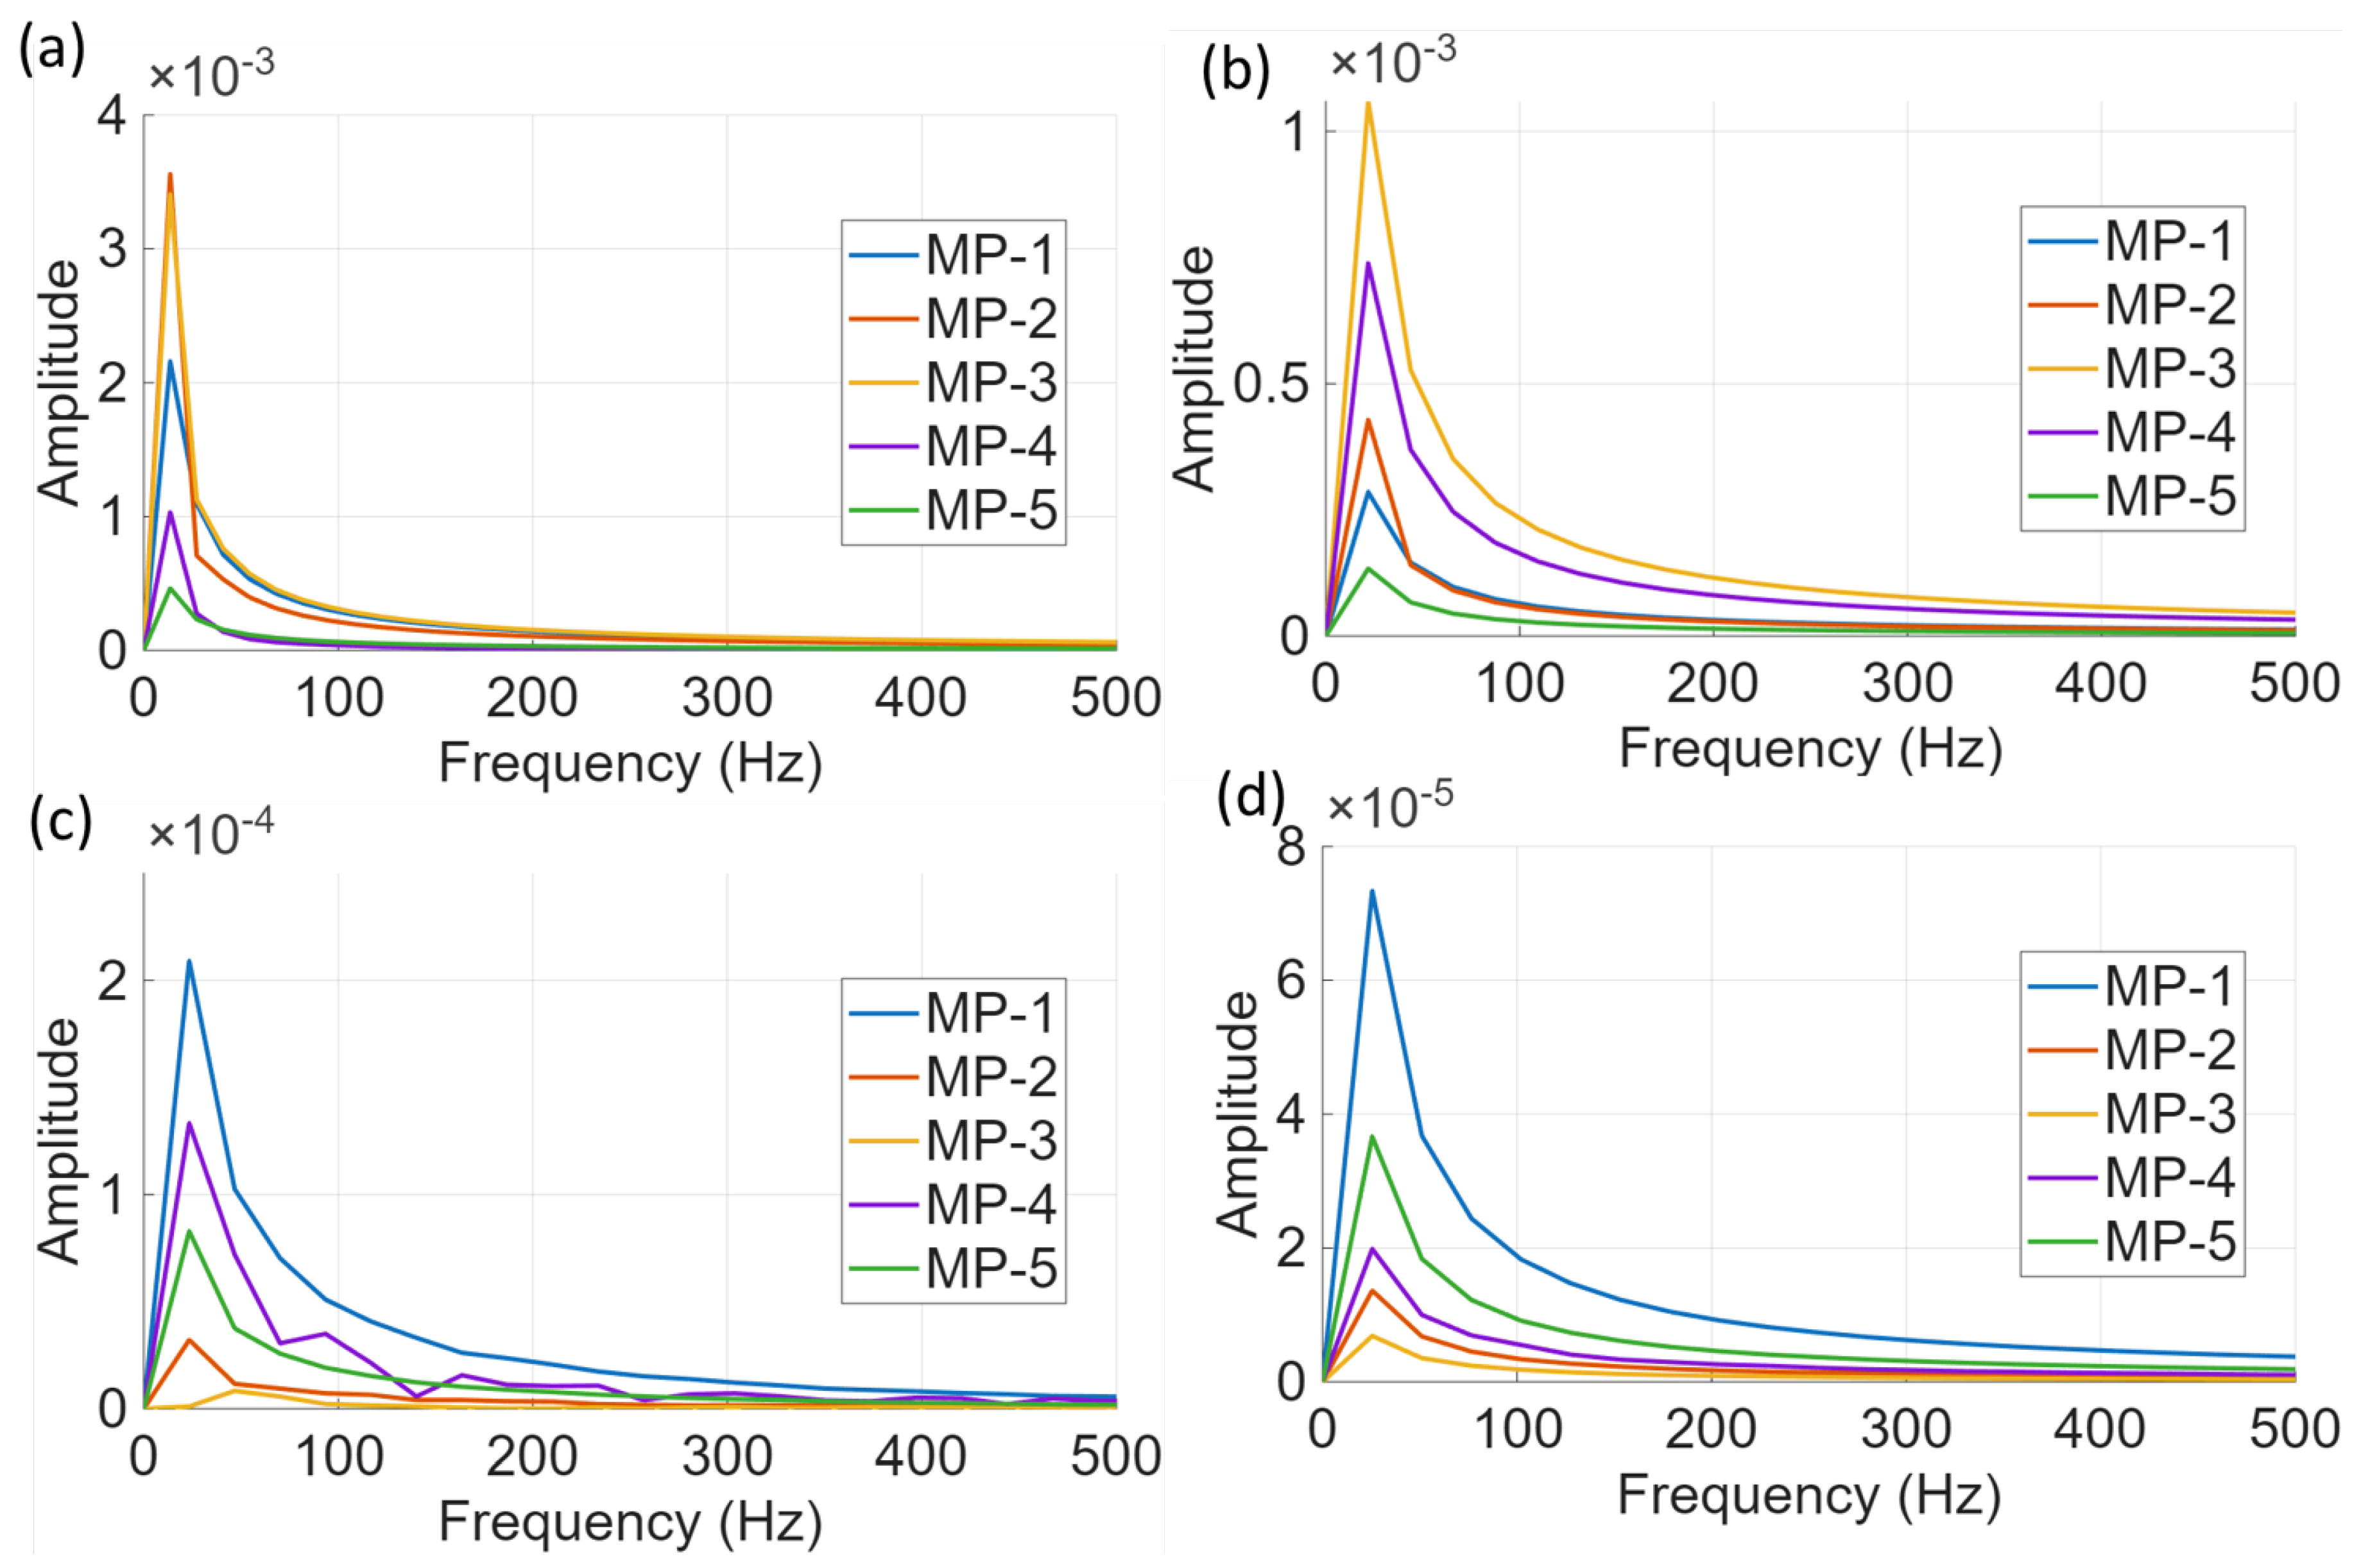
Figure 12.
Mel-frequency spectrograms (a) normal scale (b) log scale of vapour fraction at monitor point (point-3) for plain hydrofoil whereas (c) and (d) shows normal scale, log scale respectively for cavity-modified NACA0018 hydrofoils at = 1.7.
Figure 12.
Mel-frequency spectrograms (a) normal scale (b) log scale of vapour fraction at monitor point (point-3) for plain hydrofoil whereas (c) and (d) shows normal scale, log scale respectively for cavity-modified NACA0018 hydrofoils at = 1.7.
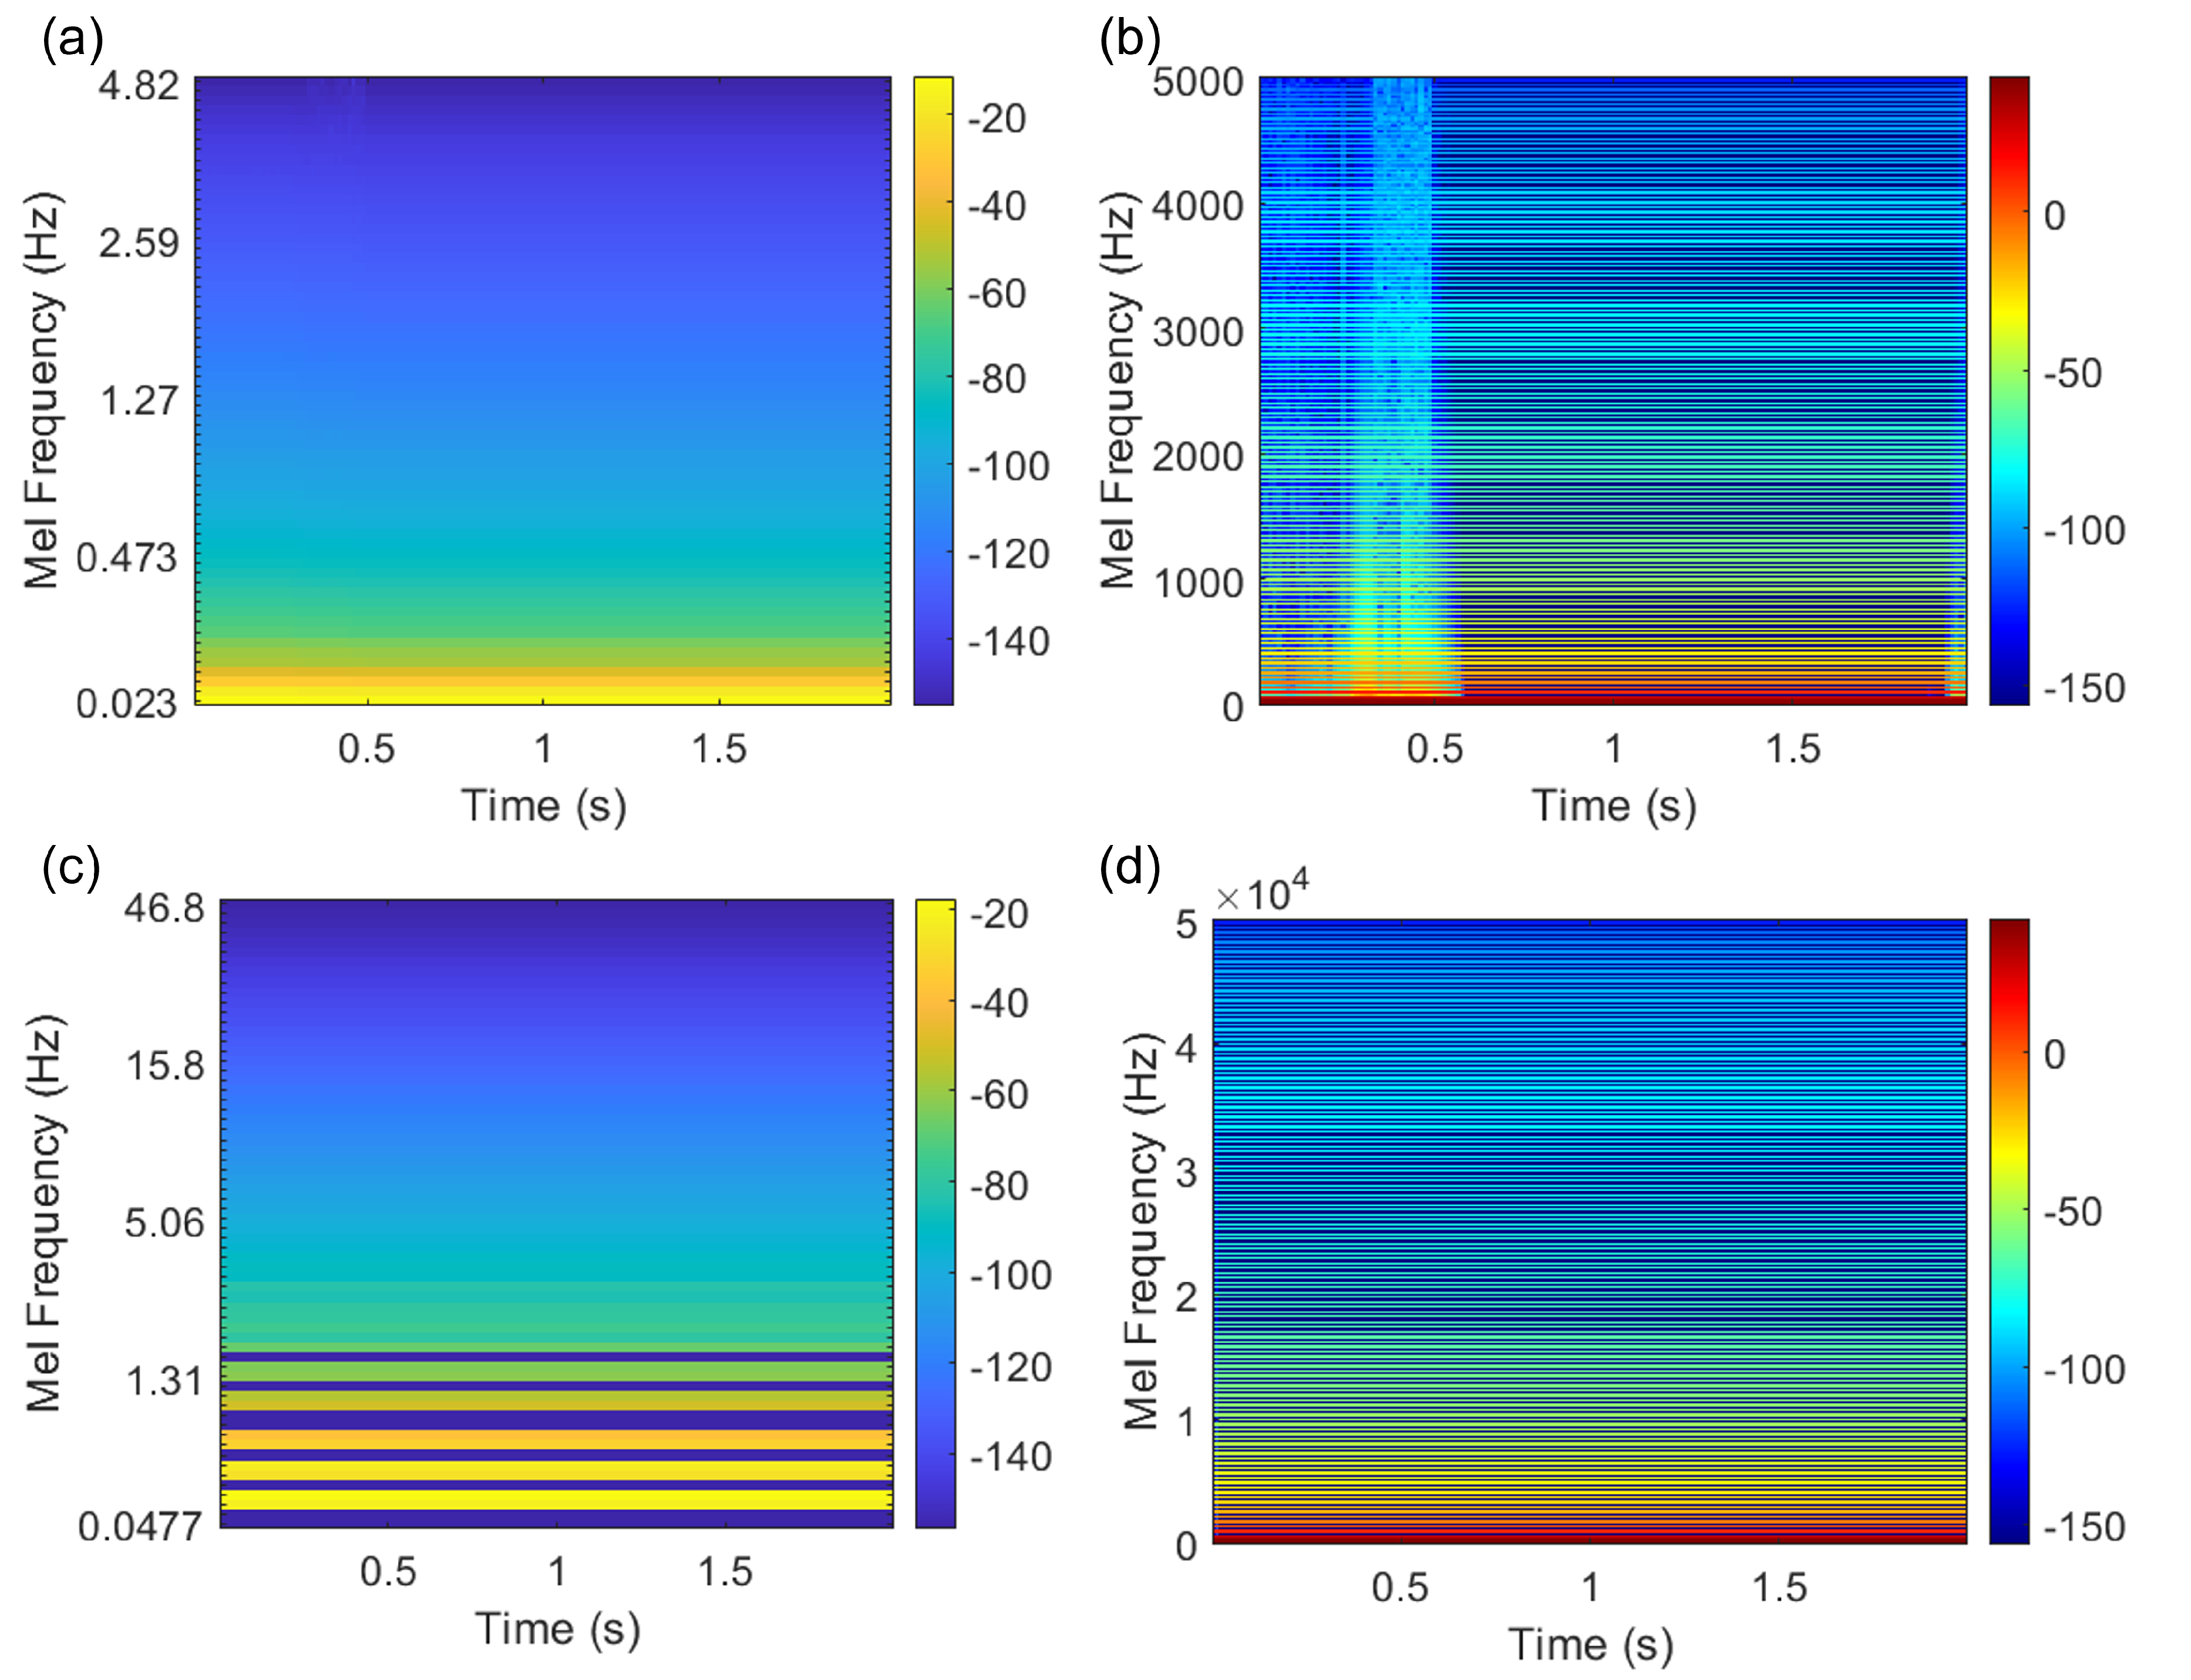

Table 1.
Grid independence.
| Number of nodes | ||
|---|---|---|
| Coarse Mesh | 0.091 | 0.94 |
| Medium Mesh | 0.086 | 0.88 |
| Fine mesh | 0.083 | 0.79 |
| List | ||
|---|---|---|
| Reference | 0.077 | 0.82 |
| Present work | 0.083 | 0.795 |
Table 3.
summary of lift to drag ratio and cavity length for plain hydrofoil.
| Cavitation number | for plain | Cavity length for plain |
|---|---|---|
| 1.7 | 8.9 | 0.13 |
| 1.23 | 9.1 | 0.05 |
| 0.93 | 9.6 | 0.03 |
Table 4.
summary of lift to drag ratio and cavity length for modified hydrofoil.
| Cavitation number | for modified | Cavity length for modified |
|---|---|---|
| 1.7 | 9.6 | 0.16 |
| 1.23 | 9.8 | 0.1 |
| 0.93 | 9.9 | 0.04 |
Disclaimer/Publisher’s Note: The statements, opinions and data contained in all publications are solely those of the individual author(s) and contributor(s) and not of MDPI and/or the editor(s). MDPI and/or the editor(s) disclaim responsibility for any injury to people or property resulting from any ideas, methods, instructions or products referred to in the content. |
© 2025 by the authors. Licensee MDPI, Basel, Switzerland. This article is an open access article distributed under the terms and conditions of the Creative Commons Attribution (CC BY) license (http://creativecommons.org/licenses/by/4.0/).
Copyright: This open access article is published under a Creative Commons CC BY 4.0 license, which permit the free download, distribution, and reuse, provided that the author and preprint are cited in any reuse.


