
Submitted:
22 September 2025
Posted:
23 September 2025
Read the latest preprint version here
Abstract
Produced well flow is controlled through the valves placed in the Christmas tree. Often being a gate-type valve, they are responsible for isolating the well from the surface on purpose with a surface command and automatically in an emergency. The reliability of the valves is particularly essential for subsea wells, as maintenance and replacement involve significant cost, time, and HSE risks to the project. Their designs are intended to withstand harsh conditions for long periods, including high temperatures, pressure, flowing solid particles, and corrosive environments. However, it is not rare to experience failing subsea valves due to leakage, cold welding, erosion of sealing elements, and other mechanical problems. These issues were the primary driver of the initial stage of the research where it was experimentally concluded that replacing the current tungsten carbide (WC)-based coating with polycrystalline diamond compact (PDC) material results in friction and wear reduction as expected theoretically due to its low friction, high hardness and high thermal stability properties.
Following the promising results, developing a prototype is the next phase, which needs to pass the required tests by American Petroleum Institute (API) standards, the slurry test being the most challenging. Therefore, in this research, a 3D model is created and simulated with relevant conditions (sand slurry) to investigate the erosion and wear rate on the sealing element and internal walls of a subsea gate valve. Ansys Fluent is used along with the Oka erosion model and a Discrete Phase Model (DPM) to simulate the interaction of sand particles with valve surfaces under realistic flow conditions. The findings contribute to the decision-making period by providing the expected flow characteristics and erosion-prone areas, and quantitative erosion estimates before manufacturing the prototype.
To quantify the optimization due to the change of internal coating material, a comparative analysis is used on the case study that includes a 5-inch subsea gate valve exposing to upstream flow with 2% sand slurry (250-400 μm particle size). A finite element method is used to solve the simulation for WC and PDC materials separately. The results show that in the same conditions, having PDC material as a contact layer leads to a 77.6% reduction in erosion depth and, thereby, 4.5 times the extended lifetime of the subsea valve. This study is among the first to simulate erosion behavior of PDC-coated subsea valves under API slurry test conditions, contributing to both technology readiness advancement and literature on erosion-resistant valve coatings.
Keywords:
gate valve
; PDC
; petoleum
; production
; subsea
1. Introduction
1.1. Background
According to International Energy Agency (IEA) (2024), global energy demand is projected to grow at an annual rate of 0.7% from 2023 to 2030. Currently, around 80% of this demand is satisfied by fossil fuels, and this trend is expected to peak around 2030, despite the advancements in the renewable energy sector. To meet the rising demand, fossil fuel exploration, and production are moving towards deep- and ultra-deep-water locations, high-pressure, high-temperature (HPHT) wells, and marginal fields (Bai and Bai, 2018; Williams et al., 2016). This move brings new challenges for the entire operation, including the need for field-proven valve designs. Using subsea valves in their current form in non-traditional fields may lead to various problems such as galling, cold welding, and seal failures (Ragazzoni et al., 2012; Bruschi et al., 2016). Flowing solid particles, such as produced sand, boost the failure process. The coating layer on the seal area is exposed to solid particles with abrasive shapes and high kinetic energy. Additionally, sand particles are trapped between the valve gate and seats, which results in faster degradation of the subsea valve (Ri et al., 2020a).
1.2. Industrial Challenge
Despite their smaller size comparing other elements of subsea production systems, the valves, when they fail, result in production halts, leading to significant maintenance expenses and lost profits (Wang et al., 2020). This can be considered as one of the primary challenges with valves. Generally, subsea valves are designed with a lifetime of 20 to 25 years (Sotoodeh, 2021). However, maintenance or replacement may be necessary in practice, depending on the operating conditions. Service times are predictable in traditional fields due to available data; however, there is a lack of data in non-traditional fields (Praveen et al., 2018).
An all-electric control system is considered for future production fields, where the valve actuator is all-electric, using an electric motor and gears to operate the valve (Wang et al., 2024). By replacing the hydraulic actuator with the electric one, the operator can have benefits such as real-time monitoring, improved safety, precise and faster control, and removal of hydraulic lines (Ahmadli et al., 2024b). However, it must be noted that electric actuators tend to have longer actuating duration, which increases the exposure of valve internals to flowing fluids and solid particles. As a result, a higher erosion rate decreases the lifetime of the subsea valve, and the predictability of valve maintenance or replacement remains a concern.
1.3. Research Question
The previous sections cover the challenges related to subsea valve operations. To address these challenges, we proposed using PDC material instead of the currently used WC material as a coating material. The proposal is based on the expectation that PDC material lowers the frictional force and offers high durability and wear resistance at the same time. Therefore, simulations and laboratory experiments were carried out to show that PDC material offers reduced actuation power and increased wear resistance (Ahmadli et al., 2025, 2023). A prototype will be manufactured to increase the TRL and undergo various tests. The most challenging test among them is a slurry sand test, where the valve is subjected to sand slurry and must operate under the maximum allowable leakage limit. Before making the prototype, it is economically beneficial to investigate how PDC material is expected to behave regarding erosion rate in the slurry test conditions. One of the methods is getting data from the open literature; however, as given in Section 1.4, there is a gap in the literature addressing our specific needs regarding subsea gate valves. Therefore, it is decided to employ a simulation software – in our case, Ansys Fluent, to answer the following questions: What is the expected erosion rate and distribution of PDC coating in the subsea valve during the slurry test, and how does this affect the expected lifetime of the subsea gate valve? For comparison and benchmarking purposes, a WC-coated subsea valve is also simulated.
1.4. Related Work
There has been various research on developing models to relate the contact material and flow conditions to erosion. One of the earliest is Finnie’s model, which performs well with ductile materials but has deviations with brittle materials and complex geometries (Finnie, 1960). Meanwhile, McLaury extended Finnie’s model by incorporating fluid properties, which made it more suitable for pipeline applications (McLaury et al., 1996). However, in both models, particle impact angles are not addressed properly (Ri et al., 2020b). To address this limitation, Oka carried out extensive experiments and developed a model that is applicable to both ductile and brittle materials (Oka and Yoshida, 2005). However, for more complex geometries and flow conditions, empirical formulas remain insufficient and less accurate compared to integrated computational fluid dynamics (CFD) analysis models.
In the literature, there is an uncountable number of research studies that adopted CFD in their investigation. Regarding the gate valves, Jong Hyok Ri modeled gate valve erosion under lubricated and non-lubricated conditions, revealing that lubrication significantly reduces erosion rates, particularly in small flow areas (Ri et al., 2020b). Subsea gate valves operate without any installed lubrication mechanism, instead rely on the produced oil fluid. For the gas producing well, the valve contact is dry. However, the methods that are used bear their significance for our study. In another study, Ri proposed an analytical model to evaluate wear and structural stability during valve actuation, emphasizing the critical role of internal coatings (Ri et al., 2022). Similarly, Messa validated CFD results with experiments to estimate valve lifespan and introduced a formula for integral erosion ratio based on flow velocity and valve opening (Messa et al., 2017). There are many other studies on related topics, but they typically cover specific cases. We investigate the PDC material in the subsea gate valves and benchmark the results with WC material, which is missing in the current literature.
2. Methodology
2.1. Flow Model
The flow model of the simulation is based on the Reynolds-Averaged Navier-Stokes (RANS) equations. The RANS model consumes low computing power while being able to capture the turbulence effects through a turbulence model covered in Section 2.2 (Frank et al., 2010). Comparatively, Unsteady Reynolds-Averaged Navier-Stokes equations offer benefits such as moving parts, oscillating flows, and varying loads, however, to optimize the running time and power, the RANS equations are preferred. Equations (1)-(4) describe the basis of steady-state turbulent flow - the conversation of mass and momentum, respectively. The equations are derived from the general equation for the simulation by assuming incompressible fluid, single-phase flow, and negligible gravity effect.
Conservation of Mass Equation:
Momentum Equations:
2.2. Turbulence Modeling
The flow turbulence is created by using k-omega Shear Stress Transport (SST) model. The SST model combines the advantages of k-omega and k-epsilon models, such as resolving near-wall flows and free-stream turbulence, respectively. Therefore, during simulation, key flow characteristics such as boundary layer separation, high-strain turbulence effects, and adverse pressure gradients can be predicted accurately, which contributes to the investigation of erosion in subsea valves. The SST model is based on two transport equations, the turbulence kinetic energy and the specific dissipation rate . For steady-state conditions, as in our simulation, the equations are given as follows (Menter, 1994):
Turbulence Kinetic Energy Equation:
Specific Dissipation Rate (ω) Equation:
For the near-wall, the SST model uses Low-Reynolds corrections, and in simulation, a correlation-based wall treatment is enabled, which optimizes the computing efficiency without sacrificing accuracy near the wall surface (Menter et al., 2003). High energy regions increase the chaotic movement of the particles, which subsequently affects the erosion severity. Therefore, the distribution of turbulent kinetic energy (TKE) is one of the outputs of the simulation, which helps to identify the critical erosion-prone areas. To avoid over-prediction of the TKE in high-strain areas, the production limiter option is activated (Menter, 2009).
2.3. Simulation Input
Subsea gate valve model and parameters.Figure 1 illustrates the model of a 5-inch subsea gate valve, which consists of two main parts: the valve itself and the hydraulic actuator. In an open position, the connection is established between the inlet and the outlet through the gate port. The pressure drop is minimal due to the straight flow path. With the closing command, the actuator pulls the gate via the stem, and the differential pressure across the valve creates a sealing force between the gate and the seats. Considering the significantly high loads and abrasive environment, the valve internals particularly the contact surfaces of the gate and seats, are coated with hard material. The substrate material is super duplex stainless steel. Regarding the isolation from the external environment, the valve body and bonnet are bolted tight. With the packing retainer around the operating stem, the high-pressure fluid is inside the valve part.
Regarding the actuator part, the axial force required to move the gate is achieved through the piston-cylinder coupling. Hydraulic fluid from topside HPU enters the cylinder through the fluid inlet, generating force on the piston. A return spring, located between the piston retainer tube and the actuator body’s bonnet end, is compressed as the hydraulic fluid drives the piston to open the valve. The valve is kept open with the consistency of hydraulic pressure. In emergencies such as power failures, the return spring activates, moving the stem into a fail-safe position and closing the valve.
Table 1 gives details about the size, dimensions, and materials of the model used in the simulation.
Slurry test and flow parameters. API 6A standard categorizes the subsea valves into two classes based on the performance requirement (American Petroleum Institute, 2021). The valves in class I are not intended to be used in the wells that expect high sand production, as opposed to class II valves. Therefore, the test conditions to validate the subsea valves vary depending on their class, which is a higher requirement for class II. In the research, the PDC-coated valve is intended for use in upper limit conditions; therefore, the valve is assumed class II. Considering that, the steps for slurry test can be described and adjusted to apply to the simulation.
The slurry test consists of two steps. In the first step, the valve is kept fully open while sand slurry with a minimum flow of circulates across the valve. The primary continuous phase of the flow is freshwater, and sand content is adjusted to , and the viscosity to , as per ISO 10414-1 standard. The size of sand particles ranges between US mesh . After pumping the flow for 25 hours through the fully open subsea valve, the sand content and flow viscosity are measured and adjusted to the initial values again. Following that, the flow is circulated for another 25 hours. After the first step, the valve is checked for leakage using fresh water and nitrogen. The second step of the slurry test uses the same properties of sand slurry in terms of sand content and viscosity. The only difference is that the valve is cycled from fully open to a closed position at a minimum of . When the valve is closed, the pump must create differential pressure between valve ports. The process continues until valve cycles are reached. After this, the valve is checked for leakage in a similar way as in the first step.
For the simulation, the flow control steps can be dismissed since the software offers precise control over the parameters. This also applies to the value deviations for the values. Regarding the simulation, the objective for the first step is to estimate the erosion of the subsea valve in a fully open position after 50 hours. Doing so with the short interval of reporting time would need significant power and time. Thereby, it is decided to simulate the valve for one hour and extrapolate the results for 50 hours. The same approach is applied to the second step, and the subsea valve is exposed to the sand slurry in 6 different static positions to simulate the rate of to reach 500 cycles. Regarding the flow parameters, based on the 5-inch valve cross-section , the inlet velocity is determined to be , and assuming the solid particles as silica sand the particle mass flow rate is found to be . Table 2 summarizes the details mentioned above.
2.4. Mass Loss Calculations
In the simulation model the flow is assumed to be single-phase. Solid particles are introduced to the flow using Discrete Phase Model (DPM) which is based on the particle impact approach. Using the DPM instead of multi-phase model results in computing power efficiency. Regarding the erosion modelling, the Oka model is integrated to evaluate the material wear under particle impacts. Equation (7) describes the Oka erosion model (Adedeji et al., 2019; ANSYS, Inc., 2019).
During the first step of the slurry test, the valve is kept fully open for flowing fluid and the mass loss due to erosion during this process is determined as in Equation (8).
During the second step of the slurry test, the model is simulated for the dynamic valve cycles. For each position, the area-weighted erosion rates are computed using the model. Assuming the constant gate speed before/after crack-open case, for one cycle erosion is determined through Equation (9).
The mass loss during the second step of the slurry test is simply calculated by multiplying the number of cycles as described in Equation (10).
3. Results and Discussion
3.1. Velocity Distribution
Figure 2 shows the velocity contours illustrating the flow distribution through the subsea gate valve at different openings. Comparing different valve positions confirms the expected decrease in flow velocity as the valve opens. Additionally, one can observe the high-velocity regions, recirculating zones, and flow impingement, which are contributing factors to erosion severity and location (Li et al., 2024; Liu et al., 2024).
Starting with the narrower opening position, the flow reaches its maximum velocity of where it is highly restricted, resulting in a jetting effect, shown in Figure 2a. Due to internal wall resistivity and flow friction, the velocity drops through the internal wall. As the opening of the valve increases to , the velocity gradients begin to spread over a larger area, leading to a reduced flow velocity. Near the outlet valve seat, localized high-velocity can be observed as shown in Figure 2b.
Figure 2c shows the half-opening case, where the flow is more evenly distributed, reducing the intensity of velocity gradients. The peak velocity observed near the outlet seat amounts to . In a opening, the flow exhibits a near-linear path with minimal jetting or recirculation zones. The average velocity remains moderate across the outlet port while the peak velocity value reaches (Figure 2d).
At a nearly fully open position , as illustrated in Figure 2e, the flow is minimally restricted, which results in a uniform velocity profile across the valve. The velocity magnitude is the lowest ≈0.49 m/s among all cases.
3.2. Turbulence Analysis
The change in the distribution of TKE during valve operation is shown in Figure 3. Comparing the TKE contours with the velocity figures, it is evident that narrow openings increase the molecular viscosity of the flow, and therefore, high TKE values are not observed where the flow velocity is maximum. Instead, intense TKE concentrated in the downstream side of the gate. Additionally, one can notice that the TKE values decline faster due to wall resistance (Ni et al., 2022). The rest of the flow area remains comparably stagnant with minimal turbulence generation (Figure 3a).
Increasing the valve opening to lowers the peak TKE significantly . However, a moderately sized zone of elevated turbulence still appears downstream as the jet expands and interacts more broadly with the slower surrounding fluid (Figure 3b).
For the half-open case, the maximum value of TKE reduces further to due to the larger flow area and less severe velocity changes. However, a noticeable region of elevated turbulence remains downstream of the gate, where the accelerated fluid meets slower pockets (Figure 3c).
At a opening, turbulence spreads further downstream and becomes milder overall. However, the lower port of the gate acts as a restriction, and thereby, creates a small turbulence zone with a peak TKE of (Figure 3d).
When the valve is nearly fully open at , the TKE across the valve is minimal. Only small patches of slightly higher turbulence are observed at the upper port of the gate and along the inner downstream wall (Figure 3e).
3.3. Erosion Rate Distribution
Regarding the erosion of the coating material in the valve, Figure 4 highlights the erosion rate at the different openings during valve operation. The most severe and localized erosion happens at opening, where the high-velocity jet causes intense particle impacts on the valve seats. Due to the intense turbulence on the downstream side, the outlet gate seats are eroded at a similar rate. Figure 4a shows the maximum erosion rate equal to . As the valve opens to , the erosion begins to spread slightly along the valve seat and nearby areas due to the increased flow passage, although the peak rate drops significantly to as shown in Figure 4b. In the half-open case, the erosion distribution becomes broader with the impact region spread inside the gate port and gate seats. Figure 4c highlights the maximum erosion happening at the seat with the rate of 0.75. The erosion intensity decreases compared to smaller openings as the particle velocities are reduced. With a opening, the erosion rate peak decreases further to (Figure 4d). At , the valve experiences the most uniform and minimal erosion distribution, as the nearly unrestricted flow reduces velocity gradients and diminishes particle impacts on the surfaces. As a result, a maximum erosion rate is recorded in Figure 4e. The results show a clear trend of erosion transitioning from highly localized and severe at smaller openings to more distributed and less intense at larger openings. The same procedure is repeated for the PDC-coated valve, and the results of maximum erosion rates during valve operation are summarized in Table 3 for both cases. The results indicate that replacing WC coating material with PDC material leads to an erosion rate reduction of and at the minimum and maximum opening cases, respectively.
3.4. Cumulative Erosion and Mass Loss
Section 3.3 determines the erosion rates at six static positions for the subsea gate valve. Figure 5 plots the results versus valve opening with interpolation and compares the WC and PDC coating valves. As can be seen, the erosion rate significantly increases as the valve near “crack-open” and “crack-close” moments.
Following the steps covered in Section 2.4, the results from the simulation are used in Equation (8). The right side of the equation is solved using Simpson’s rule as giving cumulative erosion values for both materials (Table 4):
By having the cumulative erosion values, the mass loss during each step of the slurry test is determined as in Equations (9) and (10), and the results are summarized in Table 5.
3.5. Expected Lifetime of a Subsea Valve
In the same conditions, the results show that we can expect and mass loss of WC material after the first and second steps of the slurry test, which makes the total mass loss . For the PDC material, the numbers are significantly less, equal to and after each step of the slurry test. The PDC coating lost of its mass during the whole test. However, due to density differences, mass loss is not the best way of comparing the performance of both materials. The eroded depth is determined through Equation (11).
Thereby, during the slurry test, of the WC coating and of the PDC coating material were lost. This means that at the end of the slurry test, the PDC material indicates a 5.6 times less eroded depth than the WC material. Applying the results in practice, the subsea valves are designed to withstand for 25 years. Assuming equal valve cycles annually during 25 years, yearly loss depth is determined as per Equation (12), where the results are for WC and for PDC material.
API 6A standard recommends a minimum coating thickness of for subsea valves (American Petroleum Institute, 2021). Considering the same exposed conditions, the minimum thickness will be fully eroded in around 3 years for WC coating and around 13.5 years for PDC coating.
From a practical point of view, the conditions that the valve is expected to withstand during its lifetime are significantly milder than the ones we are exposed to during the slurry test. However, the results may be a new reality for future applications in fields with high requirements. Comparing the two materials, it is evident that PDC material outperformed WC coating material by slowing the erosion rate of coating thickness by approximately . As a result, the subsea valve with PDC coating offers 4.5 times more lifetime than WC material with the same coating thickness.
The overall results reconfirm our expectations about the performance of the PDC material in subsea valves and help us visualize how the erosion rate changes depending on the gate position, flow velocity, and turbulent kinetic energy. Additionally, the simulation shows us the areas where intense erosion is happening and the corresponding eroded depth, which is used in determining the expected lifetime of the subsea valve.
3.6. Limitations
- The erosion predictions for 50 hours were extrapolated from a one-hour simulation. The extrapolation assumes a near-linear wear progression, which may not fully reflect nonlinear erosion behavior over time. Extending simulation time was limited by computational cost. However, key transient effects were captured using fine time steps and high-resolution meshes.
- The Oka erosion model was selected due to its established performance across ductile and brittle materials, including its consideration of impact angles. However, like all empirical models, it has limitations under complex geometries and variable flow conditions.
- The simulation uses the DPM with particle sizes ranging between 250–400 μm. Although a size range is considered, broader variations in subsea environments are not fully represented.
- Full dynamic simulation of 500 valve cycles was not feasible. Instead, six representative static positions were selected, including critical stages such as crack-open and crack-close. Interpolation (Simpson’s rule) was applied to estimate cumulative erosion. While this introduces approximation, the method is conservative and consistent with practices in valve erosion studies.
- The current study is part of a pre-prototype design phase. While experimental validation is not included in this study, a physical test is planned further.
- The simulations are based on API 6A Class II slurry test conditions. Broader operating conditions such as different flow rates, particle distributions, and slurry compositions, are not addressed in this work.
4. Conclusions
- This study presents a quantitative comparison of WC and PDC coatings under API slurry test conditions, which enables prediction of erosion behavior and valve lifetime in realistic subsea environments.
- Severe erosion occurs at narrow valve openings . At these openings, the flow velocity reaches up to 7.8 m/s and the turbulence kinetic energy peaks at , resulting in highly localized erosion, especially on the valve seats.
- Jetting effects at partial openings cause aggressive surface wear. Measured erosion rates are for tungsten carbide (WC) coatings and for polycrystalline diamond compact (PDC) coatings.
- At near-full opening , flow velocity drops to and turbulence kinetic energy decreases to , resulting in a significantly lower erosion risk.
- PDC coatings demonstrate superior erosion resistance. Simulation-based extrapolation shows that only of the PDC layer is removed after extended slurry exposure - 5.6 times less than the erosion observed in WC coated surfaces.
- Applying erosion trends to coating thickness standards (based on American Petroleum Institute guidelines), PDC coatings reduce the total erosion depth by and increase the valve’s expected lifetime by a factor of 4.5.
- The findings elevate the technology readiness level (TRL) of PDC-coated subsea valves, supporting their application in offshore field developments with improved operational reliability.
- Improved erosion resistance and extended service life of PDC-coated valves contribute to reduced offshore project costs, lower intervention frequency, and decreased health, safety, and environmental (HSE) risks.
Acknowledgments
This research study is carried out as a part of the project (Project No: 979254111) in SUBPRO, a research-based innovation center for subsea production and processing, that is financed by the Research Council of Norway, major industry partners, and the Norwegian University of Science and Technology (NTNU).
Conflicts of Interest
On behalf of all the co-authors, the corresponding author states that there is no conflict of interest.
Nomenclature
| Area of valve seat | |
| Area fractions in x, y, z directions | |
| Material constant | |
| Particle diameter | |
| Blending function | |
| Depth of erosion | |
| Depth of erosion per year | |
| Turbulent kinetic energy | |
| Particle size exponent | |
| Number of valve cycles | |
| Pressure | |
| Velocity in x, y, z directions | |
| Particle velocity | |
| Turbulent kinetic viscosity | |
| Erosion rate | |
| Mass loss due to erosion | |
| Model constant | |
| Model constant | |
| Impact angle function | |
| Dynamic viscosity | |
| Turbulent viscosity | |
| Fluid density | |
| Material density | |
| Model constants | |
| Specific dissipation rate |
Acronyms
| Area of valve seat | |
| Area fractions in x, y, z directions | |
| Material constant | |
| Particle diameter | |
| Blending function | |
| Depth of erosion | |
| Depth of erosion per year | |
| Turbulent kinetic energy | |
| Particle size exponent | |
| Number of valve cycles |
References
- Adedeji OE, Yu W, Sanders RS (2019) Analysis of local wear variables for high-precision erosion modelling in complex geometries. Wear 426-427:562–569. URL https://www.sciencedirect.com/science/article/pii/S0043164818316788, 22nd International Conference on Wear of Materials. [CrossRef]
- Ahmadli M, Gjersvik TB, Sangesland S (2023) Design assessment and optimization of a barrier valve for subsea applications. International Conference on Offshore Mechanics and Arctic Engineering, Volume 3: Materials Technology; Pipelines, Risers, and Subsea Systems 3:V003T04A053. proceedings paper. [CrossRef]
- Ahmadli M, Gjersvik TB, Sangesland S, Reynes C (2024a) Analysis of all-electric subsea gate valve designs and system overview. SPE Norway Subsurface Conference p D011S008R004. conference proceedings. [CrossRef]
- Ahmadli M, Gjersvik TBS, Sangesland S, Reynes C (2024b) Enhancing subsea ball valve performance: A material and design approach. International Conference on Offshore Mechanics and Arctic Engineering, Volume 8: Offshore Geotechnics; Petroleum Technology 8:V008T11A044. URL https://doi.org/10.1115/OMAE2024-124575, proceedings paper. [CrossRef]
- Ahmadli M, Gjersvik TB, Sangesland S, Ratnayake RC (2025) Analysis of friction and wear behavior of polycrystalline diamond compact (pdc) for application in subsea valves. Journal of Offshore Mechanics and Arctic Engineering pp 1–19. URL https://doi.org/10.1115/1.4067968. [CrossRef]
- American Petroleum Institute (2021) Specification for Wellhead and Christmas Tree Equipment (API 6A), 21st edn. American Petroleum Institute, Washington, D.C., URL https://www.api.org/products-andservices/standards/important-standards/api-spec-6a.
- ANSYS, Inc (2019) 2019 R3, Help System, Theory Guide. Canonsburg, PA, USA, accessed from ANSYS Help System.
- Bai Y, Bai Q (2018) Subsea Engineering Handbook. Elsevier, Amsterdam, Netherlands.
- Bruschi R, Marchionni L, Mancini A, Vitali L, Pazzaglia J (2016) Controlling fatigue damage in deep-water installation. In: International Ocean and Polar Engineering Conference, pp ISOPE–I–16–493, https://onepetro.org/ISOPEIOPEC/proceedings-pdf/ISOPE16/All-ISOPE16/ISOPE-I-16-493/1337506/isope-i-16-493.pdf.
- Finnie I (1960) Erosion of surfaces by solid particles. Wear 3(2):87–103. [CrossRef]
- Frank T, Lifante C, Prasser HM, Menter F (2010) Simulation of turbulent and thermal mixing in t-junctions using urans and scale-resolving turbulence models in ansys cfx. Nuclear Engineering and Design 240(9):2313–2328. experiments and CFD Code Applications to Nuclear Reactor Safety (XCFD4NRS). [CrossRef]
- International Energy Agency (IEA) (2024) World energy outlook 2024. URL https://www.iea.org/reports/world-energy-outlook-2024.
- Li G, Liu G,Wang H, Liu Y, Cai B, Fang X, Li G (2024) Throttle valve erosion in the oil and gas industry. Journal of Materials Science pp 1–26.
- Liu H, Yang S, Wang L, Li Y, Mi L, Yuan F, Ye C (2024) Numerical analysis of the sediment erosion of the balance valve in a buoyancy regulation system. Journal of Marine Science and Engineering 12(8). URL https://www.mdpi.com/2077-1312/12/8/1344. [CrossRef]
- McLaury BS, Shirazi SA, Shadley JR, Rybicki EF (1996) Modeling erosion in chokes. ASME-Publications-Fed 236:773–782.
- Menter F (2009) Review of the shear-stress transport turbulence model experience from an industrial perspective. International Journal of Computational Fluid Dynamics - INT J COMPUT FLUID DYNAMICS 23:305–316. [CrossRef]
- Menter F, Kuntz M, Langtry R (2003) Ten years of industrial experience with the sst turbulence model. Heat and Mass Transfer 4.
- Menter FR (1994) Two-equation eddy-viscosity turbulence models for engineering applications. AIAA Journal 32(8):1598–1605, URL https://doi.org/10.2514/3.12149. [CrossRef]
- Messa GV, Negri M, Wang Y, Malavasi S, et al. (2017) Estimation of the useful life of a gate valve subjected to impact erosion. In: Proceedings of the XXIII Conference of the Italian Association of Theoretical and Applied Mechanics, Gechi Edizioni, pp 147–163.
- Ni Y, Tan Y, Tan D (2022) Ehtt2022: Multi-physical modeling and adjusting for ultrasonic assisted soft abrasive flow processing. [CrossRef]
- Oka Y, Yoshida T (2005) Practical estimation of erosion damage caused by solid particle impact: Part 2: Mechanical properties of materials directly associated with erosion damage. Wear 259(1-6):102–109.
- Praveen J, Pathan M, Ansari K (2018) Hyperbaric pressure testing of a subsea valve to validate deep water condition. International Journal of Mechanical and Production Engineering Research and Development 8:1011–1022. [CrossRef]
- Ragazzoni S, Campanelli G, Pozzati R, Ambrosini I, Gjedrem T (2012) Very large size valves and actuators - design and testing. In: Proceedings of the Twenty-second International Offshore and Polar Engineering Conference, ISOPE, DOI ISOPE-I-12-242, URL https://onepetro.org/ISOPEIOPEC/proceedings-abstract/ISOPE12/All-ISOPE12/12622.
- Ri J, Ripeanu RG, Dinita A (2020a) Erosion modeling in parallel gate valve. FME Transactions 48:808–815. [CrossRef]
- Ri JH, Ripeanu RG, Dinita A (2020b) Erosion modeling in parallel gate valve. Fme Transactions 48(4).
- Ri JH, Ripeanu RG, Dinita A (2022) Erosion modeling of coated gate valves. Tribology in Industry 44(1):113.
- Sotoodeh K (2021) Simulation of underwater conditions for subsea valves—a review of hyperbaric tests and validation. International Journal of Pressure Vessels and Piping 191:104353. [CrossRef]
- Wang C, Liu Y, Hou W, Wang G, Zheng Y (2020) Reliability and availability modeling of subsea xmas tree system using dynamic bayesian network with different maintenance methods. Journal of Loss Prevention in the Process Industries 64:104066. [CrossRef]
- Wang H, Liu G, Zhou L, Jia P, Feihong Y (2024) Design and test of the electrical system of the all-electric subsea gate valve actuator. Actuators 13:263. [CrossRef]
- Williams T, Pappas J, Perry K (2016) Ultra-deepwater and unconventional natural gas and other petroleum resources program administration.Tech. rep., Research Partnership to Secure Energy for America, Houston, TX (United States), URL https://www.osti.gov/biblio/1344893. [CrossRef]
Figure 1.
Schematic view of a subsea gate valve (Ahmadli et al. (2024a)).
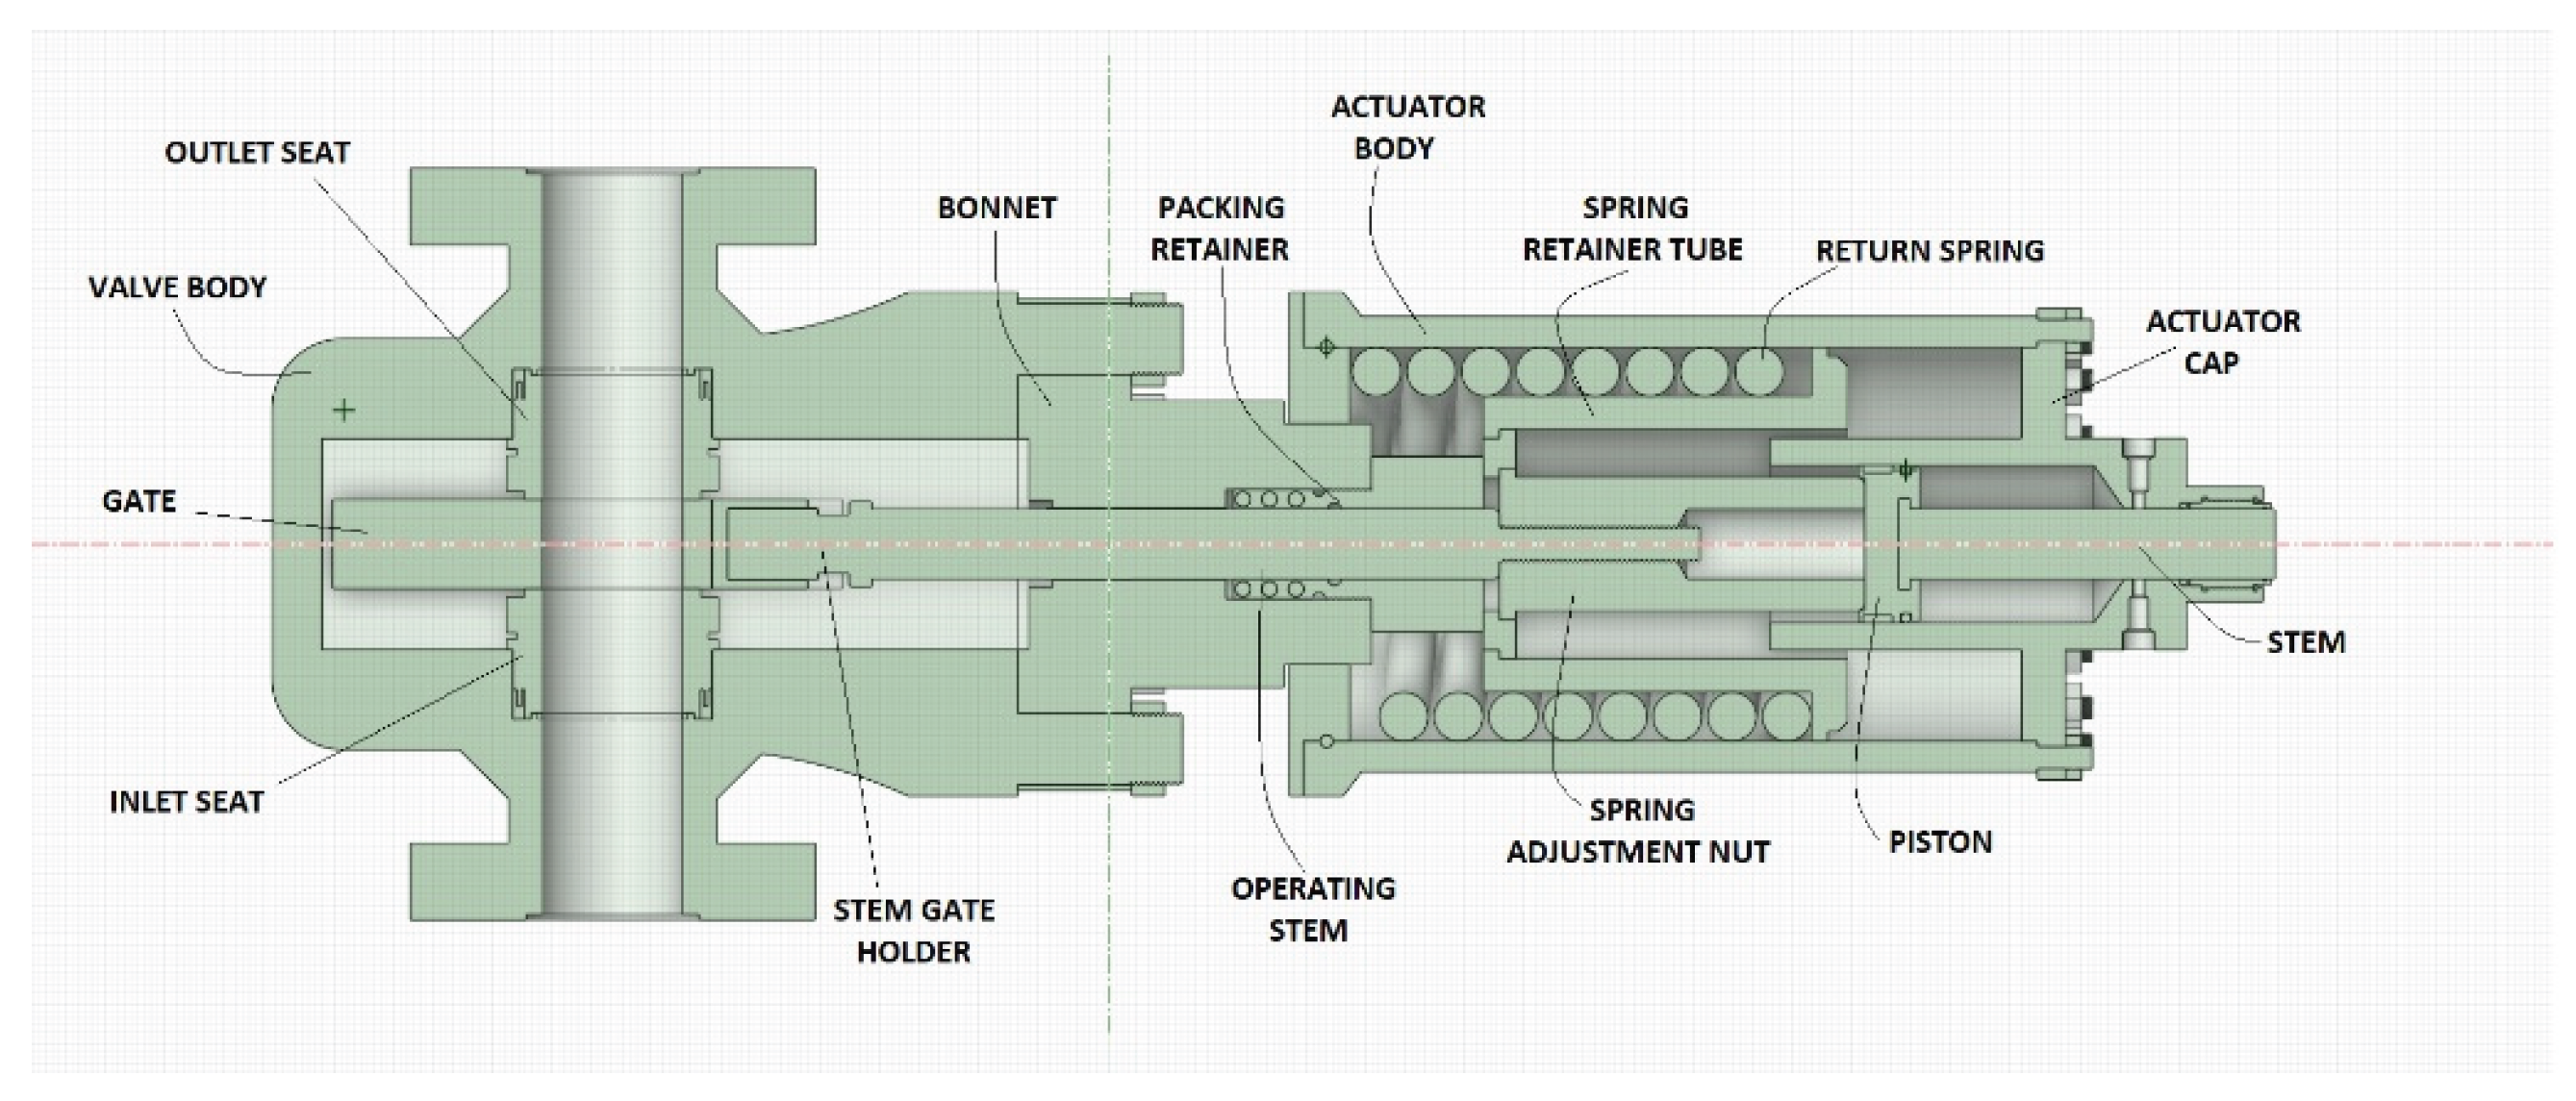
Figure 2.
Velocity contours at different valve openings. The color scale is not uniform across.
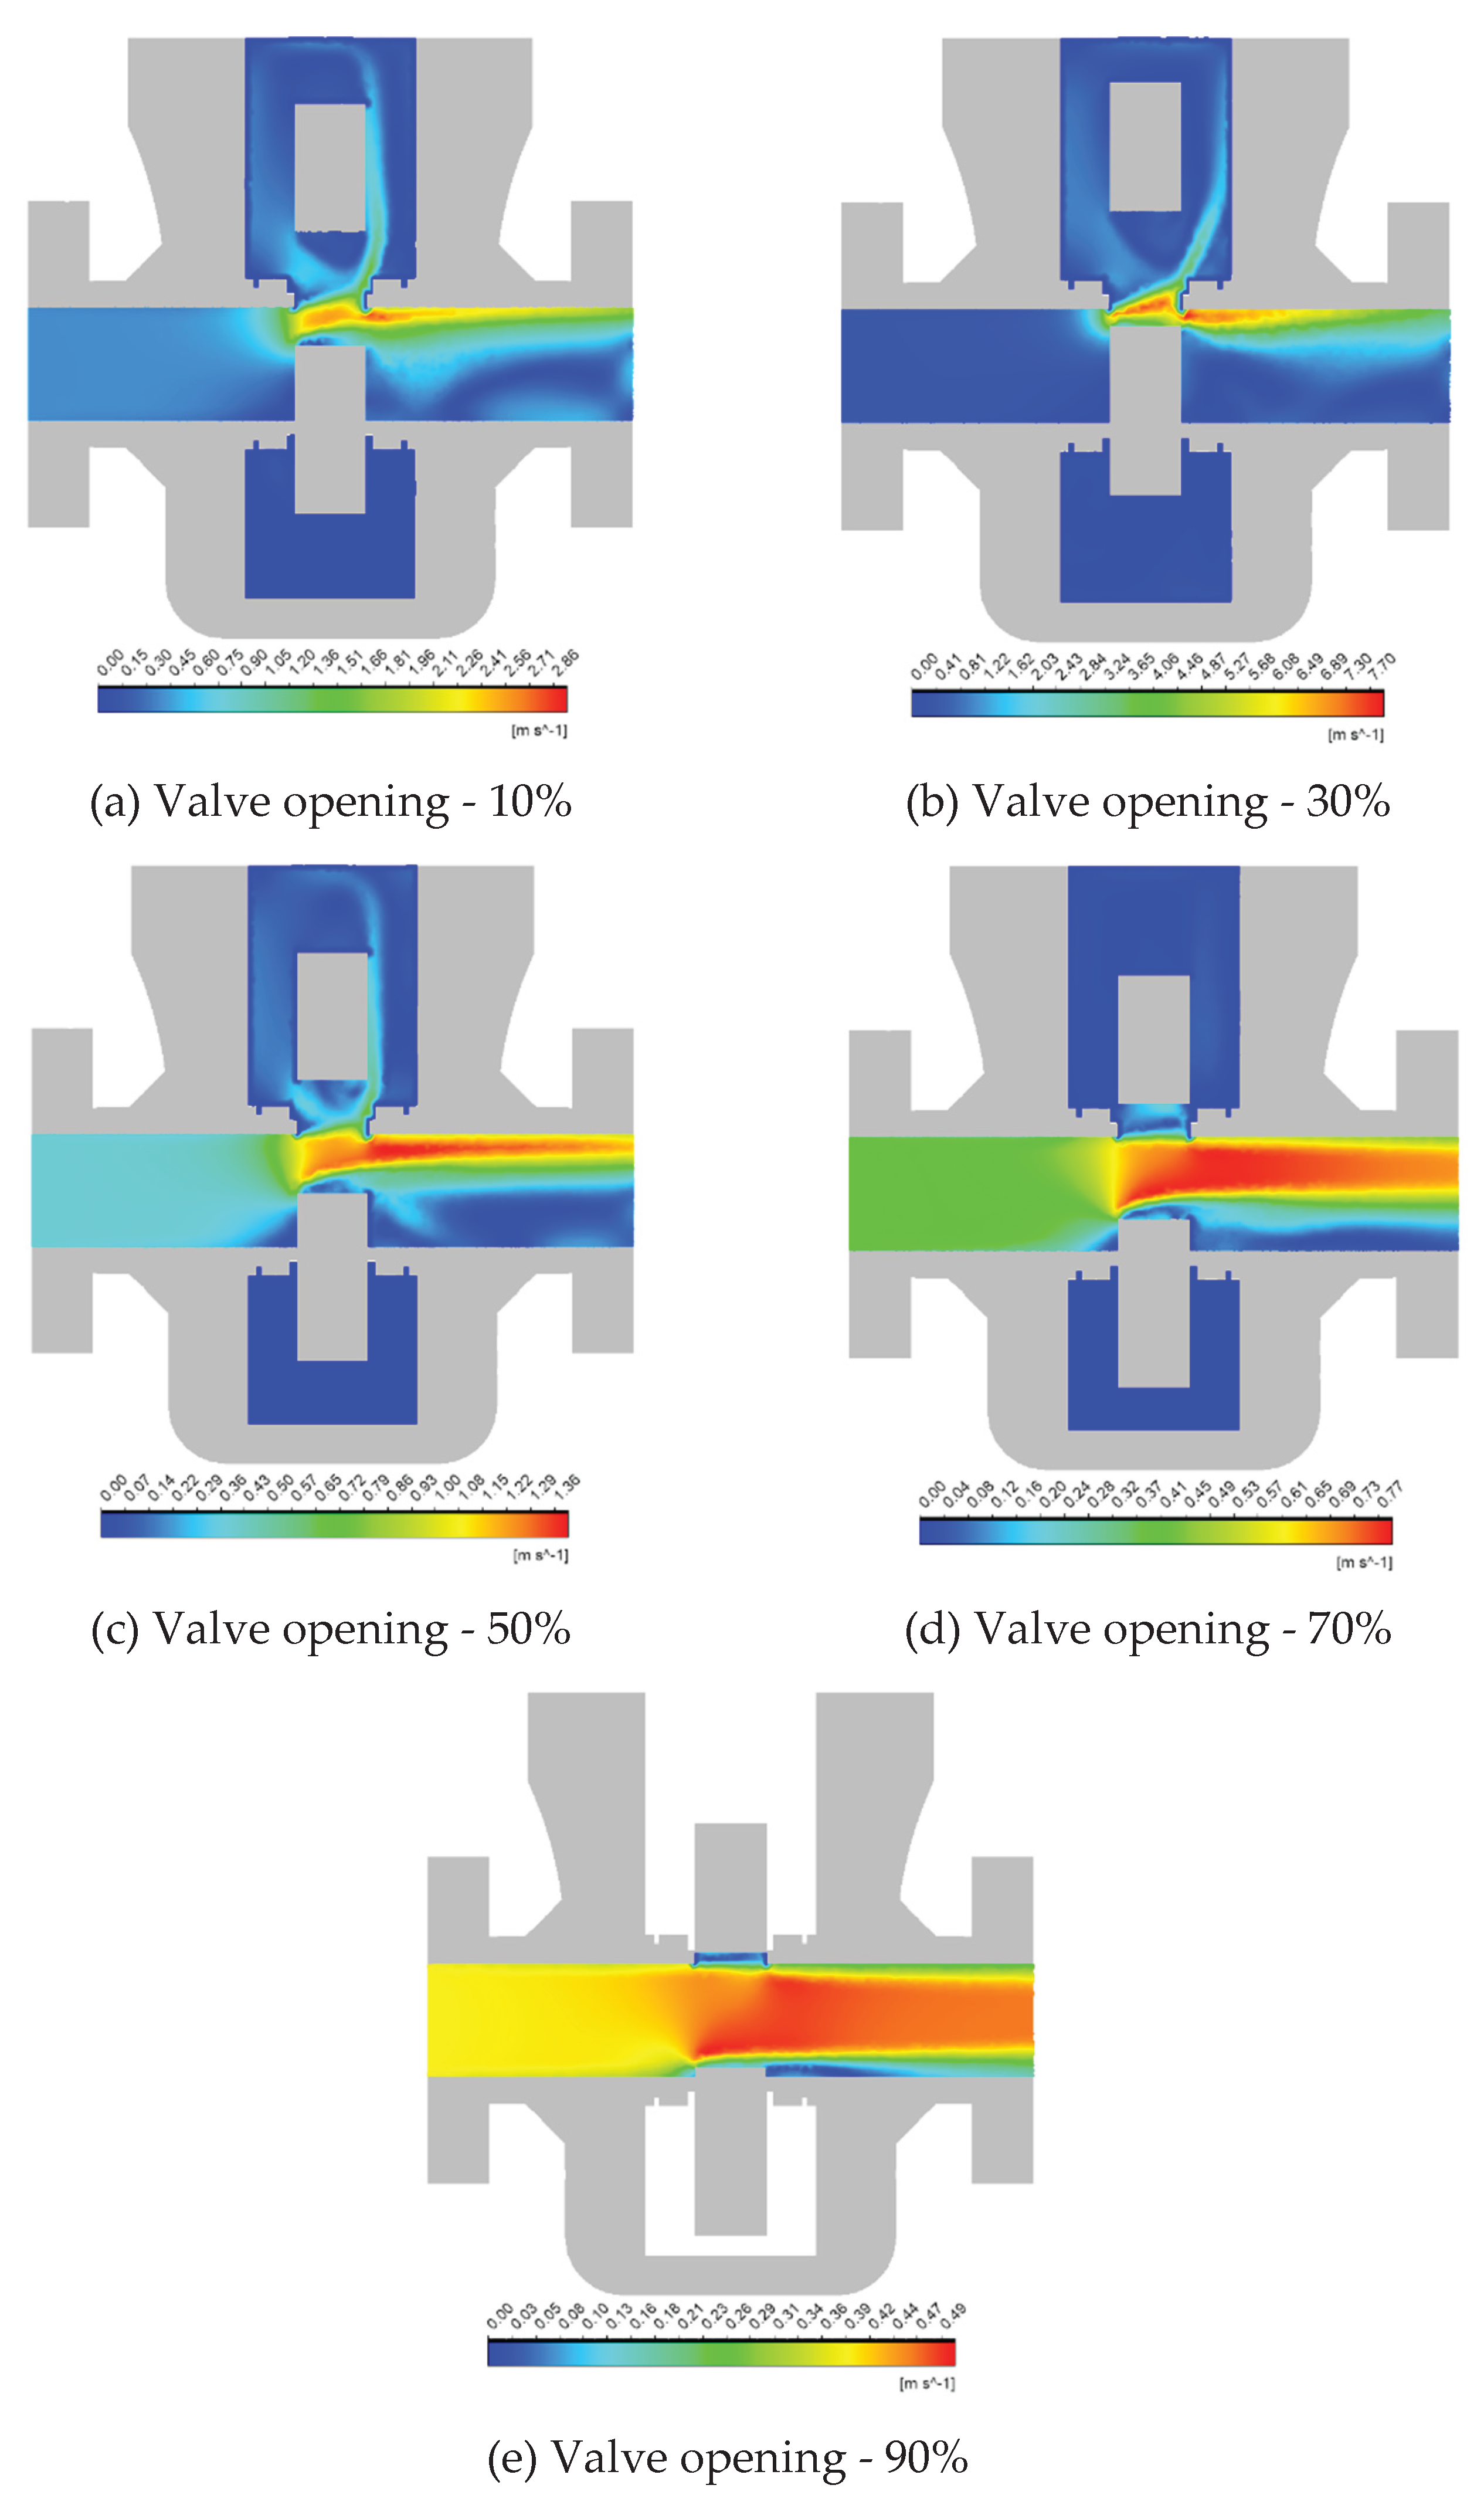
Figure 3.
Distribution of turbulence kinetic energy at different valve openings.
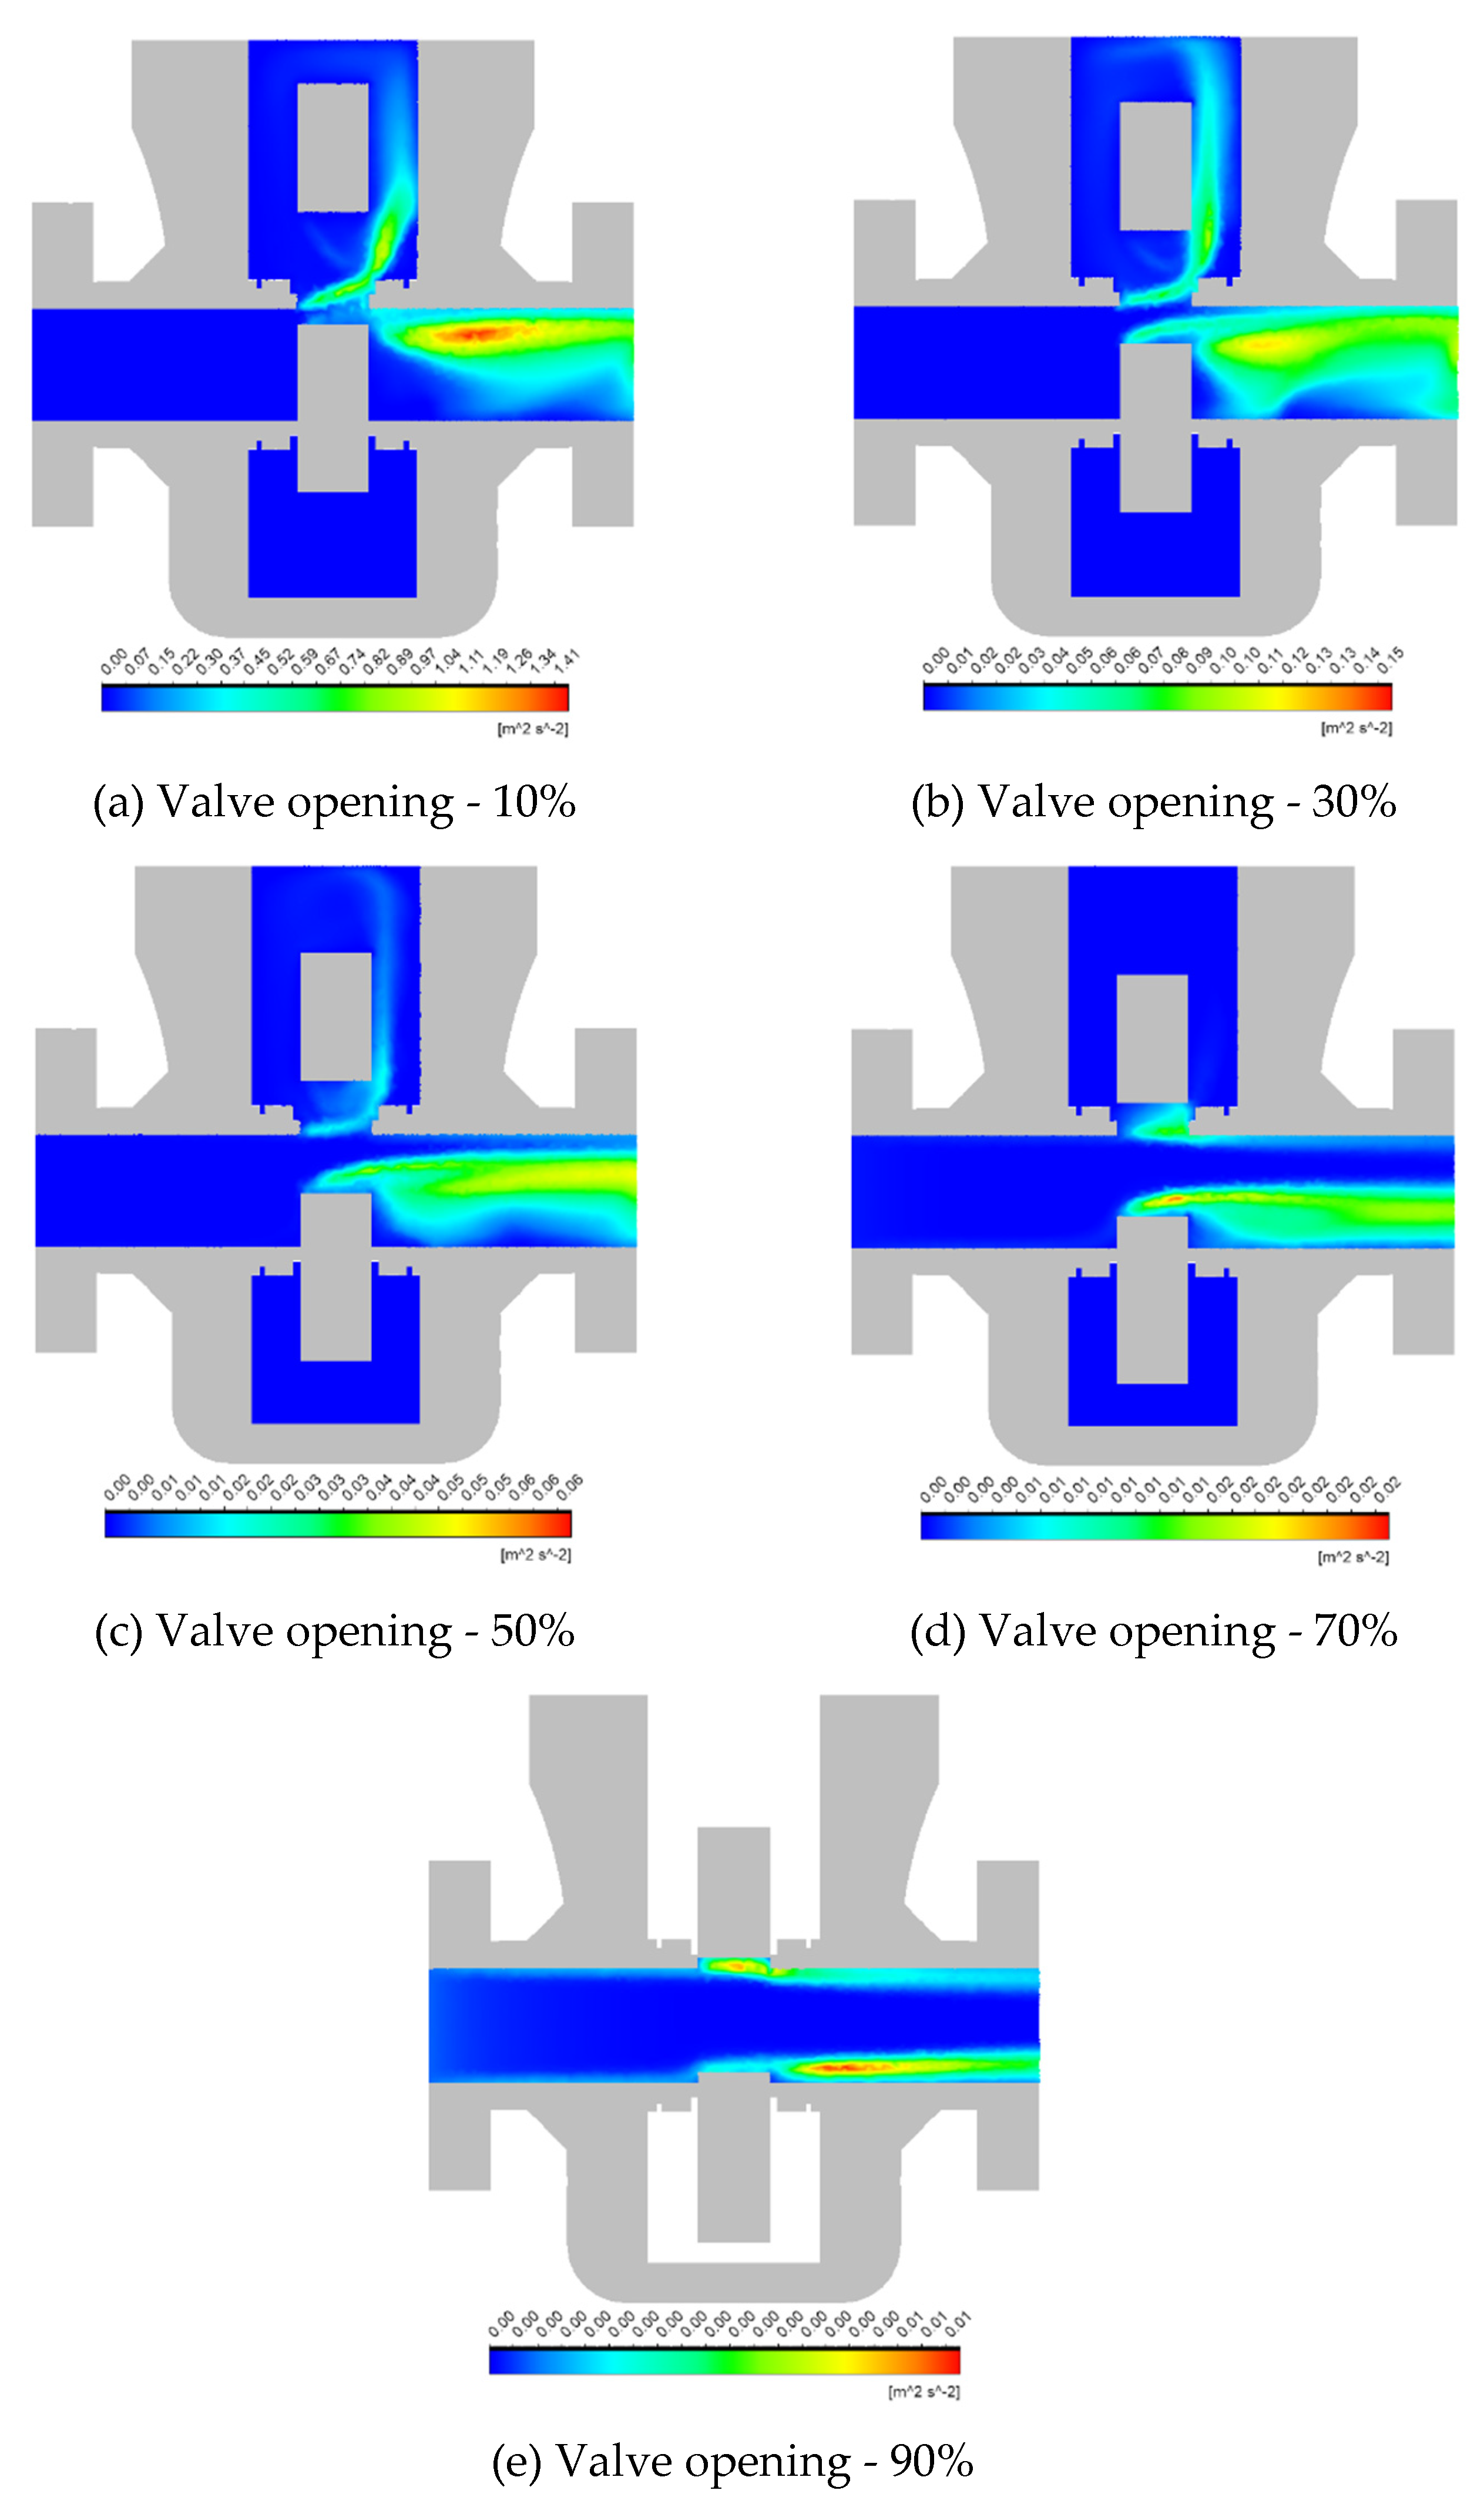
Figure 4.
Erosion rate contours at different valve openings.
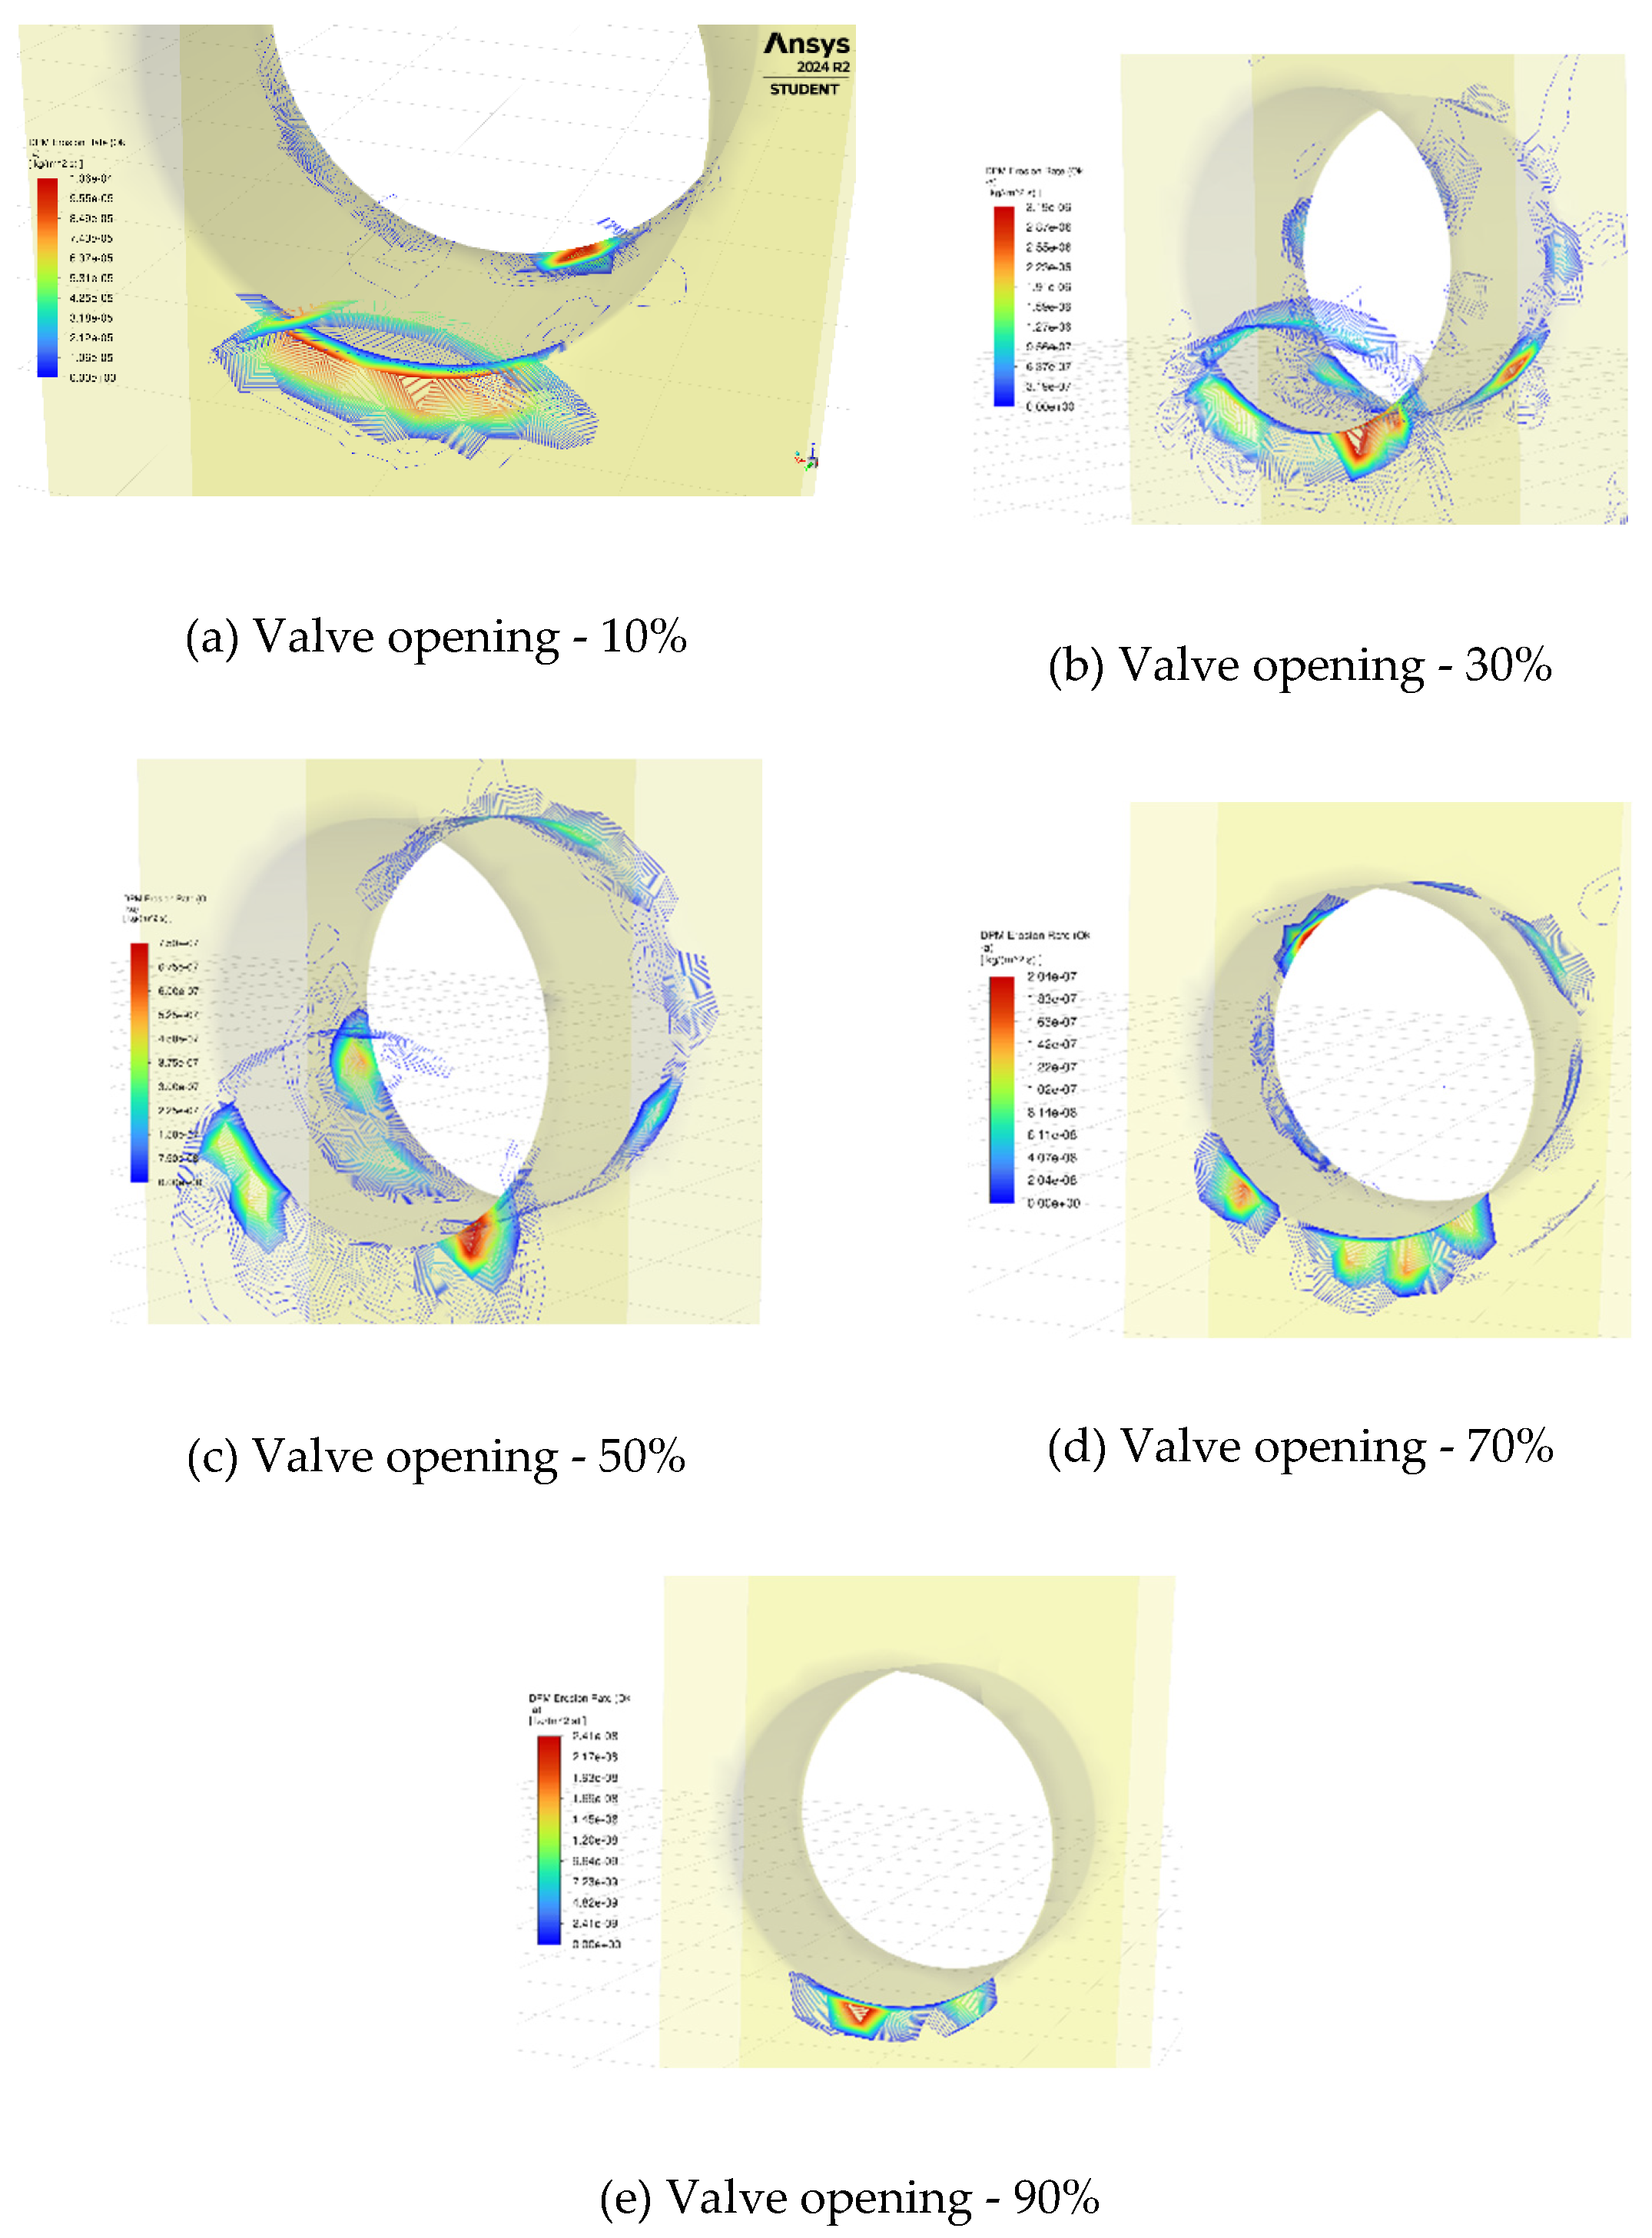
Figure 5.
Erosion rate vs. time duration for one valve cycle (logarithmic y-axis). Fully open and fully closed positions are highlighted.
Figure 5.
Erosion rate vs. time duration for one valve cycle (logarithmic y-axis). Fully open and fully closed positions are highlighted.
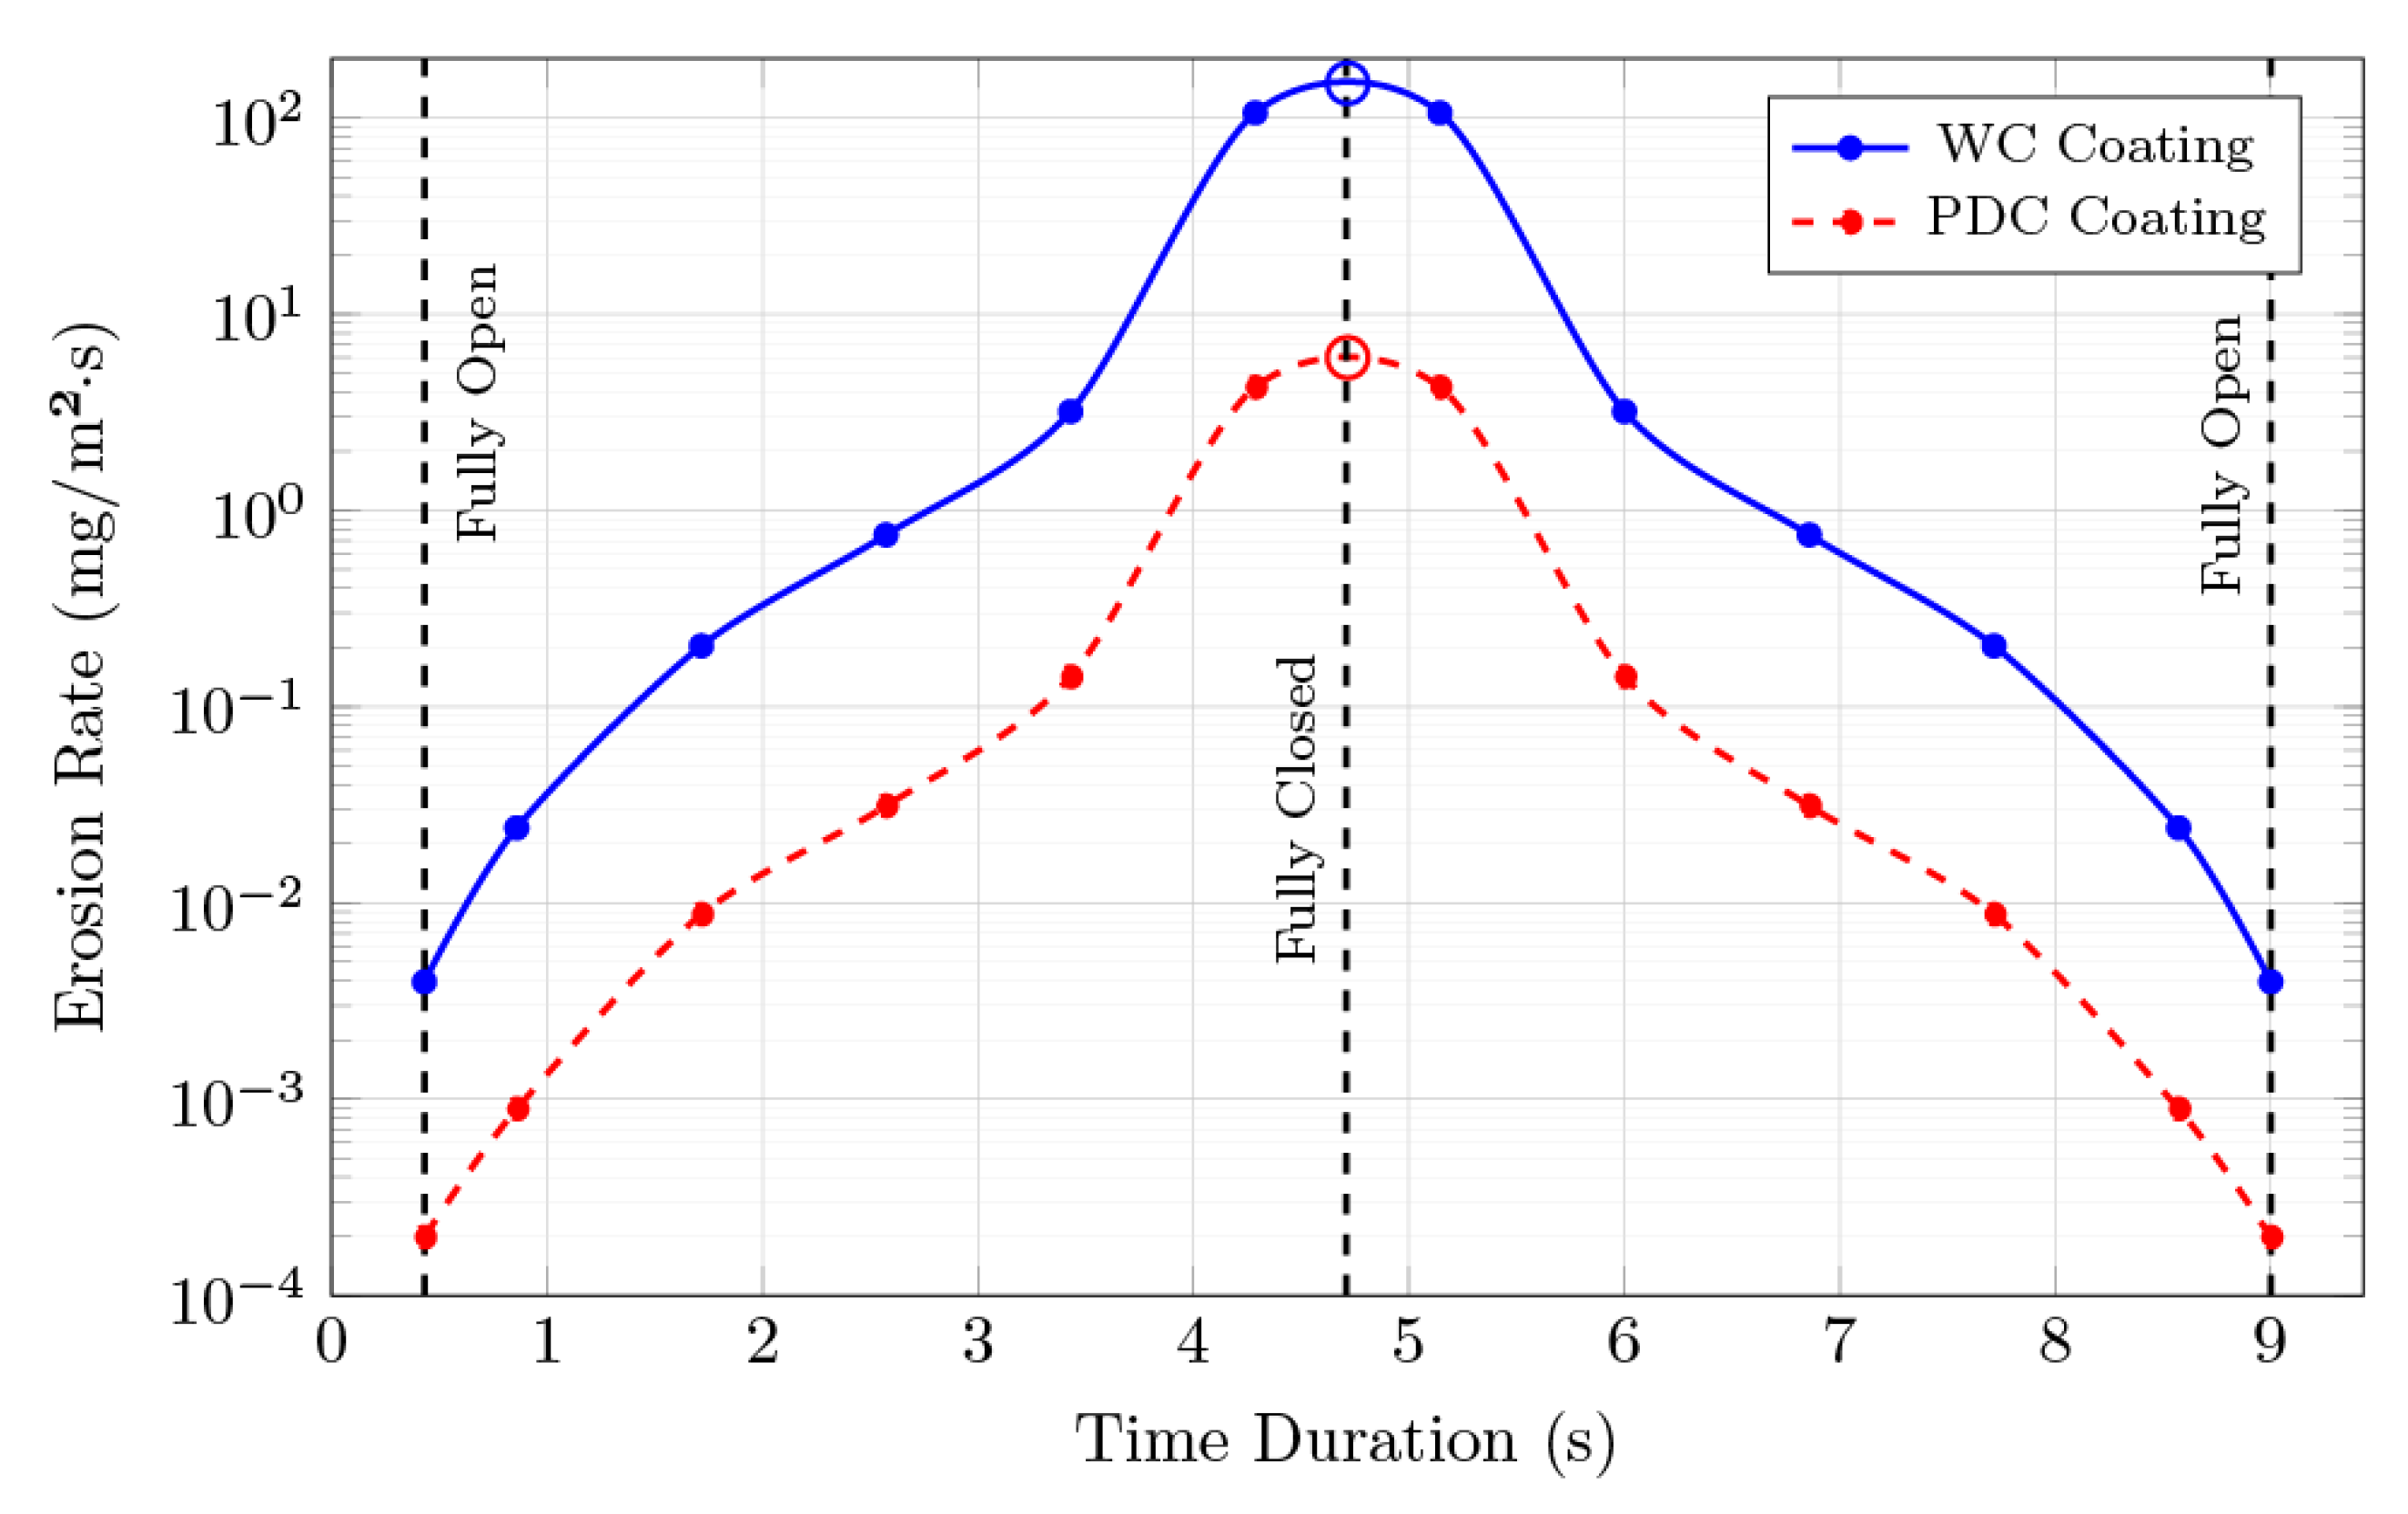

Table 1.
Parameters of the subsea gate valve model.
| Parameter | Value | Parameter | Value |
|---|---|---|---|
| Face-to-face dimension | Gate seat area | ||
| Body width | Substrate material | 25Cr super duplex | |
| Bore diameter | Material density (WC) | ||
| Gate port diameter | Material density (PDC) |
Table 2.
Simulation flow setup and parameters.
| Parameter | Value | Parameter | Value |
|---|---|---|---|
| Fluid phase | Freshwater | Particle phase | Silica sand |
| Fluid density | Particle density | ||
| Fluid viscosity | Particle diameter | ||
| Flow rate | Particle mass flow rate | ||
| Inlet velocity | Pressure (closed) |
Table 3.
Maximum erosion rates for WC and PDC coatings at different valve openings.
| Opening (%) |
Max. erosion rate WC coating | Max. erosion rate WC coating |
|---|---|---|
| 10 | ||
| 30 | ||
| 50 | ||
| 70 | ||
| 90 | ||
| 100 |
Table 4.
Cumulative erosion of WC and PDC material after each step of the slurry test.
| Step No | Flowrate | Gate position |
Duration (hours) |
||
|---|---|---|---|---|---|
| 1 | 0.300 | fully open | 50.00 | 0.713 | 0.036 |
| 2 | 0.300 | 7 cycles/min | 1.190 | 94.37 | 3.790 |
Table 5.
Mass loss of WC and PDC material after each step of the slurry test.
| A cycle | Slurry test Step 1 |
Slurry test Step 2 |
Slurry test SUM |
|
|---|---|---|---|---|
| 1.431 | 5.407 | 715.7 | 721.1 | |
| 0.057 | 0.273 | 28.74 | 29.01 |
Disclaimer/Publisher’s Note: The statements, opinions and data contained in all publications are solely those of the individual author(s) and contributor(s) and not of MDPI and/or the editor(s). MDPI and/or the editor(s) disclaim responsibility for any injury to people or property resulting from any ideas, methods, instructions or products referred to in the content. |
© 2025 by the authors. Licensee MDPI, Basel, Switzerland. This article is an open access article distributed under the terms and conditions of the Creative Commons Attribution (CC BY) license (http://creativecommons.org/licenses/by/4.0/).
Copyright: This open access article is published under a Creative Commons CC BY 4.0 license, which permit the free download, distribution, and reuse, provided that the author and preprint are cited in any reuse.


