
Submitted:
22 September 2025
Posted:
22 September 2025
You are already at the latest version
Abstract
Cacao represents a crop of strategic importance for Peru due to its socioeconomic value, which has driven initiatives for the collection, characterization, and conservation of its genetic diversity, with a view to the future development of elite plants. As part of these efforts, a collection of 113 accessions was established, with agromorphological data were recorded over two consecutive growing seasons, comprising 33 quantitative and 18 qualitative descriptors. These data were analyzed using univariate and multivariate statistical approaches, as well as Bayesian inference models. The results revealed broad phenotypic diversity, with significant variation in quantitative fruit and seed descriptors (CV = 37.51%), which was accompanied by high heritability values (> 60%) and considerable genetic advance (> 20%). Furthermore, eight phenotypic groups were identified, with Cluster II distinguished by its oblong fruits and higher pod index, and Cluster III by superior seed traits, including a greater number of fully developed seeds per fruit and an outstanding seed index (> 1.3 g). This comprehensive characterization enables the identification of accessions with promising agronomic traits and high bioactive potential, supported by phytochemical analyses using HPLC and FTIR. These findings provide a robust scientific foundation for breeding programs focused on developing more competitive and sustainable cacao production.
Keywords:
characterization
; conservation
; descriptors
; FTIR
; plant genetic resources
; theobromine
1. Introduction
Climate change and demographic pressure pose critical challenges for agriculture in tropical regions, where the limited availability of water and nutrients constrains the advances in crop improvement [1]. In response, the development of cultivars resilient to fluctuating environments has emerged as a priority strategy to ensure productive sustainability and strengthen food security. Within this context, the systematic conservation and characterization of genetic diversity gains scientific relevance, as germplasm constitutes a strategic reservoir of adaptive alleles [2].
The chocolate tree (Theobroma cacao L.) is a tropical cauliflorous species of the Malvaceae family [3], domesticated approximately 3500 years BC in northwestern South America [4,5]. This chronology is supported by fossil evidence recovered from archaeological sites of pre-Columbian cultures such as Chinchipe (Ecuador) and Montegrande (Peru) [6]. Cocoa, a strategic raw material in the chocolate industry, represents a global economic asset due to its added value derived from its biochemical composition, which is rich in secondary metabolites and alkaloids with immunomodulatory activities [7,8].
Globally, three main cacao groups have historically been recognized: Criollo, Forastero, and their hybrid Trinitario [9]. However, advances in phylogenomic analysis have enabled the reclassification of cacao diversity into eleven distinct genetic groups: (I) Amelonado, (II) Contamana, (III) Criollo, (IV) Curaray, (V) Guayana, (VI) Iquitos, (VII) Marañón, (VIII) Nacional, (IX) Nanay, (X) Purús, and (XI) Nacional Boliviano [10,11]. These groups are distributed across neotropical regions of South and Central America, representing a gradient of domestication and bioclimatic adaptation. Among these territories, Peru emerges as an epicenter of genetic diversity, harboring seven of the eleven identified groups (Contamana, Curaray, Iquitos, Marañón, Nanay, Purús, and Nacional), positioning it as a reservoir of wild alleles and variants of agronomic interest [11,12].
In Peruvian territory, cacao production spans the mid and high-altitude jungle ecoregions, extending from Cusco to Amazonas [6]. Among these, the Amazonas region is distinguished by its production of a wide variety of cacao beans, renowned for their alluring sensory attributes, which have earned it the protected designation of origin Cacao Amazonas Perú (CAP) [13]. This distinction has enabled the capitalization of market demand for the product, enhancing its competitiveness in international markets, where it accounts for 75% of fine-flavor cocoa exports [14].
In the Amazonas region, the Nacional and Criollo varieties are the main representatives of fine-flavor cacao [15]. Criollo is cultivated across 22.5% of the area in the province of Bagua, 72.7% in Utcubamba, and 78.3% in Condorcanqui [16]. Cacao cultivation thus contributes significantly to social development, benefiting numerous sectors of the population, particularly those in vulnerable conditions.
To maximize crop profitability, farmers prioritize the selection of genotypes that exhibit particular characteristics, such as resilience to biotic and abiotic stresses, high fruit productivity with morphologically attractive pods, and larger seeds with a distinctive organoleptic profiles [17]. However, it is recognized that intra and interpopulation genetic variability undergoes spatiotemporal fluctuations influenced by reproductive, geographic, and anthropogenic factors, leading to phenotypic heterogeneity [18]. Under these circumstances, the systematic characterization of a broader range of accessions becomes essential for elucidating advantageous gene combinations and identifying promising plant genetic resources [19].
Phenotypic agrobiodiversity is traditionally quantified through the evaluation of qualitative and quantitative traits [2]. Among these, average seed weight emerges as a key quantitative descriptor due to its high heritability, where larger size and morphometric uniformity represent priority attributes within chocolate industry standards, justifying its integration as a fundamental criterion in the design of assisted genetic selection programs [17,20]. This approach underscores the methodological role of morphological characterization as an analytical foundation for population genetics studies, while remaining farmer-friendly [20,21].
Numerous morphological descriptors have been reported in the literature for the characterization of commercially relevant crops, such as Coffea arabica L. [22], Amaranthus [23], Hibiscus sabdariffa L. [24], Phoenix dactylifera L. [25], y Capsicum spp [26], among others. Particularly in cacao, 65 agromorphological descriptors were established in the late twentieth century and systematically adopted by international organizations such as the Tropical Agricultural Research and Higher Education Center (CATIE), the International Cocoa Genebank Trinidad (ICGT), and the International Cocoa Germplasm Database (ICGD), which have supported comparative studies and genomic conservation efforts for decades [27]. Building on this framework, a recent study conducted in northeastern Peru [6], identified, five groups within a population of 146 fine-flavor cacao ecotypes, classified as Toribianos, Utkus, Cajas, Indes, and Bagüinos. Of these, the latter two stand out for their adaptation to altitudes above 500 m, exhibiting superior organoleptic profiles and high yield, as reflected in an improved ear index (> 11.88).
The uniqueness of this study resides in addressing an unresolved question of the past decade: the identification of the phenotypic characteristics that differentiate and cluster the germplasm of Cacao Amazonas Perú. Accordingly, the main objective was to evaluate and compare the agromorphological traits of 113 cacao accessions from the INIA Germplasm Bank to discern promising phenotypic groups. The working hypothesis was that analyzing a broad set of accessions would enrich the germplasm by identifying outstanding ones, thereby strengthening the position of Peruvian cacao and promoting the conservation and utilization of plant genetic resources for future crop improvement under the context of climate change.
2. Materials and Methods
2.1. Plant Germplasm
During 2016, plant material (scions) was collected from the middle third of the canopy of previously identified mother plants located in natural populations within the provinces of Bagua and Utcubamba (Figure 1). The selection of these specimens was conducted strategically, taking into account distinctive morphological characteristics indicated by local producers. This process enabled the recording of passport data and the subsequent assignment of a unique "PER" code (Table S1), which identifies each distinct accession within the Germplasm Bank of the National Institute of Agrarian Innovation (INIA-Peru) [28].
The study provinces, located in the department of Amazonas, are distinguished by their pronounced geographic, climatic, and altitudinal diversity. This territory encompasses areas ranging from warm and arid-warm zones in the lowlands, where temperatures can reach up to 40 °C and annual precipitation is around 1300 mm, to temperate regions situated above 1400 m a.s.l., with temperatures fluctuating between 14 °C and 25 °C. The landscape comprises mountainous reliefs, hills, alluvial plains, and undulating lands, primarily distributed around the Marañón and Utcubamba river basins. This environmental heterogeneity creates an ecological mosaic that fosters a broad expression of phenotypic variability in the evaluated cacao accessions.
2.2. Research Design
The germplasm collection, composed of buds from 113 accessions, was grafted onto the universal rootstock, IMC 67, recognized for its vegetative vigor and disease resistance. Establishment was carried out through top-cleft grafting in the year of collection, using morphologically uniform rootstock plants with scion of 10 mm diameter. The planting was conducted within an agroforestry system, employing a Latin square experimental design with a spacing of 3 × 3 m. Each accession comprised nine grafts, individually identified with QR codes to ensure traceability. During the first two years, the system was associated with Mussa sp. (banana), while the forest species Cedrela odorata L., Inga edulis Mart., and Calycophyllum spruceanum Benth., planted at 10 m intervals, reached their developmental stage.
2.3. Study Location
The ex situ conservation of the cacao collection belonging to the Germplasm Bank of INIA-Peru was established at the Huarangopampa Experimental Center (EC), a subsidiary of the Amazonas Agrarian Experimental Station. It is located in the district of El Milagro, Utcubamba province (5°39'50'' S, 78°32'01'' W), at an altitude of 480 m a.s.l. At this site, the collection hosts a total of 1017 plants, distributed across 1 ha (Figure S1).
2.4. Agronomic Management
During the establishment and maintenance period, standardized cultural practices were implemented, including weed control, periodic irrigation according to plant water requirements, and split fertilization applied twice per season. The latter was determined based on the nutritional requirements of the crop, as established through systematic soil analyses conducted throughout the evaluation period.
In addition, formative and maintenance pruning were systematically carried out over 7 years, accompanied by continuous phytosanitary monitoring to ensure the timely detection of pests and diseases. During this time, graft viability was confirmed, and a stable productive state was reached for the majority of accessions. From this point onward, the evaluation of agromorphological traits was scheduled across two consecutive cropping seasons (2023 and 2024).
2.4. Agroecological Conditions
The initial edaphic conditions of the site were characterized by a clay texture, with a pH of 7.8 and an electrical conductivity of 9.9 mS/m. Regarding mineral availability, the soil analysis registered 3.9 mg/kg of phosphorus, 176.6 mg/kg of potassium, 7.2% total carbon, 0.7% organic matter, and 0.4 mg/g total nitrogen. Furthermore, the concentration of exchangeable bases was 26.5 cmol(+)/kg for calcium, 3.0 cmol(+)/kg for magnesium, and 0.6 cmol(+)/kg for sodium. These properties were determined by the analytical characterization performed by the Soil, Water, and Foliar Analysis Laboratory (LABSAF) of INIA, which is accredited according to the NTP-ISO/IEC 17025:2017 standard under registration No. LE-200.
The climatic conditions in the collection area during the characterization period were distinguished by a higher accumulated precipitation (1040.9 mm) in 2024 [29]. In terms of temperature, relative stability was observed throughout both years (Figure 2). Relative humidity, however, showed a significant decrease between the months of July and September in both annual periods, coinciding with the months of lowest rainfall.
2.5. Agromorphological Characterization
A total of 51 phenotypic descriptors were employed for the agromorphological characterization of the germplasm [30,31,32], of which 33 corresponded to quantitative traits and 18 to qualitative traits. The selection of these descriptors was based on their capacity to reveal the distinctive characteristics of each accession, encompassing key structures such as leaves, flowers, fruits, and seeds.
2.5.1. Quantitative Descriptors
Leaf: LL= Leaf length (cm), LW = Leaf width (cm), PtL=Petiole length (cm).
Flower: PdL= Pedicel length (cm), SpL=Sepal length (mm), SW=Sepal width (mm), PL= Petal length (mm), PW= Petal width (mm), LgW= Ligule width (mm), FL= Filament length (mm), StL= Staminode length (mm), SL= Style length (mm), OL= Ovary length (mm), OW= Ovary width (mm).
Fruit: SH= Shell hardness (Mpa), FM=Fruit mass (g), FrL= Fruit length (cm), FW=Fruit width (cm), PrT= Pericarp thickness (cm), GD= Groove depth (cm), PM= Pericarp mass (g), NL= Number of locules, TSS=Total soluble solids (°Brix).
Seed: NSL= Number of seeds per locule, FSMF= Fresh seed mass per fruit (g), NSF=Number of seeds per fruit, SI=Seed index (g), EI=Ear index, NIS= Number of intact seeds, NES= Number of Empty seeds, SeL= Seed length (mm), SD= Seed diameter (mm), ST= Seed thickness (mm).
2.5.2. Qualitative Descriptors

Table 1.
Morphological descriptors evaluated in the characterization of cacao germplasm.
| Structure | Descriptor | Acronym | Categorical Indicator |
|---|---|---|---|
| Leaf | Leaf base shape | LBS | Acute (1), Obtuse (2), Rounded (3) and Codiform (4) |
| Leaf apex shape | LAS | Apiculate (1), Acuminate (3) and Caudate (5) | |
| Young leaf color | YLC | Green (3), Brown and Red (5) | |
| Flower | Pedicel color | PC | Green (1), Reddish green (2) and Reddish (3) |
| Anthocyanin in sepals | ASe | Absent (1) and Present (2) | |
| Anthocyanin in staminodes | ASt | Absent (1) and Present (2) | |
| Anthocyanin in filament | AF | Absent (1) and Present (2) | |
| Anthocyanin in ovary | AO | Absent (1) and Present (2) | |
| Anthocyanin in ligule | AL | Absent (1) and Present (2) | |
| Fruit | Immature fruit color | IFC | Green (1), Pigmented green (2) and Red (3) |
| Mature fruit color | MFC | Yellow (1), Orange (2), Green (3) and Red (4) | |
| Fruit shape | FS | Oblong (1), Elliptic (2), Oboved (3), Rounded (4) and Ovate (5) | |
| Fruit shape | FAS | Attenuated (1), Acute (2), Obtuse (3), Rounded (4), Nipple shaped (5) and Dentate (6) | |
| Basal fruit constriction shape | BCSF | Absent (0), Slight (1), Intermediate (2) and Strong (3) | |
| Roughness of the fruit peel | RFP | Absent (0), Mild (1), Intermediate (3) and Rough (5) | |
| Seed | Seed cross-section shape | SCSS | Flattened (1), Intermediate (2) and Rounded (3) |
| Longitudinal seed shape | LSS | Oblong (1), Elliptic (2), Oval (3) and Irregular (4) | |
| Seed color | SC | White (1), Pink (2), Violet (3) and Purple (4) |
2.6. Phytochemical Characterization
Fresh cotyledons from the promising accessions, along with a representative accession to ensure the inclusion of all phenotypic groups in the analysis, were preserved at –80 °C for 24 h and subsequently lyophilized under apressure of 0.003 mbar for 72 h (Labconco FreeZone, –84 °C). The resulting samples were ground, sieved (850 μm), and defatted following the protocol adapted from Cortez [33]. The filtered extract (Whatman No. 40) was stored in amber Eppendorf-type tubes at –22 °C. All analyses were performed in triplicate.
2.6.1. Colorimetric Measurement, Titratable Acidity, and pH
The color of the lyophilized powder was determined in the CIELAB color space coordinates (L*, a*, b*), using a digital colorimeter (CR-400/DP-400, Konica Minolta, Tokyo, Japan). Simultaneously, 10 g of sample were dissolved in 50 mL of Milli-Q water at 100 °C. The mixture was briefly vortexed and filtered using Whatman No. 40 paper. The pH of the solution was measured with an HI2211 pH meter (Hanna Instruments, USA). Titratable acidity was determined by titration to pH 8.1 using 0.1 N NaOH, incorporating three drops of phenolphthalein as an indicator. The results were expressed as a percentage of acetic acid equivalent.
2.6.2. Bioactive Compound Profile
The antioxidant capacity was evaluated using the DPPH free radical method, applied according to Brand-Williams [34], with minor adaptations. For this purpose, 100 μL of the extract was mixed with 3.9 mL of DPPH in amber Eppendorf-type tubes, and the absorbance was measured at 515 nm using a UV/Vis spectrophotometer (Genesys 180, Thermo Scientific™, Madison, USA). Quantification was performed using Trolox standards (y = 0.2321x – 1.2859; R² = 0.9978), and the results were expressed as Trolox equivalents (TE) per sample (mg TE/g).
Total phenolic content (TPC) was quantified using the Folin-Ciocalteu reagent [35]. For this, 500 μL of the extract was mixed with 2.5 mL of 10% reagent and 2 mL of Na₂CO₃ (4% w/v) in amber tubes. Subsequently, absorbance was measured at 750 nm using a UV/Vis spectrophotometer. Concentrations were estimated using gallic acid standards (y = 0.0036x + 0.1872; R² = 0.9982), and the results were expressed as gallic acid equivalents (GAE) per sample (mg GAE/g).
2.6.3. HPLC Screening of Methylxanthines and Phenolic Compounds
Individual standard solutions of theobromine, caffeine, caffeic acid, catechin, epicatechin, and cyanidin 3-O-glucoside were prepared, establishing concentration ranges and retention times according to the optimized protocol described by Cortez [36]. The analysis was performed using an ultra-high-performance liquid chromatograph (Agilent 1290 Infinity II, California, USA) equipped with a Zorbax Eclipse Plus C18 column (4.6 × 25 cm, 5 μm) coupled to an automated diode-array detector (DAD). The operational conditions included an injection volume of 20 μL, an analysis time of 22 min, and a constant temperature of 26 °C. Detection was carried out at 280 nm, and the results were expressed as milligrams of standard equivalent per gram of dehydrated sample (mg/g).
2.6.4. FTIR Spectroscopy Screening
For the characterization of functional groups in cacao samples, an analysis was performed using Fourier transform infrared spectroscopy in attenuated total reflectance mode (FTIR-ATR). A total of 50 mg of freeze-dried cotyledons were analyzed using a Nicolet iS50 spectrophotometer (Thermo Scientific, Madison, USA), with background correction performed through Omnic software. Subsequently, the spectra were acquired at room temperature, with 50 scans per sample, across a spectral range of 4000 to 500 cm⁻¹, at a resolution of 4 cm⁻¹.
2.7. Statistical Processing
Statistical analyses and graphical representation of data pooled from two consecutive years of agromorphological characterization were performed using the R environment v4.4.3 [37], applying a combined univariate and multivariate analytical approach.
Initially, quantitative data were refined through the detection and exclusion of outliers using the outliers package v0.15 [38]. Subsequently, the variability of the quantitative traits was described with the summarytools package v1.0.1 [39], calculating the mean, standard deviation (DevSt), extreme values (max and min), and coefficient of variation (CV). Frequency distributions were graphically represented with the ggplot2 package v3.5.2 [40], using histograms for quantitative descriptors and bar plots for qualitative ones.
Using the variability package v0.1.0 [41], which integrates the respective equations [1], genetic parameters were estimated, including genotypic variance (GV) and phenotypic variance (PV), their associated coefficients of variation (GCV and PCV), broad-sense heritability (H²), as well as the response to selection represented by genetic advance (GA) and the percentage of genetic advance relative to the mean (GAM).
The magnitude and direction of phenotypic associations between pairs of quantitative descriptors, as well as the relationships among phytochemical parameters, were determined using Pearson’s correlation coefficient, calculated with the Hmisc package v5.2-3 [42]. Subsequently, the resulting correlation matrices were visualized through heatmaps generated with the corrplot package v0.95 [43].
Germplasm clustering through hierarchical conglomerates was performed using a Euclidean distance matrix and the minimum variance method of Ward (Ward.D2), implemented in the cluster package v2.1.8.1 [44]. The optimal partition was determined by the average silhouette index (K) using the factoextra package v1.0.7 [45], and the graphical representation was generated as a heatmap with associated dendrograms employing the ComplexHeatmap [46] and dendextend v1.19.1 [47] packages.
Promising accessions in terms of productivity were identified through a bivariate linear mixed model under Bayesian inference, implemented in the MCMCglmm package [48] with Monte Carlo simulations using Markov chains and non-informative prior distributions [49]. Convergence was assessed with the coda package v0.19.4, and the Bayesian Yield Stability Index (BYSI) was calculated as the minimum yield with a 90% probability of being exceded [49], expressing uncertainty through highest posterior density (HPD) intervals. The results were synthesized in a biplot generated with ggplot2.
Differences among phenotypic groups and phytochemical parameters were assessed through one-way analysis of variance (ANOVA) (p < 0.05), after verifying data normality using the Shapiro–Wilk test (p ≥ 0.05). Multiple comparisons were conducted using Tukey's Honest Significant Difference (HSD) test at a 95% confidence level with the agricolae package v1.3-7 [50], and the results were visualized using ggplot2 and tidyverse v2.0.0 [51]. Additionally, CIELAB coordinates were graphically represented using ggplot2 and ggforce v0.5.0 [52], while FTIR spectra were normalized and plotted with the ChemoSpec v6.3.0 [53] and ggplot2 packages.
3. Results
3.2. Variation Patterns in Quantitative Descriptors
The quantitative analysis of 113 cacao accessions revealed a marked phenotypic diversity, supported by the values of the coefficient of variation (CV), means, and ranges (Figure 3). Although more than 50% of the analyzed descriptors exhibited a normal distribution, some traits, such as OW, EI, NSL, and PL, showed significant deviations from normality, characterized by skewed distributions and pronounced tails.
Analysis of the pooled data across two evaluation campaigns revealed moderate variability in the foliar descriptors. LL showed values ranging from 24.38 to 30.03 cm (CV = 4.4%), with a higher concentration of accessions was recorded in the interval between 28.00 and 28.50 cm. The LW varied between 8.50 and 11.32 cm (CV = 6.52%), with a high frequency of accessions observed in the 9.50 to 9.75 cm range.
Regarding floral characters, the PdL exhibited a variation range between 1.15 and 2.47 cm (CV = 16.42%), with the majority of accessions concentrated between 1.40 and 1.50 cm. For SpL, most accessions presented values between 8.00 and 8.50 mm (CV = 13.57%). StL varied from 5.25 to 8.92 mm (CV = 10.46%). Finally, OL in the 113 evaluated accessions fluctuated between 1.03 and 2.33 mm (CV = 15.51%), with the highest frequency of accessions found in the interval of 1.60 to 1.70 mm.
Concerning fruit attributes, FM presented a broad range of variation, with values between 302.17 and 1599.33 g (CV = 32.53%), with the majority of accessions concentrated in the 500 to 600 g interval (Figure 3). FrL predominantly ranged from 16 to 17 cm, reaching a maximum of 27.27 cm. Meanwhile, FW was concentrated between 8.80 and 10.00 cm (CV = 9.61%). Fruits were mostly distinguished by presenting a PrT between 1.28 and 3.22 cm (CV=19.83%), with the highest prevalence of accessions found between 1.80 and 1.95 cm.
The sweetness of the mucilage covering the cotyledons (TSS) reached a maximum value of 25.25 °Brix (CV = 17.29%), with most accessions concentrated in the interval of 15 to 17 °Brix. Similarly, most accessions produced between 42 and 45 seeds per fruit (NSF), with a maximum of 52.67 seeds (CV = 16.42%) and an average of only 4.03 empty seeds (Figure S2). Regarding individual seed mass (SI), the highest frequency of accessions fell within the range of 1.10 to 1.20 g, with values reaching up to 2 g (CV = 21.25%). Additionally, the ear index (EI) reached values of up to 44.90 units. These characteristics are attributed to larger dimensions in seed length (SD) and seed thickness (ST), whose values ranged from 10.53 to 17.12 mm and from 6.90 to 12.83 mm, respectively.
3.3. Estimation of Quantitative Genetic Parameters
Phenotypic characterization constitutes the foundation for assessing the diversity present in a germplasm; however, its effectiveness is intrinsically conditioned by the degree of association between the observable phenotypic expressions and the underlying genetic basis (Table 2).
The foliar descriptors showed phenotypic variation among the evaluated accessions. PtL presented a low genotypic coefficient of variation (GCV = 6.35%) and a reduced genetic advance as percent of the mean (GAM = 5.89%), indicating limited genetic variability and low potential response to selection, with a greater environmental influence (PCV = 14.10%). In contrast, LW exhibited moderate heritability (H² = 41.38%), attributable to transmissible genetic effects.
In the floral characterization, the descriptors PdL, SW, and OW showed a moderate GCV (>10%), with LF particularly standing out with a high GCV (32.36%). Regarding the PCV, the characters SW, LF, and SL exhibited elevated values (>20%). Meanwhile, heritability was generally moderate to high (H² > 60%) for most floral descriptors, with the exception of SL (H² < 24.42%). Similarly, all descriptors, except SL (GAM = 0.77%), evidenced a moderate to high estimated genetic advance (GAM > 20%), suggesting adequate potential for response to selection.
For the fruit descriptors, FM and PM presented high values for genotypic variation, phenotypic variation, and expected genetic advance (GCV, PCV, and GAM > 20%), suggesting a high potential for improvement through selection. Meanwhile, SH, NL, and TSS recorded maximum heritability values (H² = 100%), indicating that the observed variation is completely attributable to stable genetic effects.
Regarding seed characteristics, the FSMF and NES showed high genotypic variability (GCV = 21.31% and 28.48%, respectively), demonstrating substantial genetic variability for these characters. In particular, FSMF stood out for exhibiting both moderately high heritability (H² = 54.48%) and high estimated genetic advance relative to the mean (GAM = 32.41%), reflecting strong potential for selection response. Finally, PCV, EI and NES reached values above 20%, highlighting a greater influence of environmental factors on their phenotypic expression.
3.4. Association Analysis Among Quantitative Descriptors
Pearson's correlation coefficient (Figure 4) revealed positive correlations among fruit descriptors, where FM was significantly associated with FrL (r = 0.65***), FW (r = 0.78***), PrT (r = 0.56***), GD (r = 0.51***), and PM (r = 0.95***), indicating coherence in the development of larger and heavier fruit structures. These fruit variables, in turn, maintained positive associations with seed descriptors, such as PM with NIS (r = 0.30**), FW with SI (r = 0.47***), and FrL with NSF (r = 0.51***), suggesting that characteristics such as fruit length or pericarp mass directly influence seed quality and quantity. Likewise, FSMF showed positive correlations with NSL (r = 0.50***), NSF (r = 0.64***), SI (r = 0.42***), NIS (r = 0.58***), and SeL (r = 0.29***), revealing a close internal relationship among seed attributes.
When examining associations across morphological structures, positive correlations were identified between certain floral and fruit descriptors, such as FL with FW (r = 0.31***), StL with PM (r = 0.27**), and PL with FrL (r = 0.29**), suggesting that specific floral characteristics may be linked to subsequent fruit development. In contrast, negative correlations were observed among traits, such as EI with FM (r = –0.31***), FrL (r = –0.40***), and FW (r = –0.37***), indicating that a higher ear index may result in less robust fruits. Similarly, NSL showed negative correlations with SD (r = –0.34*) and NIS with SD (r = –0.31*), implying potential structural adverse structural effects on the seed. Collectively, these correlations help identify morpho-structural relationships relevant for the selection of accessions with integrated agronomic attributes.
3.5. Patterns of Variation in Qualitative Descriptors
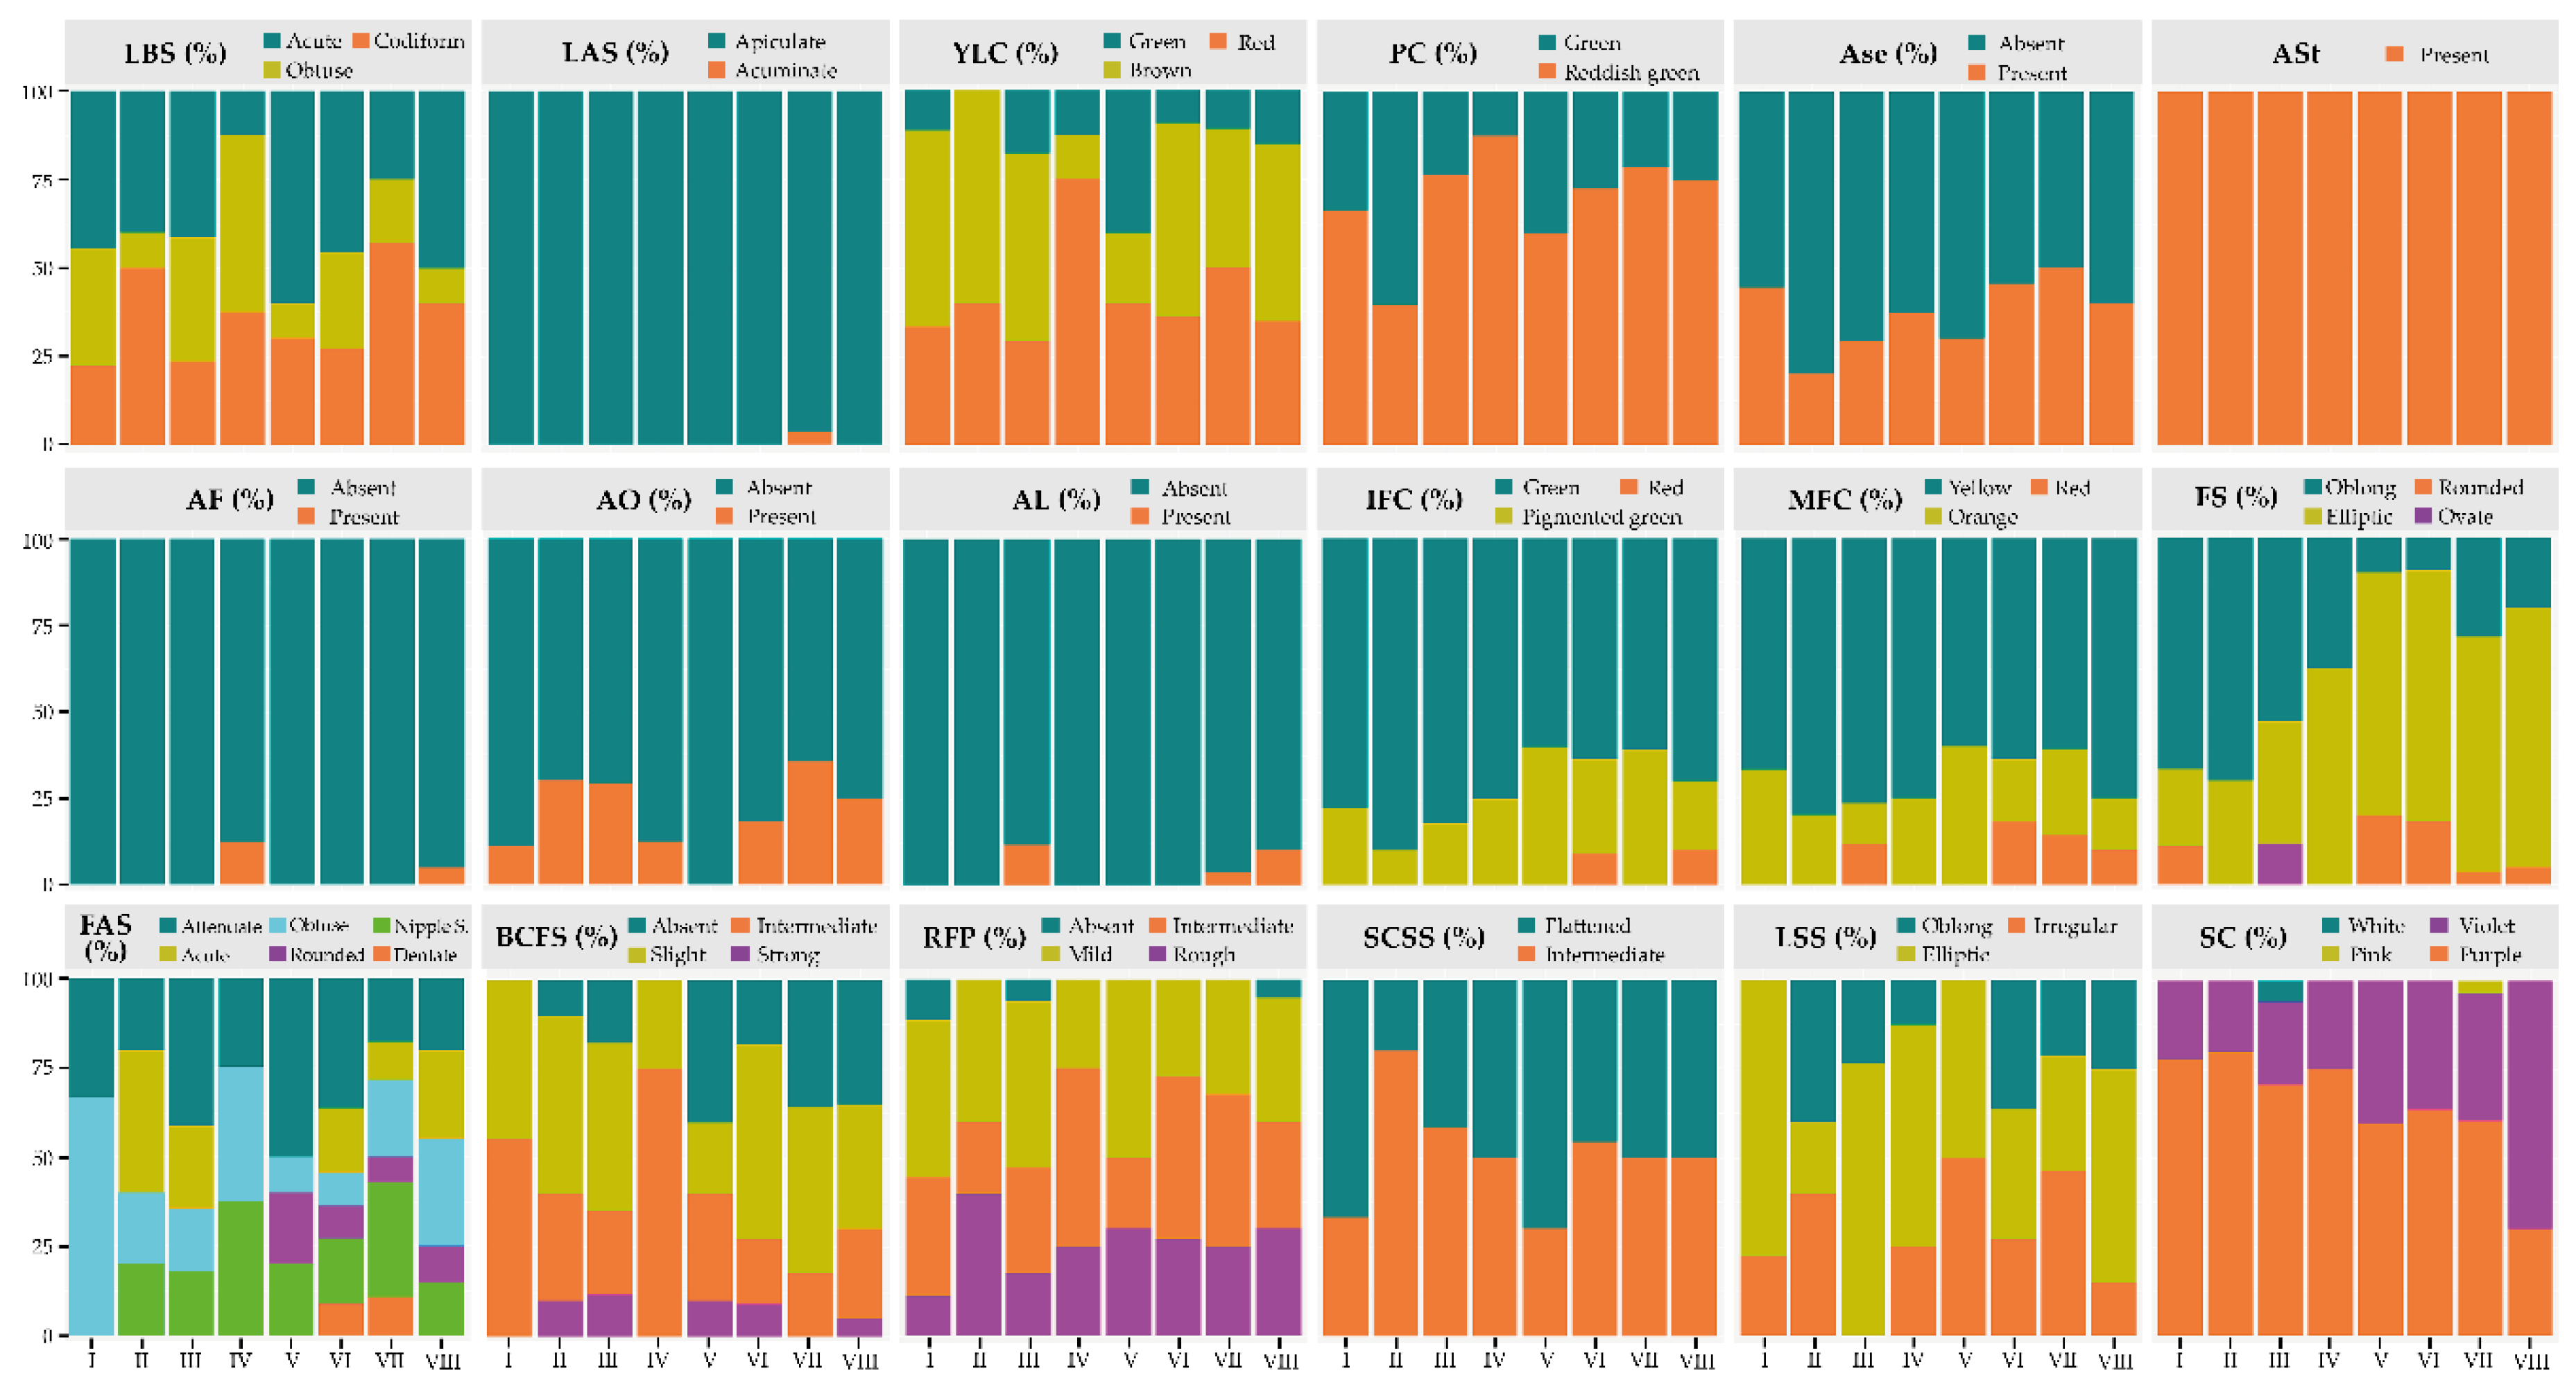
Qualitative characters were grouped into distinct categories according to the phenotypic variability detected, adjusting the number of classes to the specificity of each morphotype. This approach allowed for an orderly characterization of the diversity, revealing both frequent traits and others with uncommon occurrence within the evaluated set (Figure 5 and Figure 6).
Among the 113 accessions assessed, a clear predominance of the apiculate leaf apex (LAS) was observed, present in 112 accessions. Regarding the leaf base (LBS), an even distribution was recorded between acute and codiform shapes (n = 44 each), while the obtuse shape was less frequent (n = 25). Concerning the color of the young leaf (YLC), brown (n = 50) predominated, followed by red (n = 47), both being more represented than green (n = 16).
In floral structures, most accessions exhibited a petiole (PC) with a reddish green hue (n = 81), in contrast to a smaller number that displayed a green hue (n = 32). Regarding anthocyanin presence, variation was observed across different floral organs in the collection: Ase (n = 44), AF (n = 2), AO (n = 27), and AL (n = 5). However, in the case of staminodes (ASt), all evaluated accessions (n = 113) exhibited anthocyanin pigmentation, suggesting a possible genetic fixation of this character.
For fruit descriptors, the majority of accessions exhibited a green immature fruit color (IFC; n = 80), followed by less frequent pigmented tones (n = 30). At maturity (MFC), yellow coloration predominated (n = 78), whereas orange (n = 25) and red (n = 10) were less common. Concerning FS, elliptical (n = 65) and oblong (n = 39) fruits prevailed, while rounded (n = 7) and ovate (n = 2) forms were rare. Regarding RFP, most accessions displayed mild (n = 42), intermediate (n = 39), or rough (n = 29) rugosity.
With regard to seed traits, the cross-section shape (SCSS) was almost evenly distributed between flattened (n = 55) and intermediate (n = 58) categories, while the longitudinal shape (LSS) was predominantly elliptical (n = 57). For SC, purple (n = 69) and violet (n = 42) were the most frequent, whereas white and pink categories were uncommon (n = 1 each), suggesting a possible recessive character or low phenotypic expression within the evaluated collection.
3.6. Structural Organization of Germplasm
Hierarchical cluster analysis, based on 33 agromorphological descriptors, enabled the identification of eight phenotypically differentiated groups (Figure S3), represented by distinctive colors along the rows (Figure 7), which correspond to different accessions within the studied germplasm.
A heterogeneous distribution among groups was observed (Table S2), with Group VII containing the largest proportion of accessions (24.78%), followed by Group VIII (17.70%) and Group III (15.04%), demonstrating a higher phenotypic representativeness within these clusters. In contrast, Group IV showed the lowest representativeness (7.08%), whereas Groups II and V shared an equivalent proportion (8.85%). Interestingly, according to the collection sites (Figure 1), accessions within each group were revealed to originate from diverse altitudinal ranges. This suggests that the clustering structure is predominantly driven by intrinsic variability, attributable to the genotype of each accession.
3.7. Structural Analysis for Quantitative Descriptors
The clustering pattern showed that the agromorphological attributes of interest are heterogeneously distributed across the clusters, reflecting structural diversity among accessions with agronomic potential (Table 3).
For floral descriptors, cluster I exhibited the highest mean values for petal length (PL = 5.00 mm) and style length (StL = 7.58 mm), indicating a more pronounced floral development. However, group V stood out by including accessions with the greatest average ovary length (OL = 2.03 mm). Regarding fruit descriptors, Cluster II notably excelled, recording the highest average values for firmness (SH = 0.43 MPa), mass (FM = 1267.08 g), length (FrL = 23.52 cm), width (FW = 11.28 cm), and pericarp mass (PM = 972.28 g), suggesting enhanced structural and productive development of fruits in this group.
Concerning seed descriptors, Cluster VIII presented the highest values for seed index (SI = 1.53 g), seed diameter (SD = 15.16 mm), and seed thickness (ST = 10.20 mm), which could suggest greater structural development of the bean. On the other hand, accessions from Cluster III were notable for their prolificacy, with the highest number of seeds per locule (NSL = 9.09), seeds per fruit (NSF = 46.02), and number of intact seeds (NIS = 41.95), along with the greatest seed mass per fruit (FSMF = 180.45 g). For the EI, Cluster VIII registered the most prominent value (18.82), reflecting a more favorable ratio between seed mass and fruit mass in these accessions.
3.8. Structural Analysis for Qualitative Descriptors
Frequency analysis revealed marked variation in morphological patterns among the accessions of the eight phenotypic groups (Figure 9; Table S3). For leaf descriptors, considerable variability was observed in LBS. Accessions in Cluster V predominantly exhibited an acute base (60%), while Cluster IV showed a higher proportion with an obtuse base (50%). Conversely, Cluster VII stood out for its high frequency of accessions with codiform shape (57.14%) and was the only group presenting acuminate apices (LAS; 3.57%).
With respect to floral descriptors, PC showed that only accessions in Cluster II displayed a high frequency of green color (60%), whereas in the remaining groups, reddish green predominated, exceeding 60%. The presence of anthocyanins in sepals was low across all groups recorded in less than 50% of accessions, while in staminodes (ASt), anthocyanins were consistently present in 100% of grouped accessions. Regarding the ovary, accessions in Cluster V were characterized by a complete absence of anthocyanins (100%).
For IFC, accessions in Cluster III predominantly displayed green (82.35%) and pigmented green (17.65%) colors. At physiological maturity (MFC), 11.76% of these accessions developed a red coloration, a pattern also observed in Cluster VII, albeit in variable proportions. Regarding FS, Cluster II and IV exclusively exhibited oblong and elliptical fruits, whereas Cluster III included 11.76% of accessions with ovate fruits. Concerning roughness of the fruit peel (RFP), this trait was absent in Cluster I (11.11%), III (5.88%), and VIII (5%). Nevertheless, Cluster II stood out for having the highest proportion of accessions with rough pericarps (40%).
In the seed descriptors, SCSS showed clear differences among clusters. In Cluster II, 80% of accessions exhibited an intermediate shape and 20% a flattened form; by contrast, Cluster V was characterized by a higher proportion of flattened seeds (70%). With respect to seed SC, only Cluster III contained accessions with white seeds (5.88%) and Cluster VII with pink seeds (3.57%), while violet and purple colorations predominated in varying proportions across the remaining groups.
Figure 8.
Frequency distribution of qualitative descriptors among clusters.
3.9. Selection of Promising Accessions
The scatter diagram (Figure 9, Table S4) illustrates the combined selection of accessions using the BYSI index, simultaneously considering two discriminant descriptors closely linked to prolificity attributes due to their level of correlation with traits associated with yield potential. Superior accessions were identified as those exceeding 0.8 g in seed index (SI) and presenting an ear index (EI) below 23, located in quadrants II and III of the Cartesian plane.
Figure 9.
Bivariate distribution and multigroup selection diagram of promising plants in the germplasm of 113 cacao accessions.
Figure 9.
Bivariate distribution and multigroup selection diagram of promising plants in the germplasm of 113 cacao accessions.
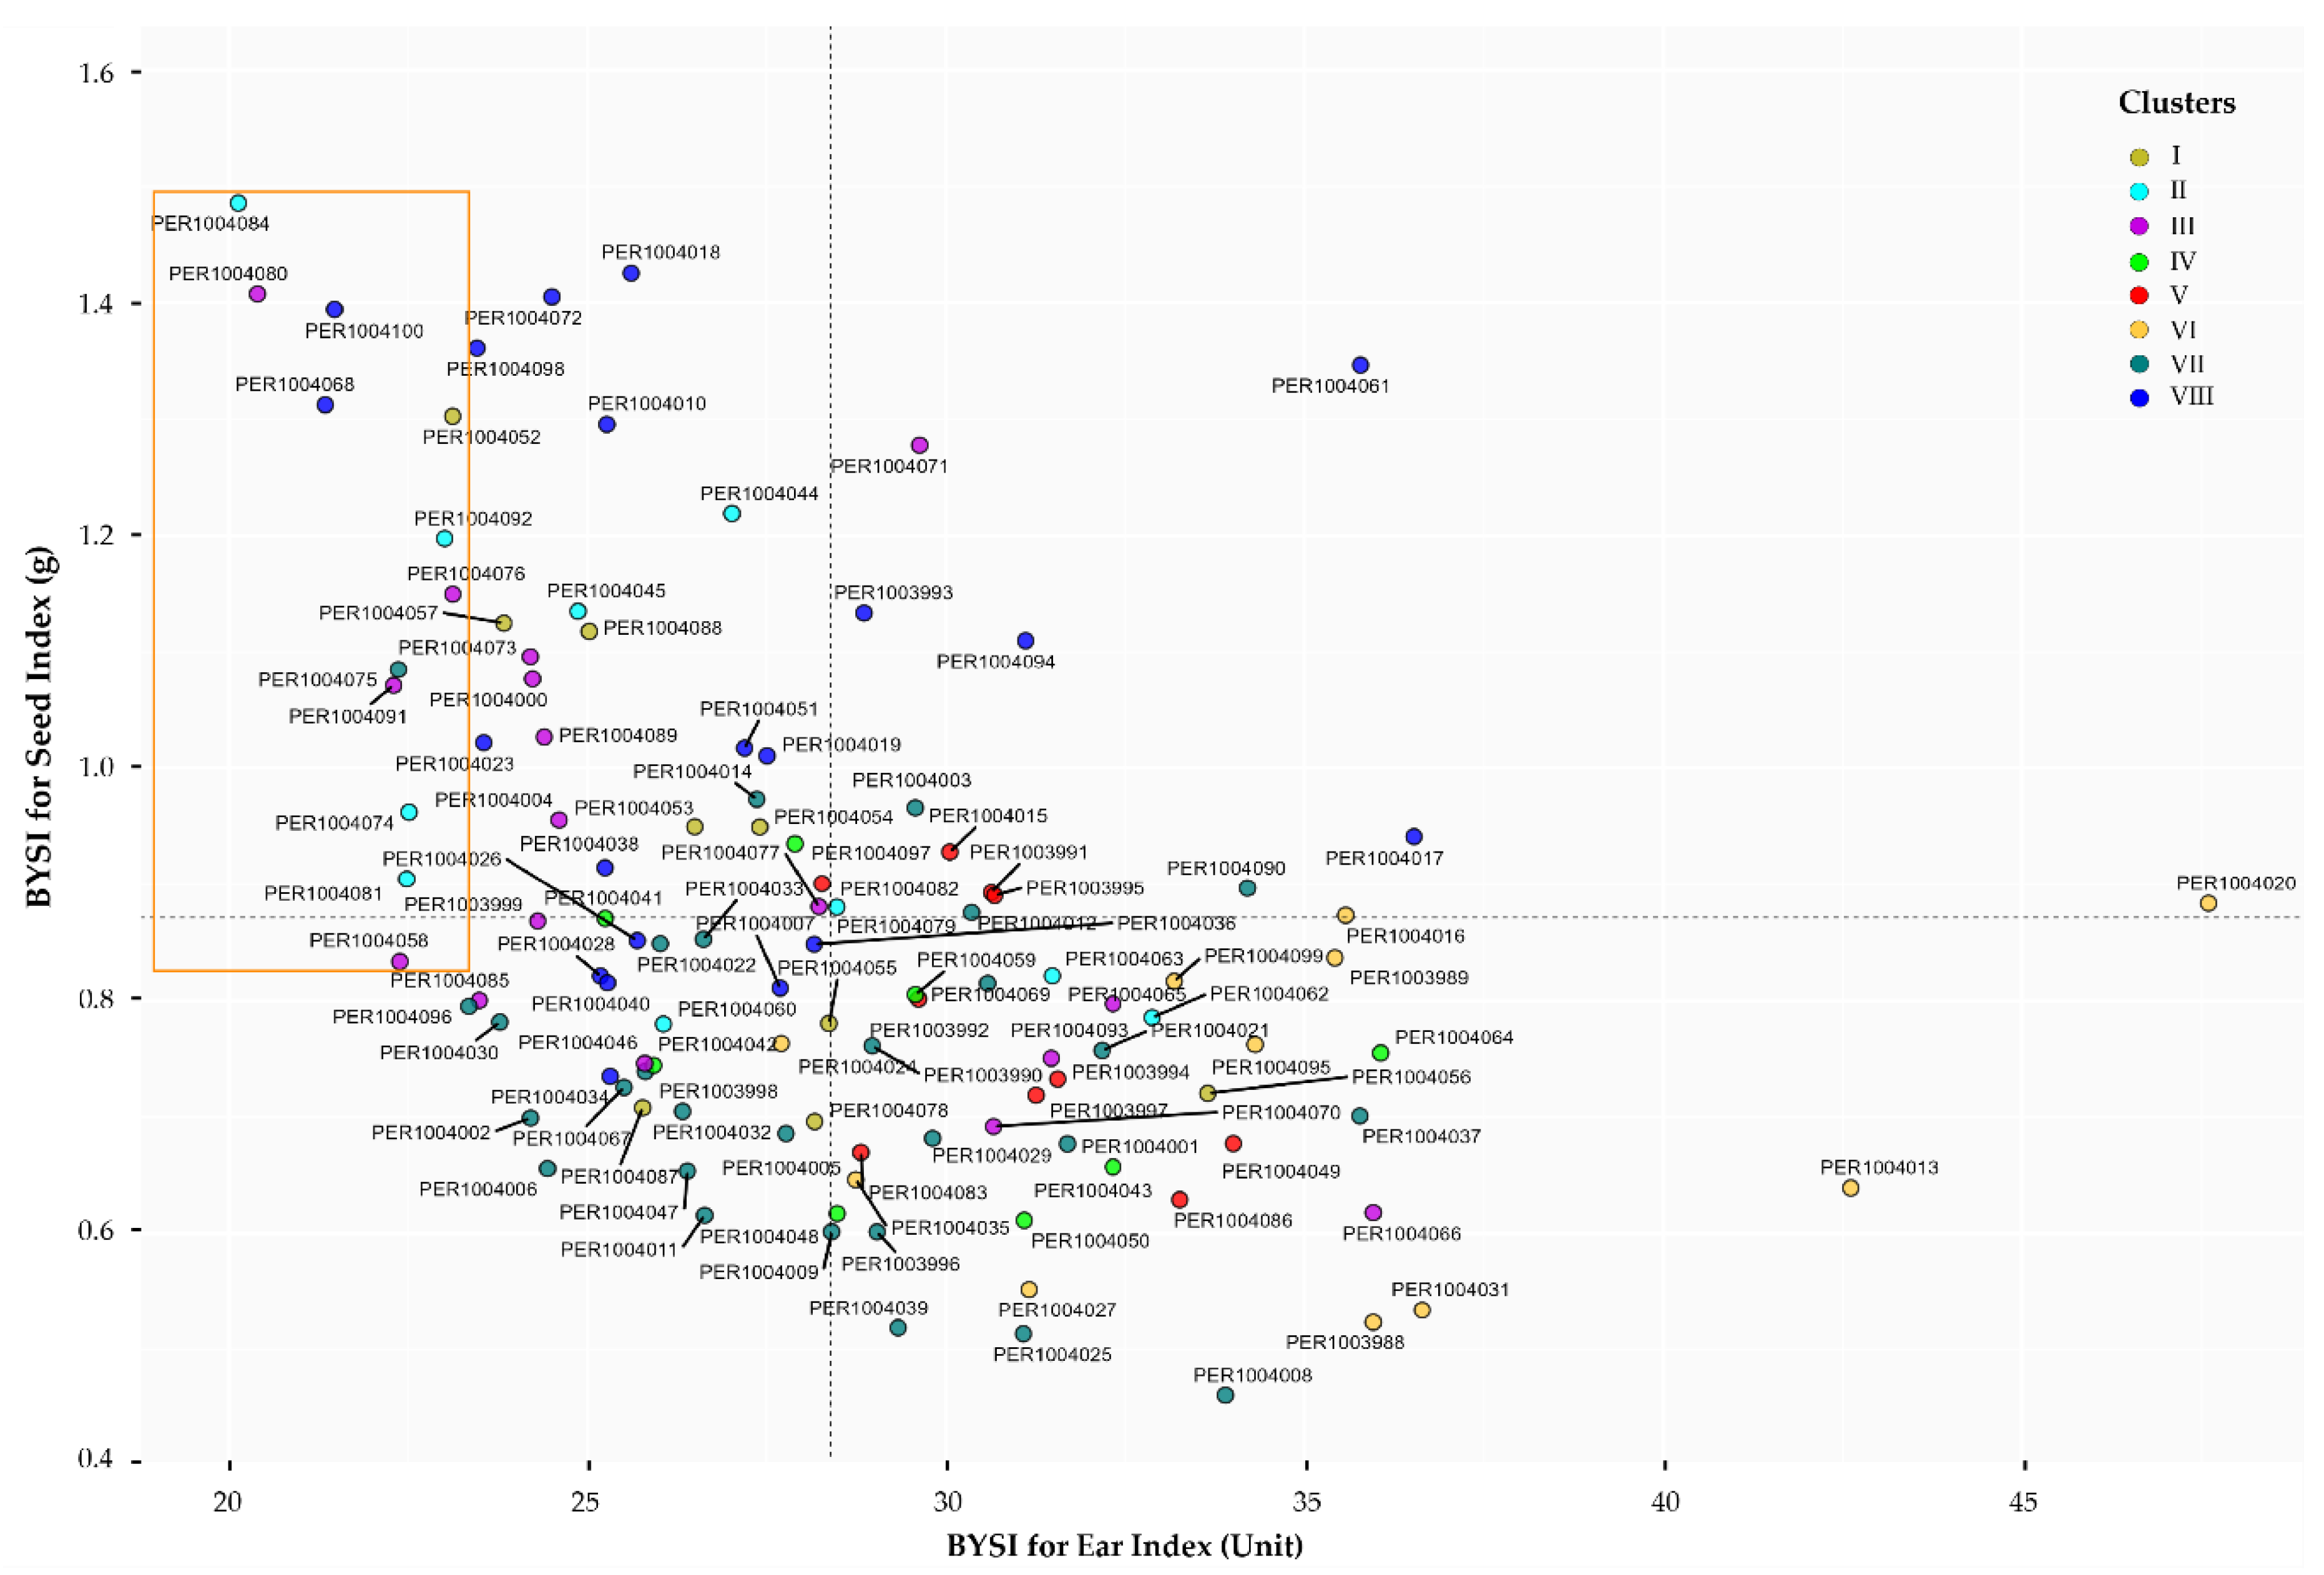
Based on the selection diagram, 12 accessions with high potential were identified (Table S4), representing 10.62% of the characterized germplasm and distributed across different districts in the province of Bagua and Utcubamba (Table S1). Among these, accessions PER1004084 and PER1004080 stood out, demonstrating a higher average dry seed mass (>1.4 g) and requiring only 21 fruits to yield 1 kg of dry seeds (EI).
Conversely, PER1004018, although also exhibiting seeds with high dry mass, required more than 25 fruits to produce 1 kg of dry seeds. Moreover, it was shown that the desired traits are distributed across different phenotypic groups, suggesting that yield potential is not restricted to a single group but rather distributed throughout the diversity of the evaluated accessions.
The characterization of the germplasm under a permanent environment across two consecutive seasons revealed moderate to high repeatability values (r̂ > 0.40) for both discriminant descriptors (Table S5). These results highlight that these traits possess intermediate to high heritability magnitude, supporting their reliability for characterization and selection in genetic improvement programs.
3.10. Phytochemical Profile of Selected Cacao Cotyledons
The analysis of bioactive compound content (Figure 10a and Table S6) revealed that among the 15 accessions evaluated, PER1004092 exhibited the highest theobromine content (25.34 ± 0.50 mg/g), whereas PER1004082 had the highest caffeine concentration (5.76 ± 0.22 mg/g). PER1004091 was notable for its epicatechin content (26.98 ± 0.26 mg/g), while catechin was absent in 7 of the 15 accessions studied.
Figure 10b illustrates a heterogeneous genetic structure, with two accessions (PER1004074 and PER1004091) clustering within the Criollo genetic group and the majority (10 of 15) grouping within the Forastero clade. This clade integrates accessions with phenotypic profiles corresponding to the distinct groups defined in this study.
The highest antioxidant and total polyphenol contents were found in accessions PER1004091/PER1004068 and PER1004084/PER1004092, respectively (Figure 10c-d and Table S6). Conversely, Figure 10e reveals a chromatic shift toward reddish–yellowish tones, as indicated by the clustering of lyophilized cotyledons within the positive quadrant of the a* and b* axes in the CIELAB space, albeit with varying intensities.
Figure 10f displays the normalized FTIR spectra of lyophilized cotyledons from 15 accessions, revealing a high degree of spectral similarity and the presence of characteristic bands associated with functional groups such as hydroxyl (O–H), hydrocarbons (C–H), carbonyls (C=O), aromatics and alkenes (C=C), esters, and carbohydrates (C–O). These results underscore the functional potential of the analyzed accessions as fine-flavor cacao.
The Pearson correlation network among phytochemical compounds (Figure 10g and Table S7) reflects significant associations, highlighting strong positive correlations between cyanidin 3-O-glucoside and caffeine (r = 0.86***), as well as between TPC and theobromine (r = 0.95***). Additional positive correlations were observed among epicatechin, color coordinates (a* and b*), and pH, as well as between TA and color. In contrast, strong negative correlations were detected between TPC and color b* (r = –0.92***), and between caffeic acid and caffeine (r = –0.83***).
4. Discussion
4.1. Ex Situ Germplasm Collection Management
The establishment of a germplasm bank of fine-flavor native cacao in the Amazon region of northeastern Peru represents a strategic action to safeguard genetic diversity and enhance its utilization in breeding programs aimed at benefiting future generations. This region, recognized as one of the centers of origin of cacao, harbors genotypes of high agronomic and commercial value, characterized by their potential for producing functional chocolates, their reduced cadmium uptake and translocation, and their high yield potential associated with significant disease tolerance [33,54]. These opportunities, embedded within the variability of the native Amazonian cacao genetic resources, constitute a valuable source of adaptive alleles that can be exploited to optimize crop productivity and climate resilience.
In the Amazonas region, recent scientific advances have clarified the intraspecific relationships of fine-flavor cacao, revealing a considerable proportion of heterozygous genotypes and a reduced presence of homozygous individuals among accessions from the provinces of Bagua and Utcubamba [55]. This evidence supports the high phenotypic diversity documented in the present germplasm collection, which is of particular relevance since its integration with advanced biotechnological tools offers a promising scenario for the genetic improvement of cacao in Peru. In this regard, the incorporation of approaches such as CRISPR-Cas9 based genome editing, applied to the differentiation of fine-flavor and bulk cacao, together with the use of multi-omics platforms, could substantially accelerate the introgression of desirable phenotypic and sensory interest, thereby enhancing cacao genetic improvement processes [56,57,58]. Although the implementation of genomic approaches in developing countries faces technical and infrastructural limitations, cooperation between local institutions and international centers is crucial to overcome these challenges and ensure that scientific advances directly benefit smallholder farmers.
As part of strategies for the conservation and the responsible harnessing of terrestrial ecosystems within the framework of the Sustainable Development Goals (SDGs), an ex situ collection of fine-flavor cacao germplasm was successfully established in the Amazonas region with 100% survival, owing to the implementation of standardized grafting techniques and the strategic use of the IMC 67 clone as rootstock. This outcome not only demonstrates the effectiveness of the protocol but also highlights the agronomic qualities of IMC 67, whose robust root system and tolerance to soil-borne pathogens likely facilitated efficient nutrient uptake without significantly altering the physical and organoleptic attributes of the scion's fruits [59,60]. Despite its narrow genetic base, the IMC 67 clone has consistently shown outstanding performance and high efficiency across various regions of the country, establishing itself as a reliable rootstock for clonal propagation and the establishment of germplasm banks. This reinforces its strategic value in conservation and improvement programs for Amazonian cacao [59].
4.2. Phenotyping of Genetic Resources
Understanding the population structure from the center of origin and diversity of cacao is essential to guide conservation strategies and promote the responsible use of native varieties in sustainable production systems [61]. As a perennial, cross-pollinated crop with a diploid genome (2n = 20), cacao exhibits high levels of heterozygosity [62]. This condition implies that crosses between two plants generate offspring with high genetic variability and a non-uniform distribution of traits, thereby ensuring evolutionary survival and providing opportunities for crop improvement [63,64].
The expression of both qualitative and quantitative traits in cacao is strongly conditioned by genotype–environment interactions [65]. In this context, the Amazonas region stands out as a reservoir of diverse ecotypes, whose reproductive attributes reflect the influence of both natural evolutionary processes and human selection [20]. However, while conventional phenotyping is a fundamental starting point for guiding current and future cacao breeding objectives, characterization based solely on external traits, though valuable for exploring existing diversity, has inherent limitations due to its subjective nature and the influence of the evaluator's judgment [66]. These constraints compromise its precision as an identification tool, highlighting the need to integrate genotyping approaches to strengthen the delineation and classification of germplasm collections.
In the evaluated germplasm, leaf characterization allowed the identification of plants with larger leaf area, attributed to both their dimensions and a morphology predominantly defined by an apiculate apex with an acute and cuneate base. These plants also exhibited young leaves with brownish and reddish pigmentation, a distinctive trait in early stages of leaf development. This observed variation is likely related to a complex genetic architecture, attributable to the interaction between determinant genes and multiple loci with polygenic effects, which would explain a multifactorial inheritance pattern linked to adaptive mechanisms and the expression of a higher diversity index [67,68]. Collectively, these findings are supported by recent studies confirming that the notable phenotypic variability of cacao is the product of cumulative influence derived from prolonged processes of natural selection and human management practices historically applied in various microenvironments of the Amazon [59,69].
Cauliflory constitutes the main distinguishing feature of the cacao flowering pattern, defined by the emergence of protandrous flowers directly from the trunk and primary branches, organized into structures known as floral cushions [65,70]. In the evaluated germplasm, the notable morphological variability at the floral level constitutes a distinctive trait of high value for its characterization and conservation. This diversity is influenced by the interaction between the genotype and the position of the flower on the plant, factors that determine both its morphology and frequency of occurrence [71]. In this regard, previous research has shown that anthocyanin pigmentation in floral organs such as the pedicel, staminodes, and ligule are the traits with the highest discriminatory power among accessions in a cacao germplasm [68,72].
In the studied germplasm, anthocyanins were found to be universally present in the staminodes, with over 80 accessions exhibiting anthocyanins in the filament, ovary, and ligule. This pigmentation pattern occurs exclusively in materials from the Upper Amazon of national origin [73]. The manifestation of this pigmentation could be explained as the result of the integral interaction between floral morphogenetic traits and the selective pressure exerted by specific pollinators [74]. Furthermore, the agromorphological variation of the flowers could be modulated or stabilized through the strategic use of rootstocks, given their significant effect on the scion's phenotypic expression. This influence would help reduce variability in floral characteristics, thereby promoting greater stability in the productive yield of certain accessions [71,75].
Fruits displayed pronounced heterogeneity in both shape and coloration across accessions throughout their development and ripening stages. Among these, fruits with thicker pericarps stand out for presenting a lower incidence of Phytophthora palmivora, whereas rougher surfaces were linked to greater susceptibility to the pathogen [76]. Similarly, fruits with an attenuated apex have been reported to have less water accumulation and retention on their surface compared to fruits with an obtuse or rounded apex [77]. These structural characteristics constitute a relevant indicator for differentiating accessions tolerant or susceptible to Phytophthora species, underscoring the importance of implementing comprehensive conservation and characterization strategies to broaden the genetic base of cacao and strengthen its agronomic attributes [78,79]. These findings highlight that the phenotypic diversity documented in the evaluated collection constitutes a strategic resource for developing resilient varieties through targeted breeding strategies adapted to specific phytosanitary conditions.
Quantitative descriptors of fruit traits in the collection revealed high heritability values (>60%) and genotypic coefficients of variation exceeding 15%, suggesting a predominant genetic influence on phenotypic expression of these traits. This implies that the observed variability is largely determined by genetic factors, with lower environmental influence [80]. In this context, accessions were identified that stood out for presenting higher averages in fruit length (19.54 cm) and width (9.85 cm), exceeding the average values of 16.21 cm and 8.38 cm, respectively, observed in a total of 140 native cacao accessions collected in the Loreto region, Peru [59].
The morphological variability of cacao seeds may be associated with the xenia effect, a phenomenon in which pollen from other trees influences attributes such as almond size and coloration, resulting in fruits with uniform or mixed grain colors [81]. Nevertheless, it is recognized that white seed coloration is characteristic of accessions belonging to the Criollo type and some Trinitarios, while purple pigmentation is predominant in Forastero-type materials [65,82,83]. On the other hand, the presence of accessions with oblong fruits has been associated with more uniform fermentation during postharvest handling compared to oval or elliptical seeds, which positively influences the development of the flavor profile [84].
Regarding the quantitative traits of the seeds, the evaluated collection presented an average ear index value of 20.57, which falls within the range considered optimal for selecting trees that produce seeds with a mass greater than 1 g [30]. This attribute is associated with a higher fat content and a lower shell proportion, factors that contribute positively to crop productivity and quality [85,86]. However, the number of seeds per fruit is largely determined by the number of ovules present in the ovary, as well as the effectiveness of the pollination process [87]. Therefore, the synergistic evaluation of the ear index with the seed index constitutes highly heritable and decisive factors for discerning promising accessions with an emphasis on higher production [17,85,88].
The distinctiveness of Peruvian fine-flavor cacao has been supported by genetic matching studies, which revealed distinctive multilocus profiles among accessions collected in the Amazonas region, suggesting possible differentiation between genetic groups for the different provinces of the region [61]. In this study, multivariate analyses allowed the identification of eight well-defined phenotypic groups, supporting the hypothesis of a heritable genetic basis associated with the observed morphological characters. This structure aligns with previous research highlighting the usefulness of agromorphological traits as indirect tools for inferring patterns of genetic diversity among cacao populations [73].
Recent research conducted in the Amazonas and Loreto regions in northeastern Peru has identified five genetic groups across collections of 146 and 140 accessions, respectively, albeit with their own morphological differences [6,59], suggesting greater genetic diversity when accessions from different altitudinal gradients are included [61]. Nevertheless, morphological variability documented for the same clone across regions underscores the need to standardize phenotypic criteria used and to further investigate whether such differences represent new genetic lineages, subpopulations, or closely related clades [17]. In this regard, it is emphasized that belonging to a phenotypic group does not necessarily imply the possession of superior agronomic attributes, underscoring the need to evaluate each accession individually throughout its production cycle under diverse environmental conditions to guide its conservation and utilization appropriately.
4.3. Phytochemical Profile of Fine-Flavor Cacao
Cacao almonds are a natural source of methylxanthines, phenolic compounds, and antioxidants, whose moderate consumption enhances physiological functions, alleviates stress, and promotes well-being beyond their nutritional value. However, elevated concentrations of methylxanthines intensify bitterness and astringency, partially masking fruity, sweet, and caramel notes that are differently appreciated by consumers based on their preferred sensory profile of cacao [89,90]. Furthermore, the high postharvest stability, bioavailability, and rapid excretion of methylxanthines underpin their functional efficacy, as evidenced by their direct correlation with metabolites in biological fluids [36,91]. This attribute highlights the promising accessions from the studied collection as consistent sources of bioactive compounds, positioning them strategically within the global cocoa market.
The theobromine/caffeine ratio is a phytochemical marker traditionally used for the genetic differentiation of cocoa into the Criollo, Trinitario, and Forastero groups. Criollo cocoas exhibit values < 2, Trinitario types range between 2–9, and Forastero display values > 9 [92]. It is recognized that ratios < 2 are typically associated with fine-flavor Criollo genotypes, whereas values > 9 are linked to sensory profiles characteristic of bulk cacao [93]. Nevertheless, recent evidence, consistent with our findings, highlights the potential of Forastero genotypes for fine-flavor cacao production [94], thereby redefining the traditional paradigm that restricted this category exclusively to Criollo varieties.
Fine-flavor cacao is also associated with high concentrations of catechin and epicatechin. In this regard, recent studies conducted in the province of Utcubamba (Amazonas) reported only 0.20 mg/g of catechin and 0.50 mg/g of epicatechin [33], amounts markedly lower than the 4.10 mg/g and 7.66 mg/g recorded in the PER1004023 accession from the studied collection. Nonetheless, the fermentation process, shaped by fungi such as Candida and Aspergillus [95], coupled with Maillard reactions and Strecker degradation during drying and roasting, substantially reduce bioactive compounds while simultaneously promoting the formation of aromatic molecules through the interaction of carbonyl and nitrogenous compounds [84]. This balance underscores the importance of selecting accessions with a high capacity to synthesize these metabolites.
FTIR analysis of cacao almonds revealed characteristic signals of phenols (3562–3322 cm⁻¹, O–H) and aromatic compounds (2925–2854 cm⁻¹, C–H). Consistent with our findings, other authors have reported the presence of these same functional groups in processed almonds [96,97], confirming the persistence of functional groups associated with their antioxidant capacity. Additionally, the peaks between 1750 and 1625 cm⁻¹ detected in our study correspond to characteristic stretches of carboxylic acids and aldehydes (C=O), fatty acids (C=C), and proteins (C=O), as reported for Ecuadorian cocoa [98]. The same report associates the signal at 1510 cm⁻¹ with phenols [98], the 1726 cm⁻¹ peak to ester carbonyl groups [99] and the signal at 3302 cm⁻¹ with alcohols and amines present in compounds such as serotonin. In agreement with our contributions, recent evidence confirms that cacao concentrates key functional groups within the 4000–1500 cm⁻¹ range, representing a significant advancement in the characterization of fine-flavor cacao [100].
5. Conclusions
This study describes the successful establishment and detailed characterization of a fine-flavor cacao germplasm collection in the Amazonas region of Peru, whose sustained survival for nearly a decade demonstrates the remarkable adaptability and physiological compatibility between the selected rootstocks and scions.
The broad phenotypic variability and high heritability observed in this collection enabled its classification into eight clearly differentiated groups, consolidating it as a strategic and high-value resource for research aimed at cacao genetic improvement. This potential is further reinforced by the significant differences detected in the phytochemical profiles of promising accessions, which displayed elevated bioactive potential, as determined through complementary HPLC and FTIR analyses. Collectively, these findings position the collection as a critical reservoir of agromorphological diversity, essential for the development of high-yielding and functionally superior genotypes, with direct applications in conservation and breeding programs.
While this study provides valuable evidence of the phenotypic diversity of cacao, certain limitations should be acknowledged. The notable influence of the genotype by environment interaction on the expression of the evaluated descriptors underscores the importance of validating these findings across a wider diversity of agroecological scenarios to identify consistent and stable patterns of variation. Likewise, expanding the geographical scope of sampling beyond the evaluated provinces could reveal additional reservoirs of adaptive variability. Overcoming these limitations will not only enhance the selection of resilient and productive genotypes but also strengthen conservation strategies, thereby ensuring the sustainability and competitiveness of Amazonian cacao in the face of climate change challenges and the growing demand for products with differentiated quality.
Supplementary Materials
The following supporting information can be downloaded at the website of this paper posted on Preprints.org. Figure S1: Germplasm collection of Theobroma cacao L. a) Labeling of the germplasm, highlighting the installation date and the composition of the collection, which comprises 122 accessions, of which 113 are of national origin and 9 of international provenance (data not shown). b–c) Details of the distribution and successful establishment of cacao trees bearing developing fruits. Figure S2: Distribution histograms of germplasm based on quantitative descriptors. Figure S3: Optimal number of clusters determined using the silhouette method. Table S1: Collection points. Table S2: Eight phenotypic clusters of cacao based on quantitative descriptors. Table S3: Percentage distribution of frequencies for qualitative descriptors. Table S4: BYSI estimation with the 95% highest posterior density interval for agromorphological yield descriptors in 113 cacao accessions. Table S5. Estimation of repeatability and variance components associated with seed and pod index in 113 cacao accessions from Amazonas, Peru. Table S6: Characterization of phytochemical compounds in cacao cotyledons. Table S7: Pearson correlation values for phytochemical compounds in cacao cotyledons.
Author Contributions
JJT-A: Conceptualization, statistical analysis, methodology and writing-original draft; NCV-V: Data curation and funding acquisition, LAM-A: Investigation and methodology, JP-Q: Conceptualization, investigation, and formal analysis, EF: Project administration and supervision. All authors have read and approved the published version of the manuscript.
Funding
This research was supported technically and financially by the investment project (IP) with CUI No. 2480490, entitled “Mejoramiento de los servicios de investigación en la caracterización de los recursos genéticos de la agrobiodiversidad en 17 departamentos del Perú – ProAgrobio”, executed by the Subdirectorate of Genetic Resources of the Directorate of Genetic Resources and Biotechnology at the National Institute of Agricultural Innovation (INIA).
Data Availability Statement
The data supporting the findings of this study will be made available upon reasonable request to the corresponding authors.
Acknowledgement
We extend our sincere gratitude to engineers Roiber Malqui Ramos and Jheiner Vásquez García, as well as to Technicians Royser Jiménez Tarrillo and Jitler Huaman Abad, whose expertise and dedication were crucial for the optimal management of the germplasm collection and the gathering of agromorphological data from the accessions evaluated in this study.
Conflicts of Interest
The authors declare no financial, personal, or professional conflicts of interest that could have influenced the development or presentation of this work.
References
- Boukrouh, S.; Noutfia, A.; Moula, N.; Avril, C.M.; Louvieaux, J.; Hornick, J.L.; et al. Ecological, morpho-agronomical, and bromatological assessment of sorghum ecotypes in Northern Morocco. Sci. Rep. 2023, 13, 15548. [Google Scholar] [CrossRef] [PubMed]
- Kouam, E.B.; Kamga-Fotso, A.M.A.; Anoumaa, M. Exploring agro-morphological profiles of Phaseolus vulgaris germplasm shows manifest diversity and opportunities for genetic improvement. J. Agric. Food Res. 2023, 14, 100772. [Google Scholar] [CrossRef]
- Alverson, W.S.; Whitlock, B.A.; Nyffeler, R.; Bayer, C.; Baum, D.A. Phylogeny of the core Malvales: evidence from ndhF sequence data. Am. J. Bot. 1999, 86, 1474–86. [Google Scholar] [CrossRef] [PubMed]
- Motamayor, J.C; Lanaud, C. Molecular analysis of the origin and domestication of Theobroma cacao L. In Managing plant genetic diversity, Proceedings of an international conference, Kuala Lumpur, Malaysia, 12-16 June 2000; Engels, J.M.M., Ed.; Engels, J.M.M.; Ramanatha Rao; Brown A.H.D.; Jackson M.T.; CABI Publishing: Wallingford UK, 2002; pp. 77–87. [Google Scholar] [CrossRef]
- Zarrillo, S.; Gaikwad, N.; Lanaud, C.; Powis, T.; Viot, C.; Lesur, I. , et al. The use and domestication of Theobroma cacao during the mid-Holocene in the upper Amazon. Nat. Ecol. Evol. [CrossRef]
- Oliva-Cruz, M.; Goñas, M.; Bobadilla, L.G.; Rubio, K.B.; Escobedo-Ocampo, P.; García Rosero, L.M.; et al. Genetic Groups of Fine-Aroma Native Cacao Based on Morphological and Sensory Descriptors in Northeast Peru. Front. Plant Sci. 2022, 13, 896332. [Google Scholar] [CrossRef]
- Oliva-Cruz, M.; Mori-Culqui, P.L.; Caetano, A.C.; Goñas, M.; Vilca-Valqui, NC.; Chavez, S.G. Total Fat Content and Fatty Acid Profile of Fine-Aroma Cocoa From Northeastern Peru. Front. Nutr. 2021, 8, 677000. [Google Scholar] [CrossRef]
- Wickramasuriya, A.M.; Dunwell, J.M. Cacao biotechnology: current status and future prospects. Plant Biotechnol. J. 2018, 16, 4–17. [Google Scholar] [CrossRef]
- Díaz-Valderrama, J.R.; Leiva-Espinoza, S.T.; Aime, M.C. The History of Cacao and Its Diseases in the Americas. Phytopathology. 2020, 110, 1604–19. [Google Scholar] [CrossRef]
- Zhang, D.; Martínez, W.J.; Johnson, E.S.; Somarriba, E.; Phillips-Mora, W.; Astorga, C.; et al. Genetic diversity and spatial structure in a new distinct Theobroma cacao L. population in Bolivia. Genet. Resour. Crop Evol. 2012, 59, 239–252. [Google Scholar] [CrossRef]
- Motamayor, J.C.; Lachenaud, P.; Mota, J.W.S.; Loor, R.; Kuhn, D.N.; Brown, J.S.; et al. Geographic and Genetic Population Differentiation of the Amazonian Chocolate Tree (Theobroma cacao L). PLoS ONE. 2008, 3, e3311. [Google Scholar] [CrossRef]
- Thomas, E.; Zonneveld, M.V.; Loo, J.; Hodgkin, T.; Galluzzi, G.; Etten, J.V. Present Spatial Diversity Patterns of Theobroma cacao L. in the Neotropics Reflect Genetic Differentiation in Pleistocene Refugia Followed by Human-Influenced Dispersal. PLos ONE. 2012, 7, e47676. [Google Scholar] [CrossRef]
- INDECOPI. Denominación de Origen Cacao Amazonas Perú. 2016. Available online: https://www.gob.pe/institucion/indecopi/informes-publicaciones/5227603-denominacion-de-origen-cacao-amazonas-peru-2016 (accessed on 17 July 2025).
- ICCO. Panel recognizes 23 countries as fine and flavour cocoa exporters. 2016. Available online: https://www.icco.org/icco-panel-recognizes-23-countries-as-fine-and-flavour-cocoa-exporters/ (accessed on 17 July 2025).
- Pridmore, R.D.; Crouzillat, D.; Walker, C.; Foley, S.; Zink, R.; Zwahlen, M.C.; et al. Genomics, molecular genetics and the food industry. J. Biotechnol. 2000, 78, 251–8. [Google Scholar] [CrossRef]
- González Castro, J.B.; Torres Armas, E.A. Caracterización de productores en la cadena de valor del cacao fino de aroma de Amazonas. Universidad San Pedro. 2018, 1. [Google Scholar]
- Doaré, F.; Ribeyre, F.; Cilas, C. Genetic and environmental links between traits of cocoa beans and pods clarify the phenotyping processes to be implemented. Sci. Rep. 2020, 10, 9888. [Google Scholar] [CrossRef]
- Ramanatha Rao, V.; Hodgkin, T. Genetic diversity and conservation and utilization of plant genetic resources. Plant Cell Tiss Organ Cult. 2002, 68, 1–19. [Google Scholar] [CrossRef]
- Adenuga, O.O.; Ariyo, O.J. Diversity Analysis of Cacao (Theobroma Cacao) Genotypes in Nigeria Based on Juvenile Phenotypic Plant Traits. Int. J. Fruit Sci. 2020, 20, S1348–1359. [Google Scholar] [CrossRef]
- Oliva-Cruz, M.; Goñas, M.; García, L.M.; Rabanal-Oyarse, R.; Alvarado-Chuqui, C.; Escobedo-Ocampo, P.; et al. Phenotypic Characterization of Fine-Aroma Cocoa from Northeastern Peru. Int. J. Agron. 2021, 2021, 2909909. [Google Scholar] [CrossRef]
- Ibrahim Bio Yerima, A.R.; Achigan-Dako, E.G.; Aissata, M.; Sekloka, E.; Billot, C.; Adje, C.O.A.; et al. Agromorphological Characterization Revealed Three Phenotypic Groups in a Region-Wide Germplasm of Fonio (Digitaria exilis (Kippist) Stapf) from West Africa. Agronomy. 2020, 10, 1653. [Google Scholar] [CrossRef]
- Paredes-Espinosa, R.; Gutiérrez-Reynoso, D.L.; Atoche-Garay, D.; Mansilla-Córdova, P.J.; Abad-Romaní, Y.; Girón-Aguilar, C.; et al. Agro-morphological characterization and diversity analysis of Coffea arabica germplasm collection from INIA, Peru. Crop Sci. 2023, 63, 2877–93. [Google Scholar] [CrossRef]
- Yeshitila, M.; Gedebo, A.; Tesfaye, B.; Degu, H.D. Agro-morphological genetic diversity assessment of Amaranthus genotypes from Ethiopia based on qualitative traits. CABI Agric. Biosci. 2024, 5, 95. [Google Scholar] [CrossRef]
- Baudoin Wouokoue, T.J.; Fouelefack, F.R.; Leticia Liejip, N.C.; Biakdjolbo, W.E.; Mafouo, T.E.; Morphoagronomic and Phenological Characteristics of Roselle (Hibiscus sabdariffa L. ) Grown in Sudano-Sahelian Zone of Cameroon. Int. J. Agron. 2025, 2025, 5568972. [Google Scholar] [CrossRef]
- Hachef, A.; Bourguiba, H.; Cherif, E.; Ivorra, S.; Terral, J.F.; Zehdi-Azouzi, S. Agro-morphological traits assessment of Tunisian male date palms (Phœnix dactylifera L.) for preservation and sustainable utilization of local germplasm. Saudi J. Biol. Sci. 2023, 30, 103574. [Google Scholar] [CrossRef]
- Virga, G.; Licata, M.; Consentino, B.B.; Tuttolomondo, T.; Sabatino, L.; Leto, C.; et al. Agro-Morphological Characterization of Sicilian Chili Pepper Accessions for Ornamental Purposes. Plants. 2020, 9, 1400. [Google Scholar] [CrossRef] [PubMed]
- Bekele, F.; Butler, D.R. Proposed short list of cocoa descriptors for characterization. In Working Procedures for Cocoa Germplasm Evaluation and Selection, Proceedings of the CFC/ICCO/IPGRI Project Workshop, Montpellier, France, 1–6 February, 1998.
- MIDAGRI. Banco de Germoplasma del Instituto Nacional de Innovación Agraria. 2025. Available online: https://genebankperu.inia.gob.pe/ (accessed on 28 June 2025).
- MINAM. Servicio Nacional de Meteorología e Hidrología del Perú - Datos hidrometeorológicos a nivel nacional. 2025. Available online: https://www.senamhi.gob.pe/?&p=estaciones (accessed on 10 June 2025).
- Bekele, F.L.; Bidaisee, G.G.; Singh, H.; Saravanakumar, D.; Morphological characterisation and evaluation of cacao (Theobroma cacao L. ) in Trinidad to facilitate utilisation of Trinitario cacao globally. Genet. Resour. Crop Evol. 2020, 67, 621–43. [Google Scholar] [CrossRef]
- Imán Correa, S.A.; Samanamud Curto, A.F.; Paredes Meneses, C.; Chuquizuta Del Castillo, B.; Arévalo Pinedo, M.T. Descriptores para cacao, Lima, Perú. 2024. Available online: https://hdl.handle.net/20.500.12955/2457 (accessed on 18 August 2025).
- Compañía Nacional de Chocolates, S.A.S.; Protocolo para la caracterización morfológica de árboles élite de cacao (Teobroma cacao L.), Medellín, Colombia. 2018. Available online: http://chrome-extension://efaidnbmnnnibpcajpcglclefindmkaj/https://chocolates.com.co/wp-content/uploads/2024/02/Cartilla_Protocolo_Cacao_dic20_VFF.pdf (accessed on 19 August 2025).
- Cortez, D.; Flores, M.; Calampa, LL.; Oliva-Cruz, M.; Goñas, M.; Meléndez-Mori, J.B.; et al. From the seed to the cocoa liquor: Traceability of bioactive compounds during the postharvest process of cocoa in Amazonas-Peru. Microchem. J. 2024, 201, 110607. [Google Scholar] [CrossRef]
- Brand-Williams, W.; Cuvelier, M.E.; Berset, C. Use of a free radical method to evaluate antioxidant activity. LWT-Food Sci. Technol. 1995, 28, 25–30. [Google Scholar] [CrossRef]
- Singleton, V.L.; Rossi, J.A. Colorimetry of Total Phenolics with Phosphomolybdic-Phosphotungstic Acid Reagents. Am. J. Enol. Vitic. 1965, 16, 144–58. [Google Scholar] [CrossRef]
- Cortez, D.; Quispe-Sanchez, L.; Mestanza, M.; Oliva-Cruz, M.; Yoplac, I.; Torres, C.; et al. Changes in bioactive compounds during fermentation of cocoa (Theobroma cacao) harvested in Amazonas-Peru. Curr. Res. Food Sci. 2023, 6, 100494. [Google Scholar] [CrossRef]
- R Core Team. R Foundation for Statistical Computing. Viena R: A language and environment for statistical computing. 2024. Available online: https://www.r-project.org/ (accessed on 11 August 2025).
- Komsta, L. Outliers: Tests for Outliers. 2022. Available online: https://cran.r-project.org/web/packages/outliers/index.html (accessed on 11 August 2025).
- Comtois, D. summarytools: Tools to Quickly and Neatly Summarize Data. 2025. Available online: https://cran.r-project.org/web/packages/summarytools/index.html (accessed on 11 August 2025).
- Wickham, H. ggplot2: Elegant Graphics for Data Analysis. 2016. Available online: https://ggplot2.tidyverse.org/index.html (accessed on 11 August 2025).
- Popat, R.; Patel, R.; Parmar, D. variability: Genetic Variability Analysis for Plant Breeding Research. 2020. Available online: https://cran.r-project.org/web/packages/variability/index.html (accessed on 11 August 2025).
- Harrell, F.E.Jr. Hmisc: Harrell Miscellaneous. 2025. Available online: https://cran.r-project.org/web/packages/Hmisc/index.html (accessed on 11 August 2025).
- Wei, T.; Simko, V.; Levy, M.; Xie, Y.; Jin, Y.; Zemla, J.; et al. corrplot: Visualization of a Correlation Matrix. 2024. Available online: https://cran.r-project.org/web/packages/corrplot/index.html (accessed on 11 August 2025).
- Maechler, M.; Rousseeuw, P.; Hubert, M.; Hornik, K.; Schubert, E. cluster: ''Finding Groups in Data'': Cluster Analysis Extended Rousseeuw et al. Available online: https://cran.r-project.org/web/packages/cluster/index.html (accessed on 11 August 2025).
- Kassambara, A.; Mundt, F. factoextra: Extract and Visualize the Results of Multivariate Data Analyses. 2020. Available online: https://cran.r-project.org/web/packages/factoextra/index.html (accessed on 11 August 2025).
- Gu, Z.; Hübschmann, D. Make Interactive Complex Heatmaps in R. Bioinformatics. 2022, 38, 1460–1462. [Google Scholar] [CrossRef]
- Galili, T. dendextend: Extending 'dendrogram' Functionality in R. 2025. Available online: https://cran.r-project.org/web/packages/dendextend/index.html (accessed on 11 August 2025).
- Hadfield, J.D. MCMC Methods for Multi-Response Generalized Linear Mixed Models: The MCMCglmm R Package. J. Stat. Softw. 2010, 33, 1–22. [Google Scholar] [CrossRef]
- Espitia-Negrete, L.; Orozco-Orozco, L.F.; Torres, J.M.C.; Medina-Cano, C.I.; Grisales-Vasquez, N.Y. Fiber production repeatability and selection of promising fique (Furcraea spp.) genotypes. Crop Sci. 2024, 64, 2666–2678. [Google Scholar] [CrossRef]
- Mendiburu, F. agricolae: Statistical Procedures for Agricultural Research. 2023. Available online: https://cran.r-project.org/web/packages/agricolae/index.html (accessed on 11 August 2025).
- Wickham, H. tidyverse: Easily Install and Load the 'Tidyverse'. 2023. Available online: https://cran.r-project.org/web/packages/tidyverse/ (accessed on 11 August 2025).
- Pedersen, T.L. ggforce: Accelerating 'ggplot2'. 2025. Available online: https://cran.r-project.org/web/packages/ggforce/index.html (accessed on 11 August 2025).
- Hanson, B.A. Exploratory Chemometrics for Spectroscopy. 2025. Available online: https://bryanhanson.github.io/ChemoSpec/ (accessed on 11 August 2025).
- Meléndez-Mori, J.B.; Guerrero-Abad, J.C.; Tejada-Alvarado, J.J.; Ayala-Tocto, R.Y.; Oliva, M. Genotypic variation in cadmium uptake and accumulation among fine-aroma cacao genotypes from northern Peru: a model hydroponic culture study. Environ. Pollut. Bioavailab. 2023, 35, 2287710. [Google Scholar] [CrossRef]
- Tineo, D.; Bustamante, D.E.; Calderon, M.S.; Oliva, M. Comparative analyses of chloroplast genomes of Theobroma cacao from northern Peru. PLos ONE. 2025, 20, e0316148. [Google Scholar] [CrossRef]
- Scharf, A.; Lang, C.; Fischer, M. Genetic authentication: Differentiation of fine and bulk cocoa (Theobroma cacao L.) by a new CRISPR/Cas9-based in vitro method. Food Control. 2020, 114, 107219. [Google Scholar] [CrossRef]
- Fister, A.S.; Landherr, L.; Maximova, S.N.; Guiltinan, M.J. Transient Expression of CRISPR/Cas9 Machinery Targeting TcNPR3 Enhances Defense Response in Theobroma cacao. Front. Plant Sci. 2018, 9, 268. [Google Scholar] [CrossRef] [PubMed]
- Chaturvedi, P.; Pierides, I.; Zhang, S.; Schwarzerova, J.; Ghatak, A.; Weckwerth, W. Multiomics for Crop Improvement. In Sustainability Sciences in Asia and Africa; Pandey, M.K., Bentley, A., Desmae, H., Roorkiwal, M., Varshney, R.K., Eds.; Springer Nature: Singapore, 2024; pp. 107–141. [Google Scholar] [CrossRef]
- Imán, S.A.; Samanamud, A.F.; Ramirez, J.F.; Cobos, M.; Paredes, C.; Castro, J.C. Development and phenotypic characterization of a native Theobroma cacao L. germplasm bank from the Loreto region of the Peruvian Amazon: implications for Ex situ conservation and genetic improvement. Front. Conserv. Sci. 2025, 6, 1576239. [Google Scholar] [CrossRef]
- Schmidt, J.E.; DuVal, A.; Puig, A.; Tempeleu, A.; Crow, T. Interactive and Dynamic Effects of Rootstock and Rhizobiome on Scion Nutrition in Cacao Seedlings. Front. Agron. 2021, 3, 754646. [Google Scholar] [CrossRef]
- Bustamante, D.E.; Motilal, L.A.; Calderon, M.S.; Mahabir, A.; Oliva, M. Genetic diversity and population structure of fine aroma cacao (Theobroma cacao L.) from north Peru revealed by single nucleotide polymorphism (SNP) markers. Front. Ecol. Evol. 2022, 10, 895056. [Google Scholar] [CrossRef]
- Bekele, F.; Phillips-Mora, W. Cacao (Theobroma cacao L.) Breeding. In Advances in Plant Breeding. In Advances in Plant Breeding Strategies: Industrial and Food Crops; Al-Khayri, J., Jain, S., Johnson, D., Eds.; Springer: Cham, 2019; pp. 409–487. [Google Scholar] [CrossRef]
- Mixão, V.; Nunez-Rodriguez, J.C.; del Olmo, V.; Ksiezopolska, E.; Saus, E; Boekhout, T. ; et al. Evolution of loss of heterozygosity patterns in hybrid genomes of Candida yeast pathogens. BMC Biol. 2023, 21, 105. [Google Scholar] [CrossRef]
- Jombart, T.; Devillard, S.; Balloux, F. Discriminant analysis of principal components: a new method for the analysis of genetically structured populations. BMC Genet. 2010, 11, 94. [Google Scholar] [CrossRef]
- Utama, R.F.; Gustian; Efendi, S. Morphological Characterization of Cacao Plants (Theobroma cacao L.) from Dharmasraya Regency of West Sumatra. CELEBES Agric. 2023, 4, 30–45. [Google Scholar] [CrossRef]
- Motamayor, J.C.; Risterucci, A.M.; Lopez, P.A.; Ortiz, C.F.; Moreno, A. , Lanaud, C. Cacao domestication I: the origin of the cacao cultivated by the Mayas. Heredity. 2002, 89, 380–386. [Google Scholar] [CrossRef] [PubMed]
- Tlahig, S.; Mohamed, A.; Triki, T.; Yahia, Y.; Yehmed, J.; Yahia, H.; et al. Integrated agro-morphological and molecular characterization for progeny testing to enhance alfalfa breeding in arid regions of Tunisia. J. Agric. Food Res. 2025, 20, 101793. [Google Scholar] [CrossRef]
- Bidot Martínez, I.; Valdés de la Cruz, M.; Riera Nelson, M.; Bertin, P. Morphological characterization of traditional cacao (Theobroma cacao L.) plants in Cuba. Genet. Resour. Crop Evol. 2017, 64, 73–99. [Google Scholar] [CrossRef]
- Poorter, H.; Niklas, K.J.; Reich, P.B.; Oleksyn, J.; Poot, P.; Mommer, L. Biomass allocation to leaves, stems and roots: meta-analyses of interspecific variation and environmental control. New Phytol. 2012, 193, 30–50. [Google Scholar] [CrossRef] [PubMed]
- Jaramillo, M.A.; Reyes-Palencia, J.; Jiménez, P. Floral biology and flower visitors of cocoa (Theobroma cacao L.) in the upper Magdalena Valley, Colombia. Flora. 2024, 313, 152480. [Google Scholar] [CrossRef]
- Lim, S.; Baek, I.; Hong, S.M.; Lee, Y.; Kirubakaran, S.; Kim, M.S.; et al. Cacao floral traits are shaped by the interaction of flower position with genotype. Heliyon. 2025, 11, e42407. [Google Scholar] [CrossRef]
- Osorio-Guarín, J.A.; Berdugo-Cely, J.; Coronado, R.A.; Zapata, Y.P.; Quintero, C.; Gallego-Sánchez, G.; et al. Colombia a Source of Cacao Genetic Diversity As Revealed by the Population Structure Analysis of Germplasm Bank of Theobroma cacao L. Front. Plant Sci. 2017, 8, 1994. [Google Scholar] [CrossRef]
- Vásquez-García, J.; Santos-Pelaez, J.C.; Malqui-Ramos, R.; Vigo, C.N.; C, W.A.; Bobadilla, L.G. Agromorphological characterization of cacao (Theobroma cacao L.) accessions from the germplasm bank of the National Institute of Agrarian Innovation, Peru. Heliyon. 2022, 8, e10888. [Google Scholar] [CrossRef]
- Trunschke, J.; Lunau, K.; Pyke, G.H.; Ren, Z.X.; Wang, H. Flower Color Evolution and the Evidence of Pollinator-Mediated Selection. Front. Plant Sci. 2021, 12, 617851. [Google Scholar] [CrossRef]
- Rodriguez-Medina, C.; Arana, A.C.; Sounigo, O.; Argout, X.; Alvarado, G.A.; Yockteng, R. Cacao breeding in Colombia, past, present and future. Breed. Sci. 2019, 69, 373–382. [Google Scholar] [CrossRef]
- Muzuni; Ambardini, S. ; Widyaningsih, A.S.; Ismaun. Morphological and physiological characteristics of cocoa (Theobroma cacao L. var. criollo) infected by Phytophthora palmivora in cocoa plantations in Southeast Sulawesi Indonesia. AIP Conf. Proc. 2023, 2704, 020015. [Google Scholar] [CrossRef]
- Daymond, A.j.; Hadley, P. Differential effects of temperature on fruit development and bean quality of contrasting genotypes of cacao (Theobroma cacao). Ann. Appl. Biol. 2008, 153, 175–185. [Google Scholar] [CrossRef]
- Ten Hoopen, G.M.; Deberdt, P.; Mbenoun, M.; Cilas, C. Modelling cacao pod growth: implications for disease control. Ann. Appl. Biol. 2012, 160, 260–72. [Google Scholar] [CrossRef]
- Nieves-Orduña, H.E.; Müller, M.; Krutovsky, K.V.; Gailing, O. Genotyping of cacao (Theobroma cacao L.) germplasm resources with SNP markers linked to agronomic traits reveals signs of selection. Tree Genet. Genomes. 2024, 20, 13. [Google Scholar] [CrossRef]
- Suparno, A.; Arbianto, M.A.; Prabawardani, S.; Chadikun, P.; Tata, H.; Luhulima, F.D.N. The identification of yield components, genetic variability, and heritability to determine the superior cocoa trees in West Papua, Indonesia. Biodiversitas. 2024, 25, 2363–2373. [Google Scholar] [CrossRef]
- López-Hernández, J.A.; Ortiz-Mejía, F.N.; Parada-Berríos, F.A.; Lara-Ascencio, F.; Vásquez-Osegueda, E.A. Caracterización morfoagronómica de cacao criollo (Theobroma cacao L.) y su incidencia en la selección de germoplasma promisorio en áreas de presencia natural en El Salvador. Rev. Minerva. 2019, 2, 31–50. [Google Scholar] [CrossRef]
- Lachenaud, P.; Motamayor, J.C. The Criollo cacao tree (Theobroma cacao L.): a review. Genet. Resour. Crop Evol. 2017, 64, 1807–1820. [Google Scholar] [CrossRef]
- Afifah, E.N.; Sari, I.A.; Susilo, A.W.; Malik, A.; Fukusaki, E.; Putri, S.P. Characterization of fine-flavor cocoa in parent-hybrid combinations using metabolomics approach. Food Chem: X. 2024, 24, 101832. [Google Scholar] [CrossRef]
- Kongor, J.E.; Hinneh, M.; de Walle, D.V.; Afoakwa, E.O.; Boeckx, P.; Dewettinck, K. Factors influencing quality variation in cocoa (Theobroma cacao) bean flavour profile — A review. Food Res. Int. 2016, 82, 44–52. [Google Scholar] [CrossRef]
- Avendaño-Arrazate, C.H.; Martínez-Bolaños, M.; Reyes-Reyes, A.L.; Aragón-Magadán, M.A.; Reyes-López, D.; López-Morales, F. Genotype-environment interaction of genotypes of cocoa in Mexico. Sci. Rep. 2025, 15, 15399. [Google Scholar] [CrossRef]
- Velasquez-Vasconez, P.A.; Castro-Zambrano, M.I.; Rodríguez-Cabal, H.A.; Castro, D.; Arbelaez, L.; Zambrano, J.C. Exploring Theobroma grandiflorum diversity to improve sustainability in smallholdings across Caquetá, Colombia. Int. J. Agron. 2025, 20, 100034. [Google Scholar] [CrossRef]
- Falque, M.; Vincent, A.; Vaissiere, B.E.; Eskes, A.B. Effect of pollination intensity on fruit and seed set in cacao (Theobroma cacao L.). Sex. Plant Reprod. 1995, 8, 354–360. [Google Scholar] [CrossRef]
- Fajardo, J.G.B.; Tellez, H.B.H.; Atuesta, G.C.P.; Aldana, A.P.S.; Arteaga, J.J.M. Antioxidant activity, total polyphenol content and methylxantine ratio in four materials of Theobroma cacao L. from Tolima, Colombia. Heliyon. 2022, 8, e09402. [Google Scholar] [CrossRef] [PubMed]
- Tušek, K.; Valinger, D.; Jurina, T.; Sokač Cvetnić, T.; Gajdoš Kljusurić, J.; Benković, M. Bioactives in Cocoa: Novel Findings, Health Benefits, and Extraction Techniques. Separations. 2024, 11, 128. [Google Scholar] [CrossRef]
- Martins, L.M.; Santana, L.R.R.; Maciel, L.F.; Soares, S.E.; Ferreira, A.C.R.; Biasoto, A.C.T.; et al. Phenolic compounds, methylxanthines, and preference drivers of dark chocolate made with hybrid cocoa beans. Res. Soc. Dev. 2023, 12, e22912440782. [Google Scholar] [CrossRef]
- Oracz, J.; Nebesny, E.; Zyzelewicz, D.; Budryn, G.; Luzak, B. Bioavailability and metabolism of selected cocoa bioactive compounds: A comprehensive review. Crit. Rev. Food Sci. Nutr. 2020, 60, 1947–1985. [Google Scholar] [CrossRef]
- Lima, G.V.S.; Moura, F.G.; Gofflot, S.; Pinto, A.S.O.; de Souza, J.N.S.; Baeten, V.; et al. Targeted metabolomics for quantitative assessment of polyphenols and methylxanthines in fermented and unfermented cocoa beans from 18 genotypes of the Brazilian Amazon. Food Res. Int. 2025, 211, 116394. [Google Scholar] [CrossRef]
- Zapata-Alvarez, A.; Bedoya-Vergara, C.; Porras-Barrientos, L.D.; Rojas-Mora, J.M.; Rodríguez-Cabal, H.A.; Gil-Garzon, M.A.; et al. Molecular, biochemical, and sensorial characterization of cocoa (Theobroma cacao L.) beans: A methodological pathway for the identification of new regional materials with outstanding profiles. Heliyon. 2024, 10, e24544. [Google Scholar] [CrossRef]
- Collin, S.; Fisette, T.; Pinto, A.; Souza, J.; Rogez, H. Discriminating Aroma Compounds in Five Cocoa Bean Genotypes from Two Brazilian States: White Kerosene-like Catongo, Red Whisky-like FL89 (Bahia), Forasteros IMC67, PA121 and P7 (Pará). Molecules. 2023, 28, 1548. [Google Scholar] [CrossRef]
- Mat, S.A.; Mohd Daud, I.S.; Mohamad Rojie, M.H.; Hussain, N.; Rukayadi, Y. Effects of Candida sp. and Blastobotrys sp. Starter on Fermentation of Cocoa (Theobroma cacao L.) Beans and its Antibacterial Activity. J. Pure Appl. Microbiol. 2016, 10, 2501–2510. [Google Scholar] [CrossRef]
- Batista, N.N.; de Andrade, D.P.; Ramos, C.L.; Dias, D.R.; Schwan, R.F. Antioxidant capacity of cocoa beans and chocolate assessed by FTIR. Food Res. Int. 2016, 90, 313–319. [Google Scholar] [CrossRef]
- Deus, V.L.; Resende, L.M.; Bispo, E.S.; Franca, A.S.; Gloria, M.B.A. FTIR and PLS-regression in the evaluation of bioactive amines, total phenolic compounds and antioxidant potential of dark chocolates. Food Chem. 2021, 357, 129754. [Google Scholar] [CrossRef]
- Grillo, G.; Boffa, L.; Binello, A.; Mantegna, S.; Cravotto, G.; Chemat, F.; et al. Analytical dataset of Ecuadorian cocoa shells and beans. Data Br. 2019, 22, 56–64. [Google Scholar] [CrossRef]
- Santiago-Gómez, I.; Carrera-Lanestosa, A.; González-Alejo, F.A.; Guerra-Que, Z.; García-Alamilla, R.; Rivera-Armenta, J.L.; et al. Pectin Extraction Process from Cocoa Pod Husk (Theobroma cacao L.) and Characterization by Fourier Transform Infrared Spectroscopy. ChemEngineering. 2025, 9, 25. [Google Scholar] [CrossRef]
- Betancourt-Sambony, F.; Barrios-Rodríguez, Y.F.; Medina-Orjuela, M.E.; Gutiérrez-Guzmán, N.; Amorocho-Cruz, C.M.; Carranza, C.; et al. Relationship between physicochemical properties of roasted cocoa beans and climate patterns: Quality and safety implications. LWT-Food Sci. Technol. 2025, 216, 117320. [Google Scholar] [CrossRef]
Figure 1.
Cartographic collection of the 113 cacao accessions from the Amazonas region, Peru.
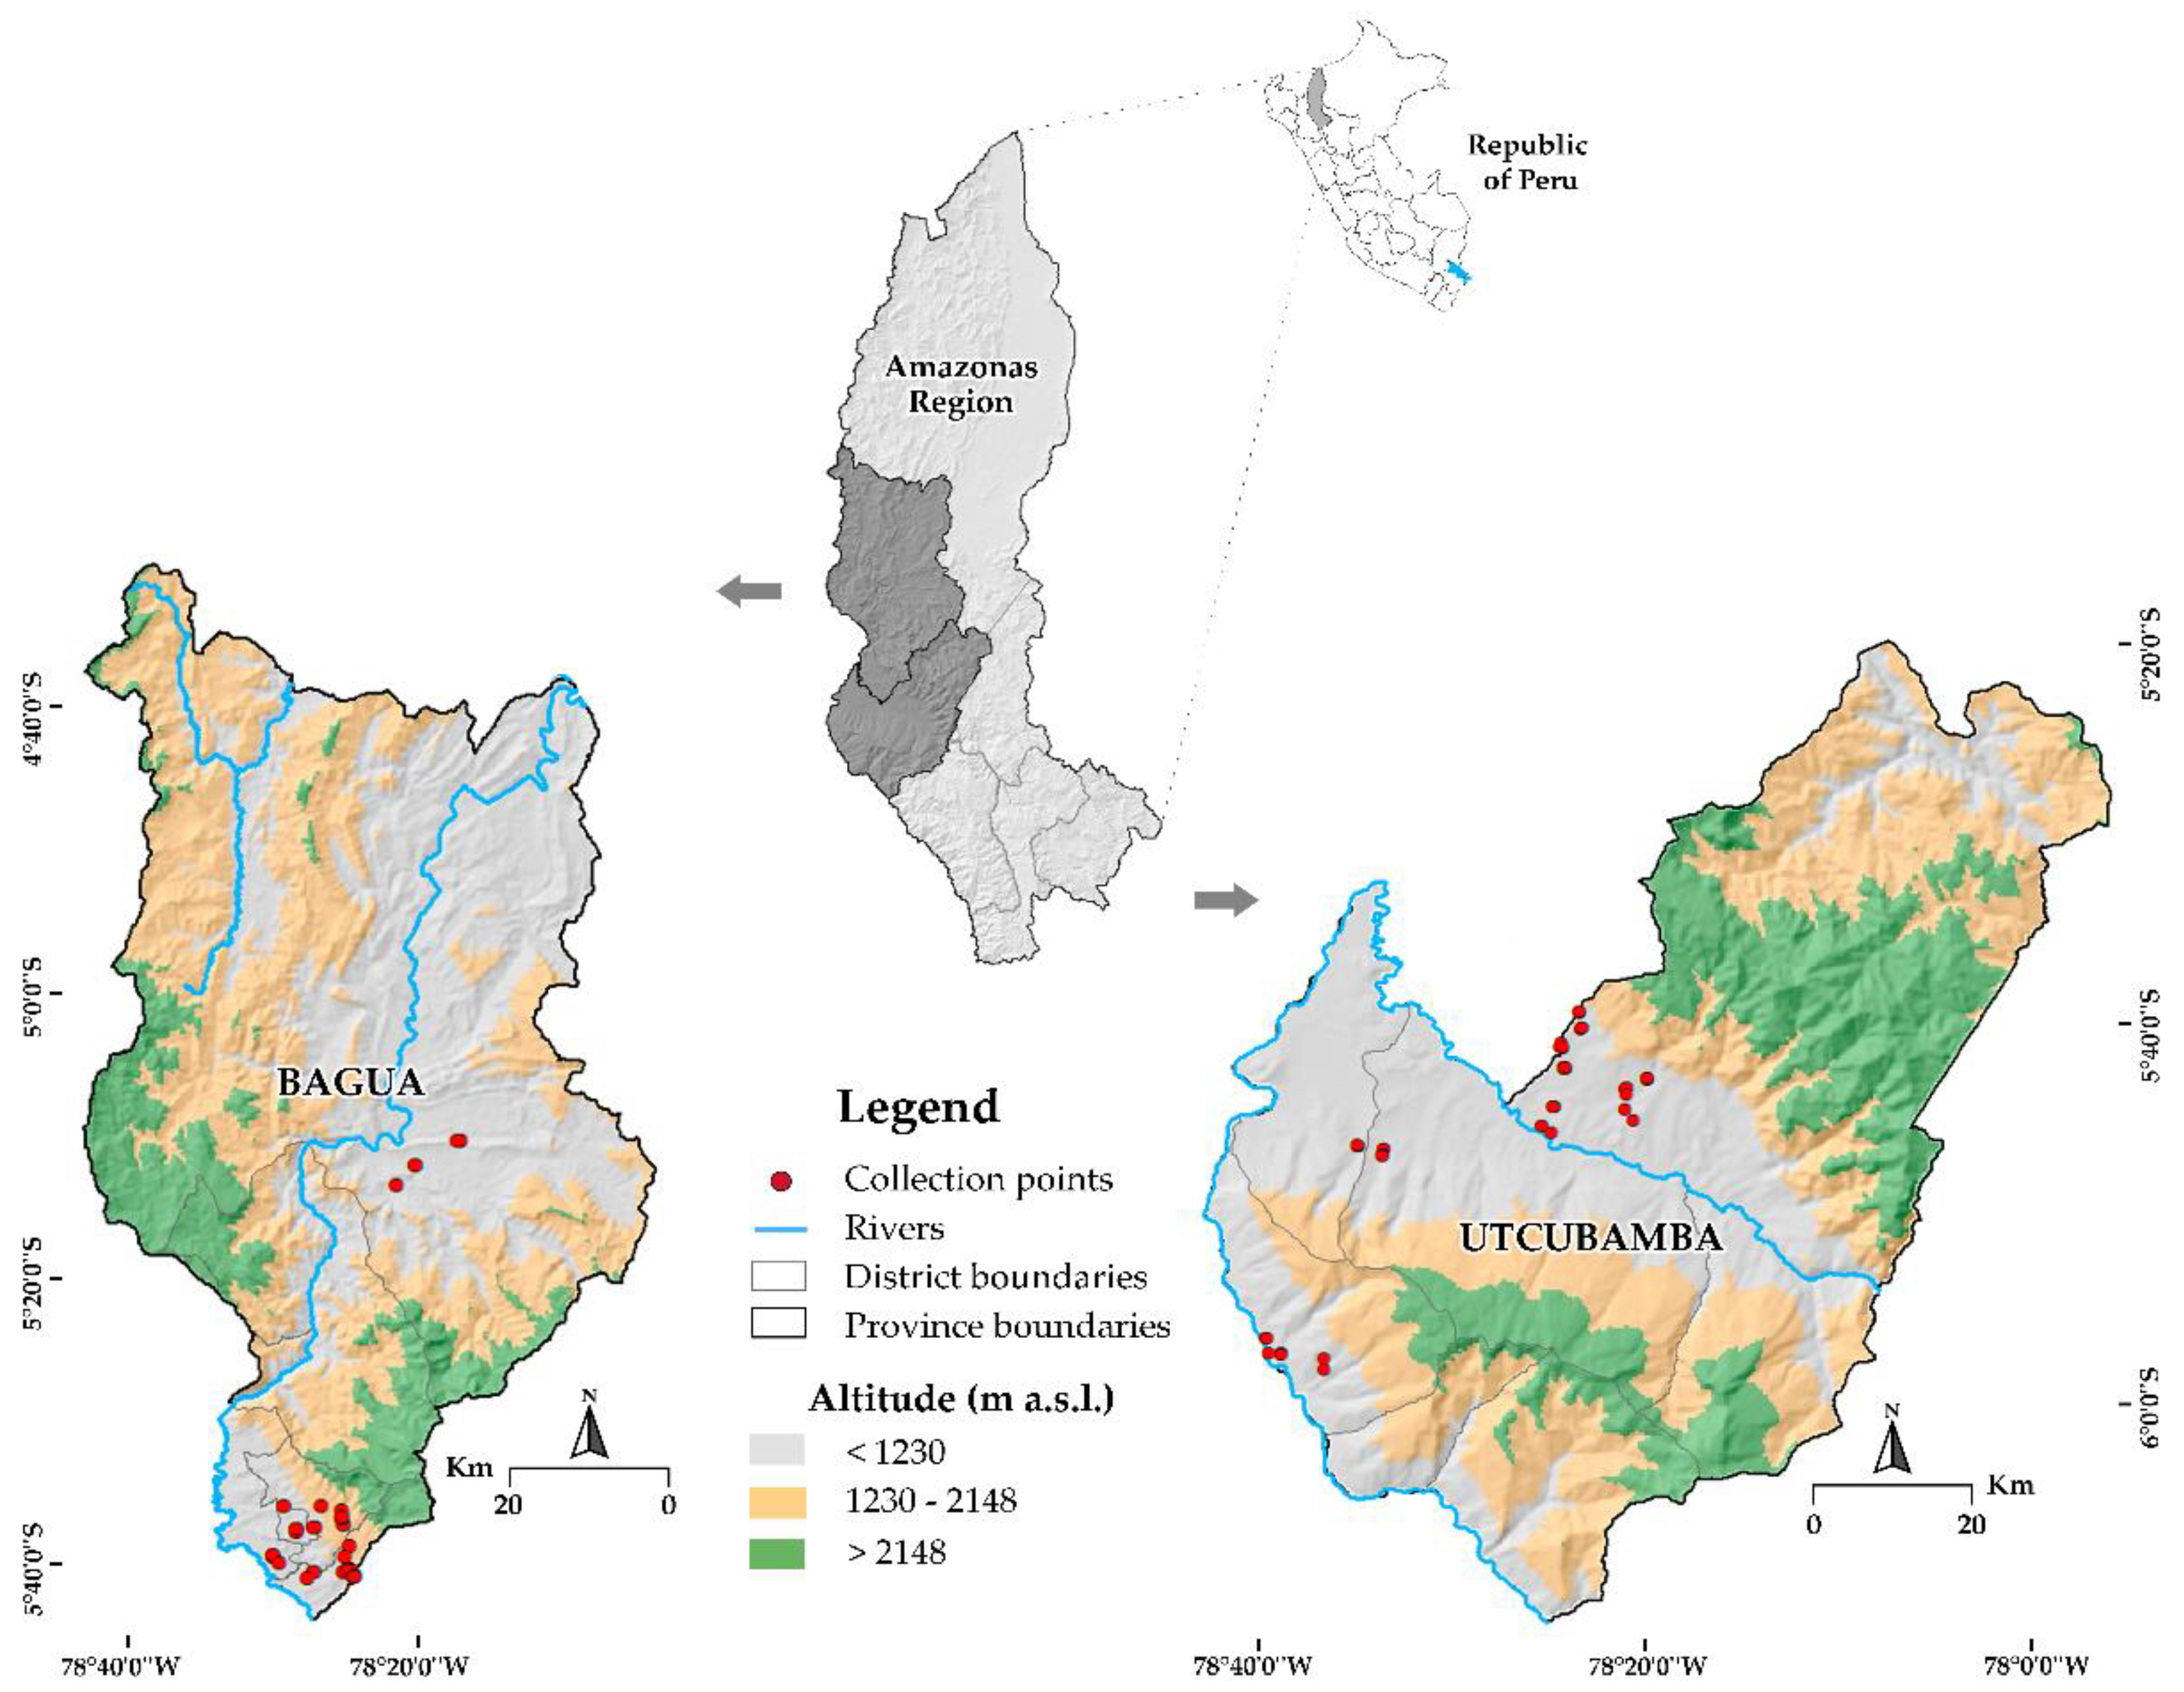
Figure 2.
Hydrometeorological diagram of the studied cropping seasons.
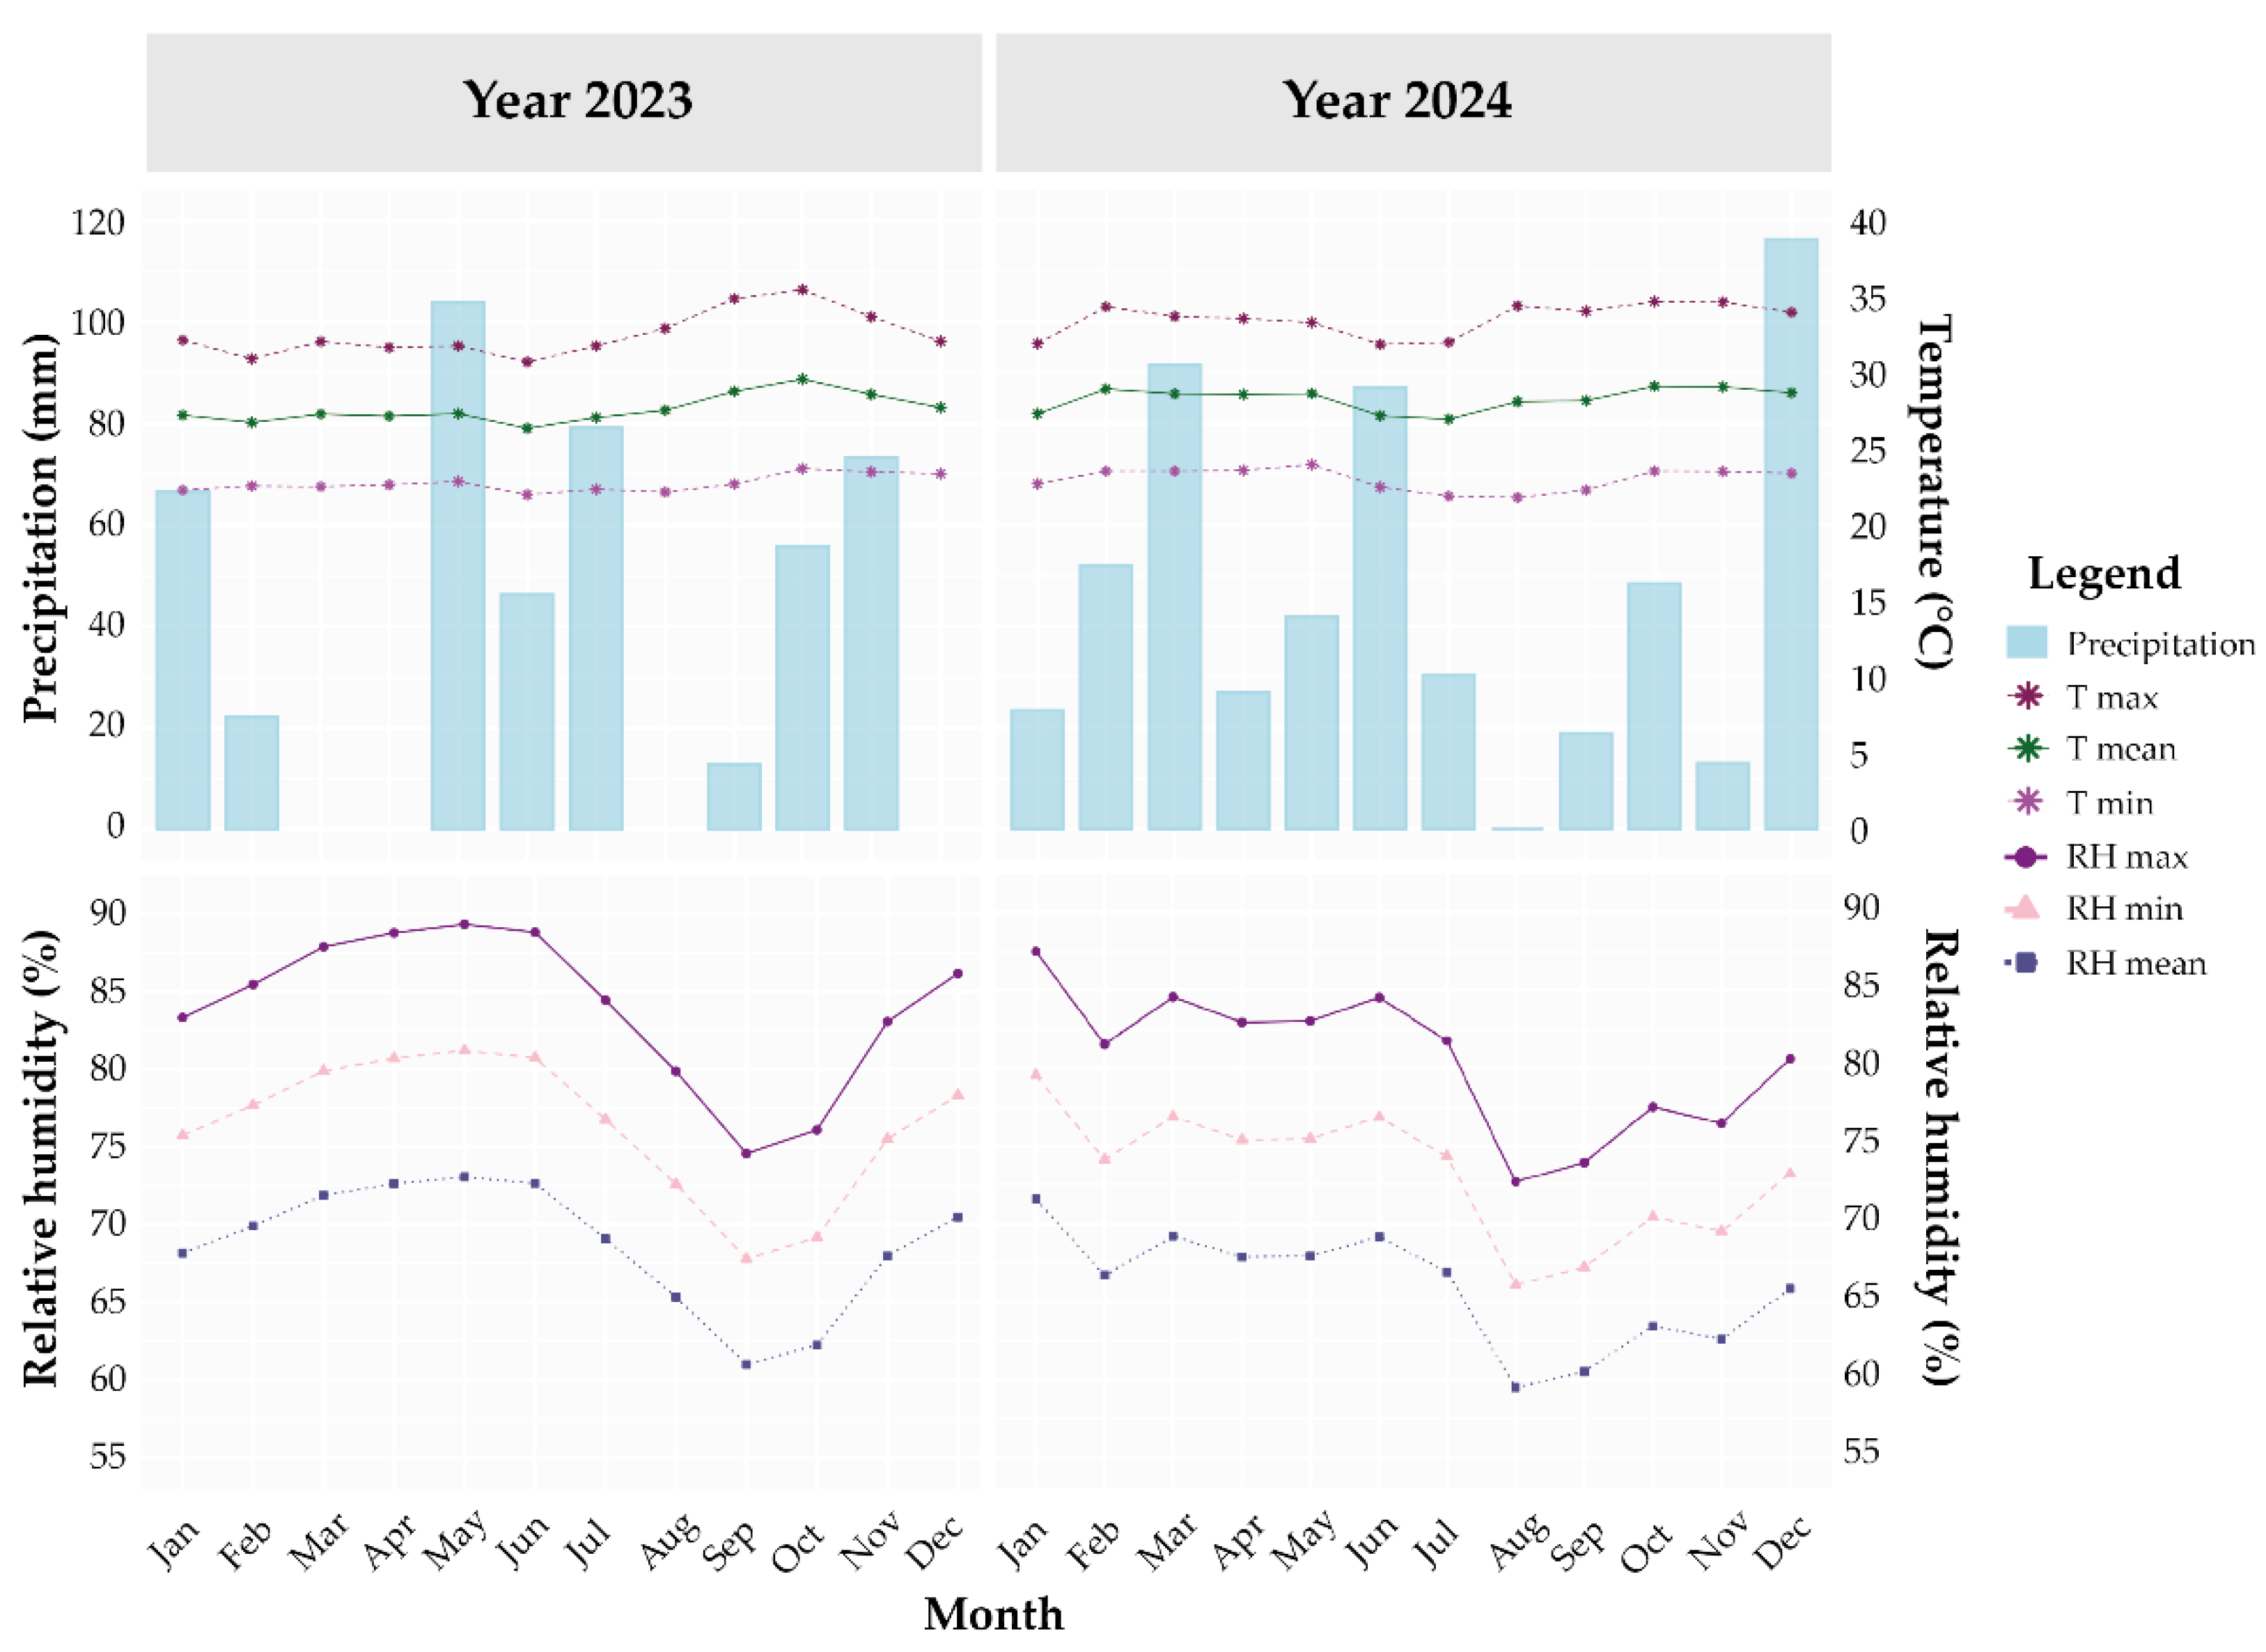
Figure 3.
Distribution histograms of the germplasm for the quantitative descriptors.
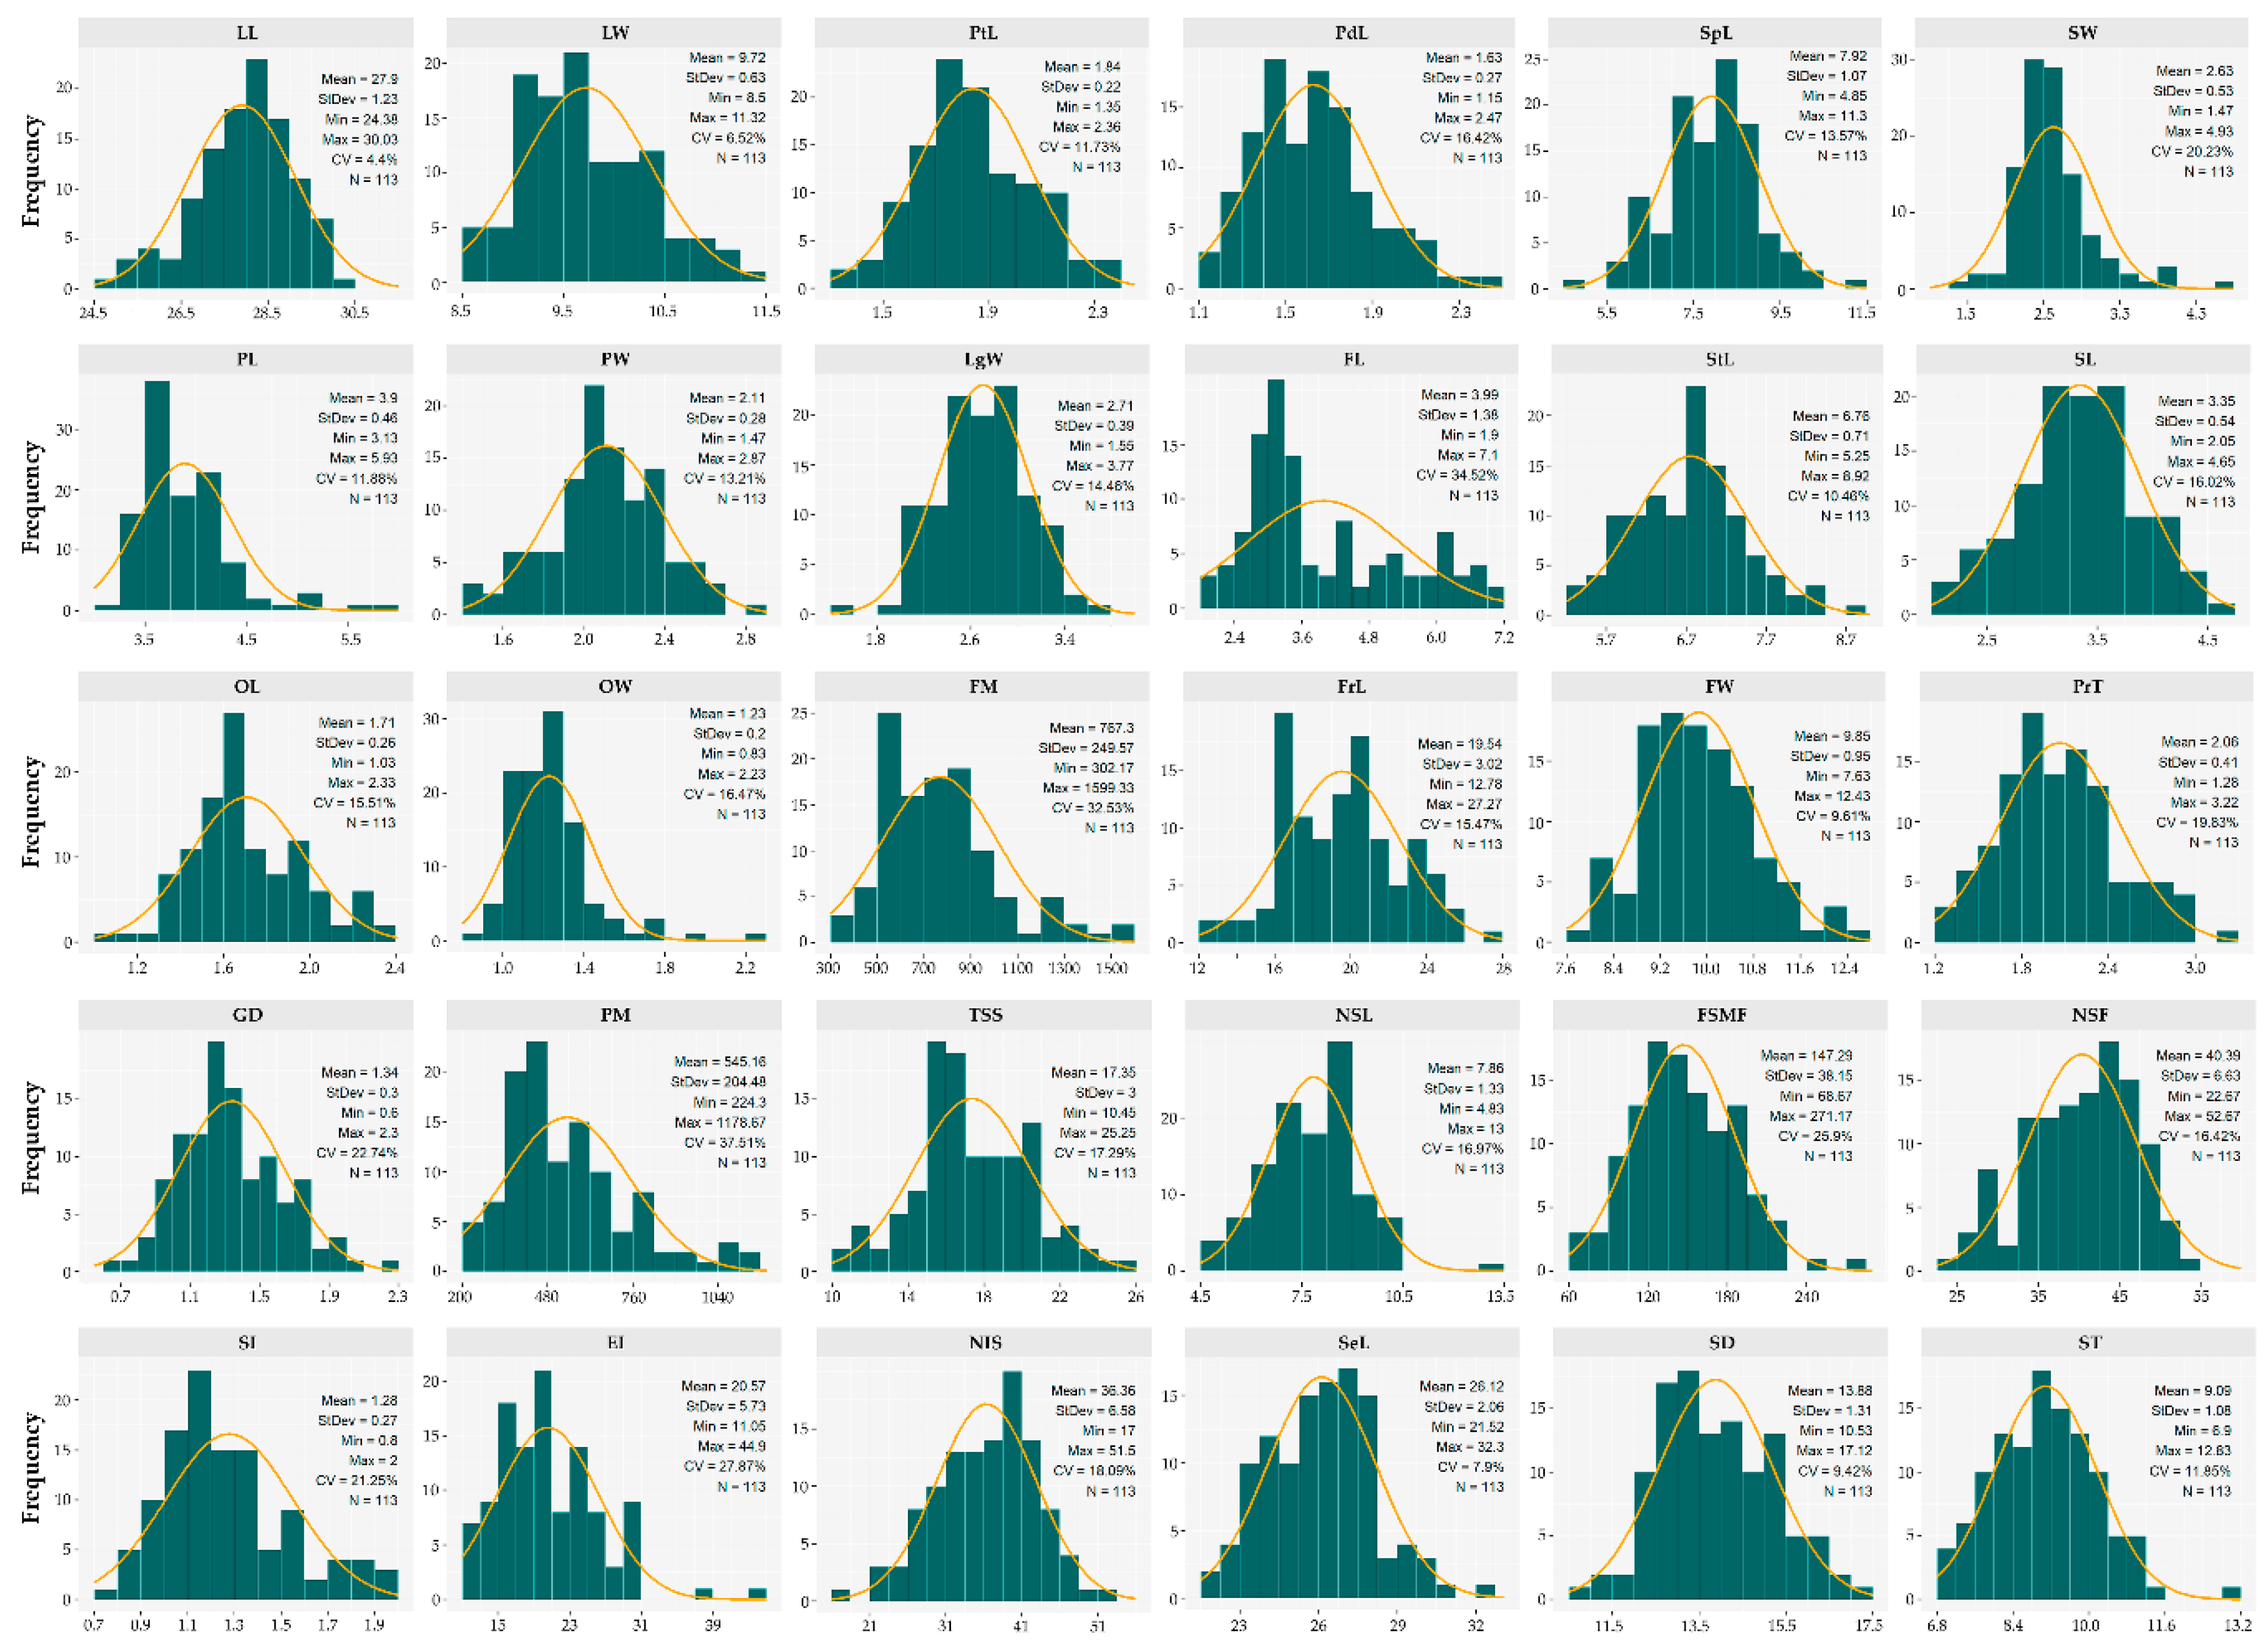
Figure 4.
Pearson correlation matrix among quantitative descriptors, with significance levels indicated by asterisks (p ≤ 0.05, * p ≤ 0.01, ** p ≤ 0.001, ***), for descriptors placed along the diagonal.
Figure 4.
Pearson correlation matrix among quantitative descriptors, with significance levels indicated by asterisks (p ≤ 0.05, * p ≤ 0.01, ** p ≤ 0.001, ***), for descriptors placed along the diagonal.
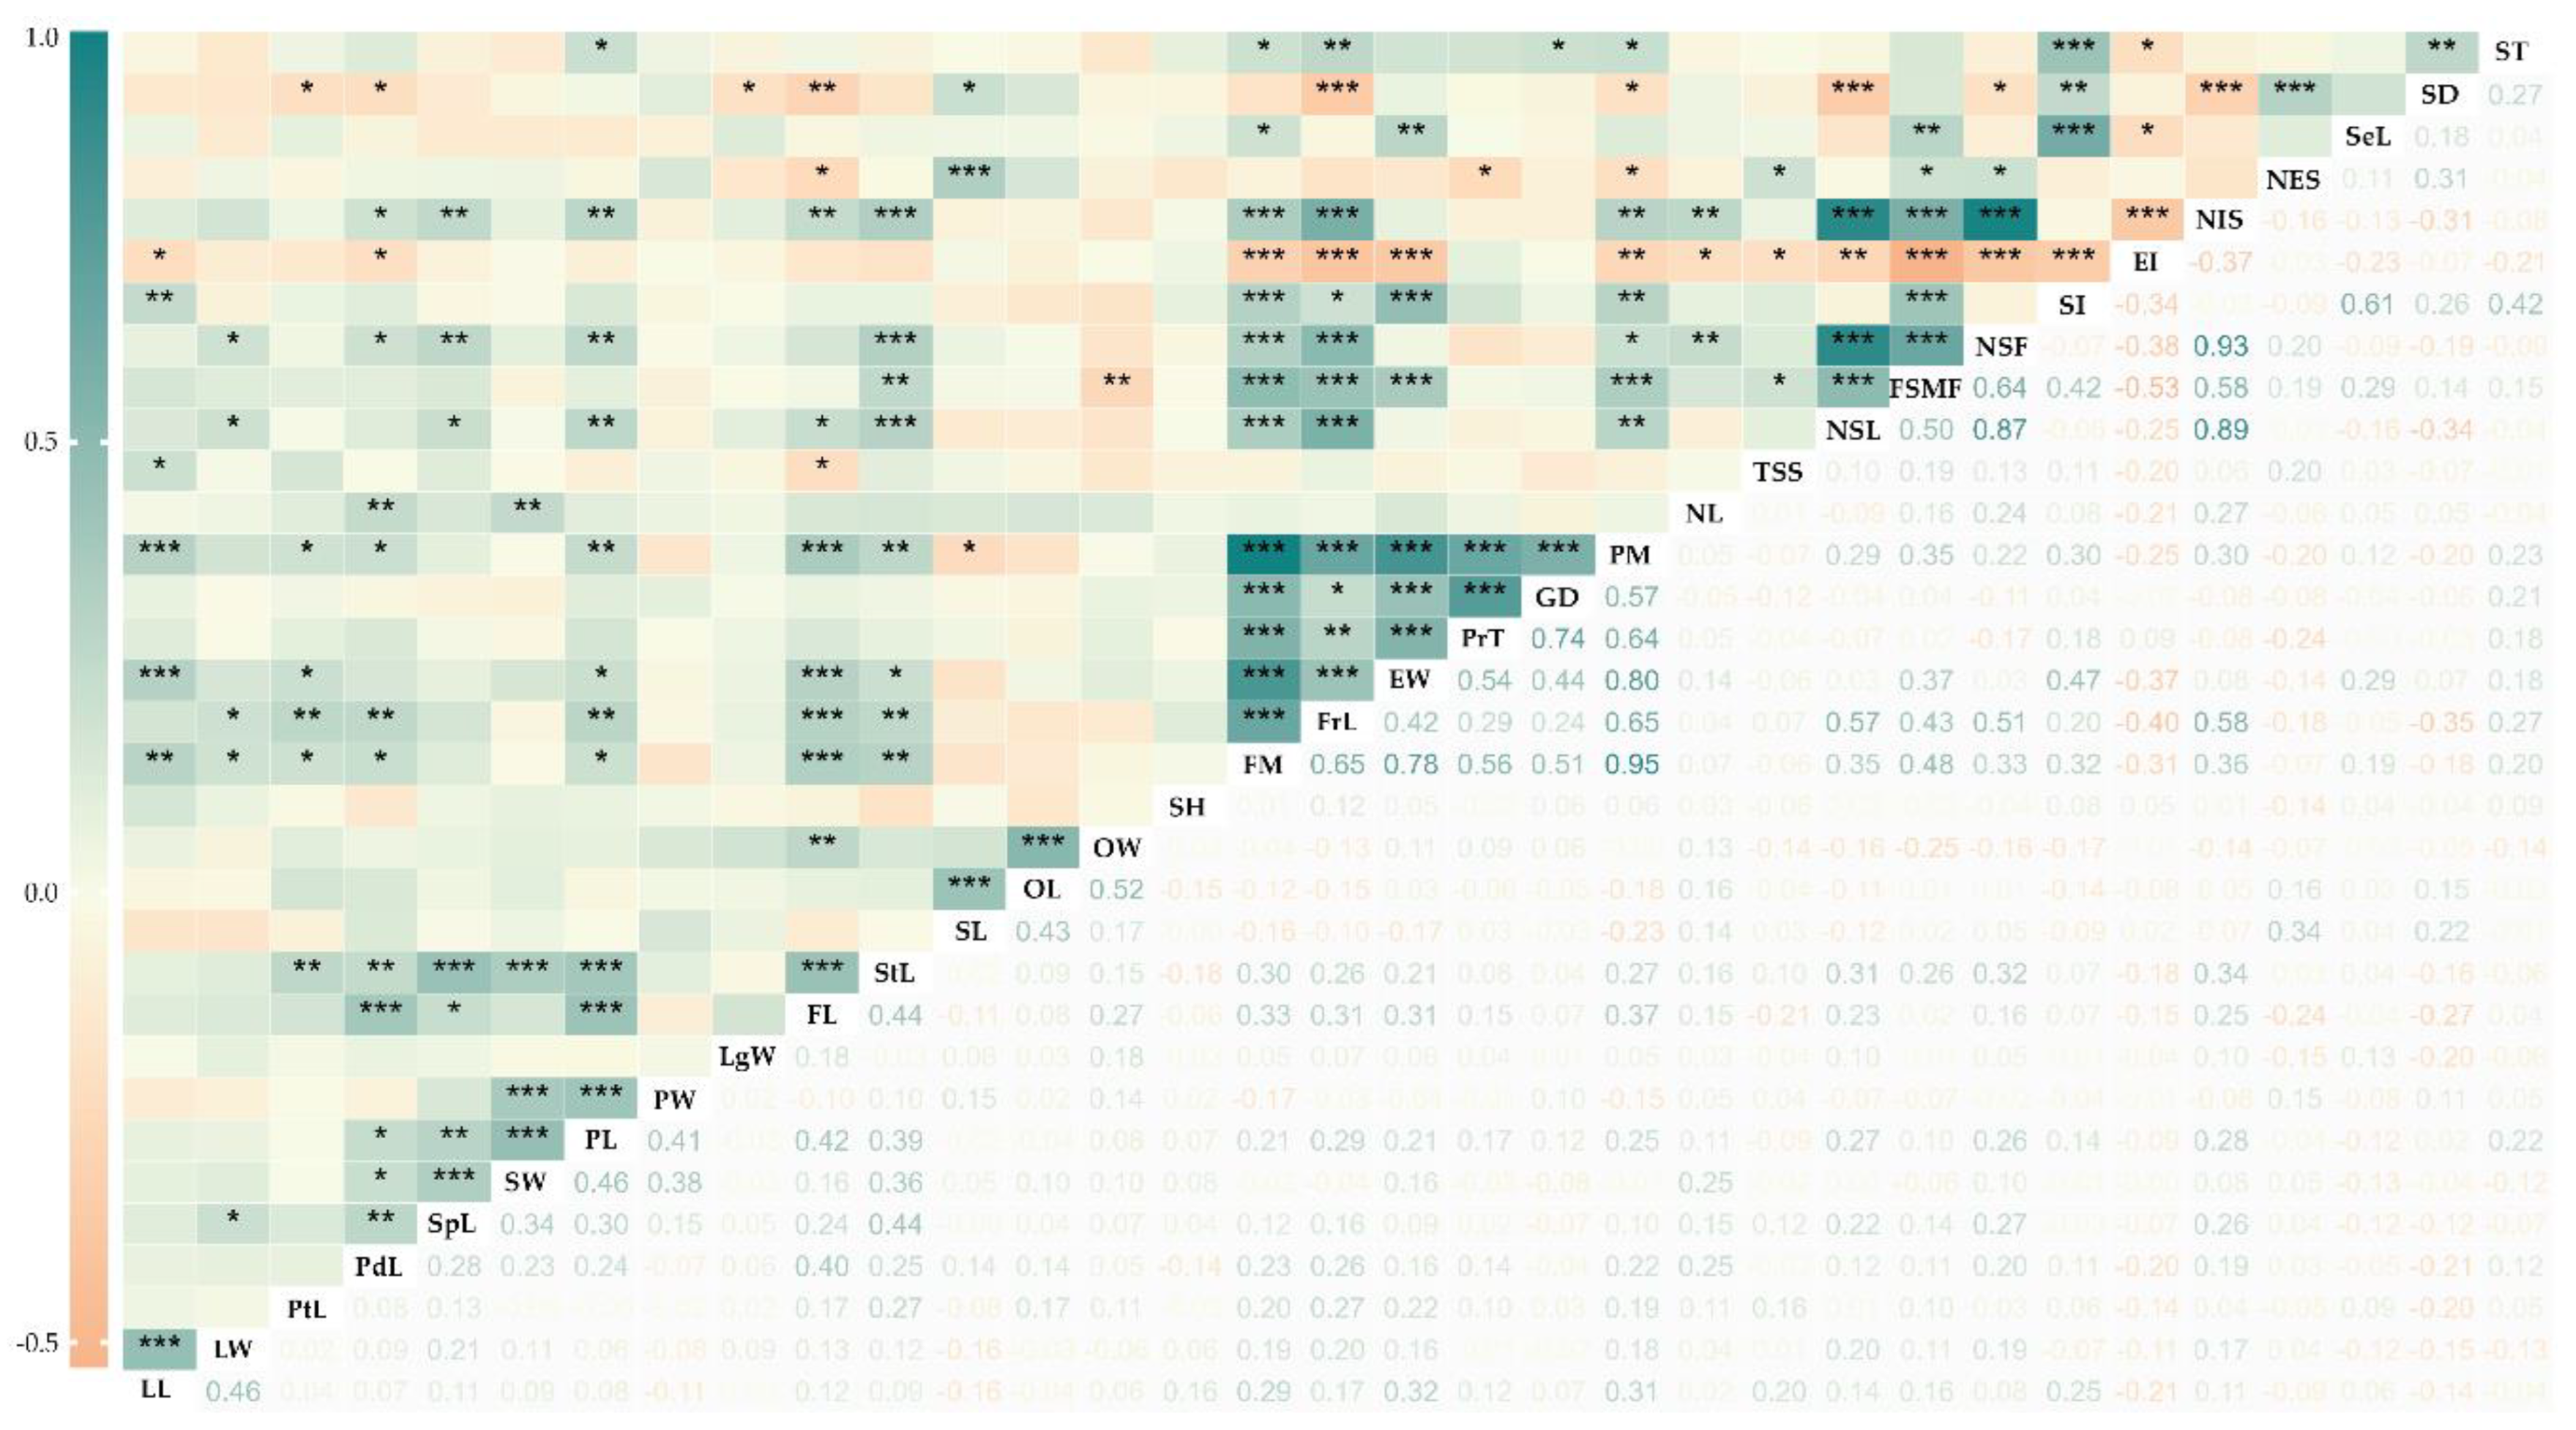
Figure 5.
Frequency distribution of the germplasm for qualitative descriptors.
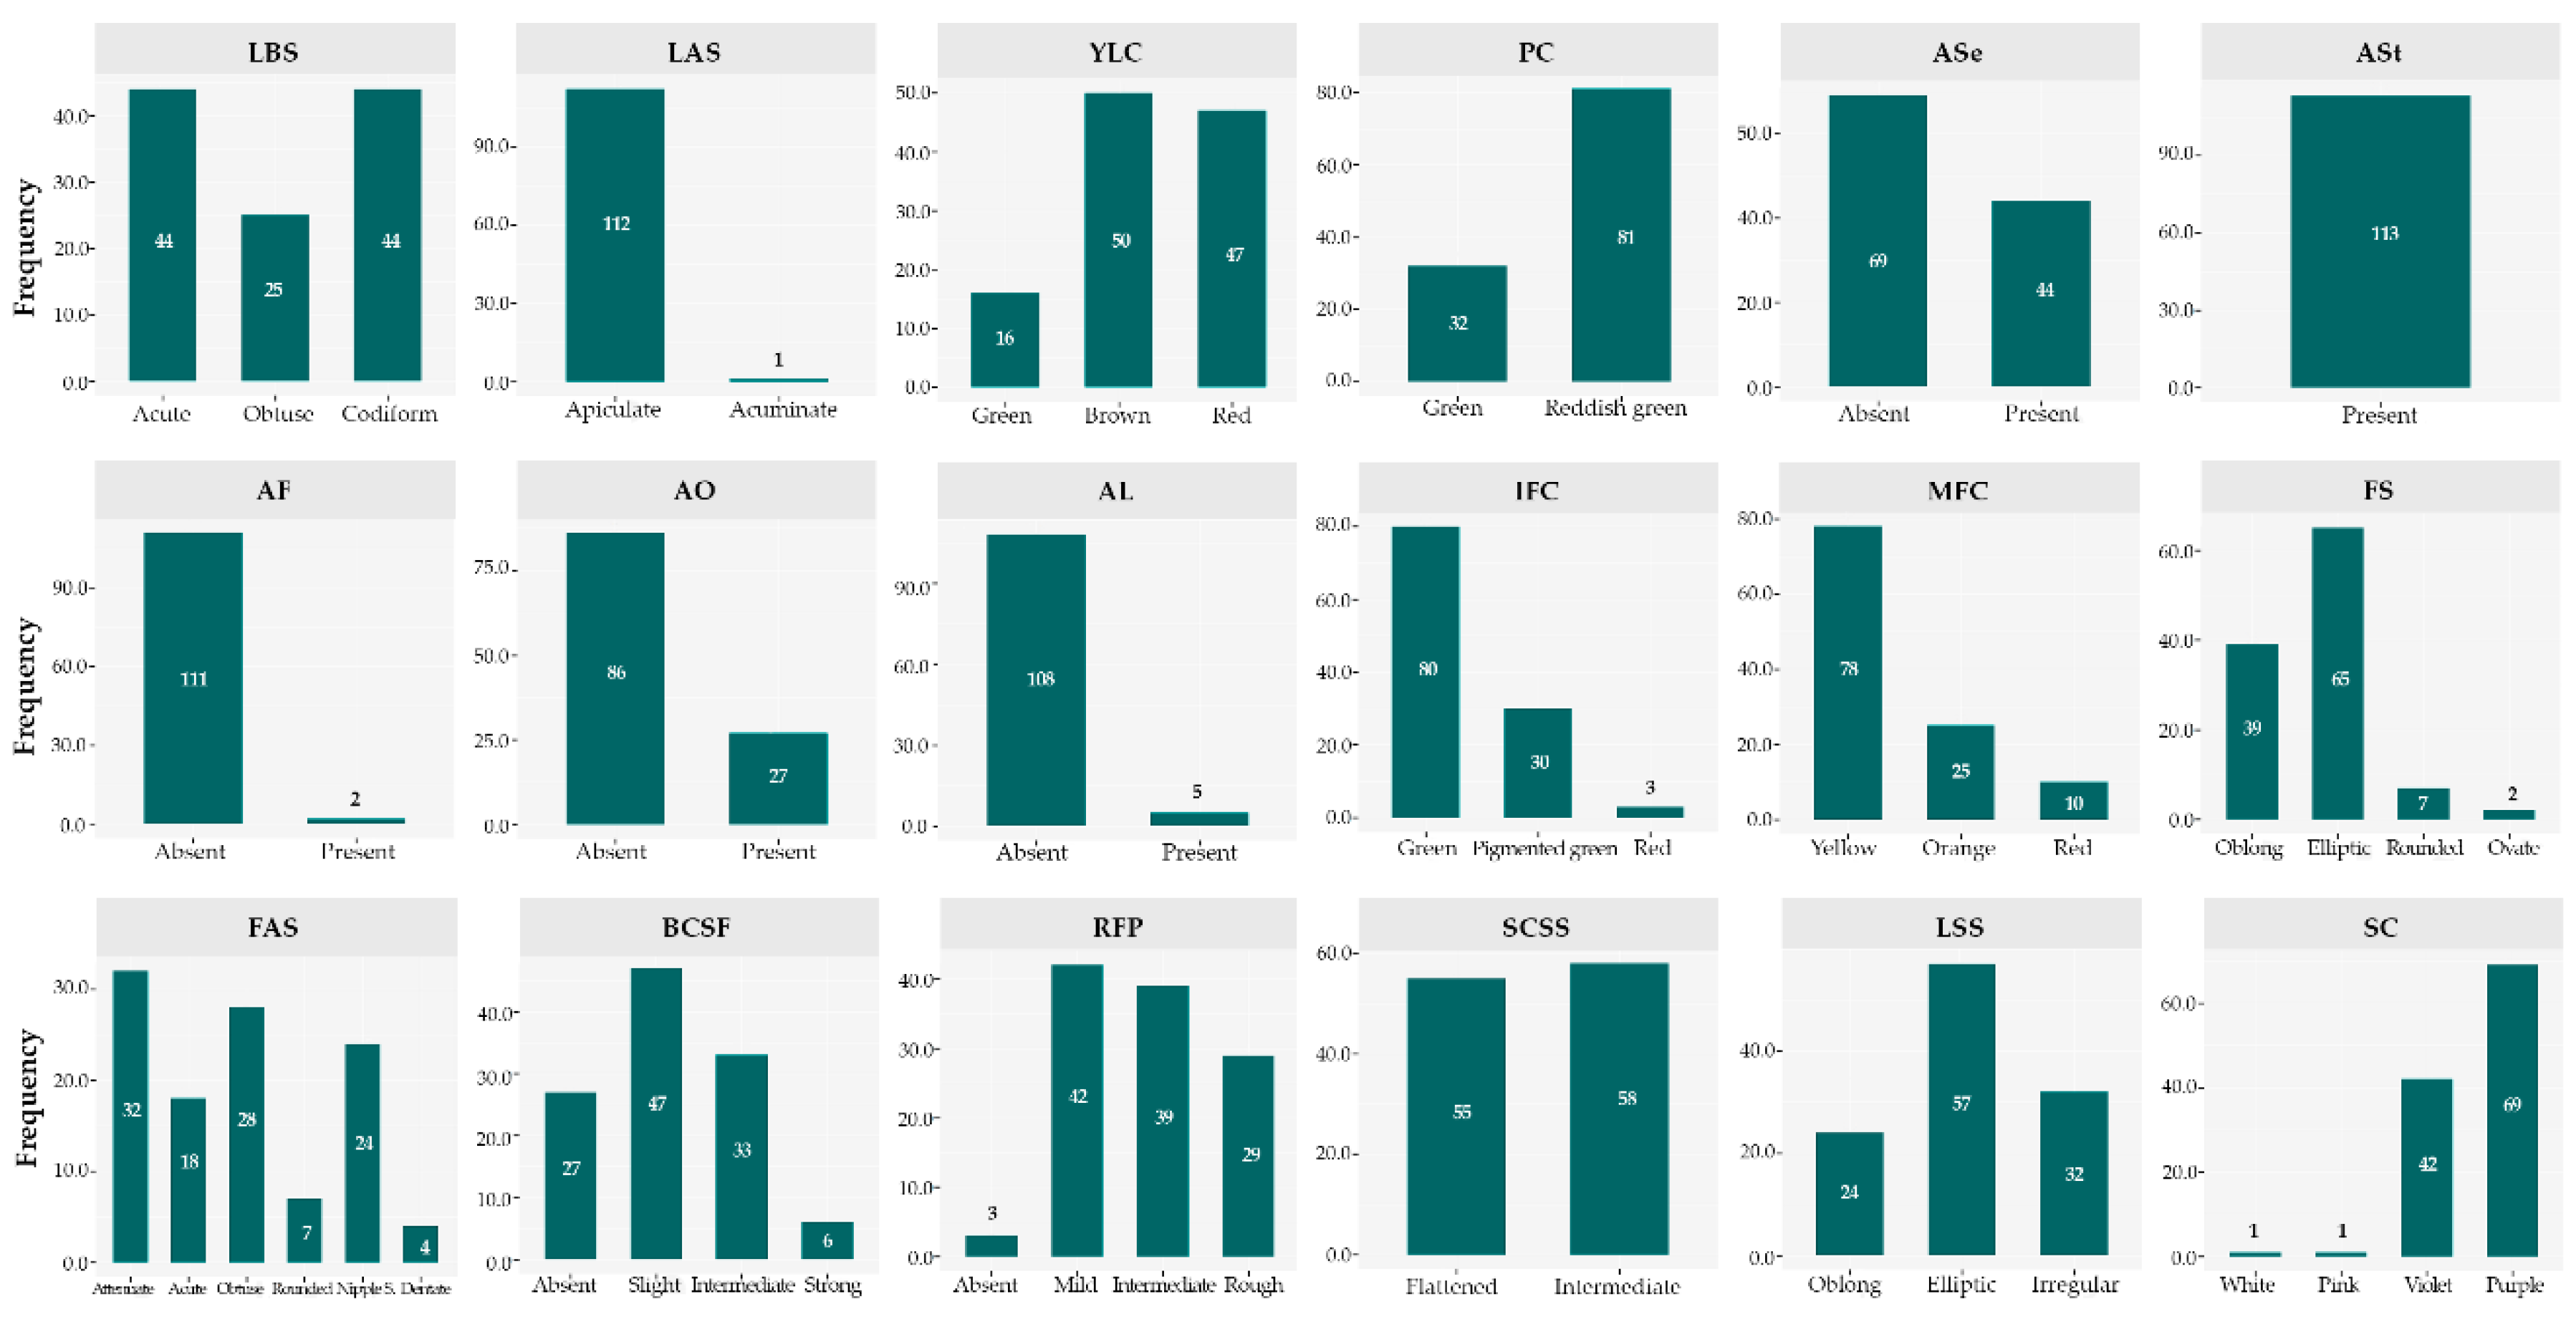
Figure 6.
Phenotypic diversity of cacao accessions from the INIA Germplasm Bank, collected in the Amazonas region of Peru.
Figure 6.
Phenotypic diversity of cacao accessions from the INIA Germplasm Bank, collected in the Amazonas region of Peru.
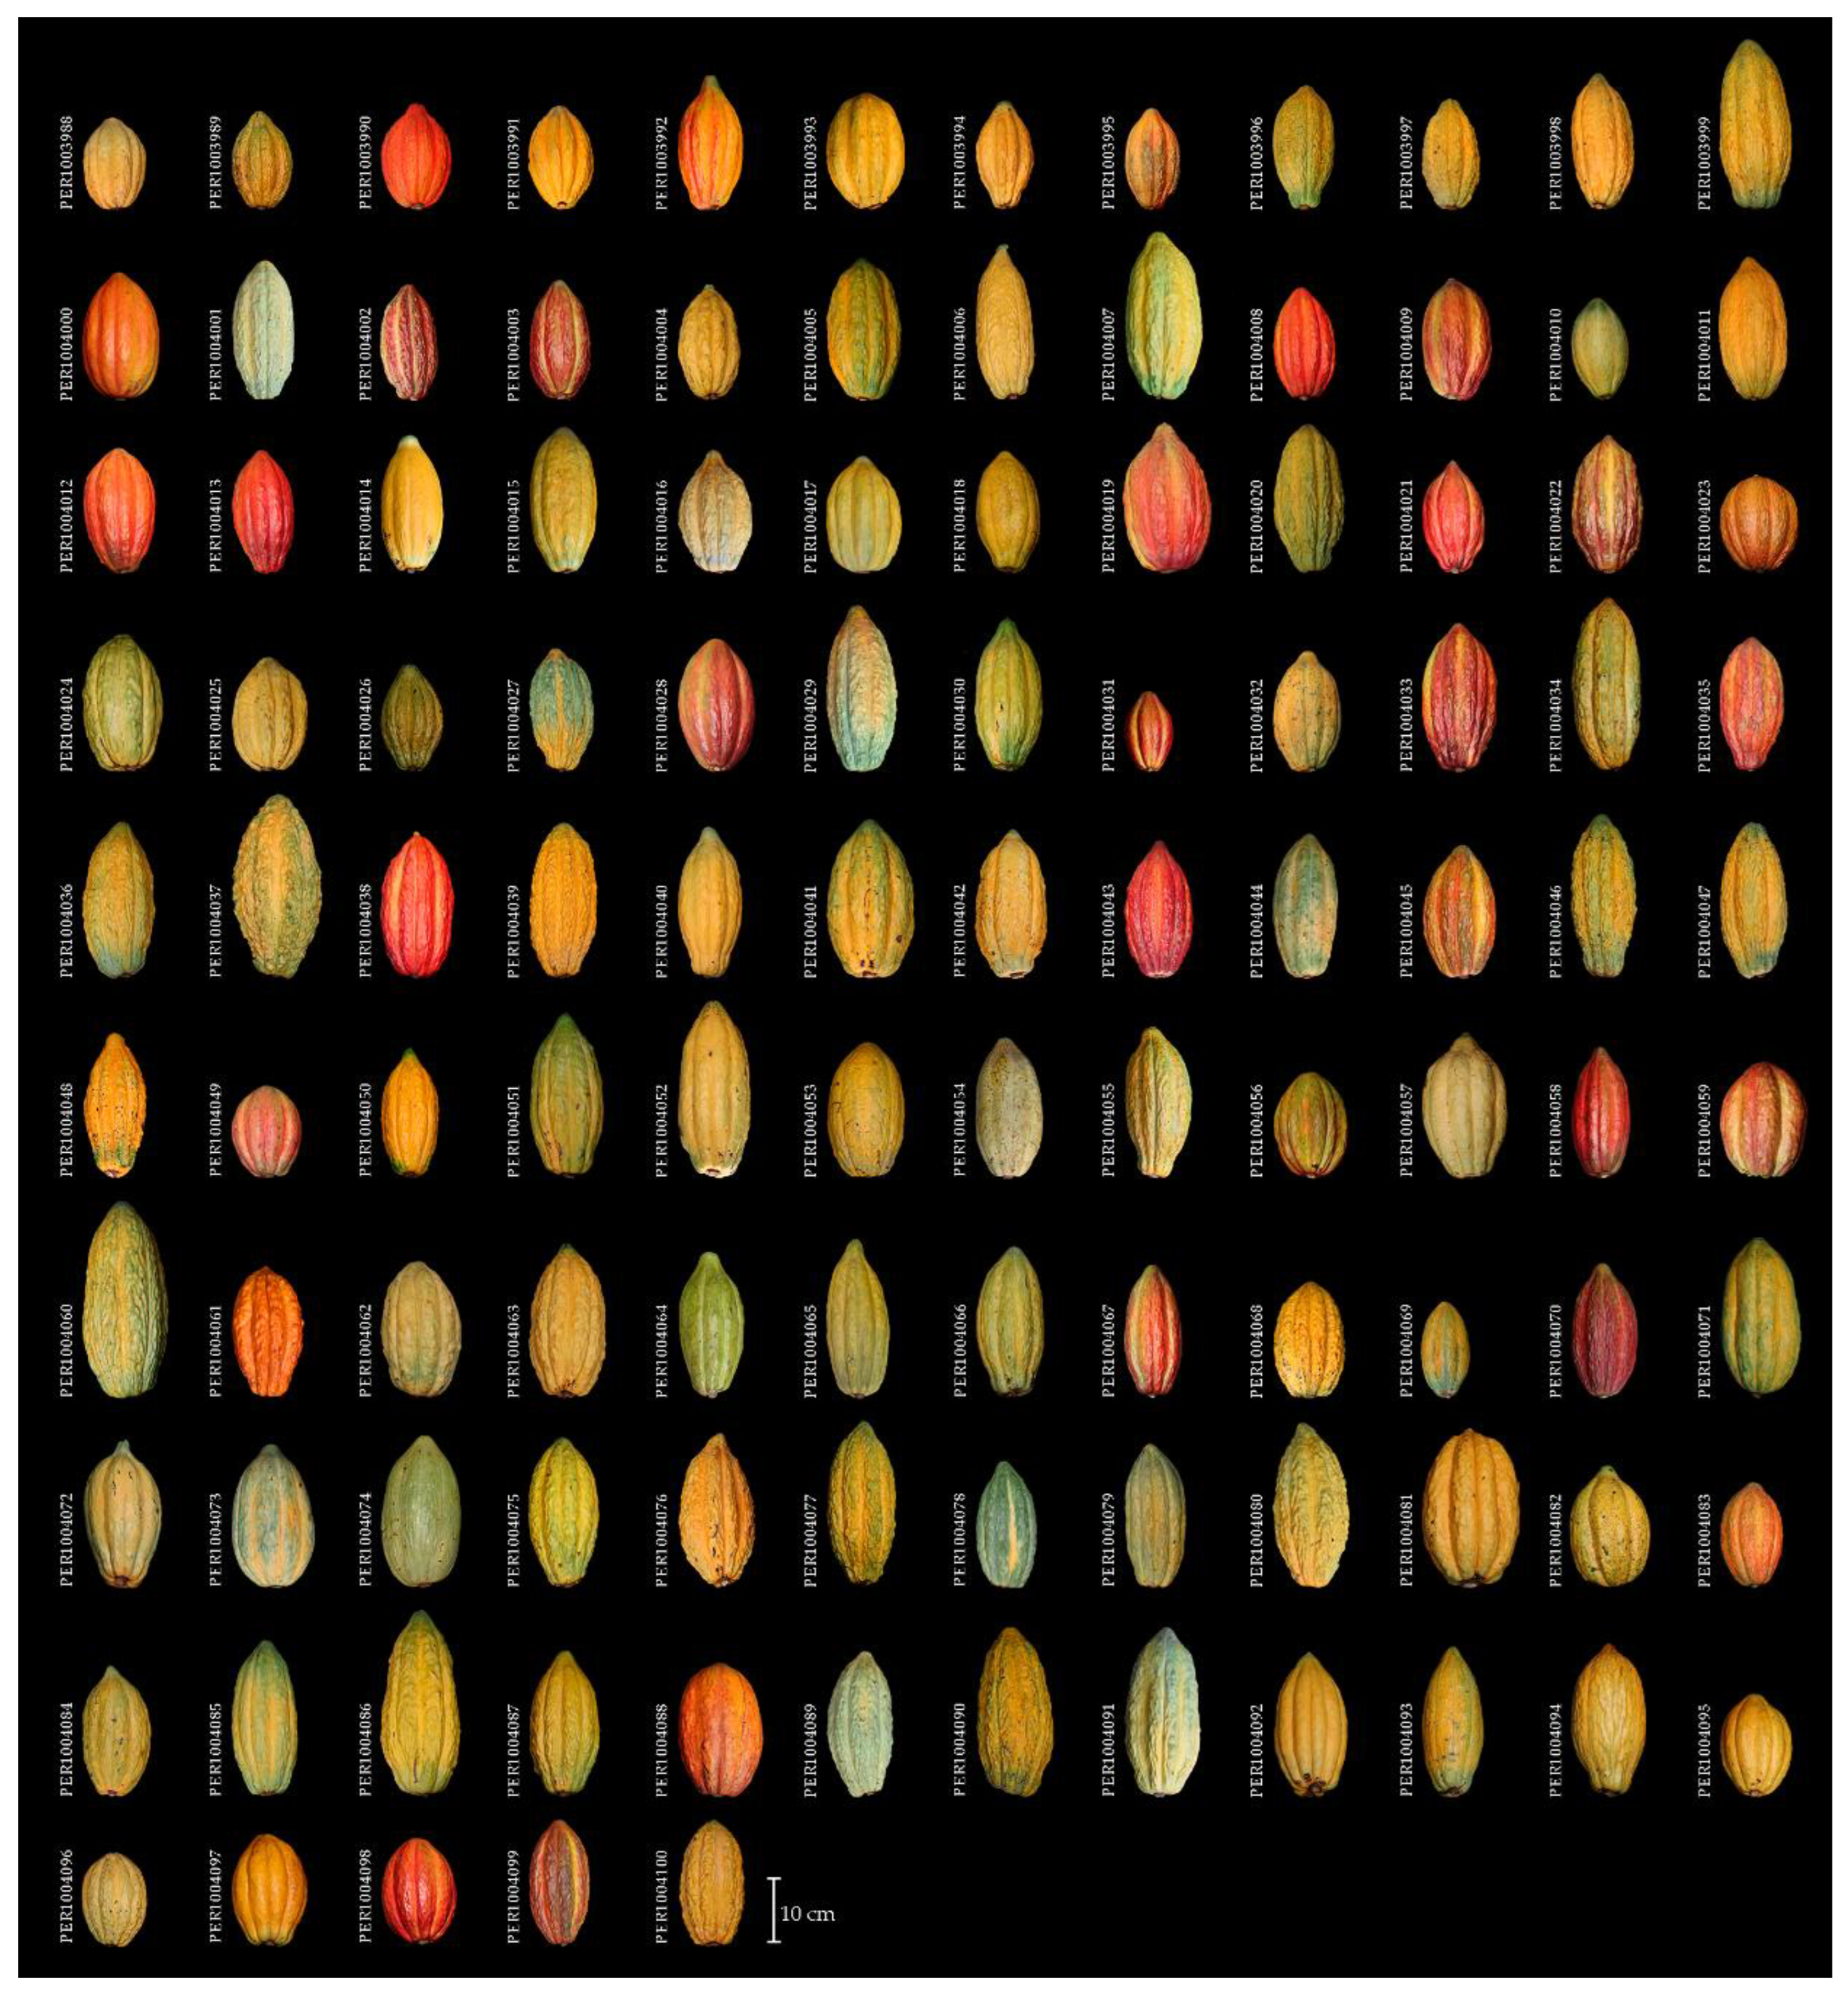
Figure 7.
Dendrogram and heatmap generated through multivariate hierarchical clustering applied to 113 cacao accessions. Columns represent the different quantitative traits, where higher values are indicated by greater blue intensity and lower values by deeper red intensity.
Figure 7.
Dendrogram and heatmap generated through multivariate hierarchical clustering applied to 113 cacao accessions. Columns represent the different quantitative traits, where higher values are indicated by greater blue intensity and lower values by deeper red intensity.
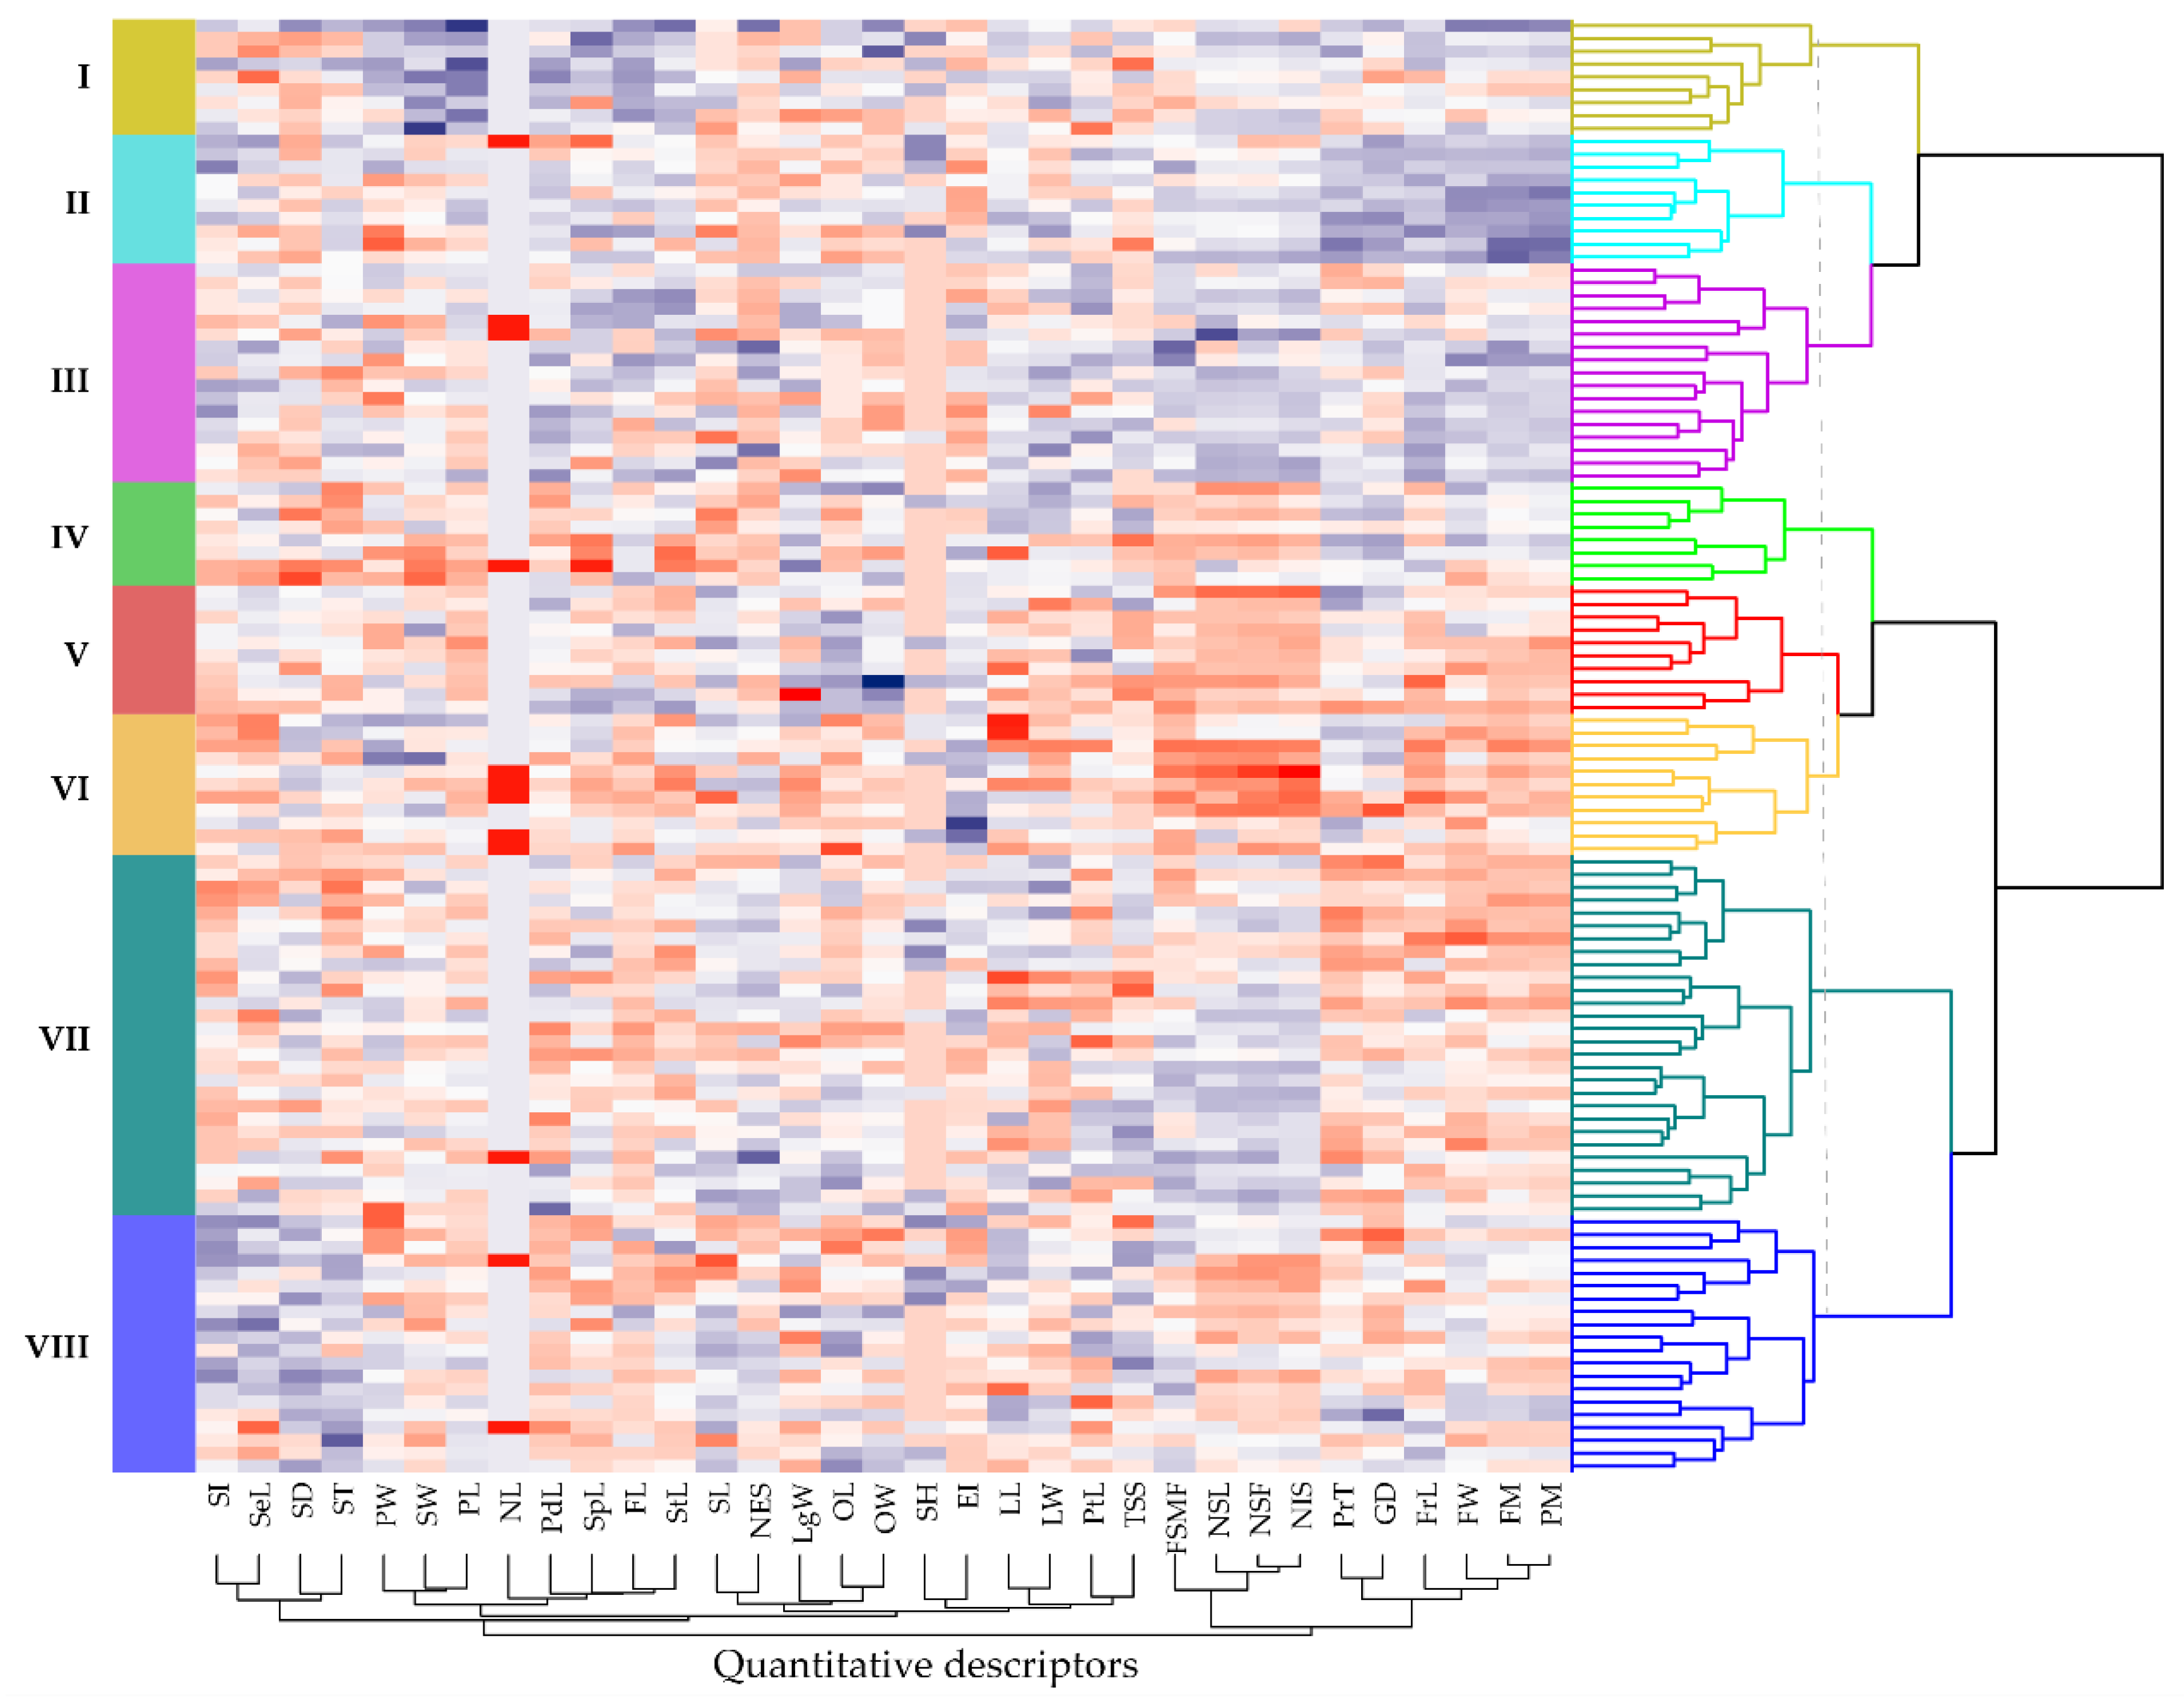
Figure 10.
Phytochemical characterization of cacao cotyledons: (a) bioactive compound content, (b) classification of cacao accessions, (c–d) polyphenol and antioxidant contents among accessions, color-coded according to the phenotypic groups defined in this study, (e) colorimetric analysis of lyophilized cotyledons in the a* and b* plane, (f) FTIR analysis of functional groups, and (g) Pearson correlation network.
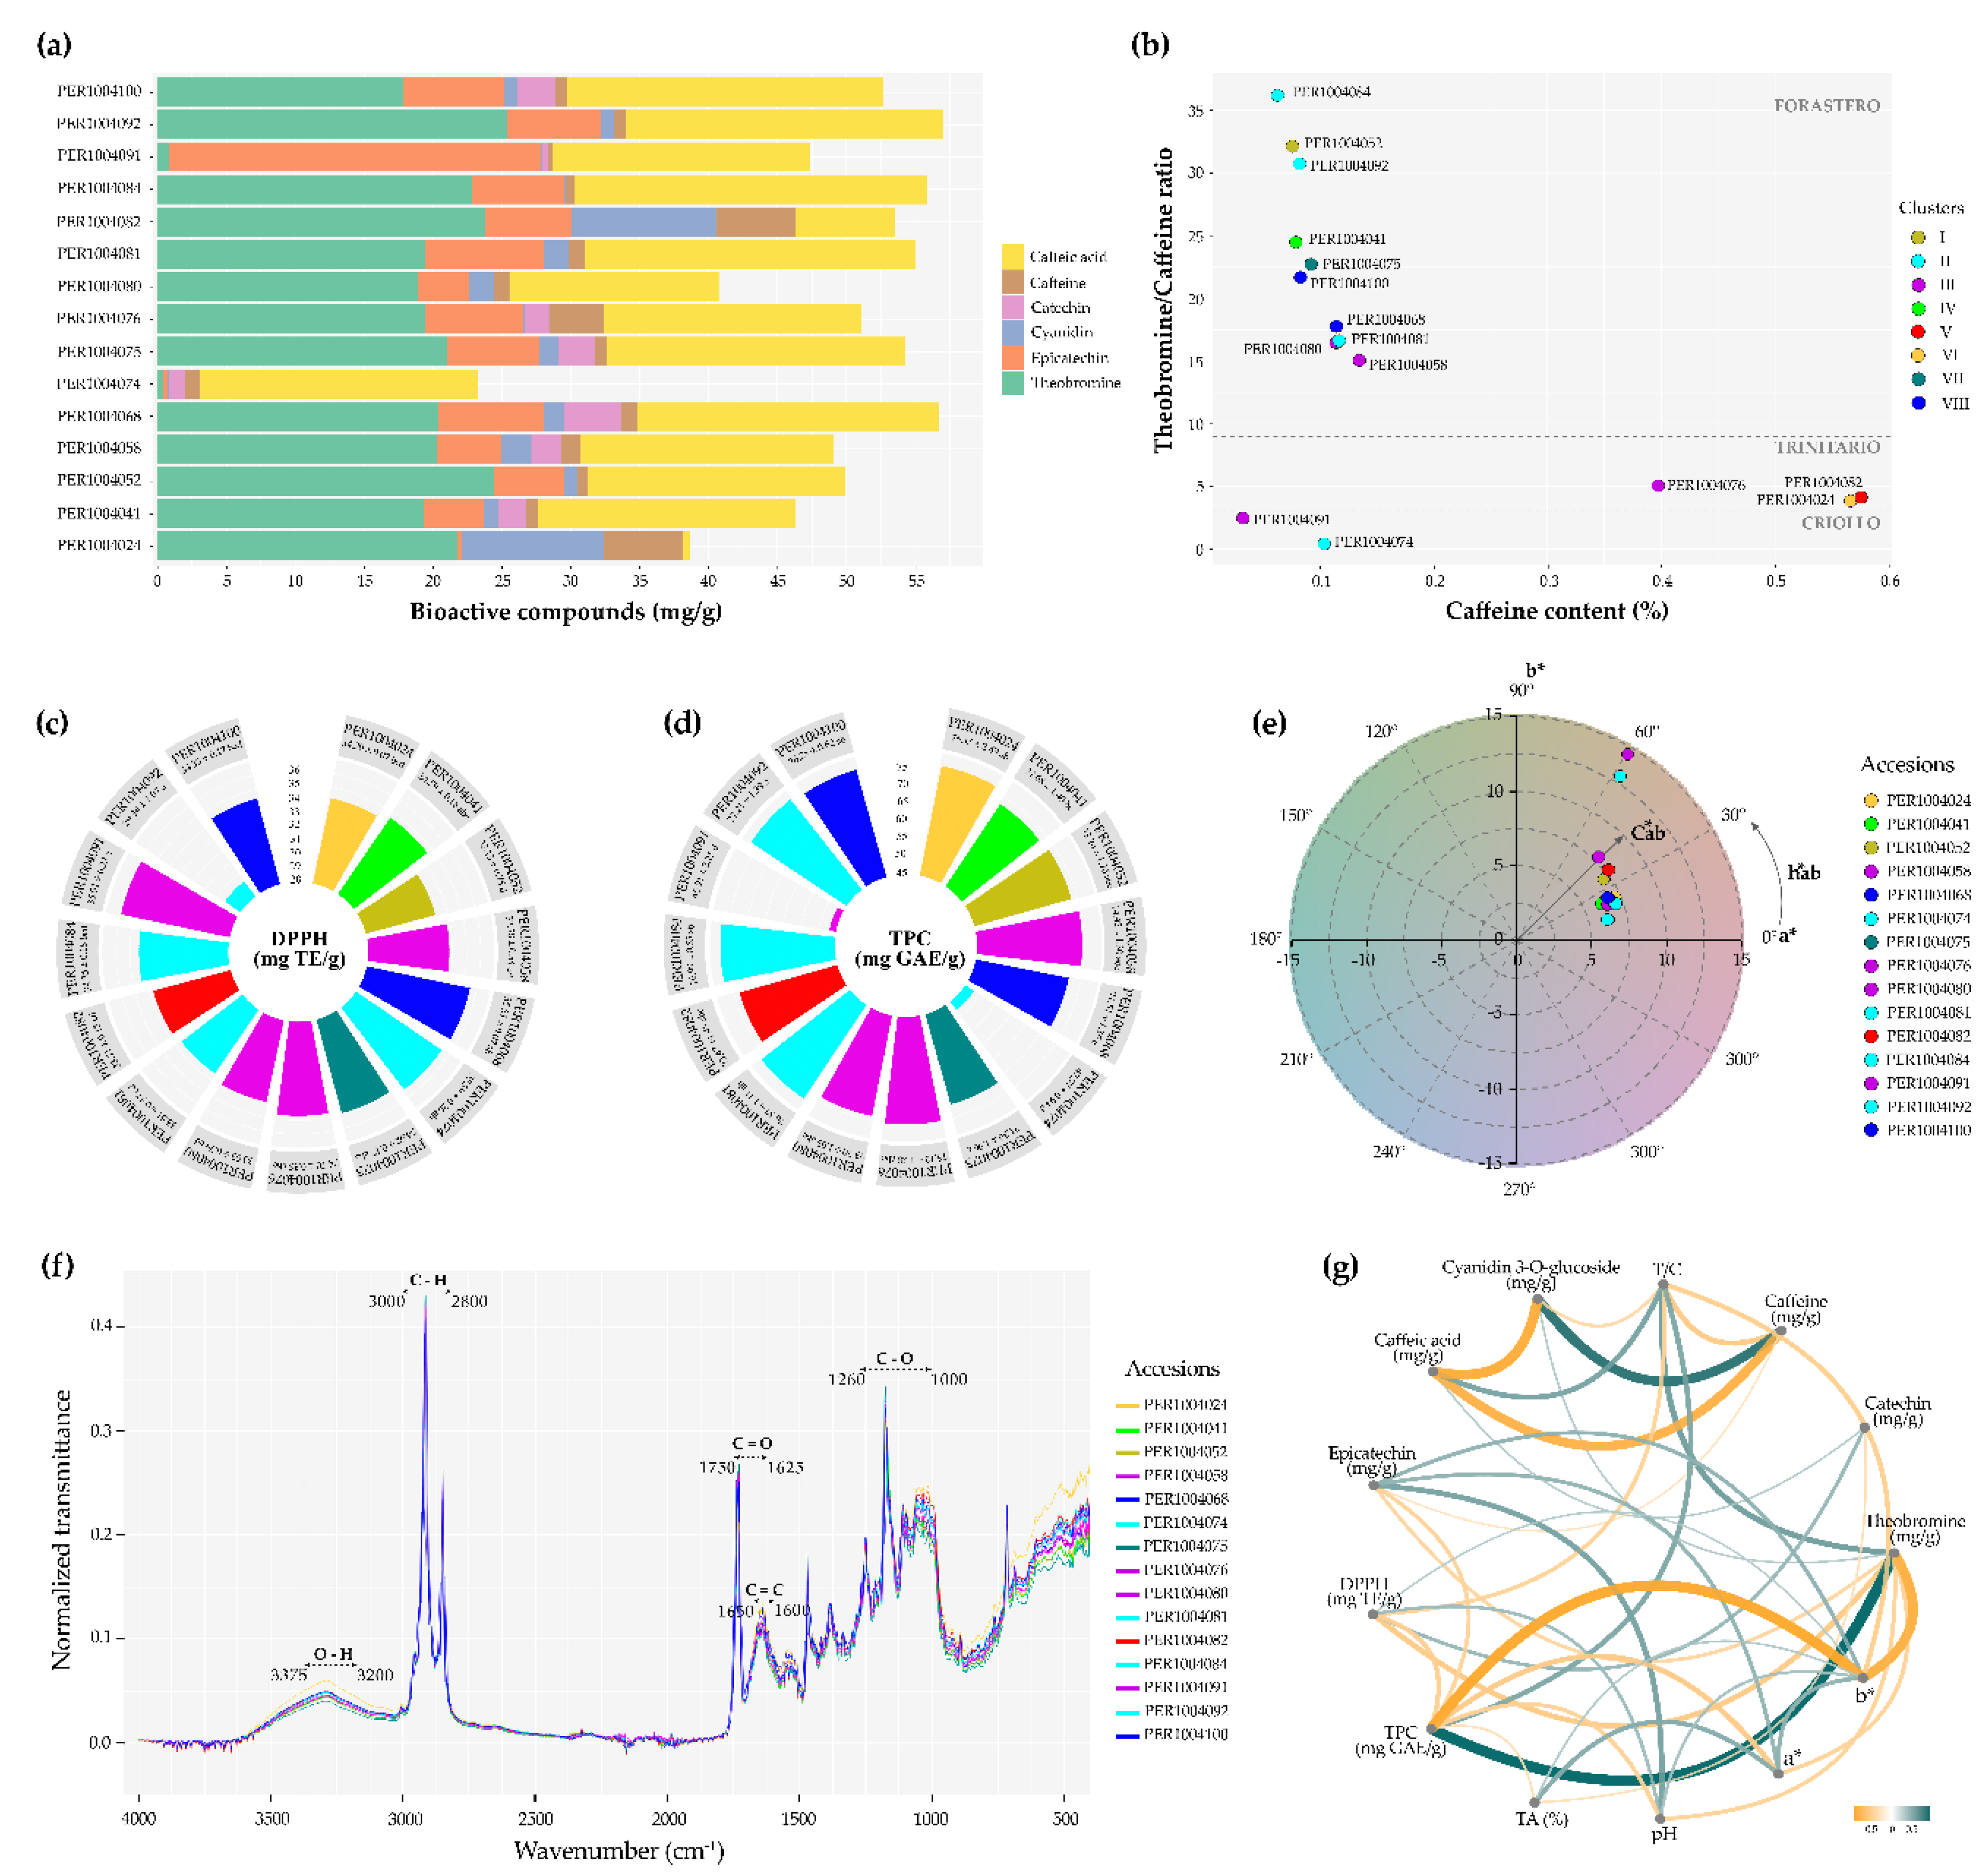
Table 2.
Estimation of genetic variation indicators in quantitative descriptors.
| Estructure | Descriptor | GV | PV | GCV (%) | PCV (%) | H2 (%) | GA | GAM (%) | |
|---|---|---|---|---|---|---|---|---|---|
| Leaf | LL | 27.90 | 0.60 | 1.51 | 2.78 | 4.40 | 39.91 | 1.01 | 3.62 |
| LW | 9.72 | 0.17 | 0.40 | 4.22 | 6.52 | 41.83 | 0.55 | 5.62 | |
| PtL | 1.84 | 0.01 | 0.07 | 6.35 | 14.10 | 20.28 | 0.11 | 5.89 | |
| Flower | PdL | 1.63 | 0.05 | 0.09 | 14.26 | 17.95 | 63.11 | 0.38 | 23.34 |
| SpL | 7.92 | 0.96 | 1.27 | 12.36 | 14.21 | 75.59 | 1.75 | 22.13 | |
| SW | 2.63 | 0.22 | 0.28 | 17.71 | 20.27 | 76.30 | 0.84 | 31.86 | |
| PL | 3.90 | 0.16 | 0.23 | 10.40 | 12.36 | 70.82 | 0.70 | 18.03 | |
| PW | 2.11 | 0.04 | 0.08 | 9.08 | 13.21 | 47.26 | 0.27 | 12.86 | |
| LgW | 2.71 | 0.10 | 0.19 | 11.43 | 16.16 | 50.05 | 0.45 | 16.66 | |
| FL | 3.99 | 1.67 | 2.06 | 32.36 | 35.98 | 80.90 | 2.39 | 59.96 | |
| StL | 6.76 | 0.36 | 0.50 | 8.84 | 10.46 | 71.38 | 1.04 | 15.38 | |
| SL | 3.35 | 0.01 | 0.65 | 2.99 | 24.02 | 1.55 | 0.03 | 0.77 | |
| OL | 1.71 | 0.04 | 0.09 | 11.89 | 17.43 | 46.50 | 0.29 | 16.70 | |
| OW | 1.23 | 0.03 | 0.05 | 14.31 | 17.64 | 65.76 | 0.29 | 23.90 | |
| Fruit | SH | 0.36 | 0.01 | 0.01 | 27.90 | 27.90 | 100.00 | 0.21 | 57.48 |
| FM | 767.30 | 53286.70 | 68984.54 | 30.08 | 34.23 | 77.24 | 417.94 | 54.47 | |
| FrL | 19.54 | 7.29 | 10.56 | 13.81 | 16.62 | 69.04 | 4.62 | 23.65 | |
| FD | 9.85 | 0.67 | 1.05 | 8.32 | 10.38 | 64.19 | 1.35 | 13.73 | |
| PrT | 2.06 | 0.13 | 0.19 | 17.58 | 20.97 | 70.27 | 0.63 | 30.36 | |
| GD | 1.34 | 0.08 | 0.10 | 21.17 | 23.31 | 82.47 | 0.53 | 39.61 | |
| PM | 545.16 | 34718.83 | 47675.19 | 34.18 | 40.05 | 72.82 | 327.56 | 60.08 | |
| NL | 4.89 | 0.02 | 0.02 | 2.57 | 2.57 | 100.00 | 0.26 | 5.30 | |
| TSS | 17.35 | 1.51 | 1.51 | 7.09 | 7.09 | 100.00 | 2.53 | 14.60 | |
| Seed | NSL | 7.86 | 0.67 | 2.60 | 10.43 | 20.52 | 25.81 | 0.86 | 10.91 |
| FSMF | 147.29 | 985.50 | 1809.02 | 21.31 | 28.88 | 54.48 | 47.73 | 32.41 | |
| NSF | 40.39 | 24.52 | 57.81 | 12.26 | 18.82 | 42.42 | 6.64 | 16.45 | |
| SI | 1.28 | 0.03 | 0.11 | 13.86 | 25.51 | 29.55 | 0.20 | 15.52 | |
| EI | 20.57 | 1.60 | 64.09 | 6.15 | 38.93 | 2.50 | 0.41 | 2.00 | |
| NIS | 36.36 | 18.69 | 61.61 | 11.89 | 21.59 | 30.33 | 4.90 | 13.49 | |
| NES | 4.03 | 1.32 | 8.40 | 28.48 | 71.86 | 15.71 | 0.94 | 23.26 | |
| SeL | 26.12 | 2.35 | 5.14 | 5.87 | 8.68 | 45.78 | 2.14 | 8.18 | |
| SD | 13.88 | 0.86 | 2.16 | 6.67 | 10.59 | 39.74 | 1.20 | 8.67 | |
| ST | 9.09 | 0.28 | 1.82 | 5.79 | 14.83 | 15.25 | 0.42 | 4.66 |
GCV and PCV = low (< 10%), moderate (10-20%), high (> 20%); H2 = low (< 30%), moderate (30-60%), high (> 60%); GAM = low (< 10%), moderate (10-20%), high (> 20%). .
Table 3.
Overall means and standard deviation (S.D.) of 33 quantitative agromorphological descriptors by phenotypic clusters.
Table 3.
Overall means and standard deviation (S.D.) of 33 quantitative agromorphological descriptors by phenotypic clusters.
| Descriptors | Cluster I Mean ± S.D | Cluster II Mean ± S.D | Cluster III Mean ± S.D | Cluster IV Mean ± S.D | Cluster V Mean ± S.D | Cluster VI Mean ± S.D | Cluster VII Mean ± S.D | Cluster VIII Mean ± S.D |
|---|---|---|---|---|---|---|---|---|
| LL | 28.28 ± 0.68 ab | 28.46 ± 0.60 a | 28.13 ± 0.71 ab | 28.34 ± 1.45 ab | 27.17 ± 1.05 ab | 26.87 ± 1.71 b | 27.78 ± 1.26 ab | 28.19 ± 1.28 ab |
| LW | 9.93 ± 0.58 ab | 9.76 ± 0.65 ab | 10.02 ± 0.63 ab | 10.14 ± 0.60 a | 9.29 ± 0.35 b | 9.31 ± 0.55 b | 9.75 ± 0.75 ab | 9.60 ± 0.40 ab |
| PtL | 1.83 ± 0.23 a | 1.88 ± 0.16 a | 2.00 ± 0.22 a | 1.85 ± 0.11 a | 1.82 ± 0.25 a | 1.78 ± 0.14 a | 1.77 ± 0.21 a | 1.83 ± 0.24 a |
| PdL | 1.91 ± 0.23 a | 1.71 ± 0.21 abc | 1.79 ± 0.27 ab | 1.45 ± 0.19 c | 1.73 ± 0.19 abc | 1.55 ± 0.11 bc | 1.59 ± 0.31 bc | 1.45 ± 0.16 c |
| SpL | 8.88 ± 1.39 a | 7.98 ± 1.29 abc | 8.50 ± 0.89 ab | 6.99 ± 0.37 c | 8.01 ± 1.04 abc | 7.69 ± 0.84 abc | 7.92 ± 0.78 abc | 7.40 ± 0.82 bc |
| SW | 3.69 ± 0.64 a | 2.43 ± 0.26 bc | 2.59 ± 0.28 bc | 2.18 ± 0.52 c | 2.73 ± 0.45 b | 2.79 ± 0.66 b | 2.60 ± 0.28 bc | 2.38 ± 0.32 bc |
| PL | 5.00 ± 0.57 a | 3.98 ± 0.33 b | 3.91 ± 0.33 bc | 3.56 ± 0.20 cd | 3.52 ± 0.19 d | 3.83 ± 0.32 bcd | 3.78 ± 0.26 bcd | 3.86 ± 0.27 bcd |
| PW | 2.40 ± 0.23 a | 1.98 ± 0.33 b | 2.09 ± 0.29 ab | 1.98 ± 0.22 b | 2.05 ± 0.19 b | 2.26 ± 0.31 ab | 2.08 ± 0.23 ab | 2.10 ± 0.27 ab |
| LgW | 2.63 ± 0.44 ab | 2.66 ± 0.25 ab | 2.79 ± 0.40 ab | 3.08 ± 0.35 a | 2.73 ± 0.57 ab | 2.50 ± 0.37 b | 2.76 ± 0.28 ab | 2.57 ± 0.41 b |
| FL | 6.21 ± 1.03 a | 4.75 ± 1.02 b | 4.65 ± 1.52 b | 4.39 ± 0.97 bc | 4.16 ± 1.35 bc | 2.82 ± 0.53 d | 3.22 ± 0.67 cd | 3.53 ± 1.13 bcd |
| StL | 7.58 ± 0.62 a | 6.93 ± 0.47 abc | 7.27 ± 0.69 ab | 6.47 ± 0.86 c | 6.61 ± 0.73 bc | 6.42 ± 0.66 c | 6.53 ± 0.53 bc | 6.57 ± 0.56 bc |
| SL | 3.25 ± 0.44 ab | 3.00 ± 0.34 b | 3.32 ± 0.61 ab | 2.83 ± 0.32 b | 3.71 ± 0.44 a | 3.33 ± 0.54 ab | 3.46 ± 0.40 ab | 3.45 ± 0.67 ab |
| OL | 1.72 ± 0.20 b | 1.56 ± 0.16 b | 1.70 ± 0.16 b | 1.62 ± 0.28 b | 2.03 ± 0.21 a | 1.47 ± 0.20 b | 1.73 ± 0.25 ab | 1.76 ± 0.31 ab |
| OW | 1.35 ± 0.31 ab | 1.20 ± 0.15 ab | 1.15 ± 0.13 b | 1.32 ± 0.23 ab | 1.42 ± 0.34 a | 1.14 ± 0.09 b | 1.19 ± 0.12 ab | 1.22 ± 0.19 ab |
| SH | 0.39 ± 0.12 ab | 0.43 ± 0.13 a | 0.31 ± 0.02 b | 0.33 ± 0.07 ab | 0.34 ± 0.08 ab | 0.35 ± 0.08 ab | 0.36 ± 0.09 ab | 0.38 ± 0.12 ab |
| FM | 852.33 ± 148.86 bc | 1267.08 ± 195.55 a | 958.86 ± 162.81 b | 769.7 ± 73.47 cd | 606.5 ± 116.97 de | 543.5 ± 125.93 e | 618.6 ± 123.27 de | 726.9 ± 132.81 cde |
| FrL | 21.00 ± 2.26 ab | 23.52 ± 1.71 a | 22.40 ± 2.18 a | 19.05 ± 2.25 bc | 17.01 ± 1.90 c | 16.77 ± 2.65 c | 18.34 ± 2.12 bc | 19.15 ± 2.43 bc |
| FW | 10.32 ± 1.00 b | 11.28 ± 0.56 a | 10.30 ± 0.76 b | 10.22 ± 0.98 b | 9.50 ± 0.73 bc | 9.06 ± 0.55 c | 9.11 ± 0.56 c | 10.07 ± 0.55 b |
| PrT | 2.15 ± 0.37 b | 2.67 ± 0.30 a | 2.05 ± 0.26 bc | 2.31 ± 0.28 ab | 2.13 ± 0.47 b | 2.18 ± 0.39 b | 1.71 ± 0.29 c | 2.01 ± 0.29 bc |
| GD | 1.30 ± 0.24 bc | 1.81 ± 0.15 a | 1.32 ± 0.22 bc | 1.56 ± 0.27 ab | 1.37 ± 0.21 bc | 1.36 ± 0.32 bc | 1.16 ± 0.19 c | 1.27 ± 0.35 bc |
| PM | 642.40 ± 139.25 b | 972.28 ± 137.75 a | 663.81 ± 125.82 b | 600.78 ± 86.20 b | 398.56 ± 96.74 c | 407.16 ± 110.11 c | 401.39 ± 85.58 c | 515.21 ± 127.65 bc |
| NL | 5.00 ± 0.01 a | 4.90 ± 0.32 ab | 4.88 ± 0.33 ab | 4.88 ± 0.35 ab | 5.00 ± 0.01 a | 4.55 ± 0.52 b | 4.96 ± 0.19 a | 4.90 ± 0.31 ab |
| TSS | 16.05 ± 2.95 a | 16.81 ± 0.45 a | 17.85 ± 2.13 a | 16.81 ± 3.95 a | 16.10 ± 3.60 a | 16.18 ± 1.13 a | 17.94 ± 3.07 a | 18.45 ± 3.48 a |
| NSL | 8.50 ± 0.73 a | 8.43 ± 0.64 ab | 9.09 ± 1.42 a | 7.15 ± 1.21 c | 6.42 ± 0.58 c | 6.52 ± 1.37 c | 8.43 ± 0.84 ab | 7.19 ± 0.83 bc |
| FSMF | 136.3 ± 18.68 bc | 166.9 ± 28.72 ab | 180.4 ± 35.64 a | 117.3 ± 11.39 cd | 111.8 ± 23.35 cd | 97.4 ± 21.99 d | 155.1 ± 33.74 ab | 160.4 ± 28.27 ab |
| NSF | 43.48 ± 3.42 a | 41.92 ± 4.40 ab | 46.02 ± 3.58 a | 35.15 ± 3.97 cd | 32.83 ± 2.76 cd | 31.88 ± 6.35 d | 45.18 ± 4.16 a | 37.31 ± 4.21 bc |
| SI | 1.34 ± 0.26 abc | 1.44 ± 0.28 ab | 1.36 ± 0.25 abc | 1.14 ± 0.14 c | 1.18 ± 0.14 bc | 1.11 ± 0.17 c | 1.11 ± 0.18 c | 1.53 ± 0.29 a |
| EI | 18.68 ± 3.71 b | 17.63 ± 5.05 b | 18.06 ± 5.27 b | 21.87 ± 4.45 b | 23.49 ± 2.18 ab | 29.18 ± 7.32 a | 20.19 ± 4.30 b | 18.82 ± 5.00 b |
| NIS | 39.72 ± 4.73 a | 39.78 ± 4.66 a | 41.95 ± 4.61 a | 33.04 ± 3.64 bc | 29.15 ± 3.23 bc | 27.44 ± 6.35 c | 39.89 ± 3.73 a | 33.27 ± 4.55 b |
| NES | 3.76 ± 2.93 ab | 2.14 ± 0.80 b | 4.07 ± 1.62 ab | 2.11 ± 0.85 b | 3.68 ± 1.33 ab | 4.44 ± 1.85 ab | 5.29 ± 2.29 a | 4.04 ± 1.70 ab |
| SeL | 25.19 ± 2.12 ab | 26.68 ± 2.11 ab | 26.37 ± 1.75 ab | 26.00 ± 1.91 ab | 26.57 ± 1.11 ab | 24.66 ± 1.93 b | 25.64 ± 1.66 ab | 27.37 ± 2.61 a |
| SD | 13.37 ± 1.56 b | 12.96 ± 0.74 b | 13.32 ± 0.82 b | 12.95 ± 1.81 b | 13.59 ± 0.83 b | 14.19 ± 1.15 ab | 14.04 ± 1.05 ab | 15.16 ± 1.16 a |
| ST | 9.22 ± 1.03 abc | 9.60 ± 0.55 ab | 9.21 ± 0.90 abc | 7.98 ± 0.92 d | 8.82 ± 0.57 bcd | 8.88 ± 1.01 bcd | 8.49 ± 0.83 cd | 10.20 ± 1.01 a |
Mean values ± standard deviation, followed by different letters, indicate significant differences among clusters (Tukey’s HSD test; p ≤ 0.05).
Disclaimer/Publisher’s Note: The statements, opinions and data contained in all publications are solely those of the individual author(s) and contributor(s) and not of MDPI and/or the editor(s). MDPI and/or the editor(s) disclaim responsibility for any injury to people or property resulting from any ideas, methods, instructions or products referred to in the content. |
© 2025 by the authors. Licensee MDPI, Basel, Switzerland. This article is an open access article distributed under the terms and conditions of the Creative Commons Attribution (CC BY) license (http://creativecommons.org/licenses/by/4.0/).
Copyright: This open access article is published under a Creative Commons CC BY 4.0 license, which permit the free download, distribution, and reuse, provided that the author and preprint are cited in any reuse.


