
Submitted:
18 September 2025
Posted:
22 September 2025
You are already at the latest version
Abstract
Digitalisation of mechanical engineering necessitates the use of predictive tools that are explainable and allow for more rapid analysis. The study began with cold spraying (CS) of high entropy alloy (HEA) coatings, Al0.1-0.5CoCrCuFeNi and MnCoCrCuFeNi coatings at nitrogen gas temperatures of 650, 750, and 850 °C. The surface roughness, Ra, was measured using profilometry and microscopy techniques. The data set comprised 20 samples with varying experimental conditions and seven measured parameters (five input variables and surface roughness (Ra) as the output. The stacking ensemble structure included three base learners, Linear Regression (LR), Extreme Gradient Boosting (XGBoost), and Gaussian Process Regression (GPR) with RidgeCV as the meta-learner. LR was chosen due to its simplicity and interpretability, GPR was chosen due to its ability to capture nonlinear trends with small datasets, and RidgeCV was used to stabilize the model by shrinking coefficients and reducing variance. This ensemble was compared with XGBoost, which is a powerful single machine learning approach. Results indicated that the stacking ensemble performed better than XGBoost in all the regression metrics. XGBoost reached 96.79% accuracy, RMSE of 0.22 µm, MAPE of 3.32%, and R2 of 0.83, whereas the stacking ensemble achieved 97.26% accuracy, RMSE of 0.17 µm, MAPE of 2.73%, and R2 of 0.89. The results validate that stacking ensembles can improve predictive and robust performance even in scenarios of small data. These novel stacking-ensemble and analysis methods can be broadened for future applicability.
Keywords:
High entropy alloys
; Surface roughness
; Stacking ensemble
; Linear Regression
; Gaussian Process Regression
; Extreme Gradient Boosting
; RidgeCV
1. Introduction
The advancement in metallurgical science has led to the creation of alloys with superior and more specific properties compared to individual metals. Traditionally, alloys primarily consist of one main element, restricting the compositional diversity and freedom. A revolutionary concept introduced by Yeh, known as High Entropy Alloy (HEA), diverges from this norm by incorporating a minimum of five primary elements, each making up 5-35% in atomic percentage [1,2].
Elements with smaller quantities, less than 5%, are said to be secondary alloying elements. Presently, current areas of interest include alloys of elements such as Al, Co, Cr, Cu, Fe, and Ni, and alloys of those based on these by other elements or substitutions [3]. The potential for discovering new alloys remains vast. HEAs are recognized for their structural and functional capabilities, owing to a high mixing entropy that encourages the formation of solid solutions with uncomplicated microstructures. The promising strength and hardness, enhanced stress and strain tolerance, and reduced temperature sensitivity of HEAs are due to multiple core effects, including high mixing entropy, lattice distortion, sluggish diffusion, and a cocktail effect [4,5]. HEAs' remarkable attributes and microstructural characteristics stem from several core effects, including high mixing entropy, lattice distortion, sluggish diffusion, and a cocktail effect [6]. Notably, Al0.5CoCrCuFeNi alloy variants, through specific processing, have exhibited superior fatigue strength compared to many traditional alloys [7]. HEAs' tribological performance is influenced by their chemical composition; elements like Al, Fe, and Nb refine the grain structure and promote the formation of BCC phases, while Mn and Cr aid in developing hard phases [6]. C, N, B, and Si additions improve the creation of compounds or phase changes, causing the hardening and wear resistance to increase. The wear resistance of HEAs is greatly affected by the phase composition, where complex and ordered phases are better than traditional alloys having the same hardness [8]. Therefore, HEAs are currently undergoing growing use in creating very wear-resistant finishes using multiple deposition methods, with the addition of ceramic particles to the metal base to increase hardness and decrease wear rates [9,10,11,12,13].
One of the most significant parameters in any industrial application is the surface roughness, which can significantly affect the performance, life cycle, and aesthetic quality of any element that is produced [14,15]. The level of surface roughness affects not only the functional problems of the machining process, i.e., the friction, wear resistance, and fatigue lifetime, but also the very cost-effective performance of the production process in general [16,17,18]. As an example, the aerospace and automobile manufacturing industry needs the optimum surface roughness in order to determine the durability and reliability of the products to withstand the high-stress conditions [19]. Moreover, the accurate control of the surface roughness can potentially lead to an even better product performance and fewer demands of post-processing, which subsequently leads to more sustainable manufacturing processes [20]. This implies that the factors that the surface roughness is dependent on should be understood and well-controlled to ensure high-quality standards of industrial production [21].
Machine learning (ML) is a computational approach, the main goal of which is to identify systematic patterns in data sets that are not easily discernible by humans [22]. The use of extreme gradient boosting (XGBoost) in mechanical engineering has been successfully used in predicting process outcomes and material properties. Shahani et al [23]. developed an XGBoost model that predicts the static and dynamic young’s modulus of intact sedimentary rocks based on inputs, including density, wave velocities, and uniaxial compressive strength. The model was more accurate than other ML and traditional regression methods and outperformed them. In a study by Mustapha et al [24]. , XGBoost was used to predict the mechanical and physical properties of pervious concrete, including compressive strength, tensile strength, density, and porosity. The model achieved a high predictive accuracy, which shows robustness in the ability to deal with complex material behavior. Ou et al [25]. used the combination of XGBoost ensemble approaches and discrete element modelling to predict autogenous grinding mill throughput. The results of this provided a good agreement with the validation dataset. XGBoost showed high predictive performance with the test dataset. Gao et al [26]. proposed a distinctive material removal model with machine learning and acoustic sensing of robotic belt grinding of Inconel 718. Once training and optimisation have been carried out, the new k-fold XGBoost technique is introduced to the material removal (MR) model. The results of the test indicate that the values obtained via the model coincide with those measured. The model determined that the mean absolute percentage error (MAPE) of material removal was 4.37%.
Recently, the field of machine learning (ML) has proposed new methods of prediction. The stacking ensemble method is one of them. Baraheni et al [27]. used this technique in predicting delamination and thrust in 72 carbon fiber reinforced polymers (CFRP) drilling runs. The superiority of the ensemble over the individual models was demonstrated by the fact that the MAE and RMSE values reduced substantially by up to 97%, 124% in the case of delamination, and 205%, 154% in the case of thrust force, as compared to the best base learner. Jones et al [28]. integrated the load-cell, accelerometer, and acoustic-emission signals into a three-level architecture and stacked a Random Forest (RF), an Artificial Neural Network (ANN), and XGBoost to forecast CNC-milling tool flank wear. The ensemble achieved an R² value of 0.95 and an RMSE of 58.23. It was better than any single model and enabled prognostics and health management in real-time machining monitoring. According to Natarajan et al [29]., a two-stage pipelined structure with discretization of the output is proposed, where a regressor was controlled by a classifier. The resulting meta-model was more accurate, with the coefficient of determination (R2) of the XGBoost method more than 90% for all materials. This was significantly better than single-model models in predicting Ra.
This study used a novel stacking ensemble to predict the surface roughness of cold-sprayed HEA coatings from a limited dataset and compares its performance with a strong single ML model. The results indicated that the ensemble performs better in terms of accuracy metrics compared to the single model and can be used to make reliable predictions and parameter optimization using small data sets.
2. Materials and Methods
2.1. Experimental Setup
Data are required for any prediction method, including statistical or artificial ones. Data from 20 experimental conditions were collected [1]. The data set includes seven different parameters. Five of them are input measured before the setup experiment procedure, and one of them is surface roughness (Ra) as output (Table 1). High purities (>99.9%) of Al, (Mn), Co, Cr, Cu, Fe, and Ni elemental powders were processed through mechanical alloying (MA) to obtain octonary HEAs Al0.1-0.5CoCrCuFeNi and MnCoCrCuFeNi (all in molar ratio). The designation of the samples was summarized in the following table. Based on these feedstocks, deposition of new HEA coatings on Mg substrates was performed by cold spraying at nitrogen gas temperatures of 650, 750, and 850 °C [30,31].
2.2. Data preprocessing
The most complex aspect of implementing a data set is describing qualitative factors alongside quantitative ones so that prediction algorithms can handle them. Therefore, categorical inputs must be encoded, called one-hot encoding. The surface roughness directions included two distinct categories (parallel and perpendicular); therefore, the qualitative variables were converted into a numerical format by the use of OneHotEncoding, similarly for alloy type. The parameters cut off and the number of cut off were not included in the analysis since these parameters were constant throughout the dataset. The Python code was run in Google Colab.
2.3. Accuracy metrics
Evaluating metrics is an important method to assess how well an ML regression analysis prediction model performs. Metrics are analytical and mathematical structures that are used to find how closely the projected output matches the actual result. Accuracy normalises the mean absolute error divided by the range of observed target values, as seen in equation (1). Some of the most commonly used metrics in research are mean absolute error (MAE) and root mean squared error (RMSE). According to equation (2), the RMSE measures the dispersion of the residuals and indicates how well the data fits the model. The lower the RMSE values, the better the models. Equation (3) shows that the MAE evaluates the precision of continuous variables independent of the direction of the mistake. Hence, the MAE is consistently less than the RMSE. The coefficient of determination () represents the percentage of variation in the dependent variable that is elucidated by the independent variable using equation (4). It can range from −∞ to 1; the higher the values, the better [32]. A recent study [33] has shown that the coefficient of determination () is more relevant than the other statistical criteria, such as RMSE and MAE, and that it is better to incorporate it with standard metrics to obtain more realistic judgments. The mean absolute percentage error (MAPE) is the most popular metric for predicting error, most likely because the variable's units are scaled to percentage units, making it simpler to interpret. This is calculated using equation (5) [34,35,36].
where is the actual value of the output results from the dataset, is the predicted value from any machine learning algorithm, is the mean value of the actual output, and is the mean value of the predicted output.
2.4. Machine Learning Implementation
2.4.1. Extreme gradient boosting
Extreme Gradient Boosting (XGBoost) is an effective algorithm that constructs a series of small decision trees, each at the current step correcting the previous errors. It copes well with missing values, regularizes complexity, and scales well on tabular data. With XGBoost, declared accuracy with tuning and early stopping is usually high, with much less overfitting and training time reduction [28,37,38]. In this paper, XGBoost was run using the xgboost library in Python. Figure 1 shows the structure of the XGBoost model employed in this study.
2.4.2. Stacking ensemble
A stacking ensemble approach was developed by averaging the outputs of different algorithms. This technique uses the predictions made by a number of base models to create a more accurate and reliable prediction. This model can be used in regression and classification problems. Several base models (ML models) are trained on the dataset in a stacking ensemble. A meta-model, a higher-level model, utilizes the predictions of the base models as inputs or training data. With the strengths of the base models, the meta-model can take advantage and make a final prediction [28].
The stacking ensemble architecture of this study is distinctive since it possesses three base-learner ML models and one ML meta-learner. The dataset was used to train the three base learners, and the Ra predictions were generated on a test set. The data used to train the meta-learner would be Ra predictions by the base-learners. The meta-model does not employ the original statistical features, but employs the base model predictions as features. The meta-model is validated against a test set as a way to give a fused forecast that is more accurate [28]. Figure 2 shows a diagram of the stacking ensemble architecture applied in this paper.
In this paper, a new stacking ensemble machine learning approach was employed. Linear Regression (LR) was chosen because of its ease of interpretation and simplicity, whereas Gaussian Process Regression (GPR) was chosen because of its capability to capture complex nonlinear patterns in small data sets [39,40]. A cross-validated version of ridge regression, ridgeCV, was chosen as the meta-learner because it shrinks coefficients and decreases variance to stabilize the model and help avoid overfitting of combined base learners [41]. Therefore, LR, XGBoost, and GPR were used as the base learners, and RidgeCV was used as the meta-learner. This innovative stacking ensemble method, LR + XGBoost + GPR → RidgeCV, has been selected because of the small size of the dataset, and allows avoiding overfitting and enhancing the predictive stability.
3. Results and Conclusions
The analysis of variance (ANOVA) test has long been a vital mechanism for researchers performing studies on multiple experimental classes. However, it cannot provide precise information on differences among the various study groups or on complex combinations of groups. In order to measure the impact of input parameters on output ones, ANOVA is used to analyze all of the variability. Using this technique, we may divide the total variance into its component parts and give each part a degree of freedom in the model. In this work, three factors are taken into account as input controls, and the experimental value of this dataset was used to assess the surface roughness. For this data set, quadratic models were unable to display the important model analysis, as seen in Table 4, which displays the response surface. These models summarize the ANOVA of each response. Based on the ANOVA in Table 2, the P-value of the Roughness type is 0.28, which shows that although this parameter plays a crucial role in the performance of the part among the other inputs, it is insignificant. A similar analysis was performed for other parameters, as shown in Table 2. It is clear that the Temperature is a more effective parameter than Alloy Type in this investigation. Overall, all parameters are not statistically significant at 95% confidence level (P > 0.05) [42,43].
XGBoost, a widely used ML algorithm to make predictions on structured data, was used in this paper. According to the performance of the models, hyperparameters were selected in each base and meta-model. The hyperparameter tuning was performed by using Bayesian optimization via BayesSearchCV, a method in the scikit-optimize package. To make sure that the best parameter combinations were selected, cross-validation was applied to estimate the performance of each combination. The optimal hyperparameters for the XGBoost model are listed in Table 3. All hyperparameters of the stacking ensemble remained at default values, as implemented in scikit-learn.
Accuracy metrics measure the proximity between predictions and actual values and allow fair comparison between models. The greater R2 and accuracy and smaller RMSE and MAPE prove that the model fits better and the residual variance is smaller, making predictions more reliable. On the evaluation set, the stacking ensemble performed better on all metrics compared to XGBoost. The performance of the two ML models in this study can be seen in Table 4. XGBoost resulted in approximately 97% accuracy, with an RMSE of 0.22 µm, a MAPE of 3.32%, and an R2 of 0.83, whereas the stack produced 97.26% accuracy, an RMSE of 0.17 µm, a MAPE of 2.73%, and an R2 of 0.89. This represents roughly a 23% reduction in RMSE and an 18% reduction in MAPE, with a 0.06 increase in R2. Figure 3 shows each model’s predicted surface roughness, Ra, values versus the actual ones for XGBoost and the stacking ensemble model with LR, XGBoost, and GPR as base learners and RidgeCV as the meta-learner (LR + XGBoost + GPR → RidgeCV) is illustrated in Figure 4.

Table 4.
Performance of the XGBoost and stacking ensemble models.
| Accuracy (%) | RMSE (µm) | MAPE (%) | R2 | |
| XGBoost | 96.79 | 0.22 | 3.32 | 0.83 |
| Stacking ensemble | 97.26 | 0.17 | 2.73 | 0.89 |
Based on the previous research, XGBoost is one of the most powerful algorithms; however, the stacking ensemble method enhances model robustness by using the power of various base learners. The ensemble methods, compared to single models, such as XGBoost, are that they can leverage the strengths of various algorithms and address their weaknesses. In the present paper, where the small size of the data was an issue, ensemble methods proved especially useful, since limited data tends to overfit single models. Stacking ensemble is a broad and generally applicable framework [44,45]. The results of the current study verify that, with appropriate ML models, even in the case of limited data, it can provide more accurate and robust predictions when well-designed ML models (LR + XGBoost + GPR → RidgeCV) are combined.
4. Conclusion
Modern manufacturing is based on data-driven approaches, but datasets are small and expensive to create, making prediction difficult. Machine learning has great potential, but in materials engineering, the models need to be accurate enough and interpretable to be useful in decision-making. Elemental powders of Al, Mn, Co, Cr, Cu, Fe, and Ni (>99.9% purity) were mixed through MA to produce HEAs Al0.1-0.5CoCrCuFeNi and MnCoCrCuFeNi, which were deposited on Mg substrates by CS at temperatures of 650, 750, and 850 °C under Nitrogen gas conditions. Profilometry and microscopy methods were applied to measure the Ra, and thus the parameter set consisted of 20 experimental conditions with seven parameters: five input parameters and one output parameter, Ra. To overcome the problem of having little data, a stacking ensemble was created with LR, XGB, and GPR as base learners and RidgeCV as the meta-learner. All algorithms had complementary advantages. LR was interpretable, GPR was able to capture nonlinear interactions in small datasets, and RidgeCV stabilized the final model by shrinking coefficients and reducing the variance. The results of this ensemble were compared with the results of a powerful single ML model, XGB. The results indicated that the stacking ensemble performed better than XGB in all measures, attaining 97.26% accuracy, RMSE of 0.17, MAPE of 2.73, and R2 of 0.89, whereas XGB had 96.79% accuracy, RMSE of 0.22, MAPE of 3.32, and R2 of 0.83. These results support that stacking ensembles can improve predictive accuracy and robustness in data-limited settings and make them suitable for Ra prediction in CS HEA coatings and other applications in advanced material processing.
Acknowledgments
The research mentioned here is funded by the European Commission, REA through its Marie Sklodowska Curie European Individual Fellowship to one of the authors (SÖ), [Project No: 101018482] (Nov. 2021- Oct. 2023), which is gratefully acknowledged. This publication is also part of the project PNRR-NGEU which has received funding from the MUR-DM117/2023 for one of the writers (MD), [Project No: MUR DM 117/Tsubaki Nakashima – Recovery, reuse and reduction of waste sludge in the production of balls and rolls for rolling bearings] (Nov. 2023- Oct. 2026), which is gratefully acknowledged. This publication is finally part of the project PNRR-NGEU which has received funding from the MUR-DM352/2023 for one of the writers (NS), [Project No: MUR DM 352/TN Italy – Ceramic coatings for the production of balls for hybrid bearings] (Nov. 2022- Oct. 2025), which is gratefully acknowledged. The following are also thanked for their contribution to the experimental part: Dr. Brendan Twamley of TSBI, TCD (XRD), Mr. John Fitzgerald of NHTC of Ireland, Robert Dunbar (OM, metallography, sample preparation), TCD workshop personnel (sample cutting, machining), Giacomo Cappelli (help in CS tests).
References
- Sesana, R.; Sheibanian, N.; Corsaro, L.; Özbilen, S.; Lupoi, R.; Artusio, F. Cold spray HEA coating surface microstructural characterization and mechanical testing. Results in Materials 2024, 21, 100540. [Google Scholar] [CrossRef]
- Yeh, J.-W. Overview of High-Entropy Alloys. In High-Entropy Alloys: Fundamentals and Applications; Gao, M.C., Yeh, J.-W., Liaw, P.K., Zhang, Y., Eds.; Springer International Publishing: Cham, 2016; pp. 1–19. [Google Scholar] [CrossRef]
- Tsai, M.-H.; Yeh, J.-W. High-Entropy Alloys: A Critical Review. Materials Research Letters 2014, 2, 107–123. [Google Scholar] [CrossRef]
- Zhang, Y.; Zuo, T.T.; Tang, Z.; Gao, M.C.; Dahmen, K.A.; Liaw, P.K.; Lu, Z.P. Microstructures and properties of high-entropy alloys. Progress in Materials Science 2014, 61, 1–93. [Google Scholar] [CrossRef]
- Miracle, D.B.; Senkov, O.N. A critical review of high entropy alloys and related concepts. Acta Materialia 2017, 122, 448–511. [Google Scholar] [CrossRef]
- Wu, J.; Chen, Y.; Zhu, H. A Review on the Tribological Performances of High-Entropy Alloys. Advanced Engineering Materials 2022, 24, 2101548. [Google Scholar] [CrossRef]
- Hemphill, M.A.; Yuan, T.; Wang, G.Y.; Yeh, J.W.; Tsai, C.W.; Chuang, A.; Liaw, P.K. Fatigue behavior of Al0.5CoCrCuFeNi high entropy alloys. Acta Materialia 2012, 60, 5723–5734. [Google Scholar] [CrossRef]
- Tong, C.-J.; Chen, M.-R.; Yeh, J.-W.; Lin, S.-J.; Chen, S.-K.; Shun, T.-T.; Chang, S.-Y. Mechanical performance of the AlxCoCrCuFeNi high-entropy alloy system with multiprincipal elements. Metallurgical and Materials Transactions A 2005, 36, 1263–1271. [Google Scholar] [CrossRef]
- Luo, D.; Zhou, Q.; Huang, Z.; Li, Y.; Liu, Y.; Li, Q.; He, Y.; Wang, H. Tribological Behavior of High Entropy Alloy Coatings: A Review. Coatings 2022, 12, 1428. [Google Scholar] [CrossRef]
- Liu, S.S.; Zhang, M.; Zhao, G.L.; Wang, X.H.; Wang, J.F. Microstructure and properties of ceramic particle reinforced FeCoNiCrMnTi high entropy alloy laser cladding coating. Intermetallics 2022, 140, 107402. [Google Scholar] [CrossRef]
- Zhu, S.; Yu, Y.; Zhang, B.; Zhang, Z.; Yan, X.; Wang, Z. Microstructure and wear behaviour of in-situ TiN-Al2O3 reinforced CoCrFeNiMn high-entropy alloys composite coatings fabricated by plasma cladding. Materials Letters 2020, 272, 127870. [Google Scholar] [CrossRef]
- Zhang, B.; Yu, Y.; Zhu, S.; Zhang, Z.; Tao, X.; Wang, Z.; Lu, B. Microstructure and wear properties of TiN–Al2O3–Cr2B multiphase ceramics in-situ reinforced CoCrFeMnNi high-entropy alloy coating. Materials Chemistry and Physics 2022, 276, 125352. [Google Scholar] [CrossRef]
- Xia, J.; Xin, D.; Chen, X.; Xin, H. Investigation of the microstructure and friction mechanism of novel CoCrCu0.2FeMox high-entropy alloy coating using plasma arc cladding. Journal of Materials Science 2022, 57, 19972–19985. [Google Scholar] [CrossRef]
- Ruzova, Т.А.; Haddadi, B. Surface roughness and its measurement methods - Analytical review. Results in Surfaces and Interfaces 2025, 19, 100441. [Google Scholar] [CrossRef]
- Sushil, K.; Ramkumar, J.; Chandraprakash, C. Surface roughness analysis: A comprehensive review of measurement techniques, methodologies, and modeling. Journal of Micromanufacturing 0 25165984241305225. [CrossRef]
- He, T.; Chen, W.; Liu, Z.; Gong, Z.; Du, S.; Zhang, Y. The Impact of Surface Roughness on the Friction and Wear Performance of GCr15 Bearing Steel. Lubricants 2025, 13, 187. [Google Scholar] [CrossRef]
- Chen, C.; Bai, Q.; Zhao, C.; Li, Q.; Zhang, S. Effect of ultrasonic high-frequency micro-forging on the wear resistance of a Fe-base alloy coating deposited by high-speed laser cladding process. Vacuum 2024, 221, 112934. [Google Scholar] [CrossRef]
- Jiang, A.; Zhao, J.; Cui, P.; Liu, Z.; Wang, B. Effects of TiAlN Coating Thickness on Machined Surface Roughness, Surface Residual Stresses, and Fatigue Life in Turning Inconel 718. Metals 2024, 14, 940. [Google Scholar] [CrossRef]
- Prasad, J.; Sonwani, R.K. Optimize chemical milling of aluminium alloys to achieve minimum surface roughness in Aerospace and Defense Industry. Journal of the Indian Chemical Society 2025, 102, 101537. [Google Scholar] [CrossRef]
- Gruber, K.; Smolina, I.; Dziedzic, R.; Stopyra, W.; Karoluk, M.; Kuźnicka, B.; Kurzynowski, T. Tailoring heat treatment for AlSi7Mg0.6 parts with as-built surface generated by laser powder bed fusion to reduce surface roughness sensitivity. Journal of Alloys and Compounds 2024, 984, 173903. [Google Scholar] [CrossRef]
- Abellán-Nebot, J.V.; Vila Pastor, C.; Siller, H.R. A Review of the Factors Influencing Surface Roughness in Machining and Their Impact on Sustainability. Sustainability 2024, 16, 1917. [Google Scholar] [CrossRef]
- Sarker, I.H. Machine Learning: Algorithms, Real-World Applications and Research Directions. SN Computer Science 2021, 2, 160. [Google Scholar] [CrossRef]
- Shahani, N.M.; Zheng, X.; Liu, C.; Hassan, F.U.; Li, P. Developing an XGBoost Regression Model for Predicting Young’s Modulus of Intact Sedimentary Rocks for the Stability of Surface and Subsurface Structures. Frontiers in Earth Science 2021, Volume 9 - 2021. [Google Scholar] [CrossRef]
- Mustapha, I.B.; Abdulkareem, Z.; Abdulkareem, M.; Ganiyu, A. Predictive modeling of physical and mechanical properties of pervious concrete using XGBoost. Neural Computing and Applications 2024, 36, 9245–9261. [Google Scholar] [CrossRef]
- Ou, T.; Liu, J.; Liu, F.; Chen, W.; Qin, J. Coupling of XGBoost ensemble methods and discrete element modelling in predicting autogenous grinding mill throughput. Powder Technology 2023, 422, 118480. [Google Scholar] [CrossRef]
- Gao, K.; Chen, H.; Zhang, X.; Ren, X.; Chen, J.; Chen, X. A novel material removal prediction method based on acoustic sensing and ensemble XGBoost learning algorithm for robotic belt grinding of Inconel 718. The International Journal of Advanced Manufacturing Technology 2019, 105, 217–232. [Google Scholar] [CrossRef]
- Baraheni, M.; Soudmand, B.H.; Amini, S.; Fotouhi, M. Stacked generalization ensemble learning strategy for multivariate prediction of delamination and maximum thrust force in composite drilling. Journal of Composite Materials 2024, 58, 3113–3138. [Google Scholar] [CrossRef]
- Jones, T.; Cao, Y. Tool wear prediction based on multisensor data fusion and machine learning. The International Journal of Advanced Manufacturing Technology 2025, 137, 5213–5225. [Google Scholar] [CrossRef]
- Natarajan, E.; Ramasamy, M.; Elango, S.; Mohanraj, K.; Ang, C.K.; Khalfallah, A. Ensemble Learning-Based Metamodel for Enhanced Surface Roughness Prediction in Polymeric Machining. Machines 2025, 13, 570. [Google Scholar] [CrossRef]
- Özbilen, S.; Vasquez, J.F.B.; Abbott, W.M.; Yin, S.; Morris, M.; Lupoi, R. Mechanical milling/alloying, characterization and phase formation prediction of Al0.1–0.5(Mn)CoCrCuFeNi-HEA powder feedstocks for cold spray deposition processing. Journal of Alloys and Compounds 2023, 961, 170854. [Google Scholar] [CrossRef]
- Sesana, R.; Corsaro, L.; Sheibanian, N.; Özbilen, S.; Lupoi, R. Wear Characterization of Cold-Sprayed HEA Coatings by Means of Active–Passive Thermography and Tribometer. Lubricants 2024, 12, 222. [Google Scholar] [CrossRef]
- Kvålseth, T.O. Cautionary Note about R 2. The American Statistician 1985, 39, 279–285. [Google Scholar] [CrossRef]
- Chicco, D.; Warrens, M.J.; Jurman, G. The coefficient of determination R-squared is more informative than SMAPE, MAE, MAPE, MSE and RMSE in regression analysis evaluation. Peerj computer science 2021, 7, e623. [Google Scholar] [CrossRef]
- Hodson, T.O. Root-mean-square error (RMSE) or mean absolute error (MAE): when to use them or not. Geosci. Model Dev. 2022, 15, 5481–5487. [Google Scholar] [CrossRef]
- Dehghanpour Abyaneh, M.; Narimani, P.; Hadad, M.; Attarsharghi, S. Using machine learning and optimization for controlling surface roughness in grinding of St37. Energy Equipment and Systems 2023, 11, 321–337. [Google Scholar] [CrossRef]
- Azarafza, M.; Hajialilue Bonab, M.; Derakhshani, R. A Deep Learning Method for the Prediction of the Index Mechanical Properties and Strength Parameters of Marlstone. Materials 2022, 15, 6899. [Google Scholar] [CrossRef]
- Wu, J.; Li, Y.; Qiao, H.; Yang, Y.; Zhao, J.; Huang, Z. Prediction of mechanical properties and surface roughness of FGH4095 superalloy treated by laser shock peening based on XGBoost. Journal of Alloys and Metallurgical Systems 2023, 1, 100001. [Google Scholar] [CrossRef]
- Wang, Z.H.; Liu, Y.F.; Wang, T.; Wang, J.G.; Liu, Y.M.; Huang, Q.X. Intelligent prediction model of mechanical properties of ultrathin niobium strips based on XGBoost ensemble learning algorithm. Computational Materials Science 2024, 231, 112579. [Google Scholar] [CrossRef]
- Hope, T.M.H. Chapter 4 - Linear regression. In Machine Learning; Mechelli, A., Vieira, S., Eds.; Academic Press, 2020; pp. 67–81. [Google Scholar] [CrossRef]
- Noori, M.; Hassani, H.; Javaherian, A.; Amindavar, H.; Torabi, S. Automatic fault detection in seismic data using Gaussian process regression. Journal of Applied Geophysics 2019, 163, 117–131. [Google Scholar] [CrossRef]
- Nawar, S.; Mouazen, A.M. Combining mid infrared spectroscopy with stacked generalisation machine learning for prediction of key soil properties. European Journal of Soil Science 2022, 73, e13323. [Google Scholar] [CrossRef]
- Modanloo, V.; Elyasi, M.; Lee, T.; Quagliato, L. Modeling of tensile strength and wear resistance in friction stir processed MMCs by metaheuristic optimization and supervised learning. The International Journal of Advanced Manufacturing Technology 2025, 139, 3095–3118. [Google Scholar] [CrossRef]
- Modanloo, V.; Alimirzaloo, V.; Elyasi, M. Optimal Design of Stamping Process for Fabrication of Titanium Bipolar Plates Using the Integration of Finite Element and Response Surface Methods. Arabian Journal for Science and Engineering 2020, 45, 1097–1107. [Google Scholar] [CrossRef]
- Faska, Z.; Khrissi, L.; Haddouch, K.; El Akkad, N. A robust and consistent stack generalized ensemble-learning framework for image segmentation. Journal of Engineering and Applied Science 2023, 70, 74. [Google Scholar] [CrossRef]
- Wang, Q.; Lu, H. A novel stacking ensemble learner for predicting residual strength of corroded pipelines. npj Materials Degradation 2024, 8, 87. [Google Scholar] [CrossRef]
Figure 1.
XGBoost model schematic diagram.
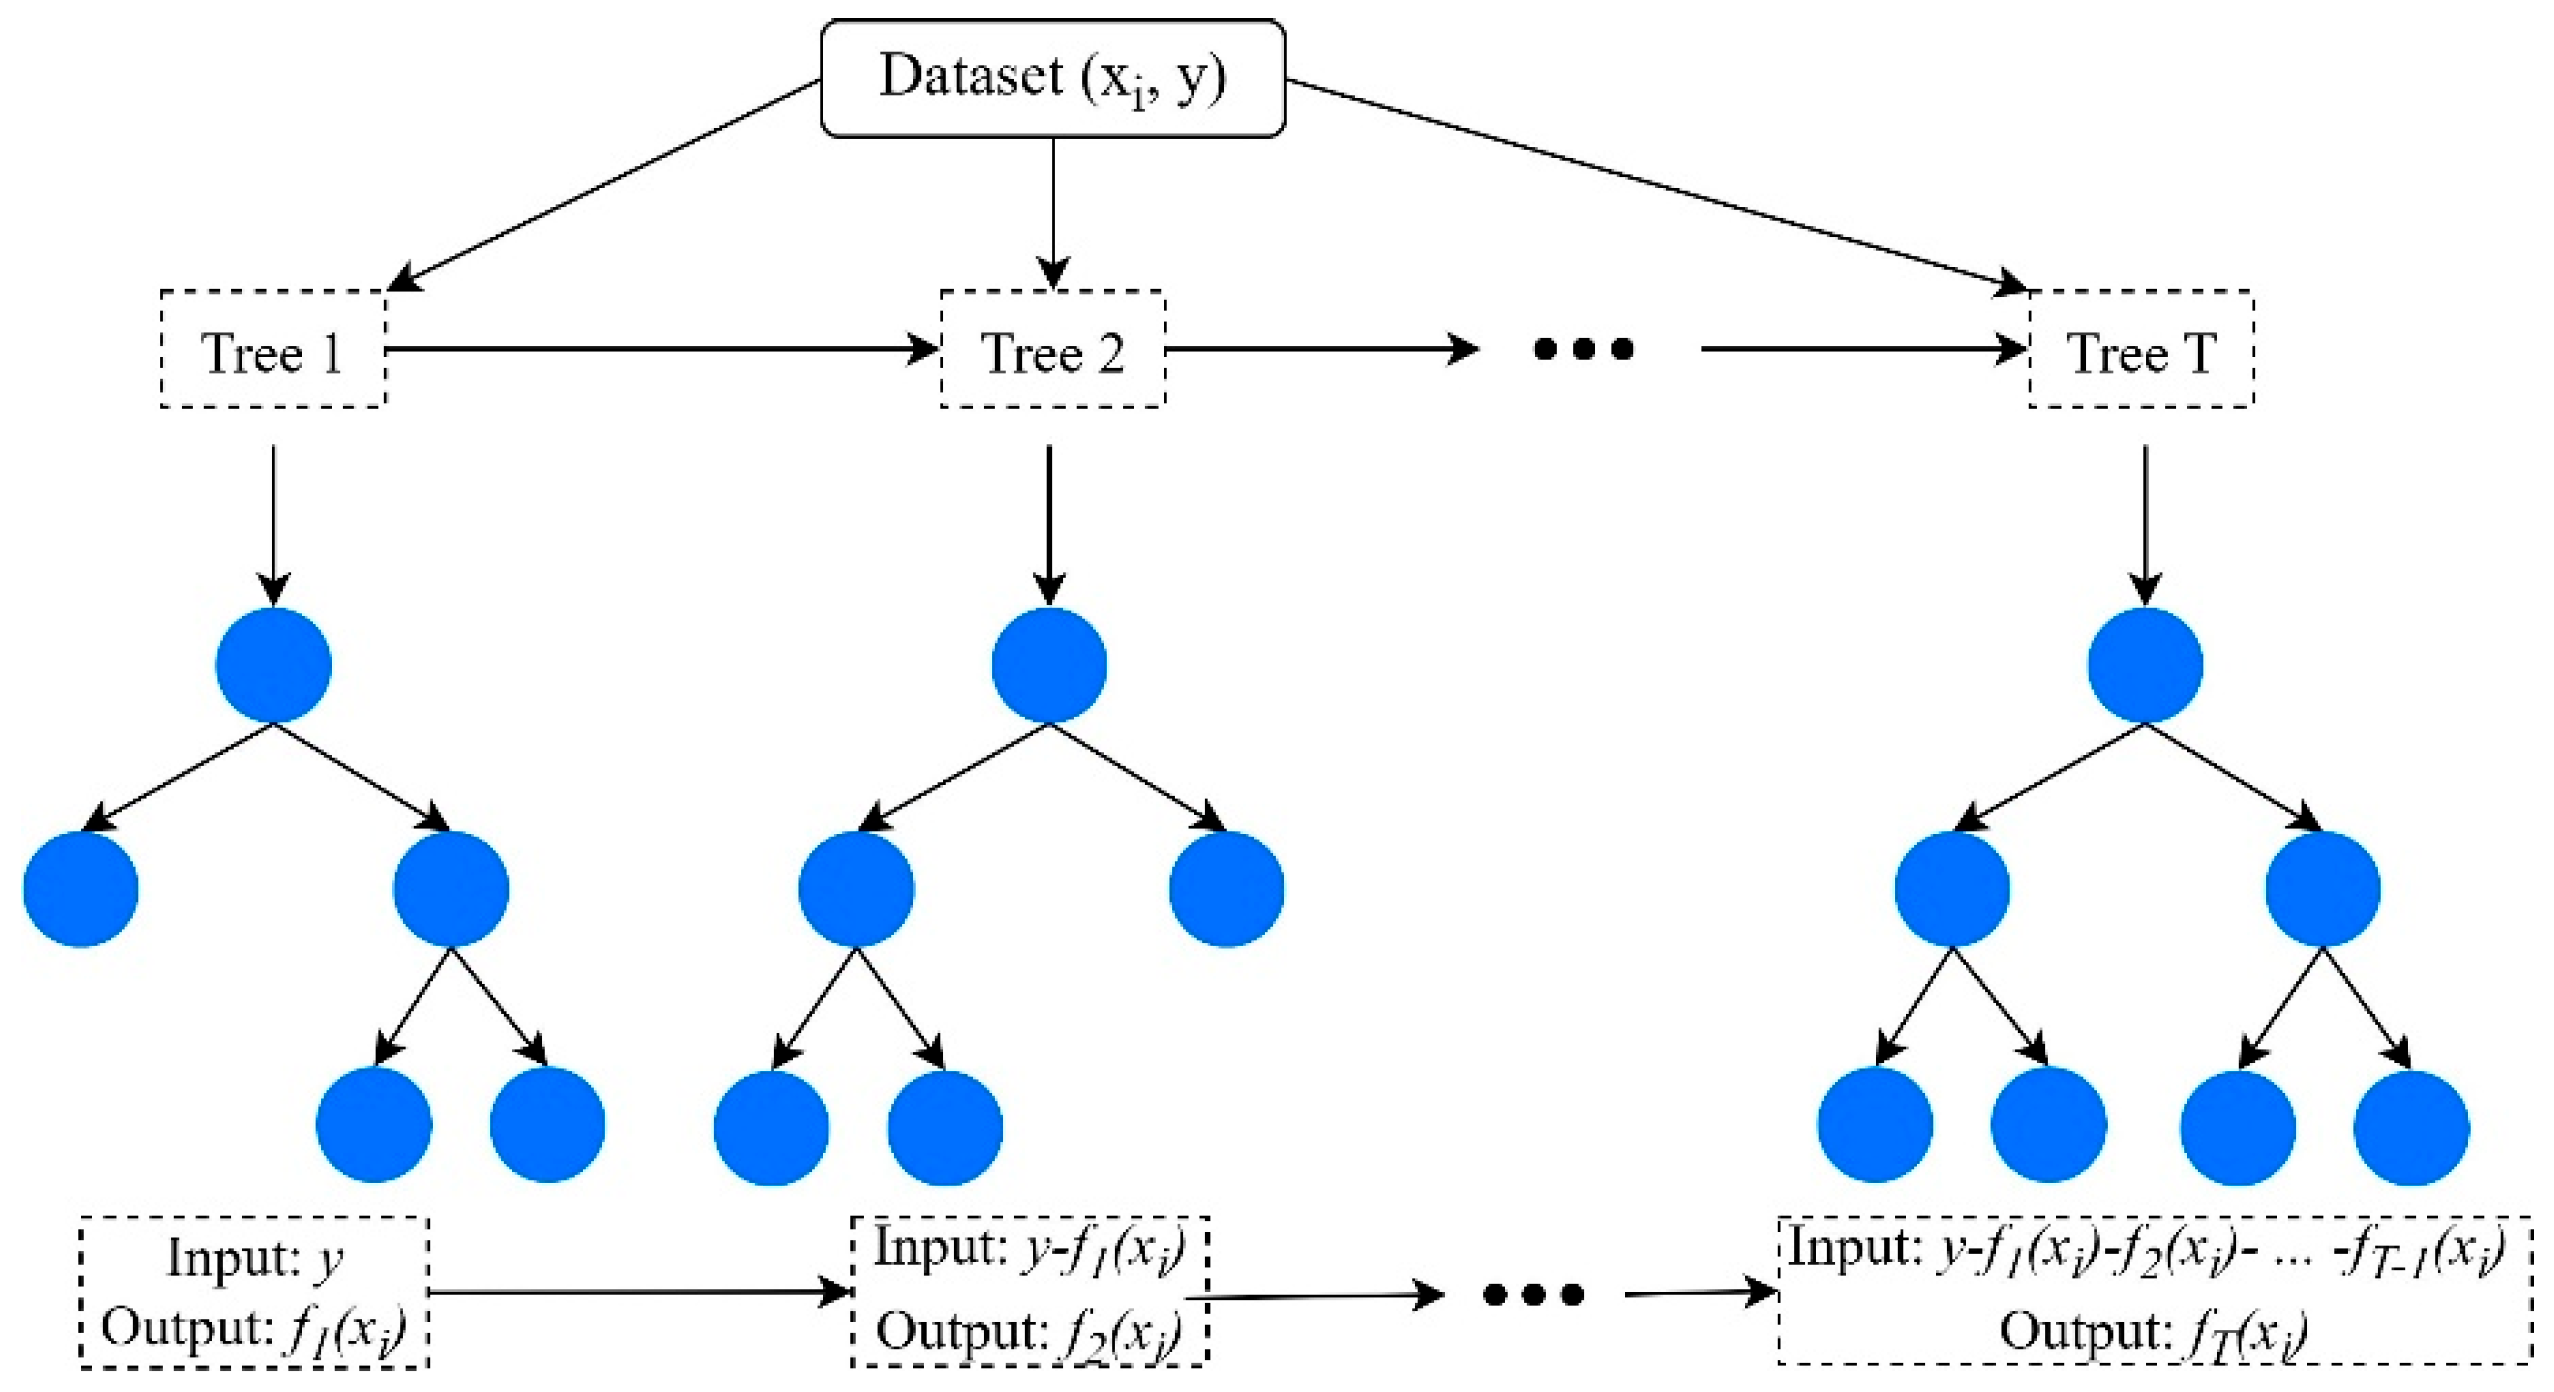
Figure 2.
Stacking ensemble process flowchart.
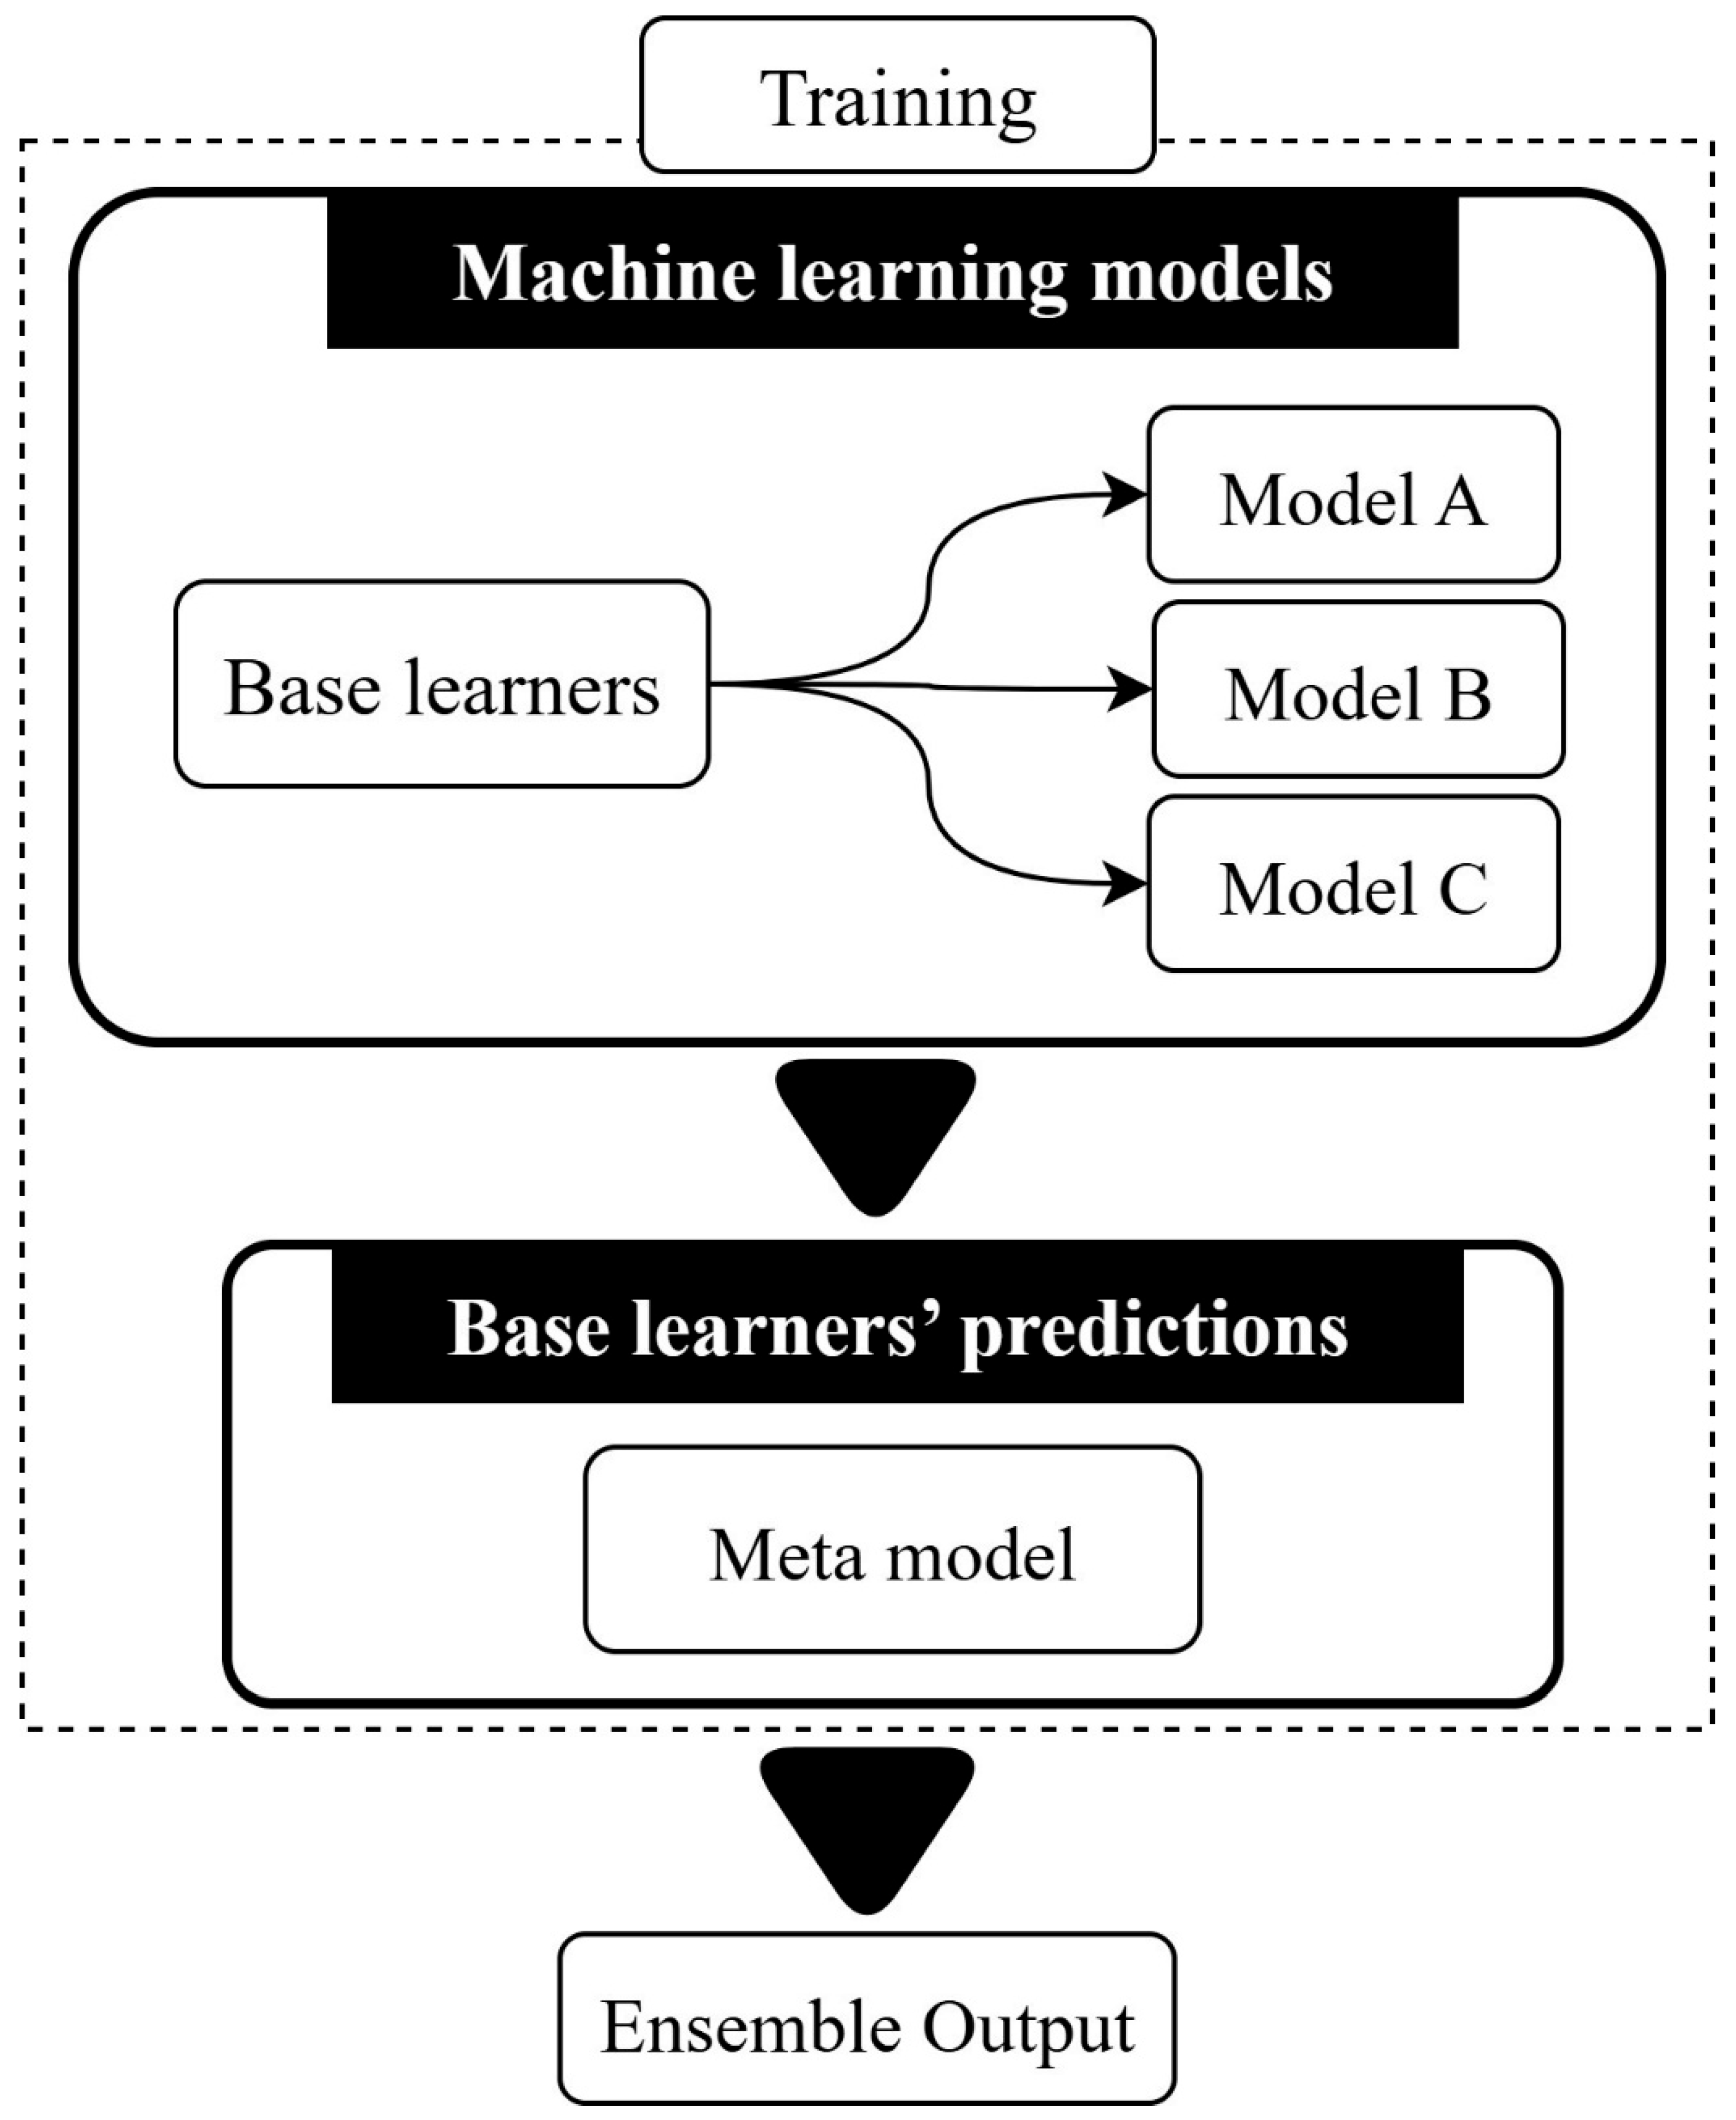
Figure 3.
XGBoost predicted vs. actual Ra values.
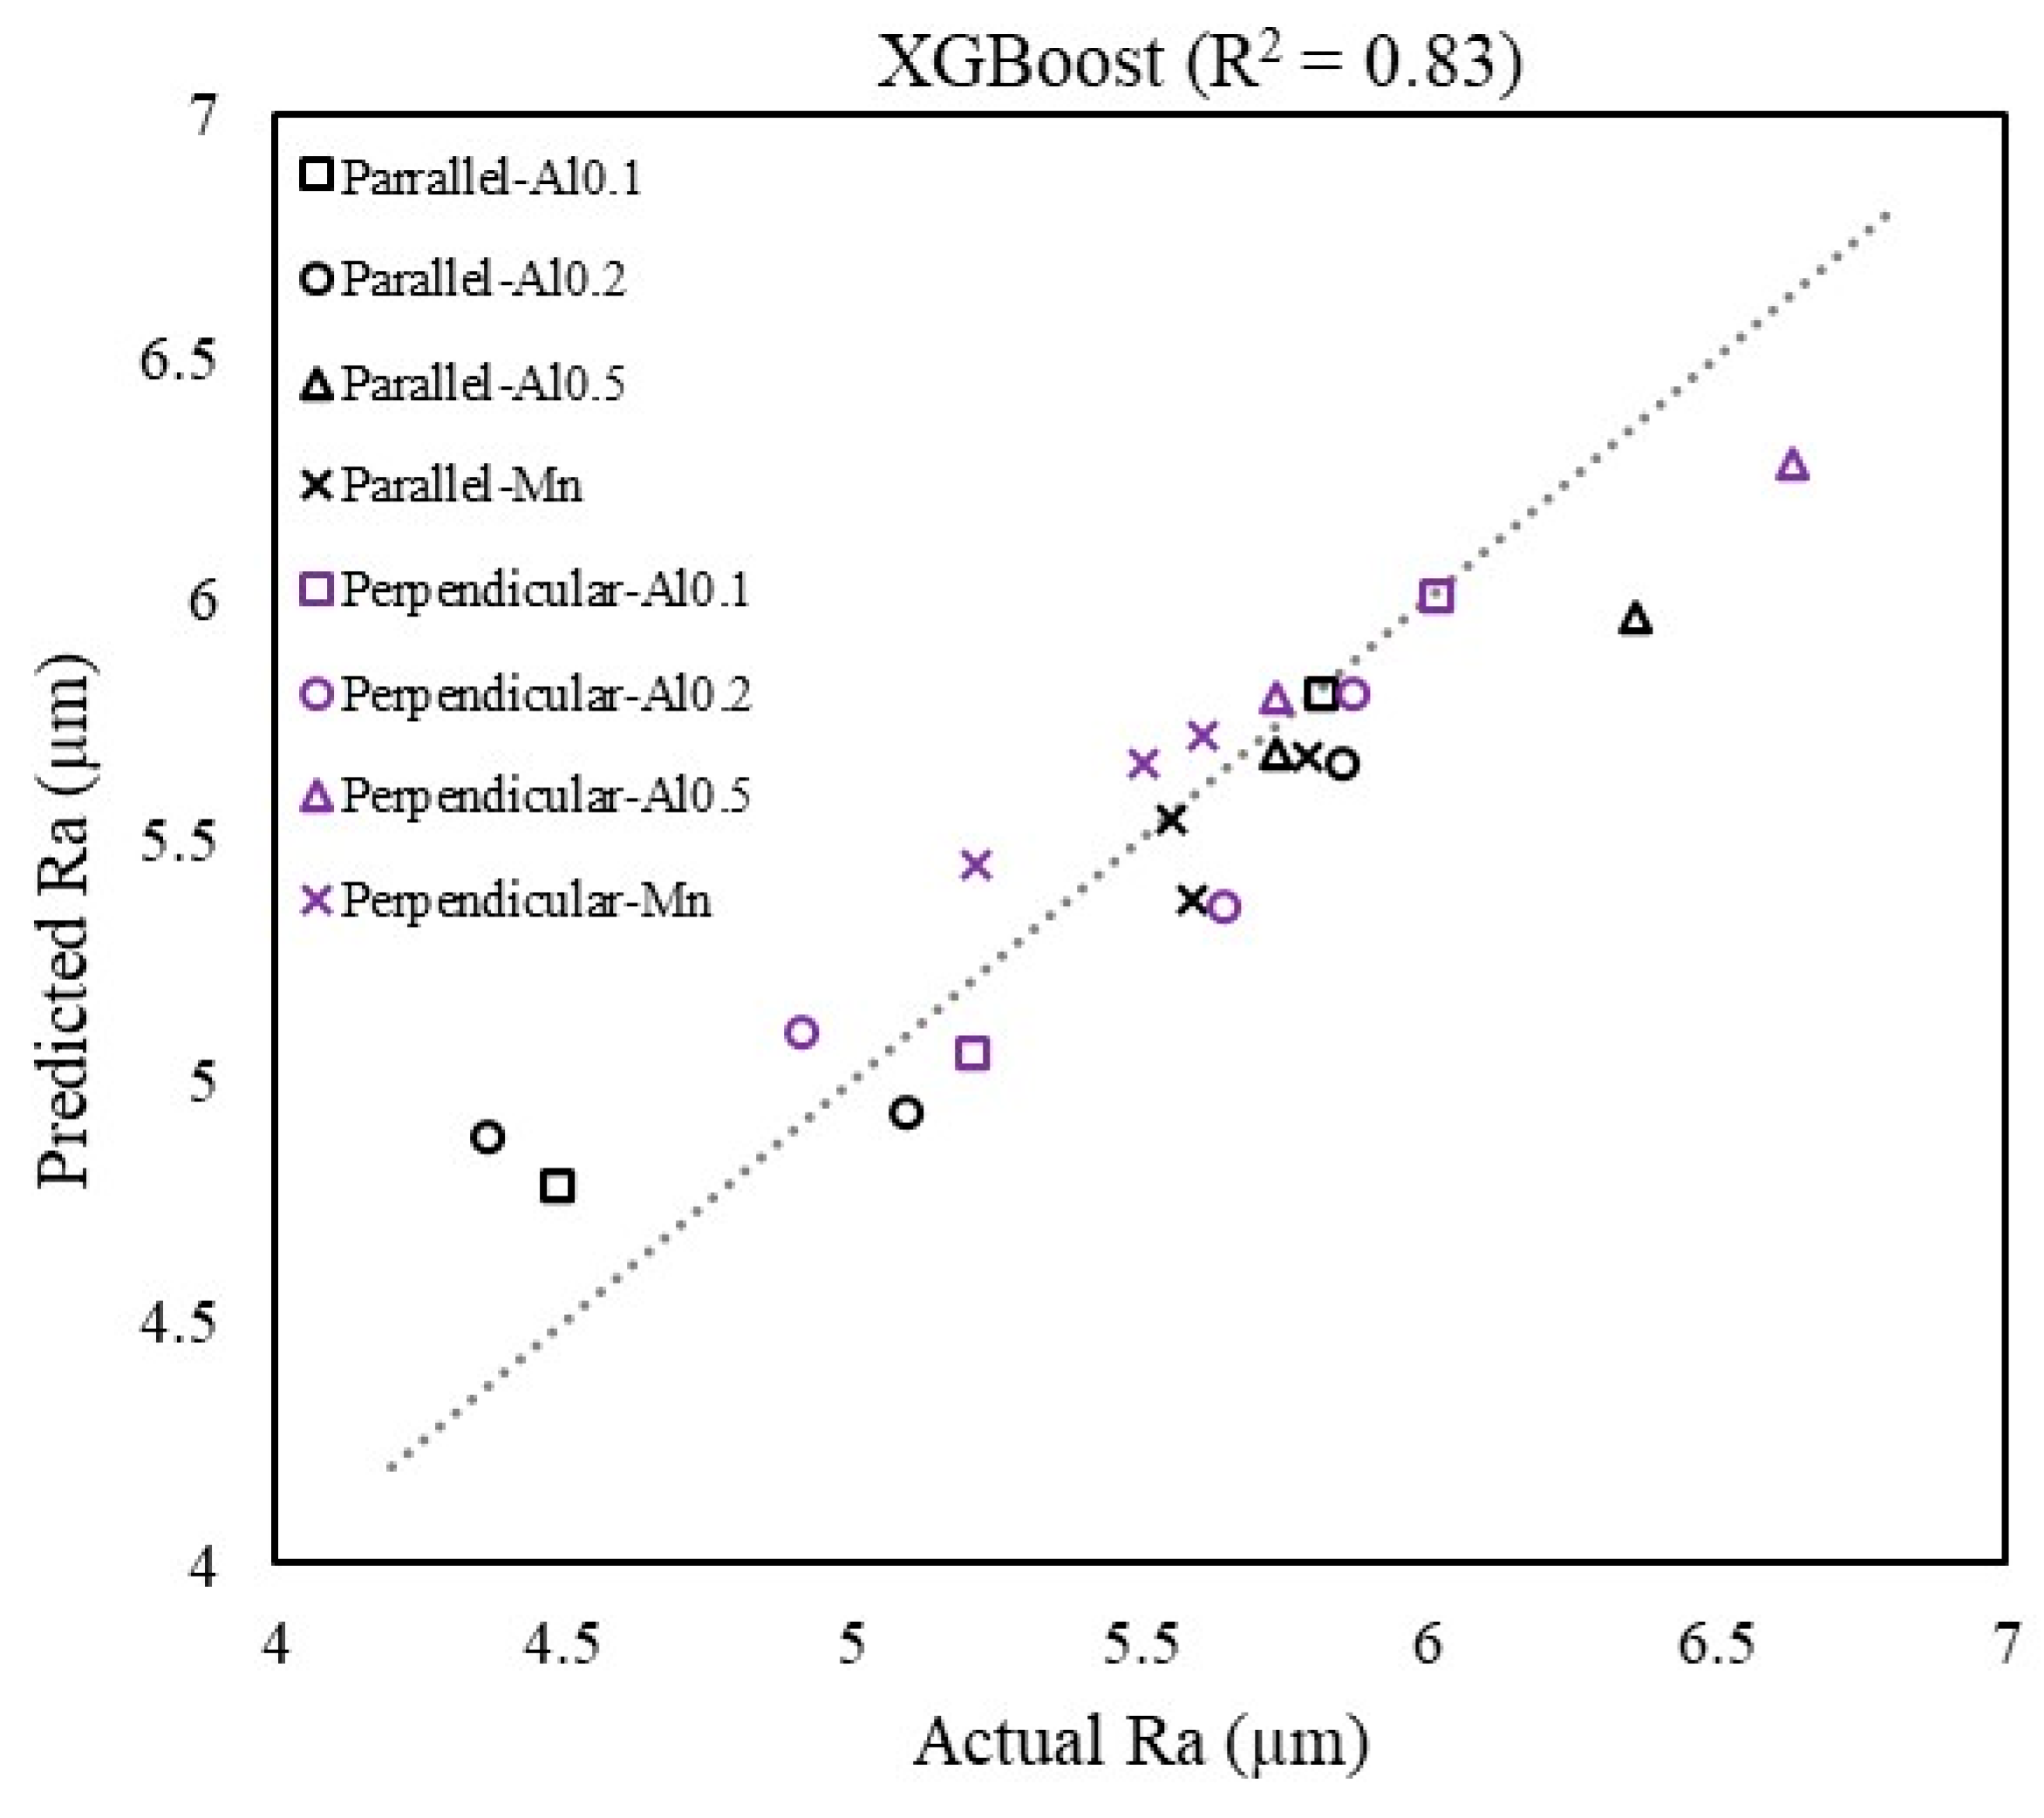
Figure 4.
LR + XGBoost + GPR → RidgeCV predicted vs. actual Ra values.
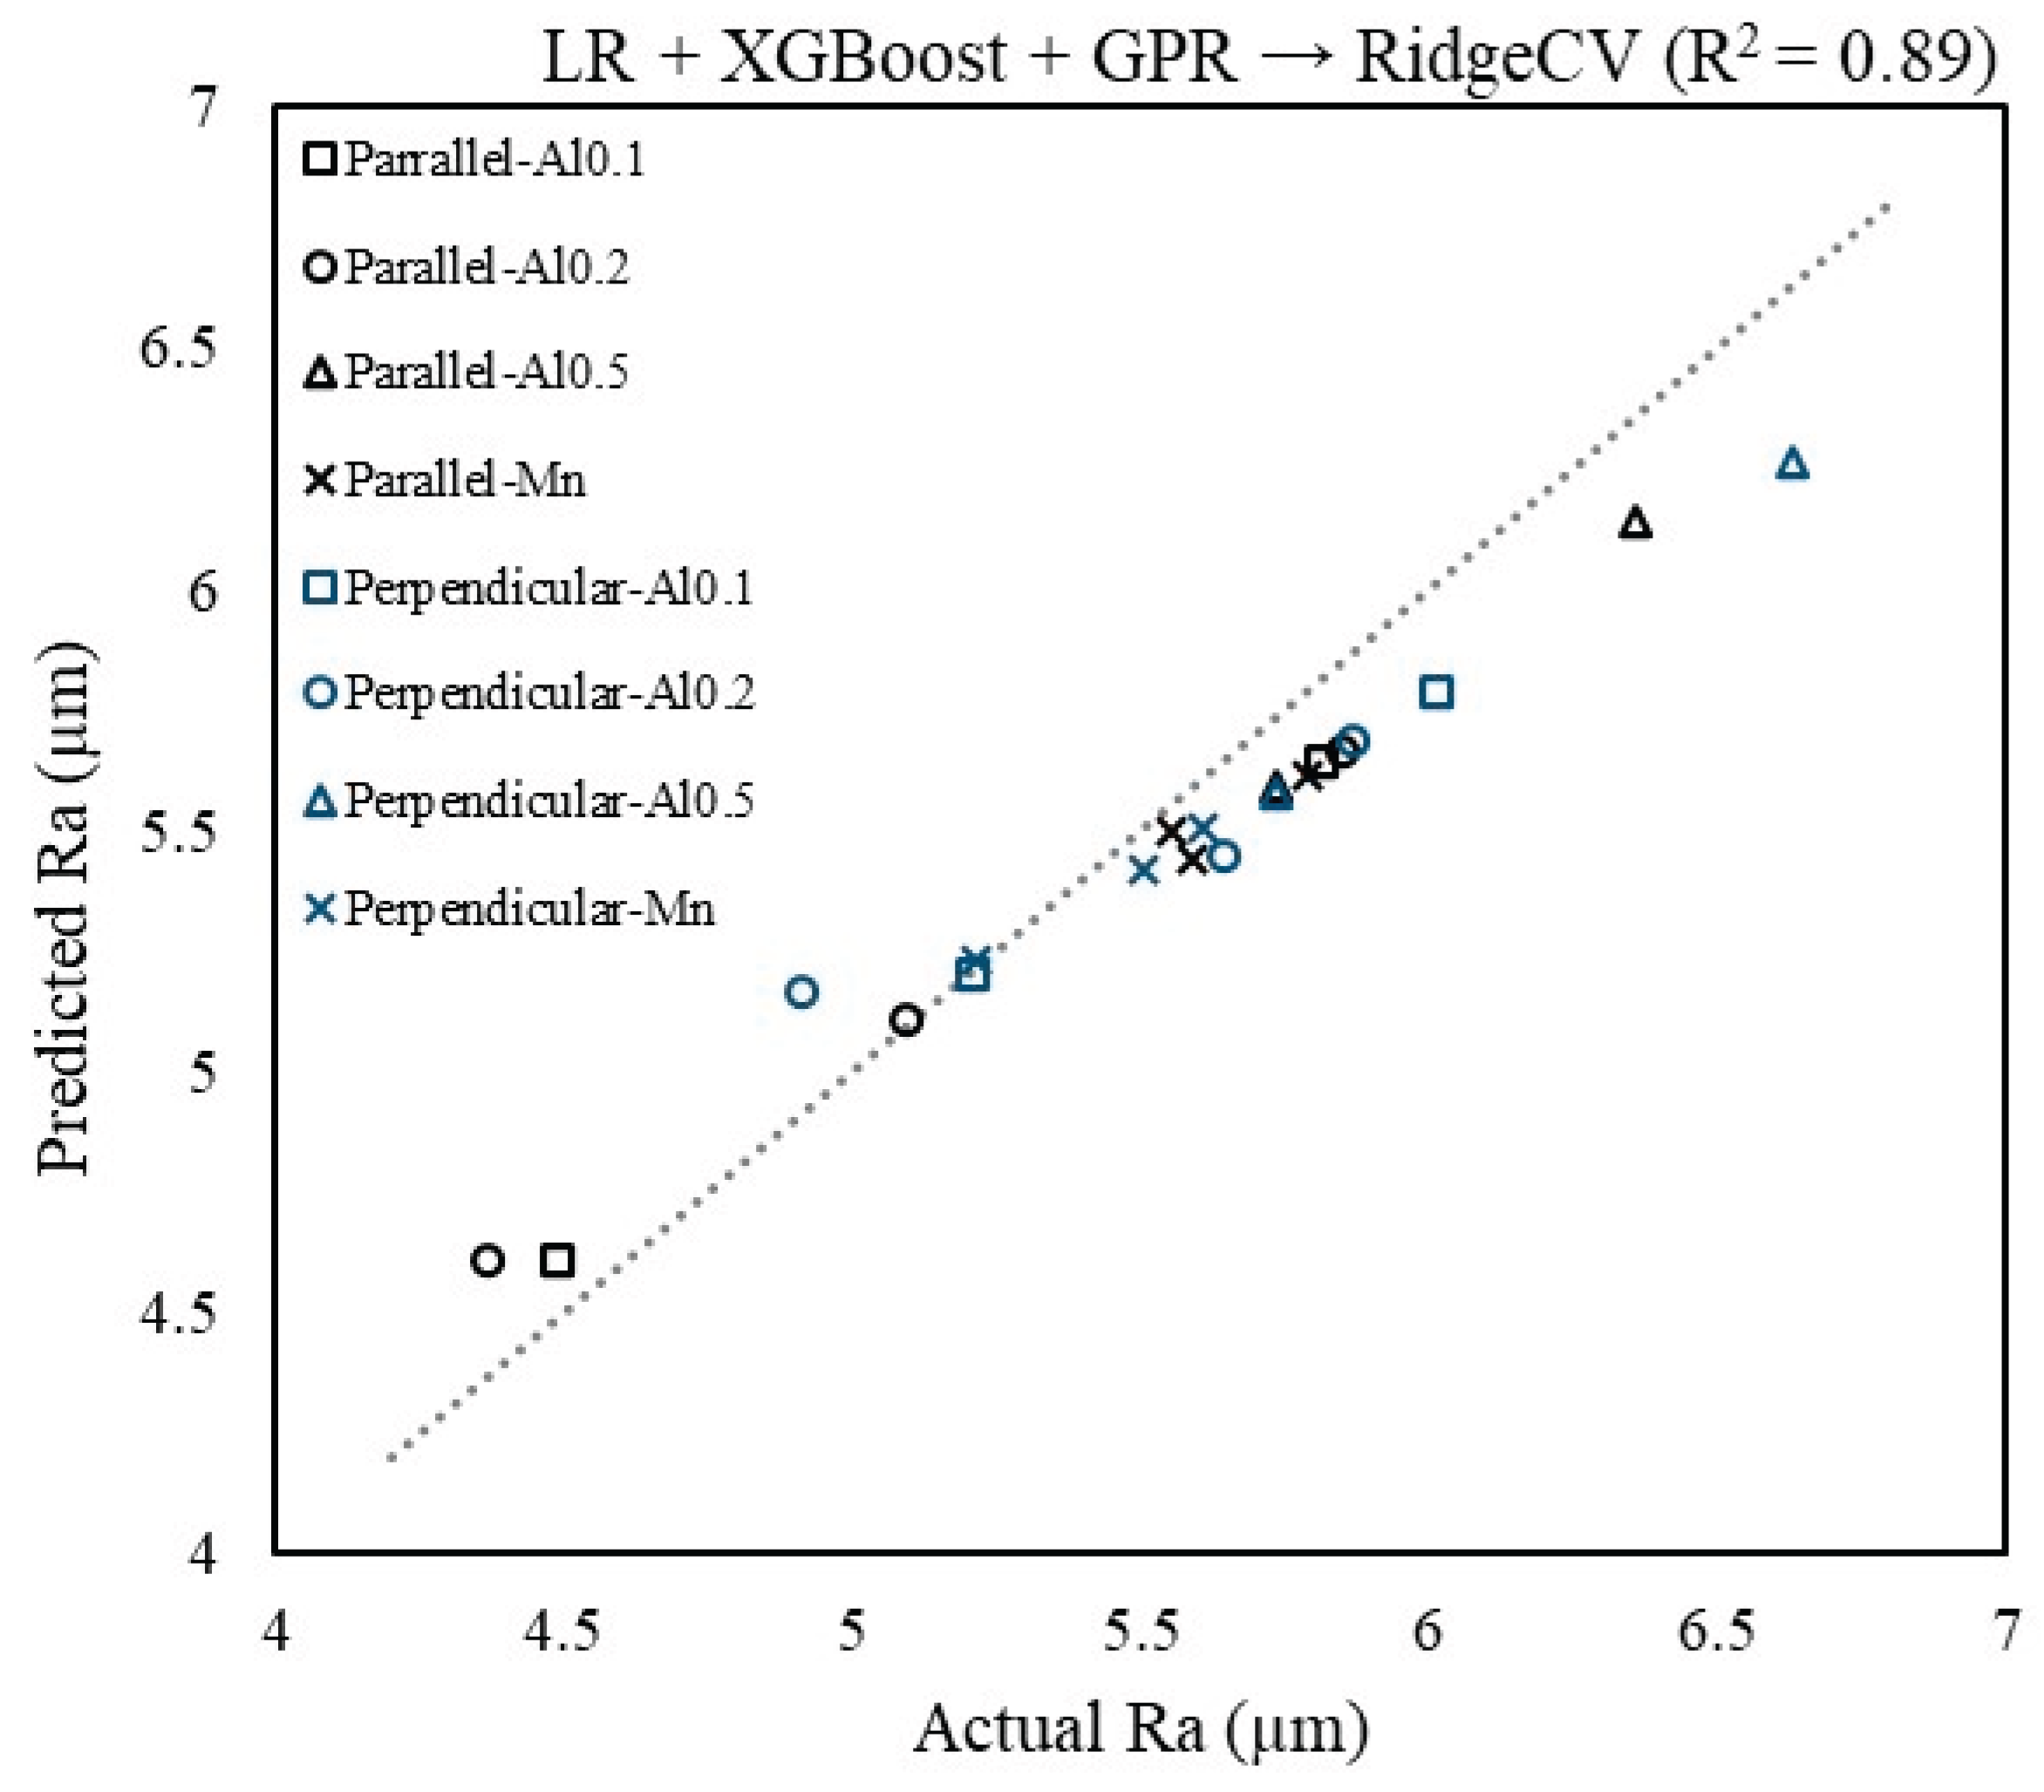
Table 1.
The dataset used in this study [1].
Table 1.
The dataset used in this study [1].
| Input Parameters | Output Parameters | |||||
| Samples | Cut off (mm) |
No. Cut off | Type | Temperature (°C) |
Alloy type | Ra (µm) |
| 1 | 0.25 | 5 | Parallel | 650 | Al0.1 | 5.81 |
| 2 | 0.25 | 5 | Parallel | 750 | Al0.1 | 4.48 |
| 3 | 0.25 | 5 | Parallel | 650 | Al0.2 | 4.36 |
| 4 | 0.25 | 5 | Parallel | 750 | Al0.2 | 5.85 |
| 5 | 0.25 | 5 | Parallel | 850 | Al0.2 | 5.09 |
| 6 | 0.25 | 5 | Parallel | 650 | Al0.5 | 6.35 |
| 7 | 0.25 | 5 | Parallel | 750 | Al0.5 | 5.73 |
| 8 | 0.25 | 5 | Parallel | 650 | MN-HEA | 5.58 |
| 9 | 0.25 | 5 | Parallel | 750 | MN-HEA | 5.55 |
| 10 | 0.25 | 5 | Parallel | 850 | MN-HEA | 5.78 |
| 11 | 0.25 | 5 | Perpendicular | 650 | Al0.1 | 6.01 |
| 12 | 0.25 | 5 | Perpendicular | 750 | Al0.1 | 5.20 |
| 13 | 0.25 | 5 | Perpendicular | 650 | Al0.2 | 5.64 |
| 14 | 0.25 | 5 | Perpendicular | 750 | Al0.2 | 5.87 |
| 15 | 0.25 | 5 | Perpendicular | 850 | Al0.5 | 4.90 |
| 16 | 0.25 | 5 | Perpendicular | 650 | Al0.5 | 6.62 |
| 17 | 0.25 | 5 | Perpendicular | 750 | Al0.5 | 5.73 |
| 18 | 0.25 | 5 | Perpendicular | 650 | MN-HEA | 5.21 |
| 19 | 0.25 | 5 | Perpendicular | 750 | MN-HEA | 5.50 |
| 20 | 0.25 | 5 | Perpendicular | 850 | MN-HEA | 5.60 |
Table 2.
The significance of each parameter.
| Parameter | Sum sq | df | Mean sq | F | P-Value |
| Type | 5.93 | 1 | 5.93 | 1.24 | 0.28 > 5% |
| Temperature | 2.12 | 1 | 2.12 | 0.44 | 0.51 > 5% |
| Alloy type | 15.53 | 3 | 5.17 | 1.08 | 0.38 > 5% |
| Error | 66.92 | 14 | 4.78 | - | - |
| Total | 90.52 | 19 | - | - | - |
Table 3.
Hyperparameters tuning for XGBoost.
| Hyperparameter | Optimal value |
| Number of trees | 400 |
| Learning rate/tree | 0.07 |
| Maximum depth/tree | 4 |
| Subsample/tree | 0.9 |
| Column sample/tree | 0.9 |
| reg_lambda | 5.0 |
| reg_alpha | 0.5 |
Disclaimer/Publisher’s Note: The statements, opinions and data contained in all publications are solely those of the individual author(s) and contributor(s) and not of MDPI and/or the editor(s). MDPI and/or the editor(s) disclaim responsibility for any injury to people or property resulting from any ideas, methods, instructions or products referred to in the content. |
© 2025 by the authors. Licensee MDPI, Basel, Switzerland. This article is an open access article distributed under the terms and conditions of the Creative Commons Attribution (CC BY) license (http://creativecommons.org/licenses/by/4.0/).
Copyright: This open access article is published under a Creative Commons CC BY 4.0 license, which permit the free download, distribution, and reuse, provided that the author and preprint are cited in any reuse.


