Submitted:
19 September 2025
Posted:
19 September 2025
You are already at the latest version
Abstract
Based on 0.1° × 0.1° soil moisture reanalysis data from 1950 to 2024, combined with remote sensing ecological products such as EVI and GPP, this study systematically investigates the spatiotemporal evolution, transition process, and ecological responses of flash droughts and slowly-evolving droughts (including seasonal and cross-seasonal droughts) in the Dongjiang River Basin of China. The results indicate that: (1) The average occurrence frequencies of flash droughts, seasonal droughts, and cross-seasonal droughts within the basin were 4.1%, 7.8%, and 8.4%, respectively. (2) The vast majority of flash droughts (approximately 90.1%) further developed into longer-lasting slowly-evolving droughts, indicating that flash droughts serve as a critical precursor to persistent drought events. Moreover, winter was identified as the key season for the occurrence of flash droughts and their transition to slowly-evolving droughts. (3) In terms of ecological response, droughts significantly suppressed vegetation growth but ecosystem resilience exhibited notable differences: although flash droughts caused relatively mild initial suppression, they were accompanied by a severe lack of ecosystem resilience; in contrast, cross-seasonal droughts, despite inducing stronger suppression, were met with higher ecosystem resilience. This study underscores the importance of early monitoring and warning of flash droughts, and the findings provide a scientific basis for drought risk management in humid basins.
Keywords:
Flash drought
; Slowly-evolving drought
; Drought evolution
; Ecological response
; Dongjiang River Basin
1. Introduction
Climate change is currently leading to more extreme weather patterns, with the increasing severity of droughts posing a significant challenge to water security worldwide [1,2]. Droughts can occur in any season and any region, severely impacting water supply, reducing agricultural and industrial productivity, and threatening ecological and social stability [3,4]. Statistics indicate that droughts account for approximately 15% of global natural disasters, and over the past two decades, they have caused average annual economic losses of up to $6.2 billion, exceeding those from other meteorological and hydrological hazards [5].
Traditionally, drought has been perceived as a slowly-evolving phenomenon, characterized by gradual development and prolonged duration [6]. It typically originates from a sustained period of deficient precipitation and progressively evolves into agricultural, hydrological, ecological, and socioeconomic drought [7,8]. However, a growing body of research [9,10,11] has revealed that under conditions of meteorological anomalies such as high temperatures, strong winds, and intense solar radiation, droughts can develop rapidly into highly destructive events. These are known as flash droughts. Unlike slowly-evolving droughts, flash droughts are characterized by sudden onset and rapid intensification, presenting new challenges for early warning systems and drought mitigation efforts [12,13,14,15,16]. Consequently, accurately identifying flash droughts, understanding their evolution, and assessing their impacts have become crucial scientific issues.
Among various hydro-meteorological variables, soil moisture is closely related to vegetation growth and is widely considered an effective indicator for identifying flash droughts [17,18,19]. Utilizing remote sensing and reanalysis soil moisture data, studies conducted across different climate regions worldwide [20,21,22] have demonstrated that while flash droughts differ from conventional slowly-evolving droughts, the two are intrinsically related. Research suggests that flash droughts constitute a subtype of drought [23]. Nevertheless, previous studies have predominantly focused on distinguishing flash droughts from slowly-evolving droughts, with limited attention paid to the connections between them. Wang et al. [24] found that in China, 9%–15% of flash droughts are temporally associated with slowly-evolving droughts. Liu et al. [25] showed that flash droughts in China often occur during the onset and development phases of slow-onset droughts. Otkin et al. [26] noted that flash droughts could either evolve into persistent droughts under continued abnormal meteorological conditions or recover quickly following precipitation. The combination of the suddenness of flash droughts and the persistence of slowly-evolving droughts exerts compound pressures on ecosystems. Therefore, elucidating the hydrological linkages between flash and slowly-evolving droughts during their evolution and assessing their ecological impacts are of great importance for water resource management, agricultural production, and ecological conservation.
This study takes the Dongjiang River Basin in southeastern China as a case study. The objectives are: (1) to characterize the spatiotemporal frequency of flash and slowly-evolving droughts; (2) to investigate the spatiotemporal evolution of flash droughts into persistent droughts; and (3) to evaluate the ecological impacts during the evolution of droughts using indicators such as the Enhanced Vegetation Index (EVI) and ecosystem water use efficiency (eWUE). The rest of the paper is organized as follows. Section 2 introduces the study area and datasets used in this study. The approches for identifying flash drought and slowly-evolving drought are also described. The assessment results are presented in Section 3. Section 4 discusses the potential uncertainties and limitations in the results. Finally, conclusions are drawn in Section 5.
2. Materials and Methods
2.1. Study Area
The Dongjiang River Basin, a major sub-basin of the Pearl River Basin—the largest river system in southeatern China, covers a total area of 35,340 km² with an average annual runoff of 25.7 billion m³ (location shown in Figure 1). Situated in a highly developed economic region of southern China, it serves as a crucial grain-producing area within Guangdong Province and is responsible for supplying water to key cities in the Guangdong-Hong Kong-Macao Greater Bay Area, including Shenzhen, Hong Kong, Guangzhou, Dongguan, and Huizhou. Although located in a humid subtropical zone with a multi-year average temperature between 14°C and 20°C and annual precipitation ranging from 1200 mm to 2200 mm, the per capita water resources amount to only approximately 800 m³/year, classifying it as a water-stressed region according to international standards [27,28]. Studies have shown that flash droughts exhibit a spatially heterogeneous distribution across China, with higher frequency in both northern and southern regions [24,25]. Against the backdrop of rapid regional economic development, improving living standards, and increasing environmental demands, higher requirements for water resources have been imposed to support economic sustainability, agricultural production, and ecological conservation. In recent years, influenced by climate anomalies and saltwater intrusion, the frequency of drought events in the Dongjiang River Basin has increased significantly [29,30]. As a result, the imbalance between water supply and demand has become a critical constraint to sustainable economic, social, and ecological development in the region.
2.2. Datasets
This study utilized datasets from the following sources: the ERA5-Land reanalysis product (https://cds.climate.copernicus.eu/#!/home) provided by the European Centre for Medium-Range Weather Forecasts (ECMWF), the MODIS Terra satellite’s Terra_0.05_16-Day L3 CMG product (https://ladsweb.modaps.eosdis.nasa.gov/), and the GOSIF_GPP dataset (https://globalecology.unh.edu/data/GOSIF-GPP.html).
From the ERA5-Land reanalysis product, we extracted an hourly soil moisture dataset at a spatial resolution of 0.1° × 0.1° for the period 1950–2024, including the volumetric soil water content at three depths: 0–7 cm, 7–28 cm, and 28–100 cm, along with actual evapotranspiration components (soil evaporation, plant transpiration, and water surface evaporation). A thickness-weighted average was computed to derive an integrated measure of the soil moisture condition within the 0–1 m depth profile, which serves as a key indicator for drought characterization. This layer represents a critical zone for vegetation root water uptake and is highly sensitive to drought stress [31,32]. The 16-day composite EVI from the MODIS product (2000–2024, at 0.05° × 0.05° resolution) was used to monitor drought-induced changes in vegetation structure. The EVI improves upon the Normalized Difference Vegetation Index (NDVI) by reducing saturation effects in high-biomass regions and minimizing sensitivity to soil background noise, thereby offering a more accurate representation of canopy greenness [33,34]. The GOSIF_GPP dataset, which provides 8-day mean gross primary productivity (GPP) at 0.05° × 0.05° resolution from 2000 to 2024 [35], was employed to calculate eWUE. This functional metric was used to evaluate the ecohydrological impacts of drought processes. To ensure consistency across all datasets, each was resampled to a unified spatial resolution of 0.1° × 0.1° and temporally aggregated to 8-day mean values.
2.3. Drought Identification
Based on the run theory [36], a drought event is defined as a period during which a drought indicator value remains below or equal to a specified threshold, starting when the value falls to or below the threshold and ending when it exceeds the threshold. For the soil moisture percentile, the 40th percentile signifies the onset of abnormally dry soil conditions, while the 20th percentile denotes the threshold at which moisture deficiency can trigger substantial environmental impacts, such as vegetation deterioration [9,15]. Accordingly, the 20th percentile of soil moisture is used as the threshold for identifying drought events [17,18,19,25].
The identification of flash droughts relies on two primary characteristics: rapid onset speed and ecological impact [37]. Ford and Labosier [38] proposed that a flash drought is characterized by a decline in soil moisture percentile from above the 40th percentile to below the 20th percentile within no more than four pentads. This definition has been widely adopted in subsequent research [15,17,18,19,25,26]. The impact of drought is generally assessed based on its duration. According to Yuan et al. [18], a flash drought lasting at least three pentads can cause significant ecological effects. Thus, the following criteria to identify droughts are applied in this study:
- A potential drought event is identified when the soil moisture percentile remains continuously below the 20th percentile for more than two 8-day periods (approximately three pentads);
- If the soil moisture percentile drops from above the 40th percentile to below the 20th percentile within three 8-day periods, the event is identified as a flash drought;
- A drought lasting between four and eleven 8-day periods (approximately one to three months) is classified as a seasonal drought (i.e., slowly-evolving drought);
- A drought persisting beyond eleven 8-day periods (approximately three months) is identified as a cross-seasonal drought (i.e., slowly-evolving drought).
It should be noted that, according to the above definitions, a flash drought and a slowly-evolving drought may represent different phases of the same event (i.e., a flash drought that persists and evolves into a slowly-evolving drought), or they may constitute independent drought events. As shown in Figure 2, five drought events were identified in a specific grid cell during the period from 2002 to 2006. Among these, Event 1 is an independent flash drought, lasting only two 8-day intervals; Event 4 transitions from a flash drought to a cross-seasonal drought; Event 5 develops from a flash drought into a seasonal drought; whereas Events 2 and 3 are non-flash drought events, each representing an independent cross-seasonal drought and seasonal drought, respectively.
2.4. Eco-Hydrological Resilience Analysis
To quantify the response of terrestrial ecosystems to hydro-climatic disturbances, eWUE is widely used as a key indicator characterizing the coupling of water and carbon cycles [39,40,41]. eWUE is defined as the amount of carbon absorbed per unit of water lost, where carbon absorption is represented by GPP or net primary productivity (NPP), and water loss is represented by actual ecosystem evapotranspiration (ET). In this study, eWUE was calculated based on 8-day GPP and ET data using the following expression:
where eWUE₈d is the 8-day mean ecosystem water use efficiency (g C·kg⁻¹ H₂O·(8d)⁻¹); GPP₈d is the 8-day gross primary productivity (g C·m⁻²·(8d)⁻¹); and ET₈d is the 8-day ecosystem evapotranspiration (kg H₂O·m⁻²·(8d)⁻¹), comprising the sum of soil evaporation, vegetation transpiration, and water surface evaporation.
Sharma and Goyal [42,43] proposed a dimensionless ecosystem resilience index, Rd (Equation. (2)), to assess the overall resistance and recovery capacity of an ecosystem to drought. A higher Rd value indicates greater resilience.
where eWUEde is the average eWUE value during the driest year, and eWUEm is the multi-year average eWUE value.
However, this index only reflects the overall resilience of the ecosystem at a macroscopic temporal scale and cannot differentiate its response to individual drought events of varying duration and intensity. Therefore, this study adopts individual drought events as assessment units and proposes a new ratio, Rde(Equation. (3)), defined as the ratio of the average eWUE during a specific drought event to the average eWUE over the entire study period. This aims to quantify ecosystem resilience to specific drought events in a more refined manner.
where Rde is the ecosystem resilience index for a specific drought event, eWUEde is the average eWUE during that drought event, and eWUEw is the average eWUE over the entire study period. Based on the Rde value, ecosystem resilience is categorized into four levels: high resilience for Rde ≥1; slightly non-resilient for 0.9≤ Rde <1; moderately non-resilient for 0.8≤ Rde < 0.9; and severely non-resilient for Rde < 0.8 [42].
3. Results
3.1. Drought Occurrence Frequency
Based on soil moisture data from the Dongjiang River Basin and the drought identification method described above, drought events during the period 1950–2024 were identified at a grid resolution of 0.1° × 0.1°. The results indicate that over the entire study period, the average duration of flash drought events was 142.5 (in 8-day intervals), seasonal droughts 267.6, and cross-seasonal droughts 289.8. As shown in Figure 3, the frequency of occurrence (FOC) of flash drought, seasonal drought, and cross-seasonal drought was 4.1% (range: 0.1%–8.6%), 7.8% (5.7%–10.5%), and 8.4% (5.7%–11.0%), respectively. The average proportions of these three drought types in the total drought duration were 24.9%, 46.9%, and 50.7%, respectively. Further analysis reveals that 9.9% of flash droughts were short-lived and did not develop into slowly-evolving droughts, whereas 24.7% eventually transitioned into seasonal droughts and 65.4% evolved into cross-seasonal droughts. These findings indicate that droughts in the Dongjiang River Basin are predominantly medium- to long-term seasonal and cross-seasonal events. A significant transformation relationship exists between flash droughts and gradual-onset droughts, indicating that flash droughts can serve as important precursors to medium- and long-term droughts.
The seasonal characteristics of flash droughts, based on the timing of their onset, are summarized in Table 1. The majority of flash droughts occurred in winter, with a smaller number emerging in autumn and summer, and the lowest frequency observed in spring. Furthermore, flash droughts that occurred in winter were more likely to further develop into seasonal droughts and cross-seasonal droughts.
Figure 4 illustrates the spatial patterns of the occurrence frequency of flash, seasonal, and cross-seasonal droughts. As seen in Figure 4a, the occurrence frequency of flash drought shows distinct spatial variability, with higher values in the northern mountainous region and lower values in the southern plains. The spatial distribution of cross-seasonal drought frequency is strongly consistent with elevation (Figure 4b), being generally higher in high-altitude areas. In contrast, seasonal drought frequency is relatively higher in the southern plains (Figure 4c).
3.2. Spatiotemperal Evolution of Drought Events
To further investigate the transition processes between flash droughts and slowly-evolving droughts, this study reconstructed the evolution of two typical drought events that occurred in the Dongjiang River Basin in 1997 and 2004. Figure 5 illustrates the temporal evolution of these two drought events within a representative grid cell. As shown in Figure 5a, during the period from October 24 to November 9, 1997, the soil moisture percentile decreased rapidly from 44.1th to 19.2th over two 8-day intervals, with a decline rate of 12.5th percentile per 8-day interval, exceeding the identification threshold for flash drought (6.7th percentile/8-day). Furthermore, the drought condition (soil moisture below the 20th percentile) persisted for two 8-day intervals, consistent with the definition of a flash drought. The drought event ended on November 23, with soil moisture recovering to the 29.2th percentile. Spatially, as depicted in Figure 6, the drought developed rapidly within just two 8-day intervals. Soil moisture declined sharply in the high-elevation areas of the northern and southeastern parts of the basin, leading to severe drought conditions. However, the drought duration was short, and soil moisture recovered quickly across the region. Overall, this flash drought event had a limited spatial extent, primarily affecting high-altitude areas in the north and southeast, while other regions remained unaffected throughout.
The 2004 drought event was characterized by its long duration and persistence. As illustrated in Figure 5b, the development phase began on September 21, 2004. The soil moisture percentile dropped sharply from 49.1th to 19.8th within two 8-day intervals, at a rate of 14.7th percentile/8-day, well above the flash drought identification threshold. Subsequently, soil moisture continued to decrease, and drought conditions were sustained over a longer period, eventually evolving into a cross-seasonal drought lasting 16 eight-day intervals. The spatial evolution of this event is shown in Figure 7. The drought originated in the high-elevation northern region and intensified rapidly to severe drought within two 8-day intervals, then gradually expanded southward. The northern area entered extreme drought conditions by the third 8-day interval, and by the fourth interval, drought had spread across the entire basin. The severe drought condition persisted across the whole basin for 13 eight-day intervals, with extreme drought lasting for 8 intervals.
A comparison between the isolated flash drought in 1997 and the flash drought that transitioned into a cross-seasonal event in 2004 reveals that the latter was significantly more severe in terms of intensity, duration, and spatial extent.
3.3. Ecological Responses to Droughts
Statistical values of EVI, eWUE, and Rde during different types of drought in the Dongjiang River Basin are presented in Table 2. Compared to non-drought periods, EVI values decreased during droughts, indicating the inhibitory effect of drought on plant growth—particularly pronounced during long-duration cross-seasonal droughts. The ecosystem’s resistance responses varied across drought types: resilience against flash droughts was the weakest, showing moderately non-resilient; resistance to seasonal droughts was characterized by slightly non-resilient; whereas resistance to cross-seasonal droughts remained strong. From the perspective of flash drought evolution, standalone flash droughts had limited inhibitory effects on plant growth, but the ecosystem exhibited severely non-resilient. Flash droughts that evolved into seasonal droughts also showed relatively mild inhibition on plant growth, with the ecosystem displaying slightly non-resilient. In contrast, flash droughts that progressed into cross-seasonal droughts strongly inhibited plant growth, yet the ecosystem maintained strong drought resistance.
To further investigate the resilience of ecosystem in the Dongjiang River Basin to different drought events, Rde values of flash droughts with varying durations, as well as seasonal and cross-seasonal droughts that evolved from non-flash droughts, were compared. The results are shown in Figure 8 and Figure 9. Figure 8 illustrates variations in resilience of the ecosystem to flash droughts with different durations. The ecosystem exhibited moderate non-resilient to short-duration flash droughts (2–4 8-day periods). As drought duration increased and flash droughts evolved into seasonal droughts, the ecosystem’s resilience improved, showing particularly strong resilience at 10–11 8-day periods. When flash droughts further evolved into longer-duration cross-seasonal droughts, the ecosystem largely maintained strong resilience. Compared to seasonal and cross-seasonal droughts that evolved from non-flash droughts (Figure 9), Rde values were generally higher for those evolved from flash droughts. Thus, the ecosystem overall exhibited stronger resilience to seasonal and cross-seasonal droughts that originated from flash droughts.
4. Discussion
This study employed an 8-day time scale, consistent with the temporal resolution of GPP and EVI data, for drought identification to ensure coherence in the scale of data used for ecological impact analysis. Unlike the pentad scale commonly adopted in previous studies, the choice of time scale may influence the number and frequency of drought events extracted. Figure 10 compares the frequency of occurrence of different types of droughts identified using the 8-day and pentad scales. The discrepancies between the two time scales were less than 0.9% in terms of the proportion of time units affected by drought, less than 3.7% in the proportion of total drought events, and less than 3.5% in the proportion of flash drought evolution. Further Mann-Whitney U tests were conducted on the drought event counts extracted from 318 grids under both time scales. The results, presented in Table 3, indicate no significant differences in the counts of flash droughts, seasonal droughts, cross-seasonal droughts, or the transitions of flash droughts to seasonal or cross-seasonal droughts. Moreover, the frequency of flash droughts obtained in this study is consistent with existing research. Li et al. [44] reported a flash drought frequency of 2%–6% in the southeastern Pearl River Basin (within which the Dongjiang River Basin is located) during 1960–2015, and Zhao et al. [45] documented a frequency of 3%–8% for flash droughts in southeastern China during a corresponding period. Both ranges align closely with the findings of this study.
The evolution of drought is influenced by multiple meteorological factors, such as temperature, precipitation, wind speed, and solar radiation. The transition between flash and slowly-evolving droughts investigated in this study, along with associated ecological effects, is closely related to variations in these meteorological variables. In particular, under the increasing occurrence of extreme climate events in recent years, extreme weather phenomena may further alter drought evolution patterns. Therefore, future research should focus on elucidating the role of meteorological drivers in the transition from flash to slowly-evolving droughts and identifying critical conditions and mechanisms governing these processes.
5. Conclusions
Based on soil moisture reanalysis data and remote sensing ecological products such as EVI and GPP, this study systematically identified and analyzed the spatiotemporal evolution characteristics and ecological responses of flash droughts and slowly-evolving droughts in the Dongjiang River Basin, China. The average durations of flash droughts, seasonal droughts, and cross-seasonal droughts were 142.5, 267.6, and 289.8 eight-day periods, respectively, with cross-seasonal droughts being the longest-lasting and most severe. In terms of frequency of occurrence, flash droughts accounted for 4.1% of the total time units, while seasonal droughts and cross-seasonal droughts accounted for 7.8% and 8.4%, respectively. Most flash droughts further developed into longer-lasting drought events. Specifically, 9.9% of flash droughts were short-lived and did not evolve further, 24.7% transitioned into seasonal droughts, and 65.4% eventually developed into cross-seasonal droughts, indicating that flash droughts serve as an important precursor to persistent drought events in the basin. Flash droughts occurred most frequently in winter and were more likely to evolve into slowly-evolving droughts during this season. Analysis based on ecological indicators such as EVI, eWUE, and Rde demonstrated that droughts significantly suppressed vegetation growth. It is noteworthy that ecosystems exhibited distinct resilience patterns to different types of droughts: flash droughts caused relatively mild initial suppression of vegetation, but were associated with poor ecosystem resilience; in contrast, cross-seasonal droughts, despite inducing stronger initial suppression, were met with higher ecosystem resilience.
These findings highlight the importance of enhancing monitoring and early identification of flash droughts as a critical signal for warning of extreme persistent drought events. The research outcomes provide a scientific basis for drought risk management and prevention in the Dongjiang River Basin and other similar humid subtropical regions.
Author Contributions
Conceptualization, Q.H.; methodology, Q.H.; software, Z.W.; validation, Q.H. and L.O.; formal analysis, Q.H.; investigation, Z.W., J.L.; data curation, Z.W., J.L.; writing—original draft preparation, Q.H.; writing—review and editing, Q.H.; visualization, Q.H.; supervision, L.O.; project administration, Q.H.; funding acquisition, Q.H., L.O.. All authors have read and agreed to the published version of the manuscript.
Funding
This research was funded by the Natural Science Foundation of Guangdong Province, China (No. 2021A1515011296 and 2025A1515011110), the General Project of Shenzhen University Stable Support Program (No. 20200926182950001), and the Post-doctoral Later-Stage Foundation Project of Shenzhen Polytechnic University (No. 6020271006K).
Data Availability Statement
The data the support the findinds of this study are available on request from the corresponding author upon reasonable request.
Acknowledgments
The authors express the great gratitude to those who make careful inspection and give advice for the improvement of this paper.
Conflicts of Interest
The authors declare no conflicts of interest.
References
- Sun, J.H.; Zhang, Q.S.; Xu, J.Y.; Liu, XM.; Liwen Chen, L.W.; Zhang, G.X.; Wu, Y.F. Will drought evolution accelerate under future climate? J. Hydrol. 2025, 650, 132552. [Google Scholar]
- Wang, L.C.; He, F.; Zhao, Y.; Wang, J.H.; Lu, P.Y.; Jia, Y.G.; Liu, K.A.; Deng, H.D.; Cui, H. Inter-basin water transfer will face greater drought risk in the futur. J. Environ. Manag. 2025, 385, 125649. [Google Scholar] [CrossRef] [PubMed]
- Crausbay, S.D.; Ramirez, A.R.; Carter, S.L.; Cross, M.S.; Hall, K.R.; Bathke, D.J.; Betancourt, J.L.; Colt, S.; Cravens, A.E.; Dalton, M.S.; et al. Defining Ecological Drought for the Twenty-First Century. Bull. Am. Meteorol. Soc. 2017, 98, 2543–2550. [Google Scholar] [CrossRef]
- Li, Q.Q.; Ye, A.Z.; Nath, R.; Zhang, Y.H. , Zhou, J.J. The global drought-sensitive areas will expand in the future. Ecol. Indic. 2025, 178, 113838. [Google Scholar]
- United Nations Convention to Combat Desertification (UNCCD). Drought in Numbers 2022: Restoration for readiness and resilience. 2022. https://www.unccd.int/resources/publications/drought-numbers.
- Mishra, A.K.; Singh, V.P. A Review of Drought Concepts. J. Hydrol. 2010, 391, 202–216. [Google Scholar] [CrossRef]
- Mishra, A.K.; Singh, V.P. Drought modeling-A review. J. Hydrol. 2011, 403, 157–175. [Google Scholar] [CrossRef]
- Li, D.; Ding, Y.; Zhou, Z.; Wang, T.; Wei, R. The Spatiotemporal Evolution and Propagation Characteristics of Multiple Drought Types from a Three-Dimensional Perspective. J. Hydrol. 2025, 652, 132702. [Google Scholar] [CrossRef]
- Svoboda, M.; Lecomete, D.; Hayes, M.; Heim, R.; Gleason, K.; Angel, J.; Rippey, B.; Tinker, R.; Palecki, M.; Stooksbury, D.; Miskus, D.; Stephens,.S. The drought monitor. Bull. Am. Meteorol. Soc. 2002, 83, 1181–1190. [Google Scholar] [CrossRef]
- Yuan, X.; Ma, Z.; Pan, M.; Shi, C. Microwave Remote Sensing of Short-term Droughts during Crop Growing Seasons. Geophys. Res. Lett. 2015, 42, 4394–4401. [Google Scholar] [CrossRef]
- Otkin, J.A.; Zhong, Y.; Lorenz, D.; Anderson, M.C.; Hain, C. Exploring Seasonal and Regional Relationships between the Evaporative Stress Index and Surface Weather and Soil Moisture Anomalies across the United States. Hydrol. Earth Syst. Sci. 2018, 22, 5373–5386. [Google Scholar] [CrossRef]
- Hao, Z.; Li, W.; Singh, V.P.; Xia, Y.; Zhang, X.; Hao, F. Impact of Dependence Changes on the Likelihood of Hot Extremes under Drought Conditions in the United States. J. Hydrol. 2020, 581, 124410. [Google Scholar] [CrossRef]
- Zhang, Y.; You, Q.; Chen, C.; Wang, H.; Ullah, S.; Shen, L. Characteristics of Flash Droughts and Their Association with Compound Meteorological Extremes in China: Observations and Model Simulations. Sci. Total Environ. 2024, 916, 170133. [Google Scholar] [CrossRef] [PubMed]
- Pendergrass, A.G.; Meehl, G.A.; Pulwarty, R.; Hobbins, M.; Hoell, A.; AghaKouchak, A.; Bonfils, C.J.W.; Gallant, A.J.E.; Hoerling, M.; Hoffmann, D.; et al. Flash Droughts Present a New Challenge for Subseasonal-to-Seasonal Prediction. Nat. Clim. Change 2020, 10, 191–199. [Google Scholar] [CrossRef]
- Liu, Y.; Zhu, Y.; Zhang, L.; Ren, L.; Yuan, F.; Yang, X.; Jiang, S. Flash Droughts Characterization over China: From a Perspective of the Rapid Intensification Rate. Sci. Total Environ. 2020, 704, 135373. [Google Scholar] [CrossRef]
- Christian, J.I.; Grace, T.M.; Fellman, B.J.; Mesheske, D.F.; Edris, S.G.; Olayiwola, H.O.; Basara, J.B.; Fuchs, B.A.; Furtado, J.C. The Flash Droughts across the South-Central United States in 2022: Drivers, Predictability, and Impacts. Weather Clim. Extrem. 2024, 46, 100730. [Google Scholar] [CrossRef]
- Otkin, J.A.; Anderson, M.C.; Hain, C.; Svoboda, M.; Johnson, D.; Mueller, R.; Tadesse, T.; Wardlow, B.; Brown, J. Assessing the Evolution of Soil Moisture and Vegetation Conditions during the 2012 United States Flash Drought. Agric. For. Meteorol. 2016, 218–219, 230–242. [Google Scholar] [CrossRef]
- Yuan, X.; Wang, L.; Wu, P.; Ji, P.; Sheffield, J.; Zhang, M. Anthropogenic Shift towards Higher Risk of Flash Drought over China. Nat. Commun. 2019, 10, 4661. [Google Scholar] [CrossRef]
- Wang, H.; Zhu, Q.; Wang, Y.; Zhang, H. Spatio-Temporal Characteristics and Driving Factors of Flash Drought Recovery: From the Perspective of Soil Moisture and GPP Changes. Weather Clim. Extrem. 2023, 42, 100605. [Google Scholar] [CrossRef]
- Christian, J.I.; Basara, J.B.; Otkin, J.A.; Hunt, E.D. Regional Characteristics of Flash Droughts across the United States. Environ. Res. Commun. 2019, 1, 125004. [Google Scholar] [CrossRef]
- Sun, J.; Zhang, Q.; Liu, X.; Sun, J.; Chen, L.; Wu, Y.; Hu, B.; Zhang, G. Flash Droughts in a Hotspot Region: Spatiotemporal Patterns, Possible Climatic Drivings and Ecological Impacts. Weather Clim. Extrem. 2024, 45, 100700. [Google Scholar] [CrossRef]
- Pallavi Goswami, P.; Gallant, A.J.E. Understanding drought onset: What makes flash droughts different from conventional droughts? Weather. Clim. Extrem. 2025, 49, 100782. [Google Scholar]
- Otkin, J.A.; Svoboda, M.; Hunt, E.D.; Ford, T.W.; Anderson, M.C.; Hain, C.; Basara, J.B. Flash Droughts: A Review and Assessment of the Challenges Imposed by Rapid-Onset Droughts in the United States. Bull. Am. Meteorol. Soc. 2018, 99, 911–919. [Google Scholar] [CrossRef]
- Wang, L.; Yuan, X. Two Types of Flash Drought and Their Connections with Seasonal Drought. Adv. Atmos. Sci. 2018, 35, 1478–1490. [Google Scholar] [CrossRef]
- Liu, Y.; Zhu, Y.; Ren, L.; Otkin, J.; Hunt, E.D.; Yang, X.; Yuan, F.; Jiang, S. Two Different Methods for Flash Drought Identification: Comparison of Their Strengths and Limitations. J. Hydrometeorol. 2020, 21, 691–704. [Google Scholar] [CrossRef]
- Otkin, J.A.; Zhong, Y.; Hunt, E.D.; Basara, J.; Svoboda, M.; Anderson, M.C.; Hain, C. Assessing the Evolution of Soil Moisture and Vegetation Conditions during a Flash Drought–Flash Recovery Sequence over the South-Central United States. J. Hydrometeorol. 2019, 20, 549–562. [Google Scholar] [CrossRef]
- The per capita water resources in the Dongjiang River Basin amount to only one-third of the national average. Available online: https://www.sohu.com/a/279928833_222493 (accessed on 26 August 2025).
- Falkenmark, M.; Lundqvist, J.; Widstrand, C. Macro-scale water scarcity requires micro-scale approaches: aspects of vulnerability in semi-arid development. Nat. Resour. Forum 1989, 13, 258–267. [Google Scholar] [CrossRef]
- Wang, T.; Tu, X.J.; Singh, V.P.; Chen, X.H.; Lin, K.R.; Lai, R.B.; Zhou, Z.L. Socioeconomic drought analysis by standardized water supply and demand index under changing environment. J. Clean. Prod. 2022, 347, 131248. [Google Scholar] [CrossRef]
- Wu, J.F.; Yao, H.X.; Chen, X.H.; Wang, G.X.; Bai, X.Y.; Zhang, D.J. A framework for assessing compound drought events from a drought propagation perspective. J. Hydrol. 2022, 604, 127228. [Google Scholar] [CrossRef]
- Seneviratne, S.I.; Corti, T.; Davin, E.L.; Hirschi, M.; Jaeger, E.B.; Lehner, I.; Orlowsky, B.; Teuling, A.J. Investigating soil moisture–climate interactions in a changing climate: A review. Earth-Sci. Rev. 2010, 99, 125–161. [Google Scholar] [CrossRef]
- Fisher, J.B.; Melton, F.; Middleton, E.; Hain, C.; Anderson, M.; Allen, R.; McCabe, M.F.; Hook, S.; Baldocchi, D.; Townsend, P.A.; et al. The Future of Evapotranspiration: Global Requirements for Ecosystem Functioning, Carbon and Climate Feedbacks, Agricultural Management, and Water Resources. Water Resour. Res. 2017, 53, 2618–2626. [Google Scholar] [CrossRef]
- Li, M.; Cui, R.; Bu, L.J.; Yang, Y.T. Loss and recovery of vegetation productivity in response to extreme drought during 2022 across China. Ecol. Indic. 2024, 166, 112358. [Google Scholar] [CrossRef]
- Qiu, R.N.; Li, X.; Han, G.; Xiao, J.F.; Ma, X.; Gong, W. Monitoring drought impacts on crop productivity of the U.S. Midwest with solar-induced fluorescence: GOSIF outperforms GOME-2 SIF and MODIS NDVI, EVI, and NIRv. Agric. For. Meteorol. 2022, 323, 109038. [Google Scholar] [CrossRef]
- Li, X.; Xiao, J.F. Mapping Photosynthesis Solely from Solar-Induced Chlorophyll Fluorescence: A Global, Fine-Resolution Dataset of Gross Primary Production Derived from OCO-2. Remote Sens. 2019, 11, 2563. [Google Scholar] [CrossRef]
- Yevjevich, V. An objective approach to definitions and investigations of continental hydrologic droughts. In Hydrology Paper No. 23. Colorado State University: Fort Collins, 1967, 9.
- Otkin, J.A.; Zhong, Y.; Hunt, E.D.; Christian, J.I.; Basara, J.B.; Nguyen, H.; Wheeler, M.C.; Ford, T.W.; Hoell, A.; Svoboda, M.; et al. Development of a Flash Drought Intensity Index. Atmosphere 2021, 12, 741. [Google Scholar] [CrossRef]
- Ford, T.W.; Labosier, C.F. Meteorological Conditions Associated with the Onset of Flash Drought in the Eastern United States. Agric. For. Meteorol. 2017, 247, 414–423. [Google Scholar] [CrossRef]
- Liu, W.B.; Sun, F.B.; Sun, S.B.; Guo, L.M.; Wang, H.; Cui, H.J. Multi-scale assessment ofeco-hydrological resilience to drought in China over the last three decades. Sci. Total Environ. 2019, 672, 201–211. [Google Scholar] [CrossRef]
- Poonia, V.; Goyal, M.K.; Jha, S.; Dubey, S. Terrestrial ecosystem response to flash droughts over India. J. Hydrol. 2022, 605, 127402. [Google Scholar] [CrossRef]
- Hao, Y.; Choi, M. Recovery of ecosystem carbon and water fluxes after drought in China. J. Hydrol. 2023, 622, 129766. [Google Scholar] [CrossRef]
- Sharma, A.; Goyal, M.K. Assessment ofecosystem resilience to hydroclimatic disturbances in India. Glob. Change Biol. 2017, 24, e432–e441. [Google Scholar]
- Sharma, A.; Goyal, M.K. District-level assessment of the ecohydrological resilience to hydroclimatic disturbances and its controlling factors in India. J. Hydrol. 2018, 564, 1048–1057. [Google Scholar] [CrossRef]
- Li, J.; Wang, Z.L.; Wu, X.S.; Guo, S.L.; Chen, X.H. Flash droughts in the Pearl River Basin, China: Observed characteristics and future changes. Sci. Total Environ. 2020, 707, 136074. [Google Scholar] [CrossRef]
- Zhao, Y.; Xiong, L.H.; Yin, J.B.; Zha, X.N.; Li, W.B.; Han, Y.J. Understanding the effects of flash drought on vegetation photosynthesis and potential drivers over China. Sci. Total Environ. 2024, 931, 172926. [Google Scholar] [CrossRef]
Figure 1.
The location of Dongjiang River Basin.
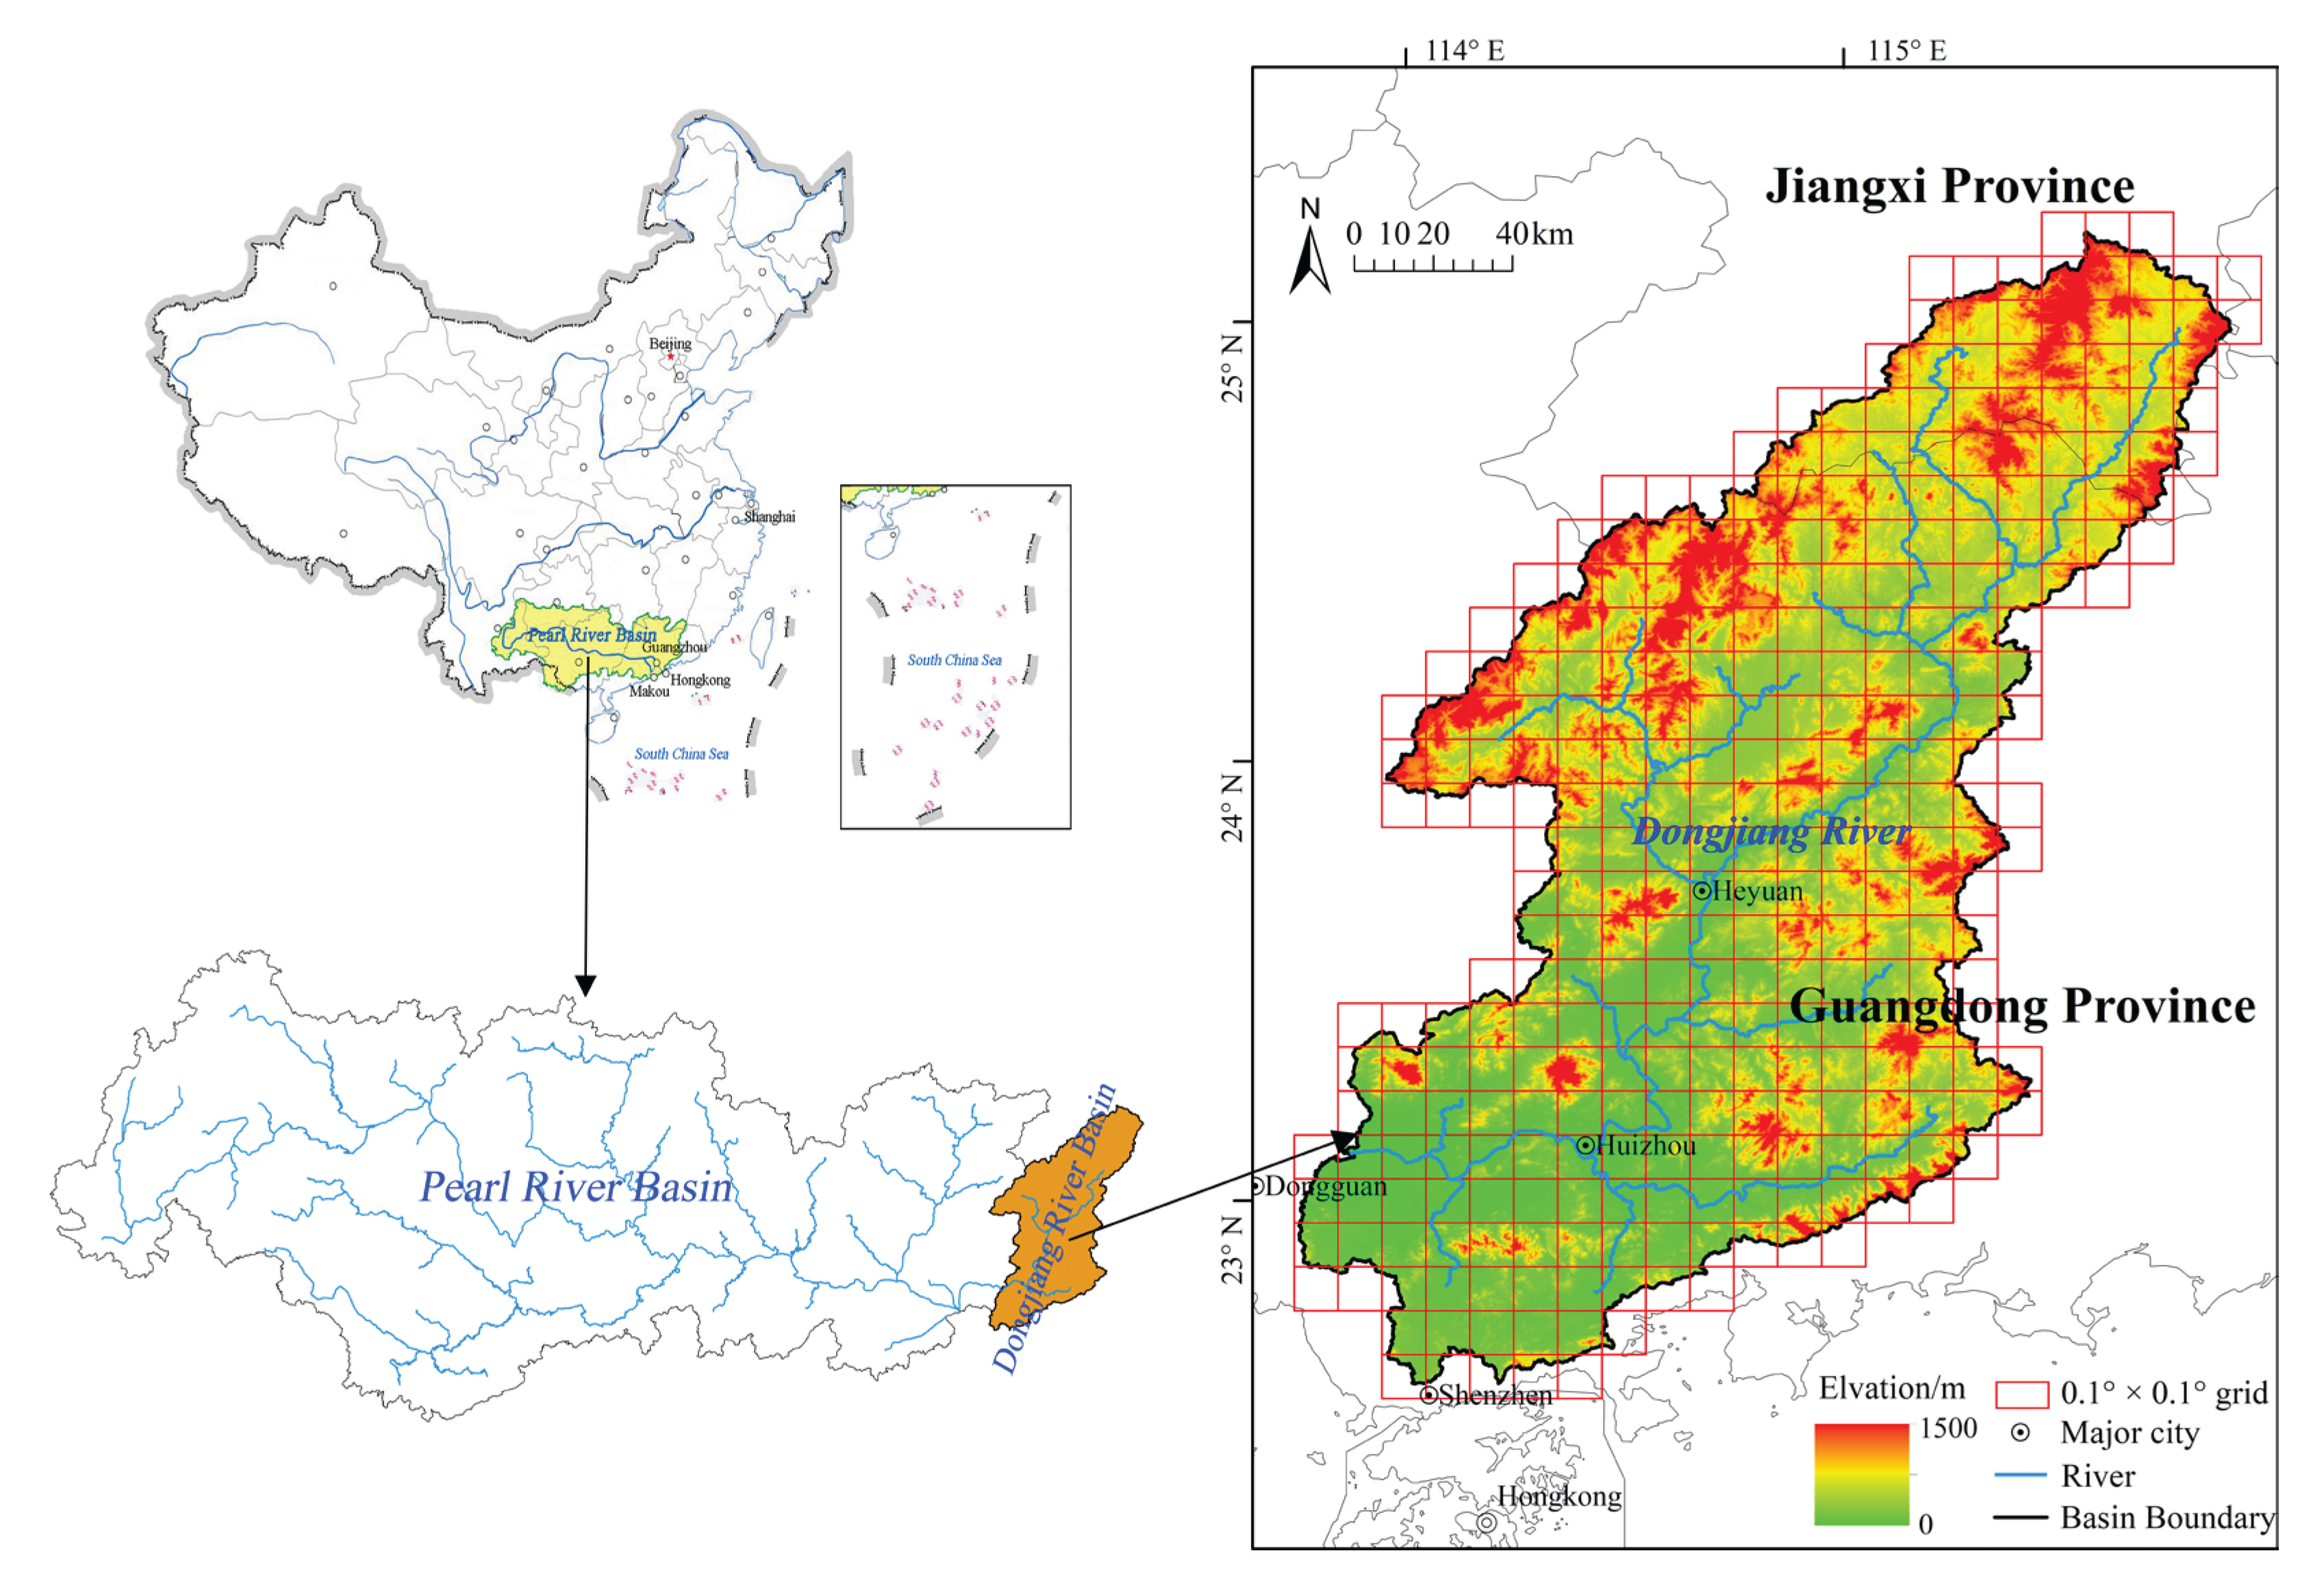
Figure 2.
The sketch of drought identification at the grid cell level from 2002 to 2006 (the horizontal axis represents the sequential number of the 8-day interval within a year).
Figure 2.
The sketch of drought identification at the grid cell level from 2002 to 2006 (the horizontal axis represents the sequential number of the 8-day interval within a year).
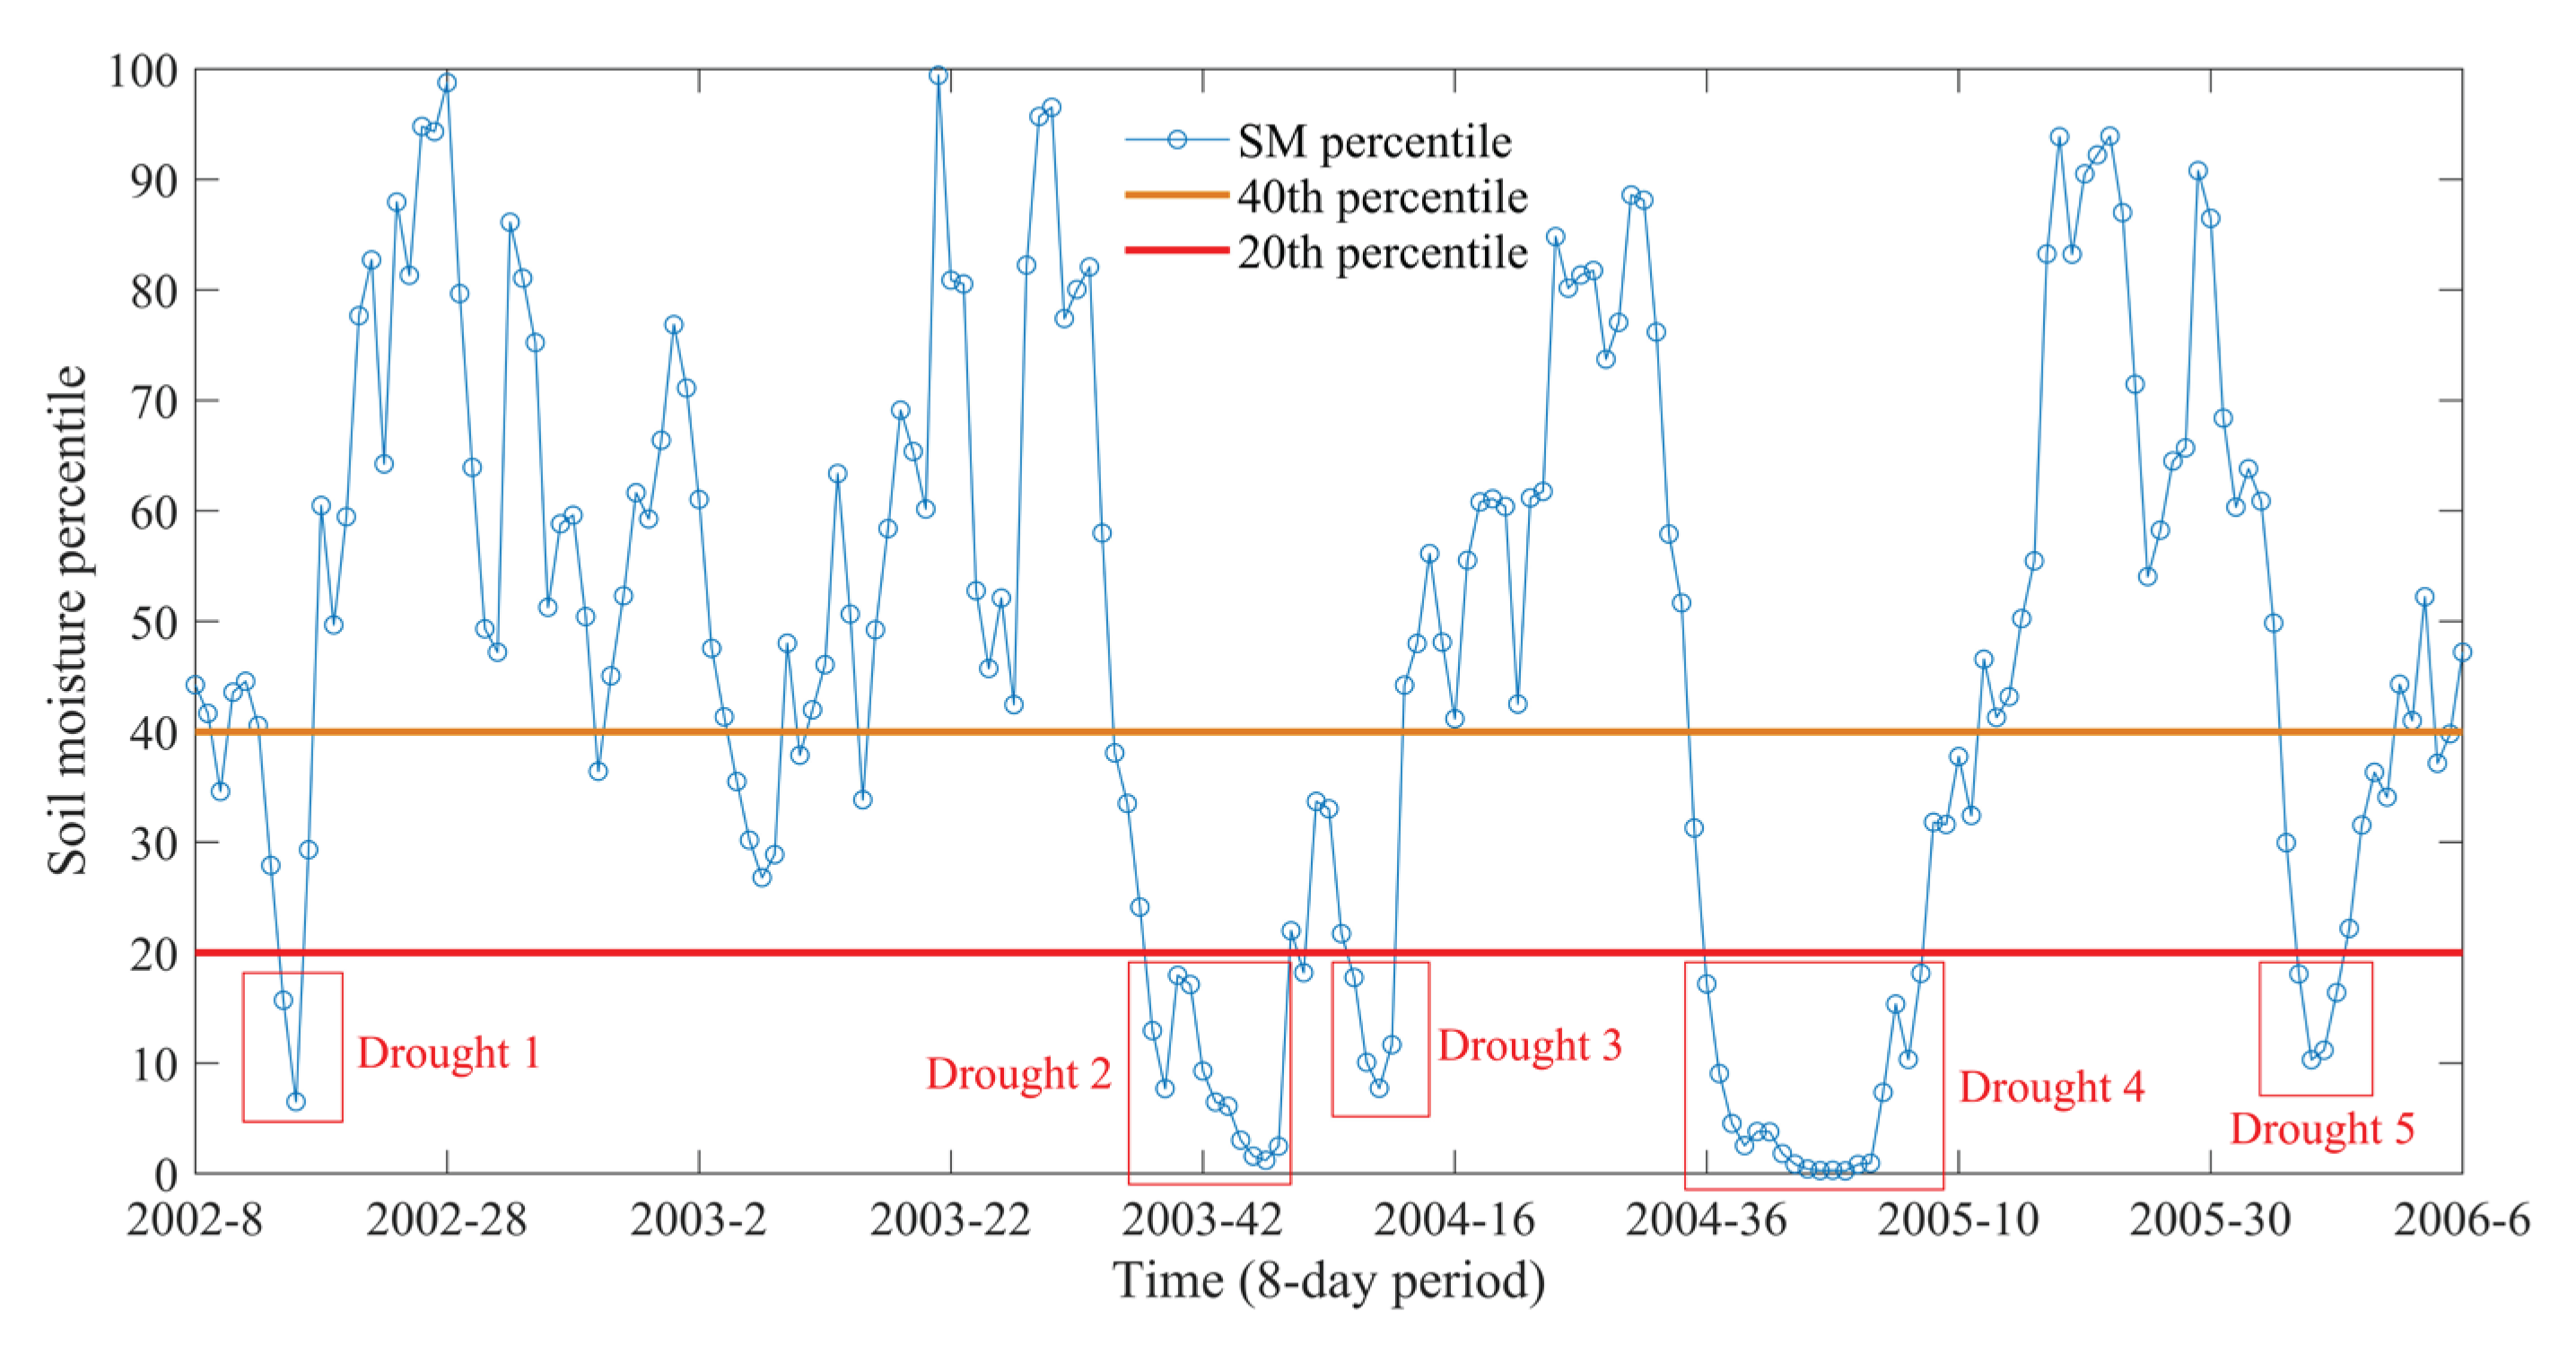
Figure 3.
Statistical box plot of drought occurrence frequency in the Dongjiang River Basin.
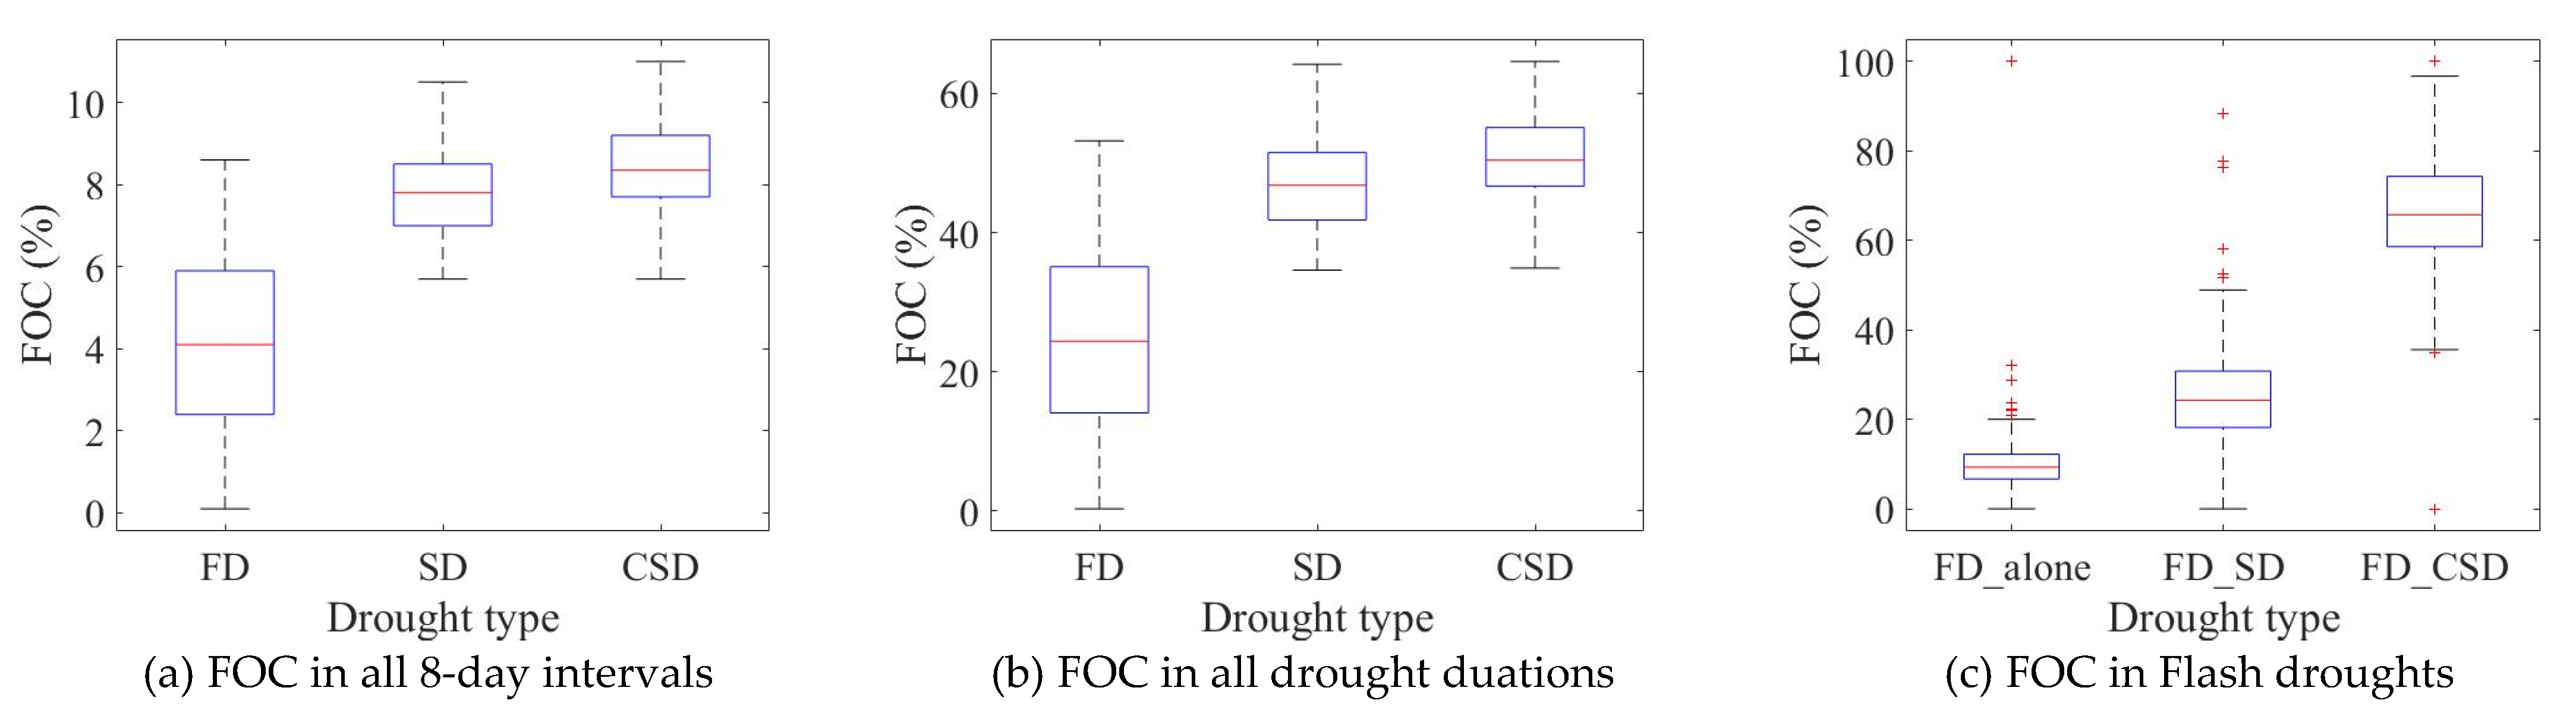
Figure 4.
Spatial distribution of drought occurrence frequency in the Dongjiang River Basin.
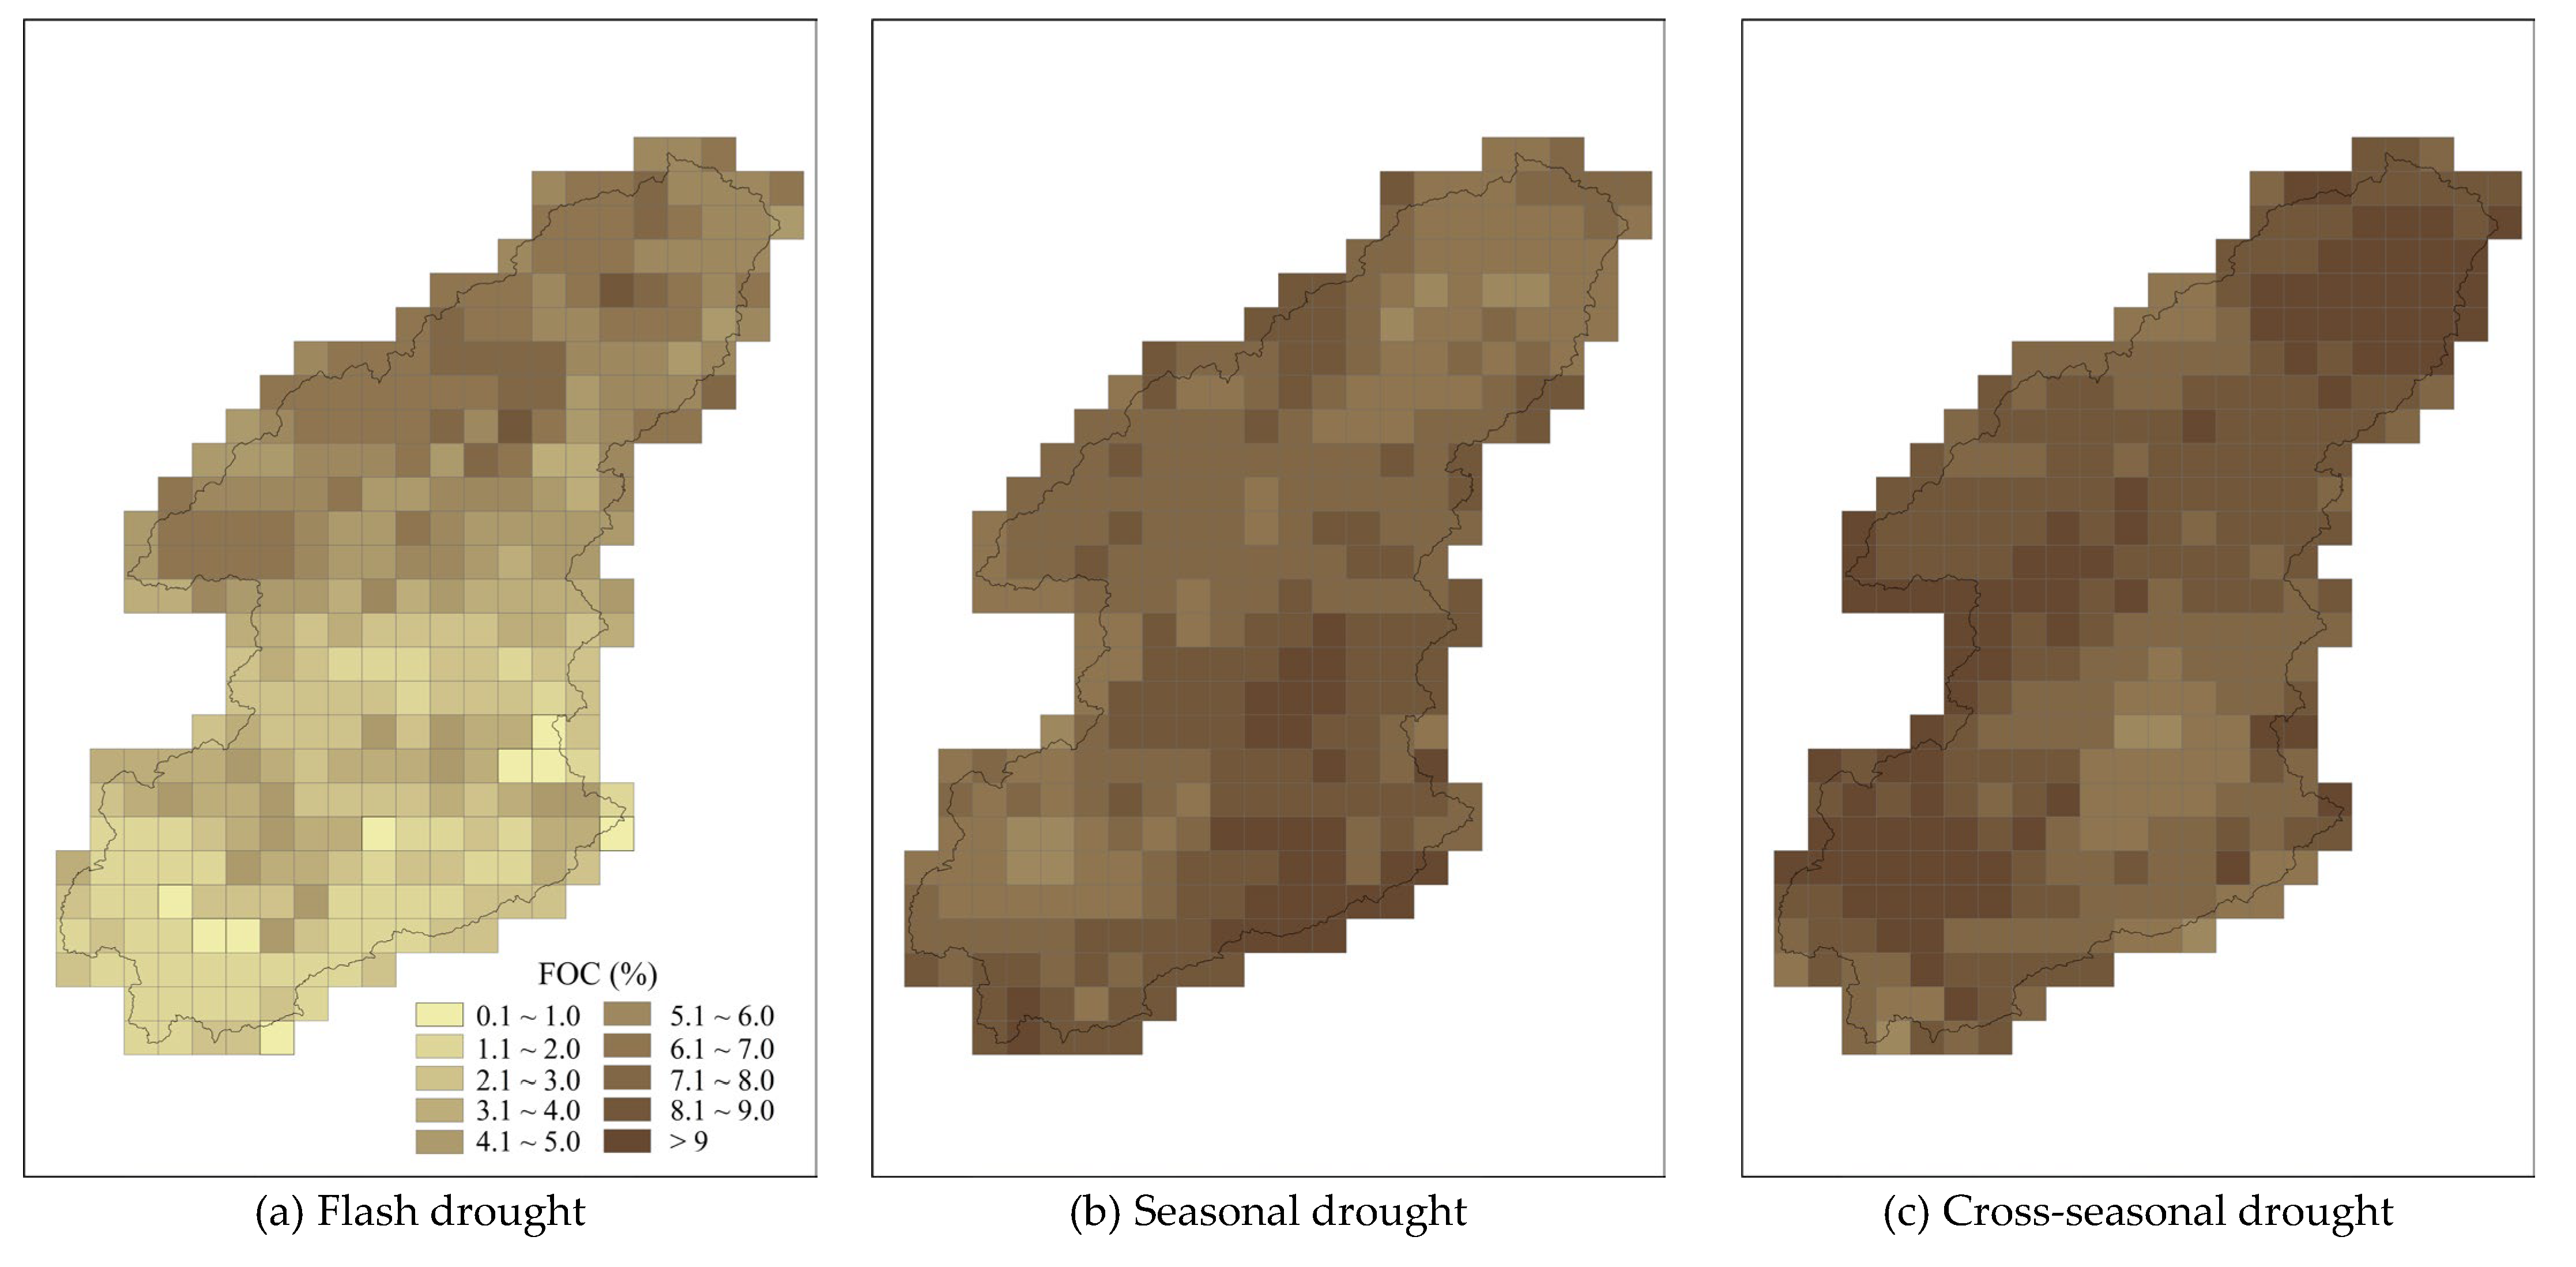
Figure 5.
Temporal evolution of the two drought events in the Dongjiang River Basin in 1997 and 2004.
Figure 5.
Temporal evolution of the two drought events in the Dongjiang River Basin in 1997 and 2004.
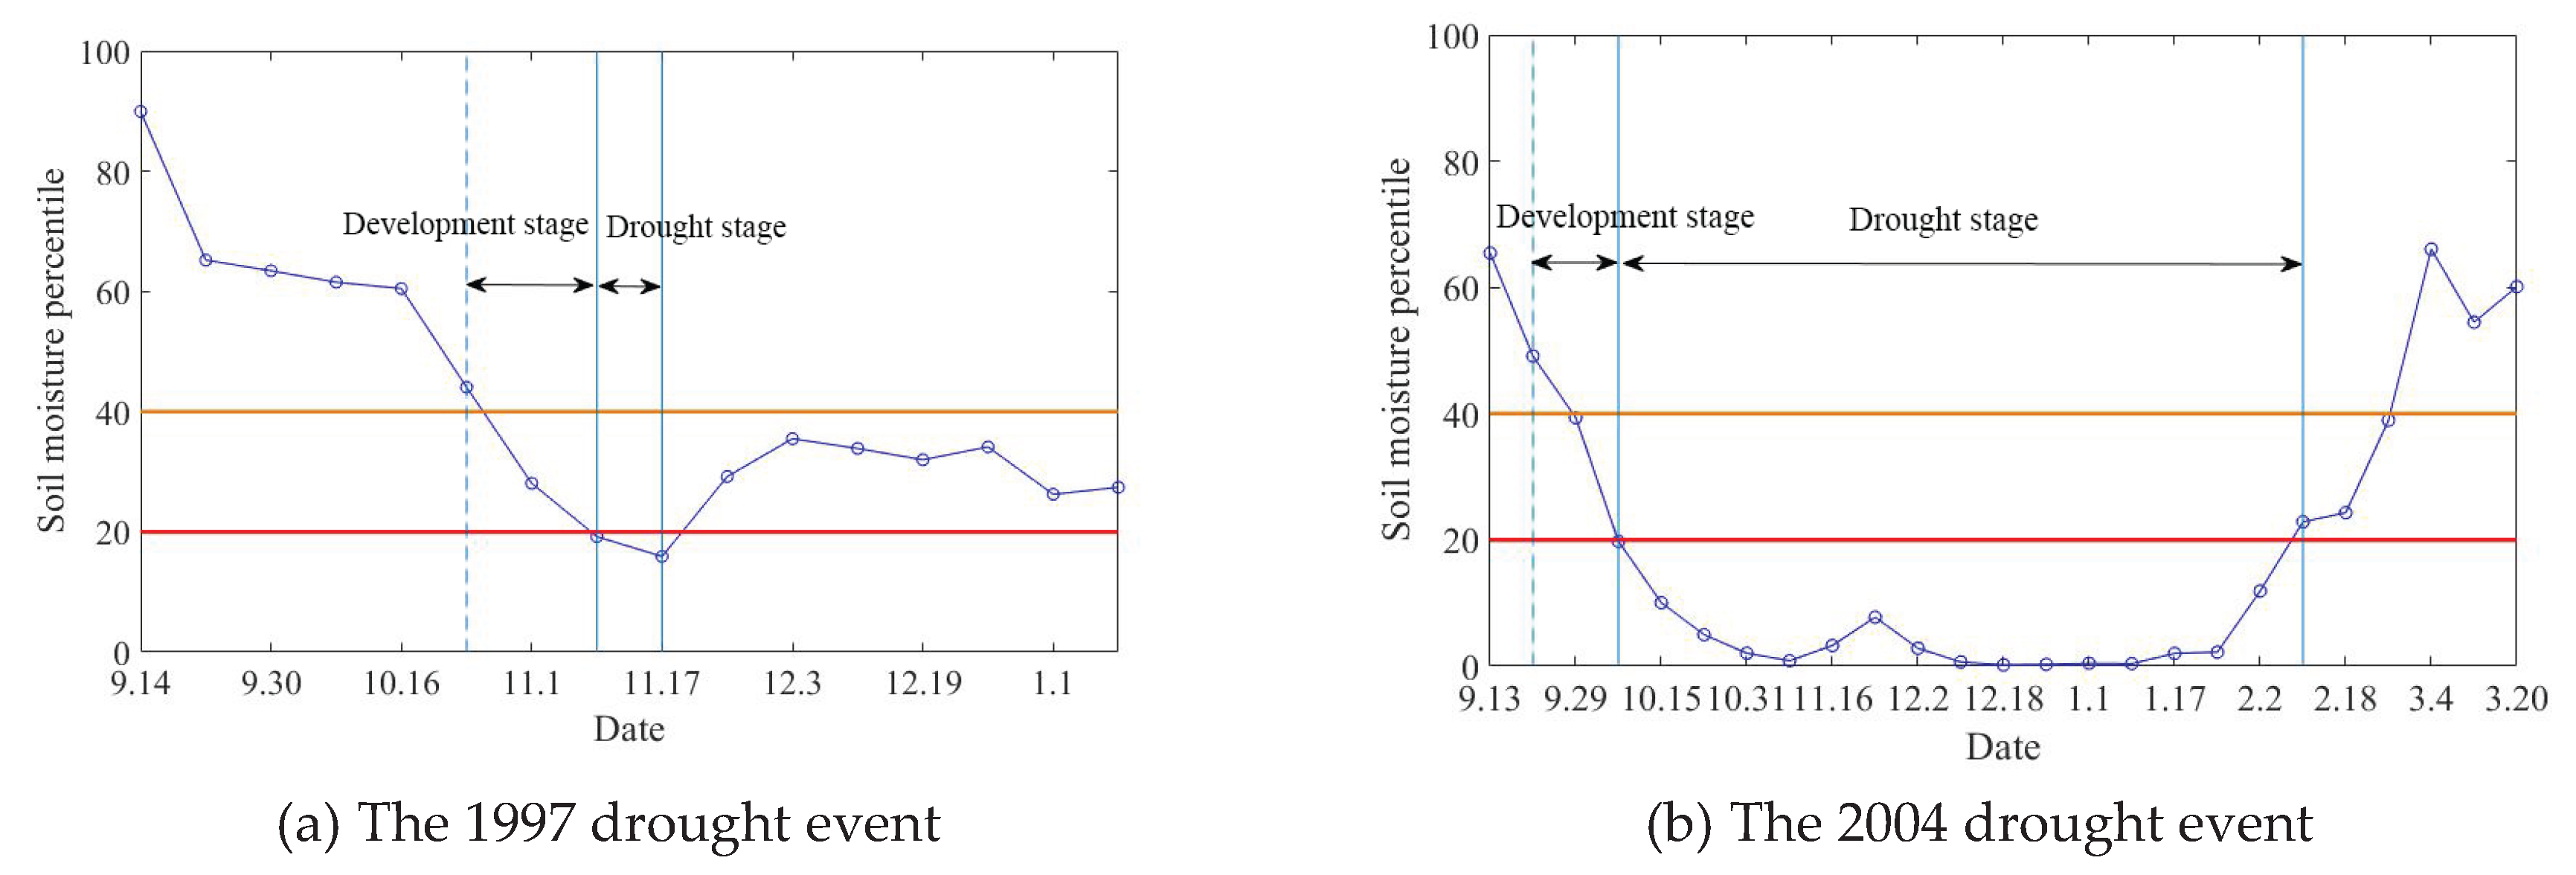
Figure 6.
Spatial evolution of the 1997 drought event in the Dongjiang River Basin.
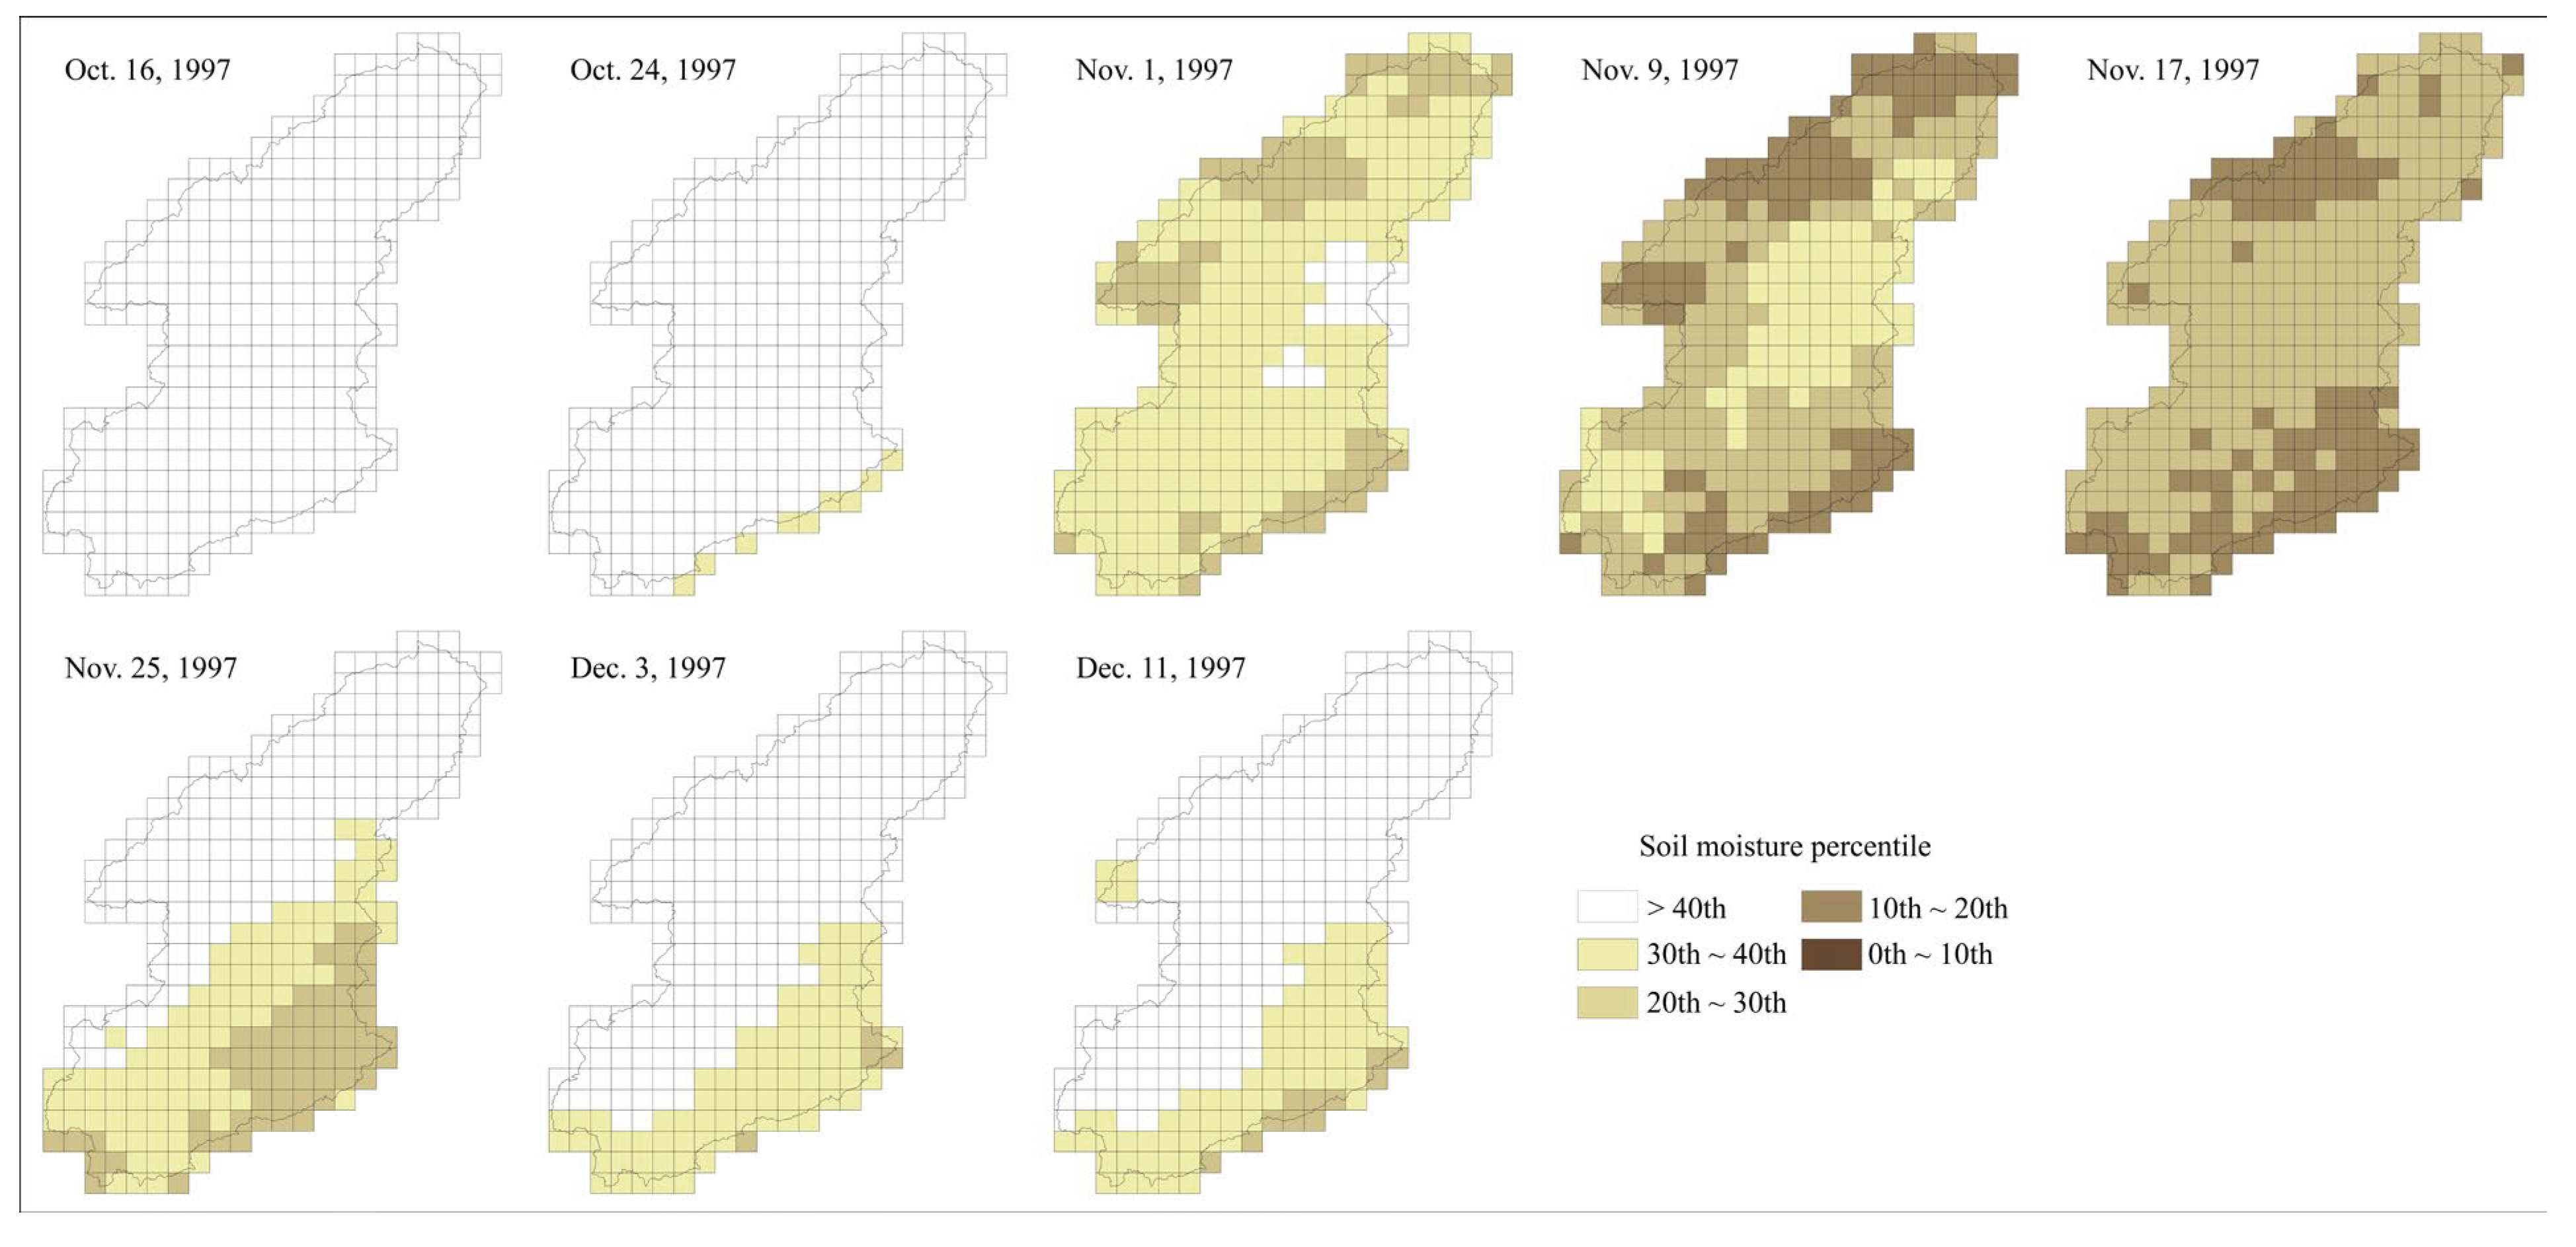
Figure 7.
Spatial evolution of the 2004 drought event in the Dongjiang River Basin.
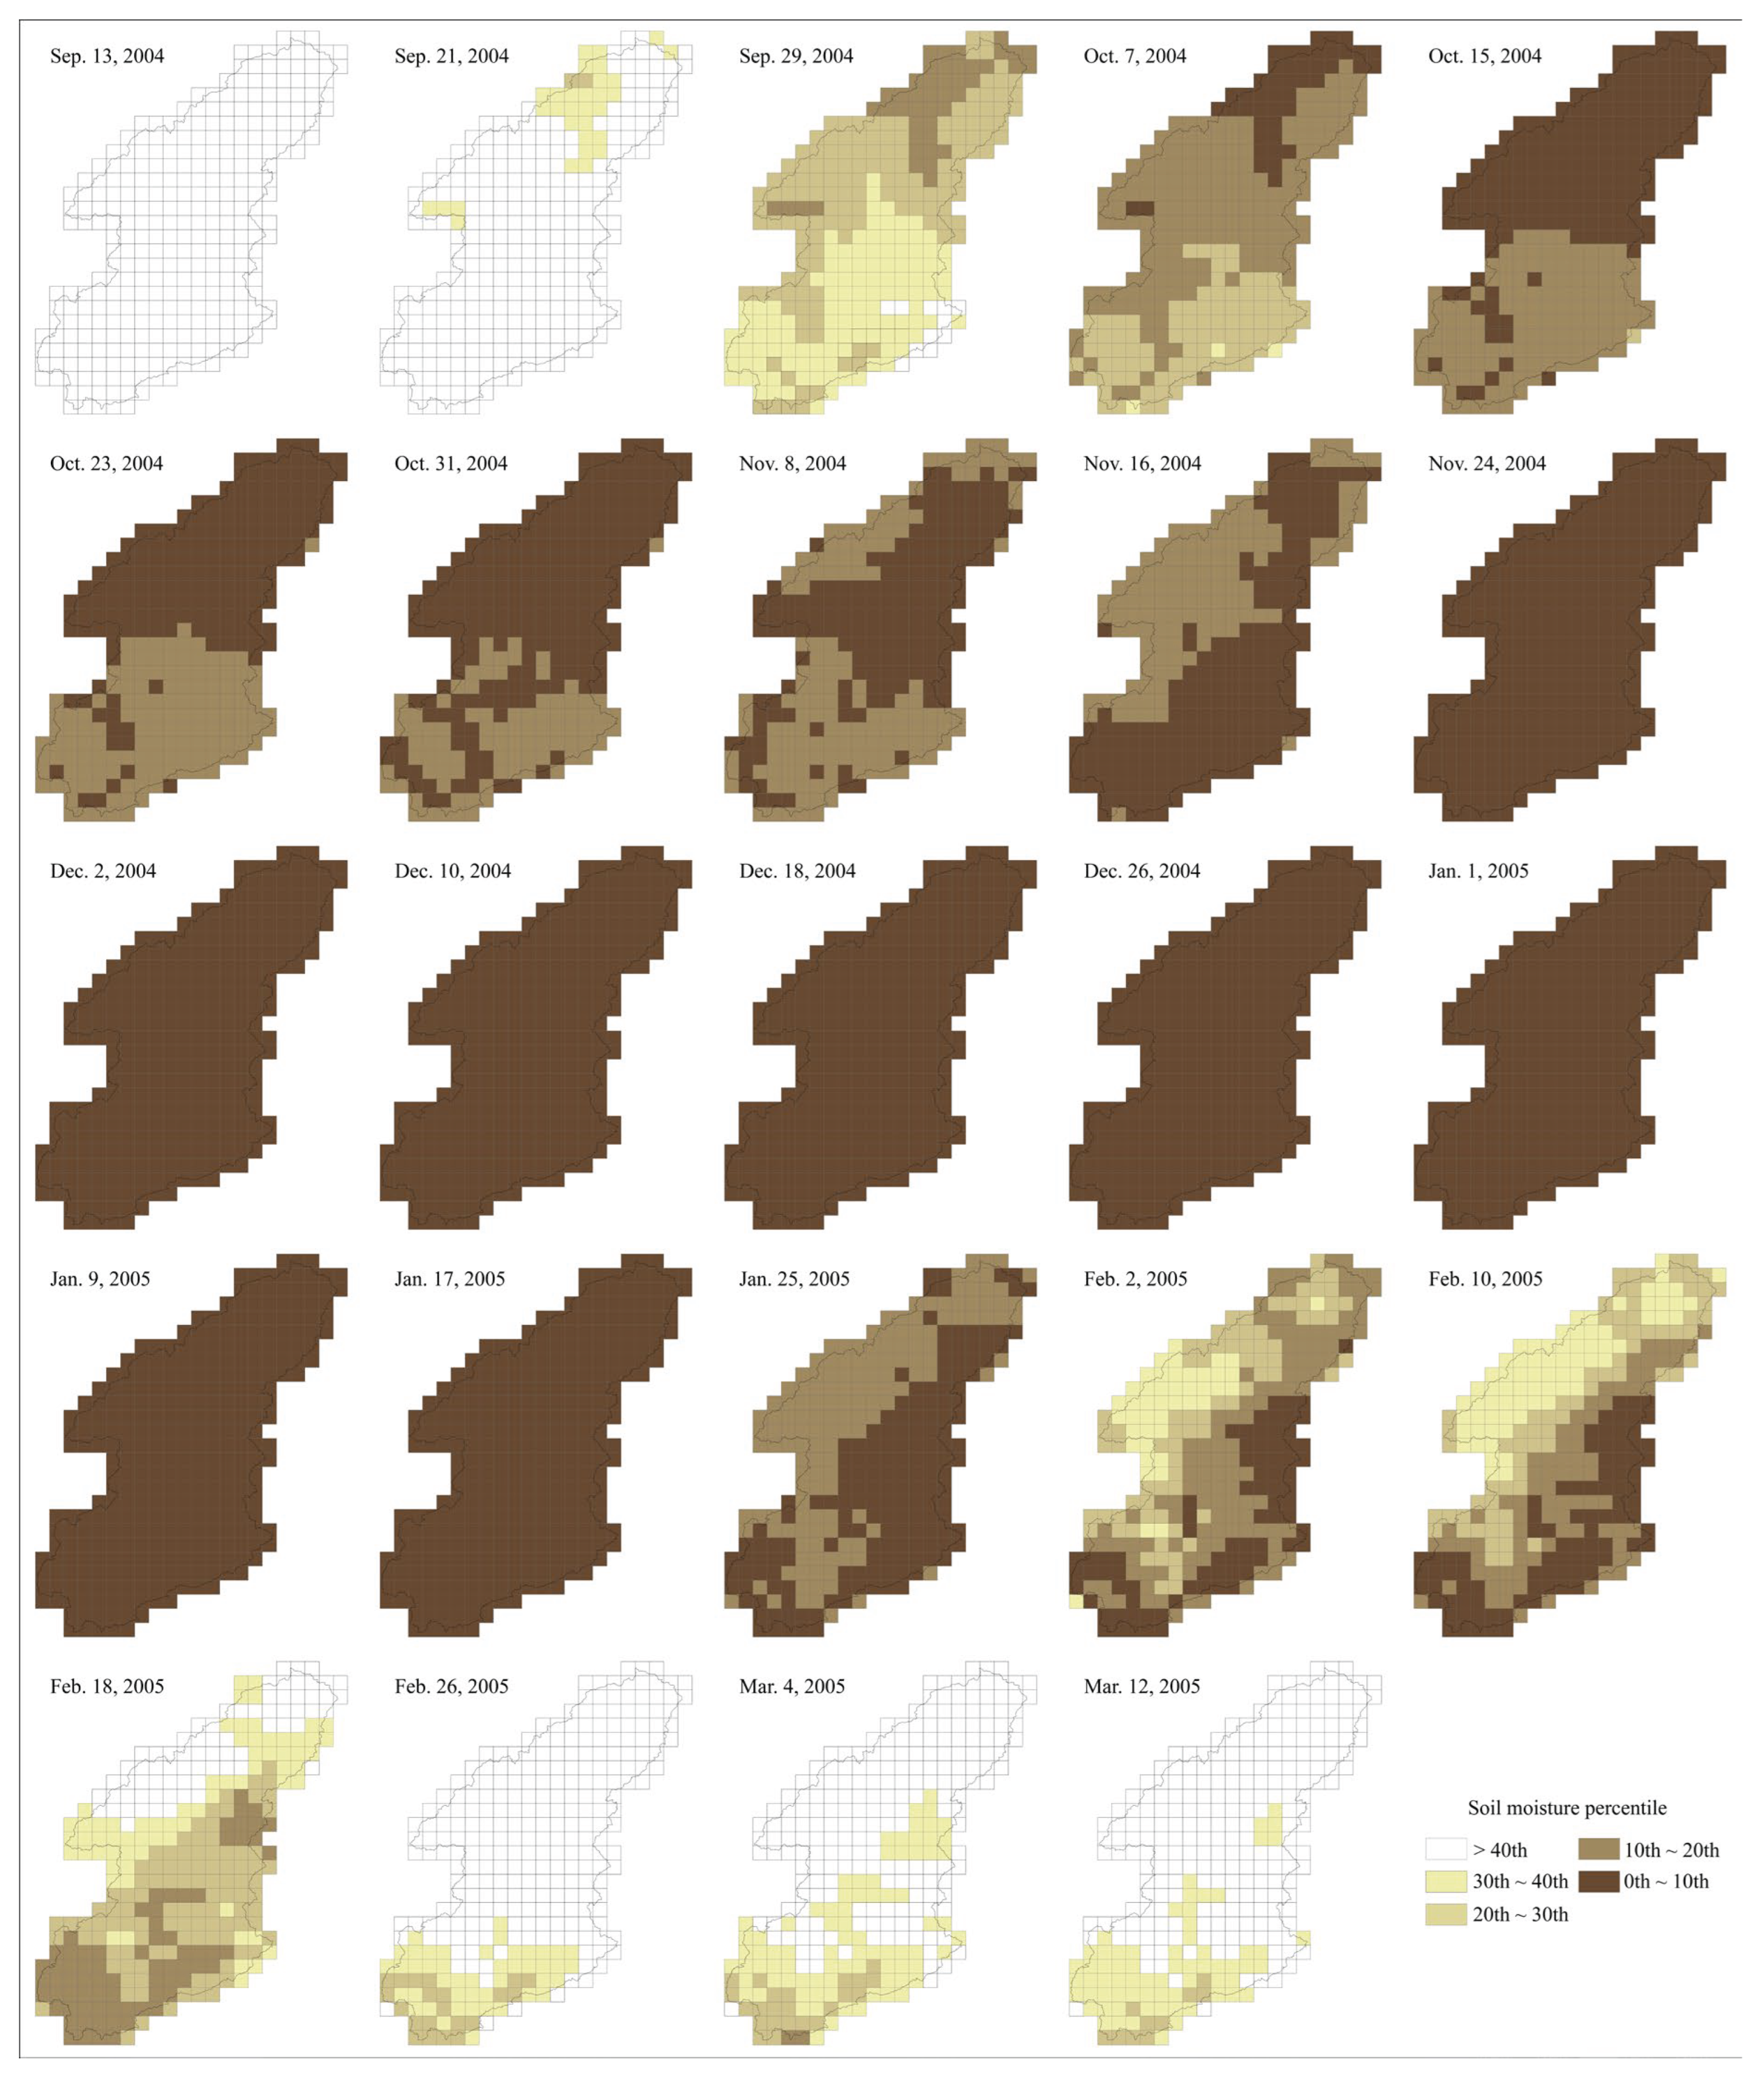
Figure 8.
Relationship between flash drought duration and Rde in the Dongjiang River Basin.
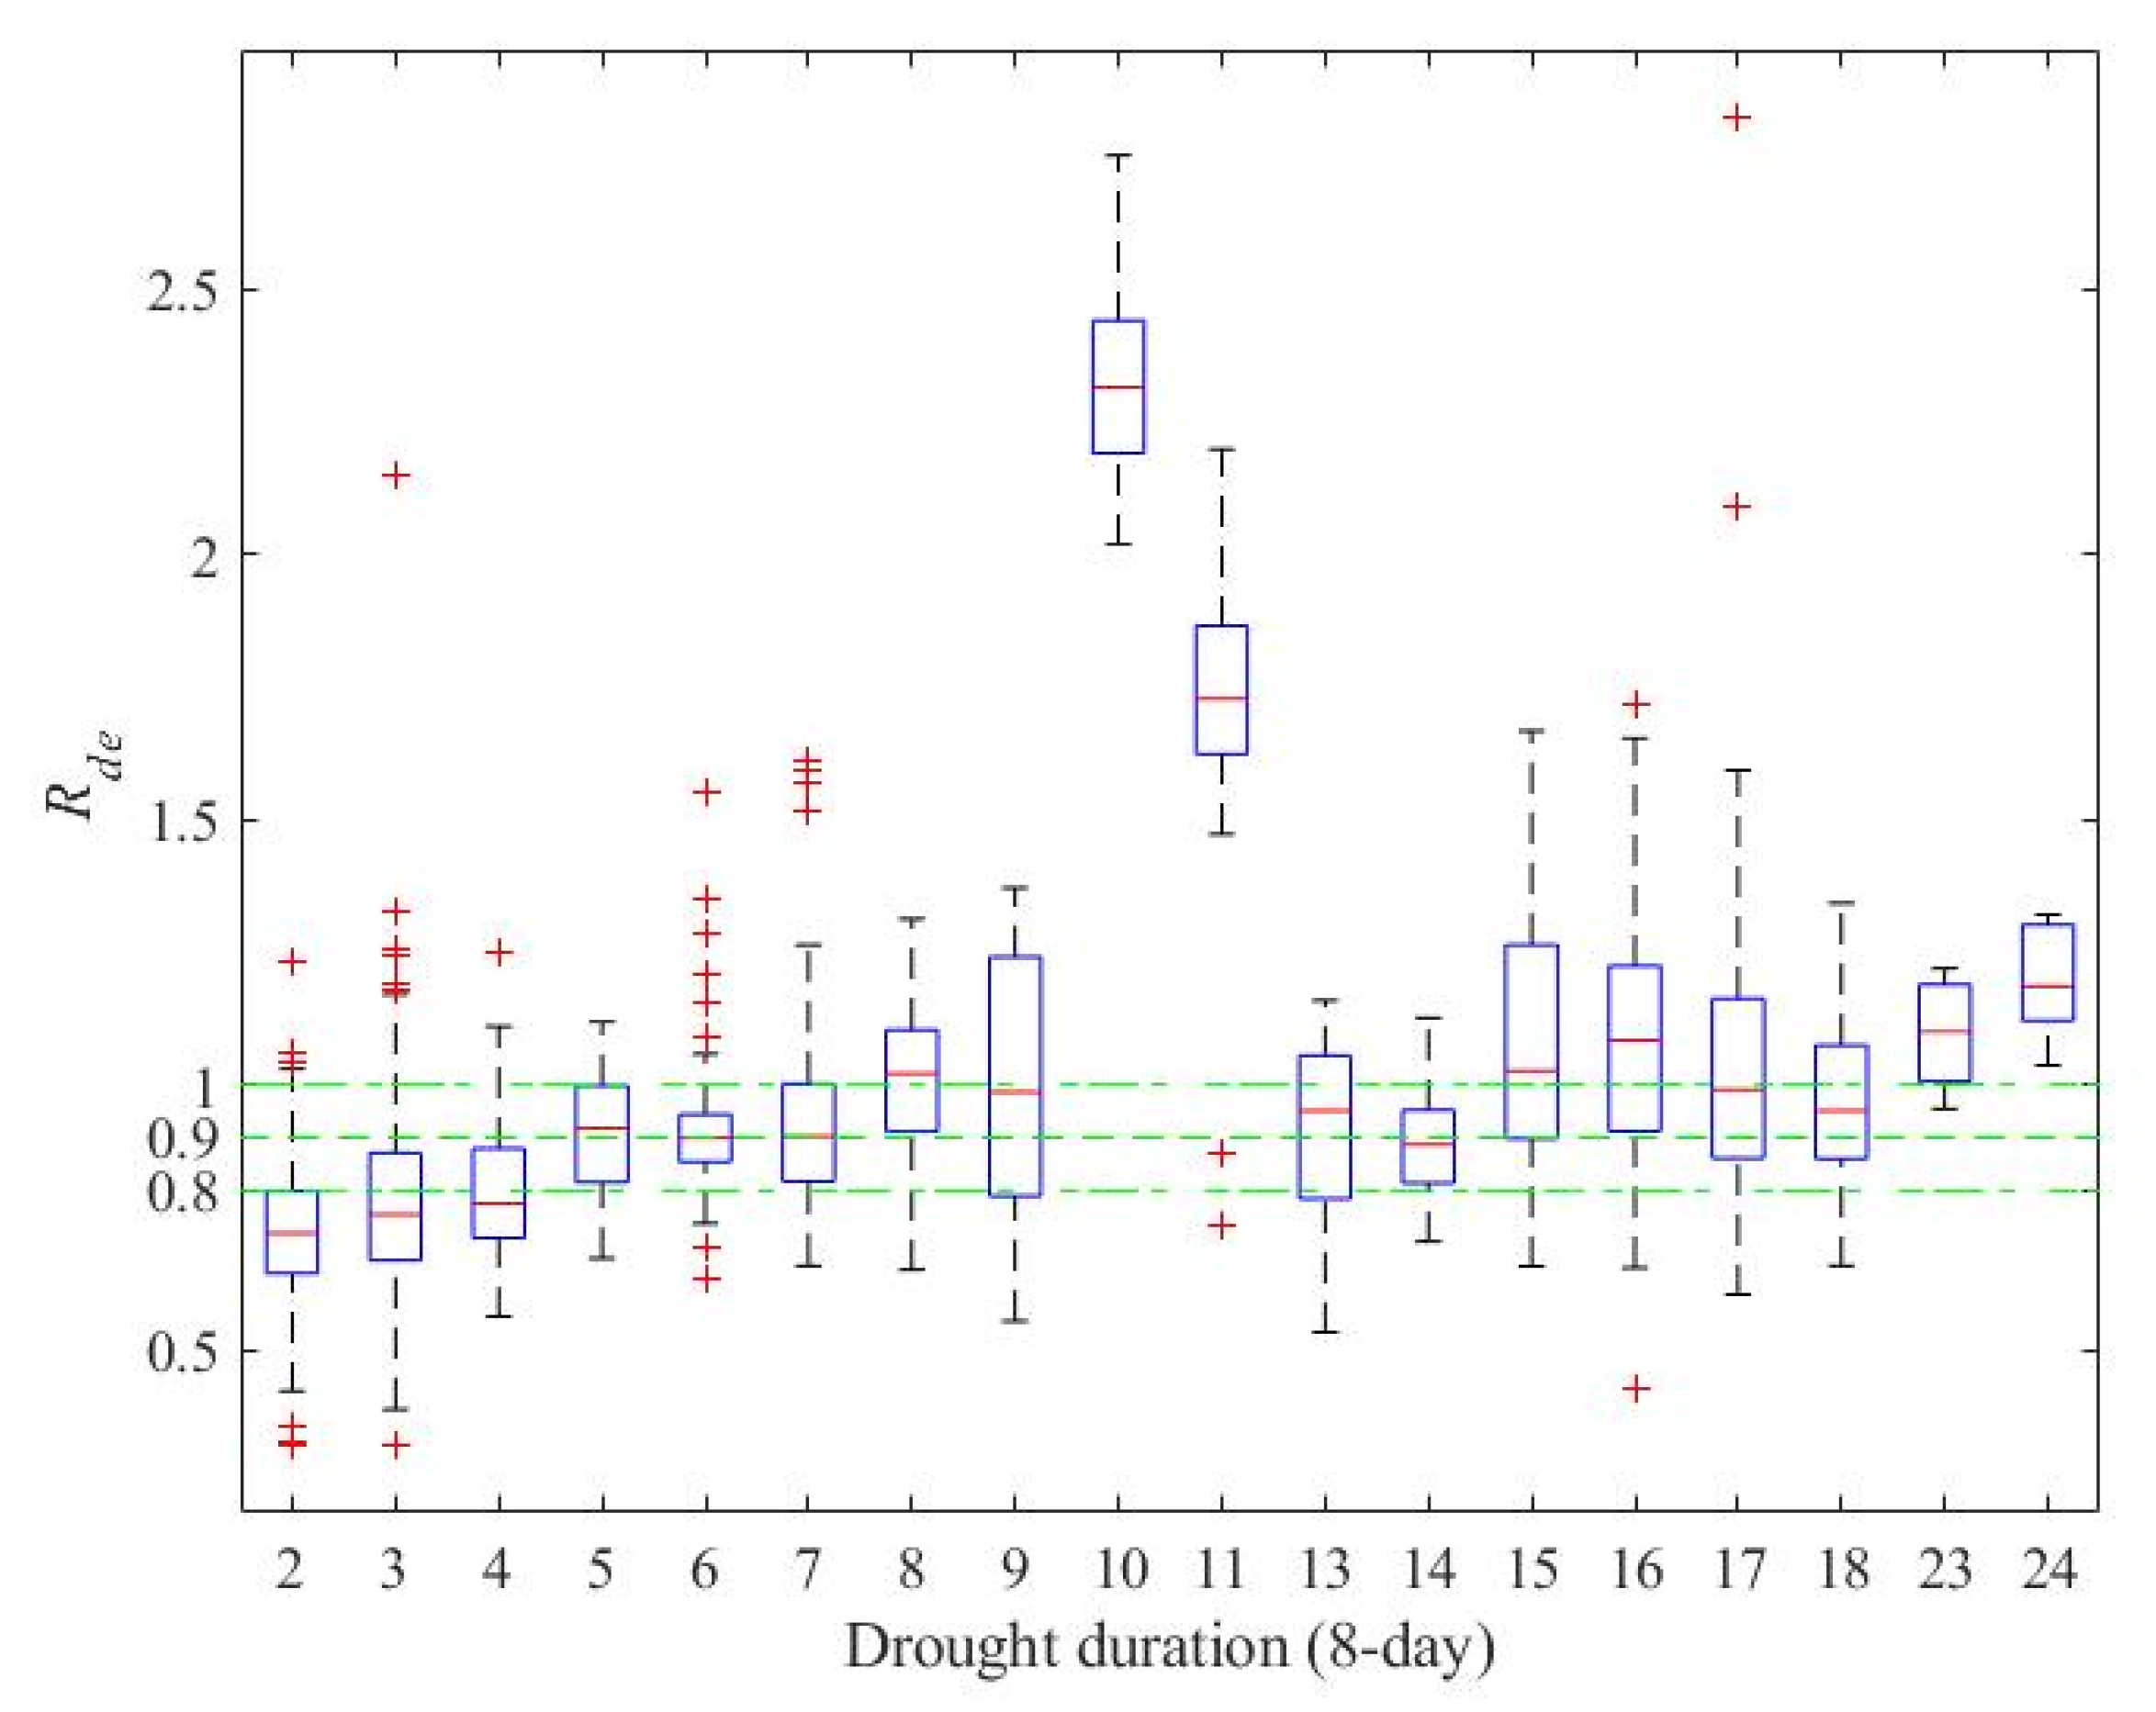
Figure 9.
Relationship between drought duration and Rde for (a) seasonal drought and (b) cross-seasonal drought (evolved from non-flash drought) in the Dongjiang River Basin.
Figure 9.
Relationship between drought duration and Rde for (a) seasonal drought and (b) cross-seasonal drought (evolved from non-flash drought) in the Dongjiang River Basin.
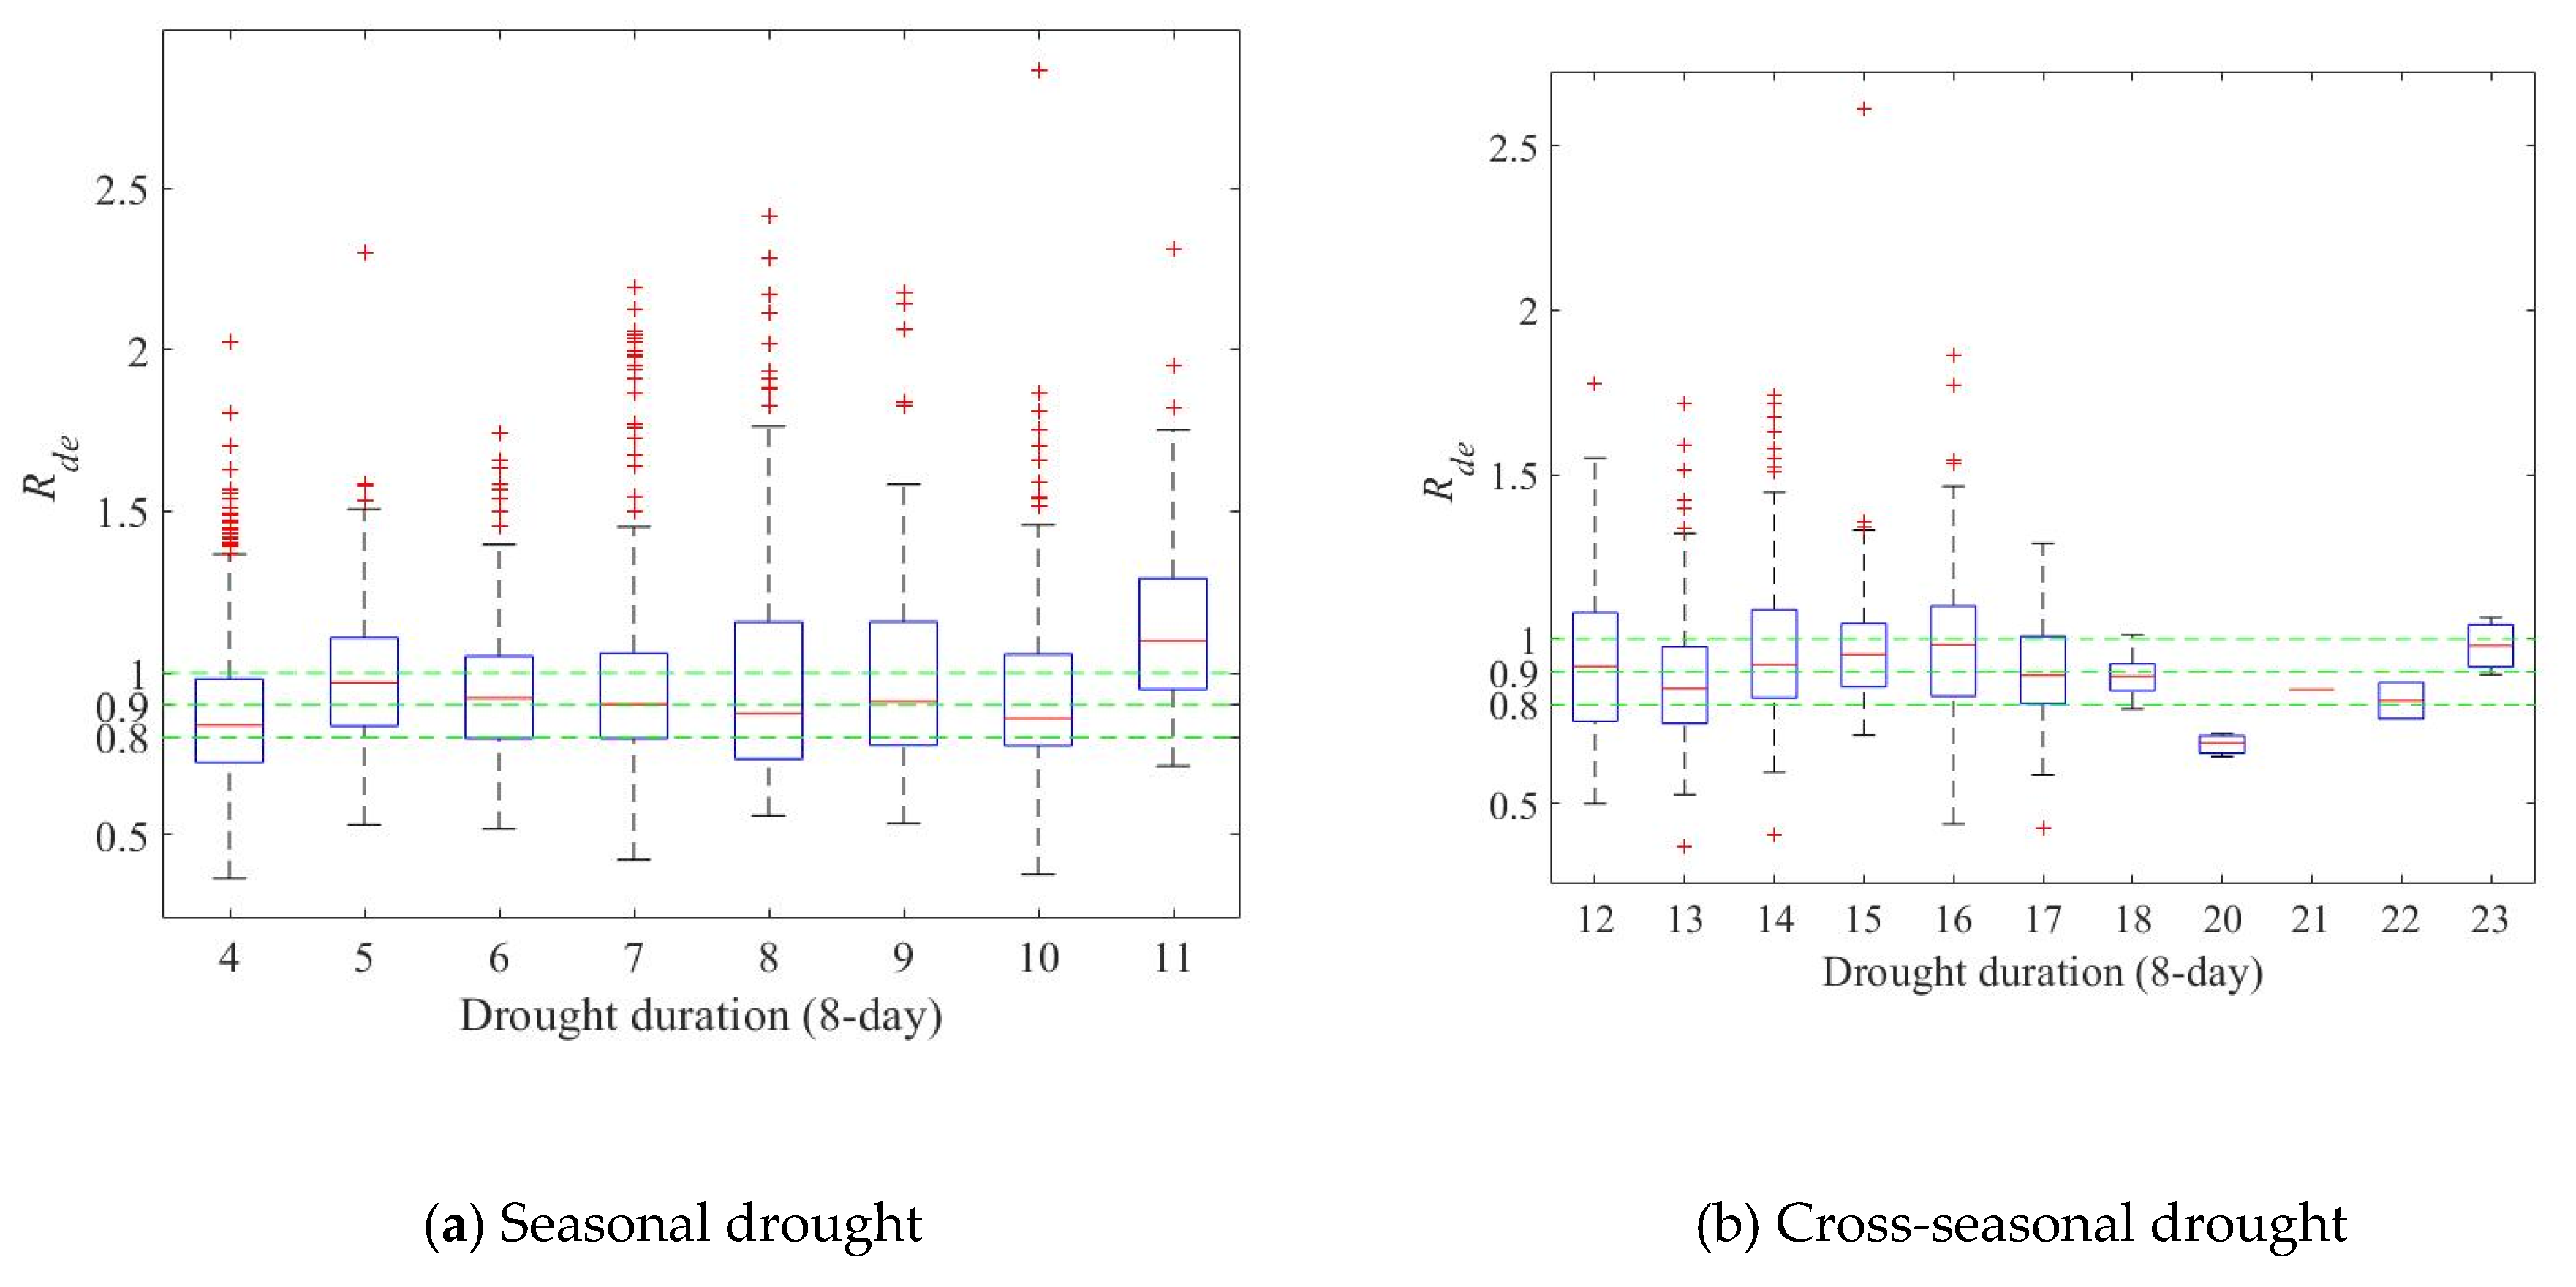
Figure 10.
Comparison of the occurrence frequency of different types of droughts identified using the 8-day scale and the pentad scale. /P denotes the proportion of a specific drought type relative to all time units, and /D represents the proportion of a specific drought type relative to the total number of drought events.
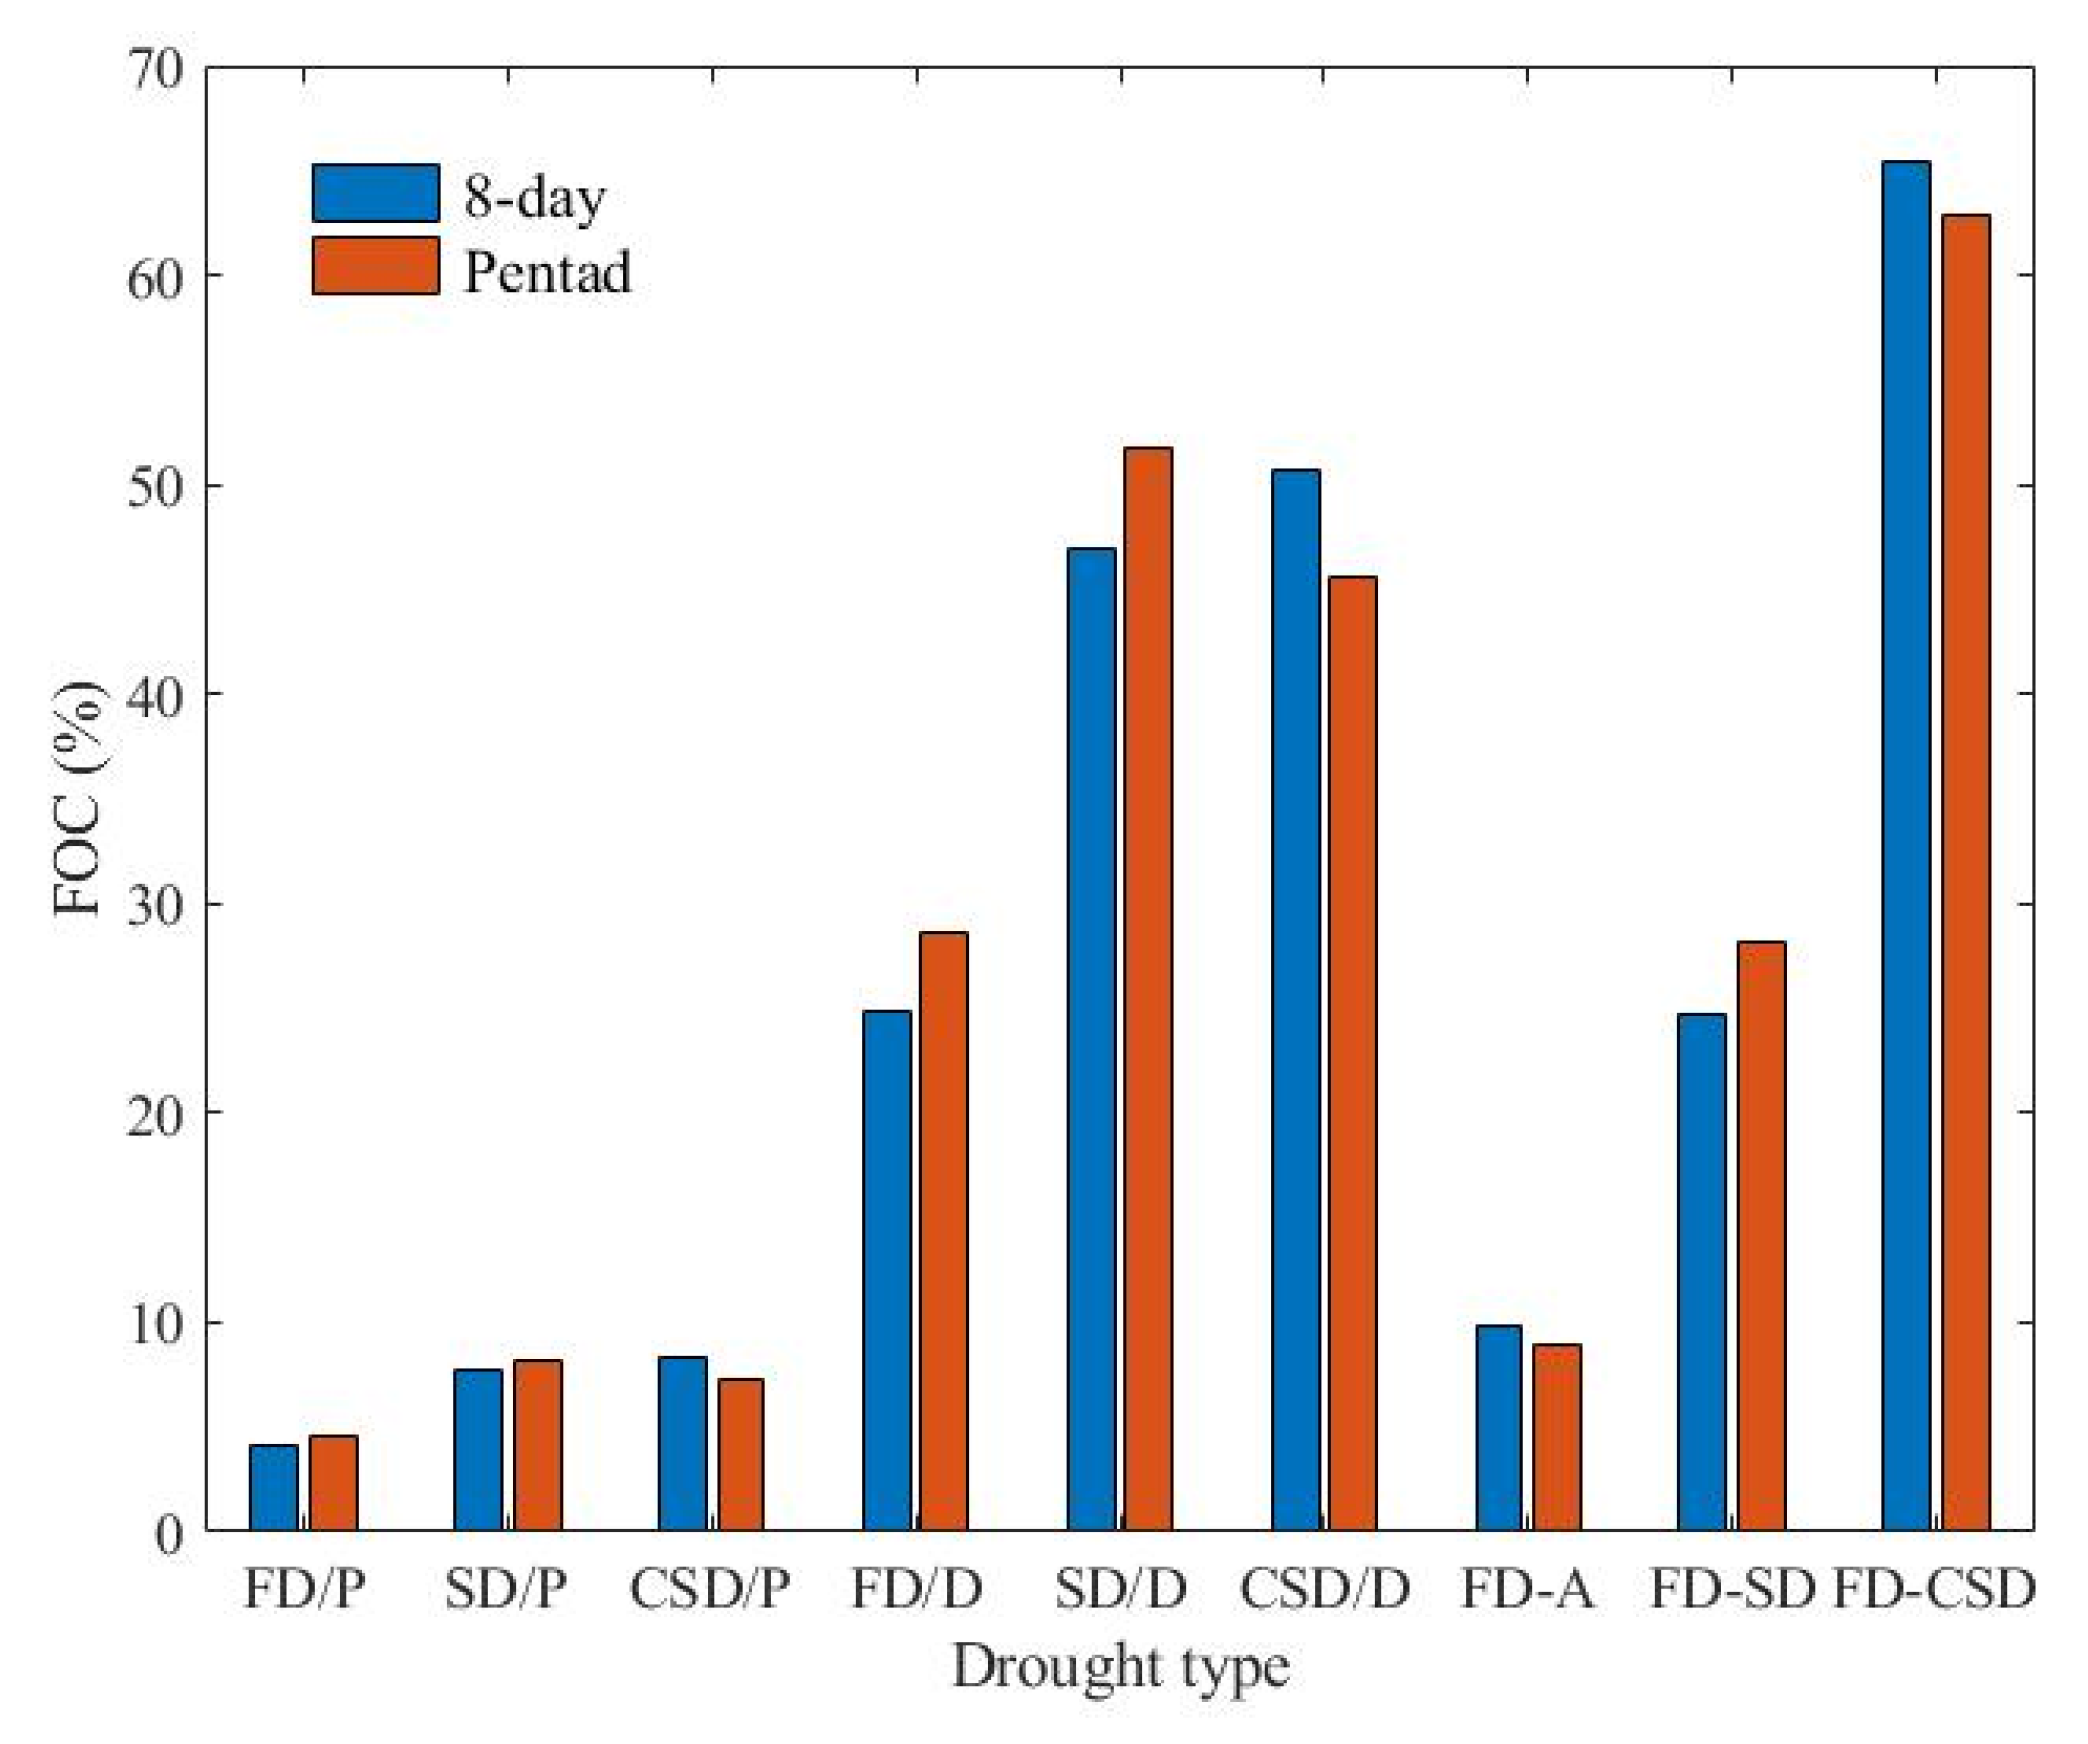

Table 1.
Seasonal characteristics of flash drought evolution in the Dongjiang River Basin.
| FOC (%) | Spring | Summer | Autumn | Winter |
|---|---|---|---|---|
| FD_alone | 1.8 | 9.4 | 12.3 | 74.0 |
| FD_SD | 2.6 | 1.2 | 5.0 | 88.0 |
| FD_CSD | 0.1 | 0.0 | 0.2 | 98.5 |
Note: FD_alone denotes flash droughts that occur independently; FD_SD denotes flash droughts that evolve into seasonal droughts; FD_CSD denotes flash droughts that evolve into cross-seasonal droughts.
Table 2.
Statistical values of EVI, WUE, and Rde during different types of drought in the Dongjiang River Basin.
Table 2.
Statistical values of EVI, WUE, and Rde during different types of drought in the Dongjiang River Basin.
| Mean value | EVI | eWUE | Rde |
|---|---|---|---|
| ND | 0.42 | 0.44 | — |
| FD | 0.40 | 0.40 | 0.89 |
| SD | 0.38 | 0.41 | 0.93 |
| CSD | 0.34 | 0.45 | 0.99 |
| FD_alone | 0.42 | 0.34 | 0.77 |
| FD_SD | 0.42 | 0.40 | 0.93 |
Note: ND indicates no drought; FD indicates flash drought; SD indicates seasonal drought; CSD indicates cross-seasonal drought.
Table 3.
Results of the Mann-Whitney U test for drought event counts extracted using the 8-day scale and the pentad scale.
Table 3.
Results of the Mann-Whitney U test for drought event counts extracted using the 8-day scale and the pentad scale.
| Drought type | P value | Effect size |r| |
|---|---|---|
| FD | 0.00 | 0.14 |
| SD | 0.00 | 0.29 |
| CSD | 0.00 | 0.45 |
| FD_SD | 0.00 | 0.20 |
| FD_CSD | 0.04 | 0.08 |
Disclaimer/Publisher’s Note: The statements, opinions and data contained in all publications are solely those of the individual author(s) and contributor(s) and not of MDPI and/or the editor(s). MDPI and/or the editor(s) disclaim responsibility for any injury to people or property resulting from any ideas, methods, instructions or products referred to in the content. |
© 2025 by the authors. Licensee MDPI, Basel, Switzerland. This article is an open access article distributed under the terms and conditions of the Creative Commons Attribution (CC BY) license (http://creativecommons.org/licenses/by/4.0/).
Copyright: This open access article is published under a Creative Commons CC BY 4.0 license, which permit the free download, distribution, and reuse, provided that the author and preprint are cited in any reuse.


