
Submitted:
16 April 2025
Posted:
18 April 2025
You are already at the latest version
Abstract
Droughts in the Amazon region are expected to increase in frequency and intensity, which would negatively affect the tropical forest, leading to a positive climate-forest feedback loop that could potentially result in the collapse of this ecosystem. In this study, extreme drought conditions were identified in the Peruvian Amazon region for the period 2000-2024, using the maximum cumulative water deficit (MCWD) index, which is related to the tropical forest water stress. The ERA5, CHIRPS and MSWEP datasets were used to estimate precipitation, while ERA5 data were used for evapotranspiration. This study focuses on the specificities of droughts and the differences across study areas. Six study areas were specified, three of them located in the Loreto department (northern Peruvian Amazon), another centered in the Moyobamba city (western Peruvian Amazon), another in Ucayali, in the central Peruvian Amazon and the other in Madre de Dios (southern Peruvian Amazon). It was found that the drought events are more frequent and intense in the central and southern region of the basin. Based on the combined effect of the regional severity of the drought and its spatial extent we identified the hydrological years of 2023-24, 2022-23, 2009-10 and 2004-05 as extreme droughts.
Keywords:
Peruvian Amazon region
; precipitation
; evapotranspiration
; drought
; maximum cumulative water deficit
1. Introduction
Over the the last two decades, the Amazon basin has experienced several periods identified in the scientific literature as extreme drought, such as those in 2005, 2010, 2015-2016 and recently in 2023 and 2024 (Papastefanou et al., 2022 [1]; Espinoza et al., 2024 [2]; Marengo et al., 2024 [3]). The increased frequency of extreme droughts, combined with heightened deforestation, could soon lead the Amazon rainforest to a critical “tipping point”, where accumulated environmental stresses could trigger irreversible changes, such as transitioning into a savanna-like ecosystem. (Nobre et al., 2016 [4]; Galaz et al., 2024 [5]). The carbon sink effect of the Amazon basin, which is essential for the mitigation of global warming, has also been in steady decline in the last decades (Brienen et al., 2015 [6], Hubau et al., 2020 [7], Papastefanou et al., 2024 [8]). According to previous studies, extreme droughts in the Amazon basin are usually associated with El Niño in the tropical Pacific and warm conditions in the tropical North Atlantic, or a combination of both anomalies (Marengo and Espinoza, 2016 [9]; Aragao et al., 2018 [10]).
Additionally, the “flavors” of El Niño result in different impacts in the Peruvian Amazon (Jiménez et al., 2019 [11]), with reduced summer (DJF) precipitation with El Niño in the central Pacific, while El Niño in the eastern Pacific is associated with substantial precipitation reduction in the northwestern Peruvian Amazon in winter (JJA).
The severe 2005 drought was considered by Zeng et al. (2008) [12] as a rare extreme climatic event, caused by a warm tropical North Atlantic Ocean that modified the Hadley circulation, reducing moisture transport into the Amazon basin, in combination with a slow soil drying process, which extended from the El Niño event of 2002, altering surface moisture balance in the region. After 5 years, an even more extreme drought event took place in 2010, which was the strongest since 1903, as a consequence of the coincidence of El Niño event and the warming of the tropical North Atlantic that produced a northward displacement of the intertropical convective zone (ITCZ) relative to its climatological position and an increase of the length of the dry season, which seriously affected the hydrology of the Amazon River in the spring (Espinoza et al., 2011 [13]; Marengo et al., 2011 [14]). The next extreme drought that extended over the Amazon basin occurred after four years, extending from 2015 to 2016, coincident with a strong El Niño event both in the Central Pacific and in the Eastern Pacific, and with extremely high temperatures in the Amazon basin (11; 15]Jiménez et al. 2018; 2019).
Papastefanou (2022) [1] studied the variation in the spatial extent, location, and season of the drought events in the entire Amazon basin for the years 2005, 2010 and 2015-2016. According to their evaluation, the area affected by severe drought varied between 0% and 39%, depending on the precipitation dataset and drought index used.
The recent generalized drought and warmth situation extending from 2022 to 2024 was studied by Espinoza et al. (2024) [2.3] and Marengo et al. (2024), who concluded that it was in close relationship with the transitional situation between La Niña during the 2022-23 and El Niño conditions in the austral winter and spring of 2023, and the general warming of the world oceans, including the north tropical Atlantic. La Niña was associated with dry conditions in southwestern Amazonia during the onset of the 2022-23 hydrological year, including the South American Altiplano (Gutierrez et al., 2024 [16]; Milla et al., 2025 [17]), while El Niño and warm conditions in the tropical North Atlantic were linked to drought in central and northern Amazonia during the austral winter and spring of 2023 (Espinoza et al., 2024 [2]). This event also occurred during a widespread anomalous warming over the worldwide ocean primarily driven by El Niño event (Jiang et al., 2024 [18]). Several authors have raised the question of the possible link between droughts in Amazonia and global warming (Doblas-Reyes et al. 2021 [19]; Parsons 2020 [20]; Agudelo et al., 2023 [21]; Clarke et al., 2024 [22]), evaluations of the intensity and the characteristics of these droughts have been developed (Jiménez et al. 2019 [11]; Jiménez-Muñoz et al. 2016 [23]; Marengo et al. 2008 [13,24], 2011; Marengo and Espinoza 2016 [9]; Espinoza et al., 2021 [25]) and its impact has been discussed (Aragǎo et al. 2007 [26]; Malhi et al. 2008 [27], Marengo et al., 2018 [28]; Jimenez et al., 2024 [29]).
Aragǎo et al. (2007) [26] proposed the application of the Maximum Cumulative Water Deficit index to the evaluation of drought conditions in the Amazon basin. They used MCWD to study the impact of droughts on Amazon forests, demonstrating its effectiveness in capturing the cumulative effects of water deficits on vegetation. This index has also been used in several other works and has proved to be a valuable tool for investigating droughts in the Amazon basin due to its ability to capture the cumulative water stress experienced by ecosystems over time, and to its relationship with tree mortality (Malhi et al. 2009 [30]; Lewis et al. 2011 [31]). MCWD has been shown to correlate strongly with ecological responses in the Amazon basin, such as reduced photosynthetic activity, increased tree mortality, and higher fire susceptibility. This makes it a more reliable indicator of drought impacts on tropical forests than other indices, such as SPEI, which is very useful from a climatological or hydrological point of view but does not always align as closely with ecological outcomes in the Amazon due to its standardization and lack of focus on cumulative deficits (Phillips et al., 2009 [32]; Brando et al., 2014 [33]).
Papastefanou et al. (2022) [1] selected several precipitation and evapotranspiration datasets to evaluate these droughts and their effects, studying the possible influence of the different manifestations of El Niño and the warming of the Atlantic surface on their development. They used precipitation data from several sources, including those derived from satellite-based radar measurements, global observations, general circulation models, and atmospheric reanalysis. To evaluate the severity of droughts and their spatial extent, they applied several indices highlighting the convenience and simplicity of using the maximum cumulative water deficit index (MCWD).
All these works have been focused on the whole Amazon Basin, including in some cases part of Peru as one of the subregions, so that the general conclusions are not necessarily valid for Peruvian Amazon, where particular climate conditions exist, such as in the transition between the forest and the Andes mountains (Espinoza et al., 2009, 2015 [13,34]; Sulca et al., 2024 [35]). Additionally, Papastefanou et al. (2022) [1] considered a standardized variant of the MCWD index, in relative terms, which does not allow the assessment of the drought stress on the forests in the different regions of Perú.
The present work is aimed at evaluating the severity and spatial extension of the most extreme droughts in Peruvian Amazon region throughout the XXI century using the MCWD index in absolute terms. In addition, we provide a regional approach, highlighting the different expressions of drought in areas characterized by different rainfall annual cycle and the impacts on water deficit and surface energy fluxes. The study period extended from 2000 to 2024, where four extreme droughts have been reported for the entire Amazon basin, but which degree of influence for the Peruvian territory has not been conclusive.
2. Materials and Methods
2.1. Data Sources
To estimate the drought related variables, we used monthly mean data from the ERA5 reanalysis (https://cds.climate.copernicus.eu/datasets/reanalysis-era5-single-levels-monthly-means?tab=download; Bell et al., 2020 [36]; Hersbach et al. 2020 [37]), which includes precipitation, air and land surface temperature, evapotranspiration and surface energy flux data. ERA5 is the fifth generation of the European Centre for Medium-range Weather Forecasts (ECMWF) atmospheric reanalysis of the global climate, and it is produced by the Copernicus Climate Change Service (C3S) at ECMWF.
For precipitation information, we decided to use several databases that combine satellite, model and in situ information, because of the scarcity of pluviometric data in the Peruvian Amazon region. The Peruvian Interpolation data of the PERUVIAN Hydrometeorological Service, SENAMHI’s Climatological and Hydrological Observations (PISCO) database (Aybar et al., 2019 [38]; Huerta et al., 2022 [39]) was initially considered, but in the end, it was not used, because previous evaluation showed that the absence of surface rainfall stations in the southern Peruvian Amazon region caused misrepresentation of the rainfall distribution. The IMERG (Global Precipitation Mission Integrated Multi-satellite Retrievals for GPM) database (Huffman et al., 2024 [40]), obtained from the compatible information from the satellite constellation radiometers and the radar on board the main GPM satellite was tested too, but preliminary comparison with other databases showed that this dataset seems to overestimate precipitation in the Peruvian Amazon basin, so it was discarded.
Consequently, for precipitation information, the Climate Hazards Group InfraRed Precipitation with Station data (CHIRPS 2.0) precipitation database was used (based on 0.05° resolution satellite imagery, and in-situ station data, aimed at trend analysis and seasonal drought monitoring https://earlywarning.usgs.gov/fews/datadownloads/Global/CHIRPS%202.0; Funk et al., 2015 [41]). Another precipitation data source that was used is the Multi-Source Weighted-Ensemble Precipitation (MSWEP), which is a global precipitation product with a 3 hourly 0.1° resolution merging gauge, satellite, and reanalysis data (Beck et al., 2019 [42]). The monthly precipitation product of ERA5 was also used., (https://cds.climate.copernicus.eu/cdsapp#!/dataset/reanalysis-era5-land-monthly-means?tab=form. To obtain water deficit, the evapotranspiration from ERA5 was combined with precipitation of the three datasets.

Table 1.
Data sources and variables.
| Source | URL | Variable | Units |
|---|---|---|---|
| ERA-5 | https://cds.climate.copernicus.eu/cdsapp#!/dataset/reanalysis-era5-land-monthly-means?tab=overview | Total Precipitation (tp) | mm |
| Evapotranspiration (Evaporation, e) | mm water equivalent | ||
| Surface shortwave radiation downwards (ssrd) | W/m2 | ||
| CHIRPS | https://coastwatch.pfeg.noaa.gov/erddap/griddap/chirps20GlobalDailyP05_Lon0360.html | Precipitation | mm |
| MSWEP | https://www.gloh2o.org/mswep/ | Precipitation | mm |
2.2. Study Area
This study focuses on the Peruvian Amazon region, specifically within the area that extends from 16oS to 1oN and 82oW to 68oW. This region is limited to the west by the Andes Mountain range (4000-5000 masl) and to the east, north and south by Peruvian borders. It is characterized by a complex spatial distribution of rainfall related to the north-south extension and the presence of the Andean mountains (Espinoza et al., 2009 [34]). In the Andean foothills of the southern Peruvian Amazon region, we find “hotspots” with maximum precipitation at altitudes of 400–700 masl, accumulating more than 4000 mm annually (Espinoza et al. 2015 [43]; Chavez and Takahashi, 2017 [44]), fed by the moisture transport from the South American low-level jet.
In association with the mature phase of the South American Monsoon system, the wet season in central and southern Peruvian Amazon occurs during December-March, and the dry season extends from June to September (Espinoza et al., 2011 [13]). Consequently, the hydrological year for the Amazon River region in Peru (e.g., in Tamshiyacu station in Loreto) is taken to be from September to August, with lowest river level in September and maximum values in April-May (Espinoza et al., 2011 [13]; Valenzuela et al., 2023 [45]).
As for the entire Amazon basin, droughts have been reported over this region in 2005, 2010 and 2015-16 (Espinoza et al., 2011 [13]; Jimenez et al., 2016 [23]), so that the high spatio-temporal variability of the precipitation regime in this region is an important characteristic of the Peruvian Amazon region.
To study the temporal evolution of the variables, six square areas of the Peruvian Amazon region, sized 2 x 2 degrees each, were chosen. The first of them (LOR1) covers the northeast of the Loreto department, where the maximum precipitation records are registered, other two regions cover the western (LOR2) and southern (LOR3) areas of Loreto, where rainfall is also high, and the fourth region convers the forest border transitional region in the eastern slopes of the Andes, centered in the Moyobamba city, in the department of San Martín (MOY). The last two regions cover the southern part of the Peruvian Amazon forest, in the departments of Ucayali (UCA) and Madre de Dios (MD). These regions have different regimes not only of precipitation, but also of evapotranspiration (Espinoza et al., 2009 [34]; Zanin et al. 2024 [46]). Table 2 and Figure 1 show the boundary coordinates and geographical location of the study areas.
2.3. Obtaining the MCWD Drought Index
The “Maximum Cumulative Water Deficit (MCWD)” index is obtained after the calculation of the water deficit (WD), which is the difference at each grid point between monthly precipitation (Pr) and evapotranspiration (Et). Subsequently, for the hydrologic year (HY), which in Peru is considered from September to August, the cumulative deficit is calculated as the sum of the deficits of all the months when monthly evapotranspiration is greater than monthly precipitation.
The monthly water deficit WD for month j (j=1, … 12) is given by:
WDj= Etj - Prj
If WDj is negative, it means that precipitation has been sufficient to meet the evapotranspiration demand and recharge soil water. If WDj is positive, it indicates a water deficit, i.e., precipitation has not covered water demand, and the soil has experienced a period of water stress.
Next, from the WDj values, the accumulated water deficit is calculated month by month. This accumulation considers the existing deficit in the soil and how it increases or decreases with each month based on precipitation and evapotranspiration. That is, for each j starting from j=1:
where H is the Heaviside step function. Thus, if the water deficit value resulted negative (i.e., there is a surplus of water in the soil), it would be reset to zero, since the moisture in the soil is sufficient to cover the deficit. Otherwise, if the WD value is positive, it continues to accumulate to record the water deficit the following month. After calculating the accumulated CWDj balance for each month of the year or study period, the MCWD is defined as the maximum value reached by CWDj during that period, which represents the greatest water deficit experienced by the soil in that period and, therefore, the point of greatest water stress for vegetation.
MCWD = max(CWD1,CWD2,...,CWD12)
The larger the MCWD value, the more intense the accumulated water deficit and, therefore, the greater the stress experienced by the ecosystem. A high MCWD value (e.g., MCWD>200 mm) indicates a significant water deficit, meaning that the soil has been under considerable water stress and vegetation may have had difficulties accessing sufficient water (Aragao et al., 2007 [26]), so that, following Malhi (2009) [30], a rainforest would tend to become a seasonal forest, while MCWD>300 mm would correspond to a savanna. MCWD values close to zero suggest that the water deficit was low, and vegetation did not experience significant stress. However, the allocation of objective thresholds associated with drought is a complex problem and depends on regional conditions (Malhi, 2009 [30]). This problem has been approached in diverse ways, and sometimes, a standardized variant of the index has been used to designate the thresholds (Papastefanou et al., 2022 [1]).
The MCWD value is determined for each hydrologic year in each area, which corresponds to the mean value of the index for the grid points within the area. In this work, the index is used in its absolute variant, since this is more relevant to the effects of drought on vegetation and its interpretation is much clearer than in the relative case, which is strongly determined by the local rainfall climatology, and can lead to the paradox of diagnosing severe drought where rainfall totals are normal for sustaining the forest and moderate or weak drought in regions with critical rainfall totals. According to Malhi et al. (2009) [30], drought assessment is determined by both the MCWD and the accumulated precipitation. Although the MCWD index provides a measure of the moisture that the soil has lost because of the rainfall deficit, cumulatively throughout the months of the hydrological cycle, which occurs most frequently in the dry period, the water reserve of surface and underground reservoirs also depends on the accumulated rainfall in the rainy season, which is not considered in the index. It is considered that evergreen forests tend to predominate if the dry season is weak, i.e., MCWD<200 mm. However, if the accumulated precipitation AP is greater than 1500 mm, forests still predominate, even for higher values of MCWD. If AP<1500 mm, savannahs predominate for MCWD<400 mm, and there is a wide transition zone for 200 mm < MCWD < 400 mm. From this it is inferred that an approximate drought criterion for a tropical forest is MCWD>200 mm. In this work, 30mm, 110mm and 140mm were used as absolute thresholds close to those derived by Papastefanou, 2022 [1], from their distribution functions have been used, corresponding to their relative thresholds and the 200 mm threshold was added as an additional one to highlight the most extreme drought regions at a regional level. In the case of the model output, a very extreme threshold was added to account for zones of extremely high values of MCWD appearing in the model output, which appears to overestimate drought conditions in some cases.
Unlike Papastefanou (2022) [1], who apply the assumption of a fixed value of Et=100 mm, based on the argument that this is a correct estimation for tropical forest conditions, in this work we use the evaporation variable “e” from ERA5 monthly reanalysis to estimate the evapotranspiration.
3. Results
3.1. Annual Precipitation and Evaporation in the Study Areas
The first approximation to the problem of droughts in the Peruvian Amazon is the analysis of the interannual precipitation variability in the study period. Figure 2 shows the records of annual precipitation and evaporation for the six study areas from each dataset. A general feature is the relatively low interannual variability of the evaporation record, whose variations are hardly noticed in the figure, except for the decreasing trend in the last two years of the record in all of the study areas and has been identified as a characteristic for the entire Amazon basin in 2024 ([3}Marengo et al., 2024). The interannual variability is mainly dominated by precipitation, with differences across datasets, particularly the low precipitation values estimated by CHIRPS for the LOR3 and MOY areas in the first half of the period (2000-2009). The annual precipitation maxima correspond to hydrologic years 2007-2008, 2011-2012 and 2014-2015 for most areas and the minima was found in 2005-2006, 2009-2010, 2015-2016, and 2023-24. In general, over almost all the period, precipitation in the areas of the Loreto department was greater than in the rest of the areas, particularly in LOR1 and LOR2, that will be shown to be consistent with less drought conditions. Annual precipitation is almost always well above annual evaporation, but it must be emphasized that this is not held for monthly precipitation, which undergoes periods where evaporation surpasses precipitation, mainly in the dry seasons, which can be associated with drought and cause the cumulative water deficit (see Figure 6 below
The average annual cycle of the water deficit in the different study areas and estimated by different precipitation datasets is shown in Figure 3.
Most of the water deficit is obtained for the dry season, including the June-August period, which is the end of the hydrological year, and particularly in August, which is its last month. This is especially evident in the observational datasets MSWEP and CHIRPS (Figure 3 B and C), while the semi observational ERA5 shows more dispersion, but with a clear mode in August (Figure 3 A). This behavior differs from the Brazilian Amazon region, for which the hydrological year ends in September (Papastefanou, et al., 2022 [1]).
3.2. Determination of Drought Periods
To determine the drought periods characteristic of the Peruvian Amazon region and their extension and intensity in different parts of the region, we evaluated the areal average MCWD from 2000 to 2024 for each of the study areas (Figure 4).
The identification of drought periods was carried out based on the MCWD index, calculated from the different data sources, wherein important differences were found across the precipitation datasets. Figure 4 shows the record of the index value for every hydrological year of the study period, calculated after averaging the values of MCWD on the grid points of each study area. The lines in different colors represent the different study areas. For instance, following ERA5 (Figure 4A), the higher values of the record for most of the period were obtained by MD, followed by UCA, and the greatest peaks were obtained for MD in 2009-10 and for LOR3 in 2023-24. LOR 1, LOR2 and MOY show relatively low values for this database. For4 MSWEP (Figure 4B), UCA shows clearly the highest MCWD record, followed by MD, but for the second half of the period, MD is not much higher that LOR3 and MOY. In this case, the higher peaks are for 2023-24 and for 2004-05. The CHIRPS (Fig4C) record shows again that UCA gas the highest record, followed by LOR3 and MD, and peaking in 2022-23, in the case of UCA and 2006-07 in the case of LOR3.
The threshold values were considered as close to those obtained by Papastefanou et al., 2022 [1], from the distribution functions of their relative MCWD values to make possible the intercomparison of results and considering the evaluations of Malhi et al. (2009) [30]. Based on this, the value of 30 mm is considered as threshold 1, the lower threshold, the middle (threshold 2) is 110 mm, and the higher threshold (threshold 3) is 140 mm, and an extreme threshold of 200 mm (threshold 4) has been considered to show up the most severe drought regions. The most relevant aspect of the MCWD index series is its high temporal variability, with peaks in the dry years for the given region, as well as across regions, with the largest MCWD values in the southern areas (UCA and MD), followed by MOY and LOR3 further north, while the water deficit is not so stressful in the LOR1 and LOR2 regions, with climatologically higher precipitation.
For each of the datasets, the average MCWD, including all the study areas, is shown in Figure 5. The HYs with greater average MSWD are not the same for every dataset. Considering the four higher MCWD values for each dataset, according to ERA5 (Figure 5A), the higher average MCWD corresponds to 2023-24, 2022-23, 2015-2016 and 2009-2010, while for MSWEP (Figure 5B) they correspond to 2023-24, 2004-05, 2009-10 and 2006-07. On the other hand, for CHIRPS, the greater MCWD are those of 2022-23, 2006-07, 2004-05 and 2023-24 (Figure 5C). As a result, the only common HY is 2023-24.
To reach a general criterion, MCWD values from the three observational datasets were averaged, obtaining the distribution shown in Figure 5D. The rankings of the MCWD average values in Figure 5 are shown in Table 3, where column 1 shows the HYs, sorted from higher to lower average MCWD value, column 5 shows the corresponding average HCWD for each HY, and columns 2-4 show the values for each of the datasets. To classify the severity of the droughts, we consider the statistics of this average MCWD, which has a mean value of 53.8 mm and a standard deviation of 22.6 mm. From this, we identify the HYs with greater average MCWD values (Figure 5D), 2023-24, 2022-23, 2009-10 and 2004-05 as extreme droughts (red characters in Table 3), since their MCWD is greater than the mean plus one standard deviation. The years 2006-07 and 2015-16, with MCWD below this, but above the 70% percentile were, are considered as moderate droughts for the Peruvian Amazon region (green characters in Table 3).
The comparison between the average precipitation and evaporation annual cycles for the years with extreme drought and the climatology of the whole period, using different datasets, can be seen in Figure 6 where the rows show the cycles for the three datasets and the model for the LOR1 (Column 1), UCA (Column 2) and MD (Column 3) study areas. From all the panels, the variability of evaporation is much less than the one of precipitation. It is also apparent that, for the dry seasons in UCA and MD, the evaporation for the extreme drought cycles is higher than precipitation. This doesn’t hold for LOR1, because drought impact is not very high in this area, as follows from the low MCWD values. This shows that the characterization of extreme drought HYs, obtained from Table 3 is qualitatively correct, as the characterization made for individual HYs emerges on a climatological scale. Another consequent feature of Figure 6 is that precipitation records for extreme droughts are lower than climatology in most of the dry season, particularly in UCA and MD.
3.3. Spatial Distribution of Drought Regions
The spatial distributions of the estimated MCWD in the Peruvian Amazon region are shown in Figure 7, for the years classified as extreme drought, as obtained from ERA5 precipitation and evaporation data, and by the CHIRPS and MSWEP precipitation data, combined with ERA5 evaporation. The upper row of panels shows the spatial distribution of MCWD according to ERA5. In this case, the droughts of 2004-05 and 2009-10 emerge as the ones with the most extended area inside the two higher thresholds (3 and 4, orange and red colors), but if the 2nd threshold is considered, the 2023-24 turns to be the most extended. It is important to note that, following this dataset, only in 2022-23 and 2023-24 can a drought signal in the northern part of the Loreto region be found. In the four HYs, the main drought areas were in the Madre de Dios and Ucayali regions, while in the forest eyebrow region, the lower threshold was accomplished. The CHIRPS dataset was characterized by a more extended threshold 4, including all the forest eyebrow region, while Madre de Dios and Ucayali were also affected by drought, which reached the southern extreme of Loreto. Only in 2022-23, most of Loreto was affected by drought, within its lower threshold. The distribution for MSWEP was very similar to CHIRPS for the two first HYs but showed relatively weak drought for 2022-23 and the strongest signal in 2023-24, covering all the Peruvian eastern border area and extending threshold 2 till most of Loreto.
The climatological distribution of MCWD, estimated by the three datasets is shown in Fugure 8. considering the study period, from HY 2000-01 to 2023-24. It evidences that that the dry conditions in the southeast of Peru are a climatological feature that gets worse in conditions of extreme drought This conditions can also be found in the central-south Andes eyebrow region, in the Apurimac department, as can be seen from the ERA5 dataset. However, the satellite-based datasets CHIRPS and MSWEP show high MCWD values all along the right slope of the Andes, which could be an artifact from an underestimation of precipitation which is characteristic of satellite based datasets (Dinku et al., 2018 [47])
The evaluation of the area affected by each level of drought, corresponding to MCWD ranges delimited by the thresholds, inside the Peruvian Amazon region obtained from each of the datasets for the HYs with extreme drought was calculated from the number of grid points within each range. The results are shown in Figure 9. There is no consensus across datasets about the most extended of the extreme droughts, but it can be asserted that the lower threshold (1)(MCWD ≥ 30mm) attained around 80% of the area of the region for all datasets and the higher threshold (4) of (MCWD≥ 200 mm), reached around 10-20 %. According to ERA5 and CHIRPS, the most extended maximum threshold corresponded to 2023-24, but according to MSWEP. It corresponded to 2004-05 and 2009-10.
3.4. Annual Cycles of Energy Fluxes According to ERA5 in Extreme Drought Conditions in the Peruvian Amazon
The surface radiation fluxes are tightly related to the precipitation regime and with the occurrence of drought in the tropical climate. To investigate the consistency of the annual cycle of three of the main energy flux components with the occurrence of drought, their average annual cycle was plotted for extreme drought hydrologic years in contrast with the climatological cycle. Figure 10 shows the plots of the average annual cycle of the sensible and latent heat flux and the net solar radiation for LOR1, UCA and MD, as obtained from the ERA5 data. The net solar radiation for the extreme drought years is greater than climatology, but the general form of the cycle is similar, showing a minimum for the dry season. The climatological cycles of sensible and latent heat show similar behavior for the three regions, and the bulk Bowen ratio (Bowen ratio for monthly totals) shows values within the rank characteristic of tropical forest, though they are lower for LOR1, and higher for MD, which is coincident with the higher precipitation averages in LOR1. The extreme drought plots show relevant absolute maxima in August for UCA and MD, clearly different from climatology, which are present in individual HYs records. Consequently, the bulk Bowen ratio plots for extreme droughts are clearly different, showing extreme values of less than 0.3 for LOR1, and of almost 0.5 for UCA and MD, all of them more than 0.1 greater than climatology, which are consistent with the measurements of Malhi et al., 2002 [48] for the dry season in Brazil.
4. Discussion
The droughts of 2004-05 and 2009-10, classified in this paper as extreme, had been previously considered as two of the most severe of the century, as well as the 2022-23 and 2023-24 droughts. The 2015-2016 drought, that has been considered as the longest in this century for the entire Amazon basin, (Papastefanou et al., 2022 [1], Marengo et al., 2008 [9,24], 2016; Espinoza et al., 2011 [13]; Lewis et al., 2011 [31]), is classified here as moderate for the Peruvian Amazon region, with a lesser impact. Another drought period, also classified as moderate in Table 3, was found in 2006-2007, with high values of MCWD in the two observational datasets. This period had not been classified as drought before, probably by its local character and because it has not been cited with an important effect on river hydrology (Espinoza et al., 2011 [13]).
Papastefanou et al., 2022 [1] found the Peruvian territory covered by moderate drought and some regions, mainly in the northern Loreto region, with local severe and extreme drought, but they only evaluated the distribution of the relative MCWD index, and only for the pre-determined years considered as extreme droughts for all the basin. In this paper, we have evaluated the absolute MCWD indices, which allowed to clarify the more severe impact of the drought on the southern areas of the region, and the importance of this situation for the forest eyebrow region.
The comparison between the spatial distribution of MCWD for these droughts for the different rainfall datasets is shown in Figure 7. In the estimation of MSWEP, the 2004-05 and 2009-10 droughts show the greatest high threshold area in the forest eyebrow region, but in 2023-24, most of Loreto was covered by drought conditions, followed by 2022-23.
Even if the general pattern is similar, significant differences arise in the spatial distribution of MCWD across the datasets. The ERA5 estimation shows that higher MCWD values are mainly concentrated in UCA and MD, except in 2022-23, when these areas extend to all the region of Loreto and MOY. CHIRPS and MSWEP show high MCWD areas also in the forest eyebrow region bordering the Andes Cordillera and show unusual drought conditions in Loreto in 2022-23. This result is consistent with extreme dry and warm conditions observed in northern Amazonia during the austral winter and spring of 2023 (Espinoza et al., 2024 [2]; Marengo et al., 2025 [49]).
The annual cycle of radiation near the Earth’s surface depends on cloud cover and is therefore related to precipitation and drought. As a result of the interaction of solar radiation with the atmosphere, the surface is heated by a net positive radiation balance during the day and cooled by a negative radiation balance at night and the surface temperature, which is the result of the radiative balance, oscillating almost between a minimum at dawn and a maximum in the afternoon. Under rainforest conditions, the daily net radiation balance is positive, and the average daily temperature is determined by the balance of daily mean surface energy, which involves not only the short and long-wave radiation components but also heat transfers to the atmosphere. On the other hand, the magnitude of the diurnal temperature range is related to factors such as the nature of the underlying surface and vegetation and water phase changes, which nature depends on climatological conditions. The rate of increase in soil temperature during the day depends on the latent and sensible heat fluxes. On a humid surface, because of frequent and abundant rains, the latent heat flux related to evaporation prevails and the warming is lower, while on a dry surface, sensible heat prevails, and the warming is greater (Brimelow et al., 2011 [50]). These diurnal variations are related to the cloud cover and precipitation characteristics of the different seasons along the year, which differ for every region and are closely related with the climatologic conditions of dry or wet periods. This suggests that the annual cycle of the main components of the surface radiative balance depend on the possible drought condition, so in the present work the possible changes of the cycle related to this phenomenon are investigated.
The monthly evolution of sensible and latent heat fluxes and solar radiation were analyzed during years of extreme and moderate drought, comparing them with climatological cycles in LOR1, UCA and MD. The climatological cycles of sensible and latent heat are similar across the regions, although LOR1 has lower values and they were higher for MD, coinciding with their precipitation levels. In extreme droughts, absolute maxima are observed in August and notable differences in the bulk Bowen ratio.
To understand the particularities of each drought period, Figure 11 shows the distribution by month of the water deficit in every HY classified as extreme or moderate drought, as estimated by CHIRPS-ERA5. The panels in the right column contain the clustered bar distributions for the extreme and moderate drought years and the left panel contains the distributions for the corresponding preceding year. In all cases, the water deficit was obtained mainly in the dry season, in the months of May-August, and the higher WD values were concentrated in August and July. However, in every case, there is a contribution of WD from the first month of the HY, that has a degree of continuity with the preceding year. In the period 2004-2007, a continuity of WD conditions can be noticed from the dry season of 2004, which contributed to the extreme drought in 2004-2005, corresponding with Central Pacific El Niño conditions and relatively dry conditions in the beginning and the end of the 2005-2006 HY, leading to the moderate drought of 2006-2007, also favored by Central Pacific El Niño conditions at the beginning of the HY, from September to February. However, most of the WD occurred in the dry season, coincident with Central Pacific La Niña, but moderately high Tropical North Atlantic temperature (https://www.worldclimateservice.com/2024/09/11/tropical-north-atlantic-index/). In the case of 2004-2005, El Niño conditions were also present at the beginning of the HY, switching to La Niña in the dry season, but the Tropical North Atlantic temperature in this period was very high, which favored an extreme drought. In the cases of 2009-2010 and 2015-2016, it is also observed that the preceding year was affected by significant WD in the dry season. The period of 2022-2024 has been the most severe in the century, with continuous dry conditions since July 2022, when a very dry period extended to September, ending as the very dry HY of 2022-2023 with the higher WD in the dry season of 2023. This occurred after a 2021-2022 HY totally covered by Central and Eastern Pacific La Niña, extending until February 2023, when a swift switch to El Niño conditions occurred, prevailing until the beginning of 2024, together with very high air temperatures, as discussed by Espinoza et al. (2024) [2]; Marengo et al. (2024) [3], in relation with the drought conditions and heatwaves (Marengo et al., 2025 [48]) in the entire Amazon basin. The HY of 2023-2024 began as moderately dry in September, but the WD was again very high in the dry season, from May to August.
5. Summary and Conclusions
Precipitation, evaporation, and energy fluxes records from different data sources have been analyzed for the period 2000-2024 to investigate the intensity and extension of major droughts in the Peruvian Amazon. The sources of data for the identification of the presence of drought conditions were ERA5 reanalysis for evapotranspiration, precipitation and surface fluxes and precipitation datasets CHIRPS and MSWEP. To evaluate drought conditions, the Maximum Cumulative Water Deficit (MCWD) index was used, based on the difference between precipitation and evaporation records.
Differences were found in the extreme drought hydrologic years identified with the three datasets, so that the statistical distribution of the average values of MCWD across the datasets was considered to rconclude that that the hydrological years of 2004-05, 2009-10, 2022-23 and 2023-24, were classified as extreme droughts, while the hydrologic years of 2006-2007 and 2015-2016 were classified as moderate droughts. Regarding the area covered by different drought thresholds, it also depends on the applied dataset. Using the estimations of the ERA5 and CHIRPS, the lower threshold (MCWD ≥ 30mm) attained around 80% of the area of the region and the higher threshold of (MCWD≥ 200 mm), reached around 20 %. The hydrologic year with the most extended maximum threshold, using ERA5 and CHIRPS was 2023-24, but according to MSWEP, it corresponded to 2004-05 and 2009-10.
The moderate drought of 2006-07 had not been identified before, and the second, of 2015-16, had been generally considered as extreme drought for the entire Amazon basin. However, this 2015-16 drought was studied by Jimenez-Muñoz et al., (2016) [23] who found that high precipitation rates were recorded in part of the Peruvian Amazon, which gave a dry-wet bipolar characteristic of this hydrologic year for Peru, consistently with our classification as moderate drought for the Peruvian Amazon region.
Six study areas inside the Peruvian Amazon were defined, including boxes of 2 x 2 degrees in northeastern Loreto (LOR1), northwestern Loreto (LOR2), southeastern Loreto (LOR3), the Moyobamba (MOY) area, including areas of the Peruvian Amazon regions of San Martín, Amazonas and the easternmost part of Loreto and two other boxes in Ucayali (UCA), at the central part of Peruvian Amazon region, and Madre de Dios, (MD), at the southern part of the region. Time series of precipitation, evaporation and MCWD were constructed for each. In general, all the databases showed similar drought patterns, with most of the water deficit concentrated between June and August, focusing on the higher values of MCWD in the Ucayali and Madre de Dios regions, but they differed in the degree of extension of severe drought conditions to the forest eyebrow region east of the Andes. A contribution of this paper is the evaluation of the predominant weight of the drought conditions in the southern areas of Perú, and the forest regions in the Andes-Amazon transition, relative to the northern part of the Peruvian Amazon, which has been much less affected, except for the most recent drought period.
It is important to underline the weight of the uncertainty of the precipitation dataset in the Amazon drought diagnose, considering the scarcity of measurements This problem has been approached here with the use of three different datasets, but will be revisited in the future, together with the influence of of the uncertainty caused by the evapotranspiration data sources. Different drought indices will also be applied in future work to the diagnose of drought conditions in the Peruvian Amazon region to compare with the present results.
Author Contributions
Conceptualization, DMC, KT, and JCE; methodology, DMC, MOA.; software, DMC, MOA and AVL.; validation, DMC and MOA.; formal analysis, DMC, KT, JCE and MOA; investigation, DMC, KT, JCE and MOA.; resources, YS, KT.; data curation, DMC, AVL and MOA; writing—original draft preparation, DMC.; writing—DMC, KT and JCE review and editing, DMC, KT, JCE and YS.; visualization, DMC, AV and, MOA.; supervision, FYS and KT.; project administration, YS and KT.; funding acquisition, YS and KT. All authors have read and agreed to the published version of the manuscript.
Funding
This research was funded by the Peruvian PPR 068 “Reducción de vulnerabilidad y atención de emergencias por desastres” program.
Data Availability Statement
The data presented in this study are available in the ECMWF Copernicus web site at https://cds.climate.copernicus.eu/cdsapp#!/dataset/reanalysis-era5-land-monthly-means?tab=overview [37], the MSWEP web site at https://www.gloh2o.org/mswep/ [42] and the CHIRPS web site [41].
Acknowledgments
We thank Sly Wonchuig, Abel Centella Artola, and Waldo Lavado for their support in data processing and/or valuable suggestions. This work was done using computational resources from Geo Cluster, provided by the Instituto Geofísico del Perú.
Conflicts of Interest
The authors declare no conflicts of interest.
Abbreviations
The following abbreviations are used in this manuscript:
| WD | Water Deficit |
| CWD | Cumulative Water Deficit |
| MCWD | Maximum Cumulative Water Deficit |
| H | Heaviside step function |
| Pr | Precipitation |
| Et | Evapotranspiration |
| HY | Hydrologic Year |
| ERA5 | Fifth generation ReAnalysis of the ECMWF |
| ECMWF | European Centre for Medium-range Weather Forecasts |
| CHIRPS | Climate Hazards group Infrared Precipitation with Station data |
| MSWEP | Multi Sourde Weighted Ensemble Precipitation |
| ITCZ | Inter-Tropical Convergence Zone |
| SPEI | Standardizes Precipitation and Evapotranspiration Index |
| SENAMHI | Servicio Nacional de Meteorología e Hidrología del Perú |
| PISCO | Peruvian Interpolated data of the SENAMHI’s Climatological and hydrological Observations |
| GPM | Global Precipitation Mission |
| IMERG | Integrated Multi-satellitE Retreivals of the GPM |
| LOR1 | Study area in the northeast of the Loreto department |
| LOR2 | Study area in the northwest of the Loreto department |
| LOR3 | Study area in the south of the Loreto department |
| MOY | Study area in the forest eyebrow region centered in the Moyobamba city |
| UCA | Study area in the Ucayali department, in the central-southern part of the Peruvian Amazon region |
| MD | Study area in the Madre de Dios department, in the southern part of the Peruvian Amazon region |
| ED | Extreme Drought |
| CLIM | Climatology |
References
- Papastefanou, P.; Zang, C.S.; Angelov, Z.; de Castro, A.A.; Jimenez, J.C.; De Rezende, L.F.C.; Ruscica, R.C.; Sakschewski, B.; Sörensson, A.A.; Thonicke, K.; Vera, C.; Viovy, N.; Von Randow, C.; Rammig, A. Recent extreme drought events in the Amazon rainforest: assessment of different precipitation and evapotranspiration datasets and drought indicators. Biogeosciences 2022, 19, 3843–3861. [Google Scholar] [CrossRef]
- Espinoza, JC.; Jimenez, J.C.; Marengo, J.A.; et al. The new record of drought and warmth in the Amazon in 2023 related to regional and global climatic features. Sci Rep 2024, 14, 8107. [Google Scholar] [CrossRef]
- Marengo, J.; Cunha, A.; Espinoza, J.; Fu, R. ; Schöngart, J.; Jimenez, J. ; Costa, M. ; Ribeiro; J. ; Wongchuig, S.; Zhao, S. The Drought of Amazonia in 2023-2024. American Journal of Climate Change 2024, 13, 567–597. [CrossRef]
- Nobre, C.A.; Sampaio, G.; Borma, L.S.; Cardoso, M. Land-use and climate change risks in the Amazon and the need of a novel sustainable development paradigm. PNAS. 2016. [Google Scholar] [CrossRef]
- Galaz, V.; Meacham, M. (eds.. Redirecting Flows.- Navigating the Future of the Amazon., Report. 2024. Stockholm Resilience Centre, Stockholm University. [CrossRef]
- Brienen, R.; Phillips, O.; Feldpausch, T.; et al. Long-term decline of the Amazon carbon sink. Nature 2015, 519, 344–348. [Google Scholar] [CrossRef]
- Hubau, W.; Lewis, S.L.; Phillips, O.L.; et al. Asynchronous carbon sink saturation in African and Amazonian tropical forests. Nature 2020, 579, 80–87. [Google Scholar] [CrossRef] [PubMed]
- Papastefanou, P.; Pugh, T.A.M.; Buras, A.; Fleischer, K.; Grams, T.E.E.; Hickler, T.; Lapola, D.M.; Liu, D.; Zang, C.; Rammig, A. Simulated sensitivity of the Amazon rainforest to extreme drought. Environmental Research Letters. 2024. [CrossRef]
- Marengo, J.A.; Espinoza, J.C. Extreme Seasonal Droughts and Floods in Amazonia: Causes, Trends and Impacts. International Journal of Climatology 2016, 36, 1033–1055. [Google Scholar] [CrossRef]
- Aragão, L.E.O.C.; Anderson, L.O.; Fonseca, M.G.; Rosan, T.M.; Vedovato, L.B.; Wagner, F.H.; et al. 21st Century Drought-Related Fires Counteract the De-cline of Amazon Deforestation Carbon Emissions. Nature Communications. 2018, 9, 536. [Google Scholar] [CrossRef]
- Jiménez, J.C.; Marengo, J.A.; Alves, L.M.; Sulca, J.C.; Takahashi, K.; Ferrett, S.; Collins, M. The role of ENSO flavours and TNA on recent droughts over Amazon forests and the Northeast Brazil region. Int. J. Climatol. 2019, 41, 3761–3780. [Google Scholar] [CrossRef]
- Zeng, N.; et al. Causes and Impact of the 2005 Amazon Drought. Environ. Res. Lett. 2008, 3, 014002. [Google Scholar] [CrossRef]
- Espinoza, J.C.; Ronchail, J.; Lavado, W.; Santini, W.; Vauchel, P.; Pombosa, R.; , Villacís, M.; Carranza, J.; Junquas,C.; Drapeau, G.; Guyot, J.L. Recent droughts in the Peruvian Amazonas region: Climate origins and hydrological impacts. Revista Peruana Geo-Atmsférica RPGA 2011, (3), 63-72. [CrossRef]
- Marengo, J.A.; Tomasella, J.; Alves, L.M.; Soares, W.R.; and Rodriguez, D.A. The drought of 2010 in the context of historical droughts in the Amazon region: DROUGHT AMAZON 2010. Geophys. Res. Lett., 2011, 38, L12703. [Google Scholar] [CrossRef]
- Jiménez, J.C.; Barichivich, J.; Mattar, C.; Takahashi, K.; Santamarıa-Artigas, A.; Sobrino, J.A.; Malhi, Y. , Spatio-temporal patterns of thermal anomalies and drought over tropical forests driven by recent extreme climatic anomalies. Phil. Trans. R. Soc. B 2018, 373, 20170300. [Google Scholar] [CrossRef] [PubMed]
- Gutierrez, R.A.; Espinoza, J.C.; Lavado, W.; Junquas, C.; Molina-Carpio, J.; Condom, T.; Marengo, J.A. The 2022-23 drought in the South American Altiplano: ENSO effects on moisture flux in the western Amazon during the pre-wet season. Weather and Climate Extremes 2024, 100710. [Google Scholar] [CrossRef]
- Milla, P.; Espinoza, J.C.; Gutierrez, R.; Molina-Carpio, J.; Ronchail, J.; Espinoza-Romero, D.; Junquas, C. Recent changes in the dry-to-wet transition season in the Andean Altiplano and related atmospheric circulation patterns (1981–2022). Climate Dynamics. 2025. [Google Scholar] [CrossRef]
- Jiang, N.; Zhu, C.; Hu, Z.Z.; et al. Enhanced risk of record-breaking regional temperatures during the 2023–24 El Niño. Sci Rep 2024, 14, 2521. [Google Scholar] [CrossRef]
- Doblas-Reyes, F.J.; Sorensson, A.A.; Almazroui, M.; Dosio, A.; Gutowski, W.J.; Haarsma, R.; Hamdi, R.; Hewitson, B.; Kwon,W.-T.; Lamptey, B.L.; Maraun, D.; Stephenson, T.S.; Takayabu,I.; Terray, L.; Turner, A.; Zuo, Z. Linking global to regional climate change, 2021: edited by: Masson-Delmotte, V.; Zhai, P.; Pirani, A.; Connors, S.L.; Pean, C.; Berger, S.; Caud, N.;Chen, Y.; Goldfarb, L.; Gomis, M.I.; Huang, M.; Leitzell, K.; Lonnoy, E.; Matthews, J.B.R.; Maycock, T.K.; Waterfield, T.; Yelekci, O.; Yu, R.; and Zhou, B.; in: Climate Change 2021: The Physical Science Basis, Contribution of Working Group I to the Sixth Assessment Report of the Intergovernmental Panel on Climate Change, Cambridge University Press, Cambridge, United Kingdom and New York, NY, USA, 2021. 1363–1512. [CrossRef]
- Parsons, L.A.; Brennan, M.K.; Wills, R.C.J.; Proistosescu, C. Magnitudes and spatial patterns of interdecadal temperature variability in CMIP6. Geophysical Research Letters 2020, 47, e2019GL086588. [Google Scholar] [CrossRef]
- Agudelo, J.; Espinoza, J.C.; Junquas, C.; Arias, P.A.; Sierra, J.P.; Olmo, M.E. Future projections of low-level atmospheric circulation patterns over South Tropical South America: Impacts on precipitation and Amazon dry season length. Journal of Geophysical Research: Atmospheres 2023, 128, e2023JD038658. [Google Scholar] [CrossRef]
- Clarke, B.; Barnes, C.; Rodrigues, R.; Zachariah, M.; Stewart, S.; Raju, E.; Baumgart, N.; D., Libonati, R.; Santos, D.; Albuquerque, R.; Alves, L.M.; Otto, F. Climate Change, Not El Niño, Main Driver of Exceptional Drought in Highly Vulnerable Amazon River Basin. 2024. Available on line. https://spiral.imperial.ac.uk/entities/publication/a26f2f67-2670-4fc4-a435-57419ee3d00e (accessed on 15/3/2025).
- Jiménez-Muñoz, J.C.; Mattar, C.; Barichivich, J.; Santamaría- Artigas, A.; Takahashi, K.; Malhi, Y.; Sobrino, J.A.; and van der Schrier, G. Record-breaking warming and extreme drought in the Amazon rainforest during the course of El Niño 2015–2016. Sci. Rep. 2016, 6, 33130. [Google Scholar] [CrossRef]
- Marengo, J.A.; Nobre, C.A.; Tomasella, J.; Oyama, M.D.; Sampaio de Oliveira, G.; de Oliveira, R.; Camargo, H.; Alves, L.M.; Brown, I.F. The Drought of Amazonia in 2005. J. Climate 2008, 21, 495–516. [Google Scholar] [CrossRef]
- Espinoza, J.C.; Arias, P.A.; Moron, V.; Junquas, C.; Segura, H.; Sierra-Perez, J.; Wongchuig, S.; Condom, T. Recent changes in the atmospheric circulation patterns during the dry-to-wet transition season in south tropical South America (1979-2020): Impacts on precipitation and fire season. Journal of Climate. 2021. [CrossRef]
- Aragão, L.E.O.C.; Malhi, Y.; Roman-Cuesta, R.M.; Saatchi, S.; Anderson, L.O.; Shimabukuro, Y.E. Spatial patterns and fire response of recent Amazonian droughts, Geophys. Res. Lett. 2007, 34, L07701. [Google Scholar] [CrossRef]
- Malhi, Y.; Roberts, T.; Betts, R.A.; Killeen, T.J. Climate Change, Deforestation, and the Fate of the Amazon. Science 2008, 319, 169. [Google Scholar] [CrossRef]
- Marengo, JA.; Jr, Souza, C.; Thonicke, K.; Burton, C.; Halladay, K.; Betts, RA.; Alves, LM.; Soares, WR .,. Changes in Climate and Land Use Over the Amazon Region: Current and Future Variability and Trends. Front. Earth Sci. 2018, 6, 228. [CrossRef]
- Jiménez, J.C.; Miranda, V.; Trigo, I.; Libonati, R.; Albuquerque, R.; Peres, L.F.; Espinoza, JC.; Marengo, J.A. Vegetation Warming and Greenness Decline across Amazonia during the Extreme Drought of 2023. Remote Sens. 2024, 16, 2519. [Google Scholar] [CrossRef]
- Malhi, Y.; Aragao, L.E.O.C.; Galbraith, D.; Huntingford, C.; Fisher, R.; Zelazowski, P.; Sitch, S.; McSweeney,C. Exploring the likelihood and mechanism of a climate-change-induced dieback of the Amazon forest. P. Natl. Acad. Sci. USA 2009, 106, 20610–20615. [CrossRef] [PubMed]
- Lewis, S.L.; Brando, P.M.; Phillips, O.L.; van der Heijden, G.M. F.; Nepsta, D. The 2010 Amazon Drought. Science 2011, 331, 6017. [Google Scholar] [CrossRef] [PubMed]
- Phillips, *!!! REPLACE !!!*; et al. Drought Sensitivity of the Amazon Rainforest. Science 2009, 323, 1344–1347. [Google Scholar] [CrossRef]
- Brando, P.M.; Balch, J.K.; Nepstad, D.C.; Morton, D.C.; Putz, F.E.; Coe, Silvério, D.; Macedo, M.N.; Davidson, E.A.; Nóbrega, C.C.; Alencar, A.; Soares-Filho, B.S. Abrupt increases in Amazonian tree mortality due to drought–fire interactions. Proc.Natl. Acad. Sci. U.S.A. 2015, 111, 6347–6352. [CrossRef]
- Espinoza, J.C.; Ronchail, J.; Guyot, J.L.; Cochonneau, G.; Naziano, F.; Lavado, W.; De Oliveira, E.; Pombosa, R.; Vauchel, P. Spatio-temporal rainfall variability in the Amazon basin countries (Brazil, Peru, Bolivia, Colombia, and Ecuador). Int. J. Climatol. 2009, 29, 1574–1594. [Google Scholar] [CrossRef]
- Sulca, J.; Apaéstegui, J.; Tacza, J. New insights into the biennial-to-multidecadal variability of the water level fluctuation in Lake Titicaca in the 20th century. Frontiers in Climate 2024, 5, 1325224. [Google Scholar] [CrossRef]
- Bell, B.; Hersbach, H.; Simmons, A.; Berrisford, P.; Dahlgren, P.; Horányi, A.; et al. The ERA5 global reanalysis: Preliminary extension to 1950. Q J R Meteorol Soc 2021, 147, 4186–4227. [Google Scholar] [CrossRef]
- Hersbach, H.; Bell, B.; Berrisford, P.; et al. The ERA5 global reanalysis. Q J R Meteorol Soc. 2020, 146, 1999–2049. [Google Scholar] [CrossRef]
- Aybar, C.; Fernández, C.; Huerta, A.; Lavado, W.; Vega, F.; Felipe-Obando, O. Construction of a high-resolution gridded rainfall dataset for Peru from 1981 to present day. Hydrological Sciences Journal 2018, 0, 1. [Google Scholar] [CrossRef]
- Huerta, A.; Lavado-Casimiro, W.; and Obando, F.O. High-resolution gridded hourly precipitation dataset for Peru (PISCOp_h). 2022, Data in Brief. https://www.sciencedirect.com/science/article/pii/S2352340922007776.
- Huffman, G.J.; E.F. Stocker; D.T. Bolvin; E.J. Nelkin; Jackson Tan (2024), GPM IMERG Final Precipitation L3 Half Hourly 0.1 degree x 0.1 degree V07, Greenbelt, MD, Goddard Earth Sciences Data and Information Services Center (GES DISC). [CrossRef]
- Funk, C.; Peterson, P.; Landsfeld, M.; et al. The climate hazards infrared precipitation with stations—a new environmental record for monitoring extremes. Sci Data 2015, 2, 150066. [Google Scholar] [CrossRef] [PubMed]
- Beck, H.E.; van Dijk, A.I.J.M. , Levizzani, V.; Schellekens, J.; Miralles, D.G.; Martens, B.; de Roo, A. MSWEP: 3-hourly 0.25° global gridded precipitation (1979–2015) by merging gauge, satellite, and reanalysis data. Hydrol. Earth Syst. Sci. 2017, 21, 589–615. [Google Scholar] [CrossRef]
- Espinoza, J.C.; Chavez, S.; Ronchail, J.; Junquas, C.; Takahashi, K.; Lavado, W. Rainfall hotspots over the southern tropical Andes: Spatial distribution, rainfall intensity, and relations with large-scale atmospheric circulation. Water Resour. Res. 2015, 51, 3459–3475. [Google Scholar] [CrossRef]
- Chavez, S.P.; Takahashi, K. Orographic rainfall hot spots in the Andes-Amazon transition according to the TRMM precipitation radar and in situ data. J. Geophys. Res. Atmos. 2017, 122, 5870–5882. [Google Scholar] [CrossRef]
- Valenzuela, J.; Figueroa, M.; Armijos, E.; Espinoza, J.C.; Wongchuig, S.; Ramirez-Avila, J.J. Flooding risk of cropland areas by repiquetes in the western Amazon basin: A case study of Peruvian Tamshiyacu City. Journal of Hydrology: Regional Studies 2023, 47, 101428. [Google Scholar] [CrossRef]
- Zanin, P.R.; Pareja-Quispe, D.; Espinoza, J.C. Evapotranspiration in the Amazon Basin: Couplings, hydrological memory and water feedback. Agricultural and Forest Meteorology. 2024, 352, 110040. [Google Scholar] [CrossRef]
- Dinku T, Funk C, Peterson P, et al. Validation of the CHIRPS satellite rainfall estimates over eastern Africa. Q J R Meteorol Soc. 2018, 144 (Suppl. 1), 292–312. [CrossRef]
- Malhi, Y.; Pegoraro, E.; Nobre, A.D.; Pereira, M.G.P.; Grace, J.A.; Culf, D.; Clement, R. Energy and water dynamics of a central Amazonian rain forest. J. Geophys. Res. 2002, 107, 8061. [Google Scholar] [CrossRef]
- Marengo, J.A.; Costa, M.C.; Cunha, A.P.; Espinoza, J.-C.; Jimenez, J.C.; Libonati, R.; Miranda, V.; Trigo, I.F.; Sierra, J.P.; Geirinhas, J.L.; Ramos, A.M.; Skansi, M.; Molina-Carpio, J.; Salinas, R. Climatological patterns of heatwaves during winter and spring 2023 and trends for the period 1979–2023 in central South America. Front. Clim. 2025, 7, 1529082. [Google Scholar] [CrossRef]
- Brimelow, J.C.; Hanesiak, J.M.; . Burrows, W.R. On the Surface-Convection Feedback during Drought Periods on the Canadian Prairies. Earth Interact. 2011, 15, 1–26. [Google Scholar] [CrossRef]
Figure 1.
Locations of the study areas in the Peruvian Amazon forest region. LOR1:Loreto Notheast; LOR2:Loreto Northwest; LOR3: Loreto South; MOY: Moyobamba; UCA: Ucayali; MD: Madre de Dios.
Figure 1.
Locations of the study areas in the Peruvian Amazon forest region. LOR1:Loreto Notheast; LOR2:Loreto Northwest; LOR3: Loreto South; MOY: Moyobamba; UCA: Ucayali; MD: Madre de Dios.
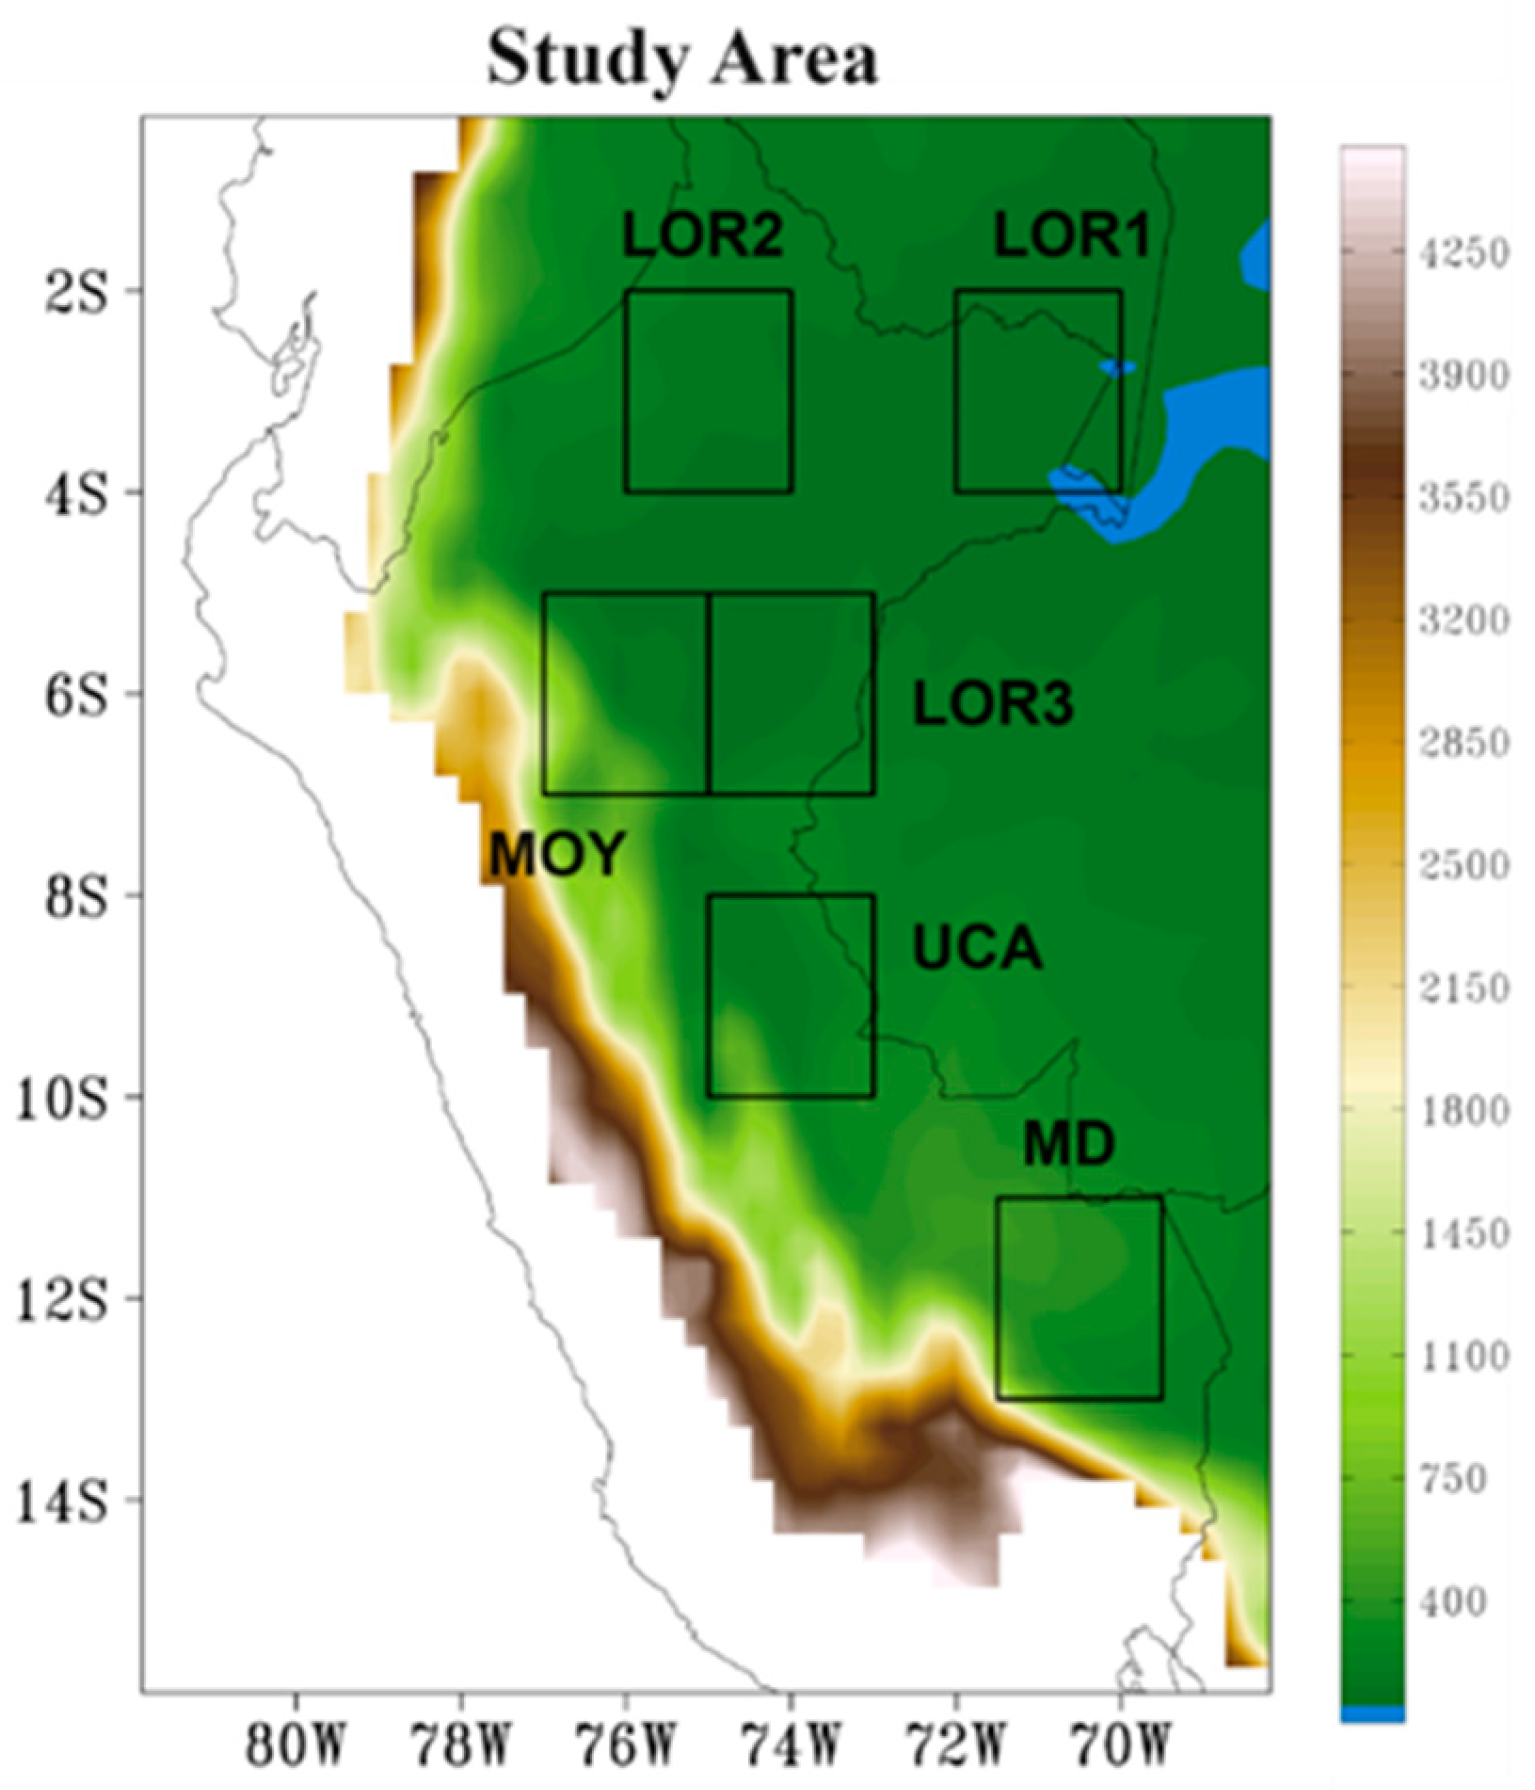
Figure 2.
Interannual variability of precipitation (Pr) and evaporation (Et) records for the six study areas, obtained from ERA5 (precipitation and evapotranspiration) and the precipitation datasets CHIRPS and MSWEP for the period 2000-2024. The color lines in the legend refer to the different data sources.
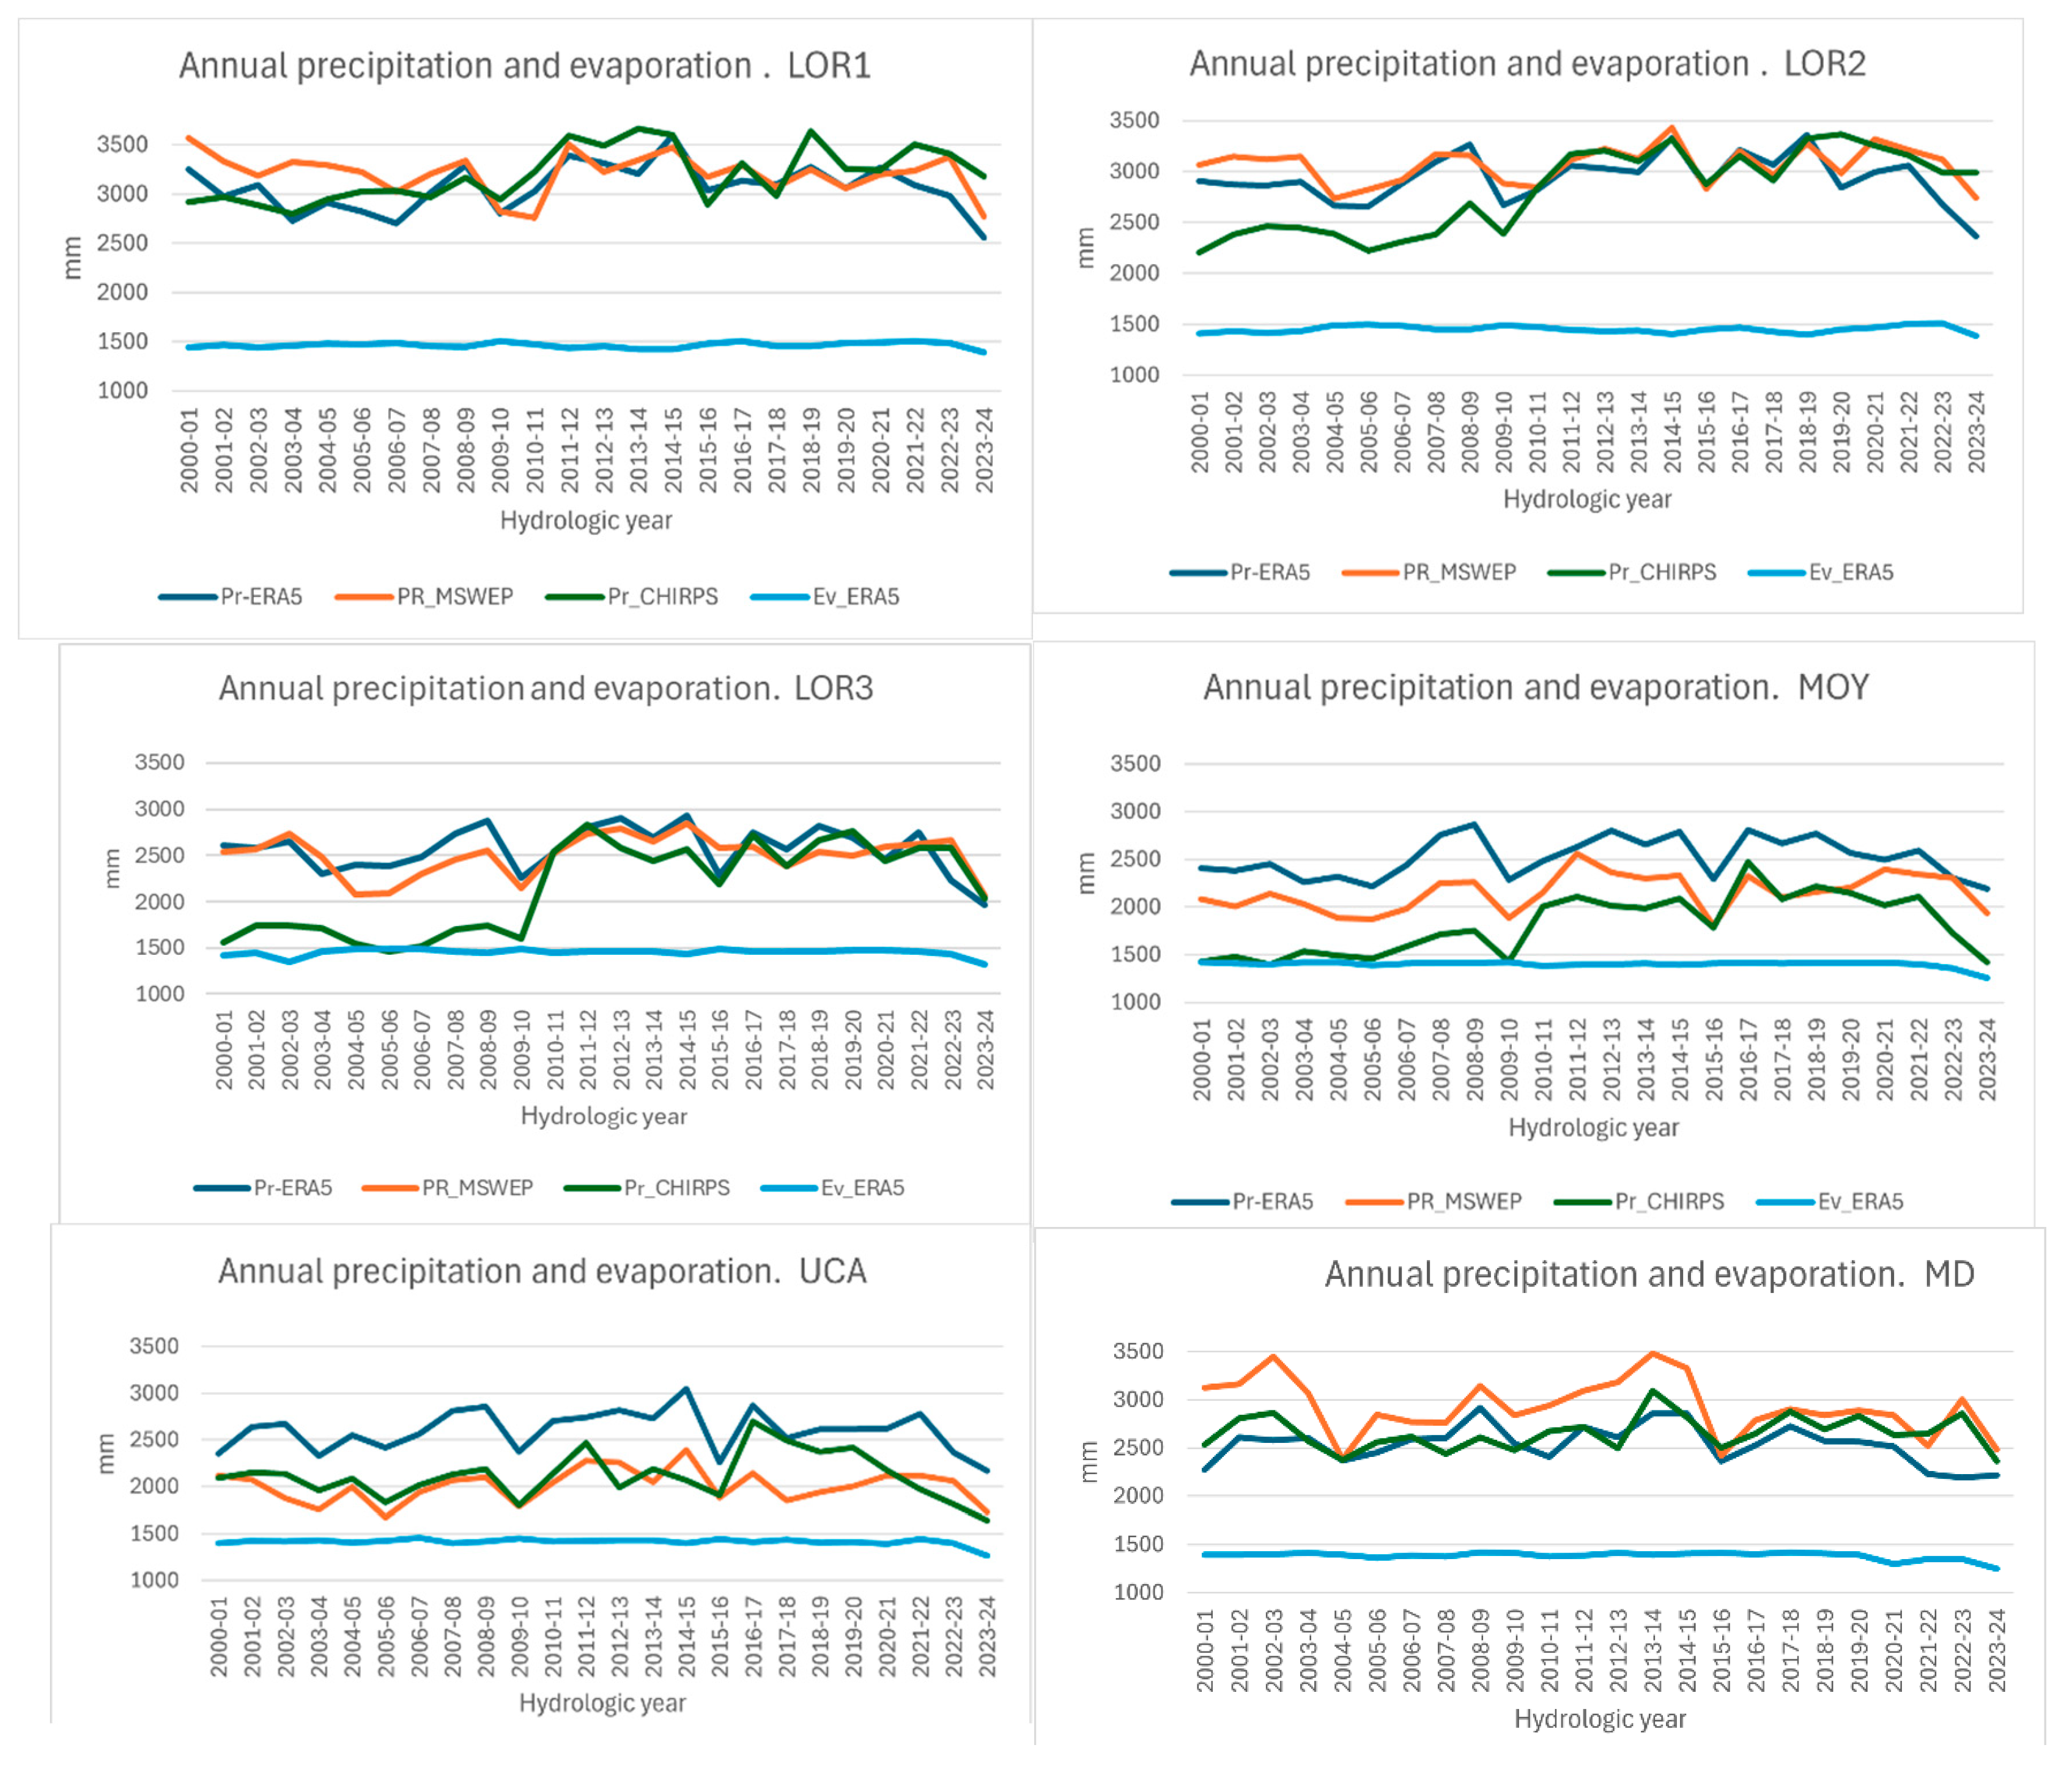
Figure 3.
Annual cycle of the water deficit (WD) in the different study areas as estimated from different precipitation (Pr) and evapotranspiration (Et) datasets. A. ERA5. B. MSWEP C. CHIRPS.
Figure 3.
Annual cycle of the water deficit (WD) in the different study areas as estimated from different precipitation (Pr) and evapotranspiration (Et) datasets. A. ERA5. B. MSWEP C. CHIRPS.
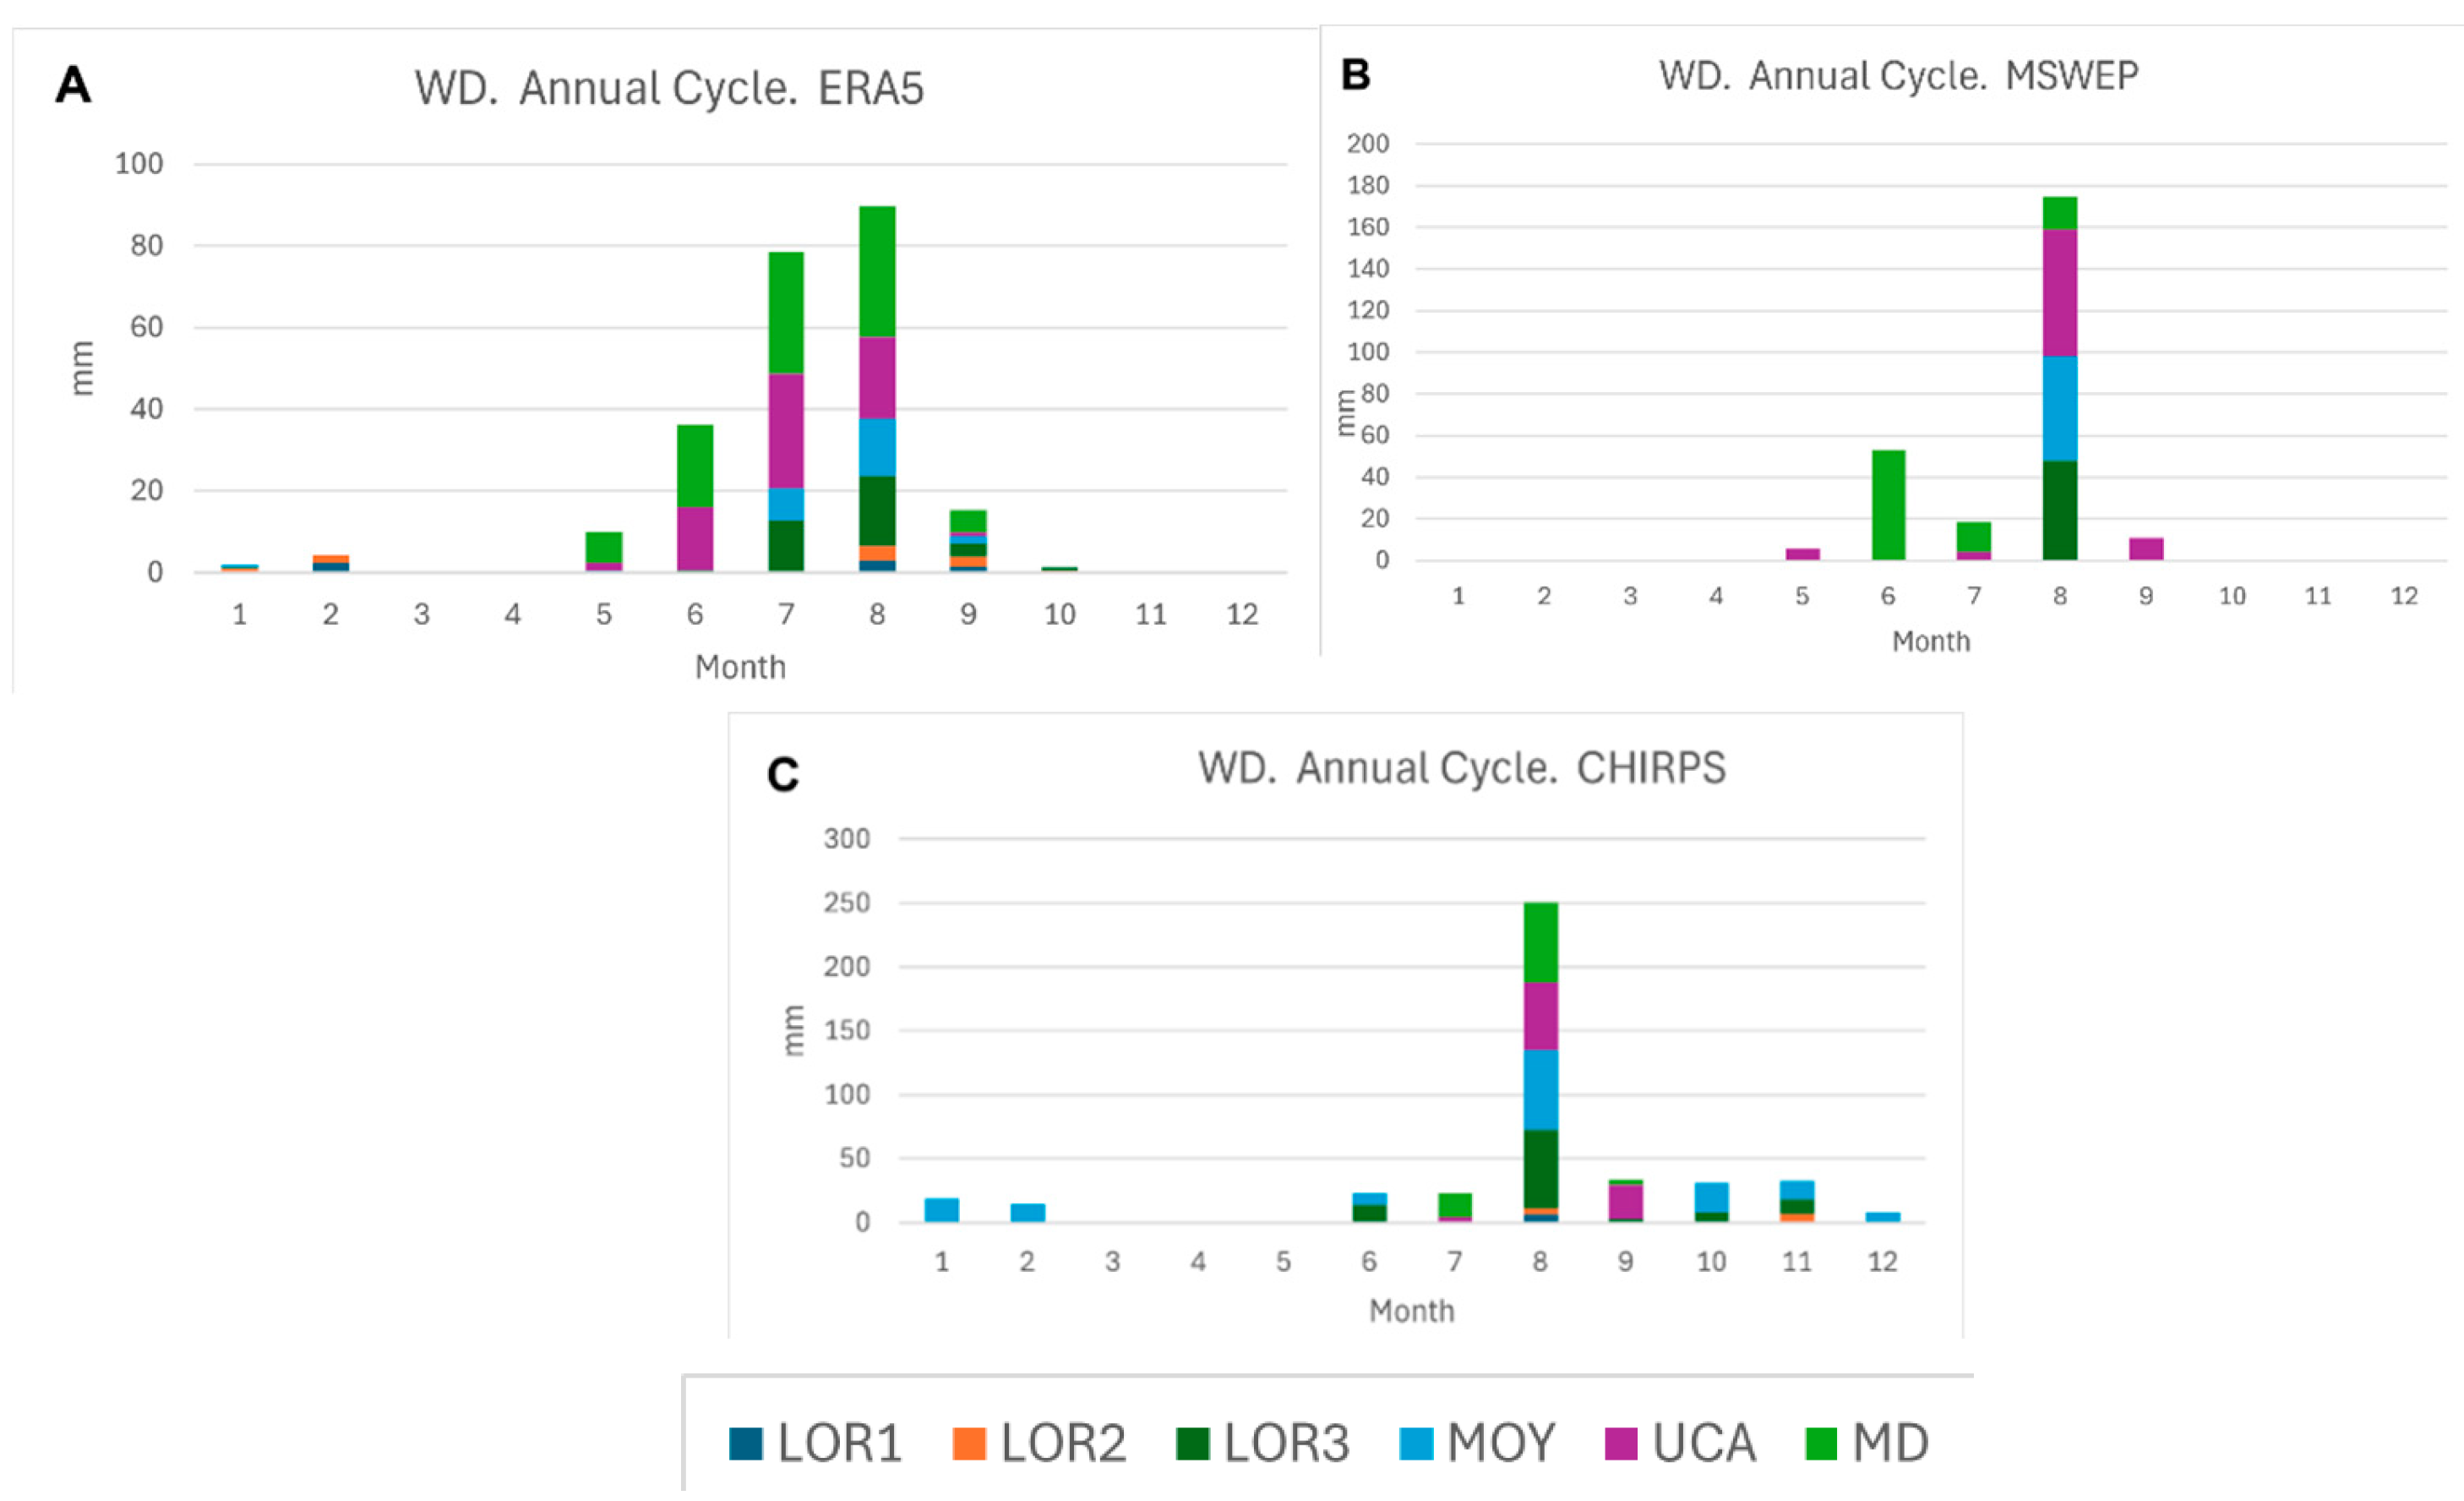
Figure 4.
Annual MCWD for the hydrologic years of the period 2000-2024 for the six study areas defined in Figure 1 and Table 2. A. Precipitation and evaporation from ERA5. B. Precipitation from MSWEP and evaporation from ERA5. C. Precipitation from CHIRPS and evaporation from ERA5. The color lines in the legend refer to the different study areas. LOR1, lOR2 andLOR3 refer to the three study areas in the Loreto region. MOY refers to Moyobamba, UCA to Ucayali and MD to Madre de Dios study areas.
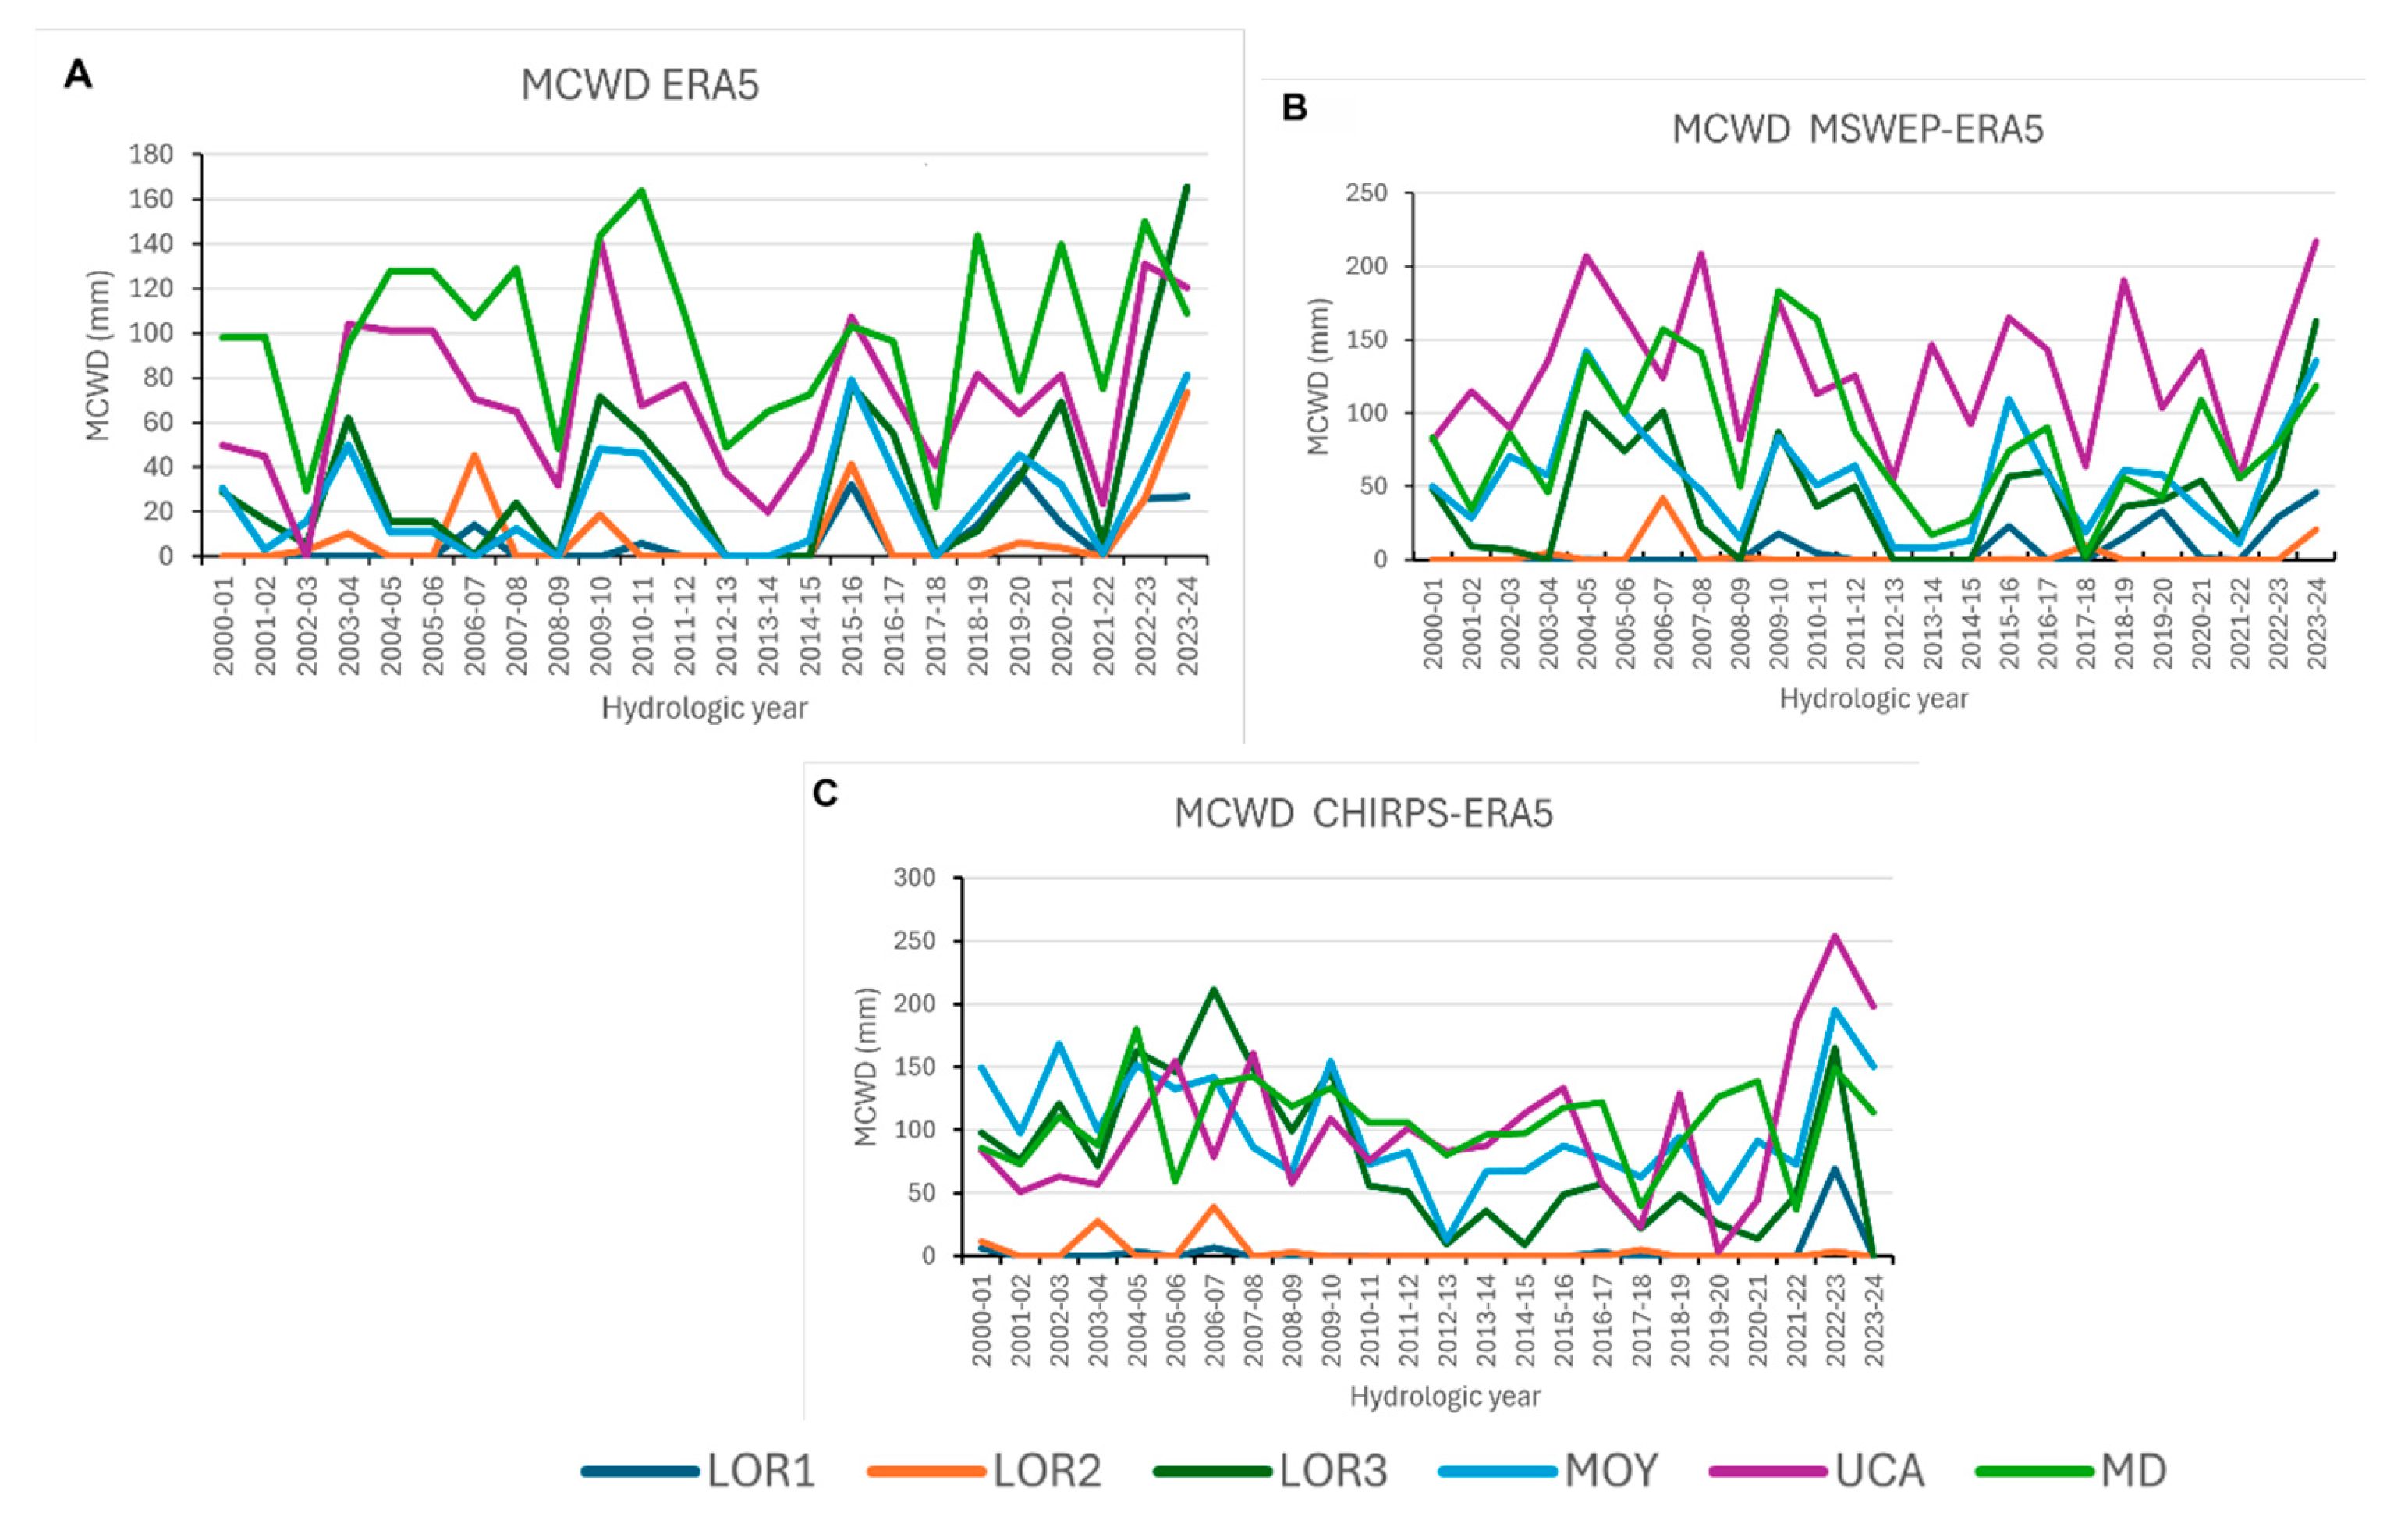
Figure 5.
Average annual MCWD of the six study areas defined in Figure 1 and Table 2. for the hydrological years of the period 2000-2024 f A. Precipitation and evaporation from ERA5. B. Precipitation from MSWEP and evaporation from ERA5. C. Precipitation from CHIRPS and evaporation from ERA5. D. Average from the three datasets.
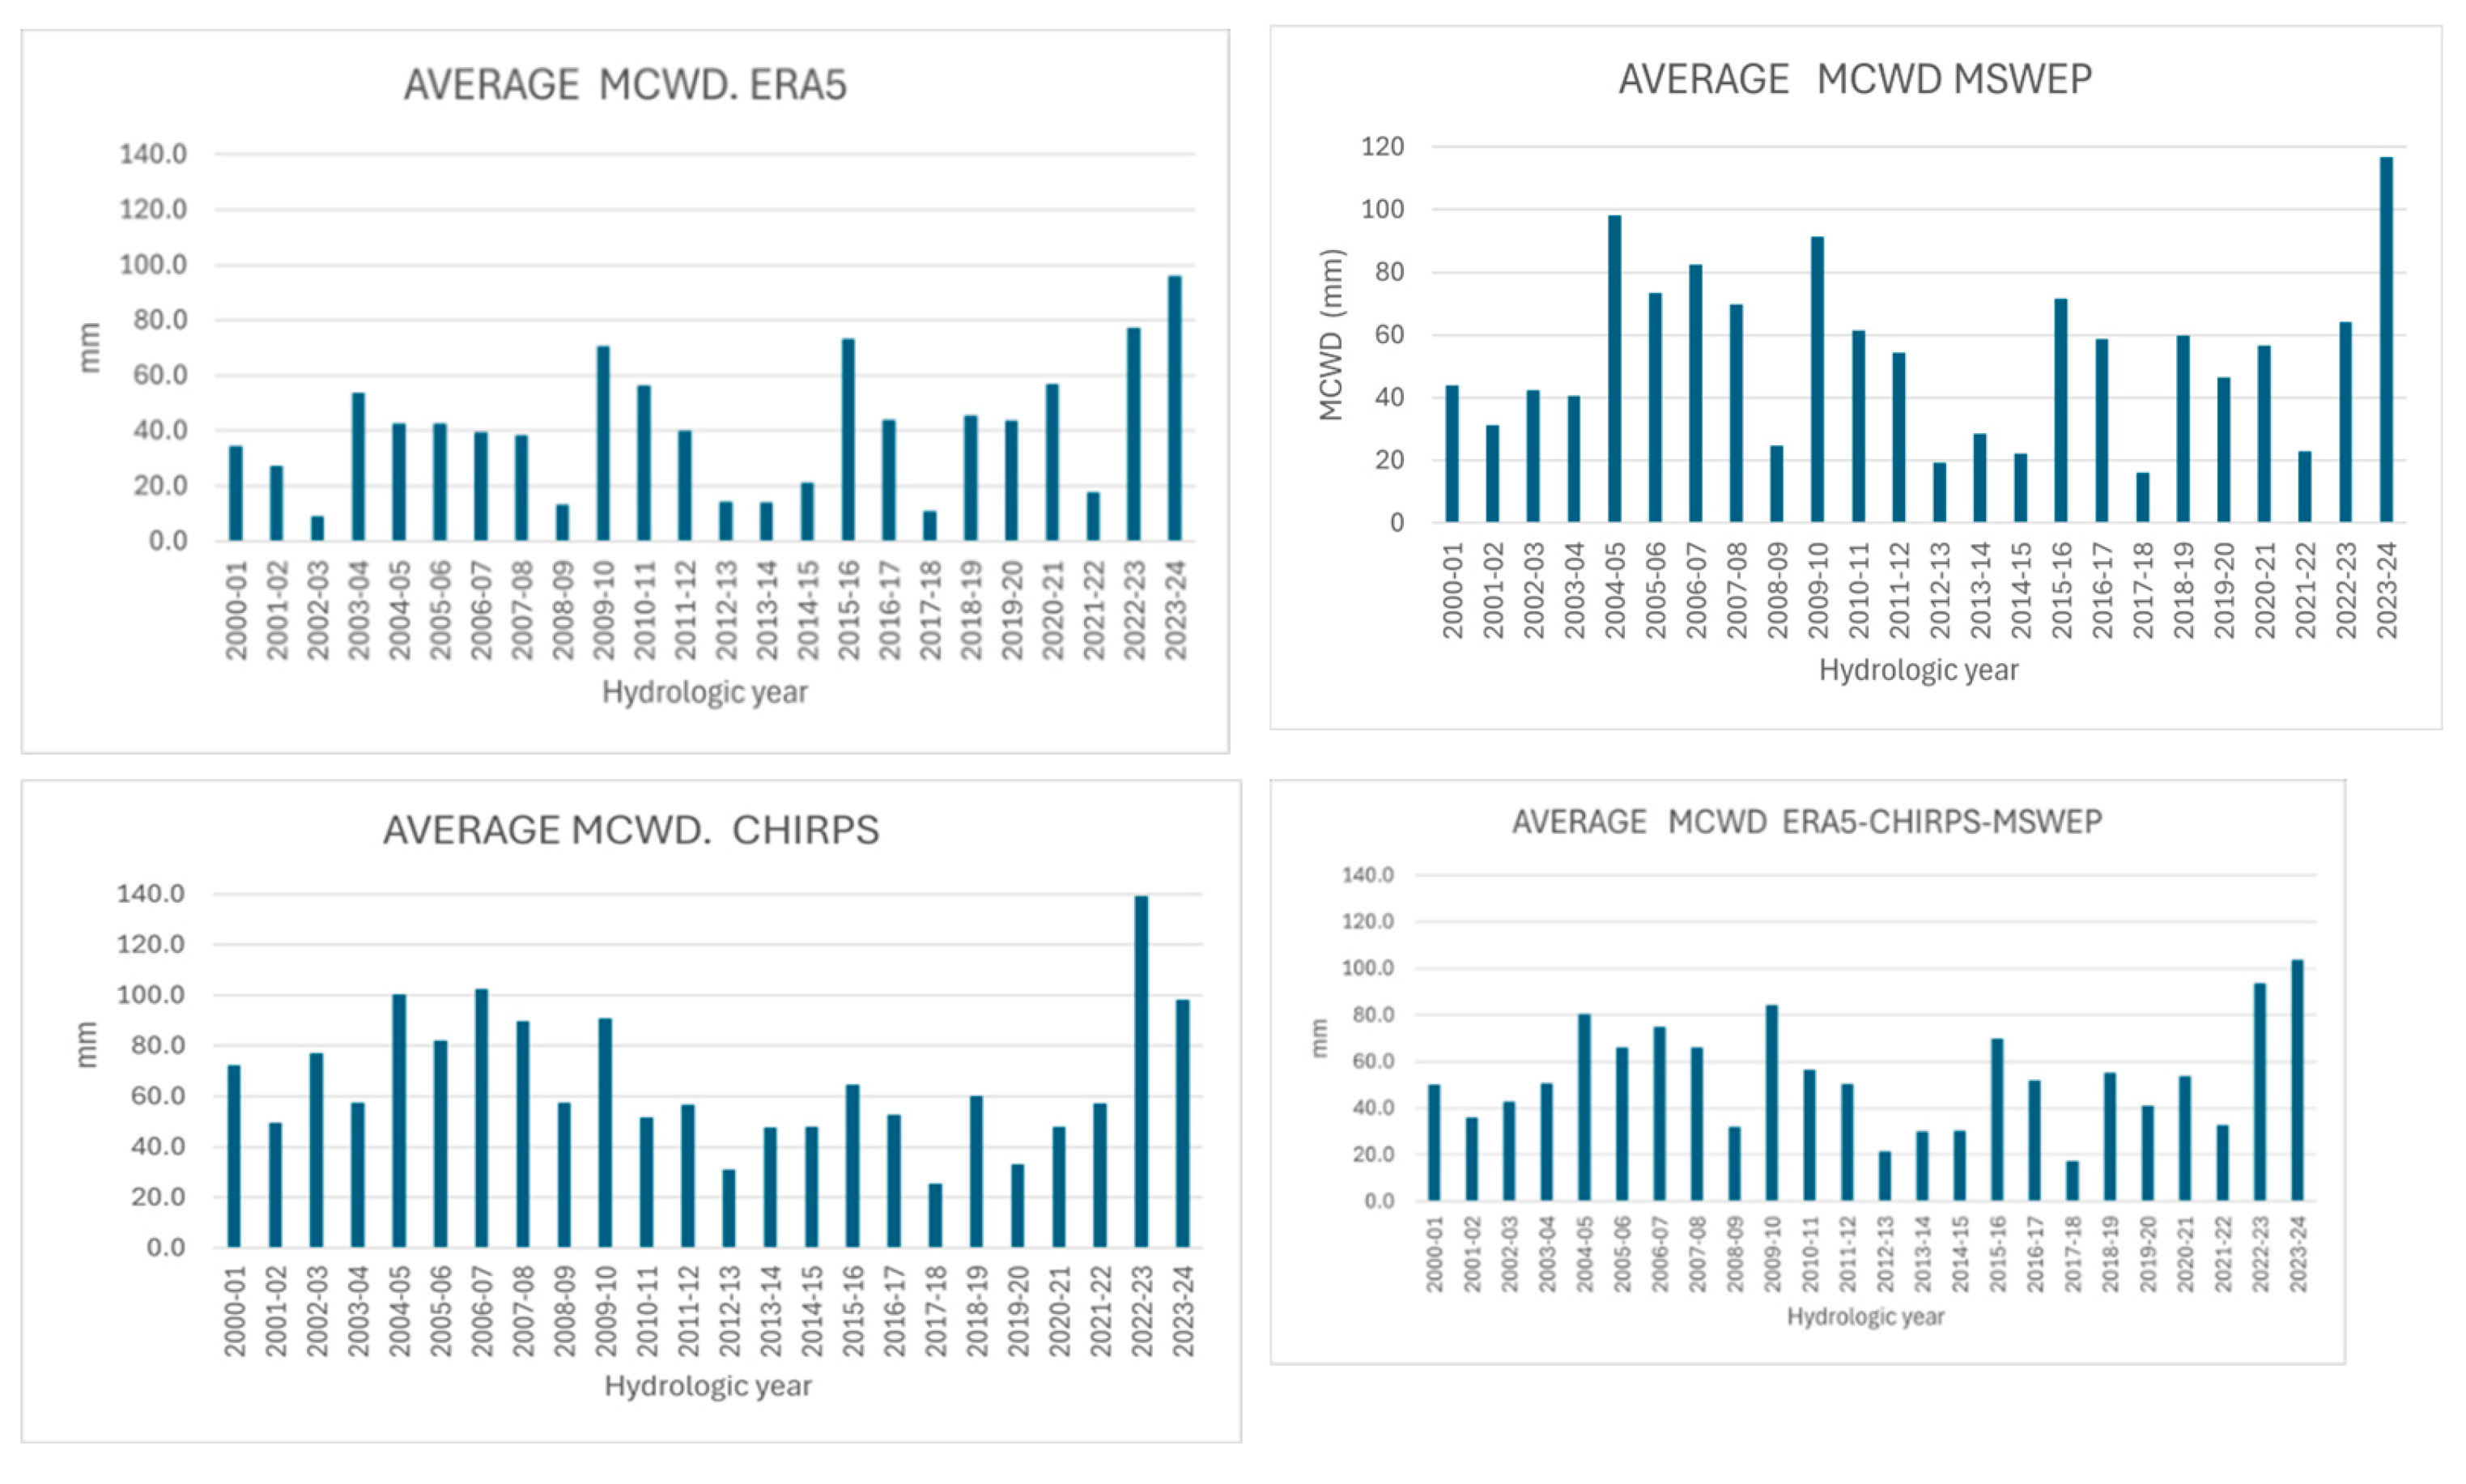
Figure 6.
Average annual cycles of precipitation (Pr) and evapotranspiration (Et) for the extreme drought (ED) hydrological years (2004-05, 2009-10, 2022-23 and 2023-24) and the climatology (CLIM) of the study period (2000-2024). The legend shows the colors of the lines corresponding to evaporation and precipitation for the two classifications.
Figure 7.
Spatial distribution of MCWD for the Peruvian Amazon region for the extreme drought hydrological years and using three different datasets. Row 1: Precipitation and evaporation: ERA5. Row 2. Precipitation: MSWEP, evaporation: ERA5. Row 3: Precipitation: CHIRPS, evaporation: ERA5. Column 1: HY 2004-05. Column 2: HY: 2009-10. Column 3: HY 2022-23. Column 4. HY 2023-24.
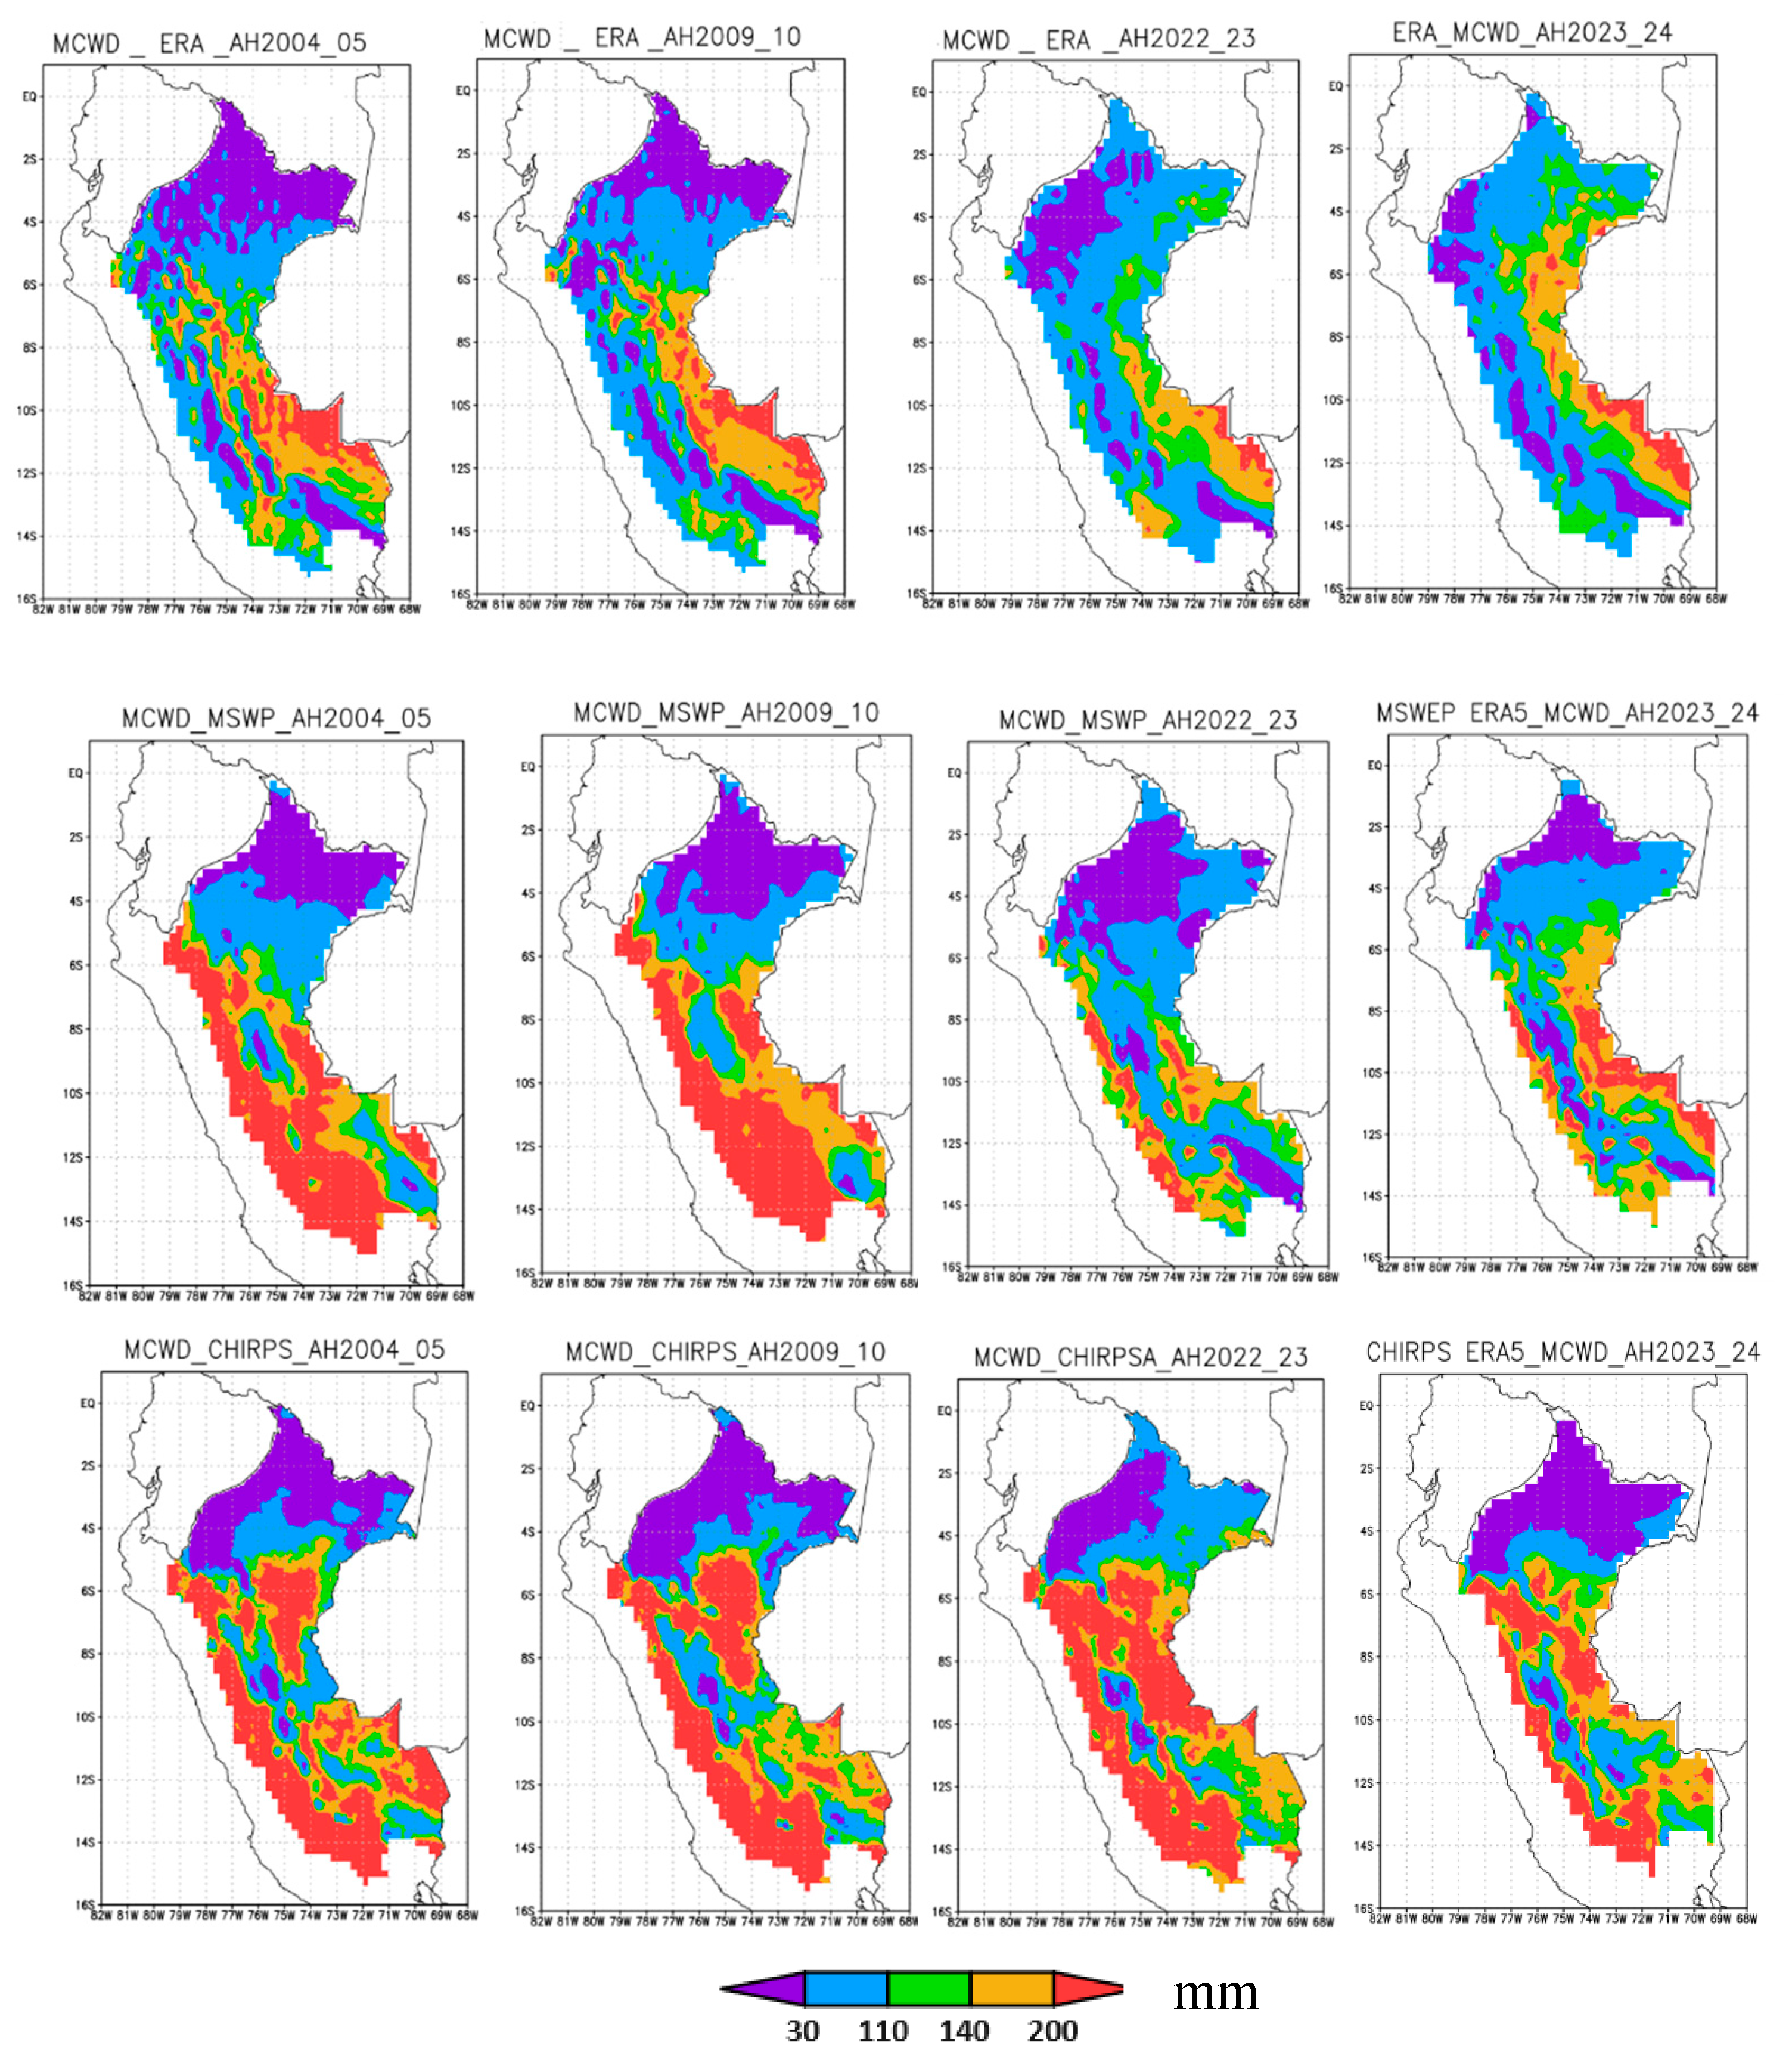
Figure 8.
Climatology of the spatial distribution of MCWD for the Peruvian Amazon region fron different datasets. Left: ERA5 . Center: MSWEP-ERA5 Right: CHIRPS-ERA5.
Figure 8.
Climatology of the spatial distribution of MCWD for the Peruvian Amazon region fron different datasets. Left: ERA5 . Center: MSWEP-ERA5 Right: CHIRPS-ERA5.
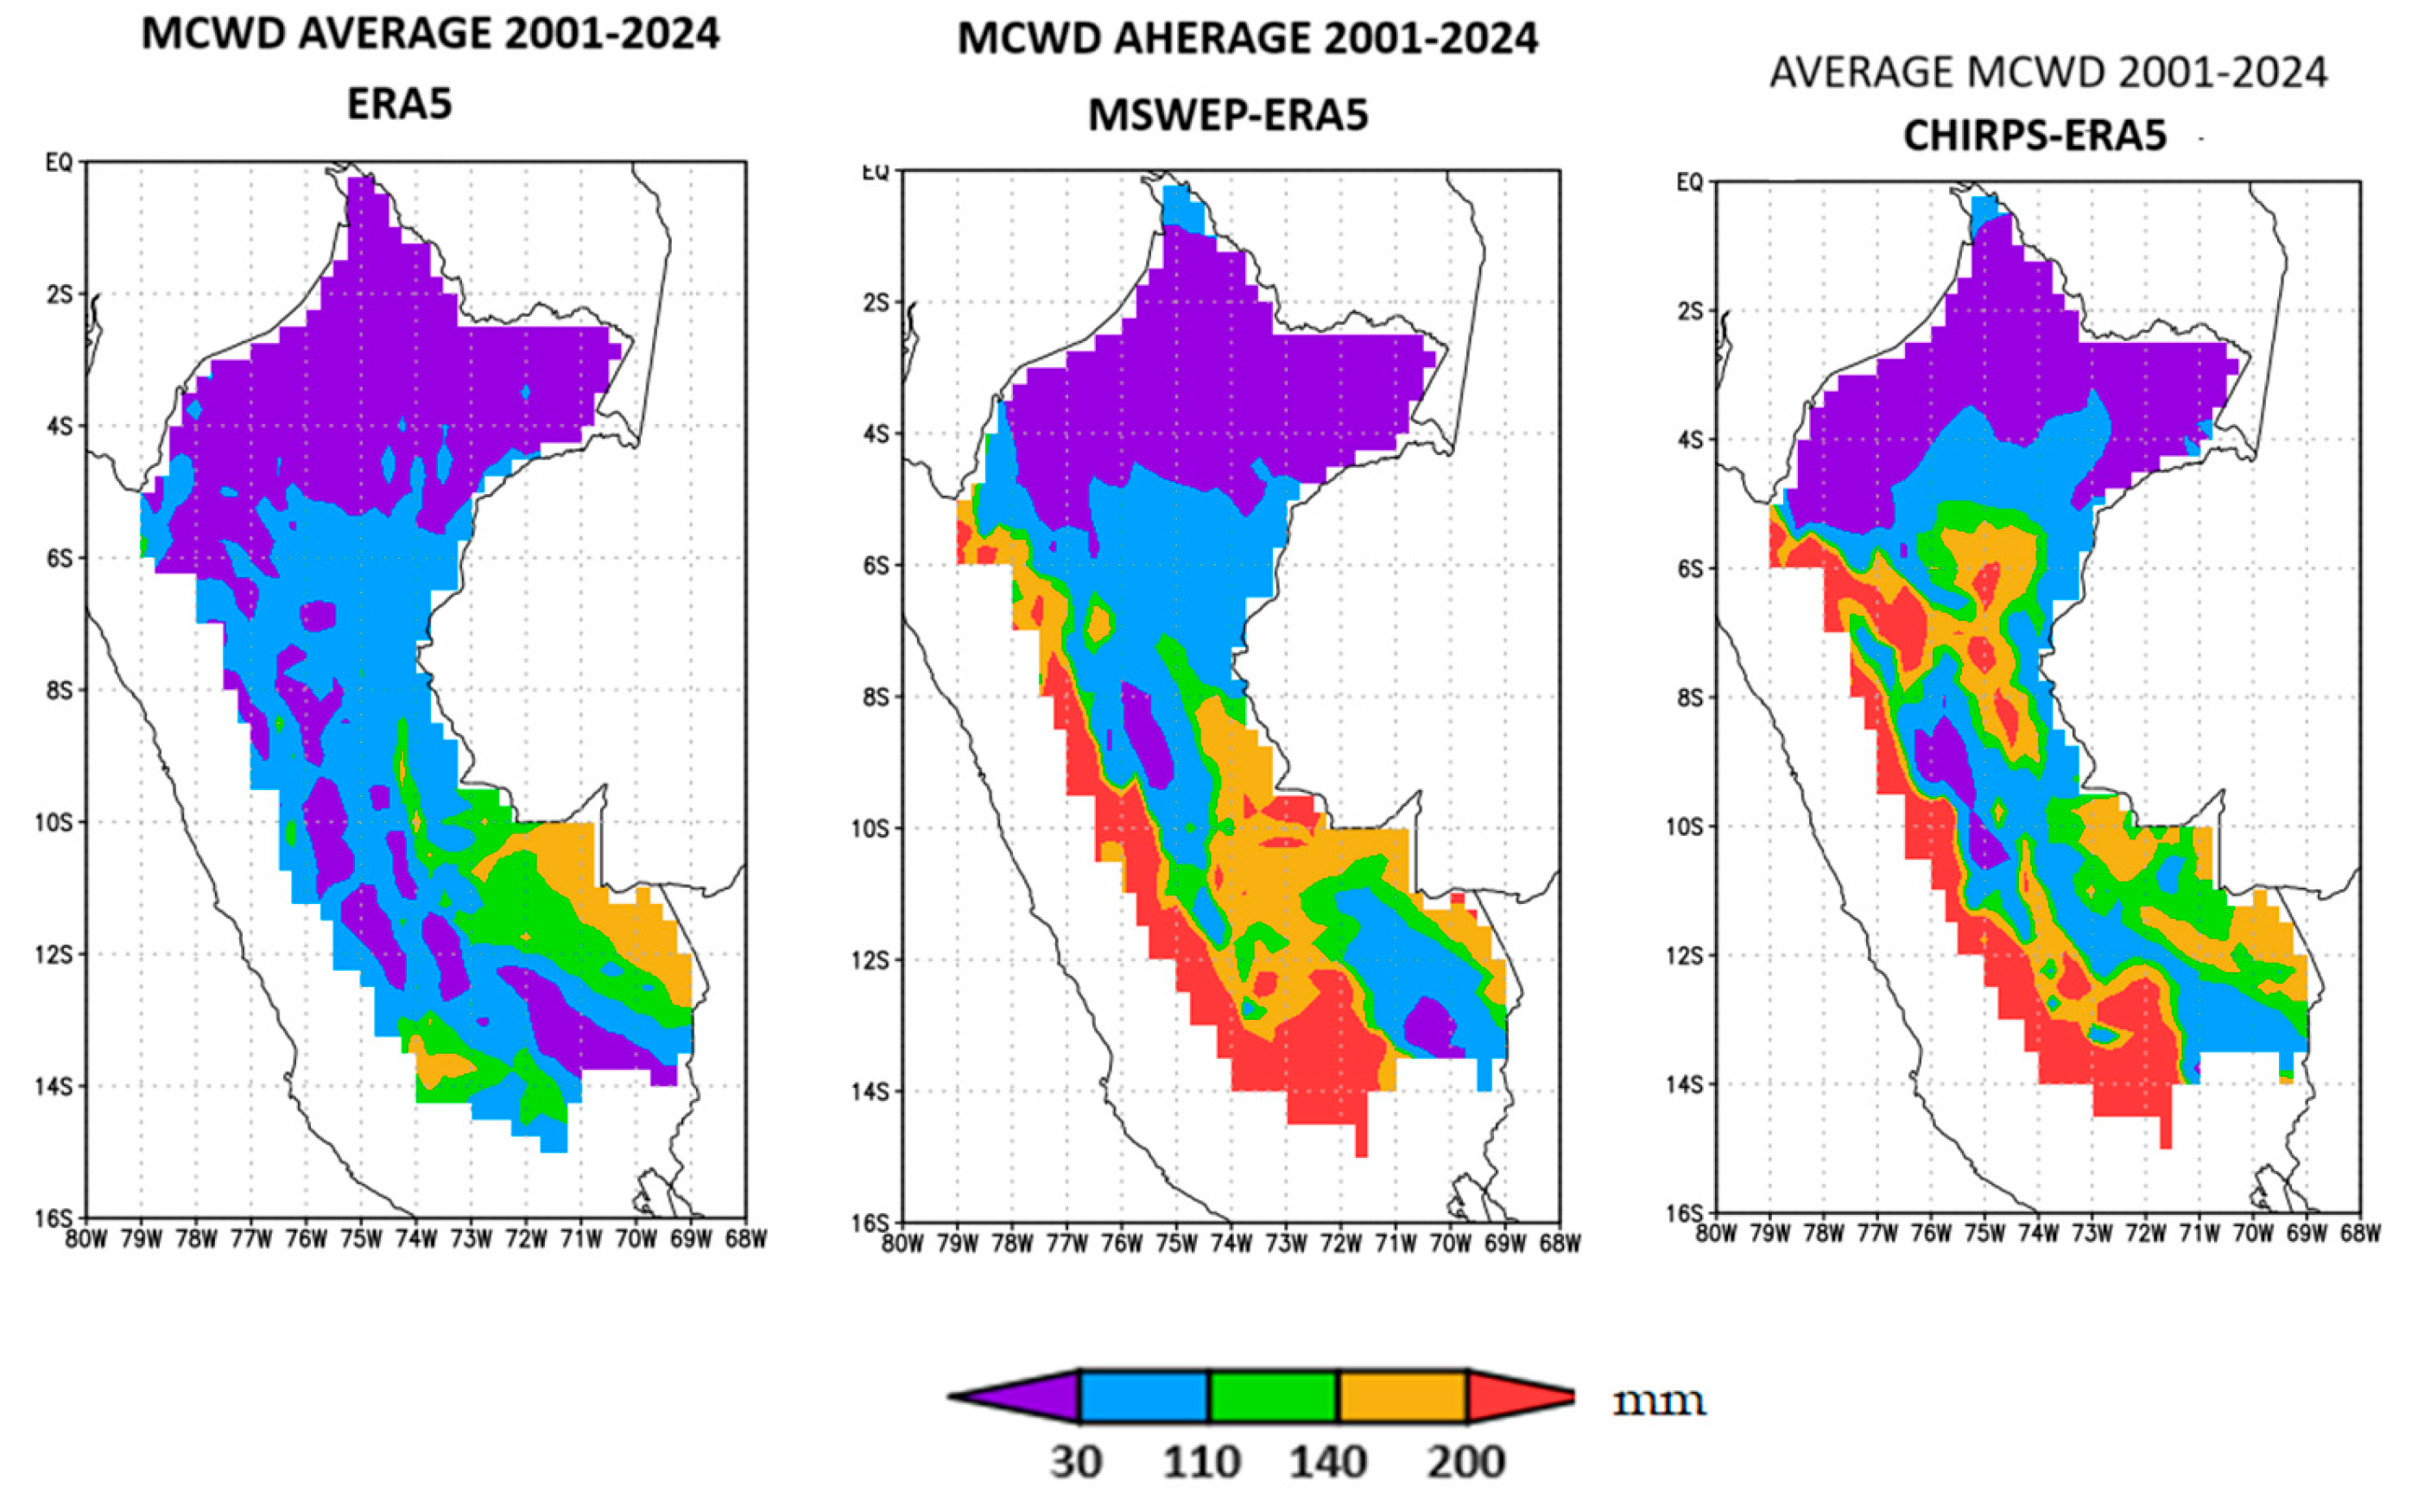
Figure 9.
Percentages of the Peruvian Amazon basin area covered by the different drought threshold intervals for the extreme droughts of 2004/05, 2009/10, 2022/23 and 2023/24. A. According to ERA5. B. According to MSWEP. C. According to CHIRPS. Thresholds: 1: MCWD≥30 mm. 2: MCWD≥110 mm; 3: MCWD≥140 mm 4:MCWD≥200mm.
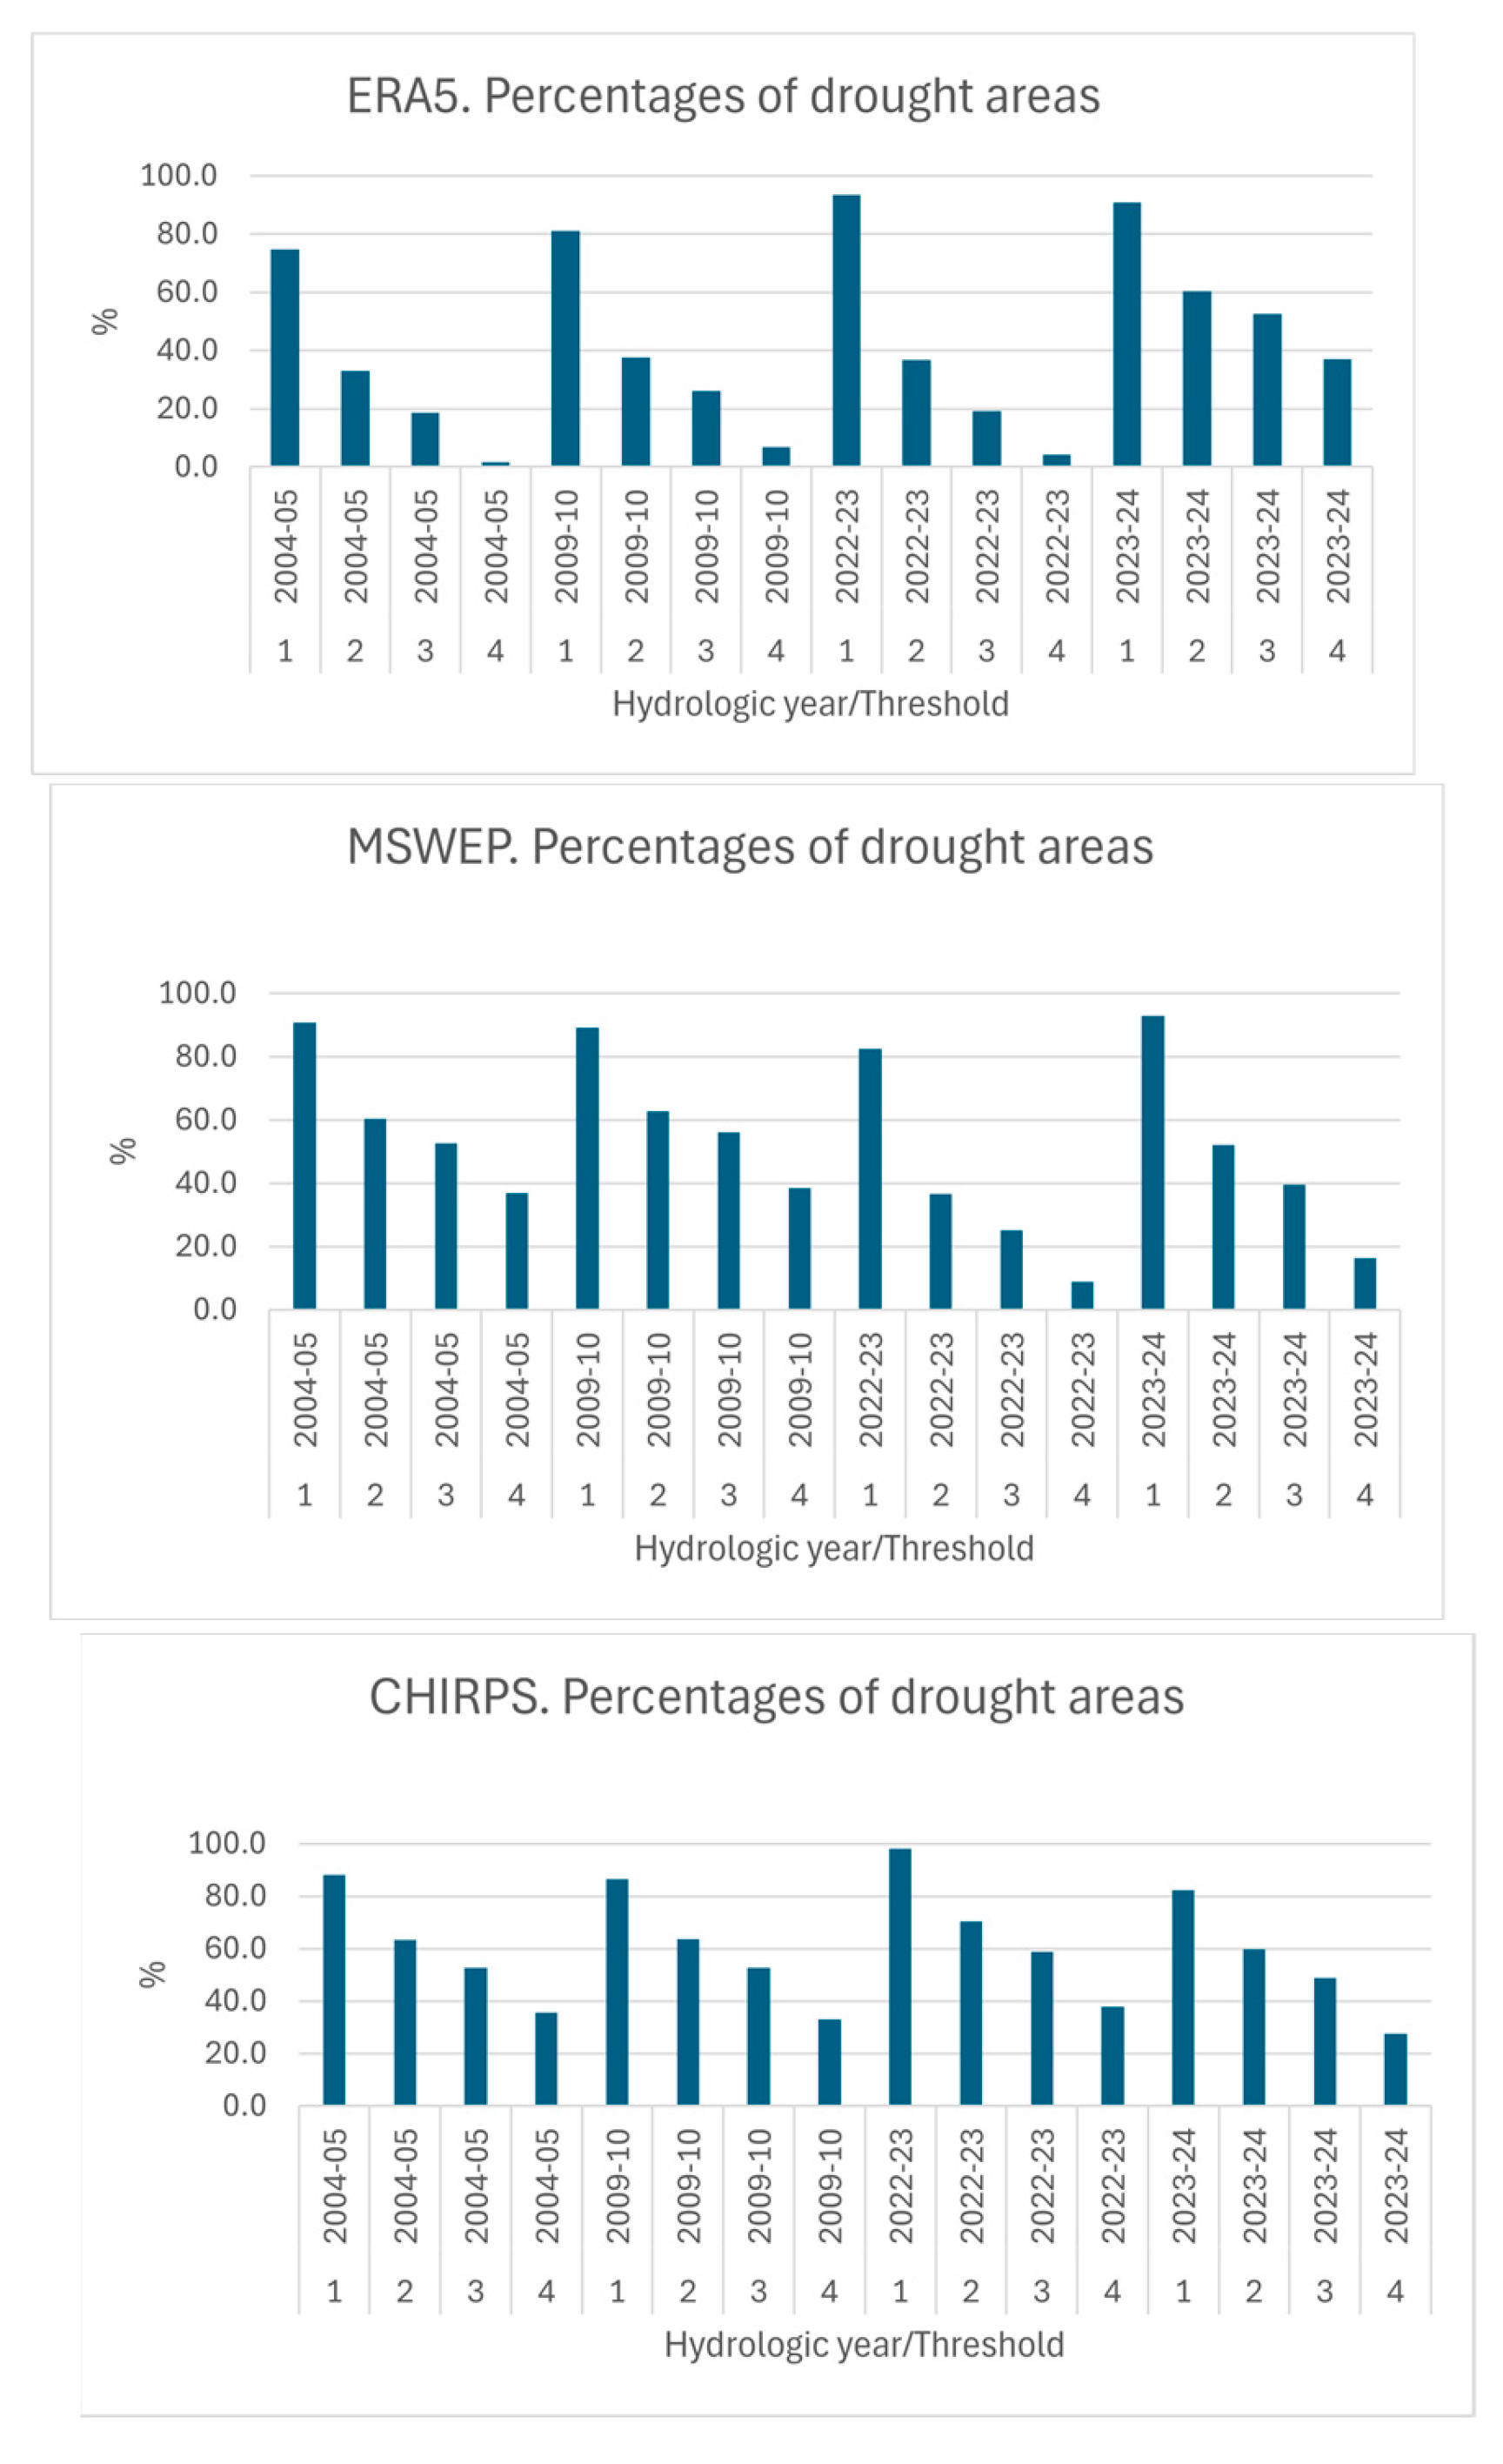
Figure 10.
Average annual cycles of three energy fluxes and the bulk Bowen ratio from ERA5 data for Northeast Loreto (LOR1), Ucayali (UCA) and Madre de Dios (MD). Upper row. LOR1. Middle row: UCA. Lower row: MD. Column 1: Sensible heat flux. Column 2: Latent heat flux. Column 3: Solar surface net radiation. Column 4. Bulk Bowen Ratio. The curves refer to the averages for extreme drought (ExD), and the climatology (CLIM).
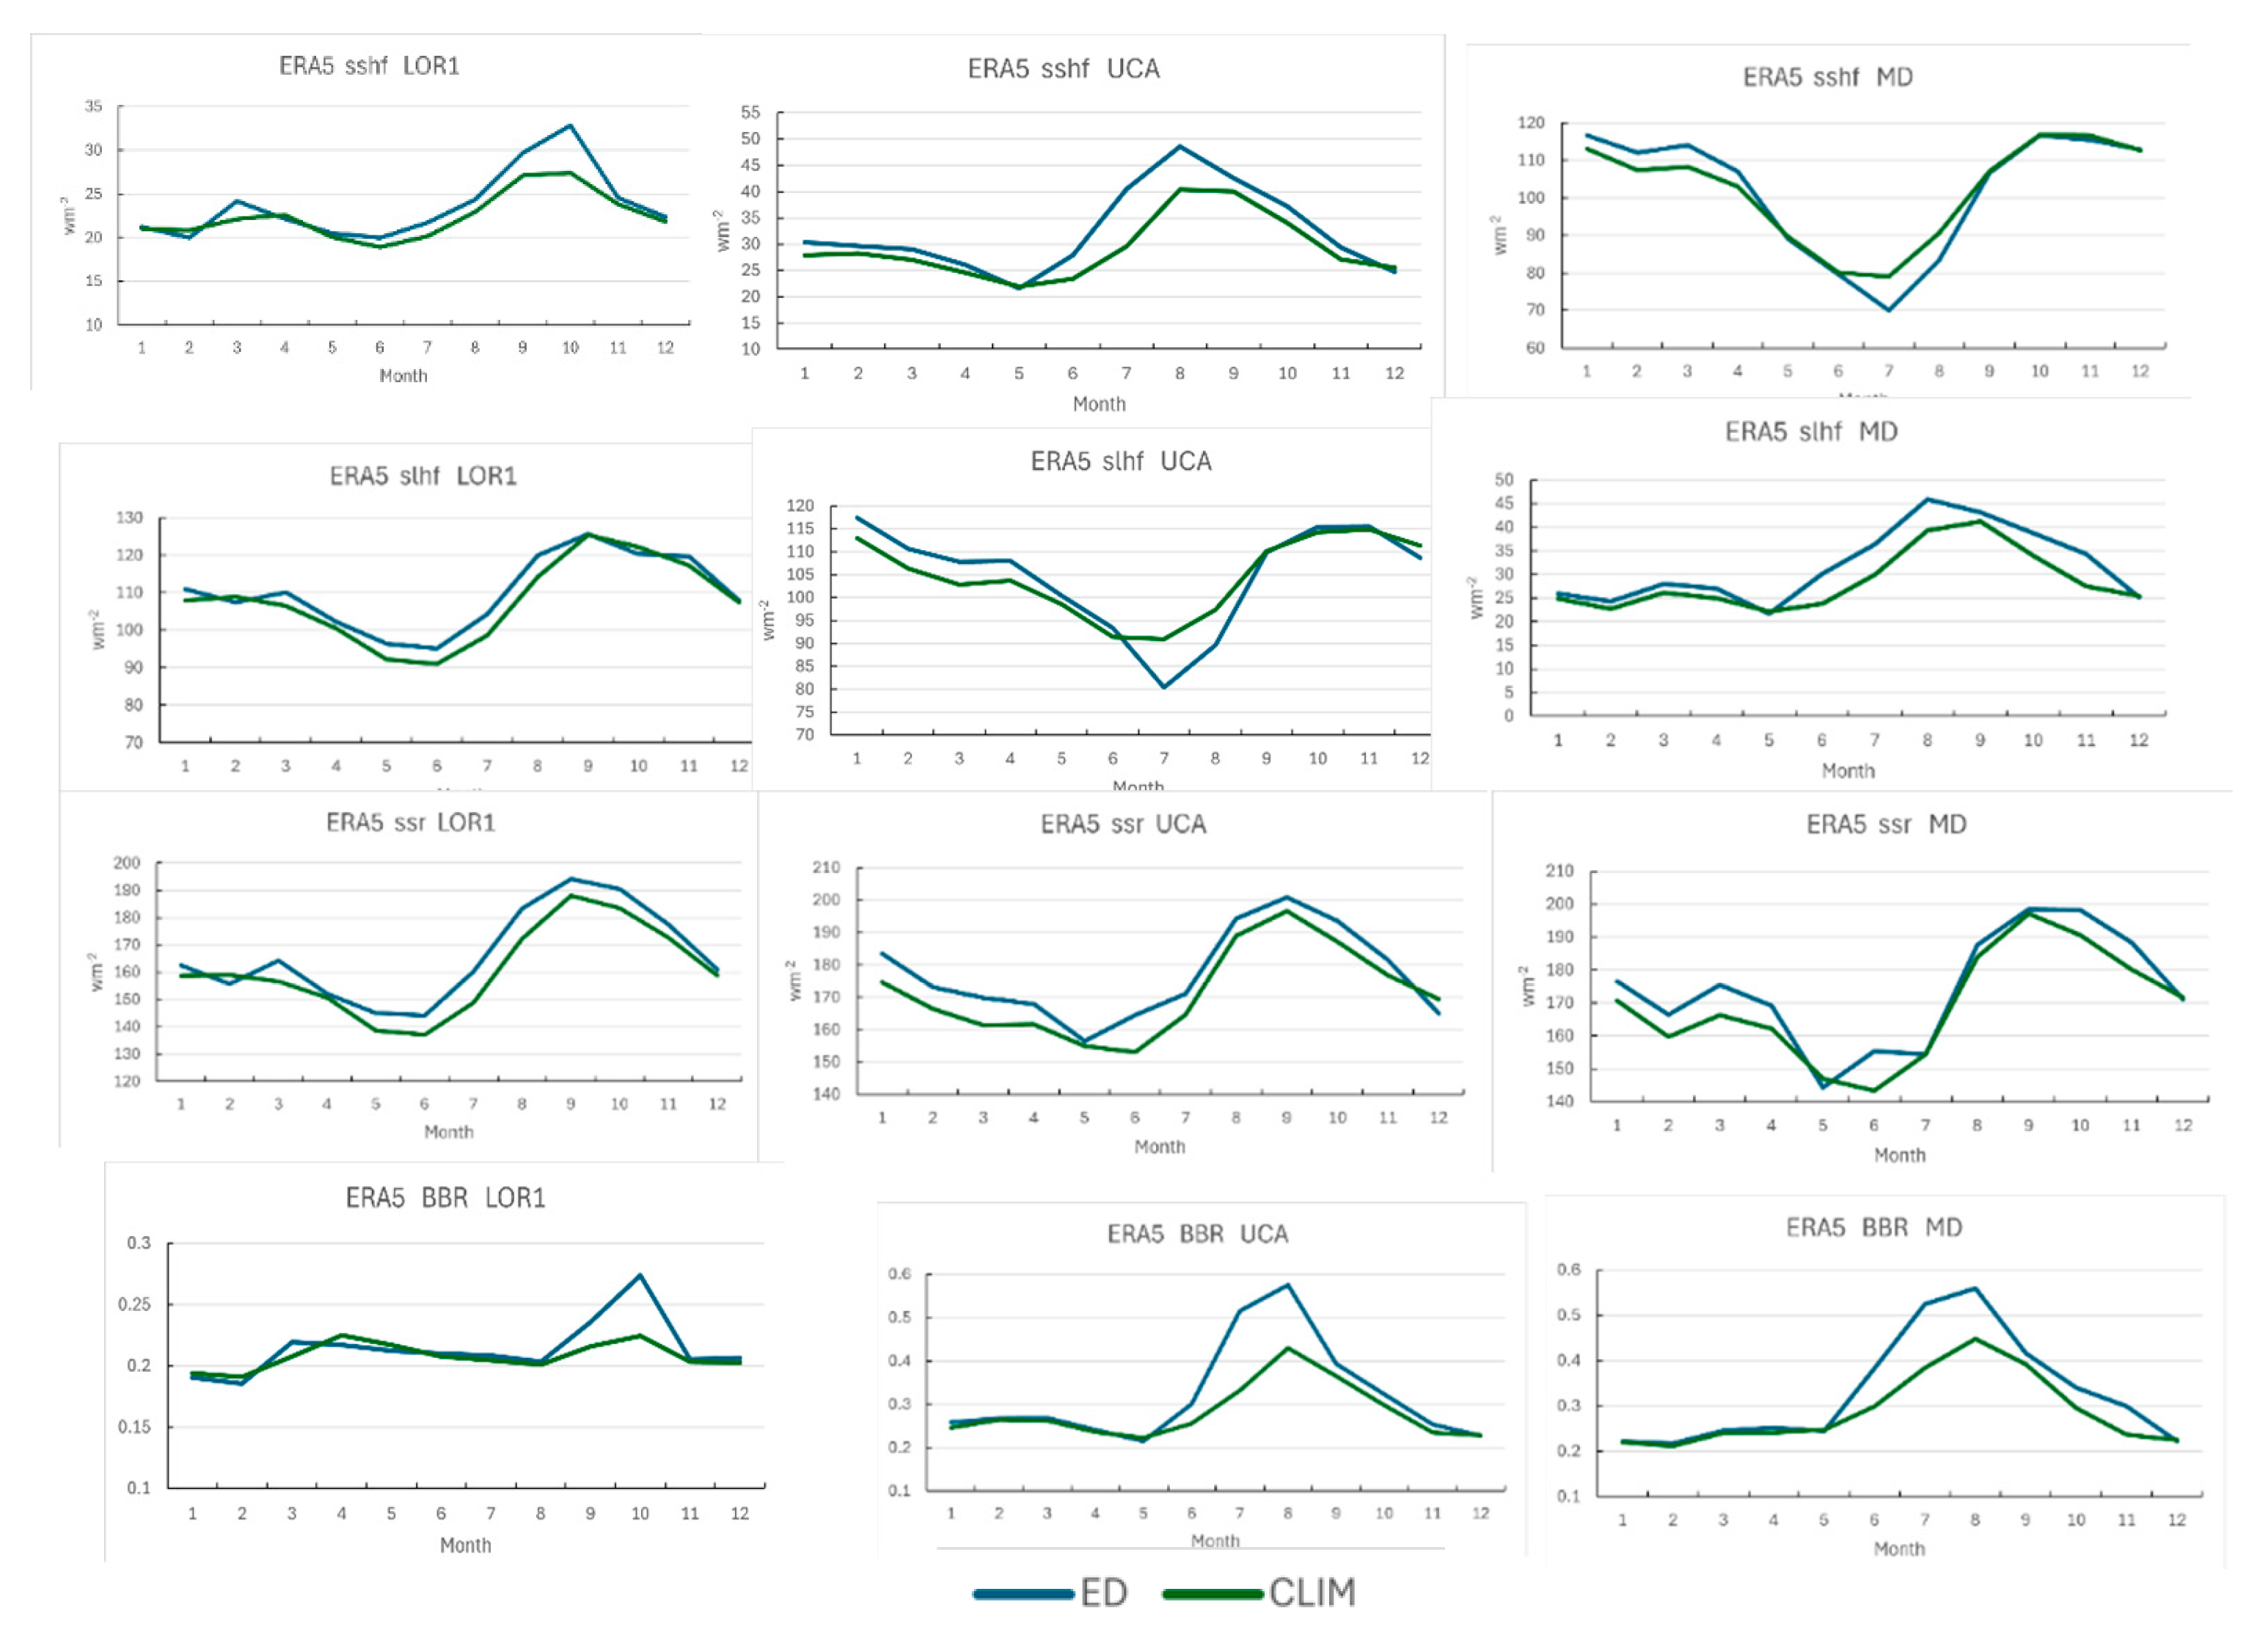
Figure 11.
Annual cycles of water deficit (WD) for the six study areas for the CHIRPS-ERA5 dataset. The right column of panels contains the WD distributions for the extreme and moderate drought hydraulic tears (HYs) and the left column contains the HYs preceding each drought HY.
Figure 11.
Annual cycles of water deficit (WD) for the six study areas for the CHIRPS-ERA5 dataset. The right column of panels contains the WD distributions for the extreme and moderate drought hydraulic tears (HYs) and the left column contains the HYs preceding each drought HY.
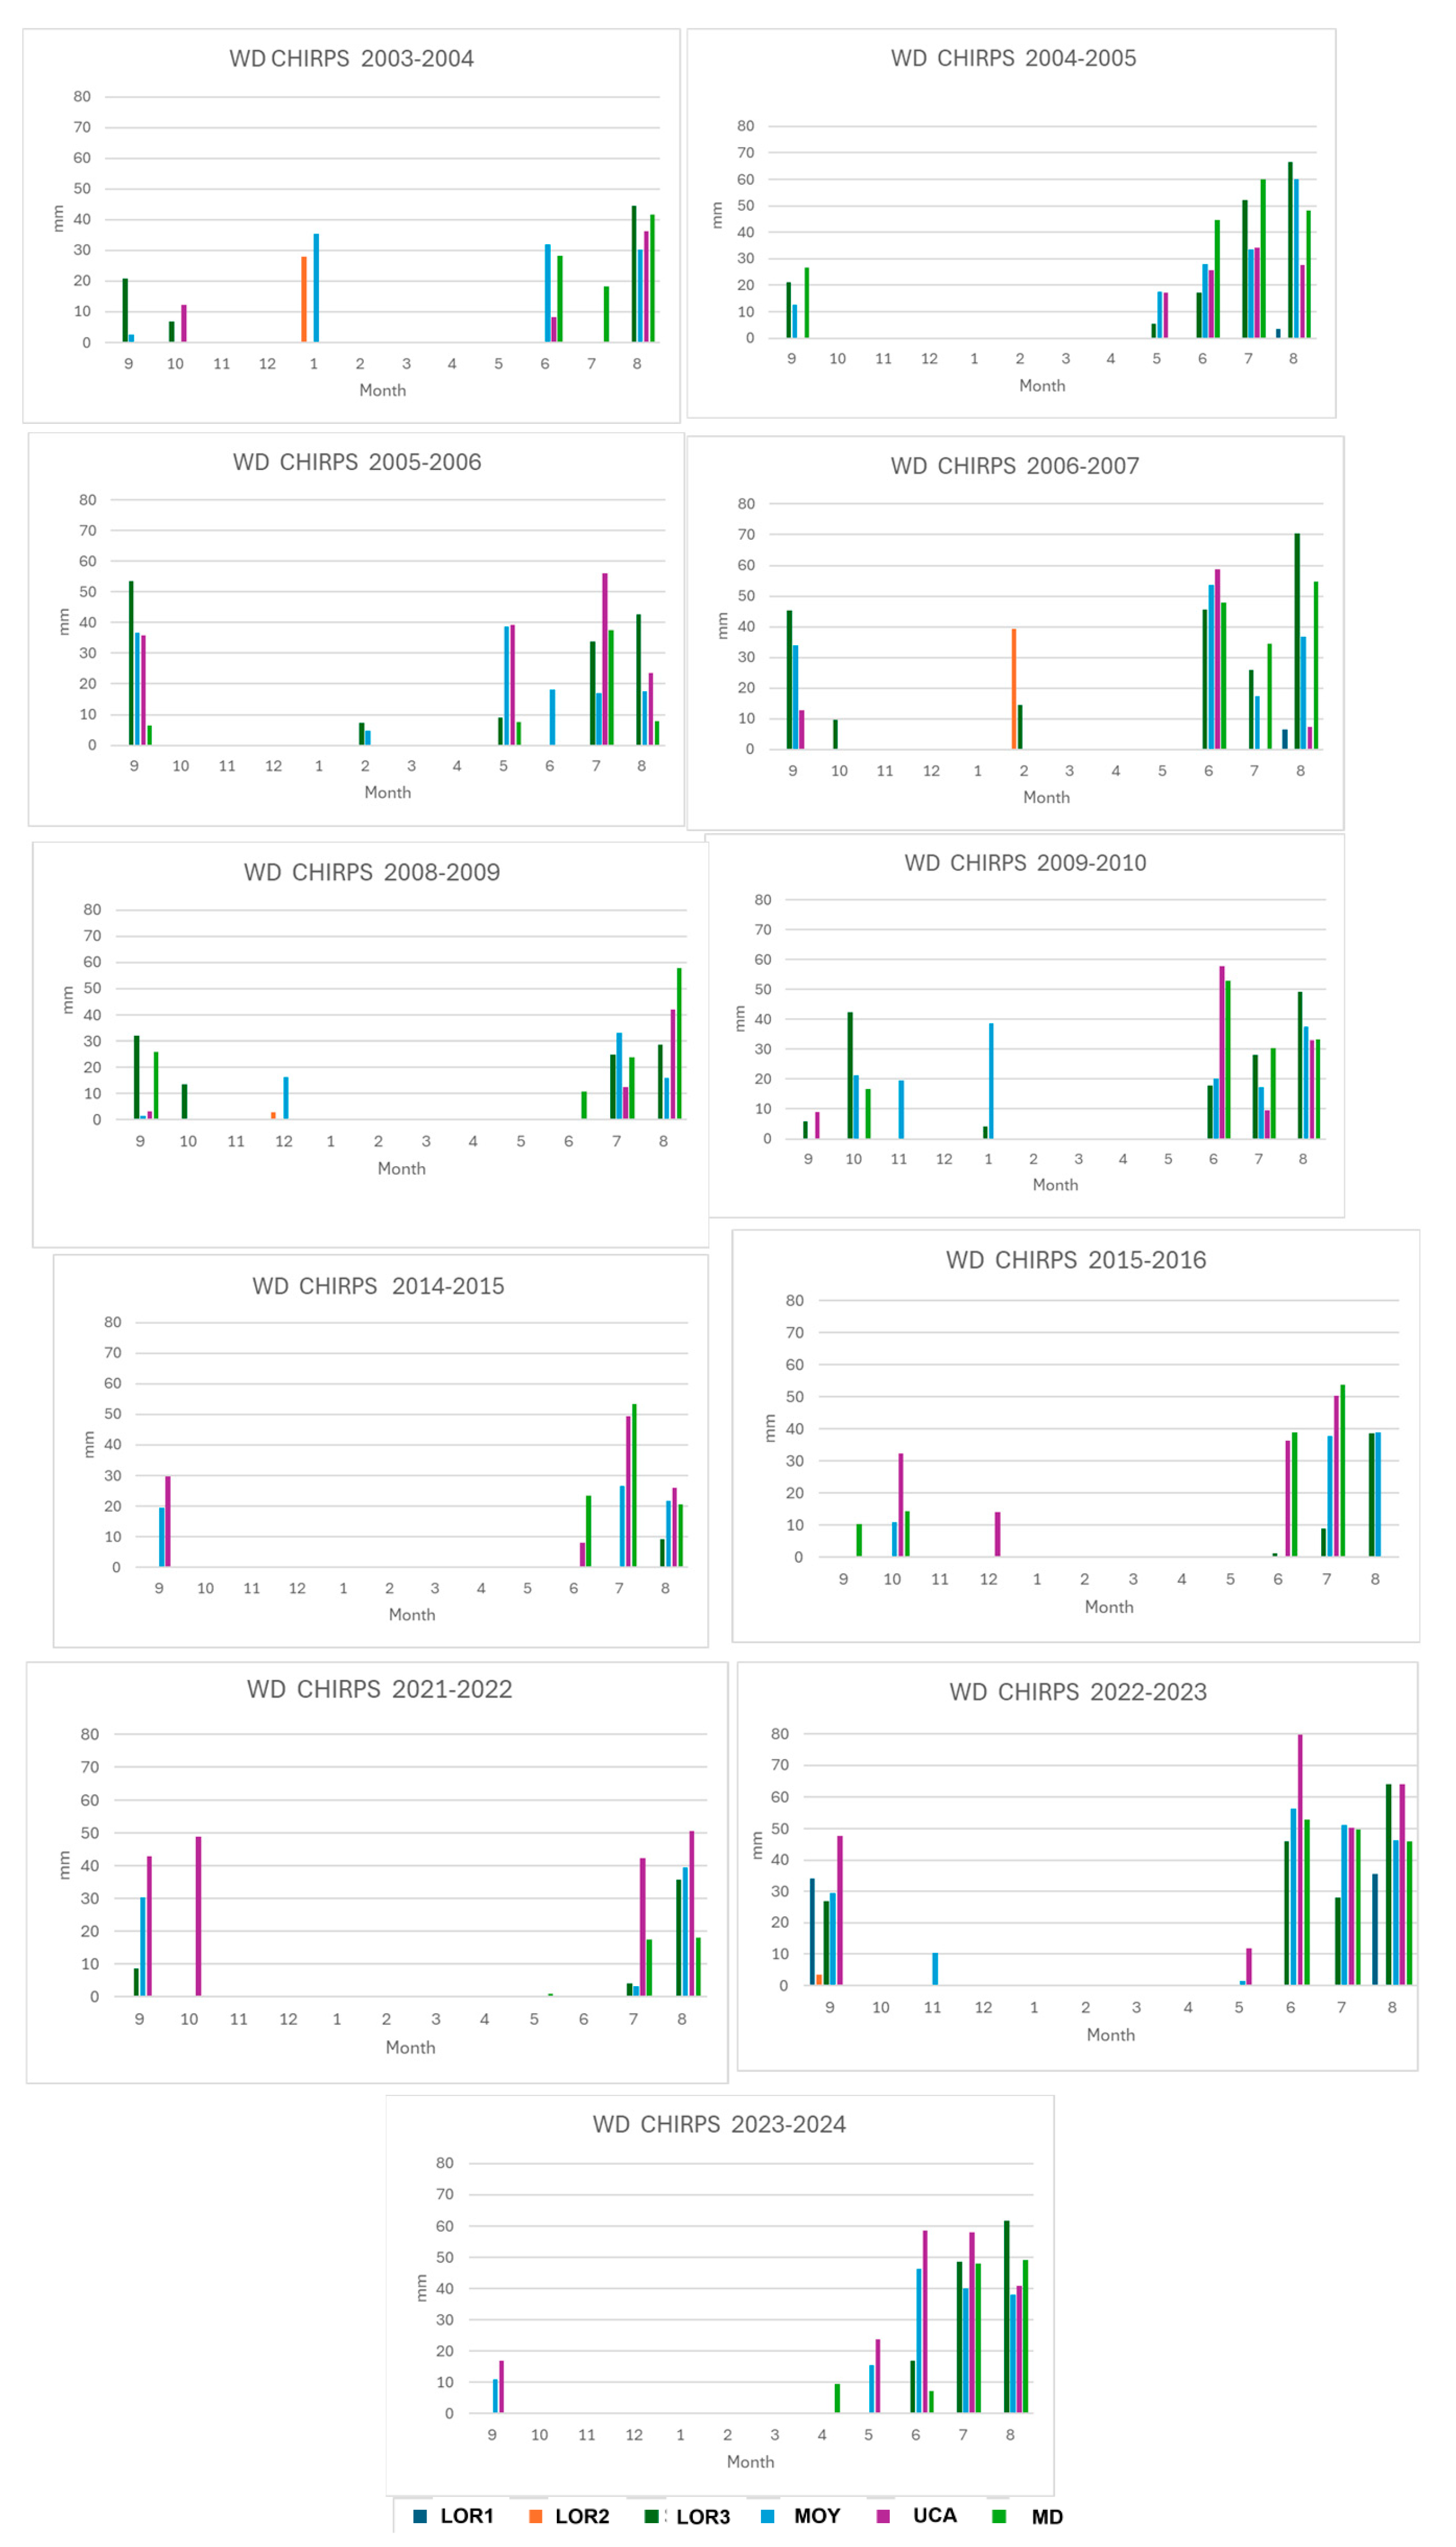
Table 2.
Coordinates and acronyms of the study areas.
| Study area | Longitude | Latitude | Approximate location | Acronym |
| 1 | 72°-70° W | 4°-2° S | Loreto Northeast | LOR1 |
| 2 | 76° – 74° W | 4°-2° S | Loreto Northwest | LOR2 |
| 3 | 75° – 73 W | 7°-5° S | Loreto South | LOR3 |
| 3 | 77° – 75° W | 7°-5° S | Moyobamba | MOY |
| 3 | 73°-75° W | 10°-8° S | Ucayali | UCA |
| 4 | 69.5°-71.5° W | 13°-11° S | Madre de Dios | MD |
Table 3.
Average MCWD across study areas for each of the datasets. Column 5 shows the average of columns 2-4, which is the average across study areas and datasets, and it the sorting criterion. The four first rows, in red characters, correspond to the years with extreme drought and the rows 5 and 6, in orange characters, correspond to moderate droughts.
| 1 | 2 | 3 | 4 | 5 |
| HY | ERA5 | MSWEP | CHIRPS | Average |
| 2023-24 | 96.0 | 116.8 | 98.2 | 103.7 |
| 2022-23 | 77.3 | 64.2 | 139.3 | 93.6 |
| 2009-10 | 70.6 | 91.5 | 90.8 | 84.3 |
| 2004-05 | 42.6 | 98.1 | 100.4 | 80.4 |
| 2006-07 | 39.6 | 82.5 | 102.5 | 74.8 |
| 2015-16 | 73.3 | 71.5 | 64.6 | 69.8 |
| 2005-06 | 42.6 | 73.4 | 82.1 | 66.0 |
| 2007-08 | 38.4 | 69.9 | 89.8 | 66.0 |
| 2010-11 | 56.4 | 61.5 | 51.8 | 56.5 |
| 2018-19 | 45.6 | 59.8 | 60.2 | 55.2 |
| 2020-21 | 56.8 | 56.6 | 48.0 | 53.8 |
| 2016-17 | 43.9 | 58.8 | 52.8 | 51.9 |
| 2003-04 | 53.7 | 40.6 | 57.5 | 50.6 |
| 2011-12 | 40.0 | 54.4 | 56.8 | 50.4 |
| 2000-01 | 34.5 | 43.9 | 72.4 | 50.2 |
| 2002-03 | 8.9 | 42.3 | 77.2 | 42.8 |
| 2019-20 | 43.8 | 46.5 | 33.1 | 41.1 |
| 2001-02 | 27.2 | 31.2 | 49.7 | 36.0 |
| 2021-22 | 17.6 | 23.0 | 57.3 | 32.6 |
| 2008-09 | 13.4 | 24.7 | 57.6 | 31.9 |
| 2014-15 | 21.2 | 22.2 | 47.9 | 30.4 |
| 2013-14 | 14.1 | 28.6 | 47.8 | 30.2 |
| 2012-13 | 14.4 | 19.3 | 30.9 | 21.5 |
| 2017-18 | 10.8 | 16.1 | 25.4 | 17.4 |
Disclaimer/Publisher’s Note: The statements, opinions and data contained in all publications are solely those of the individual author(s) and contributor(s) and not of MDPI and/or the editor(s). MDPI and/or the editor(s) disclaim responsibility for any injury to people or property resulting from any ideas, methods, instructions or products referred to in the content. |
© 2025 by the authors. Licensee MDPI, Basel, Switzerland. This article is an open access article distributed under the terms and conditions of the Creative Commons Attribution (CC BY) license (http://creativecommons.org/licenses/by/4.0/).
Copyright: This open access article is published under a Creative Commons CC BY 4.0 license, which permit the free download, distribution, and reuse, provided that the author and preprint are cited in any reuse.


