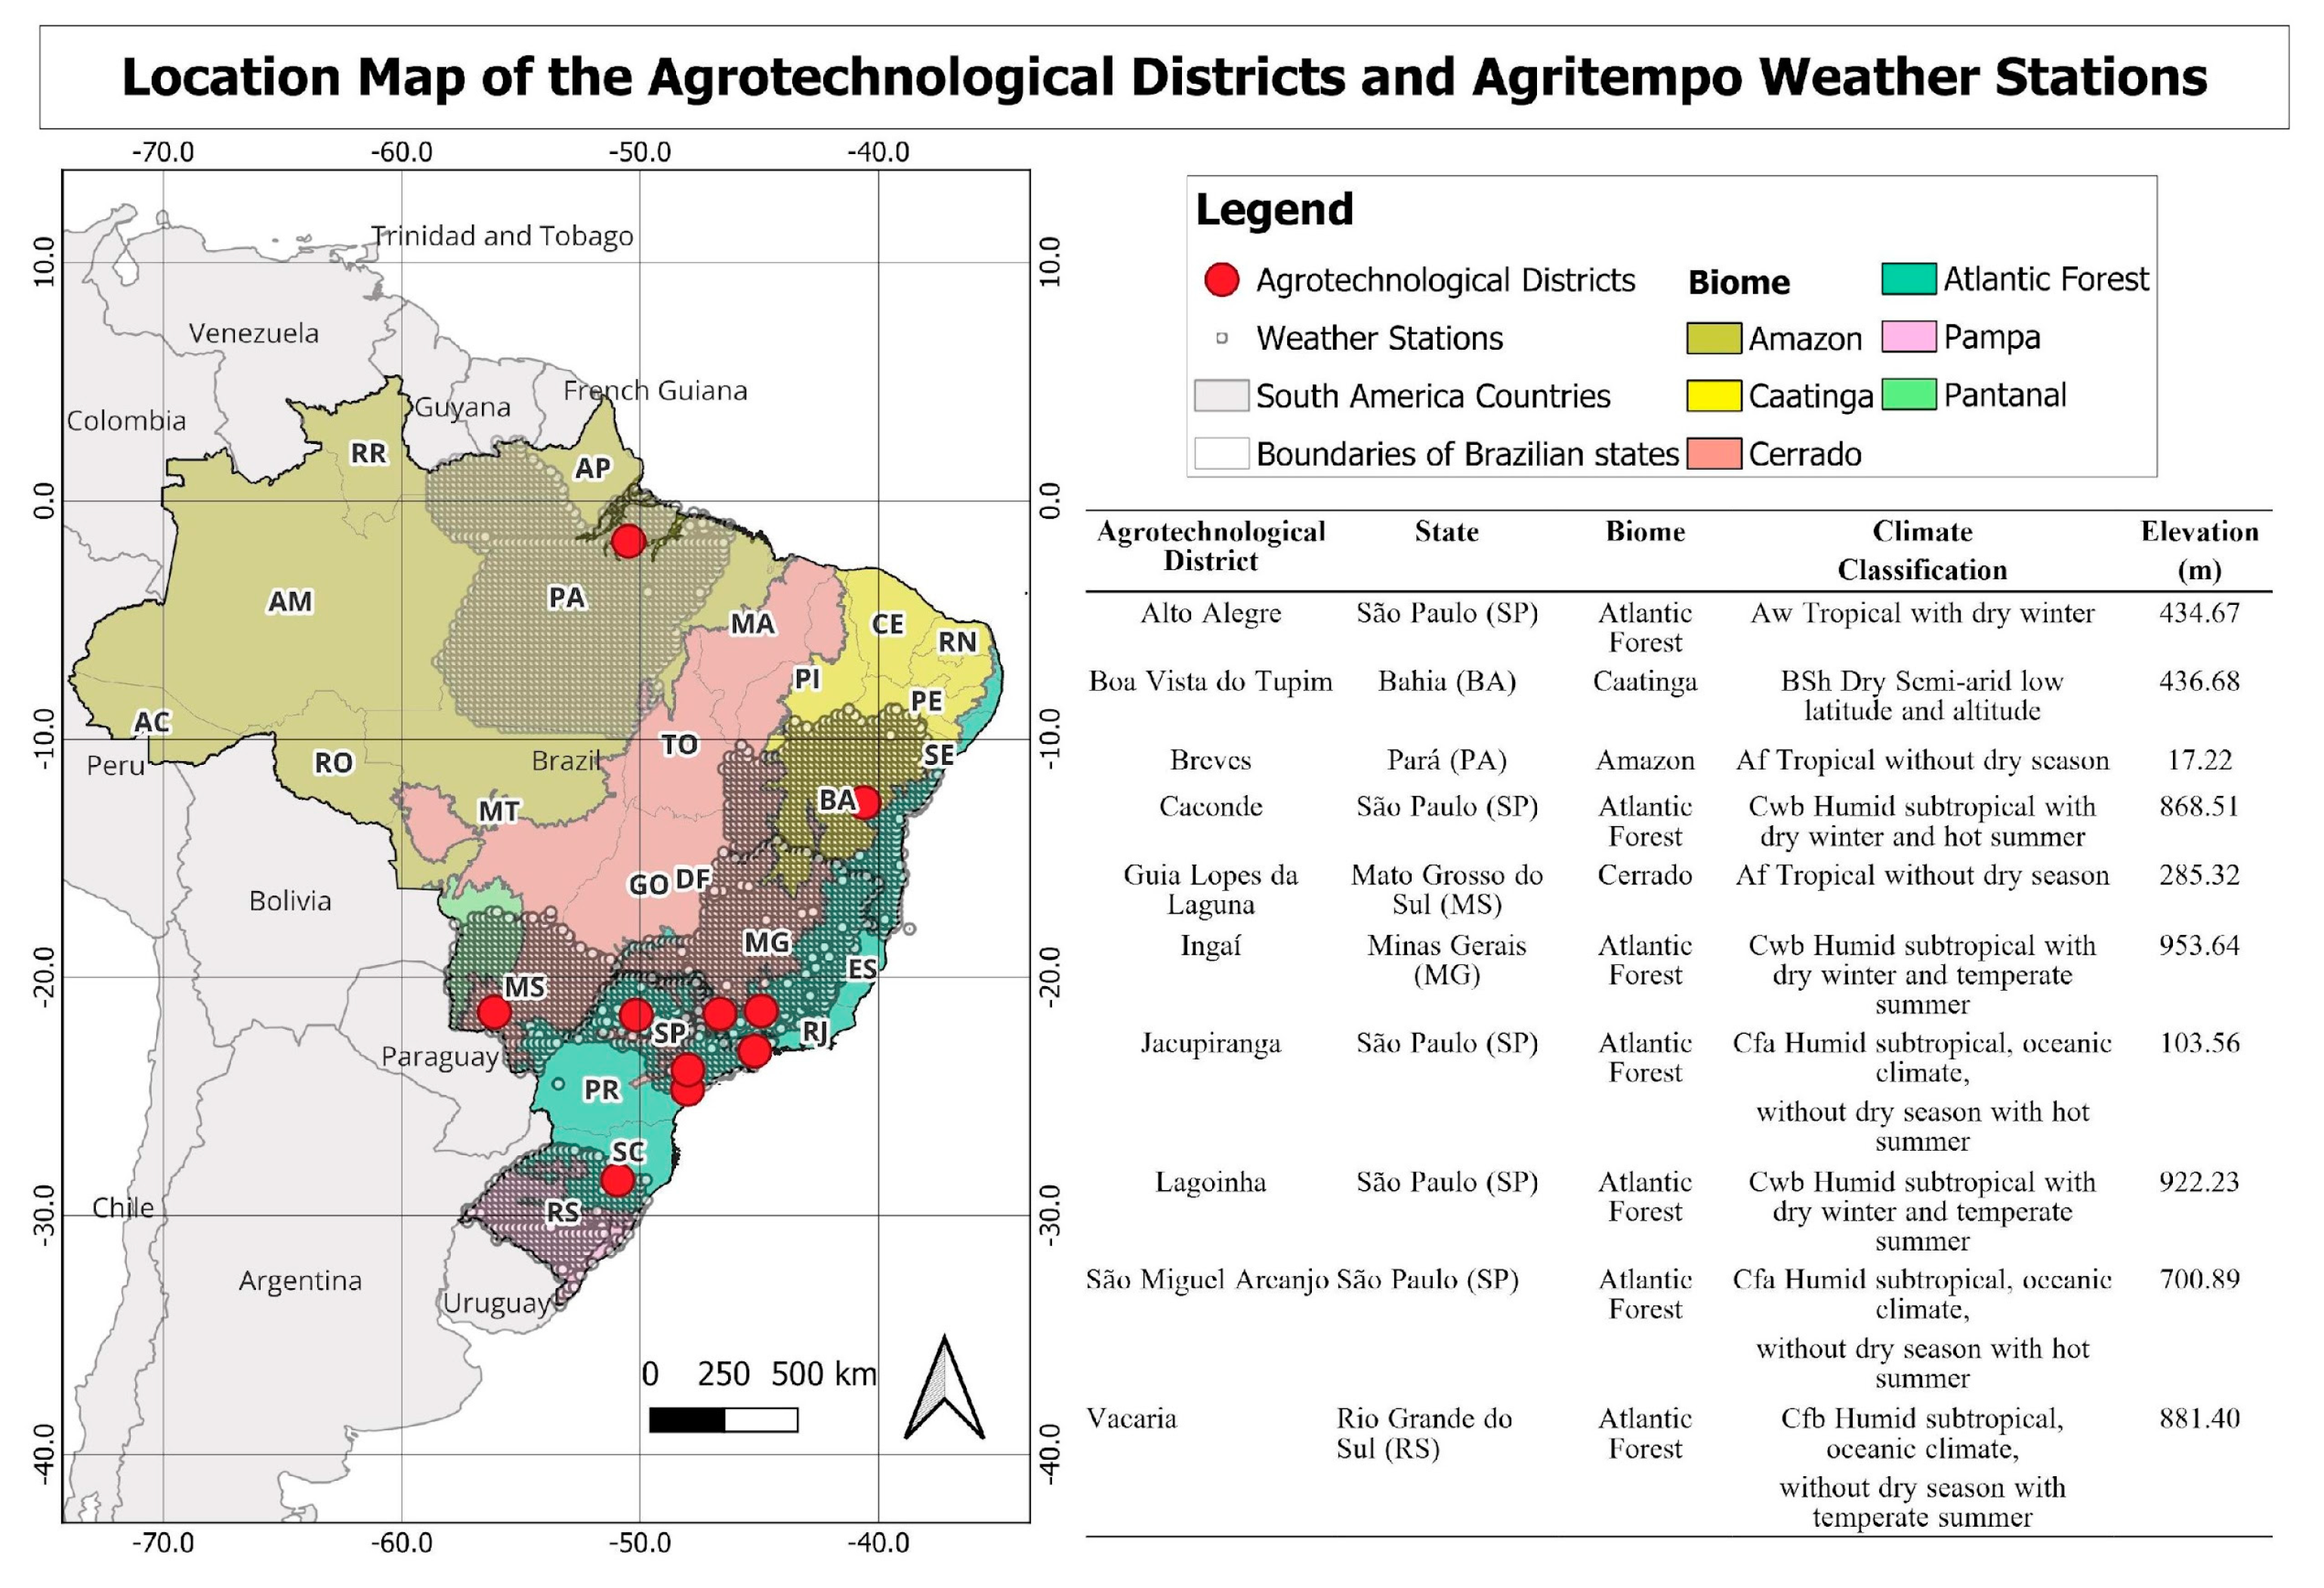
3. Results
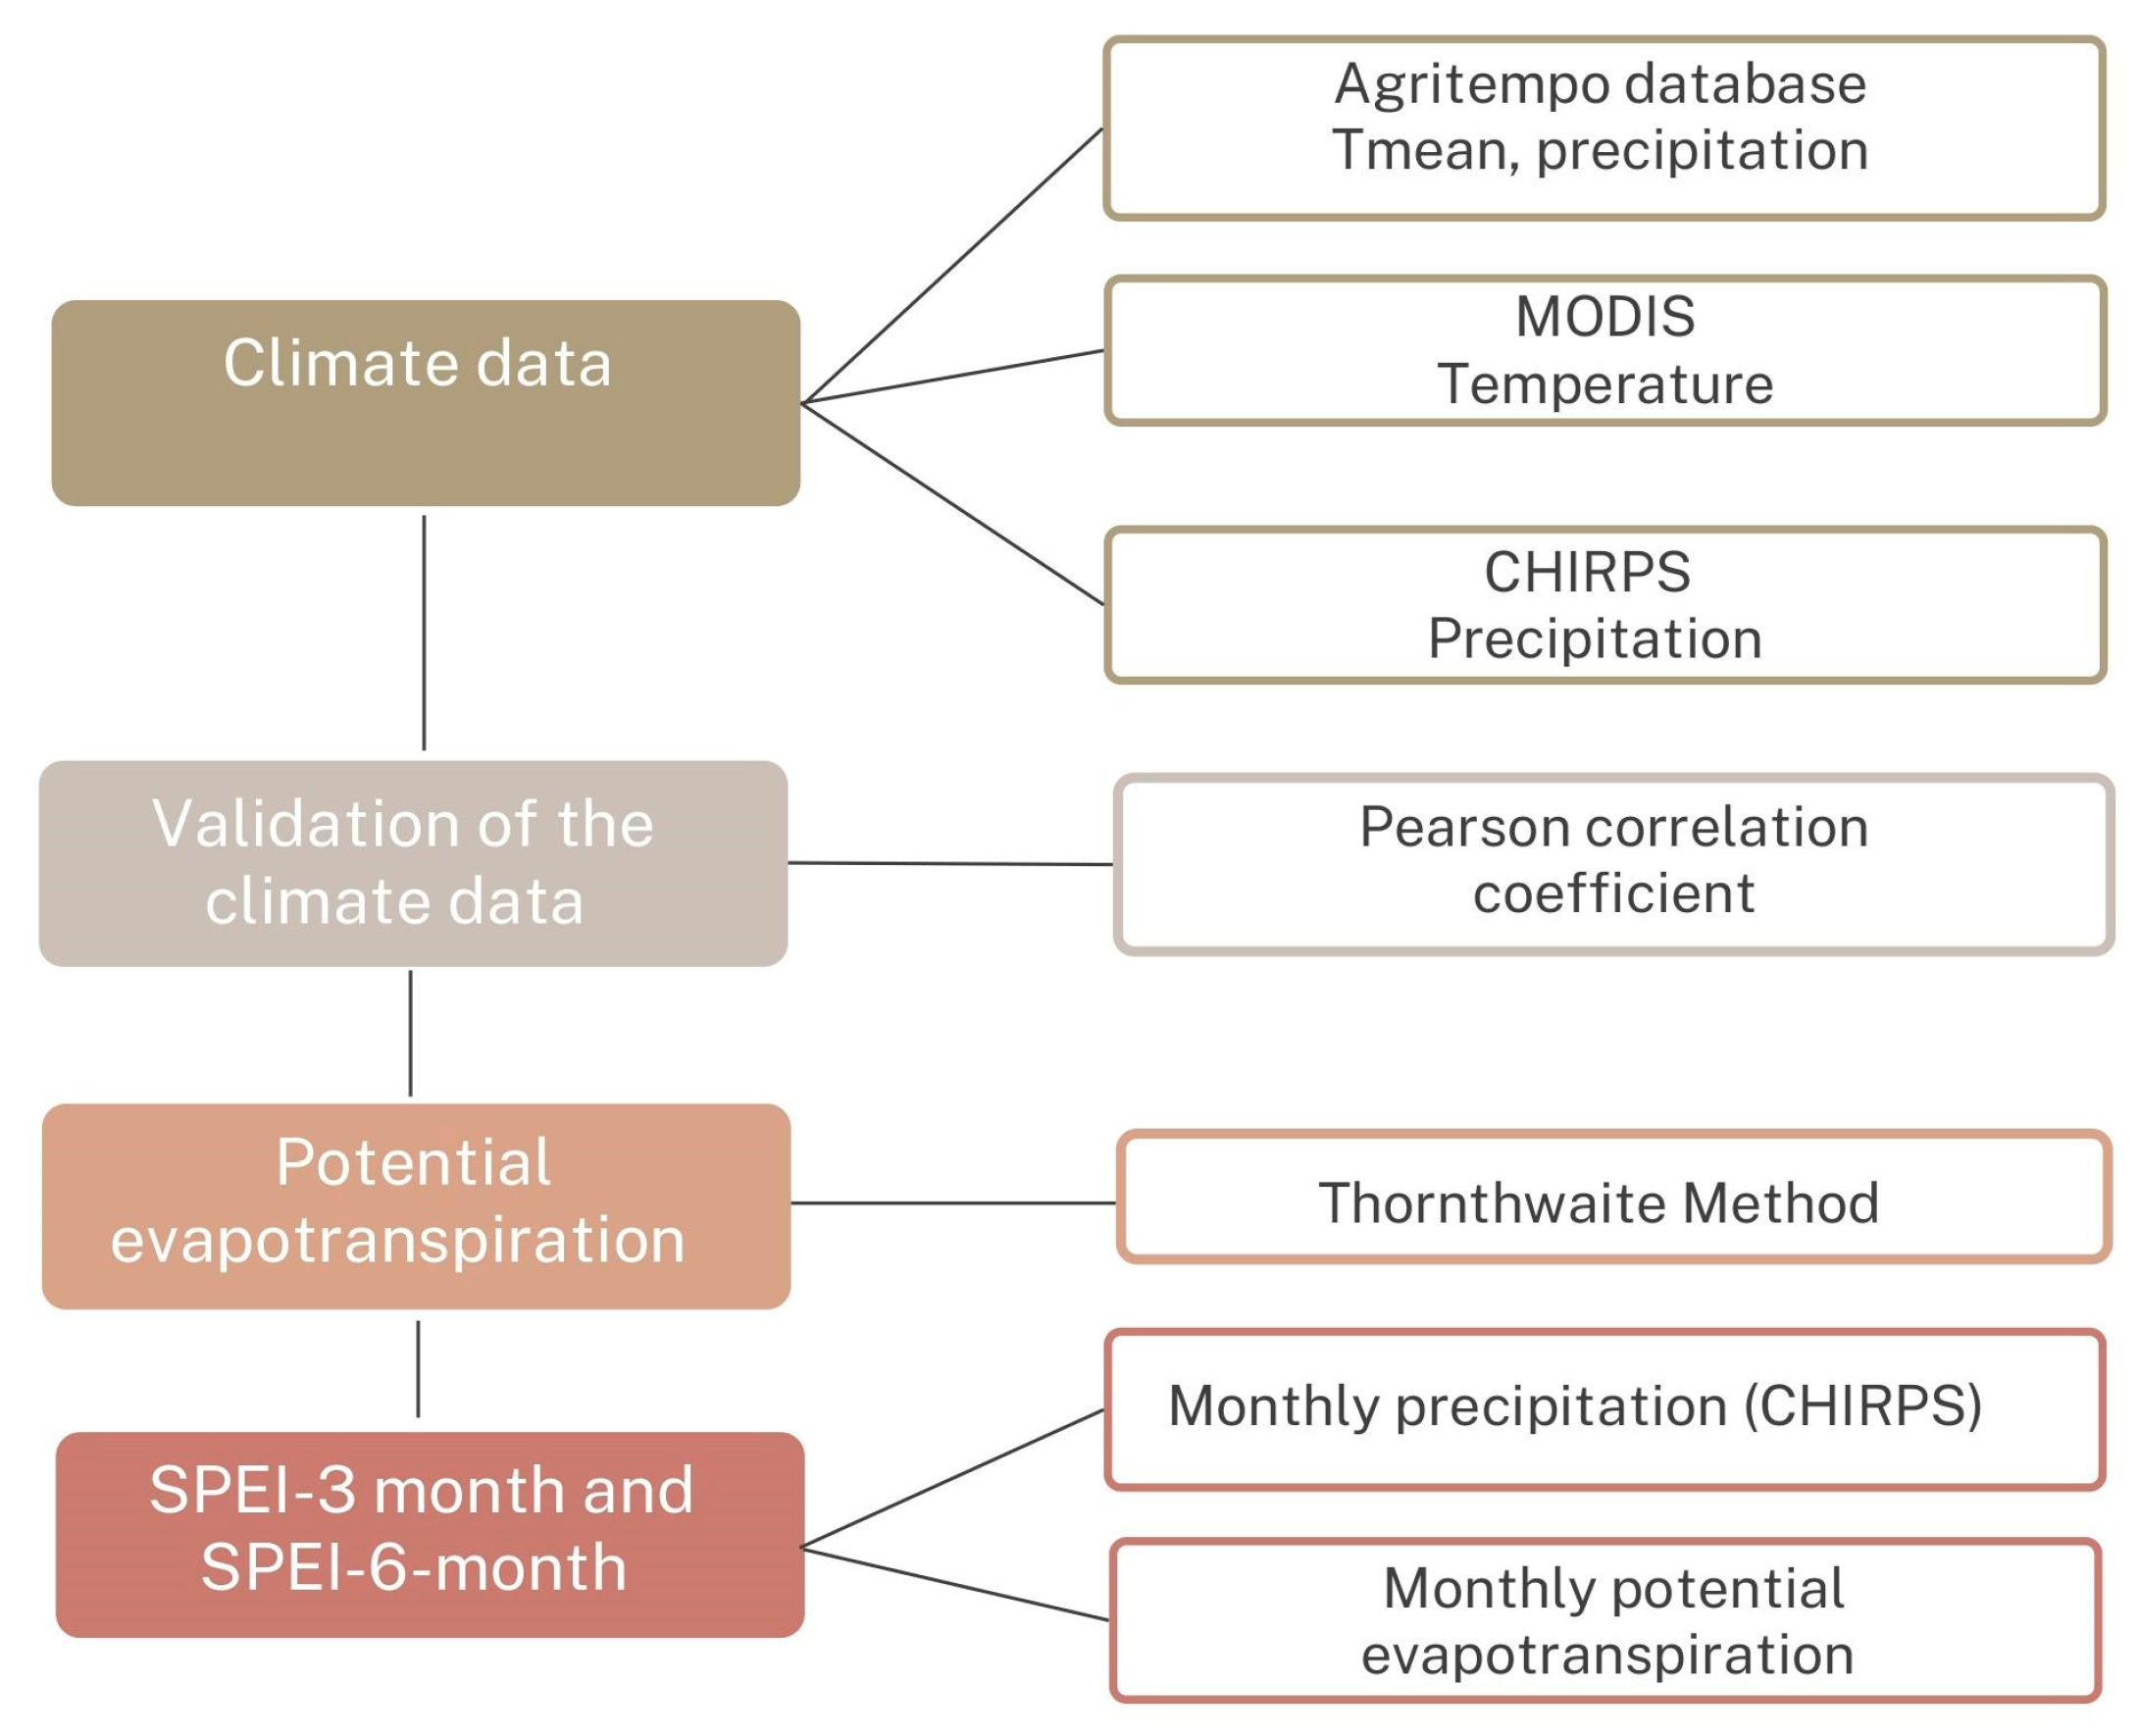
3.1. Validation of Climate Data Derived from Remote Sensing
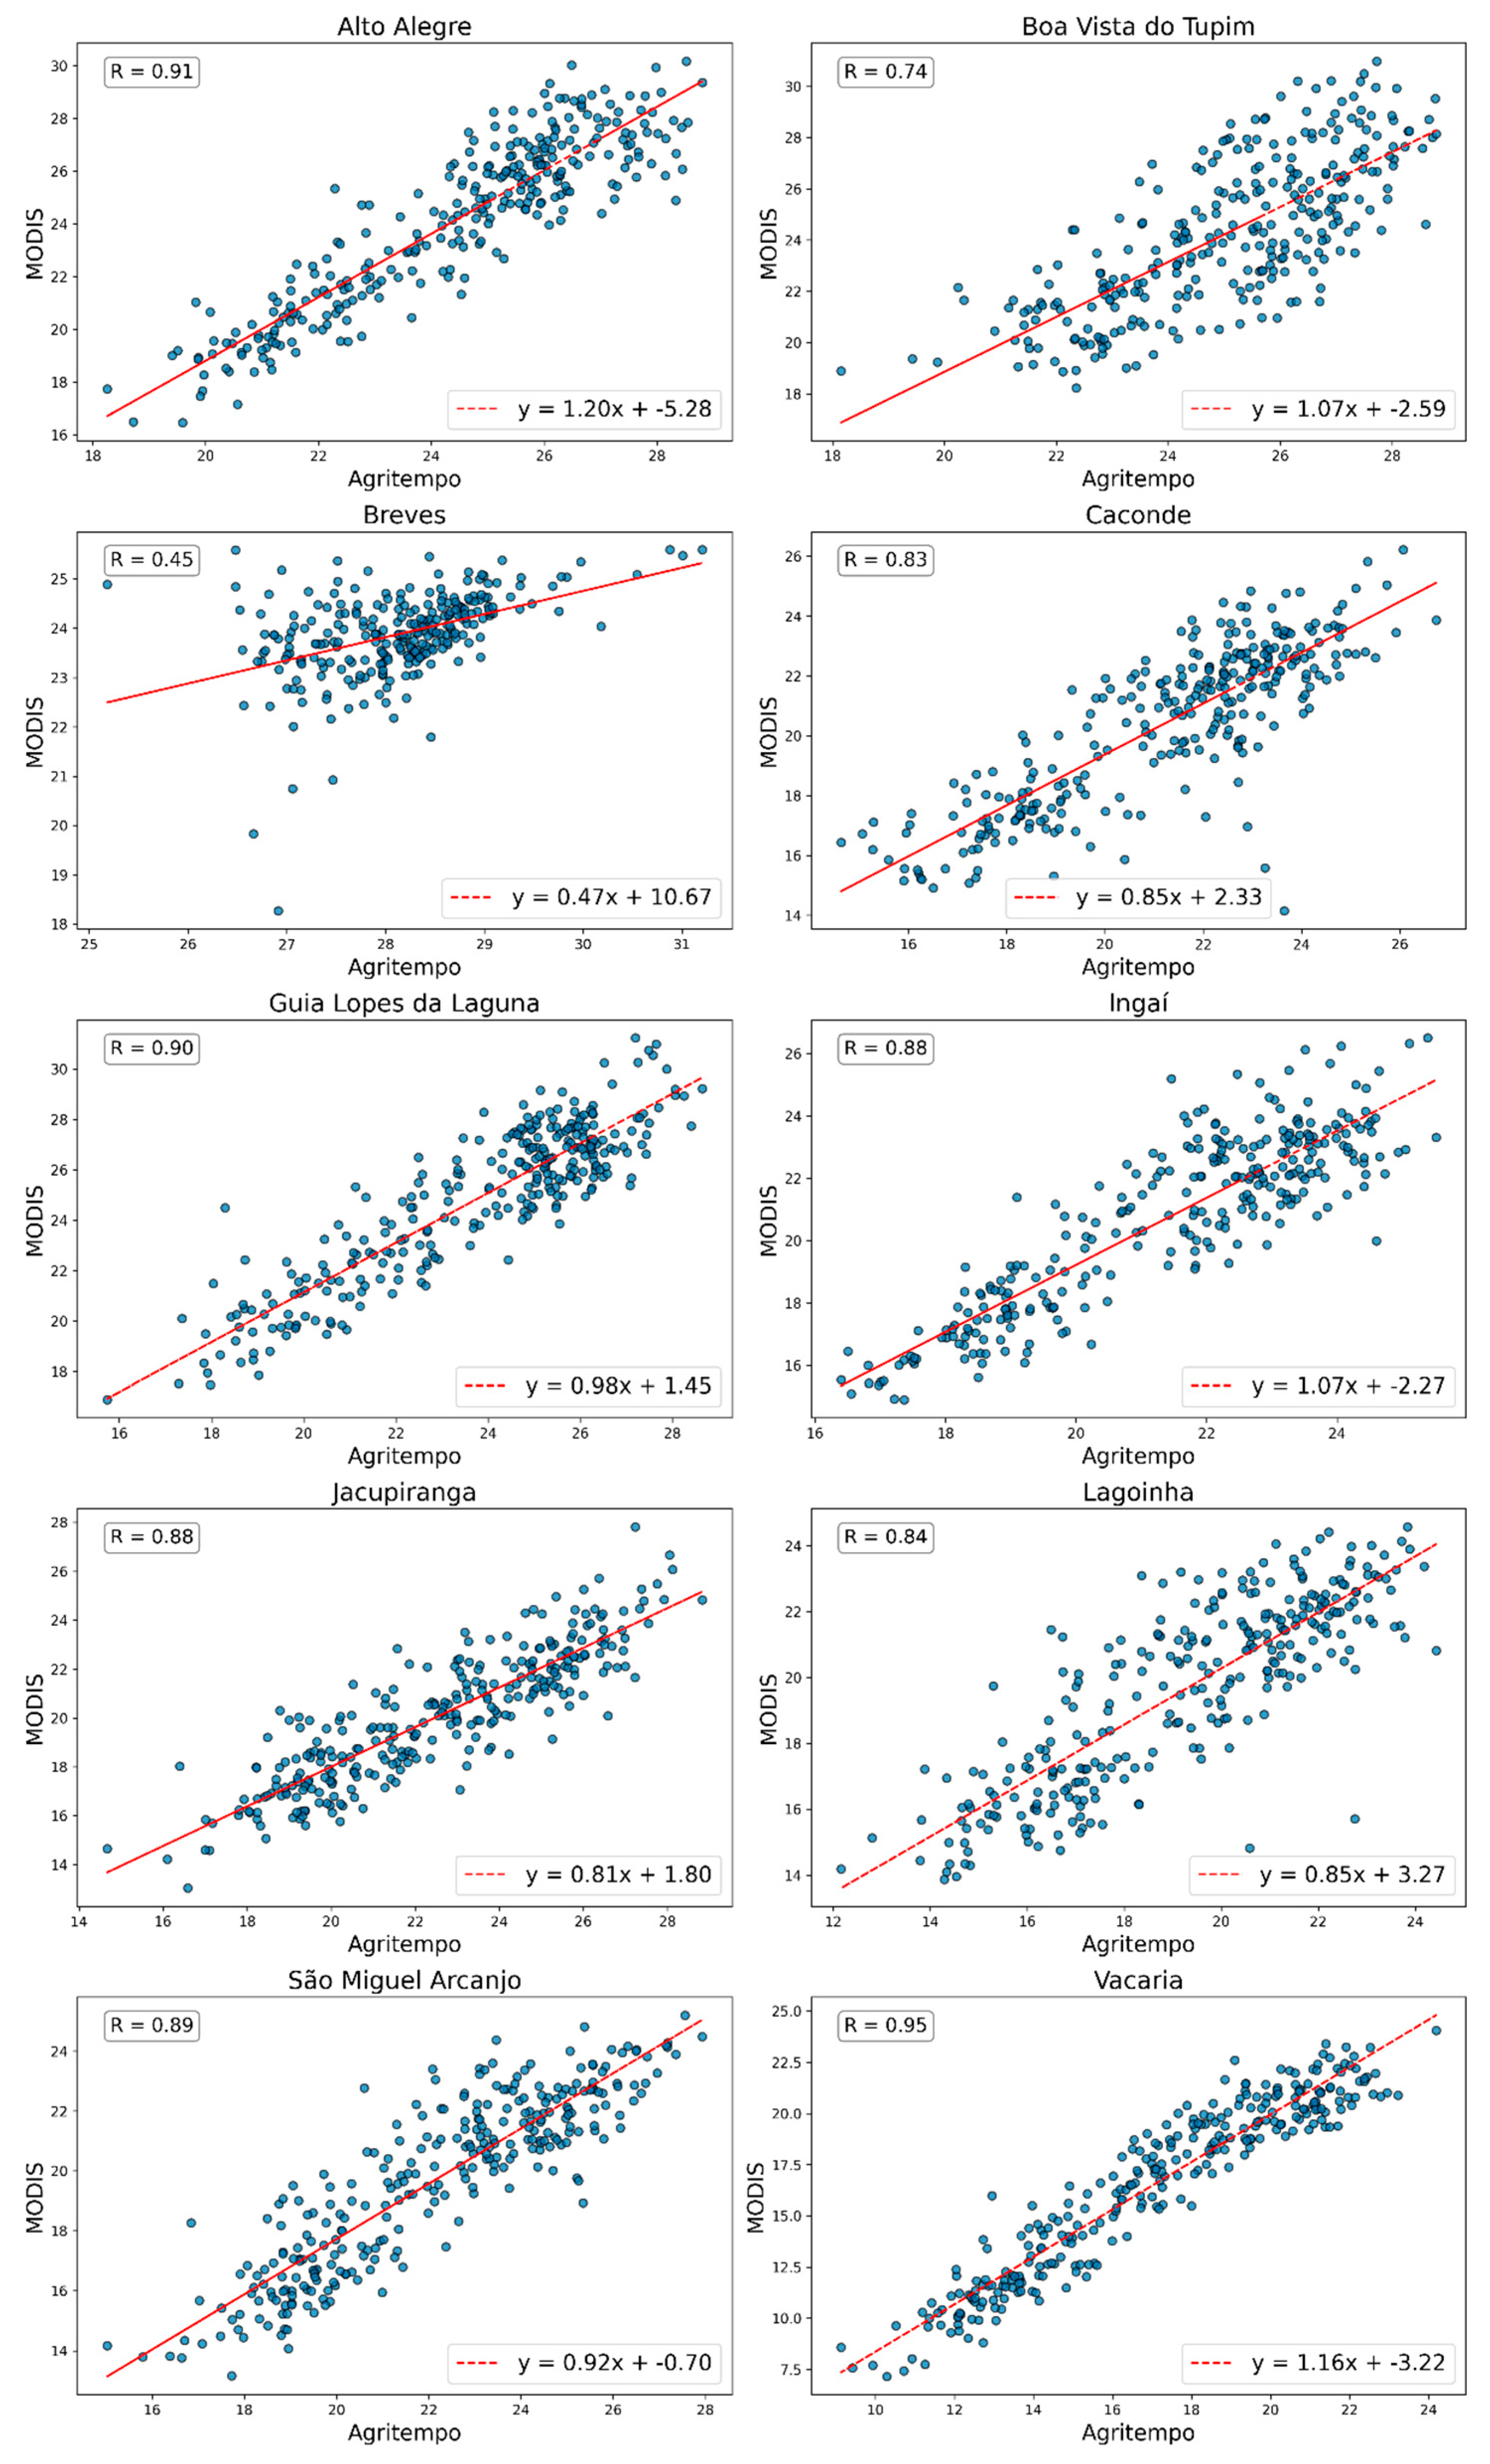
Figure 3 and
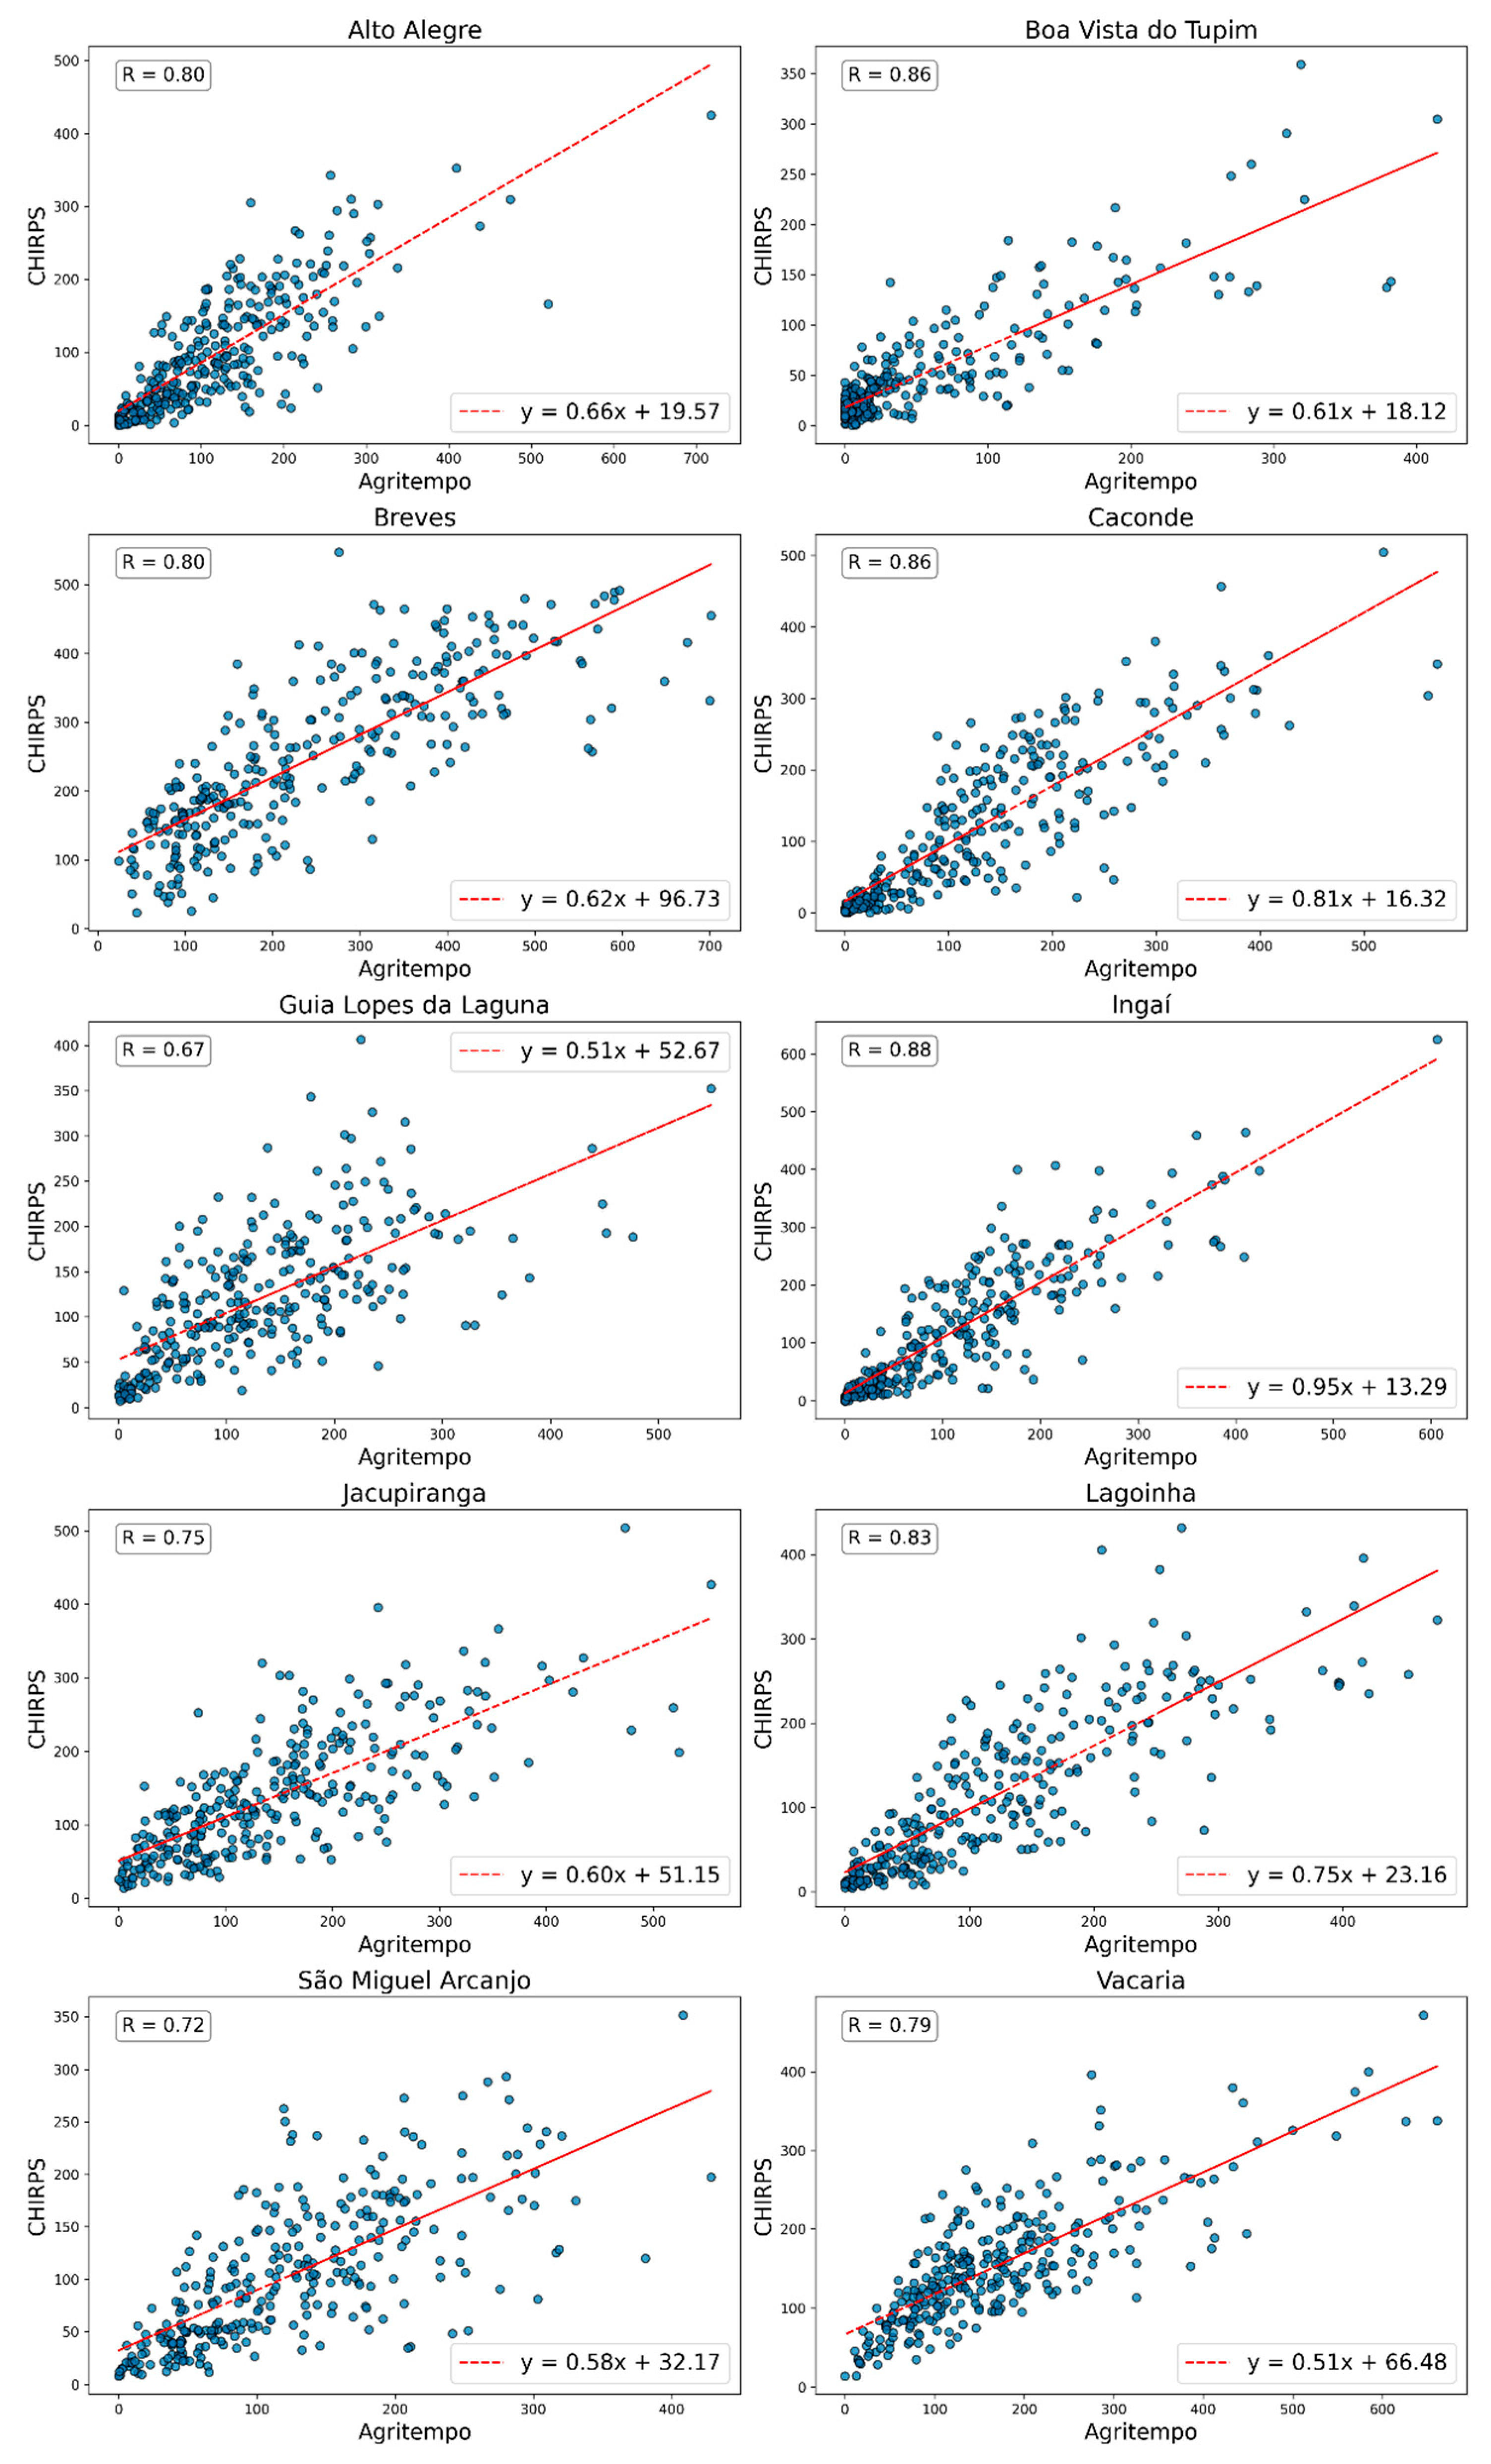
Figure 4 present the correlation between temperature data from MODIS and Agritempo, and precipitation data from CHIRPS and Agritempo, respectively.
The temperature data from MODIS showed strong agreement with the temperature data from Agritempo, with Pearson correlation coefficients ranging from 0.83 to 0.95 for the Alto Alegre, Caconde, Guia Lopes da Laguna, Ingaí, Jacupiranga, Lagoinha, São Miguel Arcanjo, and Vacaria DATs. The lowest coefficient was observed for Breves (0.45), followed by Boa Vista do Tupim (0.74) (
Figure 3).
Similarly, the precipitation data from CHIRPS demonstrated strong agreement with the precipitation data from Agritempo. The Pearson correlation coefficients ranged from 0.75 to 0.88 for the Alto Alegre, Boa Vista do Tupim, Breves, Caconde, Ingaí, Jacupiranga, Lagoinha, and Vacaria DATs. The Guia Lopes da Laguna and São Miguel Arcanjo DATs presented coefficients closest to 0.7 (
Figure 4).
3.2. Climate
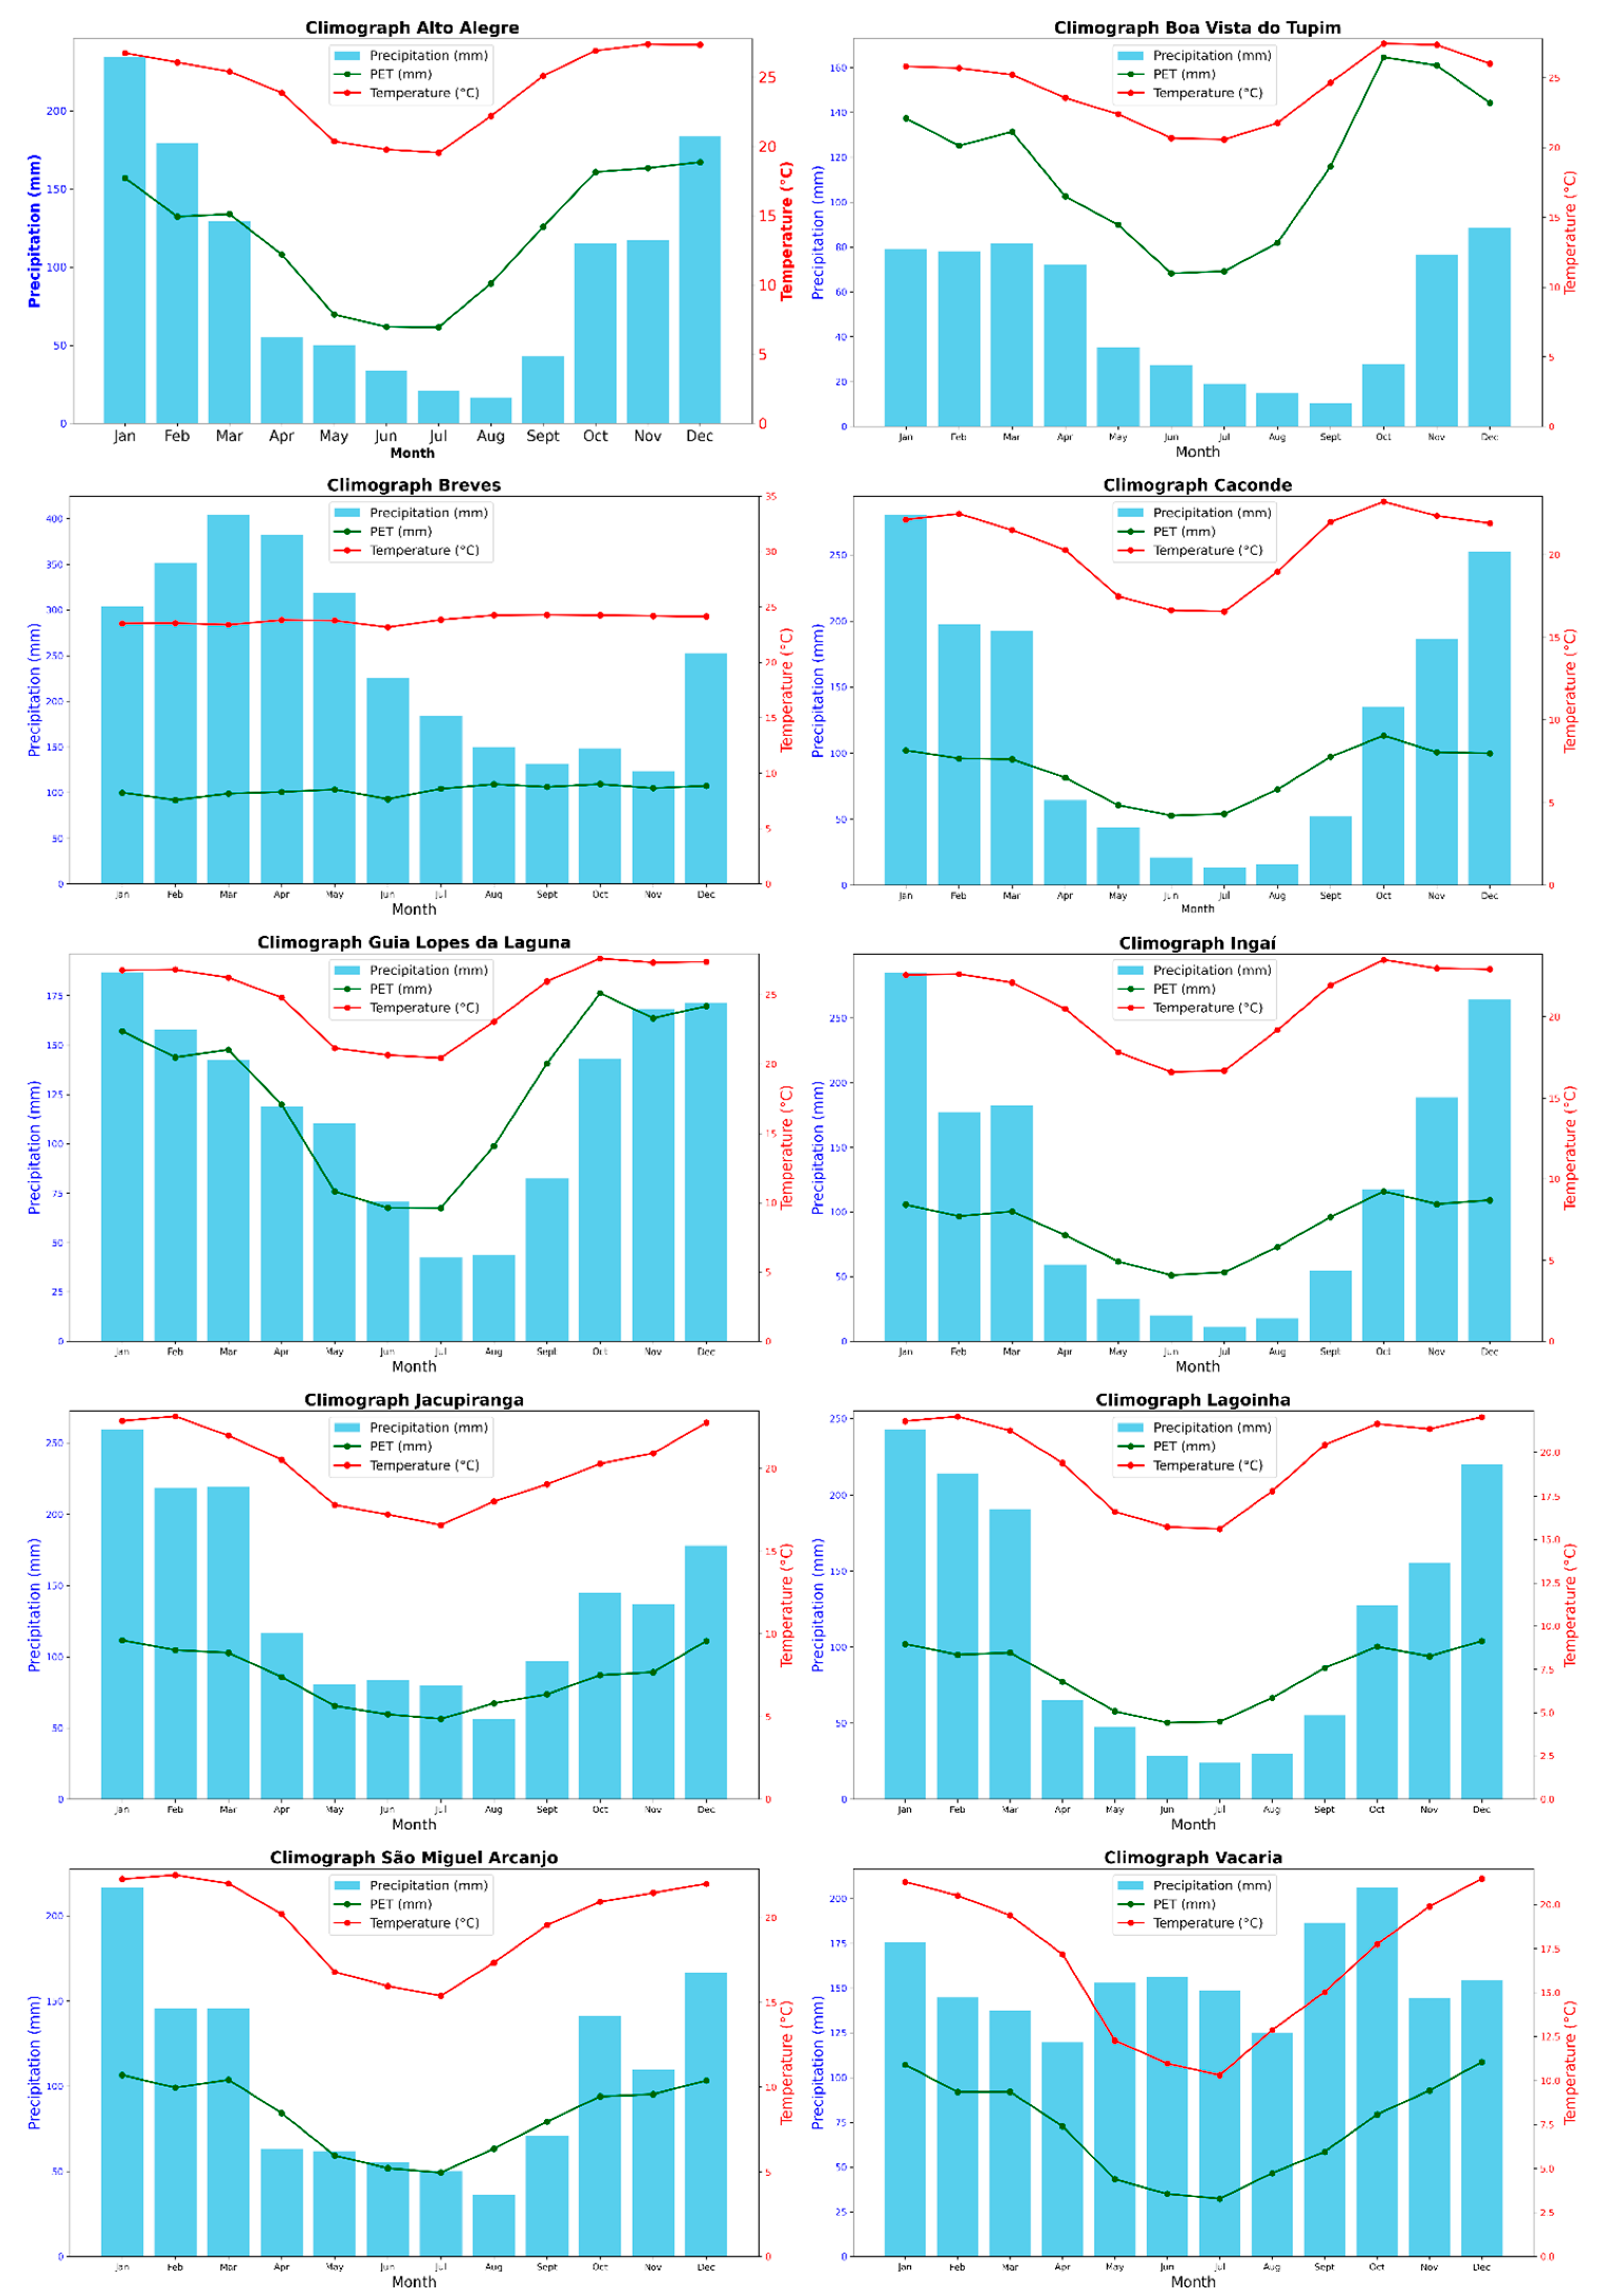
The mean monthly temperature, precipitation, and potential evapotranspiration for the Agrotechnological Districts are shown in
Figure 5.
The Alto Alegre Agrotechnological District, which has an Aw climate (tropical climate with a dry winter), experiences a rainy season from October to March, with mean monthly precipitation ranging from approximately 115 mm in October to 234 mm in January. The dry season occurs between April and September, with precipitation varying from approximately 17 mm in August to 55 mm in April. During the rainy season, temperatures are high, oscillating between 25.4 °C in March and 27.4 °C in November. The lowest temperatures occur in June (19.8 °C) and July (19.5 °C). The highest values of mean monthly potential evapotranspiration are observed between November and January, varying from 157 mm in January to 167.2 mm in December.
The Boa Vista do Tupim Agrotechnological District is characterized by a BSh climate (dry semi-arid low latitude and altitude climate). The rainy season spans November to April, with mean monthly precipitation peaking at 72.2 mm in April. The dry season encompasses May to October, with precipitation ranging from 10.3 mm in September to 35.4 mm in May. Both temperature and potential evapotranspiration are high, with the highest values observed in October (27.4 °C and 164.6 mm, respectively) and the lowest in June (20.6 °C and 69.3 mm, respectively).
The Breves and Guia Lopes da Laguna DATs, both classified as Af climate (tropical climate without a dry season), exhibit differences in precipitation, potential evapotranspiration, and temperature intervals. In Guia Lopes da Laguna, located in the Cerrado biome, the highest precipitation occurs from October to May, ranging from 110.4 mm in May to 186.9 mm in January. The lowest precipitation is recorded between June and September, varying from 42.3 mm in July to 82.4 mm in September. Minimum values of temperature and potential evapotranspiration occur between May and July, ranging from 20.4 °C in July to 21.1 °C in May, and from 67.5 mm to 75.8 mm, respectively. Maximum values occur between October and April, with temperatures ranging from 23.1 °C in August to 27.6 °C in October and potential evapotranspiration oscillating between 98.8 mm (August) and 176.22 mm (October).
Conversely, in Breves, located in the Amazon biome, the highest precipitation occurs between December and May, with values ranging from 252.4 mm in December to 404.3 mm in March. The lowest precipitation is recorded between June and November, varying from 123.6 mm in November to 225.9 mm in June. Both potential evapotranspiration and temperature show less variation, remaining within intervals of 92–109 mm and 23–24 °C, respectively.
The Caconde, Ingaí, Jacupiranga, Lagoinha, São Miguel Arcanjo, and Vacaria DATs are characterized by a humid subtropical climate and are located in the Atlantic Forest biome. With the exception of Vacaria, these districts experience six months of rainy season (October to March) and six months of dry season (April to September). The lowest temperature and potential evapotranspiration values in these districts occur between May and July. Excluding Vacaria, temperatures range from approximately 16 °C to 23 °C, and potential evapotranspiration values vary from 50 mm to 115 mm.
In the Vacaria Agrotechnological District, precipitation is well-distributed throughout the year, with a brief period of low precipitation (below 100 mm) between June and September. Temperature and potential evapotranspiration vary from 10.3 °C in July to 21.5 °C in December, and from 32.3 mm in July to 108.6 mm in December, respectively.
3.3. SPEI-3 Months
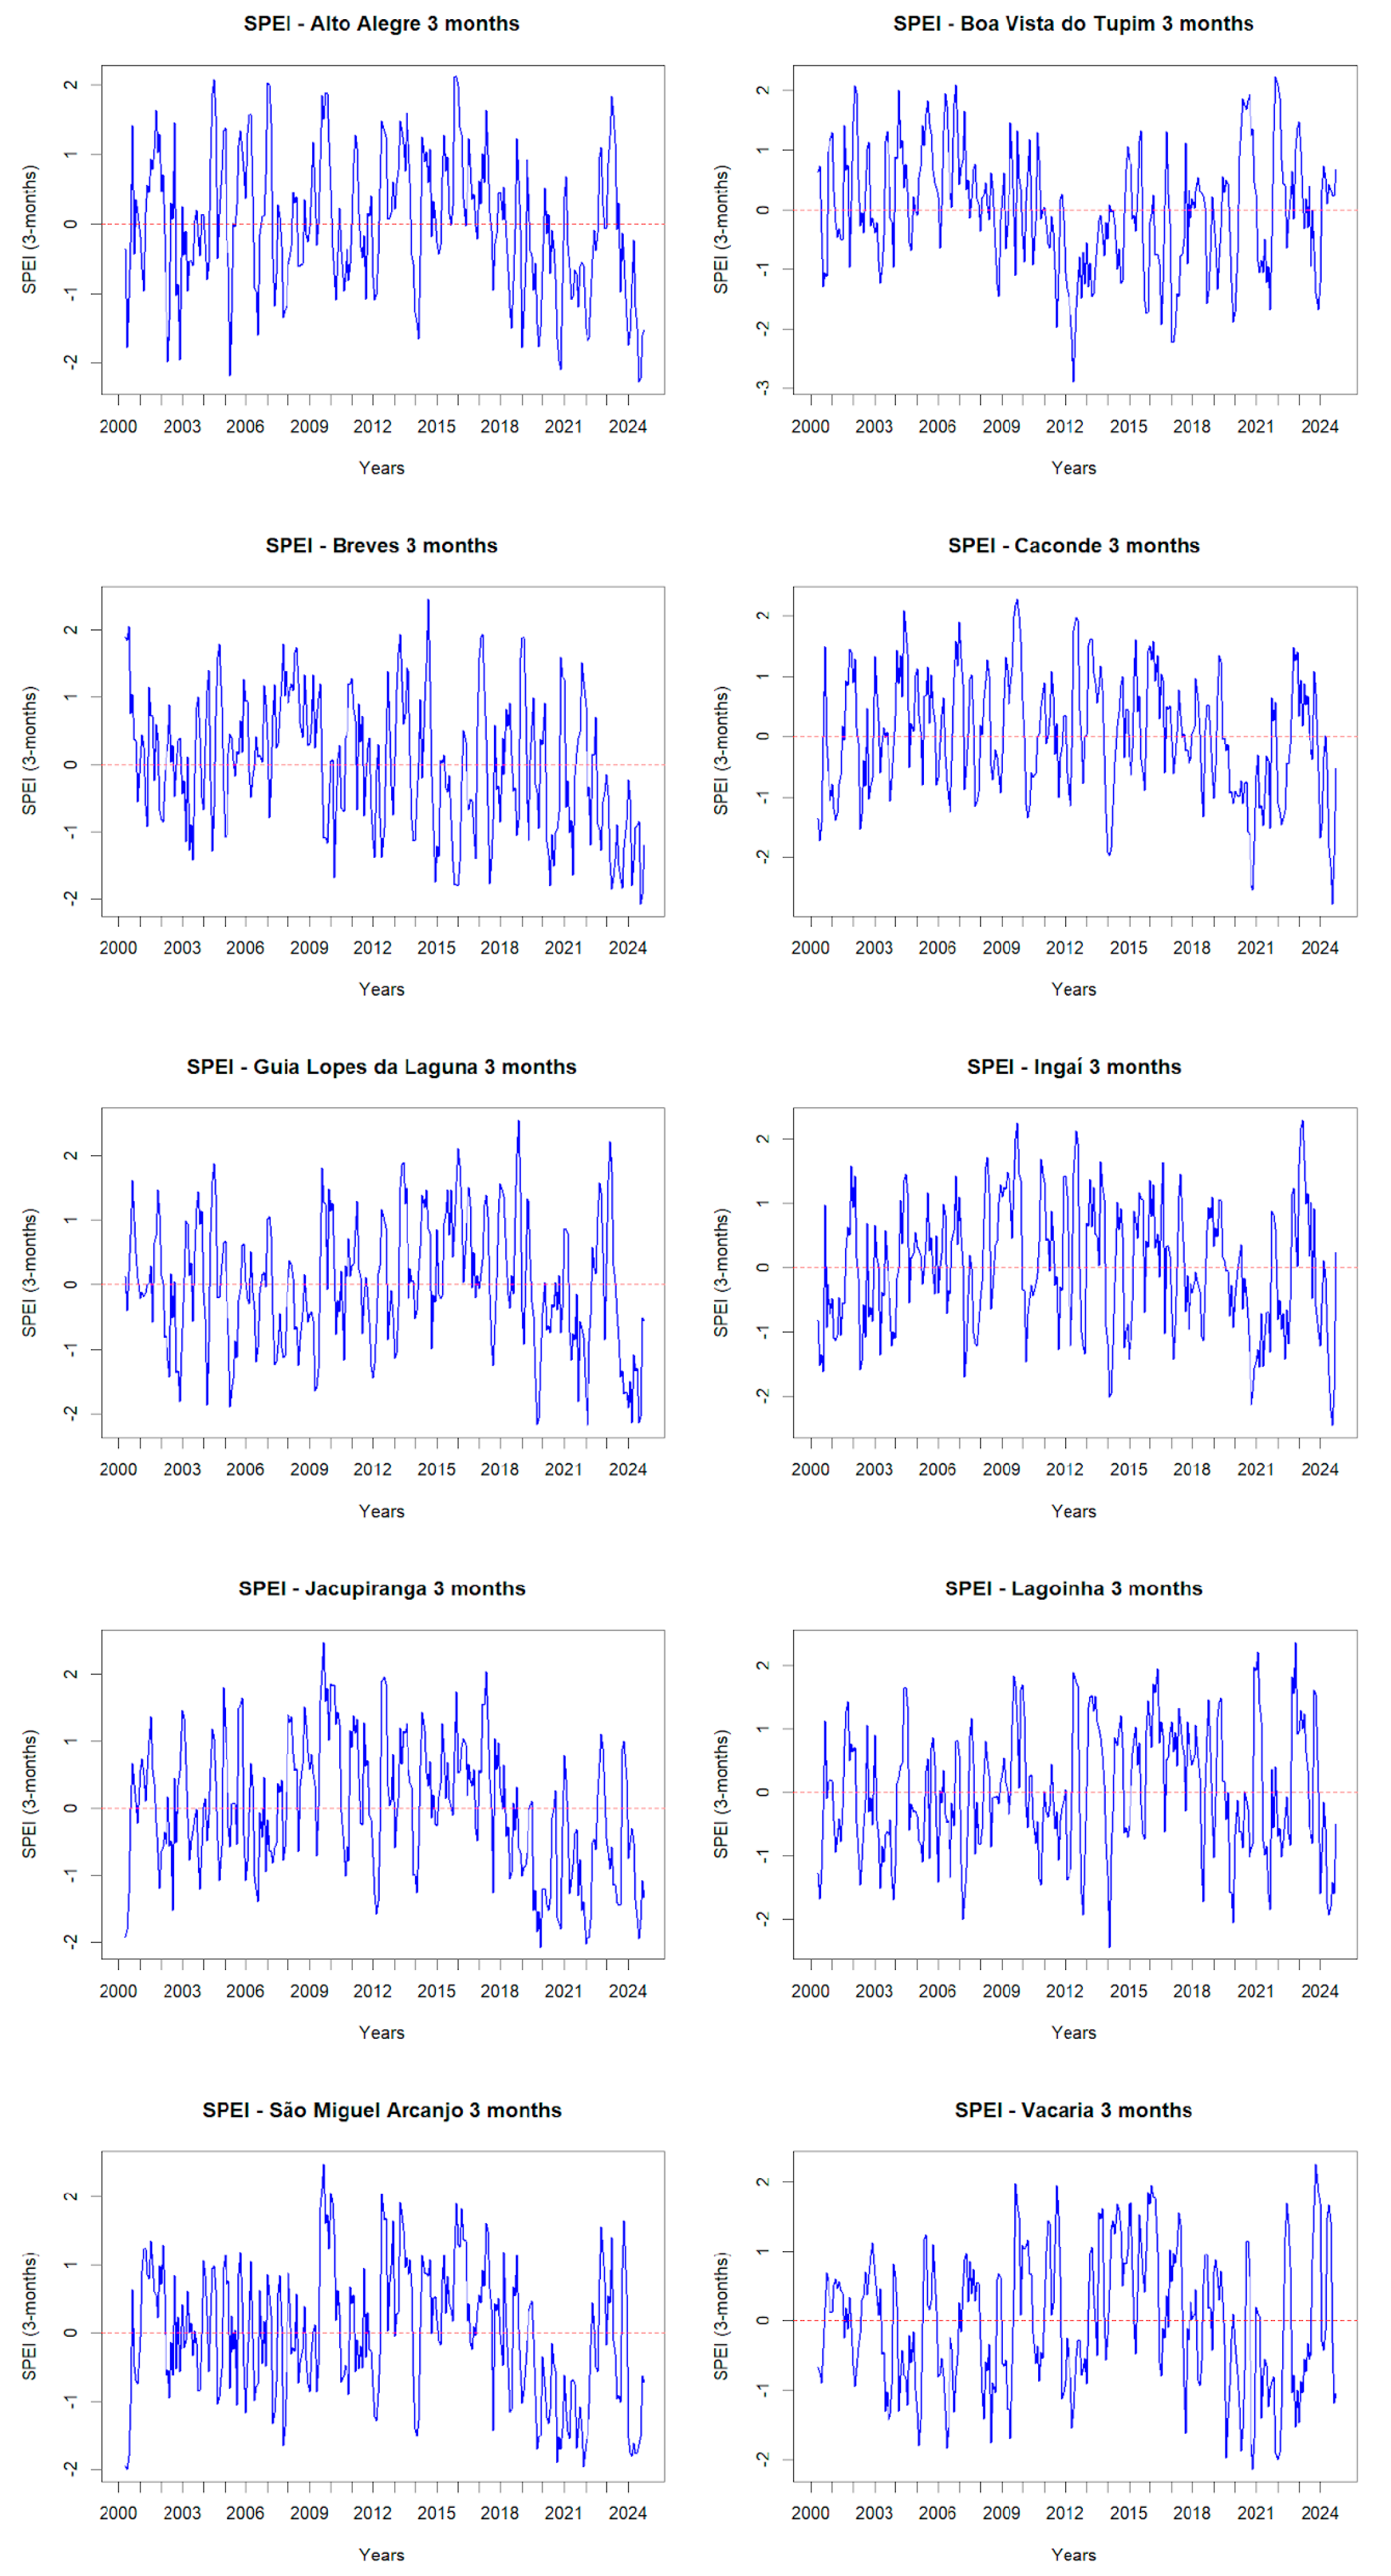
The SPEI at a 3-month time scale is shown in
Figure 6, while
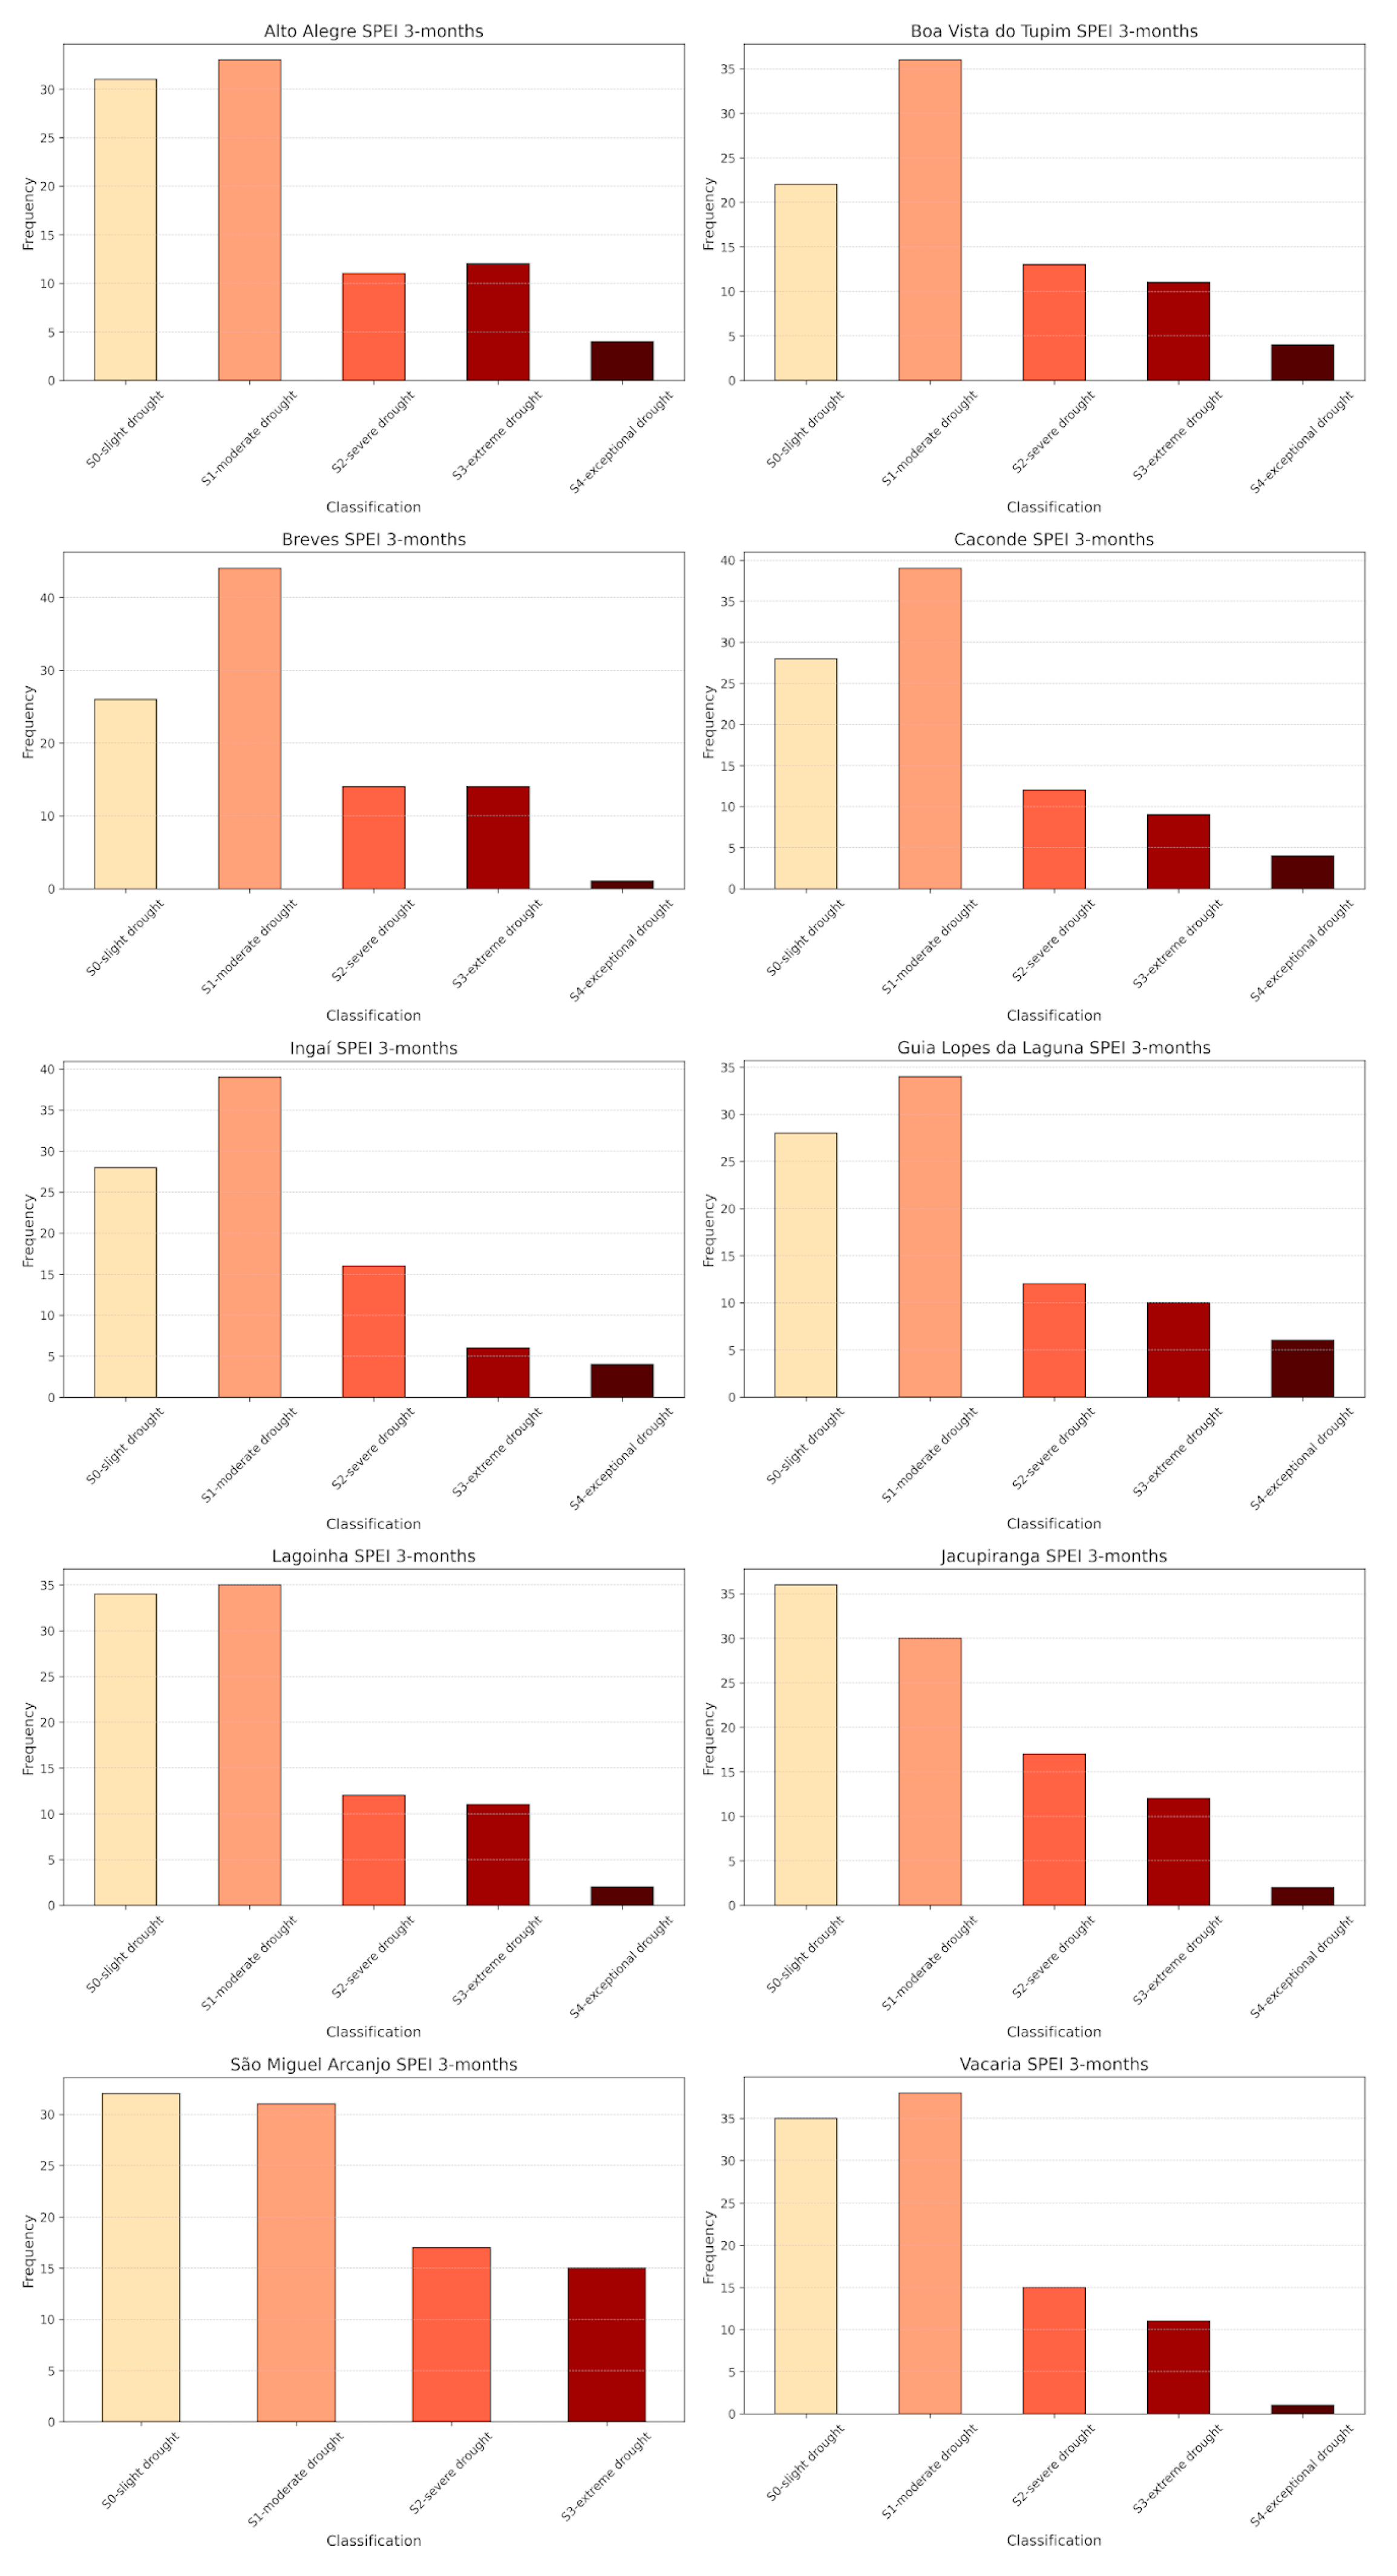
Figure 7 presents the frequency and severity of drought events in the Agrotechnological Districts based on the SPEI index.
In the period from March 2000 to October 2024, the more expressive drought (exceptional drought category) occurred in the following months: July 2024 (SPEI = - 2.3) for Alto Alegre, in June 2012 (SPEI = -2.9) for Boa Vista do Tupim, in August 2024 for Breves (SPEI = -2.1), Caconde (SPEI = -2.8), and Ingaí (SPEI = -2.5), in February 2022 (SPEI = -2.2) for Guia Lopes da Laguna, in December 2019 for Jacupiranga (SPEI = -2.1), in February 2014 for Lagoinha (SPEI = -2.4), in June 2000 for São Miguel Arcanjo (SPEI = -2.0), and in November 2020 for Vacaria (SPEI = -2.1) (
Figure 6).
The most frequent drought category in Alto Alegre Agrotechnological District was S1-moderate drought (n = 33), followed by S0-slight drought (n = 31), S3-extreme drought (n = 12), S2-severe drought (n = 11) and lastly S4-exceptional drought (n = 4), totaling 91 drought occurrences (
Figure 7).
In Boa Vista do Tupim Agrotechnological District, 86 drought events were observed, with the S1-moderate drought (n = 36) being the most frequent category, followed by S0-slight drought (n = 22), S2-severe drought (n = 13), S3-extreme drought (n = 11), and S4-exceptional drought (n = 4).
In the Agrotechnological District of Breves, a total of 99 drought episodes were identified: 44 classified as S1 (moderate drought), 26 as S0 (slight drought), 14 as S2 (severe drought), 14 as S3 (extreme drought), and 1 as S4 (exceptional drought).
The Caconde Agrotechnological District experienced a total of 92 drought occurrences, including 39 classified as S1 (moderate drought), 28 as S0 (slight drought), 12 as S2 (severe drought), 9 as S3 (extreme drought), and 4 as S4 (exceptional drought).
In the Guia Lopes da Laguna Agrotechnological District, 90 drought events were recorded, including 34 classified as S1 (moderate drought), 28 as S0 (slight drought), 12 as S2 (severe drought), 10 as S3 (extreme drought), and 6 as S4 (exceptional drought)
In the Ingaí Agrotechnological District, 93 drought episodes were recorded, comprising 39 classified as S1 (moderate drought), 28 as S0 (slight drought), 16 as S2 (severe drought), 6 as S3 (extreme drought), and 4 as S4 (exceptional drought).
In the Jacupiranga Agrotechnological District, the most common drought category was S0 (slight drought) with 36 occurrences, followed by S1 (moderate drought) with 30 occurrences, S2 (severe drought) with 17 occurrences, S3 (extreme drought) with 12 occurrences, and S4 (exceptional drought) with 2 occurrences, totaling 97 drought episodes.
For the Lagoinha Agrotechnological District, S1 (moderate drought) was the most frequent category, with 35 occurrences, followed by S0 (slight drought) with 34 occurrences, S2 (severe drought) with 12 occurrences, S3 (extreme drought) with 11 occurrences, and S4 (exceptional drought) with 2 occurrences, resulting in a total of 94 drought episodes.
The São Miguel Arcanjo Agrotechnological District did not register any S4 (exceptional drought) occurrences but recorded a total of 95 drought episodes, comprising 32 classified as S0 (slight drought), 31 as S1 (moderate drought), 17 as S2 (severe drought), and 15 as S3 (extreme drought).
The Vacaria Agrotechnological District recorded the highest number of drought episodes, totaling 100. These included 38 classified as S1 (moderate drought), 35 as S0 (slight drought), 15 as S2 (severe drought), 11 as S3 (extreme drought), and 1 as S4 (exceptional drought).
Table 2 presents the results of the Mann–Kendall test and Sen’s slope analysis for SPEI at a 3-month time scale across the Agrotechnological Districts. A decreasing trend was observed in Alto Alegre, Boa Vista do Tupim, Breves, Caconde, Jacupiranga, and São Miguel Arcanjo, while Guia Lopes da Laguna, Ingaí, Lagoinha, and Vacaria showed no significant trend.
Among the Agrotechnological Districts with a decreasing trend, Breves exhibited the most negative Sen’s slope (-0.0038). Within the group showing no trend, Lagoinha and Vacaria had positive Sen’s slope values (0.001 and 0.0003, respectively), while Guia Lopes da Laguna and Ingaí exhibited slight negative values (-0.0008 and -0.0005, respectively) (
Table 2).
3.4. SPEI-3 Months Clusters
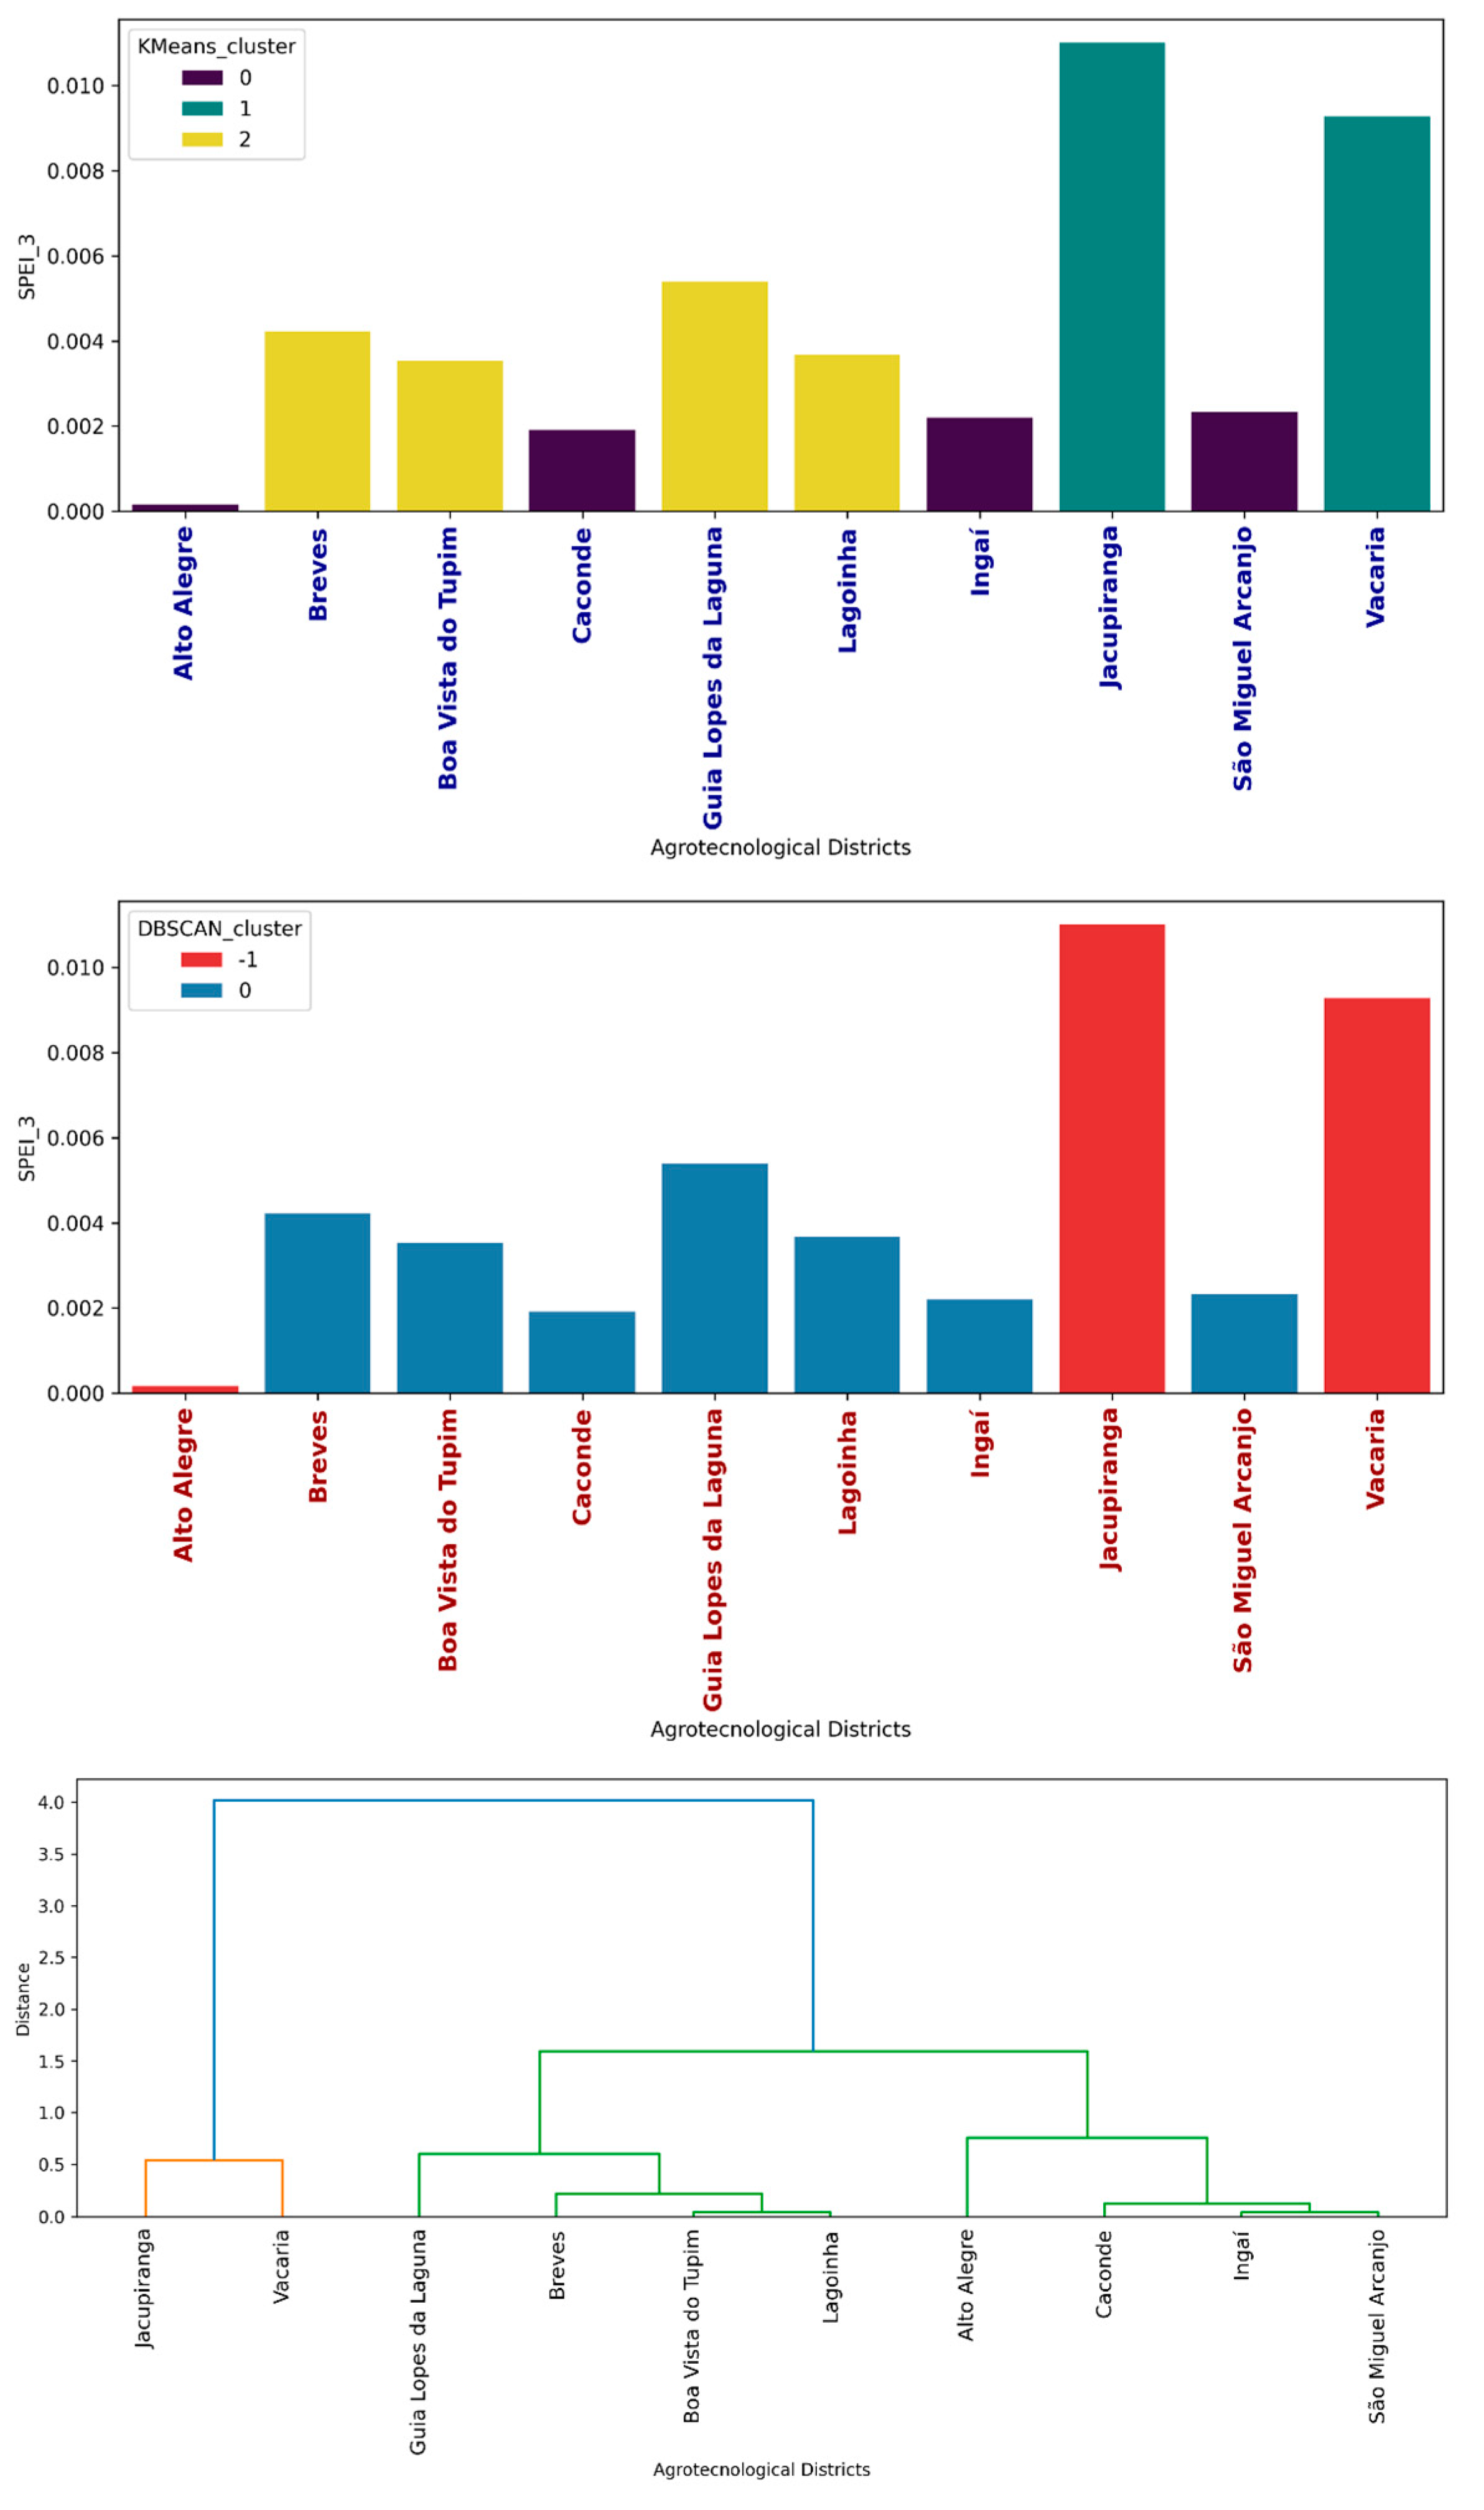
Figure 8 presents the K-means, Density-Based Spatial Clustering of Applications with Noise (DBSCAN), and dendrogram clusters for the SPEI at a 3-month time scale.
According to the K-means clustering analysis, the DATs were grouped as follows: Alto Alegre, Caconde, Ingaí, and São Miguel Arcanjo formed one cluster; Breves, Boa Vista do Tupim, Guia Lopes da Laguna, and Lagoinha formed another; and Jacupiranga and Vacaria comprised a third group.
In contrast, the DBSCAN clustering analysis grouped Alto Alegre, Jacupiranga, and Vacaria DATs into one cluster, with the remaining DATs forming a second cluster. Similarly, the dendrogram analysis showed Jacupiranga and Vacaria DATs grouped together, while the remaining DATs were clustered into a separate group.
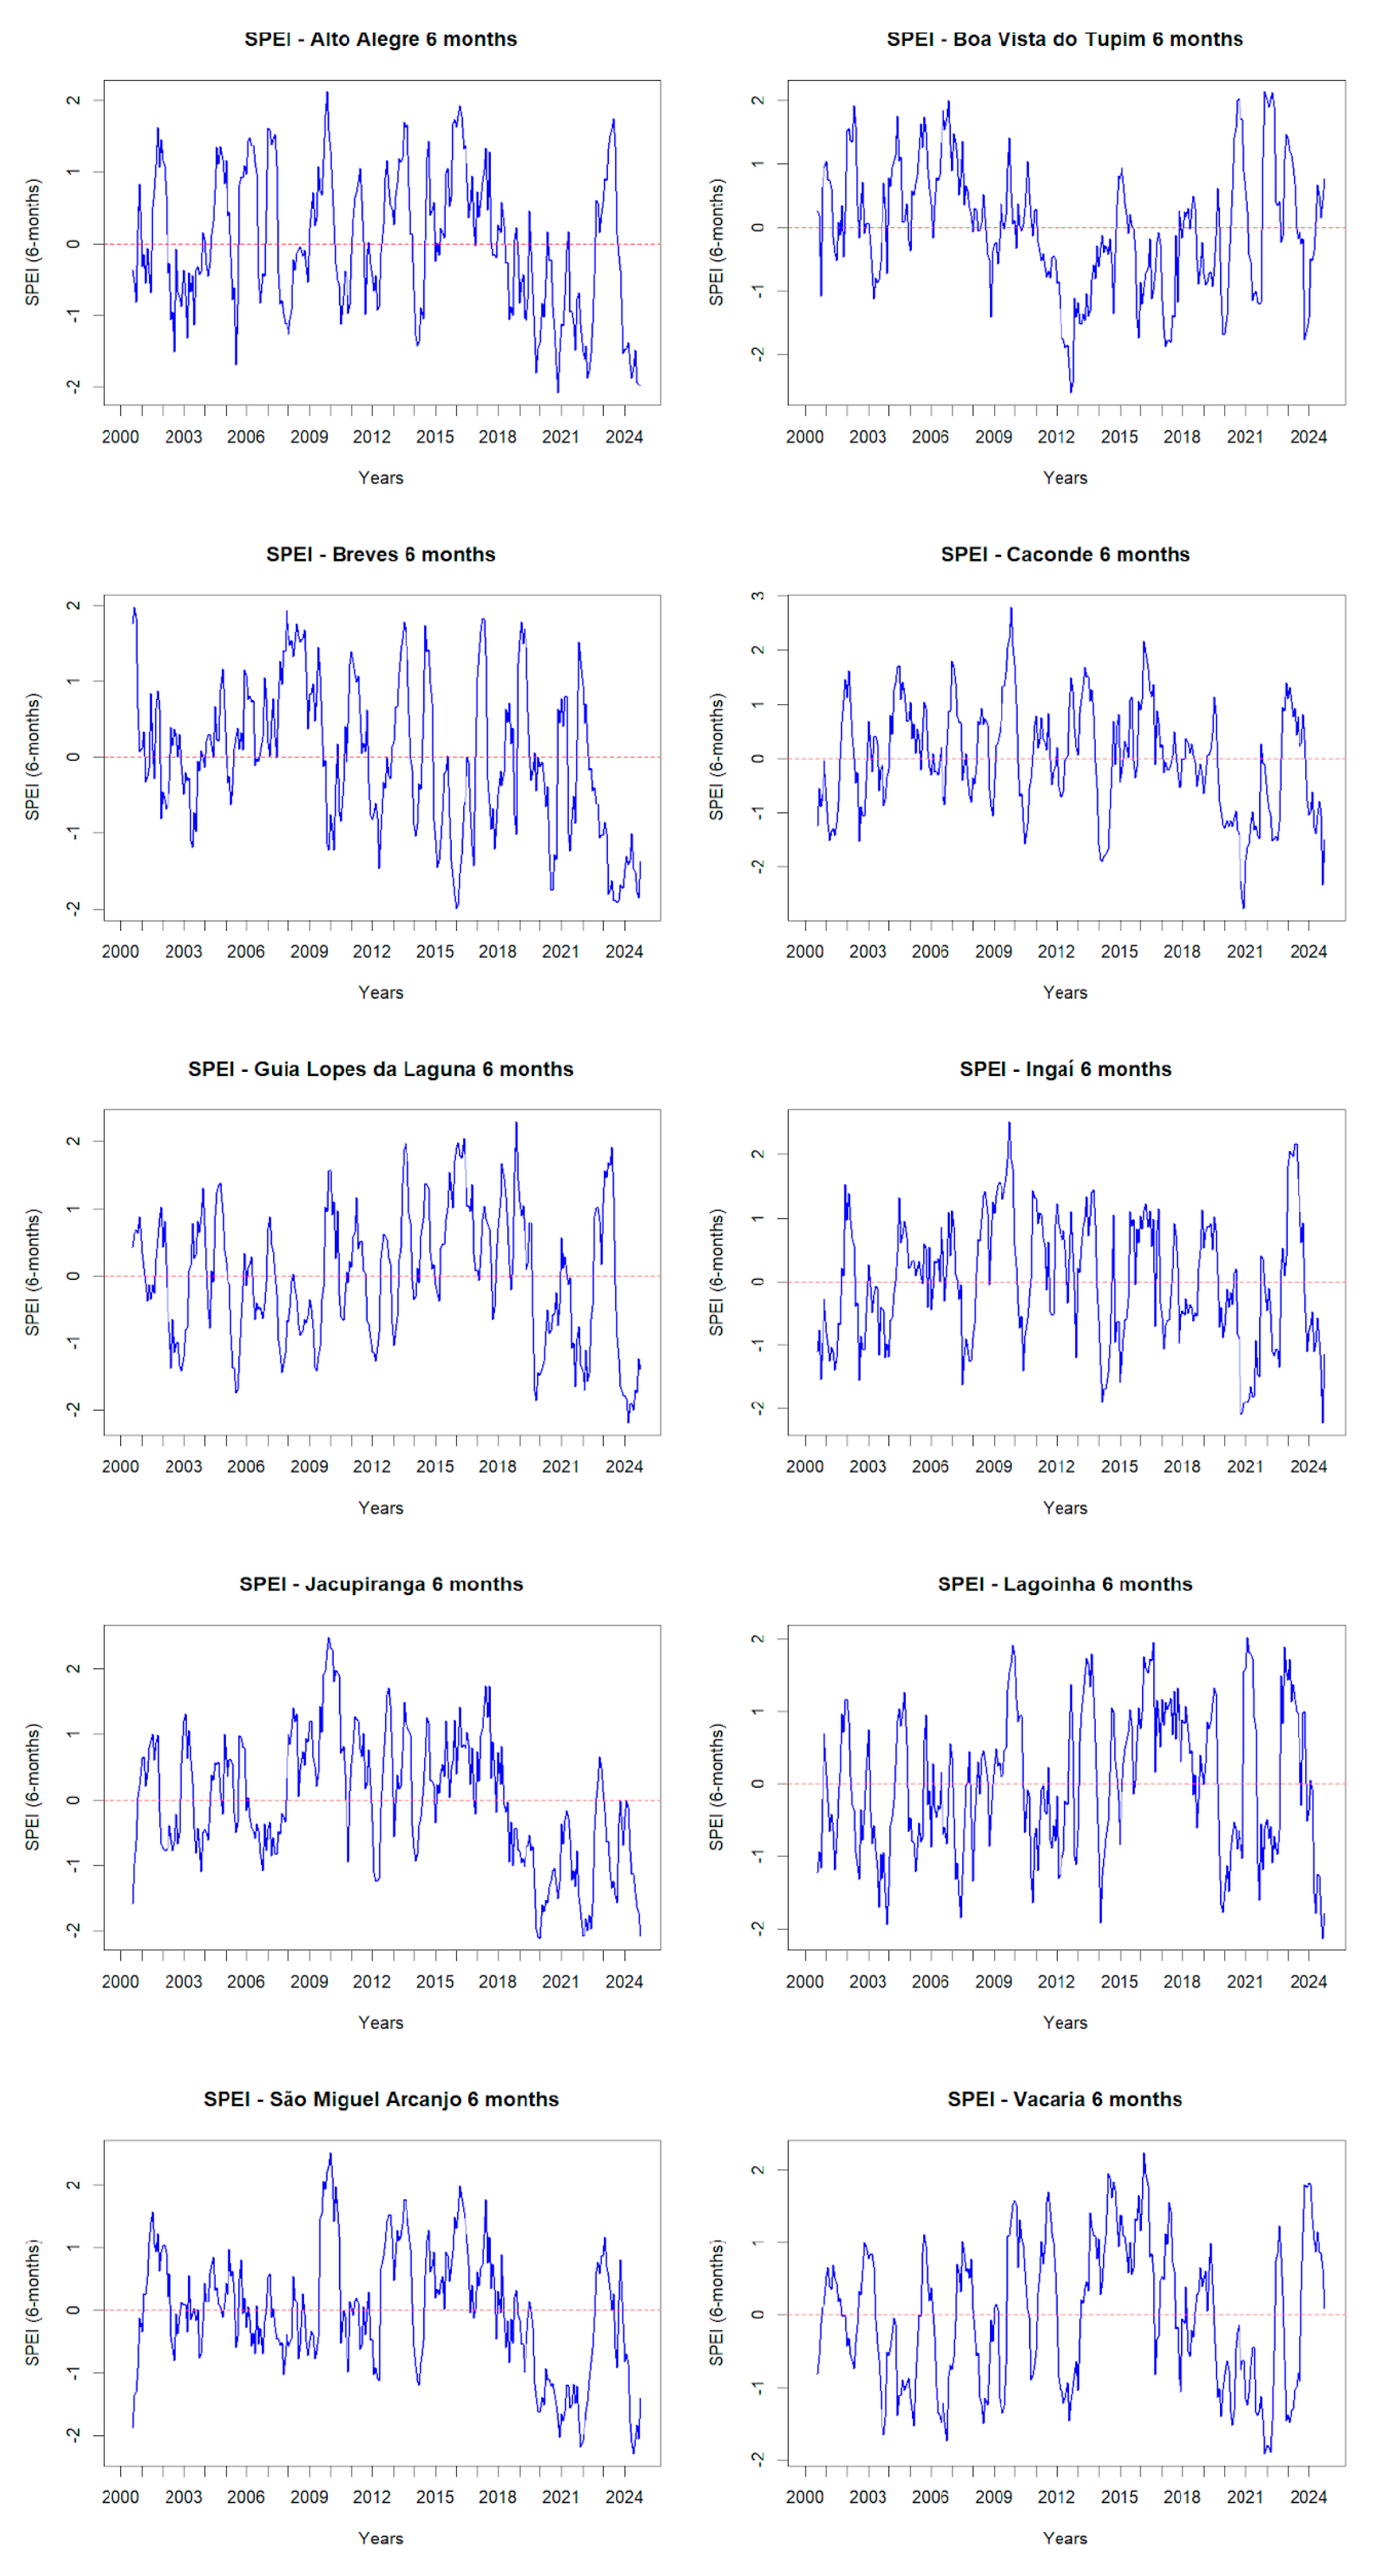
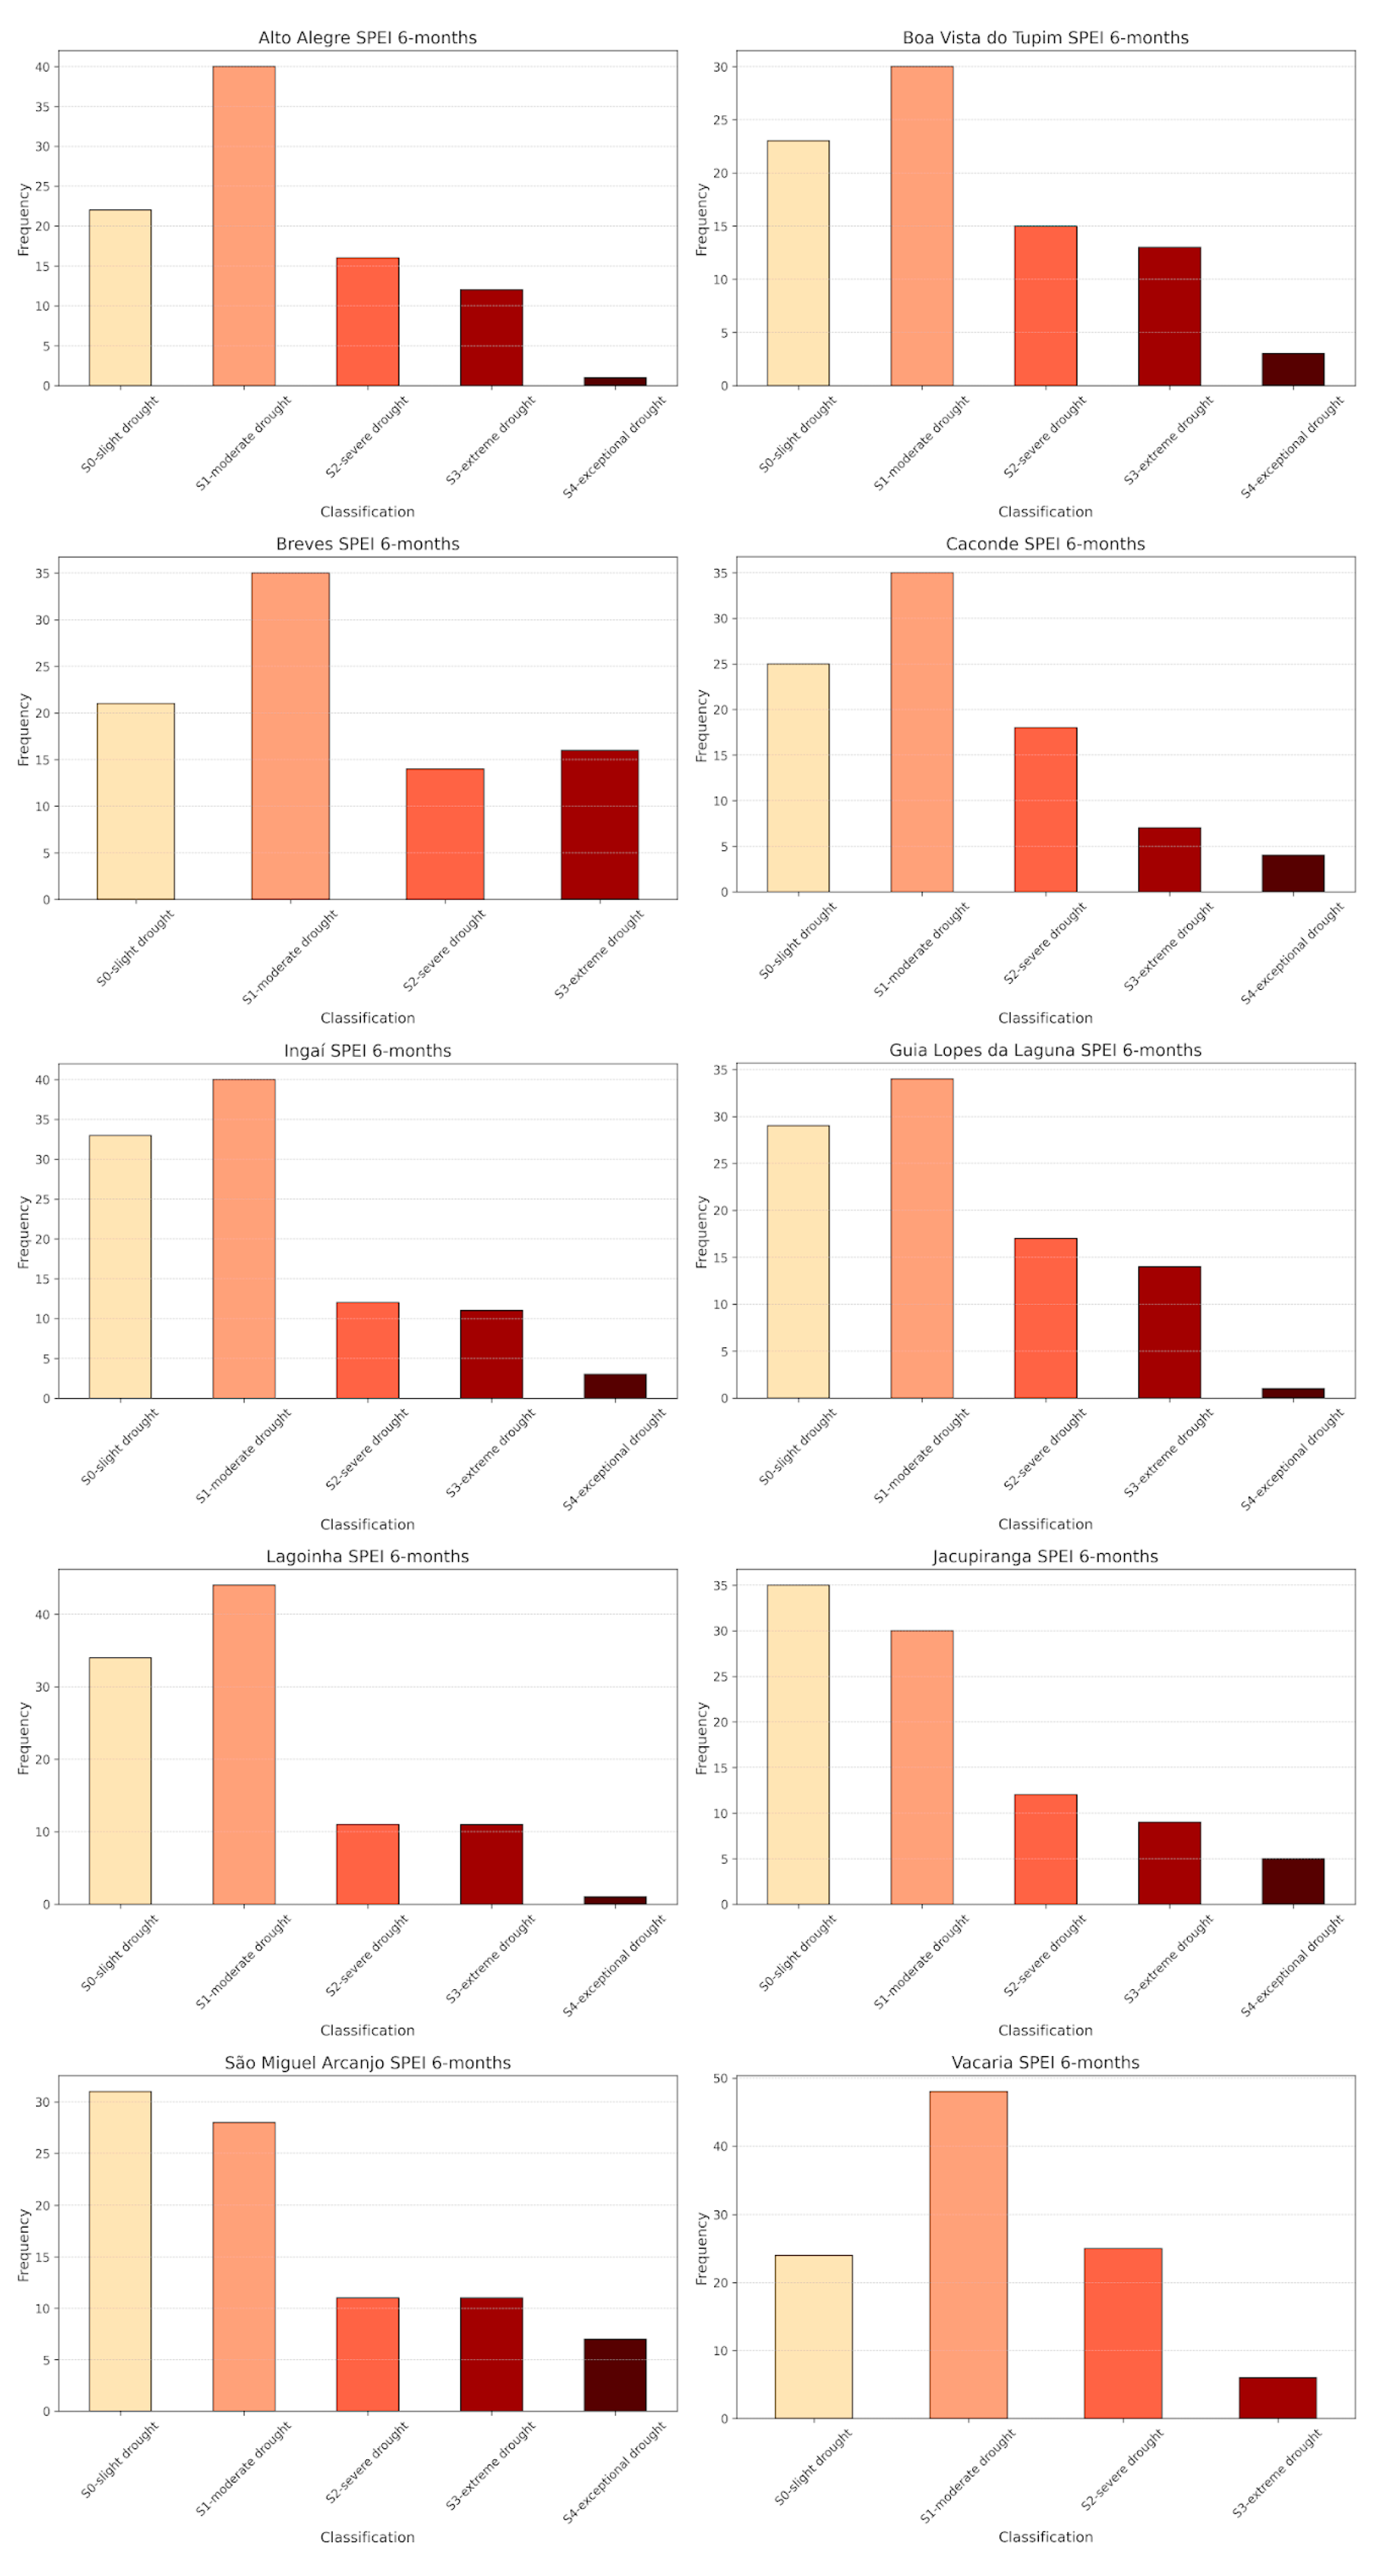
3.5. SPEI-6 Months
The SPEI at a 6-month time scale is shown in
Figure 9, while
Figure 10 illustrates the frequency and severity of drought events.
From March 2000 to October 2024, the most significant drought events (classified as exceptional drought, S4) for SPEI at a 6-month time scale occurred in the following months: November 2020 (SPEI = -2.1) in Alto Alegre, September 2012 (SPEI = -2.6) in Boa Vista do Tupim, January 2016 (SPEI = -2.0) in Breves, December 2020 (SPEI = -2.8) in Caconde, September 2024 (SPEI = -2.2) in Ingaí and Lagoinha, March 2024 (SPEI = -2.2) in Guia Lopes da Laguna, January 2020 (SPEI = -2.1) in Jacupiranga, June 2024 (SPEI = -2.3) in São Miguel Arcanjo, and December 2021 (SPEI = -2.0) in Vacaria (
Figure 9).
In the Alto Alegre Agrotechnological District, the most frequent drought category for SPEI at a 6-month time scale was S1 (moderate drought), with 40 occurrences, followed by S0 (slight drought) with 22 occurrences, S2 (severe drought) with 16 occurrences, S3 (extreme drought) with 12 occurrences, and S4 (exceptional drought) with 1 occurrence, totaling 91 drought episodes (
Figure 10).
In the Boa Vista do Tupim Agrotechnological District, 84 drought occurrences were recorded. The most frequent category was S1 (moderate drought) with 30 occurrences, followed by S0 (slight drought) with 23, S2 (severe drought) with 15, S3 (extreme drought) with 13, and S4 (exceptional drought) with 3 occurrences.
For the Breves Agrotechnological District, a total of 86 drought episodes were observed, including 35 classified as S1 (moderate drought), 21 as S0 (slight drought), 16 as S3 (extreme drought), and 14 as S2 (severe drought).
The Caconde Agrotechnological District recorded 89 drought occurrences, comprising 35 classified as S1 (moderate drought), 25 as S0 (slight drought), 18 as S2 (severe drought), 7 as S3 (extreme drought), and 4 as S4 (exceptional drought).
In the Guia Lopes da Laguna Agrotechnological District, 95 drought episodes were observed, including 34 classified as S1 (moderate drought), 29 as S0 (slight drought), 17 as S2 (severe drought), 14 as S3 (extreme drought), and 1 as S4 (exceptional drought).
The Ingaí Agrotechnological District reported 99 drought occurrences, consisting of 40 classified as S1 (moderate drought), 33 as S0 (slight drought), 12 as S2 (severe drought), 11 as S3 (extreme drought), and 3 as S4 (exceptional drought).
In the Jacupiranga Agrotechnological District, the most common drought category was S0 (slight drought), with 35 occurrences, followed by S1 (moderate drought) with 30, S2 (severe drought) with 12, S3 (extreme drought) with 9, and S4 (exceptional drought) with 5, totaling 91 drought episodes.
The Lagoinha Agrotechnological District experienced 101 drought occurrences, with S1 (moderate drought) as the most frequent category (44 occurrences), followed by S0 (slight drought) with 34, S2 (severe drought) with 11, S3 (extreme drought) with 11, and S4 (exceptional drought) with 1.
The São Miguel Arcanjo Agrotechnological District reported 88 drought episodes, including 31 classified as S0 (slight drought), 28 as S1 (moderate drought), 11 as S2 (severe drought), 11 as S3 (extreme drought), and 7 as S4 (exceptional drought).
The Vacaria Agrotechnological District, which did not register any S4 (exceptional drought) events, recorded the highest total number of drought occurrences at 103. These included 48 classified as S1 (moderate drought), 24 as S0 (slight drought), 25 as S2 (severe drought), and 6 as S3 (extreme drought).
Table 3 presents the Mann–Kendall and Sen’s slope results for SPEI at a 6-month time scale across the Agrotechnological Districts. A decreasing trend was observed in Alto Alegre, Boa Vista do Tupim, Breves, Caconde, Jacupiranga, and São Miguel Arcanjo DATs, while Guia Lopes da Laguna, Ingaí, and Vacaria showed no significant trend. Lagoinha, however, exhibited an increasing trend.
Breves exhibited the most negative Sen’s slope value (-0.0040) among the districts with a decreasing trend. Within the group showing no significant trend, Vacaria displayed a positive Sen’s slope value (0.0005), while Guia Lopes da Laguna and Ingaí recorded slightly negative values (-0.0001 and -0.0006, respectively). Lagoinha, on the other hand, demonstrated an increasing trend with a Sen’s slope value of 0.0026.
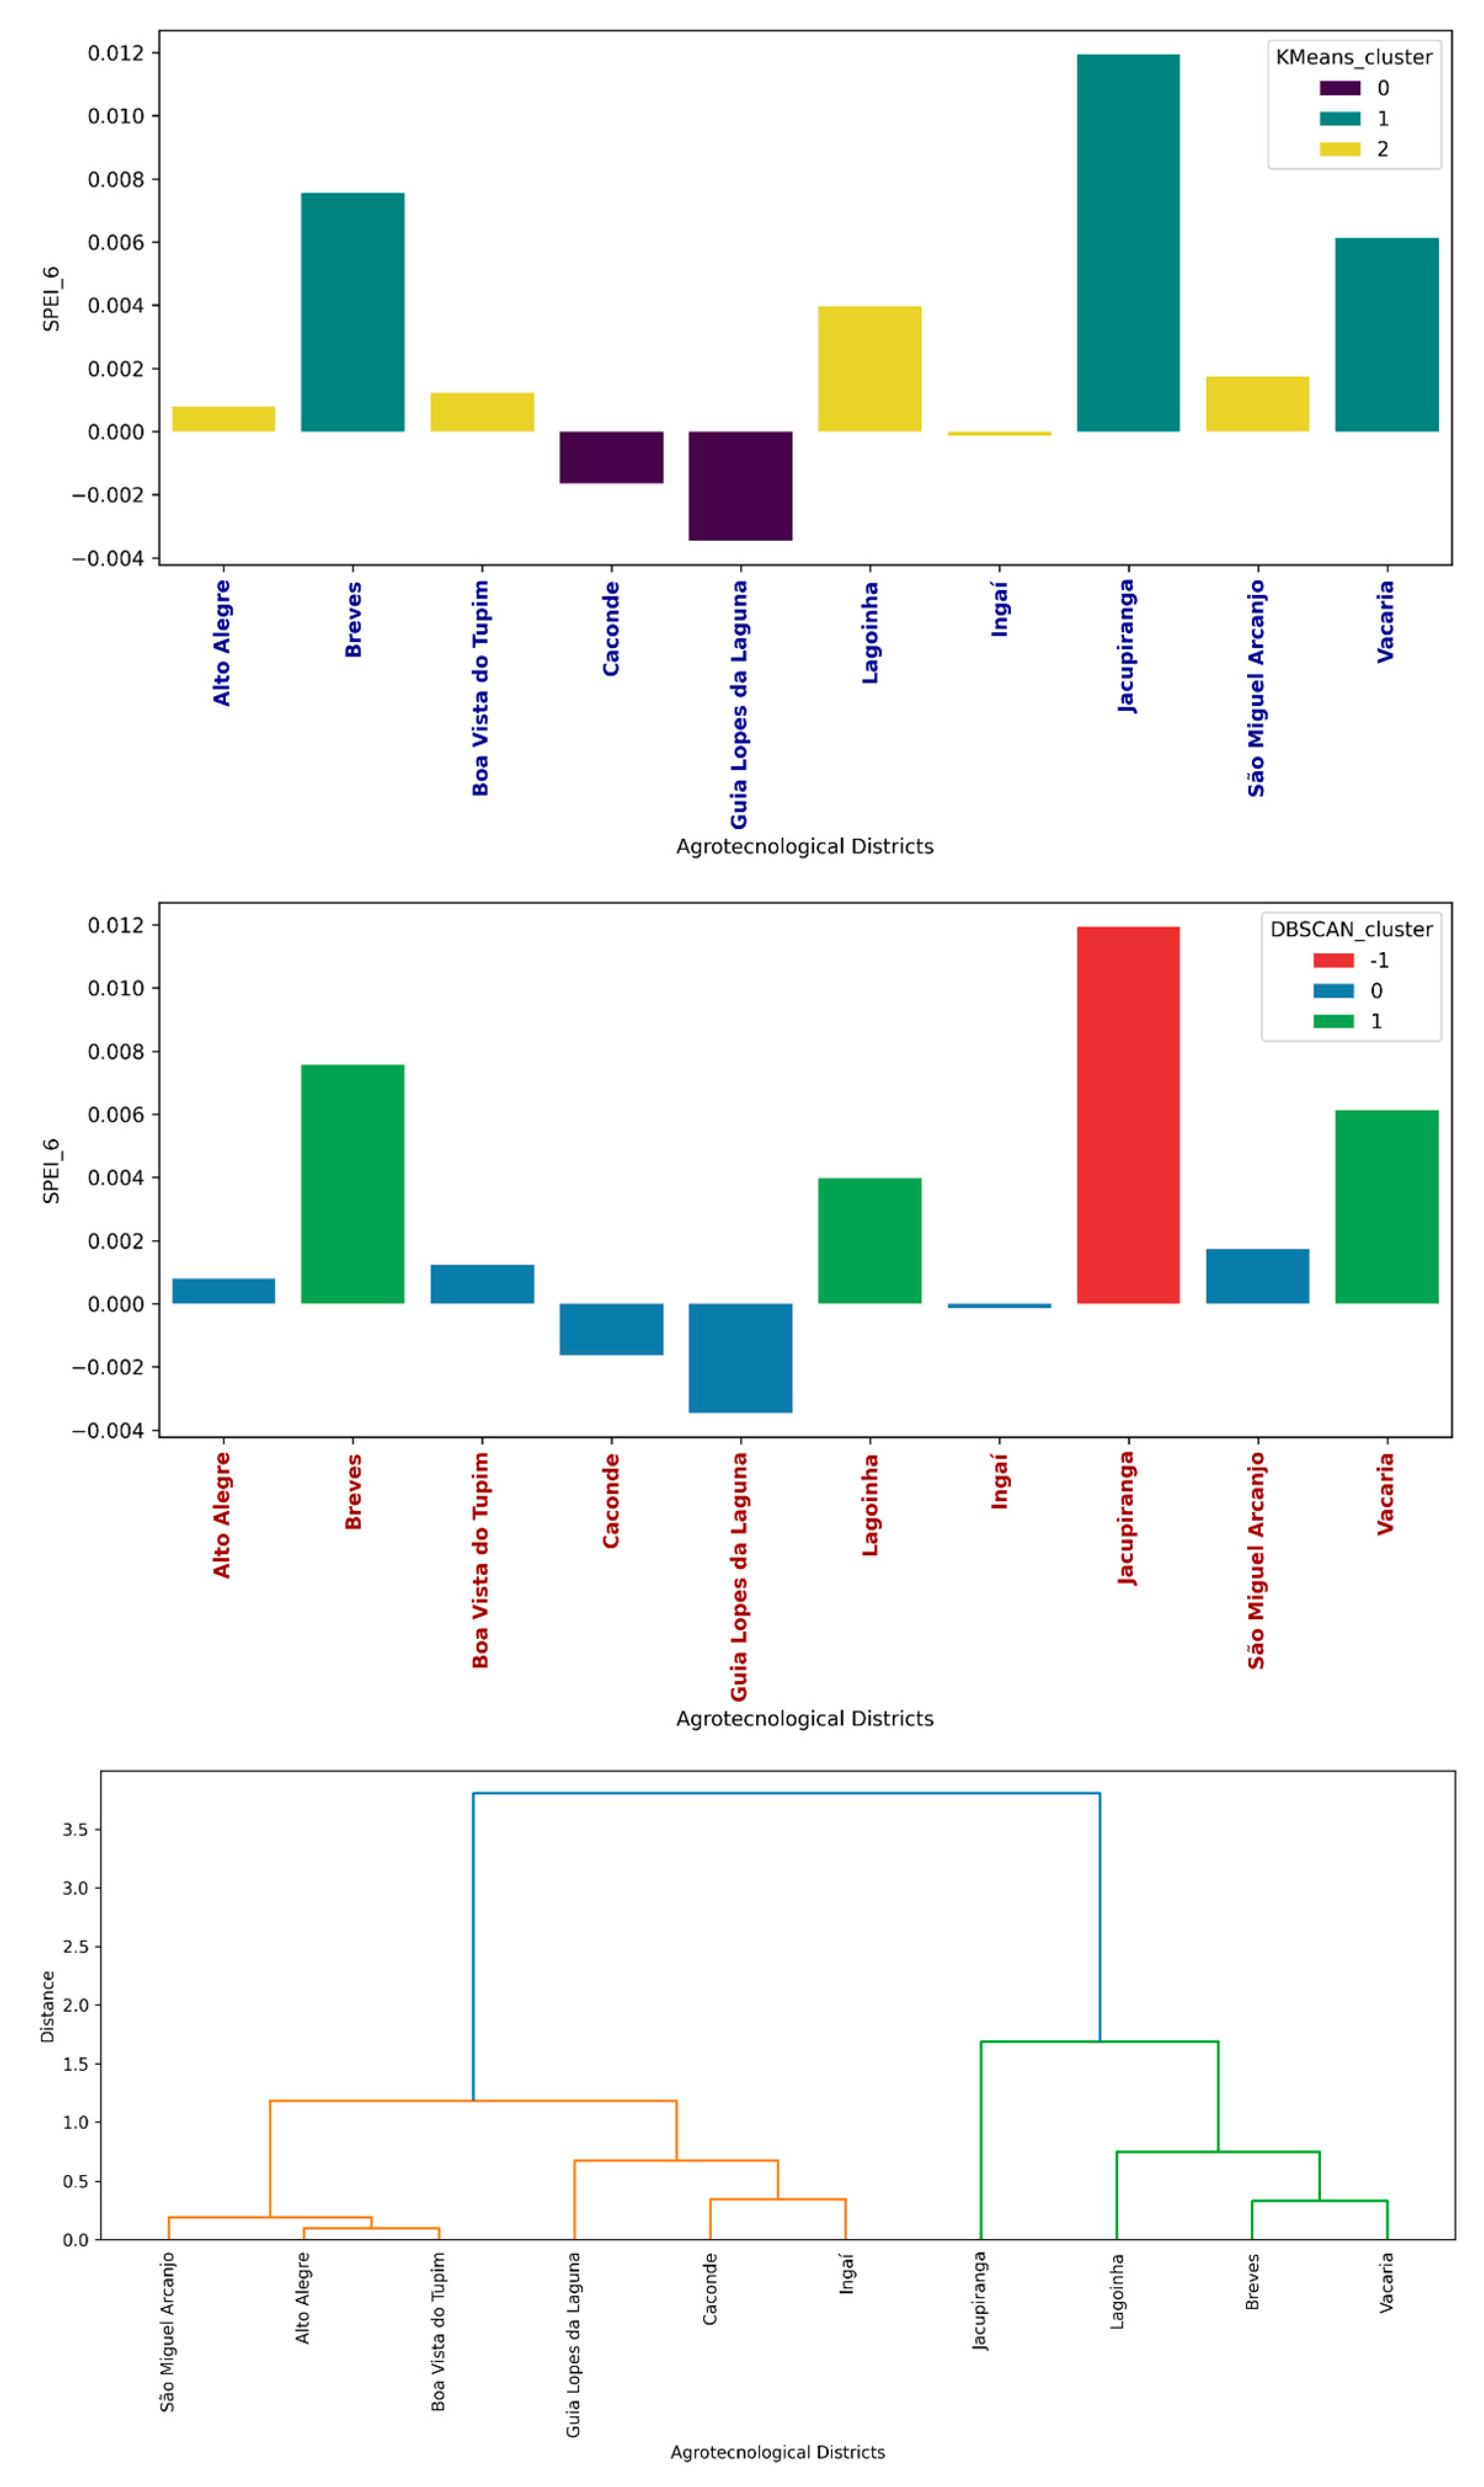
3.6. SPEI-6 Months Clusters
Figure 11 presents the K-means, DBSCAN, and dendrogram clusters for the SPEI on a 6-month time scale.
Based on K-means clustering analysis, the DATs of Alto Alegre, Caconde, Ingaí, and São Miguel Arcanjo form one cluster, while Breves, Boa Vista do Tupim, Guia Lopes da Laguna, and Lagoinha form a second cluster. The DATs of Jacupiranga and Vacaria constitute a distinct third cluster. In contrast, DBSCAN clustering groups Alto Alegre, Jacupiranga, and Vacaria DATs together, with the remaining DATs forming a separate cluster. The dendrogram analysis similarly places Jacupiranga and Vacaria DATs in one group, distinct from all other DATs.
4. Discussion
Validation of climate data from remote sensing products (MODIS and CHIRPS) demonstrated strong agreement with Agritempo ground observations, reinforcing their reliability for drought analysis. However, MODIS temperature data showed lower correlations in Breves (0.45), likely due to high cloud coverage in the Amazon region impacting sensor measurements. This contrasts with previous findings reporting correlations above 0.8 for MODIS and ERA-Interim data in Amazon [
16]. CHIRPS precipitation data correlated well with Agritempo observations (coefficients > 0.7), aligning with studies confirming its accuracy across Brazilian regions. [
17,
18,
19].
Climatic analysis revealed substantial variability across DATs due to diverse biomes and elevations. The tropical Aw climate in Alto Alegre presented distinct rainy and dry seasons impacting agricultural planning, while the semi-arid BSh climate at Boa Vista do Tupim highlighted water scarcity challenges, exacerbated by high PET values and low precipitation. Breves (Amazon biome) displayed consistent rainfall and lower PET variability, contrasting with Guia Lopes da Laguna (Cerrado biome), which experienced pronounced dry seasons and PET fluctuations. Humid subtropical DATs (Atlantic Forest biome) exhibited moderate water stress, while Vacaria, characterized by consistently low temperatures and PET, showed reduced susceptibility to high water stress.
The SPEI analyses revealed the short-term (SPEI-3) and medium-term (SPEI-6) drought dynamics through the DATs. Exceptional drought, the most severe drought class, was sporadic but impactful. For this severity class, short-term drought episodes included June 2012 (SPEI = -2.9, Boa Vista do Tupim) and August 2024 (SPEI = -2.8, Caconde), reflecting rapid yet intense moisture deficits. In contrast, medium-term drought events highlighted prolonged episodes, such as those in December 2020 (SPEI = -2.8, Caconde) and September 2012 (SPEI = -2.6, Boa Vista do Tupim). According to [
20], the 2011/2012 hydrological year exhibited the most severe drought conditions in Brazil’s Northeast region, where the municipality of Boa Vista do Tupim is located
The Agrotechnological District of Caconde, a significant coffee-producing region in Brazil, garnered media attention in 2020 and 2024 due to the exceptional droughts experienced during these years. These events were notable for their substantial impact on coffee productivity [
21] and prices [
22].
Moderate and slight drought were the most frequently observed drought severity categories in the DATs. However, temporal trend analyses revealed variations among these regions. Negative SPEI trends (SPEI-3 and SPEI-6 months) were observed in the Breves and Caconde DATs, indicating worsening drought conditions. In contrast, the Lagoinha DAT exhibited an increasing SPEI-6-month trend, suggesting improving moisture availability. Meanwhile, the absence of significant trends in regions such as Vacaria reflects stable yet variable drought conditions.
Consistent with this study, research conducted in 2015 by [
23] indicated that drought events in the Amazon region, where the Agrotechnological District of Breves is located, are expected to intensify throughout the 21st century, posing significant risks to agriculture and increasing the likelihood of wildfires.
Clustering analysis grouped DATs with similar drought profiles, emphasizing shared climatic challenges and adaptation needs. For example, Jacupiranga and Vacaria consistently formed a distinct cluster characterized by high drought frequency but stable trends, while DATs such as Alto Alegre and São Miguel Arcanjo clustered due to moderate drought frequency and decreasing trends.
The combination of K-means, DBSCAN, and dendrogram analyses underscored the complexity of spatial drought patterns and highlighted the potential for regional collaboration in managing water resources. The consistent grouping of certain DATs reveals opportunities for shared resource management strategies and policy development. These findings emphasize the need for tailored drought mitigation approaches that address local climate conditions while leveraging cluster-based insights to optimize agricultural resilience and water management strategies.
5. Conclusions
Temperature data from MODIS and precipitation data from CHIRPS can be a reliable data source for drought analysis.
The frequency and intensity of droughts varied across the Agrotechnological Districts of the Semear Digital Center. The results indicated that the most severe droughts (S4 - exceptional drought) occurred at different times across the DATs, reflecting regional climatic variability.
The most frequently observed drought severity categories in the DATs were moderate and slight drought. However, temporal trend analyses revealed variations among these regions. The Mann–Kendall trend analysis revealed a significant decline in the SPEI index in six districts, with Breves showing the steepest decline (Sen’s slope = -0.0040). In contrast, districts such as Lagoinha and Vacaria exhibited positive slope values, indicating stability or a slight increase in water availability. Clustering analyses (K-means, DBSCAN, and dendrogram) revealed consistent patterns, grouping districts such as Jacupiranga and Vacaria together based on similarities.
These findings emphasize the importance of climate monitoring and adaptive strategies to mitigate agricultural risks associated with drought, particularly for small and medium-sized farms. In this context, the implementation of public policies and digital technologies for water management and agricultural planning can be crucial to enhancing the resilience of these production systems in the face of climate change.
The results of this study have the potential to inform the development of targeted drought mitigation strategies, such as early warning systems, improved irrigation practices, and access to drought-resistant crops.
Future research should integrate land use, vegetation cover, and socioeconomic data to enhance drought impact assessments and improve climate adaptation planning.