
Submitted:
18 September 2025
Posted:
18 September 2025
You are already at the latest version
Abstract
Dairy foods are rich in nutrients and typically have a lower environmental impact than other animal-based products. Despite these benefits, in France, dairy consumption is lower than recommended. This study sought to understand where in the diet dairy foods are consumed, with a view to identifying opportunities for increasing consumption. A characterisation study was conducted using the INCA3 database (n=783 adults, aged 18-44 years). All eating episodes containing dairy products were classified by product type, and five dimensions to characterise consumption: 1) intakes; 2) eaten or drunk; 3) sweet or savoury; 4) in combination with other foods or by itself; 5) time of day. A sixth dimension, meal or snack, was based on a time-of-day approach. Results showed that (1) an average of 246g, 1126kJ of dairy is consumed per person, per day; (2) dairy is more eaten than drunk; (3) in sweet and savoury dishes depending on the type of product; (4) in proper meals in combination with other foods, rarely by itself; (5, 6) and is mostly consumed at traditional mealtimes and rarely as a mid-day snack. Various suggestions can be made for increasing dairy consumption among French adults, based on product type, eating occasion, and eating context.
Keywords:
dairy
; dairy consumption
; France
; manner of consumption
; contexts of consumption
; patterns of consumption
1. Introduction
Dairy is a good source of vitamins, calcium, and other minerals, proteins, and healthy fats [1,2,3,4]. A regular intake has been associated with lower risk of metabolic and cardiovascular diseases [5,6] and better gut health [7,8]. Its consumption promotes bone density [9], maximising bone mineral content and peak bone mass in late adolescence [9,10], and reducing the risk of developing osteoporosis in later life [11]. Moreover, contrary to popular belief, many dairy products are low-lactose or lactose-free, making them suitable for consumption by those who are lactose intolerant or have digestive sensitivities [12,13,14].
Dairy fits the need to migrate to a more sustainable lifestyle, as it has, on average, a lower impact on natural resources compared to other animal-based products, especially meats [15,16,17,18]. Furthermore, products from non-cattle milk, e.g., goat’s dairy, are considered more environmentally friendly than cow’s dairy, as less demanding in usage of natural resources [19,20].
The dairy group includes many different products from different milks and production processes [21,22], and can be considered an extremely versatile food group, suitable for countless recipes and for consumption in a range of contexts [21,23,24,25,26,27]. Moreover, as occasions for and consumption contexts are not only determined by the product per se, but are also influenced by other factors, such as individual preferences, social norms, or market-related aspects [25,28,29,30,31,32,33,34,35], dairy products may have a different place in the meal and the diet for different diners, communities, or cultures [29,32,36,37,38,39,40,41]. Similarities and common aspects also allow some dairy products to be replaced with each other, in dishes or on occasions [29,31,42,43,44]. For instance, yoghurt can be used to replace fattier products, or in different meals and on daily occasions [29,45,46]. Thus, while some products may differ in raw ingredients, production processes, and sensory characteristics, they can be consumed in the same manner or on similar occasions and still impact diet, cost, and environment differently [46,47,48,49].
However, despite the health and environmental benefits related to dairy consumption and the wide variety of products available, dairy intake in Western countries is lower than recommended [5,50,51]. Several Western countries recommend a daily consumption of two to three portions of dairy products a day [5,52]; however, in the last two decades, the consumption of milk and dairy products has decreased [50]. For instance, in Europe, milk consumption went from 206.89 kg/y per capita in 2000 to 196.49 kg/y per capita in 2020, while in North America it went from 199.49 kg/y per capita in 2000 to 173.94 kg/y per capita in 2020, without considering potential household waste [50]. In France, milk consumption went from 263 kg/y per capita in 2000 to 250 kg/y per capita in 2020 [50]. While public health campaigns often focus on dairy intakes among children and adolescents [53], intakes often also decrease and stall in late adolescence and adulthood [51]. Adults should also be encouraged to consume dairy, as its intake in adulthood has been associated with healthier body weights, lower risks of developing metabolic syndrome, and a good daily protein and vitamin intake [11,54,55,56].
To enable the development of tailored strategies, it is necessary to know how adults consume dairy products. This study was conducted to explore intakes and potential patterns in dairy consumption among French adults aged 18-44 years old. Several types of dairy products were considered. Previous studies have often focused on characterising the consumption of a single type of product, e.g., milk, or a specific product, e.g., cow’s milk [57,58]. However, exploring the consumption of different products in the dairy group could aid in identifying not only current patterns, but also potential substitution of high sugar/high fat dairy foods, e.g., dairy-based desserts, with healthier products consumed in the same recipes or food combinations.
2. Materials and Methods
2.1. Data Collection
Dairy consumption was explored using the data collected in 2014-2015 during the third French Individual and National Survey Consumption INCA (études Individuelles Nationales des Consommations Alimentaires). The INCA takes place every seven years, and the INCA3 was, at the time of this study, the most recent dataset [59]. This dataset is considered representative of the French population living in France, i.e., excluding French overseas departments and territories and Corsica, in terms of diet, physical activity, and other health-related aspects [59,60,61], and it was used as a reference by the Ministry of Health and Social Services (Ministère du travail, de la santé, des solidarités et de famille) for the development of the fourth French National Nutrition and Health Program PNNS (Programme National Nutrition Santé), in force from 2019 to 2024 [62].
A sample of 5855 participants completed the INCA3, of which 3157 (54%) were adults. Among them, n=783 (males n=324, 41.3%) were aged 18-44 years and so considered in this study. Most of them (52.4%) had a higher education. The sample had an average (SD) BMI of 24.7 (4.77) kg/m2, and the average daily energy intake of 2190 kcal (9,167 kJ). All data from the INCA3 database is publicly available online as .csv files, and can be downloaded for free at https://www.data.gouv.fr/fr/datasets/donnees-de-consommations-et-habitudes-alimentaires-de-letude-inca-3/#/resources, the French website for data collected by public agencies. Each .csv file gives information about different dimensions, e.g., demographics, food journals, and a thesaurus is available on the website.
Only the data necessary for this study were downloaded. Dairy consumption was explored through the file named “conso-compo-alim-vf-mad-datagouv2021”, reporting three non-consecutive 24h food journals per participant, and “description-indiv”, reporting demographic details. Participants were already grouped based on their age, i.e., for adults, 18-44 years old, and no other information was disclosed about their age.
Dietary data were collected along with many additional data, including the time of day that the consumption took place, the location, and the event. The degree of detail depended on the individual. Only diary entries that included dairy consumption were used for this study. No detail about the overall diet was considered, and foods other than dairy were considered only in relation to dairy consumption, to explore eating habits. Data were also not trimmed for implausible dietary intakes, under- or over-reporting.
2.2. Data Analysis
Once downloaded, the data were organised and analysed in Microsoft Excel.
Each dairy entry was classified manually. Sub-groups, i.e., milk, yoghurt, fermented dairy, soft cheese, hard cheese, desserts, cream, sauces, plant-based dairy alternatives (PBDA), or other, were created considering the health and environmental impacts of each product, e.g., their production process [23], their greenhouse gas emissions [kg CO2 kg-1] [48,49], and their presence in the dataset, to ensure all dairy products were classified. Each food journal was checked, and then a search per product was run to ensure all entries were associated with one of the ten sub-groups. Besides being both fermented dairy, yoghurt, and other fresh fermented products, i.e., crème fraiche, fromage blanc, Petit Suisse, quark, cottage cheese, cultured milks, were classified into two different sub-groups, as they are often associated with different types of consumption due to different sensory characteristics [63]. Flavoured products were included in the reference product sub-group, e.g., flavoured milks in the milk sub-group, flavoured yoghurts in the yoghurt sub-group. The Cream sub-group included whipped creams, double creams, and heavy creams; the Sauce sub-group included all dairy entries named as such by individuals. The Other sub-group was created to classify dairy products when specified in recipes, e.g., cheese as pizza topping, without detailed information about quantities. This sub-group was considered only while exploring potential eating patterns, not intakes. Butter was not considered as it has a different nutritional composition and use in the kitchen compared to other milk-based products [64,65]. Plant-based dairy alternatives (PBDA) were also considered. All relevant products were classified into a single PBDA sub-group, no specific sub-group was made for each type of PBDA, e.g., PBDA milk, PBDA cheese. These products were not common in the INCA3 dataset.
Six dimensions were explored for each dairy entry. Intakes were explored in terms of quantities. Dairy consumption was characterised considering eating paradigms such as patterning, e.g., frequency, and format, e.g., food combination [66], and in terms of number of entries in the dataset.
- i)
-
First dimension: intakes.Intakes were explored in terms of weight consumed (grams) and energy intake (kcal, kJ). Average daily intakes were computed for each sub-group, for ‘all dairy’, i.e., all sub-groups except PBDA, and ‘all soft dairy’, i.e., milk, yoghurt, fermented dairy, and soft cheese.
- ii)
-
Second dimension: “eaten” vs “drunk”.All fluid products, whose texture is liquid, that can be consumed alone or with other liquid products, e.g., coffee, were classified as "drunk". Products whose texture does not allow them to be consumed as a beverage, but instead are "spoonable", or whose consistency is solid, were classified as "eaten".
- iii)
-
Third dimension: “savoury” vs “sweet”.All entries were checked one by one and classified according to the foods they were consumed with. They were classified as “savoury” if consumed with other savoury foods, e.g., pasta; they were classified as “sweet” if the other foods were sugary, e.g., jam. A third label was added to classify dairy entries when not paired with any food or paired with food neither 'savoury' nor 'sweet', i.e., coffee, cocoa, tea. In these cases, entries were classified as "neither".
- iv)
-
Fourth dimension: “combined with other foods” vs “by itself”.Each dairy entry was classified based on the foods it was paired with. When the dairy was consumed by itself in a standalone meal, it was classified as “by itself”; when the dairy was consumed in a meal and the accompanying foods were specified, it was classified according to those foods, e.g., “with fruit”. When dairy was consumed as part of a meal, but no details on the accompanying foods were stated, it was classified as “in a meal”.
- v)
-
Fifth dimension: time of day of the consumption (in hours, from 0 to 23).Time of day was explored for total dairy, soft dairy, and each soft dairy product individually, hard cheese, and desserts.
- vi)
-
Sixth dimension: “meal” vs “snack”.This dimension was derived from dimension v) time of day, where meals and snacks were defined based on the time of consumption, considering traditional mealtimes in France. Notably, the daily meal structure is shared by most of the population and includes three main meals (i.e., breakfast, lunch, and dinner) at the same hours of the day [67]. A snack was defined following consumption at any other time [66,68,69].
This study was approved by the Research Ethics Committee of Bournemouth University, UK (ID: 45760). The INCA3 database is public, already anonymised, and has obtained appropriate ethical approval before its data collection.
3. Results
3.1. First Dimension: Intakes
Table 1 shows the average daily intake in terms of weight consumed (grams) and energy content (kcal and kJ). Figure 1 shows the weight consumed (a) and energy content (b) per dairy sub-group. These graphs highlight the differences in energy content of differing dairy sub-groups and make it evident that highly consumed dairy products based on weight do not necessarily also impact the diet in terms of energy, e.g., the average daily consumption of soft cheese was 19g vs yoghurt 63g, however, their impact in terms of energy intake is the same (227 kJ). A total average consumption was computed for all dairy and all soft dairy, i.e., milk, yoghurt, fermented dairy, and soft cheese, both excluding PBDA. It is interesting to note that soft dairy covers 87% of total dairy consumption. The sub-group Other was not considered due to a lack of details.
3.2. Eating Patterns
3.2.1. Second Dimension: “Eaten” vs “Drunk”
Figure 2 shows that dairy products are more likely to be eaten than drunk, except for milk and PBDA. The eaten ratio in the milk sub-group refers to milk eaten with cereals, or milk in recipes, e.g., crepes.
3.2.2. Third Dimension: “Savoury” vs “Sweet”
As shown in Figure 3, dairy is more likely to be consumed in sweet or savoury dishes according to its sub-group. For instance, while some products are consumed either in savoury or sweet dishes, e.g., cheeses vs desserts, respectively, others are suitable for both, e.g., fermented dairy products. Milk and yoghurt were also found to be consumed in neither sweet nor savoury dishes, e.g., Greek yoghurt by itself without other foods. The most diverse sub-group is the PBDA. However, it is important to remember that this group includes different types of dairy alternatives, e.g., milks, cheeses, that are usually consumed in different ways.
3.2.3. Fourth Dimension: “In Combination with Other Foods” vs “By Itself”
Figure 4 shows that dairy products are rarely consumed by themselves, and often in combinations with other foods. The degree of variety in food combinations depends on the dairy type, where food combinations vary according to the sub-group. Some sub-groups were found more suitable for different food combinations, while others, even when consumed in a meal, were more often consumed by themselves.
3.2.4. Fifth Dimension: Time of Day
Figure 5 and Figure 6 show dairy consumption throughout the day. Figure 5 shows the consumption for all dairy sub-groups, including soft dairy, and for the soft dairy sub-group; while Figure 6 focuses on each dairy sub-group by itself, without consideration of the ‘cream’, ‘sauce’, or ‘other’ sub-groups, due to low consumption. Figure 5 highlights that soft dairy covers the majority of dairy consumed, and both figures show that dairy is more likely to be consumed during traditional mealtimes and is not well distributed across the day.
3.2.5. Sixth Dimension: “Meals” vs “Snacks”
A final dimension, derived from dimension 5, time of day, shows that dairy consumption tends to happen in meals, in the morning, at lunch time, i.e., 12 am to 1 pm, and at dinner time, i.e., 7-9 pm, even though some intakes are recorded in the afternoon and after dinner too. Higher consumption of milk was recorded in the morning; however, milk entries can be seen all day long, except for at lunch and dinner. Cheeses, yoghurts, and desserts are most likely to be consumed around mealtimes, at lunch or dinner.
4. Discussion
This study aimed to explore dairy consumption in a representative dataset of French adults aged between 18 and 44 years old. Dairy consumption was explored in terms of intakes and eating patterns.
Results show that the average total consumption was 246g/d. However, this includes desserts and other products where the advice is to consume these rarely [70]. French dietary guidelines suggest a daily intake of 2 servings of dairy, between 150ml of milk, 125g of yoghurt, or 30g of cheese, or a total of 310ml as milk equivalents [51]. In this sample, soft dairy was also consumed more than other products, and this is promising as French food guidelines suggest consuming milk, yoghurt, and other fermented dairy daily, and other products less frequently [70,71], and soft dairy consumption has environmental benefits when compared with hard cheese consumption [48,49]. Milk was, as expected, found to be the most consumed product in terms of weight, as the most well-known among all dairy foods [24]. Milk is indeed a good source of protein [3], while also being a low-energy-dense product if compared to other foods, including other dairy foods, such as cheeses [72]. Yoghurt was found as the second most consumed product in terms of weight consumed, and this confirms expectations, as these dairy foods are popular in France, due to the wide availability of different types of yoghurt in the French market [51,58,73]. Yoghurt consumption has been associated with several nutritional benefits, e.g., rich in vitamin B6, and health benefits, e.g., for gut health, and its energy content is limited compared with other dairy products [7,8,46,56,74]. Other fermented dairy products were the least consumed among the soft dairy products, by weight, and this may be due to the products included in the sub-group. Products such as fromage blanc, Petit Suisse, crème fraiche, are known in France, but are still less popular than yoghurt [75], while others, such as cultured milks, e.g., lait ribot, are still associated with regional traditions [76], thus less common in the French diet [7,76,77]. Moreover, the consumption of these foods can be perceived as “disgusting”, as people associate cultured milks with expired milks, and for this reason, intakes could be affected [29,33]. Although the quantity consumed remains limited, cheeses were found to have the most impact on the diet in terms of energy. These findings demonstrate the energy density of cheeses, particularly hard cheeses, due to the lower water content.
Five dimensions further aimed at identifying eating patterns. First, dairy was more eaten than drunk, except for animal-based and plant-based milks. Even though it can be used in recipes, milk is, in fact, usually considered a beverage [78,79,80,81], and it is frequently paired with coffee, cocoa, or tea [79,80]. Other dairy foods were more eaten than drunk, as their sensory characteristics, particularly tribology and texture, make them less suitable to be consumed as beverages [82,83].
Secondly, the majority of dairy products are consumed either in sweet or in savoury dishes, but rarely in both. Only fermented dairy products and PBDA were found to be consumed in both manners. Fermented dairy products appeared as an interesting dairy sub-group, as results suggest that they are suitable for many different recipes, unlike yoghurt, which is produced through a very similar process [21,22]. Compared to yoghurt, fermented dairy products have a less defined role in the meal, and this makes them more versatile, while yoghurt in France is often consumed as a healthy replacement for desserts [29,45].
Thirdly, in the majority of dairy entries, dairy products were consumed with other foods, rather than alone, and the food combinations differed depending on the dairy sub-group. For instance, cheeses were more likely to be consumed with pasta or bread, while milk is often consumed with tea, coffee, or cocoa. Some dairy products, such as yoghurt and desserts, were also consumed in a meal but without direct combination with other foods. Dairy products have all different sensory characteristics that lead to differences in manners of consumption [82,83,84,85], thus differences in intakes. In French customs, yoghurt could indeed be consumed at the end of the meal as a dairy-based dessert, either by itself or paired with sugar, honey, or jam [45,78,86]; likewise, cheese, when paired with bread [29].
Finally, in relation to time of day, our results suggest that French adults do not consume dairy foods outside traditional mealtimes. For instance, milk is the most consumed dairy product at breakfast time and throughout the morning, and this is common across different life stages and in many countries around the world [87,88,89,90,91,92]. By comparison, yoghurt, cheeses, and desserts are more common at lunch or dinner, and this is understandable as differences in sensory characteristics may not only impact individual preferences but may also make a specific product more or less suitable for some recipes, thus impacting the manner and time of consumption [25,93,94,95,96].
These results can indeed aid in the development of strategies to boost the consumption of dairy among the target population. Suggestions to increase consumption could focus on maximizing familiar consumption scenarios, per product type, or taking advantage of existing patterns of low consumption to fill current gaps.
For instance, while the majority of dairy products are eaten and not drunk, some products, such as yoghurt-to-drink and some fresh fermented dairy products, have a texture that makes them suitable for drinking and drinkable recipes. A recent study suggests that a valuable strategy to boost fluid milk intake among adults is by adding it to smoothies, an already popular drink [104]. More liquid fermented dairy products could also be incorporated similarly.
Food combinations revealed that dairy products are already consumed in a wide range of different dishes, recipes, and direct combinations with other foods. However, the savoury vs sweet dimension suggests that the majority of sub-groups tend to be consumed in savoury or sweet dishes, and not both. New recipes or new versions of traditional recipes may be provided and/or taught to adults to boost their consumption of dairy. Yoghurt can be used to prepare a refreshing side sauce for spicy recipes [97], replacing crème fraiche, which is notably higher in fat content [98,99], or may be used in sweet dishes, in non-traditional food combinations [98], e.g., yoghurt with fruit, nuts, and chocolate or caramel for a lower-fat dessert. Soft cheese, similarly, while usually consumed in savoury dishes, can be paired with fruit, nuts, and sweet biscuits for a sweet dish.
France has a strong food culture, including a long-lasting dairy tradition [38,100,101], with dairy foods from different production processes and with different sensory characteristics [23,25,93,94]. This may indeed have an impact on food combinations and dietary choices, in creating individual and cultural unspoken rules. Apps and digital tools may be developed or implemented to enable personalised recipe substitution, permitting consumers to swap between products with similar sensory characteristics or taking into account personal preferences or needs [103].
In the late 1990s - early 2000s, a change in the structure of the meals was recorded in France, following a change in social structure, especially related to work-life balance [67]. Although the French now have more opportunities to eat outside their main meals [67], the results of the present study suggest that French adults do not consume dairy foods outside traditional mealtimes. However, the French dietary guidelines already suggest consuming dairy, specifically soft dairy products, as mid-afternoon snacks [70], in combination with fruits and bread [70]. Strategies increasing the accessibility and availability of healthy foods in different out-of-home locations, such as canteens, restaurants, and food trucks, have already been tested to promote healthier food choices, including dairy consumption, with promising results [105,106,107]. Higher availability of these products in vending machines could also boost their consumption, assuming safety concerns are addressed, if these products are coupled with good product positioning, readable labelling, and accessible prices [108,109,110,111,112,113]. Other strategies could be helpful, such as implementing menus, considering rewards, incentives [107], or better promotion of these products, through an infographic with key messages, e.g., recommended frequency of consumption, via different communication channels [114,115]. Developing tailored strategies promoting consumption of dairy at unusual times or out of home may indeed boost consumption of these products while also increasing the chances of adhering to food guidelines.
5. Conclusions
Results showed that in France, among adults aged 18-44 years, an average of 246g and 1126kJ of dairy is consumed per day, from a variety of dairy sub-groups. Focusing on dietary patterns, dairy was more eaten than drunk, in sweet and savoury dishes depending on the type of product, in proper meals in combination with other foods, rarely by itself, and is mostly consumed at traditional mealtimes and rarely as a mid-day snack. Suggestions to increase consumption could focus on maximizing these familiar consumption scenarios, per product type, or taking advantage of current patterns of low consumption to fill current gaps.
Author Contributions
Conceptualization, K.M.A. and C.F.; methodology, K.M.A, C.F.; investigation, C.F.; analysis, C.F.; writing—original draft preparation, C.F.; writing—review and editing, K.M.A., A.D., J.M., C.F.; supervision, K.M.A., A.D., J.M.; funding acquisition, K.M.A., A.D, J.M. All authors have read and agreed to the published version of the manuscript.
Funding
This research was funded by Bournemouth University, UK; the Institut Lyfe – Lyon for excellence Research & Innovation Center, France, and Danone S.A., and was completed as part of the PhD studentship under-taken by C.F. and supervised by A.D., J. M. and K.M.A.
Institutional Review Board Statement
This study was approved by the Research Ethics Committee of Bournemouth University, UK (ID: 45760). The INCA3 database is public, already anonymised, and has obtained appropriate ethics approval before its data collection.
Data Availability Statement
For this study, data were download from the INCA3 database. The INCA3 is entirely available online on the French website for data collected by public agencies. All data can be downloaded for free at https://www.data.gouv.fr/fr/datasets/donnees-de-consommations-et-habitudes-alimentaires-de-letude-inca-3/#/resources.
Conflicts of Interest
This work was part funded by Danone S.A. – a company with a product portfolio that includes dairy products. The funders had no role in the design of the study; in the collection, analyses, or interpretation of data; in the writing of the manuscript; or in the decision to publish the results.
Abbreviations
The following abbreviations are used in this manuscript:
| BMI | Body Mass Index |
| INCA | French Individual and National Survey Consumption (études Individuelles Nationales des Consommations Alimentaires) |
| Kcal | Kilocalories |
| kJ | Kilojoules, 1Kcal = 4.186 kJ. |
| PBDA | Plant-Based Dairy Alternatives |
| PNNS | French National Nutrition and Health Program (Programme National Nutrition Santé) |
| UK | United Kingdom |
References
- Rozenberg S, Body J-J, Bruyère O, Bergmann P, Brandi M L, Cooper C, Devogelaer J-P, Gielen E, Goemaere S, Kaufman J-M, Rizzoli R and Reginster J-Y 2016 Effects of Dairy Products Consumption on Health: Benefits and Beliefs—A Commentary from the Belgian Bone Club and the European Society for Clinical and Economic Aspects of Osteoporosis, Osteoarthritis and Musculoskeletal Diseases Calcif Tissue Int 98 1–17.
- Clegg M E, Tarrado Ribes A, Reynolds R, Kliem K and Stergiadis S 2021 A comparative assessment of the nutritional composition of dairy and plant-based dairy alternatives available for sale in the UK and the implications for consumers’ dietary intakes Food Research International 148 110586. [CrossRef]
- Hoffman J R and Falvo M J 2005 Protein - Which is best? nternational Society of Sports Nutrition Symposium. Symposium - Macronutrient Utilization During Exercise: Implications For Performance And Supplementation vol 3 (Las Vegas, NV, USA: Journal of Sports Science and Medicine) pp 118–30.
- Mozaffarian D 2019 Dairy Foods, Obesity, and Metabolic Health: The Role of the Food Matrix Compared with Single Nutrients Advances in Nutrition 10 917S-923S. [CrossRef]
- Prentice A M 2014 Dairy products in global public health The American Journal of Clinical Nutrition 99 1212S-1216S. [CrossRef]
- Tunick M H and Van Hekken D L 2015 Dairy Products and Health: Recent Insights J. Agric. Food Chem. 63 9381–8. [CrossRef]
- Savaiano D A and Hutkins R W 2021 Yogurt, cultured fermented milk, and health: a systematic review Nutrition Reviews 79 599–614.
- Kok C R and Hutkins R 2018 Yogurt and other fermented foods as sources of health-promoting bacteria Nutrition Reviews 76 4–15.
- Das C, Das P P and Kambhampati S B S 2023 Sarcopenia and Osteoporosis JOIO 57 33–41.
- Hereford T, Kellish A, Samora J B and Reid Nichols L 2024 Understanding the importance of peak bone mass Journal of the Pediatric Orthopaedic Society of North America 7 100031. [CrossRef]
- Wallace T C, Bailey R L, Lappe J, O’Brien K O, Wang D D, Sahni S and Weaver C M 2021 Dairy intake and bone health across the lifespan: a systematic review and expert narrative Critical Reviews in Food Science and Nutrition 61 3661–707. [CrossRef]
- Zingone F, Bucci C, Iovino P and Ciacci C 2017 Consumption of milk and dairy products: Facts and figures Nutrition 33 322–5.
- Lad S S, Aparnathi K D, Mehta B and Velpula S 2017 Goat Milk in Human Nutrition and Health – A Review Int.J.Curr.Microbiol.App.Sci 6 1781–92. [CrossRef]
- Raynal-Ljutovac K, Lagriffoul G, Paccard P, Guillet I and Chilliard Y 2008 Composition of goat and sheep milk products: An update Small Ruminant Research 79 57–72. [CrossRef]
- Gerber P J and Food and Agriculture Organization of the United Nations 2013 Tackling climate change through livestock: a global assessment of emissions and mitigation opportunities (Rome: Food and Agriculture Organization of the United Nations).
- FAO 2022 FAO Strategy on Climate Change 2022–2031 (Rome).
- Gaillac R and Marbach S 2021 The carbon footprint of meat and dairy proteins: A practical perspective to guide low carbon footprint dietary choices Journal of Cleaner Production 321 128766.
- Berners-Lee M, Hoolohan C, Cammack H and Hewitt C N 2012 The relative greenhouse gas impacts of realistic dietary choices Energy Policy 43 184–90. [CrossRef]
- Haenlein G F W 2007 About the evolution of goat and sheep milk production Small Ruminant Research 68 3–6.
- Peacock C and Sherman D M 2010 Sustainable goat production—Some global perspectives Small Ruminant Research 89 70–80.
- Bylund G 1995 Dairy Processing Handbook (AB S-221 86 Lund, Sweden: Tetra Pak Processing Systems).
- Weltgesundheitsorganisation and FAO 2011 Milk and milk products. Second edition. (Rome: Food and Agriculture Organization of the United Nations).
- Almena-Aliste M and Mietton B 2017 Cheese Classification, Characterization, and Categorization: A Global Perspective Microbiol Spectrum` 2 29.
- Paul A A, Kumar S, Kumar V and Sharma R 2020 Milk Analog: Plant based alternatives to conventional milk, production, potential and health concerns Critical Reviews in Food Science and Nutrition 60 3005–23. [CrossRef]
- Ojeda M, Etaio I, Valentin D, Dacremont C, Zannoni M, Tupasela T, Lilleberg L and Pérez-Elortondo F J 2021 Effect of consumers’ origin on perceived sensory quality, liking and liking drivers: A cross-cultural study on European cheeses Food Quality and Preference 87 104047.
- Palacios O M, Badran J, Drake M A, Reisner M and Moskowitz H R 2009 Consumer acceptance of cow’s milk versus soy beverages: impact of ethnicity, lactose tolerance and sensory preference segmentation Journal of Sensory Studies 24 731–48.
- Cardello A V, Llobell F, Jin D, Ryan G S and Jaeger S R 2024 Sensory drivers of liking, emotions, conceptual and sustainability concepts in plant-based and dairy yoghurts Food Quality and Preference 113 105077.
- Brennan L, Francis C, Jenkins E L, Schivinski B, Jackson M, Florence E, Parker L, Langley S, Lockrey S, Verghese K, Phan-Le N T, Hill A and Ryder M 2023 Consumer Perceptions of Food Packaging in Its Role in Fighting Food Waste Sustainability 15 1917.
- Franzon C, Dougkas A, Memery J, Prigent J and Appleton K M 2024 A qualitative study to explore and identify reasons for dairy consumption and non-consumption among young adults (18-30 years old) in the UK and France Journal of Nutritional Science 13 1–10.
- Cruwys T, Bevelander K E and Hermans R C J 2015 Social modeling of eating: A review of when and why social influence affects food intake and choice Appetite 86 3–18. [CrossRef]
- Racey M, Bransfield J, Capello K, Field D, Kulak V, Machmueller D, Preyde M and Newton G 2017 Barriers and Facilitators to Intake of Dairy Products in Adolescent Males and Females With Different Levels of Habitual Intake Global Pediatric Health 4 2333794X1769422.
- Douglas M 1972 Deciphering a Meal (The MIT Press on behalf of American Academy of Arts & Sciences).
- Harris M 1998 Good to eat: Riddles of food and culture (Waveland Press). [CrossRef]
- Chinea C, Suárez E and Hernández B 2020 Meaning of food in eating patterns BFJ 122 3331–41. [CrossRef]
- Holm L, Skov Luridsen D, Gronow J, Khama N, Kjærnes U, Bøker Lund T, Mäkelä J and Niva M 2019 The food we eat Everyday Eating in Denmark, Finland, Norway and Sweden. A Comparative Study of Meal Patterns 1997-2012 (Bloomsbury Publishing) p 248.
- Visser M 2017 The rituals of dinner. The origin, evolution, eccentrities and meaning of table manners. (Penguin Books).
- Poulain J P 2002 The contemporary diet in France: “de-structuration” or from commensalism to “vagabond feeding” Appetite 39 43–55.
- Delfosse C 2012 La France et ses terroirs. Un siècle de débats sur les produits et leurs liens à l’espace: Pour N° 215-216 63–74.
- Gray A 2010 “The Greatest Ordeal”: Using Biography to Explore the Victorian Dinner Post-Medieval Archaeology 44 255–72.
- Harding G 2021 Dinner Is the Great Trial: Sociability and Service à la Russe in the Long Nineteenth Century.
- Almerico G M 2014 Food and identity: Food studies, cultural, and personal identity Journal of International Business and Cultural Studies 8.
- Duncan S E 1998 Dairy Products: The Next Generation. Altering the Image of Dairy Products Through Technology Journal of Dairy Science 81 877–83. [CrossRef]
- Pulina G, Milán M J, Lavín M P, Theodoridis A, Morin E, Capote J, Thomas D L, Francesconi A H D and Caja G 2018 Invited review: Current production trends, farm structures, and economics of the dairy sheep and goat sectors Journal of Dairy Science 101 6715–29. [CrossRef]
- Laila A, Topakas N, Farr E, Haines J, Ma D W, Newton G and Buchholz A C 2021 Barriers and facilitators of household provision of dairy and plant-based dairy alternatives in families with preschool-age children Public Health Nutr. 24 5673–85.
- Kemp B J, White-Flynn T T, Lyons O C, Cronin B E, O’Donovan C B, Donovan C M and Flynn M A T 2017 Is it yoghurt or is it a dessert? Proc. Nutr. Soc. 76 E69.
- Valli C and Traill W B 2005 Culture and food: a model of yoghurt consumption in the EU Food Quality and Preference 16 291–304. [CrossRef]
- Hobbs D A, Durrant C, Elliott J, Givens D I and Lovegrove J A 2020 Diets containing the highest levels of dairy products are associated with greater eutrophication potential but higher nutrient intakes and lower financial cost in the United Kingdom Eur J Nutr 59 895–908. [CrossRef]
- Berners-Lee M, Hoolohan C, Cammack H and Hewitt C N 2012 The relative greenhouse gas impacts of realistic dietary choices Energy Policy 43 184–90. [CrossRef]
- Agence de la transition écologique 2021 Agribalyse dataset, Synthese.
- Our World in Data 2025 “Yearly per capita supply of milk - excluding butter” [dataset]. Food and Agriculture Organization of the United Nations, “Food Balances: Food Balances (-2013, old methodology and population)”; Food and Agriculture Organization of the United Nations, “Food Balances: Food Balances (2010-)” [original data]. ourworldindata.org.
- European Dairy Association 2021 EDA Factsheet ‘Daily Dairy Recommendations: Are we eating enough dairy?’.
- Weaver C M 2014 How sound is the science behind the dietary recommendations for dairy? The American Journal of Clinical Nutrition 99 1217S-1222S. [CrossRef]
- Baker I A, Elwood P C, Hughes J, Jones M, Moore F and Sweetnam P M 1980 A randomised controlled trial of the effect of the provision of free school milk on the growth of children. Journal of Epidemiology & Community Health 34 31–4. [CrossRef]
- Chen G-C, Szeto I M Y, Chen L-H, Han S-F, Li Y-J, Van Hekezen R and Qin L-Q 2015 Dairy products consumption and metabolic syndrome in adults: systematic review and meta-analysis of observational studies Sci Rep 5 14606. [CrossRef]
- Zhang K and Wu J 2024 Meat–Egg–Dairy Consumption and Frailty among Chinese Older Adults: Exploring Rural/Urban and Gender Differences Nutrients 16 1334.
- Laird E, Casey M C, Ward M, Hoey L, Hughes C F, Mccarroll K, Cunningham C, Strain J J, Mcnulty H and Molloy A M 2017 Dairy intakes in older Irish aduts and effects on vitamin micronutrient status: data from the TUDA study J Nutr Health Aging 21 8.
- Kapaj A 2018 Factors that influence milk consumption world trends and facts uropean Journal of Business, Economics and Accountancy 6.
- Charby J, Hébel P and Vaudaine S 2017 Les produits laitiers en France : évolution du marché et place dans la diète Cahiers de Nutrition et de Diététique 52 S25–34.
- Ministère des solidarités et de la santé 2019 Programme National Nutrition Santé 2019-2023 (PNNS4), Annexe 4 (Ministère du travail, de la santé, des solidarités et de famille, France).
- Agence nationale de sécurité sanitaire (ANSES) 2017 INCA 3 : Evolution des habitudes et modes de consommation, de nouveaux enjeux en matière de sécurité sanitaire et de nutrition.
- Agence nationale de sécurité sanitaire (ANSES) 2017 Étude individuelle nationale des consommations alimentaires 3 (INCA 3) - Avis de l’Anses - Rapport d’expertise collective (Agence nationale de sécurité sanitaire (ANSES)).
- Ministère du travail, de la santé, des solidarités et de famille, France 2025 Programme national nutrition santé (PNNS) - Professionnels.
- Tamime A 2002 Fermented milks: a historical food with modern applications–a review Eur J Clin Nutr 56 S2–15. [CrossRef]
- Public Health England 2016 The Eatwell Guide.
- U.S. Department of Agriculture and U.S. Department of Health and Human Services 2020 Dietary Guidelines for Americans, 2020-2025.
- Leech R M, Worsley A, Timperio A and McNaughton S A 2015 Characterizing eating patterns: a comparison of eating occasion definitions The American Journal of Clinical Nutrition 102 1229–37. [CrossRef]
- Poulain J P 2002 The contemporary diet in France: “de-structuration” or from commensalism to “vagabond feeding” Appetite 39 43–55.
- Hess J M, Jonnalagadda S S and Slavin J L 2016 What Is a Snack, Why Do We Snack, and How Can We Choose Better Snacks? A Review of the Definitions of Snacking, Motivations to Snack, Contributions to Dietary Intake, and Recommendations for Improvement Advances in Nutrition 7 466–75. [CrossRef]
- Ovaskainen M-L, Reinivuo H, Tapanainen H, Hannila M-L, Korhonen T and Pakkala H 2006 Snacks as an element of energy intake and food consumption Eur J Clin Nutr 60 494–501. [CrossRef]
- Observatoire Economique de l’Achat Publique 2015 Recommandation nutrition groupe d’étude des marchès de restauration collective et nutrition GEM-RCN. Version 2.0 – Juillet 2015.
- Ministère des solidarités et de la santé 2018 Programme National Nutrition Santé (PNNS) 2019-2023.
- ANSES 2016 Ciqual Table de composition nutritionnelle des aliments.
- European Commission 2023 MMO Economic Board. Milk market observatory. Annex: Milk market situation.
- Szczepańska E, Janota B, Wlazło M and Czapla M 2021 Eating behaviours, the frequency of consumption of selected food products, and selected elements of lifestyle among young dancers Rocz Panstw Zakl Hig 67–76.
- Cesbron-Lavau E, Lubrano-Lavadera A-S, Braesco V and Deschamps E 2017 Fromages blancs, petits-suisses et laits fermentés riches en protéines Cahiers de Nutrition et de Diététique 52 33–40.
- Bourlioux P 2007 Histoire des laits fermentes Cahiers de Nutrition et de Diététique 42 6.
- Tamime A 2002 Fermented milks: a historical food with modern applications–a review Eur J Clin Nutr 56 S2–15. [CrossRef]
- Herpin N 1988 Le repas comme institution: Compte rendu d’une enquête exploratoire Revue Française de Sociologie 29 503. [CrossRef]
- Roy B D 2008 Milk: the new sports drink? A Review Journal of the International Society of Sports Nutrition 5 15.
- Ng S W, Ni Mhurchu C, Jebb S A and Popkin B M 2012 Patterns and trends of beverage consumption among children and adults in Great Britain, 1986–2009 Br J Nutr 108 536–51.
- McCarthy K S, Parker M, Ameerally A, Drake S L and Drake M A 2017 Drivers of choice for fluid milk versus plant-based alternatives: What are consumer perceptions of fluid milk? Journal of Dairy Science 100 6125–38. [CrossRef]
- Corvera-Paredes B, Sánchez-Reséndiz A I, Medina D I, Espiricueta-Candelaria R S, Serna-Saldívar S and Chuck-Hernández C 2022 Soft Tribology and Its Relationship With the Sensory Perception in Dairy Products: A Review Front. Nutr. 9 874763. [CrossRef]
- Kupiec B and Revell B 1998 Speciality and artisanal cheeses today: the product and the consumer British Food Journal 100 236–43. [CrossRef]
- Conti-Silva A C and Souza-Borges P K D 2019 Sensory characteristics, brand and probiotic claim on the overall liking of commercial probiotic fermented milks: Which one is more relevant? Food Research International 116 184–9.
- Farag M A, Jomaa S A, Abd El-Wahed A and R. El-Seedi H 2020 The Many Faces of Kefir Fermented Dairy Products: Quality Characteristics, Flavour Chemistry, Nutritional Value, Health Benefits, and Safety Nutrients 12 346.
- Saint-Eve A, Leclercq H, Berthelo S, Saulnier B, Oettgen W and Delarue J 2016 How much sugar do consumers add to plain yogurts? Insights from a study examining French consumer behavior and self-reported habits Appetite 99 277–84. [CrossRef]
- Michaud C, Baudier F, Guilbert P, Carel D, Le Bihan G, Gautier A and Delamaire C 2004 Les repas des français : résultats du baromètre santé nutrition 2002 Cahiers de Nutrition et de Diététique 39 203–9.
- Michels N, De Henauw S, Beghin L, Cuenca-García M, Gonzalez-Gross M, Hallstrom L, Kafatos A, Kersting M, Manios Y, Marcos A, Molnar D, Roccaldo R, Santaliestra-Pasías A M, Sjostrom M, Reye B, Thielecke F, Widhalm K and Claessens M 2016 Ready-to-eat cereals improve nutrient, milk and fruit intake at breakfast in European adolescents Eur J Nutr 55 771–9. [CrossRef]
- Ozdogan Y, Yardimci H and Ozcelik A O 2017 Young adults’ milk consumption habits and knowledge about milk Studies on Ethno-Medicine 11 106–13.
- Rubio-Martín E, García-Escobar E, Ruiz De Adana M-S, Lima-Rubio F, Peláez L, Caracuel A-M, Bermúdez-Silva F-J, Soriguer F, Rojo-Martínez G and Olveira G 2017 Comparison of the Effects of Goat Dairy and Cow Dairy Based Breakfasts on Satiety, Appetite Hormones, and Metabolic Profile Nutrients 9 877.
- Blondin S A, Goldberg J P, Cash S B, Griffin T S and Economos C D 2018 Factors Influencing Fluid Milk Waste in a Breakfast in the Classroom School Breakfast Program Journal of Nutrition Education and Behavior 50 349-356.e1. [CrossRef]
- Fagt S, Matthiessen J, Thyregod C, Kørup K and Biltoft-Jensen A 2018 Breakfast in Denmark. Prevalence of Consumption, Intake of Foods, Nutrients and Dietary Quality. A Study from the International Breakfast Research Initiative Nutrients 10 1085. [CrossRef]
- Kupiec B and Revell B 1998 Speciality and artisanal cheeses today: the product and the consumer British Food Journal 100 236–43. [CrossRef]
- Murphy M, Cowan C, Meehan H and O’Reilly S 2004 A conjoint analysis of Irish consumer preferences for farmhouse cheese British Food Journal 106 288–300. [CrossRef]
- Jaeger S R and Porcherot C 2017 Consumption context in consumer research: methodological perspectives Current Opinion in Food Science 15 30–7.
- Borghini A 2015 What Is a Recipe? J Agric Environ Ethics 28 719–38.
- Garabuau-Moussaoui I 2001 La cuisine des jeunes : désordre alimentaire, identité générationnelle et ordre social Anthropology of food - Traditions et identités alimentaires locales 0.
- Hasan B, Thompson W G, Almasri J, Wang Z, Lakis S, Prokop L J, Hensrud D D, Frie K S, Wirtz M J, Murad A L, Ewoldt J S and Murad M H 2019 The effect of culinary interventions (cooking classes) on dietary intake and behavioral change: a systematic review and evidence map BMC Nutr 5 29. [CrossRef]
- Lee Y, Kim T and Jung H 2022 The Relationships between Food Literacy, Health Promotion Literacy and Healthy Eating Habits among Young Adults in South Korea Foods 11 2467.
- Delfosse C 2012 La diffusion mondiale de la consommation de fromage, de l’ingrédient de pizza au produit de terroir: Pour N° 215-216 123–9. [CrossRef]
- Fumey G 2012 La France, un plateau de fromages: La Géographie N° 1544 25–7. [CrossRef]
- Forwood S E 2025 Solving the diet problem: meals as food choice heuristics for behaviour change Current Opinion in Food Science 64 101317.
- Fatemi B, Duval Q, Girdhar R, Drozdzal M and Romero-Soriano A 2023 Learning to Substitute Ingredients in Recipes.
- Jung M E, Mistry C, Bourne J E, Perrier M-J, Martin Ginis K A and Latimer-Cheung A E 2015 A qualitative investigation of adults’ perceived benefits, barriers and strategies for consuming milk and milk products Health Education Journal 74 364–78.
- Glanz K 2004 Increasing fruit and vegetable intake by changing environments, policy and pricing: restaurant-based research, strategies, and recommendations*1 Preventive Medicine 39 88–93. [CrossRef]
- Glanz K and Mullis R M 1988 Environmental Interventions to Promote Healthy Eating: A Review of Models, Programs, and Evidence Health Education Quarterly 15 395–415. [CrossRef]
- Mandracchia F, Tarro L, Llauradó E, Valls R M and Solà R 2021 Interventions to Promote Healthy Meals in Full-Service Restaurants and Canteens: A Systematic Review and Meta-Analysis Nutrients 13 1350. [CrossRef]
- Rozman U, Lorber M, Bolha A, Bahar J B, Lavrič M and Turk S Š 2025 Sustainability aspects of food and drinks offered in vending machines at Slovenian universities Front. Nutr. 12 1439690. [CrossRef]
- Whatnall M, Fozard T, Kolokotroni K Z, Marwood J, Evans T, Ells L J and Burrows T 2022 Understanding eating behaviours, mental health and weight change in young adults: protocol paper for an international longitudinal study BMJ Open 12 e064963. [CrossRef]
- Calabro R, Kemps E, Prichard I and Tiggemann M 2024 Vending machine backgrounds: nudging healthier beverage choices Curr Psychol 43 1733–42.
- Bos C, Van Der Lans I A, Van Kleef E and Van Trijp H C M 2018 Promoting healthy choices from vending machines: Effectiveness and consumer evaluations of four types of interventions Food Policy 79 247–55. [CrossRef]
- Rosi A, Zerbini C, Pellegrini N, Scazzina F, Brighenti F and Lugli G 2017 How to improve food choices through vending machines: The importance of healthy food availability and consumers’ awareness Food Quality and Preference 62 262–9. [CrossRef]
- Carrad A M, Louie J C, Milosavljevic M, Kelly B and Flood V M 2015 Consumer support for healthy food and drink vending machines in public places Australian and New Zealand Journal of Public Health 39 355–7. [CrossRef]
- Palascha A and Chang B P I 2024 Which messages about healthy and sustainable eating resonate best with consumers with low socio-economic status? Appetite 198 107350.
- Myers J, Schweiger D and Clark S 2024 Dairy nutrition educational messages help increase dairy product knowledge, purchasing, and consumption JDS Communications 5 13–7. [CrossRef]
Figure 1.
Average weight consumed (a) and energy content (b) for each dairy sub-group. Percentage of energy content are shown to highlight the impact of the different products compared to the total intakes.
Figure 1.
Average weight consumed (a) and energy content (b) for each dairy sub-group. Percentage of energy content are shown to highlight the impact of the different products compared to the total intakes.
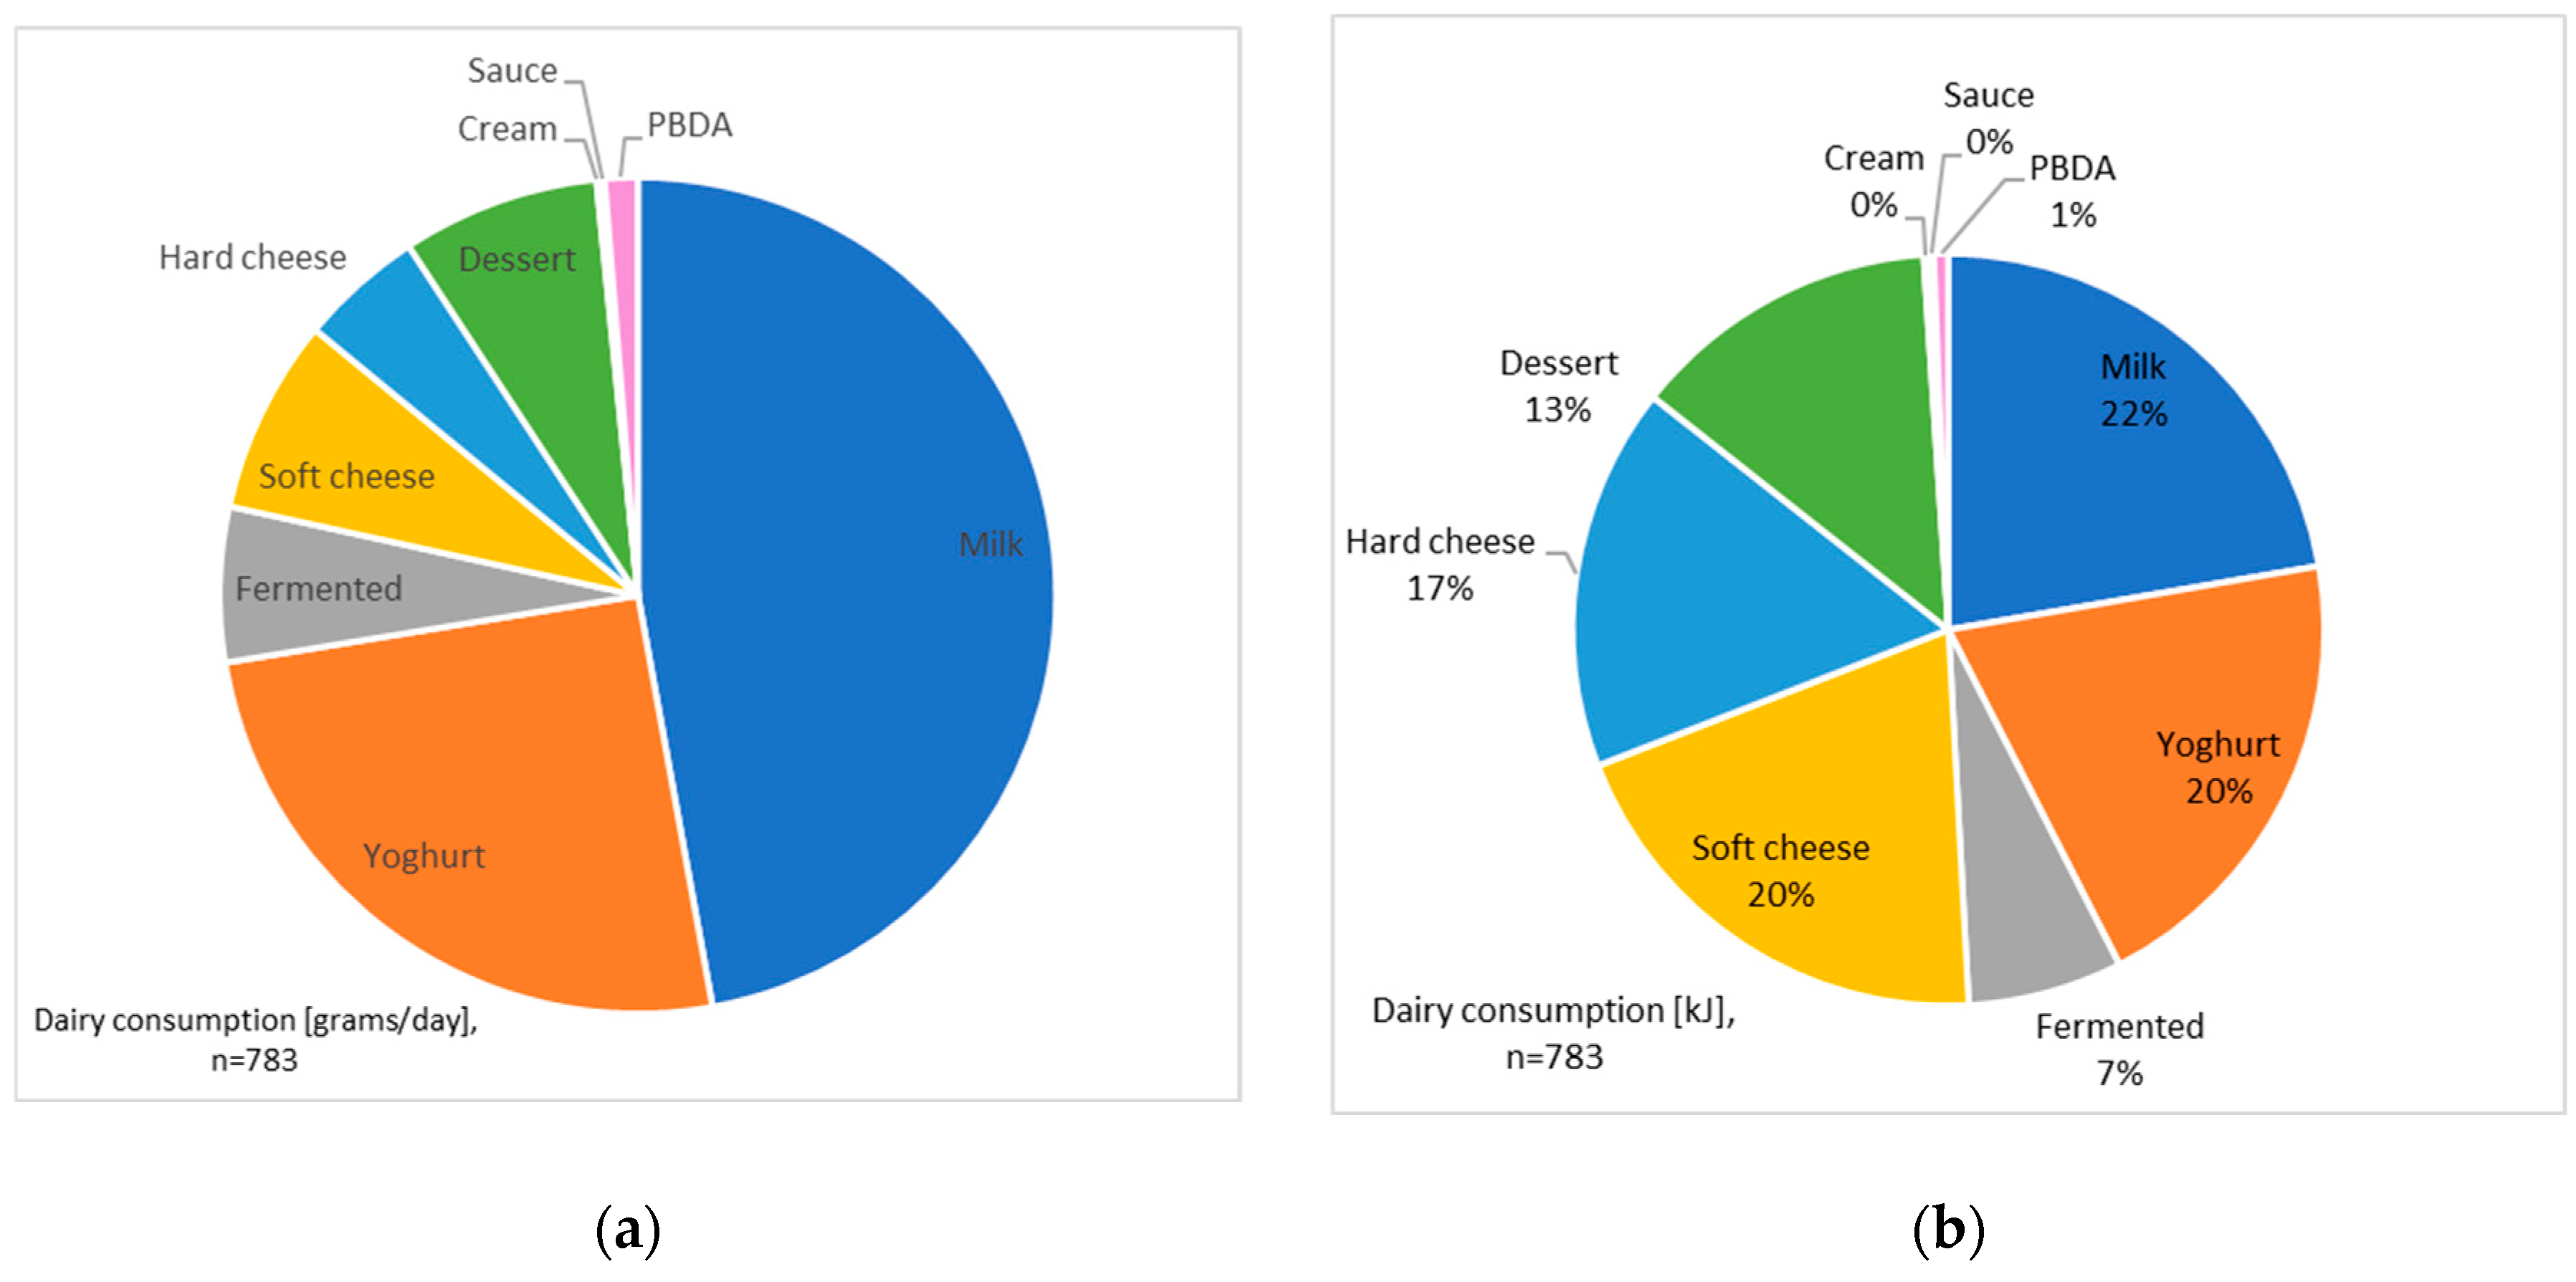
Figure 2.
How dairy sub-groups are consumed [%]. Dairy is mostly “eaten”, except for milk and PBDA.
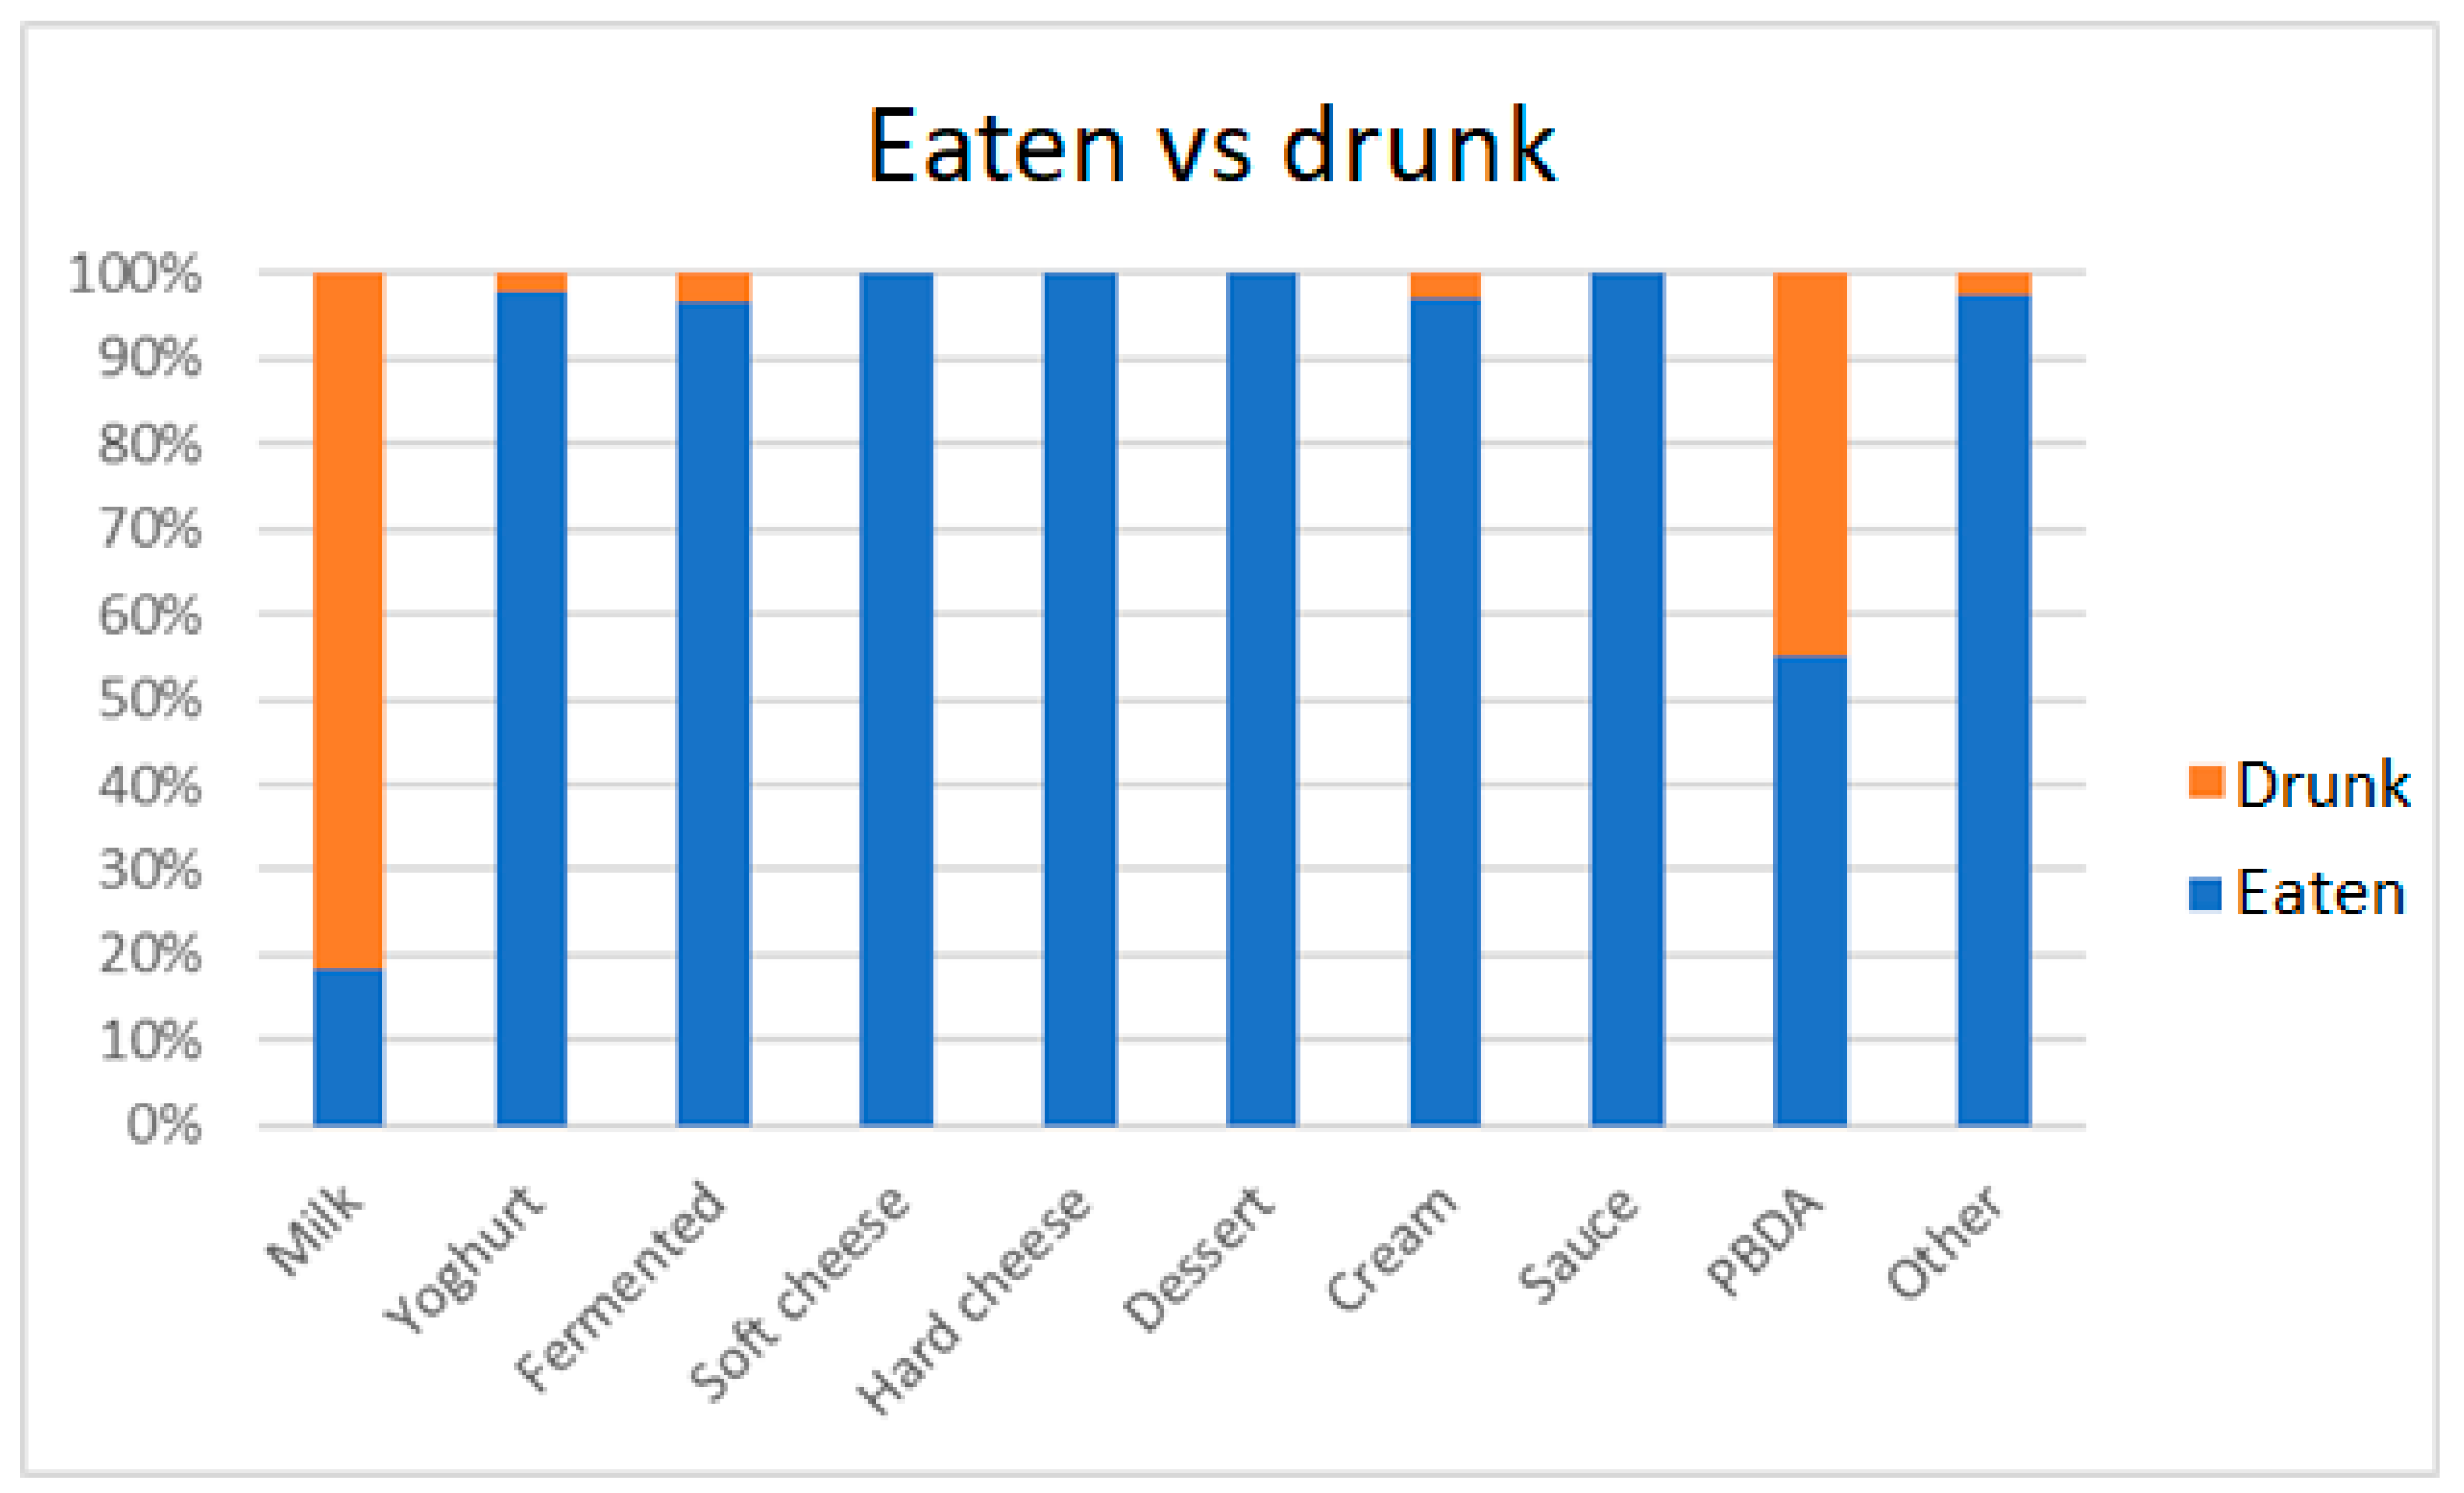
Figure 3.
How dairy sub-groups are consumed [%]. Sub-groups can be consumed differently, some of them in both savoury and sweet dishes, or neither way.
Figure 3.
How dairy sub-groups are consumed [%]. Sub-groups can be consumed differently, some of them in both savoury and sweet dishes, or neither way.
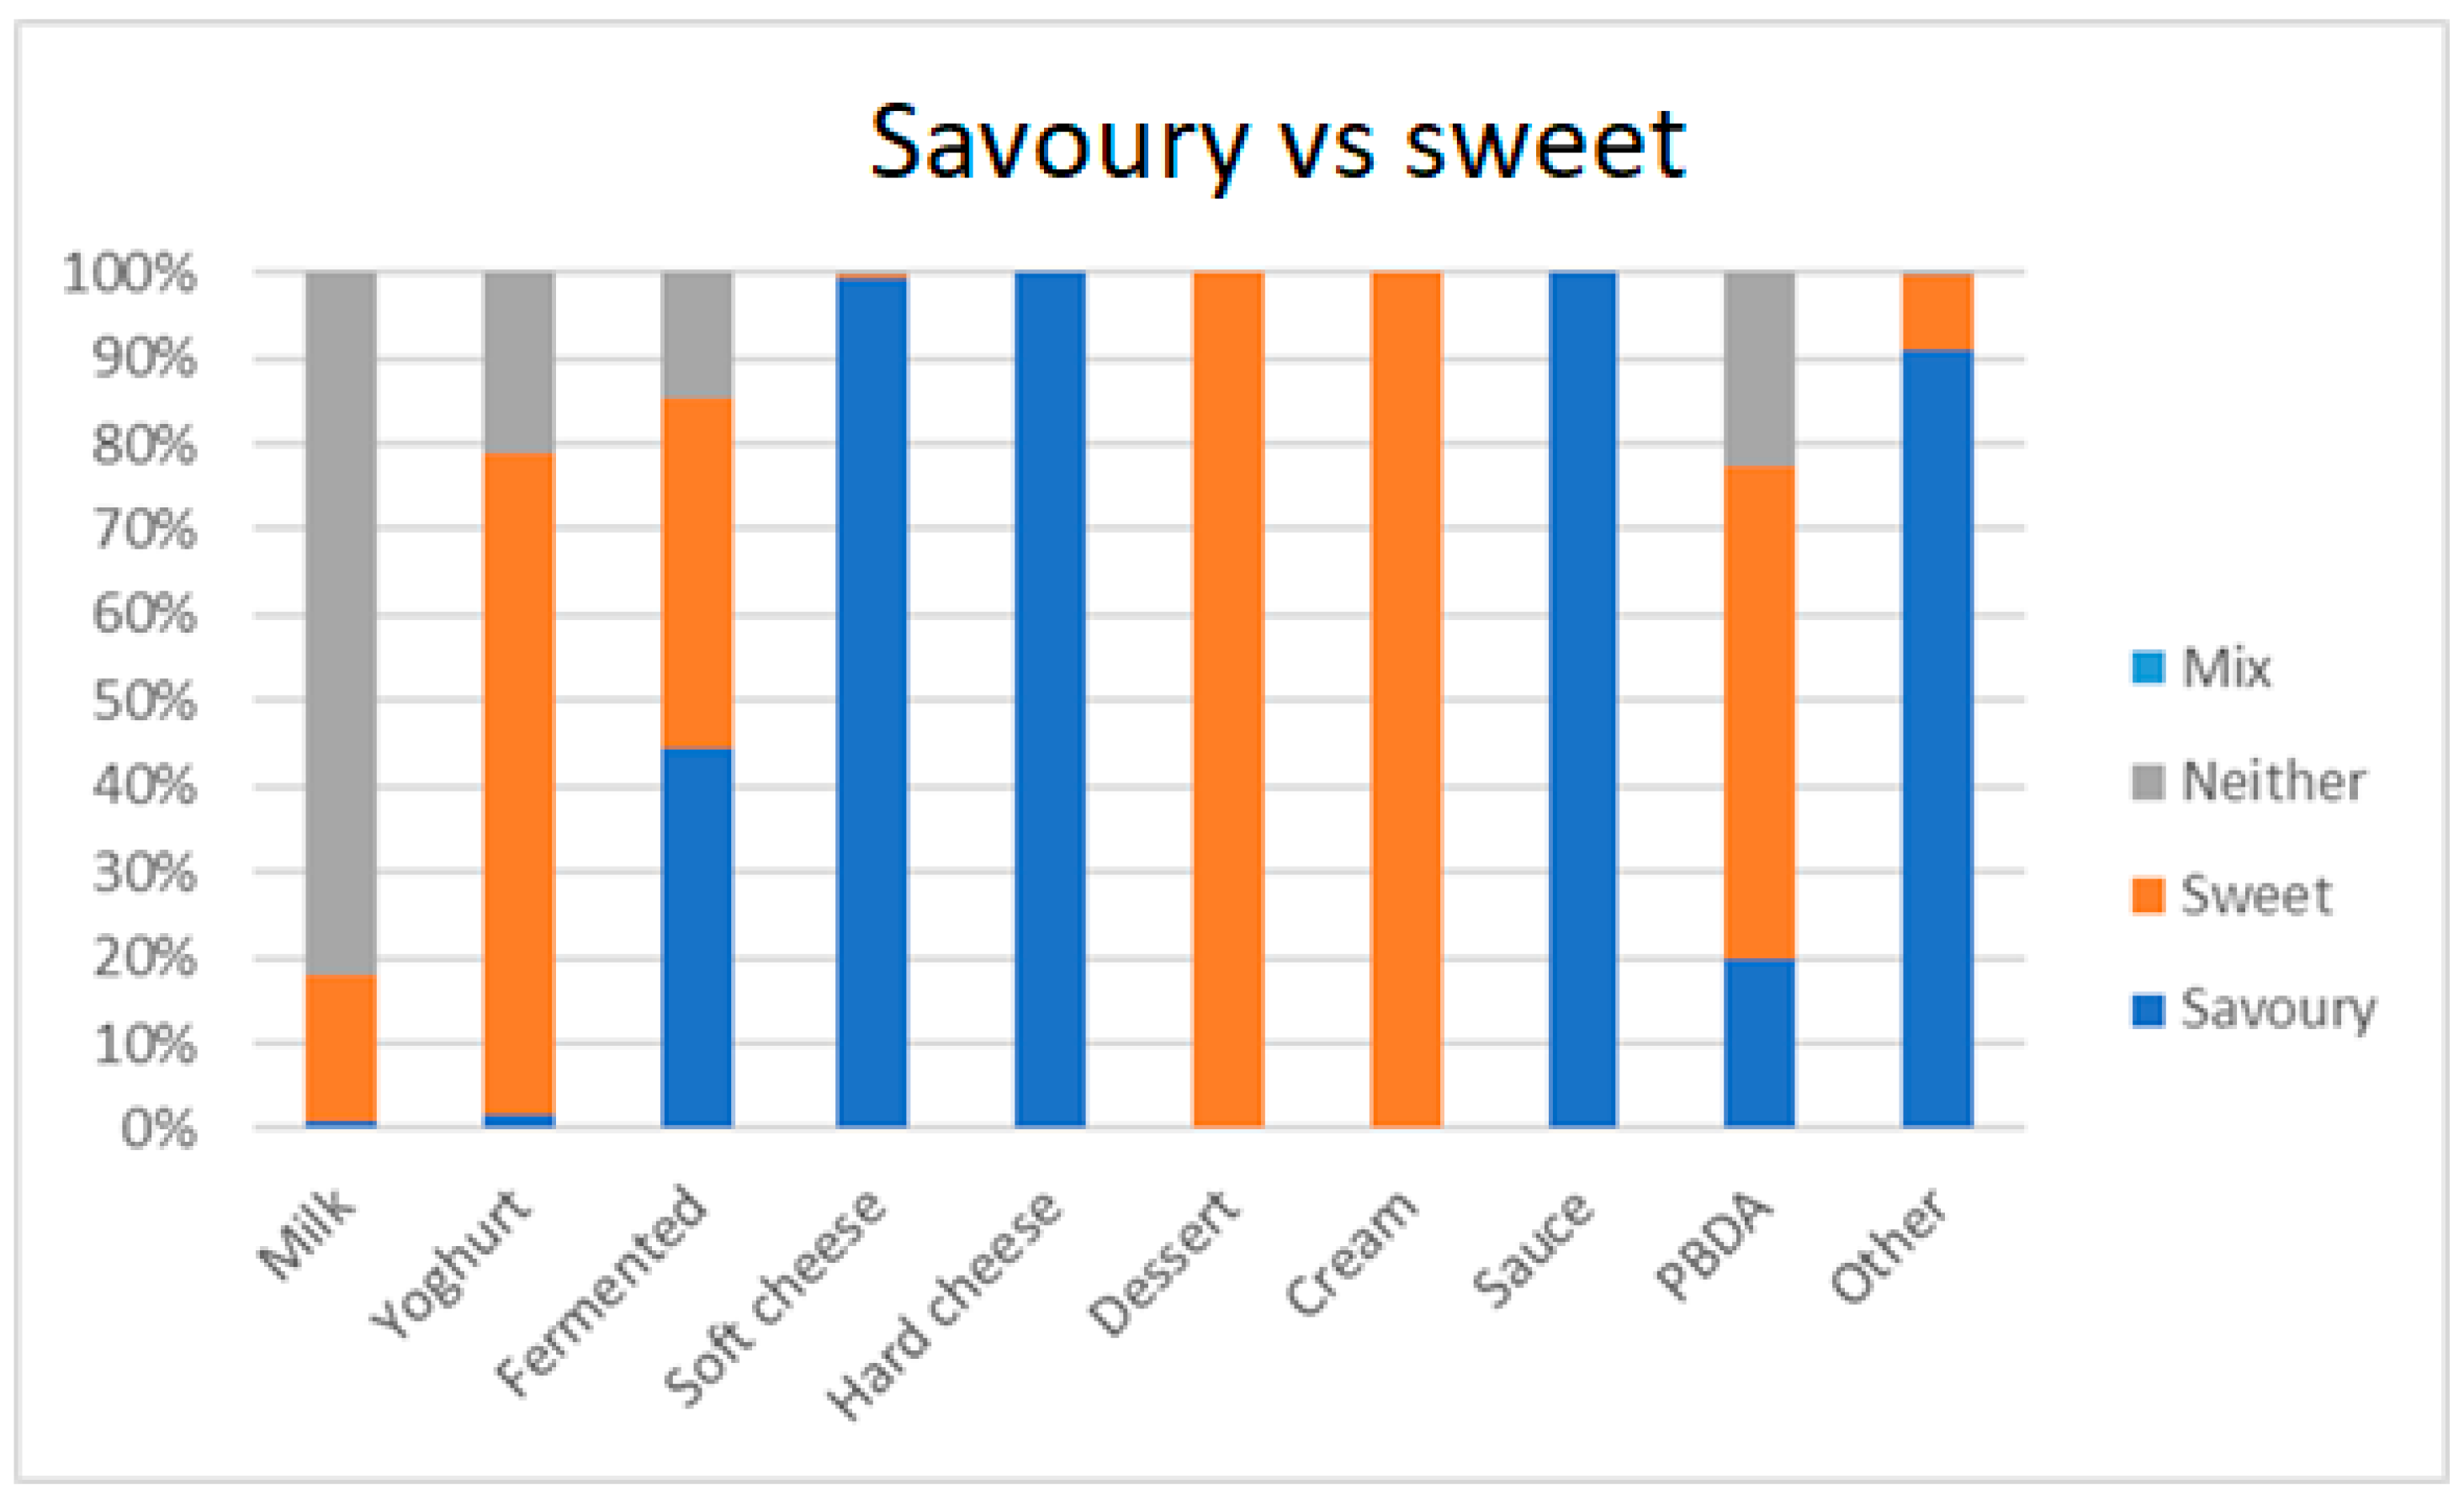
Figure 4.
How dairy sub-groups are consumed [%]. In meal refers to dairy entries recorded in the same meal with other foods, but without specific details of combination.
Figure 4.
How dairy sub-groups are consumed [%]. In meal refers to dairy entries recorded in the same meal with other foods, but without specific details of combination.
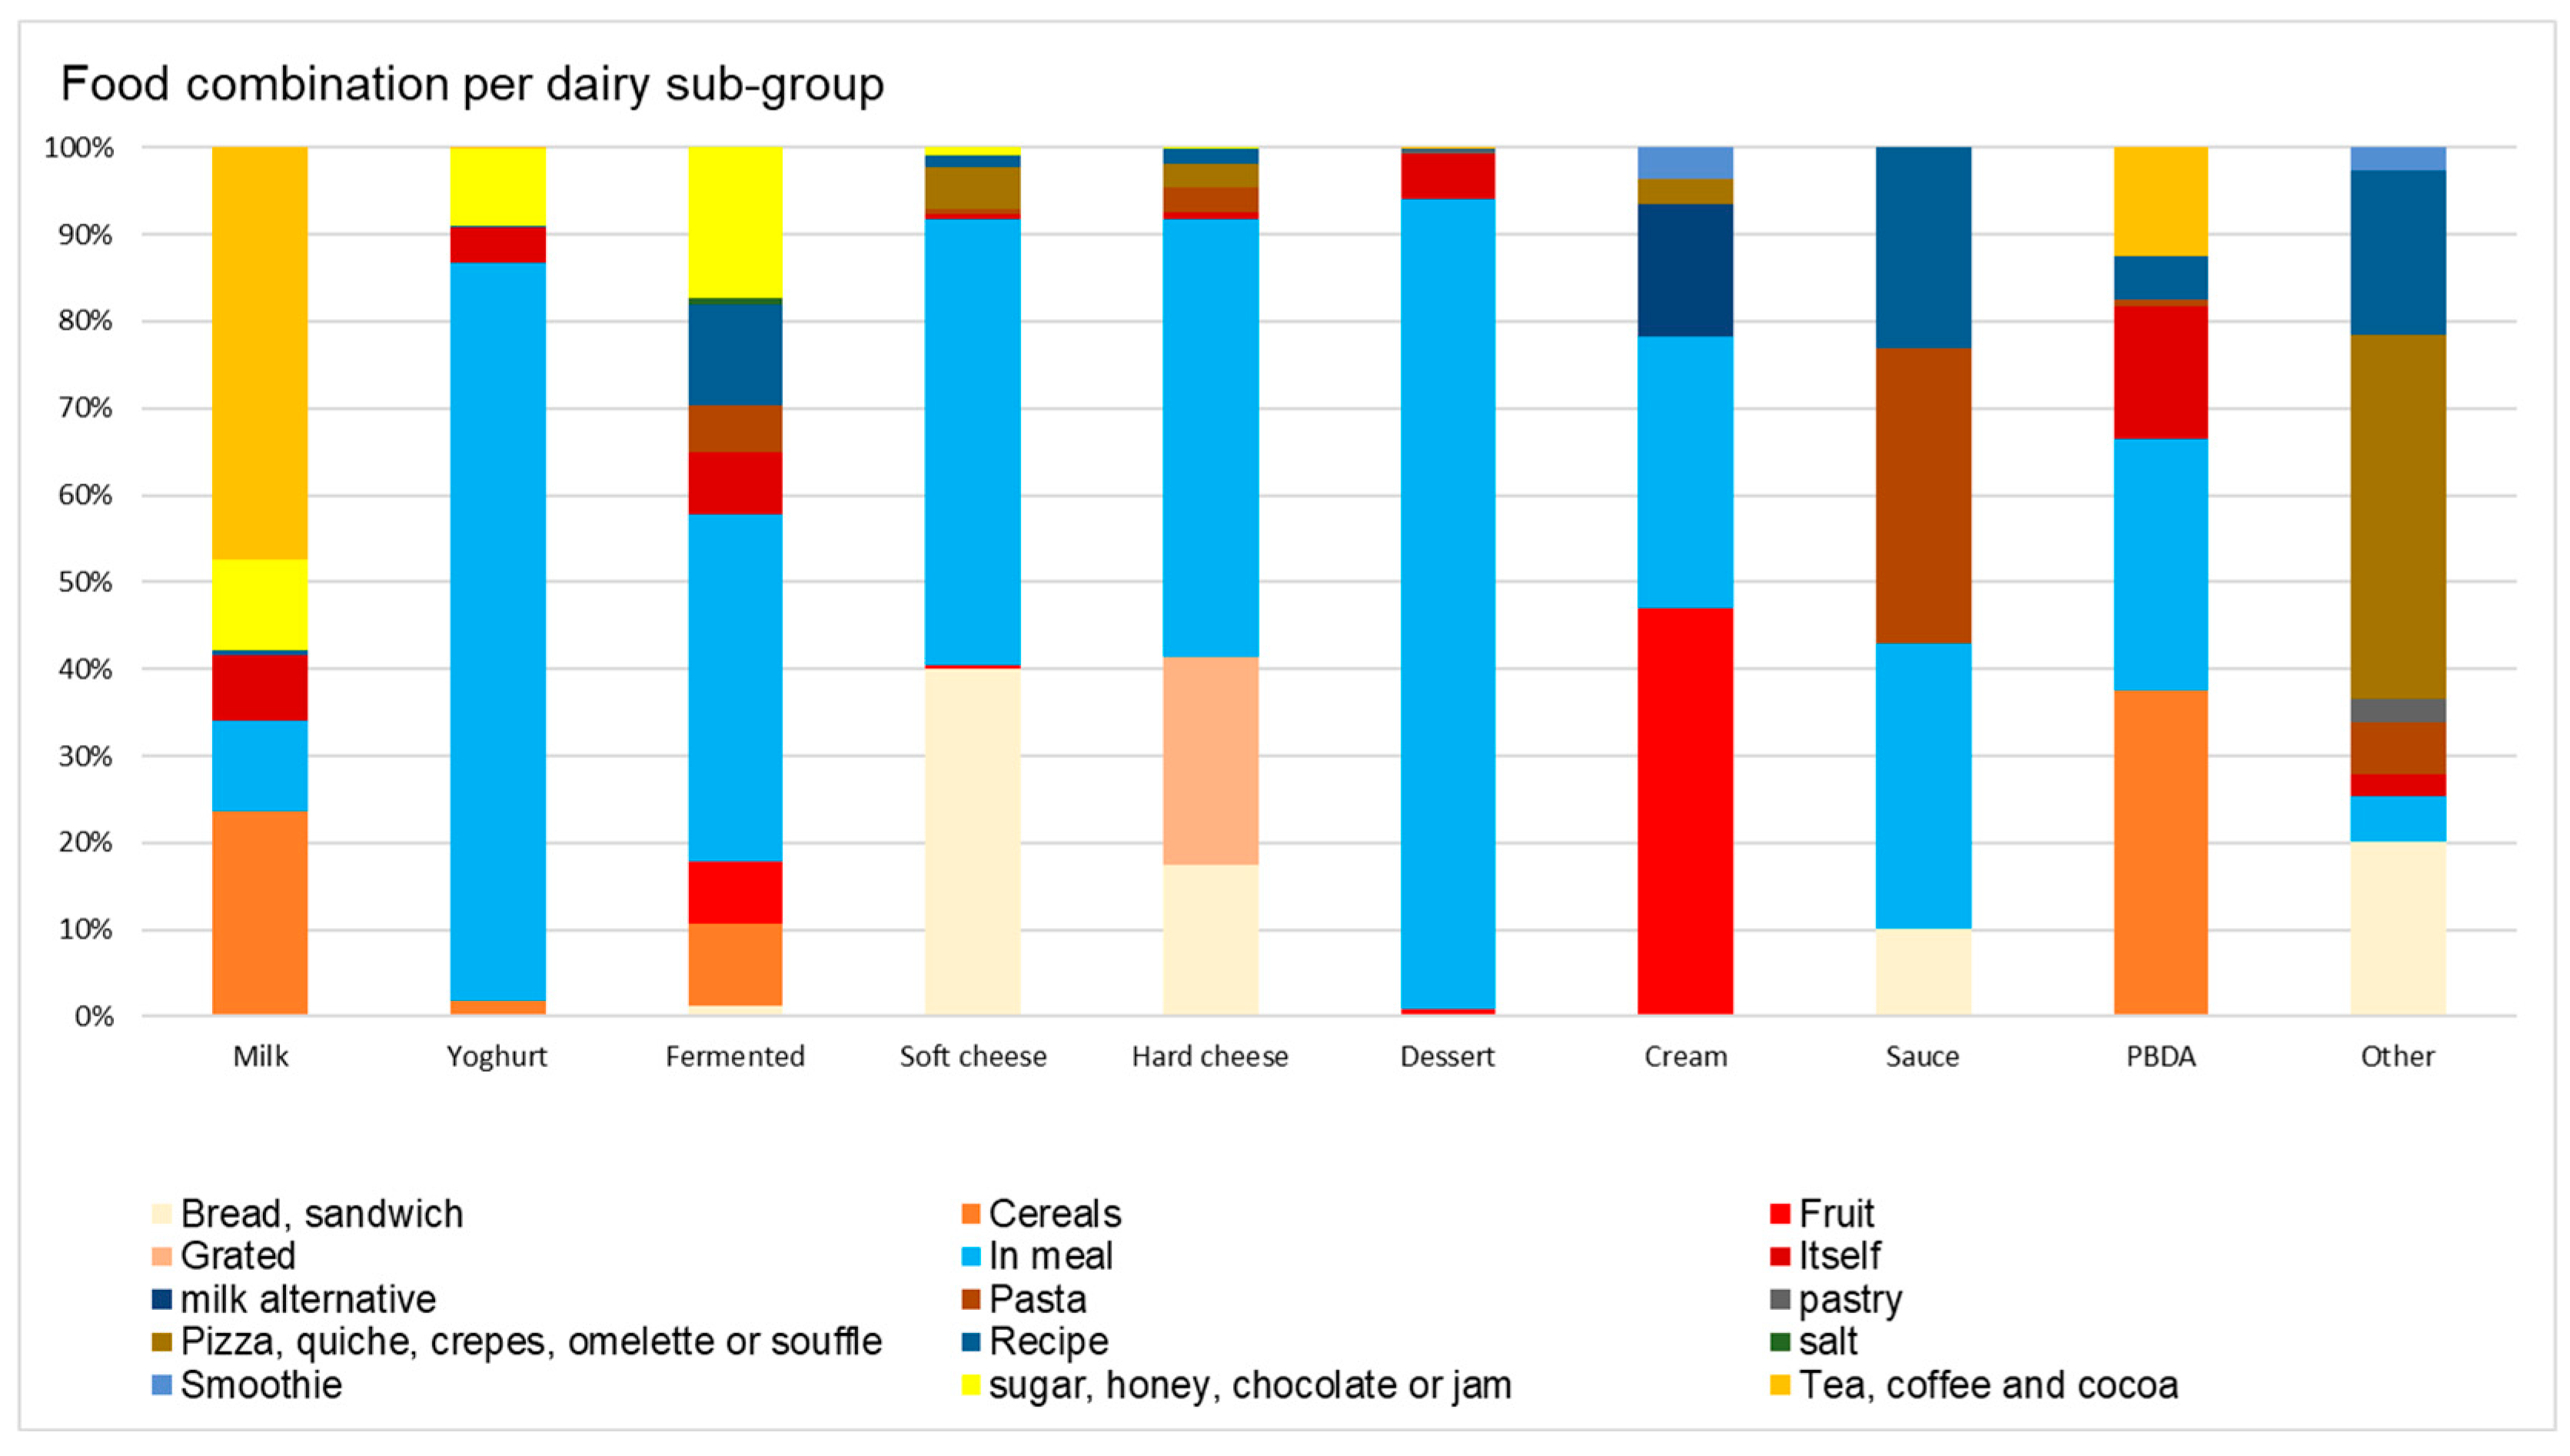
Figure 5.
Overall dairy and overall soft dairy consumption by hour. Soft dairy includes milk, yoghurt, fermented dairy, and soft cheese.
Figure 5.
Overall dairy and overall soft dairy consumption by hour. Soft dairy includes milk, yoghurt, fermented dairy, and soft cheese.
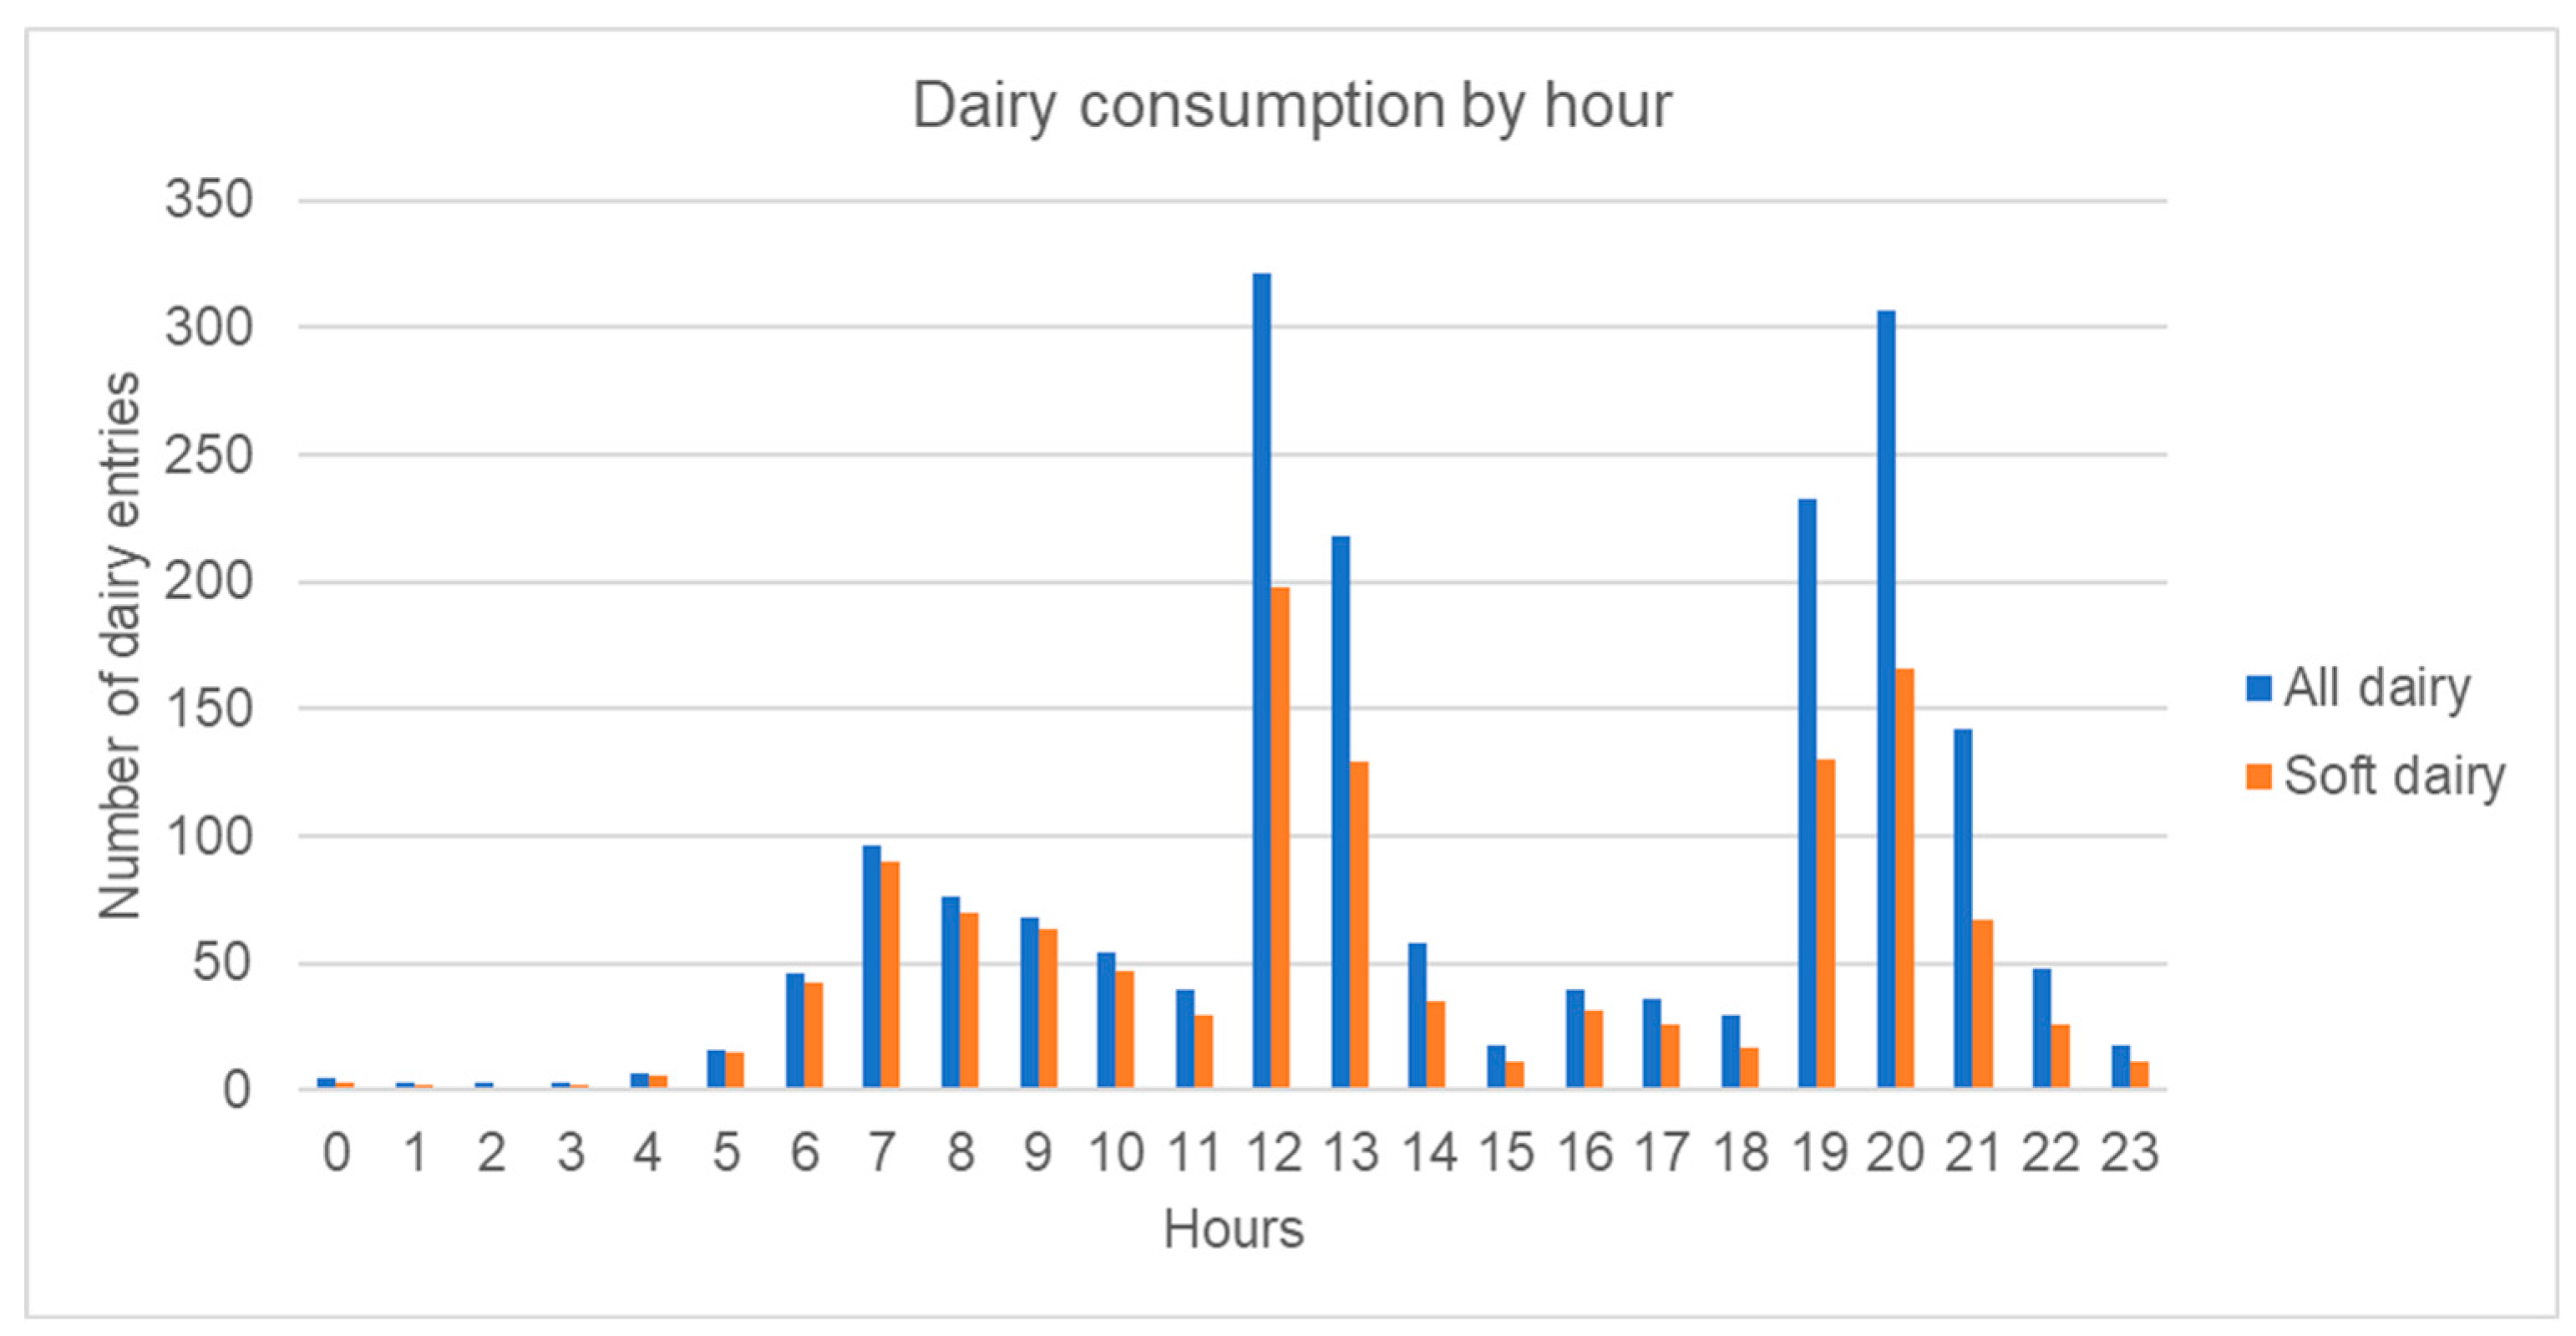
Figure 6.
Soft dairy sub-groups, hard cheese, and dessert consumption by hour.
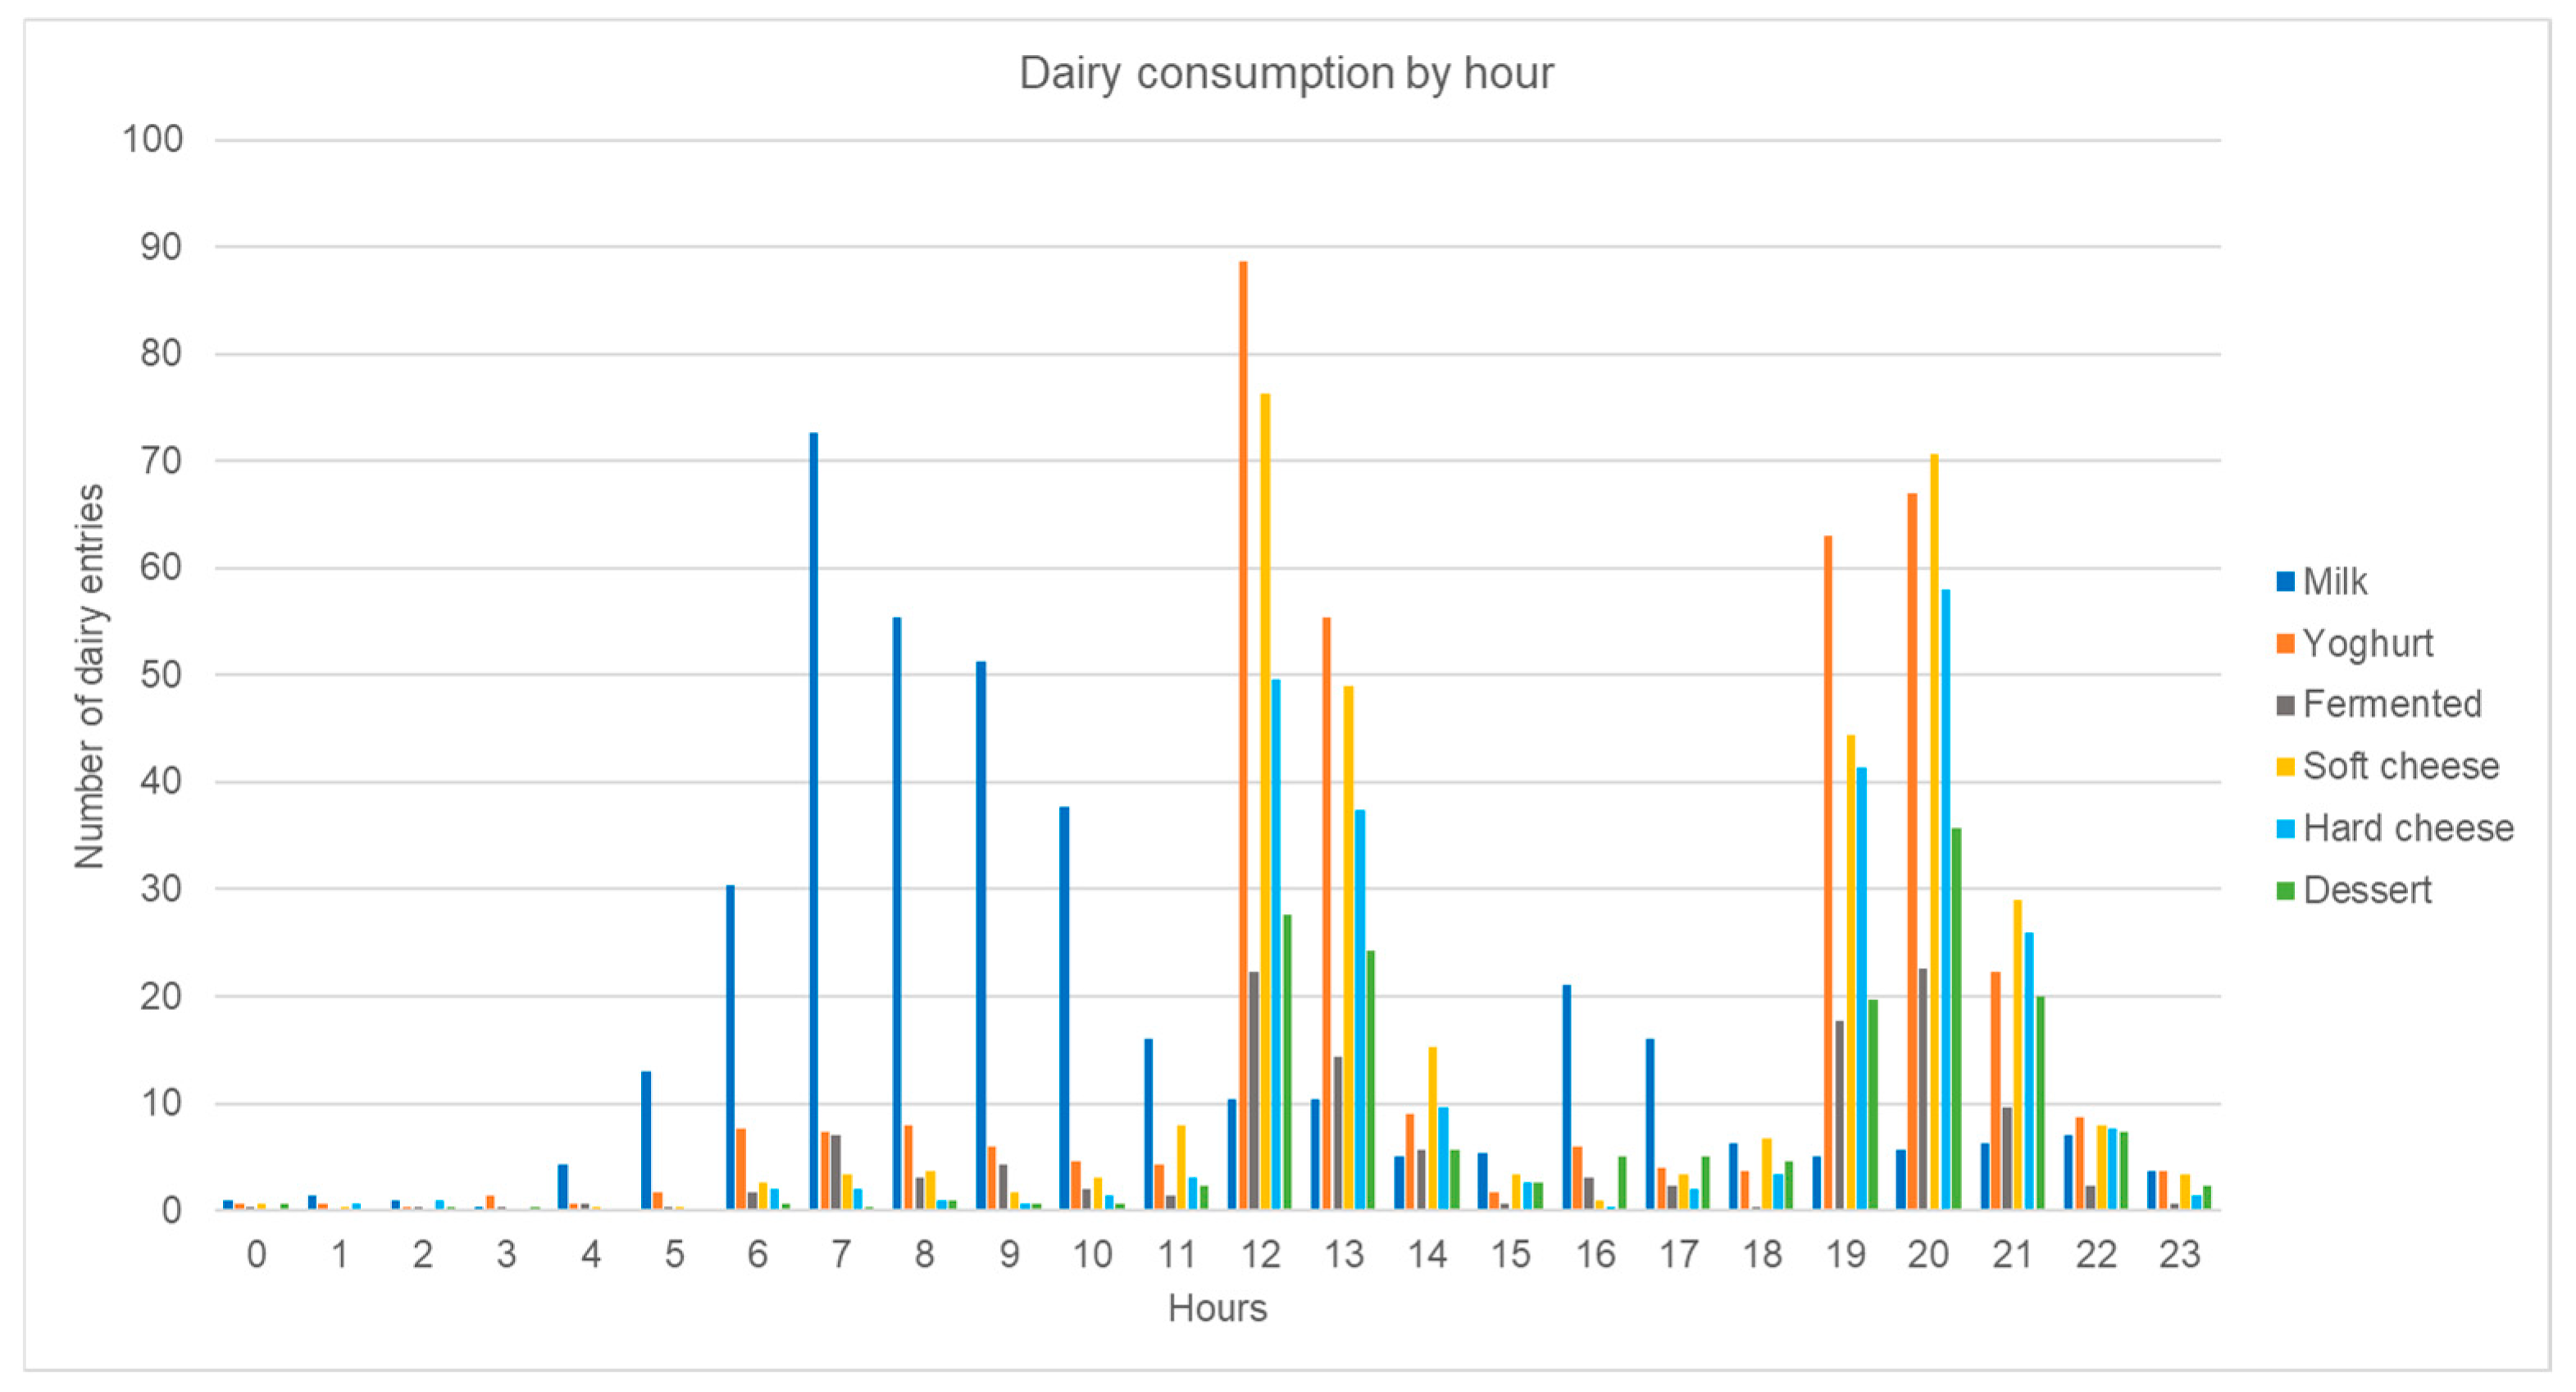

Table 1.
Average weight consumed and energy content of overall dairy, overall soft dairy, and each dairy sub-group intake. Energy content has been reported in kcal and kJ. 1kcal = 4.186 kJ.
Table 1.
Average weight consumed and energy content of overall dairy, overall soft dairy, and each dairy sub-group intake. Energy content has been reported in kcal and kJ. 1kcal = 4.186 kJ.
| N=783 | Average weight consumed [g/day] | Average energy intake [kcal/day] | Average energy intake [kJ/day] |
|---|---|---|---|
| All dairy | 246 | 269 | 1,126 |
| Soft dairy | 215 | 187 | 783 |
| Milk | 118 | 60 | 252 |
| Yoghurt | 63 | 54 | 227 |
| Fermented dairy | 15 | 18 | 75.3 |
| Soft cheese | 19 | 54 | 227 |
| Hard cheese | 12 | 45 | 187 |
| Dessert | 19 | 36 | 151 |
| Cream | 0.2 | 0.6 | 2.5 |
| Sauce | 0.5 | 0.6 | 2.5 |
| PBDA | 3 | 2 | 7 |
Disclaimer/Publisher’s Note: The statements, opinions and data contained in all publications are solely those of the individual author(s) and contributor(s) and not of MDPI and/or the editor(s). MDPI and/or the editor(s) disclaim responsibility for any injury to people or property resulting from any ideas, methods, instructions or products referred to in the content. |
© 2025 by the authors. Licensee MDPI, Basel, Switzerland. This article is an open access article distributed under the terms and conditions of the Creative Commons Attribution (CC BY) license (http://creativecommons.org/licenses/by/4.0/).
Copyright: This open access article is published under a Creative Commons CC BY 4.0 license, which permit the free download, distribution, and reuse, provided that the author and preprint are cited in any reuse.


