
Submitted:
09 December 2024
Posted:
11 December 2024
You are already at the latest version
Abstract
Background: Community-dwelling older adults are at risk of malnutrition due to age-related declines in energy and nutrient intakes. While the positive effect of dining companions on energy and nutrient intake has been suggested, evidence remains inconclusive. This study investigated the association between the number of dining companions and energy and nutrient intakes, as well as the contribution of specific food groups to higher intakes in the presence of dining companions. Methods: This cross-sectional study included 2,865 community-dwelling older adults. The number of dining companions was assessed through self-administered questionnaires and categorized into three groups (none, 1, ≥2). Dietary intake was evaluated using a validated food frequency questionnaire, and multivariable regression analyses were conducted to control for potential confounders. Results: Participants dining with two or more companions consumed significantly more energy (β 143.85; 95% CI: 30.05, 257.65; P for trend= 0.01), protein (β 6.32; 95% CI: 1.05, 11.59), fat (β 6.78; 95% CI: 2.44, 11.12; P for trend = 0.002), and carbohydrates (β 17.43; 95% CI: 1.48, 33.37; P for trend = 0.06) compared to those dining alone. They also consumed higher amounts of rice, fats and oils, meat, other vegetables, fruits, and mushrooms. Conclusions: Dining with two or more companions is associated with greater energy and nutrient intakes, particularly from energy- and nutrient-dense foods. Encouraging shared meals could serve as a potential approach to support dietary quality and address risks of malnutrition in older adults.
Keywords:
meal
; companion
; social facilitation
; dietary intake
; aged
; community dwelling
1. Introduction
The amounts of energy and nutrient intakes community-dwelling older adults consume decrease with age and tend to be inadequate [1,2,3]. This may predispose older adults to weight loss, undernutrition, and protein energy malnutrition. Although energy requirements decrease with age as a result of decreased energy expenditure and physical activity [4], the fall in the amount of energy intake is often greater than the decrease in energy requirements. Nutrient requirements do not necessarily decrease with age and even tend to remain the same or increase [5]. For example, protein, which is one of the macro-nutrients, is recommended to be increased for older adults more than for other age groups to alleviate age-related conditions such as skeletal muscle loss [6,7]. Multiple factors that contribute to the decreased amount of energy and nutrient intakes in older adults are known to include sensory changes, anorexia, diseases, medication use, and psychological factors such as depression [1,3,8].
Japan is facing an aging society, with family structures transitioning from extended families to nuclear families, and more recently, to single-person and couple households. Among older adults in particular, single-person and couple households accounted for 63.9 % of all individuals aged 65 and over in 2022, a significant increase from 31.3% in 1986 [9]. As a results of changes in family structure, older adults have fewer opportunities to eat with two or more companions. Eating alone has been reported to be linked to unhealthy dietary behaviors [10]. Studies focusing on eating with companions have shown a positive correlation between the number of eating companions and the intake of energy and nutrients among younger individuals [11,12,13,14,15,16,17,18,19,20,21,22]. However, research focusing on older adults is limited [23,24,25] and has not yet established a distinct association between the number of eating companions and the intake of energy and nutrients because prior studies have not controlled for confounders associated with energy intake.
Although social facilitation, the influence of others on individual behavior [26], has been presented as a plausible reason why people consume more energy when dining with others than when eating alone, which food groups contribute to the increase in the amount of energy and nutrient intakes are still not revealed. Because specific food groups, such as vegetables and fruits, were reported to have an inverse association with malnutrition and unhealthy aging [27,28], focusing on intakes from each food group is also needed. Therefore, the aim of this study is to confirm the association between the number of dining companions and energy and nutrient intakes, particularly macro-nutrients (protein, carbohydrate, and fat), while controlling for confounders associated with energy intake. In addition, we seek to identify the specific food groups that contribute to this association in the context of dining with more dining companions, focusing on Japanese older adults.
2. Methods
2.1. Study Population
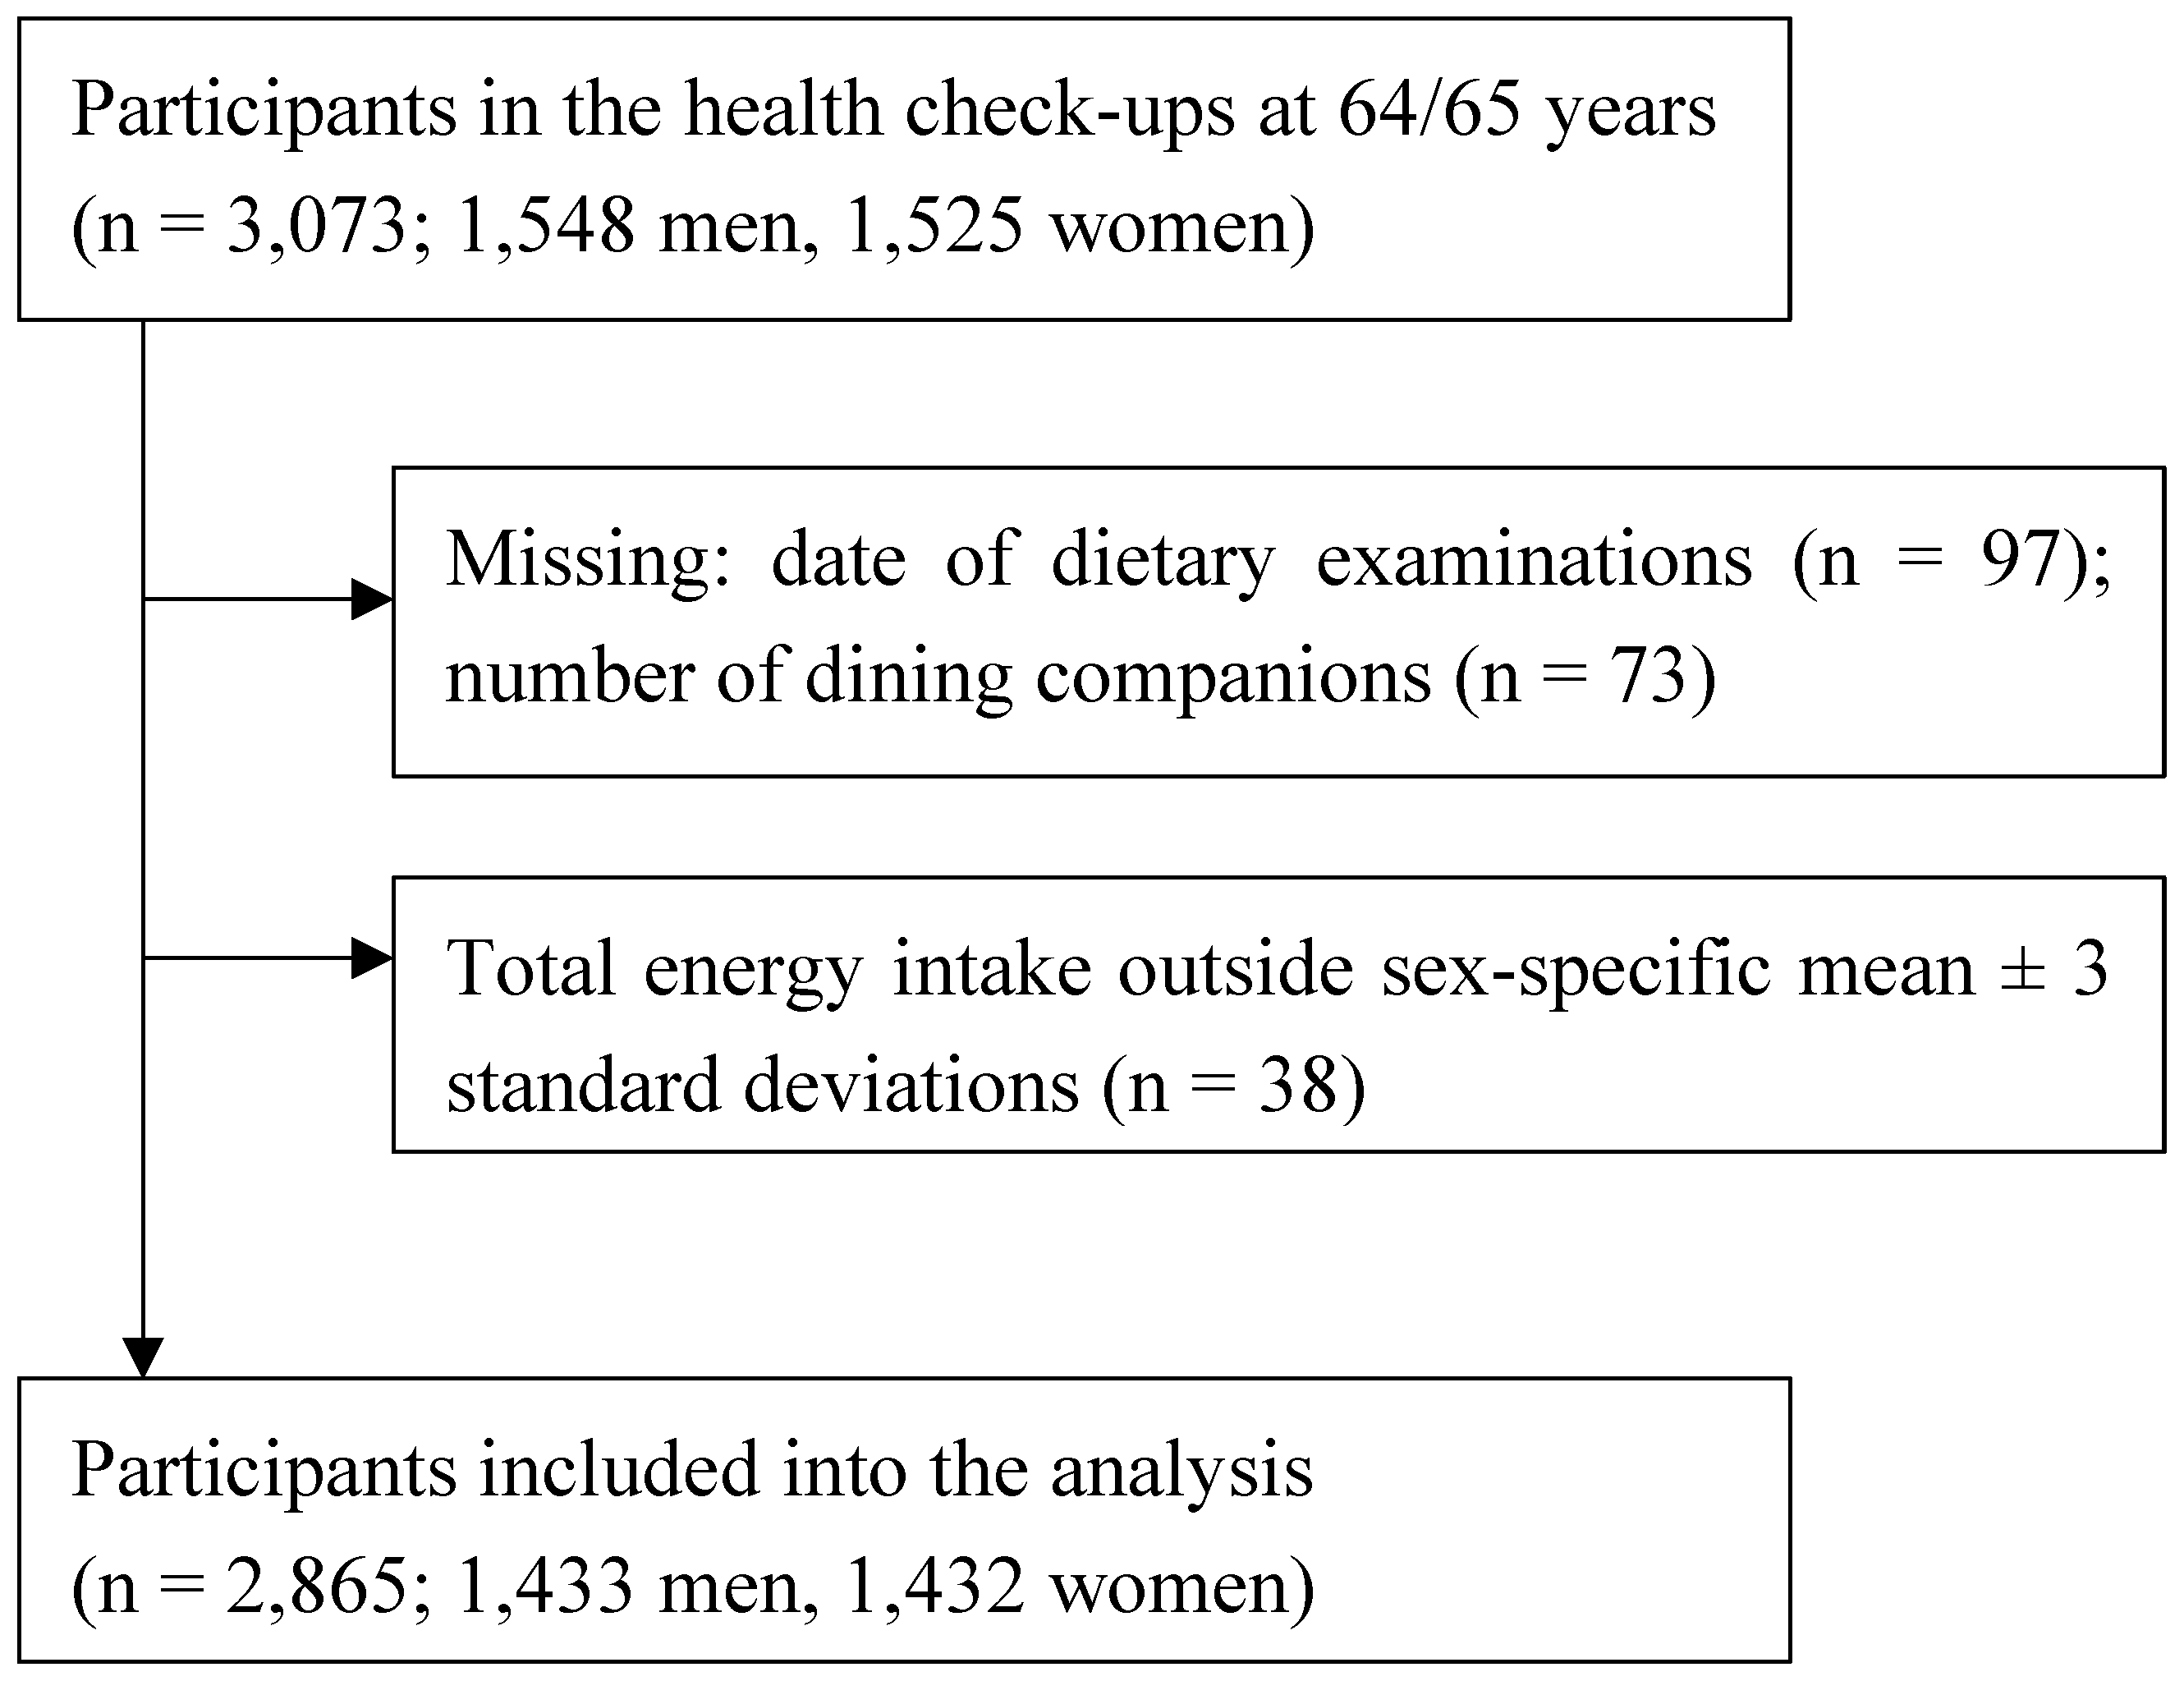
Participants in this study were drawn from the New Integrated Suburban Seniority Investigation Project, an age-specific research project involving residents of Nisshin City, located in central Japan [29]. Community-dwelling older adults aged 64–65 years were invited by letter to participate in a free comprehensive medical health checkup and to complete a detailed questionnaire survey annually from 1996 to 2005. Among 3,073 potential participants, those with missing data on dietary examinations (n = 97) or the number of dining companions (n = 73) were excluded. Additionally, we excluded those whose estimated total energy intake fell outside three standard deviations above or below the sex-specific mean (n = 38). As a result, 2,865 individuals (1,433 men and 1,432 women) remained for the final analyses (figure 1). This study was conducted in accordance with the guidelines laid down in the Declaration of Helsinki, and all procedures involving the study participants were approved by the Ethics Committees of Nagoya University Graduate School of Medicine, the National Center for Geriatrics and Gerontology of Japan, Aichi Medical University School of Medicine, Hokkaido University Graduate School of Medicine, and Osaka City University Graduate School of Human Life Science. Informed consent was obtained from all participants for their involvement in the study, including any follow-up procedures. An opt-out approach was applied from 1996 to 2001. Health checkup examinees who declined to participate in the study were recorded and excluded from the survey. From 2002 to 2005, participants provided written consent through an opt-in approach.
Figure 1.
Participant flow of the present study.
2.2. Data Collection
Information was collected via self-reported questionnaires and objective assessments during the health check-ups.
Information on the number of dining companions was collected through self-administered questionnaires using the following question: “In the past year, excluding yourself, how many people usually dined with you on weekdays?” We then categorized the number of dining companions into three groups (none, 1, ≥2) and set none as a reference category based on previously identified associations with adverse health-related outcomes [10,30,31,32].
A food frequency questionnaire (FFQ) was employed to assess the intake of 16 food groups including rice, bread, noodles, sugars and sweeteners, confectioneries, fats and oils, nuts and seeds, pulses, fish and shellfish, meats, eggs, milk and dairy products, green-yellow vegetables, other vegetables, fruits, and mushrooms. The FFQ, which was designed to reflect modern Japanese foods and dishes, covered 97 food items. Energy, protein, fat, and carbohydrate intakes were also evaluated. The frequency of consumption for each food item was recorded using an incremental scale (< once/month, once/month, 2–3 times/month, once/week, 2–4 times/week, 5–6 times/week, once/day, 2–3 times/day, ≥ 4 times/day). Except for rice, portion sizes were fixed across all food items. The validity of the FFQ in measuring food group and nutrient intakes has been confirmed in previous studies [33,34].
2.3. Statistical Analysis
The characteristics of the participants were compared across each category of dining companions. Categorical variables were analyzed using the chi-squared test. To explore the relationship between the number of dining companions and the intakes of 16 food groups, multiple regression models were employed. Multivariable regression coefficients (β) and 95% confidence intervals (CIs) were estimated, with individuals having no dining companions as the reference group. The regression models were adjusted for potential confounders. The following covariates were included step-by-step as confounders in the regression models: enrollment year (1996–1999, 2000–2002, 2003–2005), sex (men or women) (model 1); educational attainment (lower than high school, high school or above or other/missing), cohabitation status (living alone, living with others, or missing), smoking habits (current, past or never), alcohol consumption (current, never/past or missing), walking status (<1, ≥1 h/day or missing), depressive symptoms (presence, absence or missing), instrumental activities of daily living (IADL: deteriorated, not deteriorated, missing), history of hypertension (yes or no/missing), diabetes mellitus (yes or no/missing), cardiovascular diseases (yes or no/missing), cancer (yes or no/missing), hyperlipidemia (yes or no/missing) (model 2); body mass index (BMI), categorized as <18.5, 18.5–22.9, ≥23 kg/m2 [35] (model 3). BMI was calculated as weight in kilograms divided by height in meters squared. Depressive symptoms were assessed using the short-form Geriatric Depression Scale (GDS), a tool validated for older Japanese populations [36]. A GDS score of less than 6 points was classified as indicative of depressive symptoms [37]. The Instrumental Activity of Daily Living index measures 5 functions: public transportation, shopping, meal preparation, manages financial matters, handling of money in the bank. Participants unable to perform at least one of these functions were considered to have significant impairment [38]. Hypertension was defined as systolic blood pressure ≥140 mmHg, diastolic blood pressure ≥90 mmHg, self-reported hypertension, and/or antihypertensive medication. Diabetes mellitus was defined by fasting blood glucose ≥126 mg/dl, hemoglobin A1c (HbA1c) ≥6.5%, self-reported diabetes mellitus, and/or antidiabetic medication. HbA1c values were converted to National Glycohemoglobin Standardization Program (NGSP) equivalents using the formula: NGSP (%) = (1.02 × JDS (%)) + 0.25%, as the HbA1c levels were originally measured according to Japanese Diabetes Society criteria [39]. Cerebrovascular disease was classified as self-reported stroke, cerebral hemorrhage, and subarachnoid hemorrhage. Cancer was defined by self-reported diagnosis, and hyperlipidemia was characterized by a total cholesterol level ≥220 mg/dl, self-reported hyperlipidemia, and/or hyperlipidemia medication. Then, the analyses were repeated for intakes of energy, protein, fat, and carbohydrate. A trend test was performed using the original number of dining companions as a continuous variable in the multivariable regression model. All statistical tests were two-sided, and an alpha level of 0.05 was considered statistically significant. All statistical analyses were conducted using EZR 1.61 [40].
3. Results
The participants consumed an average of 1,882 ± 570 kcal/day. The mean intakes of protein, fat, and carbohydrate intakes were: protein 72.2 ± 26.7 g/day, fat 52.8 ± 21.9 g/day, and carbohydrate 255.1 ± 79.8 g/day, respectively. The participants had mean amounts of food groups: rice 40.07 ± 19.62 g/day, bread 22.73 ± 21.74 g/day, noodles 97.41 ± 86.86 g/day, sugars and sweeteners 4.12 ± 2.30 g/day, confectioneries 16.37 ± 16.81 g/day, fats and oils 10.76 ± 6.24 g/day, nuts and seeds 2.58 ± 3.42 g/day, pulses 79.00 ± 51.41 g/day, fish and shellfish 77.77 ± 55.14 g/day, meats 52.02 ± 38.47 g/day, eggs 33.21 ± 26.59 g/day, milk and dairy products 182.35 ± 144.94 g/day, green-yellow vegetables 118.63 ± 95.90 g/day, other vegetables 123.96 ± 67.45 g/day, fruits 200.63 ± 139.37 g/day, and mushrooms 11.96 ± 10.12 g/day.
The characteristics of the study participants according to the number of dining companions are shown in Table 1. Males were more represented in the one dining companion group. Participants with lower education levels were more commonly found among those with two or more dining companions. Most participants living alone were in the no dining companions group, whereas nearly all participants with dining companions lived with others. Current smokers were most numerous in the no dining companions group. Current alcohol consumption was highest among those with one dining companion. Walking time was shortest in the one dining companion group. Depressive symptoms were more frequently observed in the no dining companions group compared to the other groups. IADL deterioration was more typical in the group with two or more dining companions. No significant differences were observed in medical history or BMI across the groups.
The associations of the number of dining companions with food group intake are shown in Table 2. Significant positive associations were found between the number of dining companions and the intake of various food groups. Participants who dined with two or more companions had a higher intake of rice (P for trend = 0.003), fats and oils (β 1.99; 95% CI: 0.74, 3.23; P for trend < 0.001), meat (β 7.90; 95% CI: 0.25, 15.55; P for trend < 0.001), other vegetables (β 13.84; 95% CI: 0.56, 27.12; P for trend = 0.31), fruits (β 30.86; 95% CI: 5.09, 56.62; P for trend = 0.01), and mushrooms (β 2.48; 95% CI: 0.53, 4.44; P for trend = 0.08) compared to those who dined alone, after adjusting for potential confounders. Milk and dairy products (β 37.45; 95% CI: 10.31, 64.60) and green-yellow vegetables (β 24.77; 95% CI: 6.76, 42.79) were significantly more consumed by participants dining with one companion, but these associations were not significant for those dining with two or more companions.
Table 3 shows the association with the number of dining companions and the intakes of energy and nutrients. Participants who have two or more dining companions consume more energy (β 143.85; 95% CI: 30.05, 257.65; P for trend= 0.01), protein (β 6.32; 95% CI: 1.05, 11.59), fat (β 6.78; 95% CI: 2.44, 11.12; P for trend = 0.002), and carbohydrates (β 17.43; 95% CI: 1.48, 33.37; P for trend = 0.06) compared to those who dined alone, after adjusting for potential confounders.
4. Discussion
The present study found a significant positive association between the number of dining companions and the intake of energy and nutrients among community-dwelling older adults. Participants dining with two or more companions consumed higher amounts of energy, protein, fat, and carbohydrates than those dining alone. Furthermore, those dining with more companions had higher intakes of rice, fats and oils, meat, fruits, other vegetables and mushrooms, which likely contributed to the observed increase in nutrient intake.
Our results are consistent with previous studies that suggested a positive correlation between the number of eating companions and the energy intake, based on data collected from 7-day food diaries for each meal [11,25]. A study that followed 153 adults aged 18–67 years in America found that the amounts of energy, protein, fat, and carbohydrate intake increase as a function of the number of eating companions, in a fashion best described by a power function [25]. Another study that followed 56 French participants with Type I diabetes and 28 healthy controls (52.5 ± 1.9 years of age, range 19–77) found that both groups had a positive correlation between the number of people present at the meal and amounts of energy intake [24]. In an observational study of 348 men and 414 women in America, participants were divided into four groups: 20–34 years old (n = 325), 35–49 years old (n = 292), 50–64 years old (n = 99), and over 65 years (n = 46). All four groups had a positive relationship between the number of people present at the meal and amounts of energy intake [23]. While these studies share similarities with ours in investigating the associations between the number of dining companions and the amount of intake, our study offers a distinct contribution by controlling the potential confounders that are likely to affect energy intakes for community-dwelling older adults.
A potential mechanism by which having more dining companions leads to higher energy intakes may be social facilitation, defined as the phenomenon where individual behavior is influenced by the presence of other people engaged in the same behavior [41]. Eating behavior is one of the clearest demonstrations of the social facilitation effect. People eat more in groups than when alone, which is called social facilitation of eating. There are two primary hypotheses in the literature regarding the mechanism of social facilitation of eating. The arousal hypothesis states that in larger groups activation or arousal is greater, resulting in a faster eating rate and greater consumption [42,43]. The time extension hypothesis suggests that larger group size increases social interaction, extends meal duration, and increases the length of time an individual is in the presence of food, thereby increasing intake [16,42]. In addition, another reason why energy intake may be higher when increasing the number of dining companions is the greater chance to get social support from other people, including family and friends, neighbors, and caregivers. They may provide encouragement and support to eat more, even when the participants are in difficult situations to eat, such as illness and poor appetite, or feeling depressed.
Our study found that participants dining with two or more companions consumed larger amounts of fats and oils, which are high-energy-density foods [44,45], compared to participants dining with fewer companions. They also ate more rice, meat, fruits, other vegetables and mushrooms. Although the reasons for greater consumption of specific food groups, such as rice, fats and oils, meat, fruits, other vegetables and mushrooms, among participants dining with two or more companions remain unclear, the diversity of those dining together, especially when the group includes individuals from different age groups, may also influence the types of food consumed. For instance, the presence of younger individuals during meals might encourage older individuals to consume more fats, as well as vegetables and fruits, which are considered healthy foods. The fat intake between younger and older individuals in the same household showed a weak to moderate positive correlation [46,47,48]. Another study has shown that younger individuals encourage older individuals in the household to adopt healthy habits [49,50,51]. However, we did not obtain information on family composition or with whom participants usually dined, so future studies are needed to clarify this point.
The present study has some notable strengths. We were able to eliminate the negative effect of aging on the association between the number of dining companions and the amount of intake by using data from age-specific community-dwelling older adults, because previous studies have shown that aging is associated with a lower number of dining companions [23] and lower intakes of energy and nutrients [1]. Furthermore, to enhance the robustness of our findings, we employed multivariable regression analyses to control for confounders known to be related to energy intake. These confounders included educational level [52], living arrangement [53], smoking status [54], alcohol consumption status [55], physical activity [56], depressive symptoms [57], IADL [58], medical histories [1], and BMI [59], which were not accounted for in previous studies [23,24,25]. However, certain limitations to the study warrant consideration. First, due to the cross-sectional nature, we could not identify temporal relationships between the number of dining companions and the amounts of intakes. A possibility of reverse causality exists, where individuals who inherently consume higher energy levels may choose to dine with more companions, as social interactions can contribute to the enjoyment of meals. To clarify such temporal relationships, conducting a cohort study would be required. Second, although we collected information on the amounts of dietary intake for breakfast, lunch and dinner, the number of eating companions was obtained only for dinner. This discrepancy should be taken into account when interpreting the results. A previous study of community-dwelling men and women in the Netherlands showed that the mean number of eating companions at breakfast, lunch, and dinner was 1.1 ± 1.2, 2.5 ± 2.5, and 3.6 ± 2.3, respectively [16]. Therefore, an overestimation of the number of eating companions may have occurred in this study, which may have led to an underestimation of our results.
5. Conclusions
This study showed dining with two or more companions was associated with greater energy intake and consumption of protein, fat, and carbohydrates from rice, fats and oils, meat, fruit, other vegetables and mushrooms. This highlights the role of social facilitation in eating behavior, suggesting that dining with companions may serve as a practical intervention for improving dietary quality and preventing malnutrition in older adults.
Author Contributions
Methodology, formal analysis, investigation, data curation, writing—the original draft, visualization, and funding acquisition, Y.M.-W. and S.U.; conceptualization, investigation, data curation, and writing—review & editing, T.F., S.O., M.A., K.W., and K.T.; conceptualization, investigation, data curation, supervision, project administration, funding acquisition, and writing—review & editing, A.T. All authors have read and agree to the published version of the manuscript.
Funding
This study was supported by a Grant-in-Aid for Scientific Research (grant number JP15390197, JP25893003, JP2646760, JP26520105, JP20K02392[CoBiA], and 24K05554[CoBiA]) from the Ministry of Education, Culture, Sports, Science and Technology of Japan; The Uehara Memorial Foundation; Mitsui Sumitomo Insurance Welfare Foundation; Health Promotion Foundation; and Pfizer Health Research Foundation.
Institutional Review Board Statement
The study was conducted according to the guidelines of the Declaration of Helsinki, and approved by the Ethics Committee of each research institution approved the study protocol: Hokkaido University Graduate School of Medicine (no. 37, 2014); Aichi Medical University School of Medicine (no. 558, 2008); the National Centre for Geriatrics and Gerontology in Japan (no. 242, 2006); and Nagoya University Graduate School of Medicine (no. 162, 2002 and 2004), and Osaka City University School of Human Life Science (no. 21-01, 2021).
Informed Consent Statement
Informed consent was obtained from all subjects involved in the study.
Data Availability Statement
The authors do not have permission to share data.
Acknowledgments
We appreciate the staff from the Nisshin Medical and Dental Associations and the Health Center and Hygiene Department of Nisshin City who provided the cooperation and great effort for carrying out our study. The authors appreciate Dr. Takashi Kawamura, professor emeritus at Kyoto University, who greatly contributed to the initiation of the NISSIN Project.
Conflicts of Interest
The authors declare no conflict of interest.
References
- Shahar, D.; Shai, I.; Vardi, H.; Fraser, D. Dietary intake and eating patterns of elderly people in Israel: who is at nutritional risk? Eur J Clin Nutr. 2003, 57, 18-25. [CrossRef]
- Ter Borg, S.; Verlaan, S.; Mijnarends, D.M.; Schols, J.; de Groot, L.; Luiking, Y.C. Macronutrient Intake and Inadequacies of Community-Dwelling Older Adults, a Systematic Review. Ann Nutr Metab. 2015, 66, 242-255. [CrossRef]
- Yannakoulia, M.; Mamalaki, E.; Anastasiou, C.A.; Mourtzi, N.; Lambrinoudaki, I.; Scarmeas, N. Eating habits and behaviors of older people: Where are we now and where should we go? Maturitas. 2018, 114, 14-21. [CrossRef]
- Roberts, S.B.; Rosenberg, I. Nutrition and aging: changes in the regulation of energy metabolism with aging. Physiol Rev. 2006, 86, 651-667. [CrossRef]
- Panda, A.; Booth, S.L. Nutritional Aspects of Healthy Aging. Med Clin North Am. 2022, 106, 853-863. [CrossRef]
- Campbell, W.; Deutz, N.; Volpi, E.; Apovian, C. Nutritional Interventions: Dietary Protein Needs and Influences on Skeletal Muscle of Older Adults. The journals of gerontology. Series A, Biological sciences and medical sciences. 2023, 78, 67-72. [CrossRef]
- Campbell, W.W.; Trappe, T.A.; Wolfe, R.R.; Evans, W.J. The recommended dietary allowance for protein may not be adequate for older people to maintain skeletal muscle. J Gerontol A Biol Sci Med Sci. 2001, 56, M373-380. [CrossRef]
- Chapman, I.M. Endocrinology of anorexia of ageing. Best Practice & Research Clinical Endocrinology & Metabolism. 2004, 18, 437-452. [CrossRef]
- Ministry of Health, Labour and Welfare Summary Report of Comprehensive Survey of Living Conditions 2022. Available online: https://www.mhlw.go.jp/english/database/db-hss/dl/report_gaikyo_2022.pdf (accessed on 28 November 2024).
- Tani, Y.; Kondo, N.; Takagi, D.; Saito, M.; Hikichi, H.; Ojima, T.; Kondo, K. Combined effects of eating alone and living alone on unhealthy dietary behaviors, obesity and underweight in older Japanese adults: Results of the JAGES. Appetite. 2015, 95, 1-8. [CrossRef]
- De Castro, J.M.; De Castro, E.S. Spontaneous meal patterns of humans: Influence of the presence of other people. American Journal of Clinical Nutrition. 1989, 50, 237-247. [CrossRef]
- de Castro, J.M. Social facilitation of the spontaneous meal size of humans occurs on both weekdays and weekends. Physiology and Behavior. 1991, 49, 1289-1291. [CrossRef]
- De Castro, J.M.; Brewer, E.M.; Elmore, D.K.; Orozco, S. Social facilitation of the spontaneous meal size of humans occurs regardless of time, place, alcohol or snacks. Appetite. 1990, 15, 89-101. [CrossRef]
- Elmore, D.K.; de Castro, J.M. Meal patterns of normal, untreated bulimia nervosa and recovered bulimic women. Physiology and Behavior. 1991, 49, 99-105. [CrossRef]
- De Castro, J.M. The relationship of cognitive restraint to the spontaneous food and fluid intake of free-living humans. Physiology and Behavior. 1995, 57, 287-295. [CrossRef]
- Feunekes, G.I.J.; de Graaf, C.; van Staveren, W.A. Social facilitation of food intake is mediated by meal duration. Physiology and Behavior. 1995, 58, 551-558. [CrossRef]
- De Castro, J.M. Inheritance of social influences on eating and drinking in humans. Nutrition Research. 1997, 17, 631-648. [CrossRef]
- de Castro, J.M.; Bellisle, F.; Feunekes, G.I.J.; Dalix, A.-M.; De Graaf, C. Culture and meal patterns: A comparison of the food intake of free-living American, Dutch, and French students. Nutrition Research. 1997, 17, 807-829. [CrossRef]
- Heusel, C.; De Castro, J.M. The spontaneous intake of food, self-rated moods, and hunger of underweight women. Nutrition Research. 1997, 17, 191-204. [CrossRef]
- Bellisle, F.; Dalix, A.M.; De Castro, J.M. Eating patterns in French subjects studied by the 'weekly food diary' method. Appetite. 1999, 32, 46-52. [CrossRef]
- Stroebele, N.; de Castro, J.M. Influence of physiological and subjective arousal on food intake in humans. Nutrition. 2006, 22, 996-1004. [CrossRef]
- Pearcey, S.M.; De castro, J.M. Food intake and meal patterns of one year old infants. Appetite. 1997, 29, 201-212. [CrossRef]
- De Castro, J.M. Age-related changes in the social, psychological, and temporal influences on food intake in free-living, healthy, adult humans. Journals of Gerontology - Series A Biological Sciences and Medical Sciences. 2002, 57, M368-M377. [CrossRef]
- de Castro, J.M.; Bellisle, F.; Dalix, A.M.; Slama, G. The effect of Type I diabetes on the eating patterns of free-living French: A diet diary study. Physiology and Behavior. 2002, 75, 583-592. [CrossRef]
- de Castro, J.M.; Brewer, E.M. The amount eaten in meals by humans is a power function of the number of people present. Physiology and Behavior. 1992, 51, 121-125. [CrossRef]
- Lumeng, J.C.; Hillman, K.H. Eating in larger groups increases food consumption. Arch Dis Child. 2007, 92, 384-387. [CrossRef]
- Bojang, K.P.; Manchana, V. Nutrition and Healthy Aging: A Review. Curr Nutr Rep. 2023, 12, 369-375. [CrossRef]
- de Morais, C.; Oliveira, B.; Afonso, C.; Lumbers, M.; Raats, M.; de Almeida, M.D. Nutritional risk of European elderly. Eur J Clin Nutr. 2013, 67, 1215-1219. [CrossRef]
- Kitamura, T.; Kawamura, T.; Tamakoshi, A.; Wakai, K.; Ando, M.; Ohno, Y. Rationale, design, and profiles of the New Integrated Suburban Seniority Investigation (NISSIN) Project: a study of an age-specific, community-based cohort of Japanese elderly. J. Epidemiol. 2009, 19, 237-243. [CrossRef]
- Tani, Y.; Kondo, N.; Noma, H.; Miyaguni, Y.; Saito, M.; Kondo, K. Eating Alone Yet Living With Others Is Associated With Mortality in Older Men: The JAGES Cohort Survey. J Gerontol B Psychol Sci Soc Sci. 2018, 73, 1330-1334. [CrossRef]
- Kimura, Y.; Wada, T.; Okumiya, K.; Ishimoto, Y.; Fukutomi, E.; Kasahara, Y.; Chen, W.; Sakamoto, R.; Fujisawa, M.; Otsuka, K.; et al. Eating alone among community-dwelling Japanese elderly: association with depression and food diversity. J Nutr Health Aging. 2012, 16, 728-731. [CrossRef]
- Noh, H.M.; Han, J.; Roh, Y.K.; Song, H.J. Eating Alone and Cognitive Decline in Korean Older Adults: A 3-Year Prospective Study. Ann Geriatr Med Res. 2021, 25, 17-24. [CrossRef]
- Egami, I.; Wakai, K.; Kato, K.; Lin, Y.; Kawamura, T.; Tamakoshi, A.; Aoki, R.; Kojima, M.; Nakayama, T.; Wada, M.; et al. A simple food frequency questionnaire for Japanese diet--Part II. Reproducibility and validity for nutrient intakes. J Epidemiol. 1999, 9, 227-234.
- Wakai, K.; Egami, I.; Kato, K.; Lin, Y.; Kawamura, T.; Tamakoshi, A.; Aoki, R.; Kojima, M.; Nakayama, T.; Wada, M.; et al. A simple food frequency questionnaire for Japanese diet--Part I. Development of the questionnaire, and reproducibility and validity for food groups. J Epidemiol. 1999, 9, 216-226. [CrossRef]
- Consultation, W.E. Appropriate body-mass index for Asian populations and its implications for policy and intervention strategies. Lancet. 2004, 363, 157-163. [CrossRef]
- Almeida, O.P.; Almeida, S.A. Short versions of the geriatric depression scale: a study of their validity for the diagnosis of a major depressive episode according to ICD-10 and DSM-IV. Int. J. Geriatr. Psychiatry. 1999, 14, 858-865. [CrossRef]
- Montorio, I.; Izal, M. The Geriatric Depression Scale: a review of its development and utility. Int Psychogeriatr. 1996, 8, 103-112. [CrossRef]
- Koyano, W.; Shibata, H.; Nakazato, K.; Haga, H.; Suyama, Y. Measurement of competence: reliability and validity of the TMIG Index of Competence. Arch Gerontol Geriatr. 1991, 13, 103-116. [CrossRef]
- Kashiwagi, A.; Kasuga, M.; Araki, E.; Oka, Y.; Hanafusa, T.; Ito, H.; Tominaga, M.; Oikawa, S.; Noda, M.; Kawamura, T.; et al. International clinical harmonization of glycated hemoglobin in Japan: From Japan Diabetes Society to National Glycohemoglobin Standardization Program values. Journal of Diabetes Investigation. 2012, 3, 39-40. [CrossRef]
- Kanda, Y. Investigation of the freely available easy-to-use software 'EZR' for medical statistics. Bone Marrow Transplant. 2013, 48, 452-458. [CrossRef]
- Lumeng, J.C.; Hillman, K.H. Eating in larger groups increases food consumption. Archives of Disease in Childhood. 2007, 92, 384-387. [CrossRef]
- De Castro, J.M. Social facilitation of duration and size but not rate of the spontaneous meal intake of humans. Physiol Behav. 1990, 47, 1129-1135. [CrossRef]
- Zajonc, R.B. SOCIAL FACILITATION. Science. 1965, 149, 269-274.
- Rolls, B.J.; Bell, E.A. Intake of fat and carbohydrate: role of energy density. Eur J Clin Nutr. 1999, 53 Suppl 1, S166-173. [CrossRef]
- Horgan, G.W.; Whybrow, S.; Scalco, A.; Craig, T.; Macdiarmid, J.I. Effect of different food groups on energy intake within and between individuals. Eur J Nutr. 2022, 61, 3559-3570. [CrossRef]
- Mirmiran, P.; Zahedi, A.S.; Koochakpour, G.; Hosseini-Esfahani, F.; Akbarzadeh, M.; Daneshpour, M.S.; Azizi, F. Resemblance of nutrient intakes in three generations of parent-offspring pairs: Tehran lipid and Glucose Study. PLOS ONE. 2022, 17, e0266941. [CrossRef]
- Feunekes, G.I.; Stafleu, A.; de Graaf, C.; van Staveren, W.A. Family resemblance in fat intake in The Netherlands. Eur J Clin Nutr. 1997, 51, 793-799. [CrossRef]
- Wang, Y.; Beydoun, M.A.; Li, J.; Liu, Y.; Moreno, L.A. Do children and their parents eat a similar diet? Resemblance in child and parental dietary intake: systematic review and meta-analysis. J Epidemiol Community Health. 2011, 65, 177-189. [CrossRef]
- Laroche, H.H.; Davis, M.M.; Forman, J.; Palmisano, G.; Reisinger, H.S.; Tannas, C.; Spencer, M.; Heisler, M. Children's roles in parents' diabetes self-management. Am J Prev Med. 2009, 37, S251-261. [CrossRef]
- de la Haye, K.; de Heer, H.D.; Wilkinson, A.V.; Koehly, L.M. Predictors of parent-child relationships that support physical activity in Mexican-American families. J Behav Med. 2014, 37, 234-244. [CrossRef]
- Manalel, J.A.; Marcum, C.S.; Calabrese, S.; de la Haye, K.; Hughes, D.; Prichard, I.; Hutchinson, A.; Wilson, C.; Koehly, L. Intergenerational exchange of healthful eating encouragement: Consideration of family ancestry and disease history. Fam Syst Health. 2019, 37, 302-313. [CrossRef]
- Rippin, H.L.; Hutchinson, J.; Greenwood, D.C.; Jewell, J.; Breda, J.J.; Martin, A.; Rippin, D.M.; Schindler, K.; Rust, P.; Fagt, S.; et al. Inequalities in education and national income are associated with poorer diet: Pooled analysis of individual participant data across 12 European countries. PLoS One. 2020, 15, e0232447. [CrossRef]
- Davis, M.A.; Murphy, S.P.; Neuhaus, J.M. Living arrangements and eating behaviors of older adults in the United States. J Gerontol. 1988, 43, S96-98. [CrossRef]
- Prokopidis, K.; Witard, O.C. Understanding the role of smoking and chronic excess alcohol consumption on reduced caloric intake and the development of sarcopenia. Nutr Res Rev. 2022, 35, 197-206. [CrossRef]
- Yeomans, M.R.; Caton, S.; Hetherington, M.M. Alcohol and food intake. Current Opinion in Clinical Nutrition & Metabolic Care. 2003, 6, 639-644.
- Halliday, T.M.; White, M.H.; Hild, A.K.; Conroy, M.B.; Melanson, E.L.; Cornier, M.A. Appetite and Energy Intake Regulation in Response to Acute Exercise. Med Sci Sports Exerc. 2021, 53, 2173-2181. [CrossRef]
- Simo-Tabue, N.; Boucaud-Maitre, D.; Letchimy, L.; Guilhem-Decleon, J.; Helene-Pelage, J.; Duval, G.T.; Tabue-Teguo, M. Correlates of Undernutrition in Older People in Guadeloupe (French West Indies): Results from the KASADS Study. Nutrients. 2023, 15. [CrossRef]
- Reza, S.; Alam, M.R.; Chowdhury, A.I.; Mamun, M.A.A.; Akhter, M.; Habib, M.A. Assessing Nutritional Status and Functionality in Geriatric Population of Bangladesh: The Hidden Epidemic of Geriatric Malnutrition. Gerontol Geriatr Med. 2023, 9, 23337214231172663. [CrossRef]
- Yoshita, K.; Arai, Y.; Nozue, M.; Komatsu, K.; Ohnishi, H.; Saitoh, S.; Miura, K. Total energy intake and intake of three major nutrients by body mass index in Japan: NIPPON DATA80 and NIPPON DATA90. J Epidemiol. 2010, 20 Suppl 3, S515-523. [CrossRef]

Table 1.
Characteristics of study participants according to number of dining companions (n = 2,865).
Table 1.
Characteristics of study participants according to number of dining companions (n = 2,865).
| Variables | Number of dining companions | |||
| None (n = 194) | 1 (n = 1,872) | ≥2 (n = 799) | P -value | |
| Sex | ||||
| Male | 78 (40.2) | 986 (52.7) | 369 (46.2) | <0.001 |
| Female | 116 (59.8) | 886 (47.3) | 430 (53.8) | |
| Highest level of education | ||||
| Junior high school or below | 59 (30.4) | 518 (27.7) | 317 (39.7) | <0.001 |
| High school or above | 135 (69.6) | 1,350 (72.1) | 477 (59.7) | |
| Living arrangement | ||||
| Living alone | 96 (49.5) | 8 (0.4) | 4 (0.5) | <0.001 |
| Living with others | 92 (47.4) | 1,827 (97.6) | 773 (96.7) | |
| Smoking status | ||||
| Current | 38 (19.6) | 310 (16.6) | 156 (19.5) | 0.003 |
| Past | 44 (22.7) | 545 (29.1) | 178 (22.3) | |
| Never | 112 (57.7) | 1,017 (54.3) | 465 (58.2) | |
| Alcohol consumption status | ||||
| Current | 73 (37.6) | 869 (46.4) | 323 (40.4) | 0.02 |
| Never/Past | 121 (62.4) | 1,002 (53.5) | 476 (59.6) | |
| Walking status(h/day) | ||||
| <1 | 79 (40.7) | 825 (44.1) | 316 (39.5) | 0.02 |
| ≥1 | 115 (59.3) | 1040 (55.6) | 474 (59.3) | |
| Depressive symptoms | ||||
| Presence | 55 (28.4) | 369 (19.7) | 194 (24.3) | 0.01 |
| Absence | 139 (71.6) | 1,495 (79.9) | 602 (75.3) | |
| IADL | ||||
| Deteriorated | 7 (3.6) | 219 (11.7) | 104 (13.0) | 0.01 |
| Not deteriorated | 187 (96.4) | 1.648 (88.0) | 693 (86.7) | |
| Medical history of | ||||
| Hypertension | ||||
| Presence | 101 (52.1) | 863 (46.1) | 351 (43.9) | 0.12 |
| Diabetes mellitus | ||||
| Presence | 17 (8.8) | 207 (11.1) | 73 (9.1) | 0.25 |
| Cardio-cerebrovascular diseases | ||||
| Presence | 5 (2.6) | 60 (3.2) | 25 (3.1) | 0.89 |
| Cancer | ||||
| Presence | 5 (2.6) | 75 (4.0) | 30 (3.8) | 0.618 |
| Hyperlipidemia | ||||
| Presence | 27 (13.9) | 250 (13.4) | 109 (13.6) | 0.96 |
| BMI (kg/m2) | ||||
| <18.5 | 6 (3.1) | 94 (5.0) | 30 (3.8) | 0.37 |
| 18.5–22.9 | 98 (50.5) | 882 (47.1) | 369 (46.2) | |
| ≥23.0 | 90 (46.4) | 896 (47.9) | 400 (50.1) | |
IADL, instrumental activity of daily living; BMI, body mass index. Values are expressed as number (percentage). P-values were calculated with chi-square tests. The proportion of each variable does not always add up to 100 owing to missing data.
Table 2.
Associations of number of dining companions with food group intake (n =2,865).
| Number of dining companions | ||||
| None (n = 194) | 1 (n = 1,872) | ≥2 (n = 799) | P for trend | |
| Rice (g) | ||||
| β (95 % CI)1 | Ref. | 0.67 (−2.14, 3.50) | 3.90 (0.91, 6.90)* | <0.001 |
| β (95 % CI)2 | Ref. | −0.51 (−4.19, 3.15) | 2.23 (−1.57, 6.04) | 0.004 |
| β (95 % CI)3 | Ref. | −0.58 (−4.26, 3.08) | 2.23 (−1.57, 6.04) | 0.003 |
| Bread (g) | ||||
| β (95 % CI)1 | Ref. | 0.88 (−2.33, 4.10) | −0.70 (−4.12, 2.71) | 0.15 |
| β (95 % CI)2 | Ref. | 0.26 (−3.92, 4.46) | −0.88 (−5.24, 3.46) | 0.32 |
| β (95 % CI)3 | Ref. | 0.31 (−3.88, 4.51) | −0.81 (−5.16, 3.53) | 0.37 |
| Noodles (g) | ||||
| β (95 % CI)1 | Ref. | 9.07 (−3.80, 21.94) | 6.63 (−7.01, 20.28) | 0.99 |
| β (95 % CI)2 | Ref. | 7.88 (−8.92, 24.70) | 5.78 (−11.65, 23.22) | 0.90 |
| β (95 % CI)3 | Ref. | 8.08 (−8.73, 24.90) | 6.00 (−11.43, 23.44) | 0.94 |
| Sugars and sweeteners (g) | ||||
| β (95 % CI)1 | Ref. | 0.29 (−0.04, 0.63) | 0.15 (−0.20, 0.51) | 0.75 |
| β (95 % CI)2 | Ref. | 0.33 (−0.11, 0.77) | 0.22 (−0.23, 0.68) | 0.94 |
| β (95 % CI)3 | Ref. | 0.32 (−0.11, 0.77) | 0.23 (−0.22, 0.68) | 0.96 |
| Confectioneries (g) | ||||
| β (95 % CI)1 | Ref. | 1.37 (−1.04, 3.80) | 0.51 (−2.05, 3.08) | 0.06 |
| β (95 % CI)2 | Ref. | 0.73 (−2.40, 3.87) | 0.27 (−2.98, 3.53) | 0.13 |
| β (95 % CI)3 | Ref. | 0.72 (−2.41, 3.87) | 0.27 (−2.98, 3.53) | 0.13 |
| Fats and oils (g) | ||||
| β (95 % CI)1 | Ref. | 0.78 (−0.13, 1.70) | 2.13 (1.15, 3.11)* | <0.001 |
| β (95 % CI)2 | Ref. | 0.59 (−0.60, 1.79) | 1.99 (0.74, 3.24)* | <0.001 |
| β (95 % CI)3 | Ref. | 0.59 (−0.61, 1.79) | 1.99 (0.74, 3.23)* | <0.001 |
| Nuts and seeds (g) | ||||
| β (95 % CI)1 | Ref. | 0.30 (−0.19, 0.81) | 0.17 (−0.35, 0.71) | 0.62 |
| β (95 % CI)2 | Ref. | 0.55 (−0.10, 1.21) | 0.45 (−0.23, 1.13) | 0.84 |
| β (95 % CI)3 | Ref. | 0.55 (−0.10, 1.21) | 0.45 (−0.23, 1.13) | 0.84 |
| Pulses (g) | ||||
| β (95 % CI)1 | Ref. | 9.17 (1.61, 16.73)* | 10.63 (2.62, 18.65)* | 0.61 |
| β (95 % CI)2 | Ref. | 7.56 (−2.32, 17.45) | 8.80 (−1.45, 19.06) | 0.9 |
| β (95 % CI)3 | Ref. | 7.46 (−2.43, 17.36) | 8.76 (−1.50, 19.02) | 0.92 |
| Fish and shellfish (g) | ||||
| β (95 % CI)1 | Ref. | 8.08 (−0.03, 16.19) | 5.89 (−2.71, 14.49) | 0.15 |
| β (95 % CI)2 | Ref. | 8.56 (−2.02, 19.16) | 7.14 (−3.84, 18.13) | 0.17 |
| β (95 % CI)3 | Ref. | 8.33 (−2.26, 18.93) | 7.01 (−3.96, 18.00) | 0.18 |
| Meet (g) | ||||
| β (95 % CI)1 | Ref. | 3.78 (−1.84, 9.41) | 11.13 (5.16, 17.11)* | <0.001 |
| β (95 % CI)2 | Ref. | 0.67 (−6.70, 8.04) | 7.80 (0.15, 15.45)* | <0.001 |
| β (95 % CI)3 | Ref. | 0.80 (−6.57, 8.18) | 7.90 (0.25, 15.55)* | <0.001 |
| Eggs (g) | ||||
| β (95 % CI)1 | Ref. | 4.52 (0.57, 8.46)* | 2.93 (−1.24, 7.12) | 0.93 |
| β (95 % CI)2 | Ref. | 1.44 (−3.70, 6.58) | 0.24 (−5.08, 5.58) | 0.73 |
| β (95 % CI)3 | Ref. | 1.49 (−3.65, 6.64) | 0.28 (−5.05, 5.62) | 0.74 |
| Milk and dairy products (g) | ||||
| β (95 % CI)1 | Ref. | 2.89 (−18.22, 24.01) | −19.76 (−42.15, 2.63) | <0.001 |
| β (95 % CI)2 | Ref. | 36.85 (9.71, 63.99)* | 19.40 (−8.73, 47.54) | 0.05 |
| β (95 % CI)3 | Ref. | 37.45 (10.31, 64.60)* | 19.86 (−8.26, 48) | 0.06 |
| Green-yellow vegetables (g) | ||||
| β (95 % CI)1 | Ref. | 16.32 (2.37, 30.28)* | 3.75 (−11.03, 18.55) | 0.02 |
| β (95 % CI)2 | Ref. | 24.54 (6.52, 42.56)* | 15.67 (−3, 34.36) | 0.17 |
| β (95 % CI)3 | Ref. | 24.77 (6.76, 42.79)* | 15.97 (−2.7, 34.65) | 0.19 |
| Other vegetables (g) | ||||
| β (95 % CI)1 | Ref. | 22.61 (12.82, 32.39)* | 24.03 (13.65, 34.4)* | 0.03 |
| β (95 % CI)2 | Ref. | 12.14 (−0.66, 24.94) | 13.84 (0.56, 27.12)* | 0.29 |
| β (95 % CI)3 | Ref. | 12.23 (−0.58, 25.04) | 13.84 (0.56, 27.12)* | 0.31 |
| Fruits (g) | ||||
| β (95 % CI)1 | Ref. | 45.26 (25.81, 64.71)* | 21.86 (1.24, 42.48)* | 0.007 |
| β (95 % CI)2 | Ref. | 49.04 (24.2, 73.88)* | 30.60 (4.84, 56.36)* | 0.01 |
| β (95 % CI)3 | Ref. | 49.22 (24.37, 74.07)* | 30.86 (5.09, 56.62)* | 0.01 |
| Mushrooms (g) | ||||
| β (95 % CI)1 | Ref. | 2.60 (1.16, 4.05)* | 2.81 (1.28, 4.34)* | 0.05 |
| β (95 % CI)2 | Ref. | 2.14 (0.26, 4.02)* | 2.50 (0.54, 4.45)* | 0.09 |
| β (95 % CI)3 | Ref. | 2.11 (0.22, 3.99)* | 2.48 (0.53, 4.44)* | 0.08 |
β, multivariable regression coefficients; CI, confidence interval; Ref, Reference; IADL, instrumental activity of daily living; BMI, body mass index. * P < 0.05. P for trend is calculated across the number of dining companions (continuous). 1 adjusted for enroll year, sex. 2 adjusted for enroll year, sex, highest level of education, living arrangement, smoking status, alcohol consumption status, walking status, depression symptoms, IADL, medical histories of hypertension, diabetes mellitus, cardio-cerebrovascular diseases, cancer, and hyperlipidemia. 3 adjusted for enroll year, sex, highest level of education, living arrangement, smoking status, alcohol consumption status, walking status, depression symptoms, IADL, medical histories of hypertension, diabetes mellitus, cardio-cerebrovascular diseases, cancer, and hyperlipidemia, and BMI.
Table 3.
Associations of number of dining companions with nutrient intakes (n = 2,865).
| Number of dining companions | ||||
| None (n = 194) | 1 (n = 1,872) | ≥2 (n = 799) | P for trend | |
| Energy (kcal) | ||||
| β (95 % CI)1 | Ref. | 116.08 (31.62, 200.54)* | 161.14 (71.59, 250.69)* | 0.01 |
| β (95 % CI)2 | Ref. | 90.66 (−19.10, 200.42) | 142.87 (29.05, 256.70)* | 0.02 |
| β (95 % CI)3 | Ref. | 90.25 (−19.51, 200.02) | 143.85 (30.05, 257.65)* | 0.01 |
| Protein (g) | ||||
| β (95 % CI)1 | Ref. | 6.00 (2.10, 9.90)* | 6.35 (2.21, 10.48)* | 0.38 |
| β (95 % CI)2 | Ref. | 5.52 (0.44, 10.60)* | 6.29 (1.02, 11.56)* | 0.42 |
| β (95 % CI)3 | Ref. | 5.50 (0.42, 10.59)* | 6.32 (1.05, 11.59)* | 0.38 |
| Fat (g) | ||||
| β (95 % CI)1 | Ref. | 4.18 (0.97, 7.39)* | 6.16 (2.75, 9.56)* | 0.004 |
| β (95 % CI)2 | Ref. | 4.37 (0.18, 8.55)* | 6.74 (2.40, 11.08)* | 0.002 |
| β (95 % CI)3 | Ref. | 4.39 (0.21, 8.58)* | 6.78 (2.44, 11.12)* | 0.002 |
| Carbohydrate (g) | ||||
| β (95 % CI)1 | Ref. | 16.30 (4.49, 28.11)* | 21.54 (9.02, 34.06)* | 0.03 |
| β (95 % CI)2 | Ref. | 11.68 (−3.70, 27.06) | 17.26 (1.30, 33.21)* | 0.09 |
| β (95 % CI)3 | Ref. | 11.59 (−3.78, 26.97) | 17.43 (1.48, 33.37)* | 0.06 |
β, multivariable regression coefficients; CI, confidence interval; Ref, Reference; IADL, instrumental activity of daily living; BMI, body mass index. * P < 0.05. P for trend is calculated across the number of dining companions (continuous). 1 adjusted for enroll year, sex. 2 adjusted for enroll year, sex, highest level of education, living arrangement, smoking status, alcohol consumption status, walking status, depression symptoms, IADL, medical histories of hypertension, diabetes mellitus, cardio-cerebrovascular diseases, cancer, and hyperlipidemia. 3 adjusted for enroll year, sex, highest level of education, living arrangement, smoking status, alcohol consumption status, walking status, depression symptoms, IADL, medical histories of hypertension, diabetes mellitus, cardio-cerebrovascular diseases, cancer, and hyperlipidemia, and BMI.
Disclaimer/Publisher’s Note: The statements, opinions and data contained in all publications are solely those of the individual author(s) and contributor(s) and not of MDPI and/or the editor(s). MDPI and/or the editor(s) disclaim responsibility for any injury to people or property resulting from any ideas, methods, instructions or products referred to in the content. |
© 2024 by the authors. Licensee MDPI, Basel, Switzerland. This article is an open access article distributed under the terms and conditions of the Creative Commons Attribution (CC BY) license (http://creativecommons.org/licenses/by/4.0/).
Copyright: This open access article is published under a Creative Commons CC BY 4.0 license, which permit the free download, distribution, and reuse, provided that the author and preprint are cited in any reuse.


