
Submitted:
18 September 2025
Posted:
18 September 2025
You are already at the latest version
Abstract
This study examines the relationship between meteorological variables and the prevalence of Fusarium species at 26 grain sampling sites over five years. We analyzed average temperatures for May, June, and July, which showed significant year-to-year variability, with the highest deviations in 2019 and the lowest in 2014. Similarly, precipitation varied substantially each year, with notable differences between 2014 and 2019. The measurement of Fusarium DNA indicated its presence in most samples, with peak levels in southeastern and northwest Poland. Five Fusarium species were identified, with F. graminearum s.s. being the most dominant. The geographic distribution of Fusarium DNA revealed significant regional differences, with the highest levels in specific provinces each year. Statistical analysis showed significant correlations between DNA levels of F. avenaceum, F. culmorum, and F. graminearum s.s. Principal Component Analysis (PCA) revealed strong relationships among these species, especially in samples from 2016 and 2017. We also found a positive correlation between Fusarium DNA levels and precipitation during the flowering and ripening stages, and a negative correlation with temperature during stem elongation and milk-dough phases. These results highlight the complex interactions between climate factors and Fusarium occurrence in winter wheat grain, shedding light on environmental influences on fungal epidemiology in agricultural systems.
Keywords:
DNA
; Fusarium
; Fusarium head blight
; wheat
; weather conditions
1. Introduction
Fusarium head blight (FHB), also known as scab, is a severe wheat disease (Triticum aestivum) in Europe and other regions caused by fungi of the genus Fusarium [1]. Several species of Fusarium can cause FHB, including Fusarium graminearum and Fusarium culmorum. These fungi infect the developing wheat spikes, causing the grain to become discolored and shriveled, thereby reducing the yield and quality of the crop. The presence of mycotoxins produced by Fusarium species in infected grains can also pose a risk to human and animal health. The two species mentioned above are identified as producers of deoxynivalenol (DON), nivalenol (NIV), and zearalenone (ZEN). Other Fusarium species that cause FHB include F. avenaceum, a producer of moniliformin, enniatins, and beauvericin (BEA); F. poae, a producer of diacetoxyscirpenol (DAS), NIV, and BEA; F. langsethiae and F. sporotrichioides, producers of T-2 toxin, HT-2 toxin, and DAS, also occur [2,3,4,5,6,7]. Among these species, Fusarium graminearum and F. culmorum are highly pathogenic to wheat, causing severe epidemics of FHB. The other species are moderately or weakly pathogenic; however, they may also contaminate wheat grain with mycotoxins [8,9,10,11].
Currently, F. graminearum is considered the most important species causing FHB in Europe and other regions, as it is the most virulent and capable of producing high levels of mycotoxins. Phylogenetic studies of the F. graminearum strain collection revealed that F. graminearum is a species complex comprising 11 distinct species [12,13,14]. The most common species worldwide within the F. graminearum species complex (FGSC) is F. graminearum sensu stricto. In Europe, F. graminearum s.s. was isolated almost exclusively [15,16,17]. Only single isolates of other species (F. boothi, F. cortaderiae) were found, as shown in the analysis of the influence of climate on the distribution of FGSC species by Backhouse [18] and in the bibliographic analysis by Del Ponte et al. [19].
The composition of Fusarium species infecting wheat varies depending on the climate of the wheat-growing region. In Europe, other species are more common in the Northeast, where F. avenaceum, F. culmorum, and F. graminearum s.s. each make up about the same share, compared to the Southwest of the continent, where F. graminearum s.s. is mostly found [20,21].
The composition of the species changes with time, which is the result of climate warming and changes in the acreage of the main cereal crops, such as an increase in the area of maize [22,23,24,25]. The primary reported effect of these factors is the increase in the frequency of F. graminearum and the decrease in F. culmorum [26,27,28]. Climate warming could favor F. graminearum s.s., as it has a higher optimal temperature for development than F. culmorum. F. graminearum s.s., unlike F. culmorum, is a significant pathogen on maize and can survive on maize debris [24,29]. It is worth noting that in Poland, the area used for maize cultivation has expanded significantly, from 59,000 hectares in 1990 to 1,814,974 hectares in 2024 (https://kukurydza.info.pl/powierzchnia-uprawy-kukurydzy-w-polsce-w-2024-r/).
The frequencies of Fusarium species infecting wheat heads in Poland from 1985 to 2009 were summarized by Stępień and Chełkowski [30]. In 1985, F. avenaceum and Microdochium nivale were the dominant species, with F. culmorum as the third most common. By 2009, F. graminearum became dominant, and F. culmorum ranked second, with its frequency about half that of F. graminearum. The rise of F. graminearum was evident; however, the differences between certain years were statistically significant. According to various studies conducted in Poland after 2010, F. graminearum is now the most prevalent species of Fusarium [31,32,33]. A higher frequency of F. culmorum was observed only in some studies [34,35]. Other species commonly detected include F. avenaceum and F. poae [33,36].
There has been a recent increase in FHB cases in Poland, raising concerns among farmers and researchers about its impact on food safety and security [37,38,39]. This disease presents a major risk in areas with high humidity and rainfall, as these conditions foster the growth and spread of Fusarium fungi. [33,36,40,41]. In Poland, farmers and researchers use various strategies to reduce the impact of FHB. These include planting resistant cultivars, adopting integrated disease management practices, and developing new technologies to detect and lower mycotoxin contamination [42,43]. However, FHB still presents a significant challenge for the Polish cereal crop industry, which must meet the stricter limits on Fusarium toxin levels in cereal grain coming into effect in 2024 [44]. Ongoing research and development efforts are essential to address this problem.
The study aimed to evaluate the diversity of Fusarium species infecting wheat kernels across various regions of Poland from 2014 to 2019.
2. Materials and Methods
2.1. Wheat Grain Samples
Wheat grain samples were collected during the harvest seasons of 2014–2017 and 2019. They came from 26 experimental stations of COBORU (the Research Centre for Cultivar Testing; https://coboru.gov.pl/), situated in different regions of Poland (Figure 1). Two winter wheat cultivars, moderately susceptible to FHB—‘Arkadia’ and ‘Bamberka’ (which was replaced in 2017 by ‘Hondia,’ a moderately resistant variety to FHB)—were included [45]. According to COBORU data (https://coboru.gov.pl/), these three cultivars were among the most widely grown in Poland during the study years. Winter wheat was cultivated in 10 m² plots with moderate nitrogen input (average 90 kg/ha of N) and no chemical control of diseases, except for seed treatment with fungicides. Herbicides and insecticides were applied as needed. The grain was harvested with a combine harvester.
The number of samples collected and analyzed varied from year to year.
2.2. Sample Preparation
Pure isolates from five Fusarium species (F. culmorum, F. avenaceum, F. graminearum s.s., F. poae, and F. langsethiae) were cultivated on PDA medium. The surface of the PDA in the Petri dishes was covered with sterilized cellophane discs. Mycelial cultures were incubated in darkness at 22°C for one week. Between 1 and 2 grams of mycelium from each species were harvested for DNA extraction. The samples were ground in liquid nitrogen using a mortar and pestle.
Wheat grain samples (300 g) were finely ground using Ultra Centrifugal Mill ZM 300 (Retsch Polska, Verder Polska Sp. z o.o., Katowice, Poland). Next, 5 g of ground grain was powdered in liquid N₂ using Geno/Grinder 2000 (OPS Diagnostics, Bridgewater, NJ). Two replicates (200 mg) of subsamples were taken from each powdered sample for DNA isolation.
2.3. DNA Isolation
DNA extraction from pure mycelia and plant samples was conducted using a CTAB method. 750 µl of CTAB extraction buffer (20 g/l CTAB, 1.4 M NaCl, 0.1 M Tris-HCl, 20 mM Na₂EDTA) with 20 µl of RNase A (10 mg/ml) was added to each subsample. Buffer volumes, together with the volumes of chemicals used in subsequent steps, were increased proportionally, if needed. Samples were incubated at 65°C for 15 min. Next, 20 µl of Proteinase K (20 mg/ml) was added, and samples were incubated at 65°C for 60 min. Subsequently, samples were centrifuged for 10 min at 16000 x g. The supernatant was transferred into a new tube, and 500 µl of chloroform was added. Then, samples were shaken for 30 s and centrifuged for 10 min at 16000 x g. The upper layer was transferred to a new tube and mixed with another 500 µl of chloroform. After 5 min of centrifugation at 16000 x g, the upper layer was combined with two volumes of CTAB precipitation solution (5 g/l CTAB, 0.04 M NaCl). The mix was incubated for 60 min at room temperature and centrifuged for 5 min at 16000 x g. After removing the supernatant, the pellet was dissolved in 350 µl of 1.2 M NaCl. Next, 350 µl of chloroform was added, and the mix was shaken for 30 s. After 10 min centrifugation at 16000 x g, the upper phase was transferred to a new tube and mixed with 180 µl of isopropanol. The sample was centrifuged for 10 min at 16000 x g. The supernatant was removed, and the pellet was washed in 500 µl of 70% ethanol and centrifuged for 10 min at 16000 x g. The DNA pellet was dried and then dissolved in 100 µL of deionized, sterile water. DNA concentration was measured using the Nanophotometer Pearl (Implen GmbH, Munich, Germany).
2.4. Real-Time PCR
Real-time PCR analyses with SYBR Green intercalating dye were performed on a 7500 Fast instrument (Life Technologies). Primer sequences developed by Nicolaisen et al. [46] are listed in Table 1. The authors state that F. graminearum primers (Fgram F, Fgram R) detect all species in the F. graminearum species complex. Exceptions are two species from South America—F. cortaderiae and F. brasillicum.
PCR reactions were conducted in a 12.5 µl total volume. Standard curves for Fusarium species were prepared using subsequent dilutions of DNA derived from pure cultures: 0.001, 0.01, 0.1, 1, and 10 ng/µL. The standard curve for the EF1α reference gene was prepared from wheat DNA in concentrations of 0.5, 1, 2, 5, and 10 ng/µl. Samples for the real-time PCR reaction were diluted to 5 ng/µl. The PCR mix consisted of 1x SYBR Green PCR Mastermix (Life Technologies), 250 nM primer F and R (Sigma), and 0.5 µg/µl BSA (Thermo Scientific). The temperature profile of the PCR reaction was as follows:50°C, 2 min; 95°C, 10 min; (95°C, 15 s; 62°C, 1 min) x 40. For the EF1α gene, the annealing temperature was 60°C. Following the PCR reaction, melt curve analysis was conducted in the temperature range of 60-95°C to check the specificity of the obtained products.
The concentration of each Fusarium species was measured using a standard curve. The results are expressed as picograms of fungal DNA per microgram of plant DNA, following Nicolaisen et al. [46].
2.5. Statistical Analysis
Statistical analysis was performed using Microsoft® Excel 2016 and XLSTAT© (Version 2020.4.1.1027, Addinsoft, Paris, France) software.
The relationships between DNA levels of five Fusarium species were analysed using Pearson’s correlation tests (XLSTAT procedure: Correlation tests). Before analysis, all variables that were not normally distributed were log10-transformed.
The data on DNA levels of five Fusarium species in 111 wheat grain samples, collected over five years from 26 locations, were then analysed using multivariate statistical methods. Principal component analysis (XLSTAT procedure: Principal Component Analysis PCA) was used to demonstrate how grain samples from different locations and years are distributed in relation to the variation explained by the first two principal components and how DNA levels of Fusarium species influence these components. PCA results also reveal relationships among variables based on the angles between variable vectors.
To identify a potential link between Fusarium DNA levels in grain and the summarized weather variables across 92 data windows, Spearman’s rank correlation coefficient was employed. Weather summaries with a significant Spearman correlation (p < 0.01) were identified as key weather factors that could influence Fusarium colonization of wheat grains. A phenological stage was assigned to these significant weather summaries.
3. Results
3.1. Weather Conditions
The weather conditions at the 26 grain sampling locations varied (Figure 2). The average temperature in May fluctuated over the five years, ranging from 10.2°C to 16.3°C. The most considerable temperature variation was recorded in 2019, while the smallest was in 2014. In June, the average temperature fluctuated between 13.9°C and 22.8°C over the five years. The most tremendous variation was observed in 2017, with the least in 2014. July’s average temperature ranged from 15.9°C to 22.0°C during these years, with the highest variation in 2015 and the lowest in 2014.
When comparing the five years, the lowest average temperature in May was recorded in 2019 and 2015, while the highest was in 2016. We noticed a slow decrease in the average temperature starting from 2016. In June, the lowest average temperature was recorded in 2014 and the highest in 2019. The average temperature in June increased each year from 2014 and was particularly high in 2019. The lowest average temperature in July was recorded in 2017 and 2019, with the highest in 2014. We observed a gradual decline in the average temperature in this month from 2014 onward.
Regarding precipitation, the monthly total rainfall in May ranged from 40.7 to 91.8 mm over five years. The greatest variation occurred in 2019 and 2014, while the least was in 2016. In June, the annual total rainfall ranged from 36.6 to 76.4 mm across five years. The largest variation was in 2019, and the smallest in 2015. In July, the total rainfall over five years varied from 45.9 to 141.2 mm. The highest variation was in 2016, and the lowest was in 2015.
Over five years, the lowest precipitation in May was observed in 2016 and 2017, while the highest occurred in 2014 and 2019. We saw a gradual decline in rainfall from 2014 to 2016, followed by an increase until 2019. In June, the lowest precipitation was recorded in 2019 and 2015, and the highest in 2017. The June rainfall was fairly consistent across the five years. The lowest precipitation in July was recorded in 2019, and the highest in 2016. We observed a gradual rise in rainfall in July from 2014 to 2016, followed by a subsequent decrease until 2019.
3.2. Fusarium Species
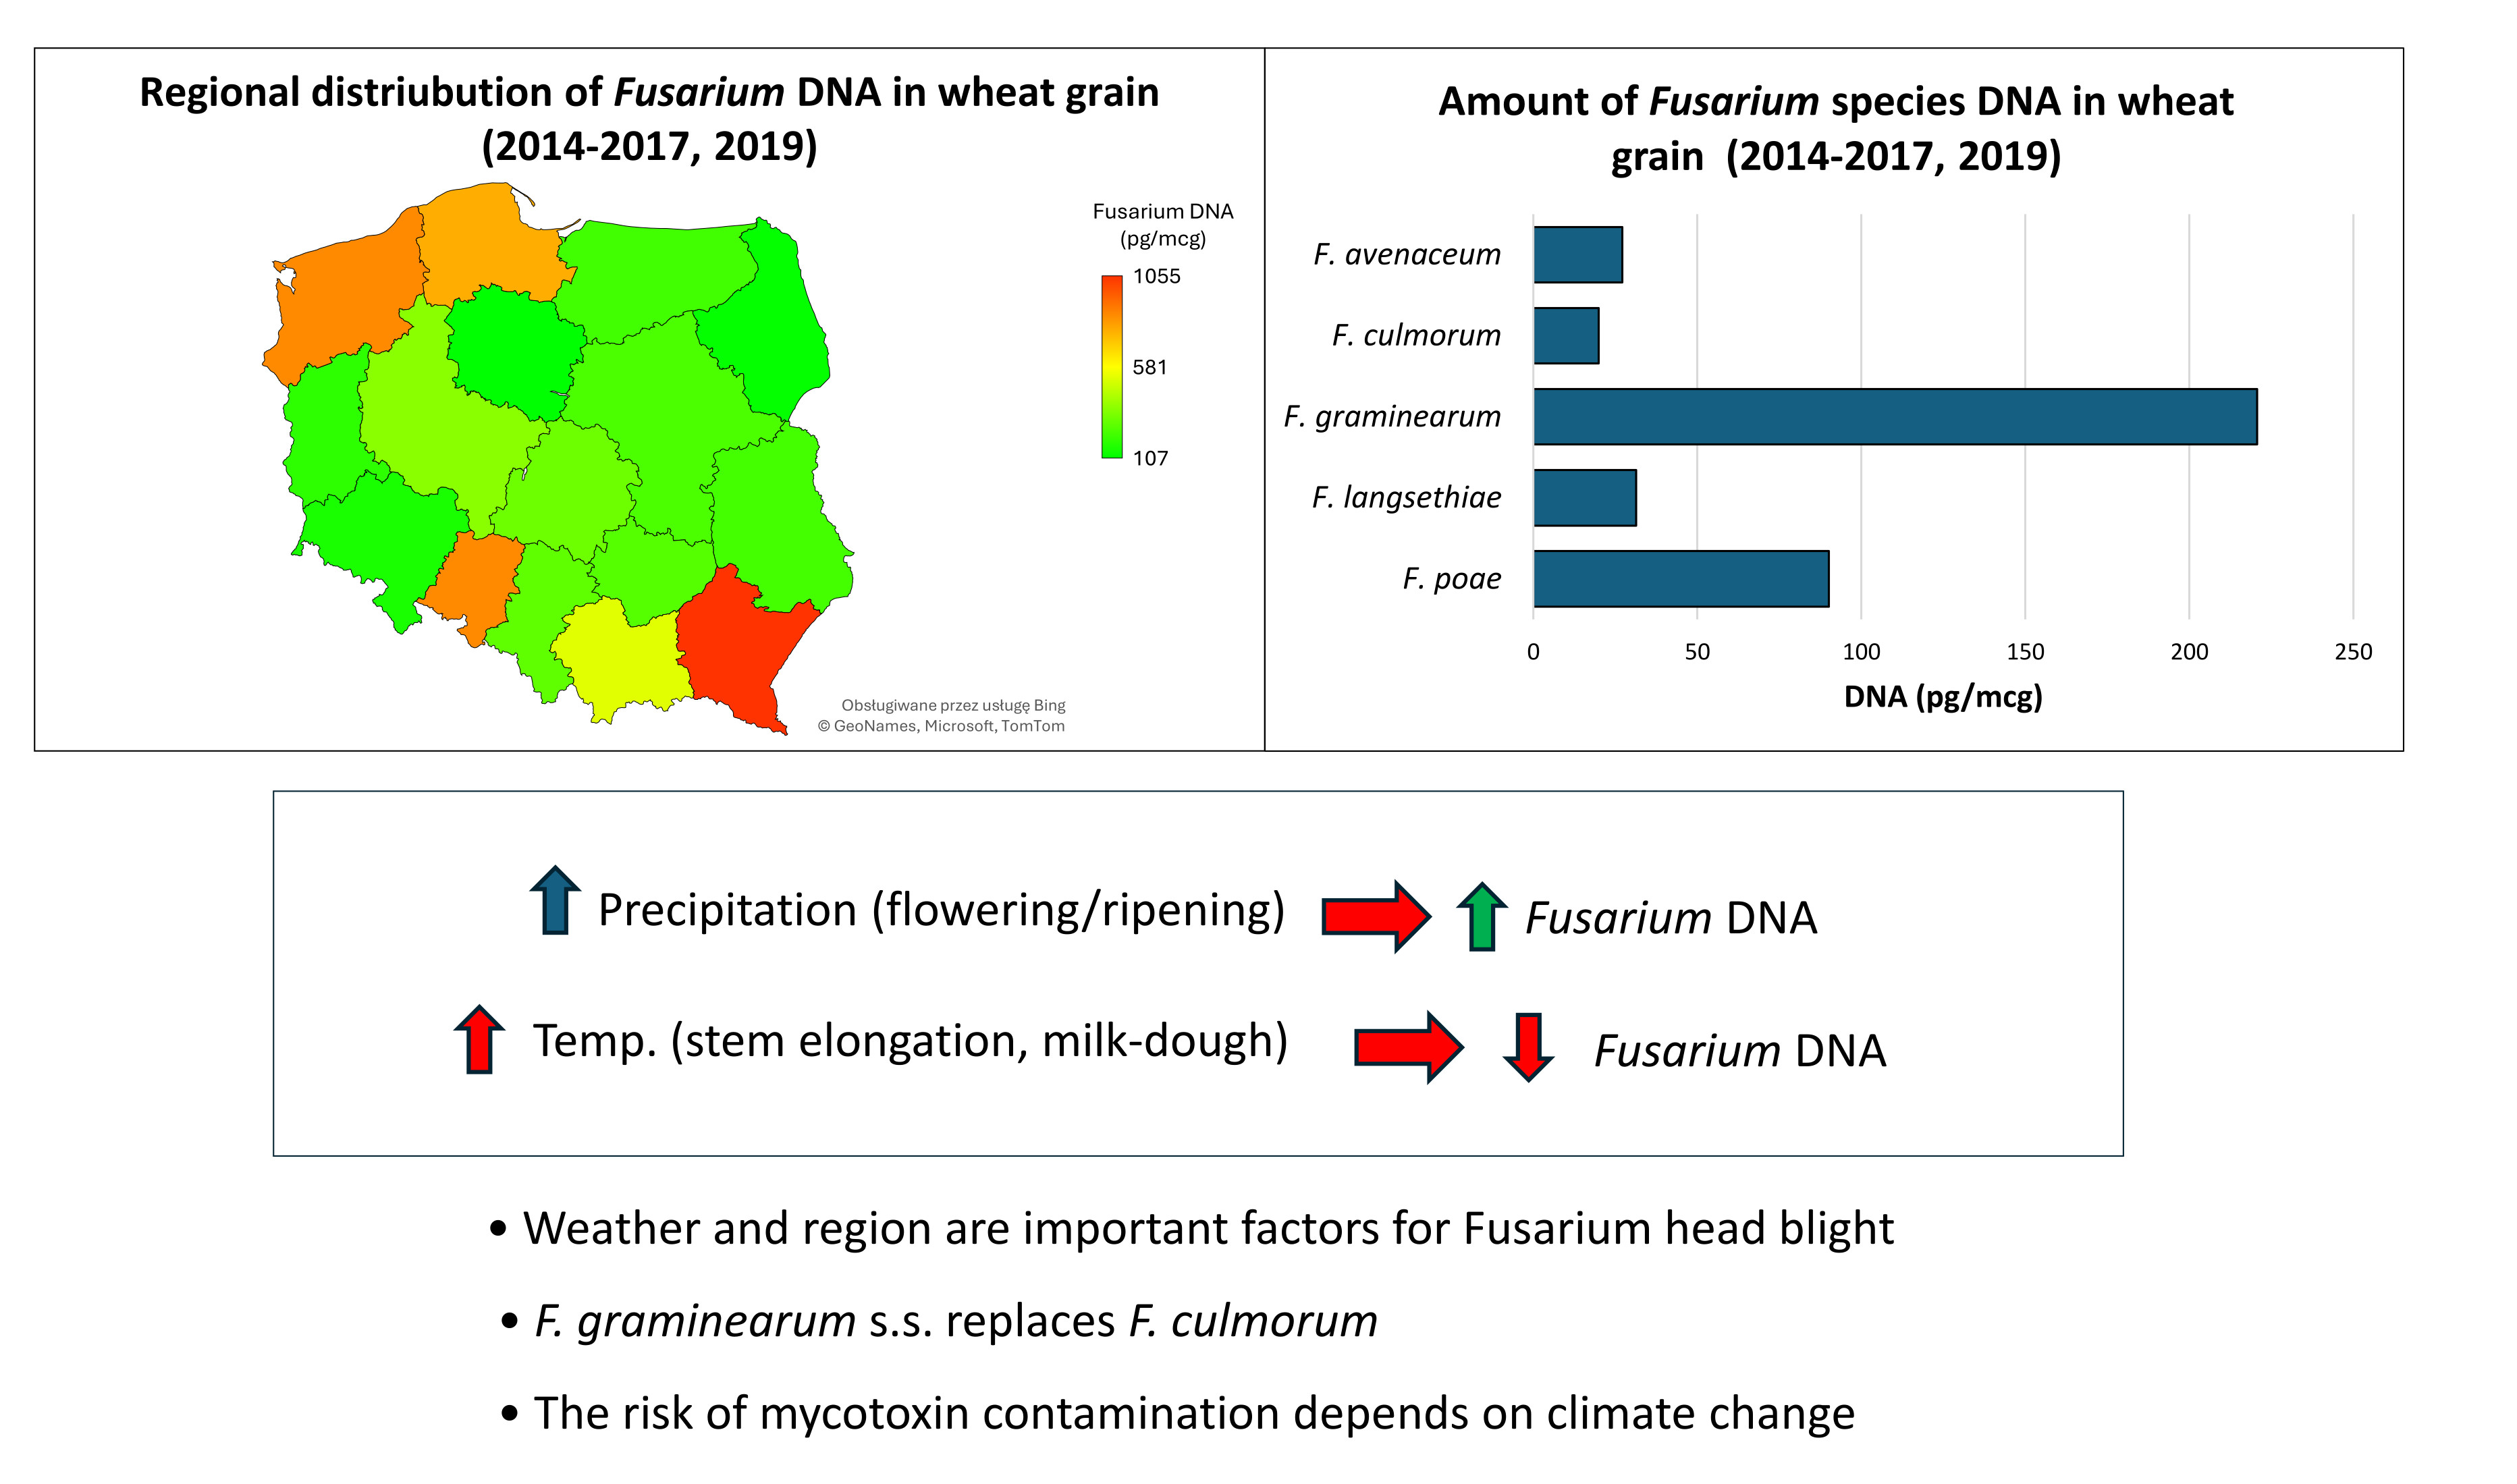
DNA from five Fusarium species was detected in most samples over a five-year period. Trace amounts of Fusarium DNA were detected in 40% of samples in 2014, 35% in 2015, 36% in 2016, 8% in 2017, and 28% in 2019. The highest total of Fusarium DNA was identified in 2017, and it was notably higher than in other years (Figure 3).
In 2014, F. graminearum s.s. dominated, and the amount of DNA from this species was significantly higher than that of the other species. Only traces of F. avenaceum DNA were detected. In 2015, F. poae was the dominant species, and its DNA amount was greater than that of the others. DNA from F. avenaceum and F. culmorum was detected only in trace amounts. In 2016, the DNA levels of the five species did not differ significantly; however, the highest amounts were seen for F. avenaceum and F. graminearum s.s., while F. langsethiae had the lowest amount. In 2017, F. graminearum s.s. again dominated, and its DNA amount was significantly higher than that of the other species. In 2019, the DNA levels of the five species did not differ significantly, with F. avenaceum having the lowest amount. No DNA from F. culmorum was detected.
The highest concentrations of total Fusarium DNA during the five-year study were found in southeastern Poland, particularly in the Podkarpackie province, as well as in the northwestern regions, including Zachodniopomorskie and Pomorskie provinces (Figure 4). Elevated levels of Fusarium DNA were also detected in wheat grain from the southern Opolskie province. Additionally, the Małopolskie province in the south showed higher concentrations of Fusarium DNA compared to other regions. The lowest levels were observed in Kujawsko-Pomorskie (north-central Poland), Podlaskie (eastern Poland), and Dolnośląskie (southwestern Poland).
Over five years of experimentation, the regional distribution of Fusarium DNA showed significant variation (Figure S1). In 2014, Fusarium DNA was mainly found in grain samples from southeastern Poland (Podkarpackie, Lubelskie, and Małopolskie provinces), with particularly high levels in Podkarpackie (2804 pg/μg). In 2015, a large amount of Fusarium DNA was detected in samples from southern Poland, especially in Małopolskie. Unlike in 2014, high concentrations also appeared in samples from Mazowieckie. In 2016, Fusarium DNA was primarily found in samples from northwestern Poland (Zachodniopomorskie), with a concentration of 1757 pg/μg, while other regions showed lower levels. An exception was Śląskie in southern Poland, which exceeded the average for 2016 at 501 pg/mg (Figure 3). In 2017, the highest Fusarium DNA levels were in samples from northwest and north Poland (Zachodniopomorskie, Pomorskie, and Warmińsko-Mazurskie). Levels were also high in parts of central Poland (Wielkopolskie and Łódzkie) and southern Poland (Opolskie). Unfortunately, samples from Podkarpackie were not available this year. In 2019, Fusarium DNA was mainly found in grain samples from northern (Pomorskie and Warmińsko-Mazurskie) and southeastern Poland (Podkarpackie, Małopolskie, and Świętokrzyskie), with high levels also in western Poland (Lubuskie).
We analyzed the frequency of Fusarium species in Polish regions over five years (Figure S2). DNA from F. aveanceum was found in significant amounts only in two northern regions—the Zachodniopomorskie and Pomorskie provinces. In other regions, it was present in very low or trace amounts. The DNA concentration of F. culmorum in wheat grain was generally low, mainly detected in samples from the northwestern Zachodniopomorskie province and the southern Śląskie province. Only traces of F. culmorum DNA were found in most parts of eastern Poland, as well as in the south and west. DNA from F. graminearum s.s. was detected in the highest amounts, mostly in southeastern and southern Poland (particularly in the Podkarpackie province), as well as in northern and northwestern Poland (mainly Pomorskie). It was also present in central and west-central regions. Only trace levels of this species’ DNA were found in the Mazowieckie and Lubuskie provinces. The presence of F. langsethiae DNA was confirmed in significant quantities in two southern regions (Opolskie and Podkarpackie) and one in western Poland (Lubuskie). In five of the sixteen provinces, F. langsethiae was either not detected or found only in trace amounts. The DNA of F. poae was detected in most provinces, with the highest concentrations in the southern Małopolskie province and the east-central Mazowieckie province. Only low or trace amounts of this species’ DNA were observed in two regions.

Table 2.
Pearson correlation matrix of DNA concentrations from five Fusarium species.
| Variables (n=111) | F. avenaceum | F. culmorum | F. graminearum s.s. | F. langsethiae |
|
F. culmorum p-value |
0.469 0.000 |
|||
|
F. graminearum s.s. p-value |
0.246 0.009 |
0.249 0.008 |
||
|
F. langsethiae p-value |
-0.012 0.899 |
0.055 0.567 |
0.067 0.488 |
|
|
F. poae p-value |
-0.050 0.599 |
0.037 0.703 |
0.031 0.745 |
-0.037 0.0698 |
The DNA amounts of three Fusarium species—F. avenaceum, F. culmorum, and F. graminearum s.s.—were significantly correlated. The highest correlation was observed between F. avenaceum and F. culmorum. In samples with high levels of Fusarium DNA, these two species were often found together. The correlation coefficients between F. graminearum and either F. avenaceum or F. culmorum were significant but lower. F. graminearum s.s. was present in fewer samples, along with one of these species, in higher amounts. However, some grain samples were infected equally by all three species. No correlation was found between the DNA of F. langsethiae or F. poae and that of the other species.
The relationships between species were further analyzed using Principal Component Analysis (PCA). A strong connection was found among the DNA concentrations of F. avenaceum, F. culmorum, and F. graminearum s.s. (Figure 5). All three species showed high positive loadings on factor F1. These species were often detected together in the same grain samples. High DNA levels were mainly observed in samples from 2017 and 2016, with some notable amounts also found in samples from 2014 and 2019. No significant link was observed between these species and F. langsethiae or F. poae. For factor F2, the loadings were highly positive for F. poae and highly negative for F. langsethiae. F. langsethiae DNA was only detected in larger amounts in certain samples, mainly from 2016, 2017, and 2019. F. poae was consistently found in many samples across all years, but in similar moderate quantities. The loadings for factor F3 showed that in some samples—mainly from 2019—both species were present in significant amounts (Figure S3). Again, there was no relationship between these species and F. avenaceum, F. culmorum, or F. graminearum s.s.
Factor loadings for factor F4 were strongly positive for F. graminearum and slightly negative for the other species (Figure S4). This indicates the dominance of F. graminearum as a key pathogen in the FHB complex of wheat.
The relationships between two weather variables (Tmean, PREC), estimated over 14-day windows during the growing season, and the total Fusarium DNA content in winter wheat grain at harvest were analyzed using Spearman’s rank correlation coefficient (Figure 6). A positive correlation was observed between DNA content and precipitation during flowering (BBCH 61-69) and ripening (BBCH 87-89). Conversely, Tmean during stem elongation (BBCH 30-39) and milk-dough (BBCH 75-83) development was negatively correlated with DNA content in the harvested grain. Tmean was positively correlated with DNA content at booting-heading (BCH 45-51).
4. Discussion
This study highlights the significant effect of weather conditions on the presence and distribution of Fusarium species in winter wheat grain. The annual fluctuations in average temperatures during May, June, and July—particularly the extreme differences in 2019 and 2014—and the more stable conditions in 2017 show that temperature is a key factor in Fusarium development. This is further supported by the negative correlation between temperature during the stem elongation and milk-dough stages and Fusarium DNA content. Previous research has also highlighted the role of temperature in influencing the dynamics of Fusarium species [47,48,49].
Precipitation levels showed significant yearly variation, with notable differences between the dry 2015 and the wet years of 2016 and 2017. The positive correlation between Fusarium DNA content and precipitation during the flowering and ripening stages indicates that increased moisture may encourage the growth and spread of Fusarium species. This aligns with previous research highlighting the importance of wet conditions in Fusarium development [50,51,52].
The detection of Fusarium DNA in most samples collected in the late 2010s, with the highest concentrations in southeastern and northwestern Poland, indicates that regional climate factors influence the prevalence of Fusarium. We found that F. graminearum s.s. was the primary cause of FHB. The proportion of the previously dominant species, F. culmorum, decreased significantly. It was found in higher amounts only in the cooler northwestern region. Duba et al. [53], investigating wheat samples from northeastern and southeastern Poland (collected in 2104 and 2015), found F. culmorum dominance only in grain from the cooler northern region.
Several studies examining changes in Fusarium populations, mainly in Western Europe, have shown similar trends. According to Birzele et al. [54] in 1997 and 1998, the dominant species in wheat grain in Germany were F. avenaceum, F. poae, F. culmorum, and F. graminearum. The frequencies of the last two species were similar; however, the percentage of F. graminearum increased in 1998. Waalwijk et al. [55] analyzed wheat heads and grain collected in the Netherlands in 2001 and 2002. In 2001, samples collected during the late milk stage mainly contained F. graminearum; however, some samples also had F. avenaceum and/or F. culmorum. At harvest, F. graminearum was almost exclusively dominant. In 2002, weather conditions were more favorable for FHB, leading to a relative dominance of F. graminearum in grain from the Netherlands and nearly complete dominance in samples from France. Isebaert et al. [56] observed that F. graminearum and F. culmorum were the most prevalent species in Northern Belgium from 2002 to 2005. They found an interesting correlation between crops and the frequency of both species (maize – F. graminearum, small grain cereals – F. culmorum). In Luxembourg, the most common species found on wheat heads in 2008 were F. graminearum, F. avenaceum, and F. poae. An increase in the frequency of F. graminearum and a decrease in F. culmorum were observed [57]. Chandelier et al. [58] analyzed winter wheat samples from Belgium over the 2003-2009 period. They found that the main species were F. avenaceum and F. graminearum; however, their frequency varied depending on the year, ranging from 20% to 100%. The frequency of F. poae remained relatively constant over the years (about 70%). The overall incidence of F. culmorum decreased during the study, from 80% in 2003 to 10% in the final three years. In Germany in 2008, F. graminearum s.s. was the main species, followed by F. culmorum. Other species (F. poae, F. tricinctum, M. nivale, etc.) were found in small quantities [59]. In Hungary, in 2010, which was a very favorable year for FHB development, F. graminearum was primarily isolated from wheat grain [60]. Winter wheat grown in the Netherlands in 2009 was examined for the presence of Fusarium species and toxins [61]. In samples collected at harvest, the authors observed a dominance of F. graminearum. F. avenaceum and Microdochium nivale were also common. However, in the preharvest samples, only F. graminearum and M. nivale were found.
Fusarium poae was the most commonly detected species in grain. It appeared in 98% of samples, compared to 91% for F. graminearum. The amount of F. poae DNA was approximately three times lower than that of F. graminearum over a five-year period. However, during dry years like 2015, F. poae dominated, with its DNA levels being eight times higher than F. graminearum. In similarly dry conditions in 2019, the DNA amounts for both species were similar.
According to published studies, F. poae was frequently isolated from wheat spikes and kernels in Poland in 1993, as well as in 2006-2007 [62,63]. It is a weak pathogen of cereal spikes; however, it is widespread on wheat across Europe [7,56,64,65]. In 2001 and 2002, Xu et al. [64] discovered that F. poae was the most common species infecting grain at harvest in three studied countries (UK, Italy, Hungary). Only in cooler Ireland was F. poae less frequent. Audenaert et al. [66] observed that this species was dominant in Flanders in 2007, although it was isolated less frequently in 2008. The higher infection pressure in 2007 compared to 2008 was attributed to F. poae’s nature as a secondary pathogen. Additionally, the frequent occurrence of F. poae is connected to its sporulation strategy. This species produces large amounts of tiny microconidia in a dry, powdery form that can easily invade cereal heads. This process may be especially effective under dry conditions and wind dispersal, as Hörberg [67] found no difference between the dispersal patterns of F. poae microconidia and the much larger macroconidia of F. culmorum during splash dispersal.
Xu et al. [68] linked F. poae with relatively dry and warm conditions, while F. graminearum was associated with warm and humid environments. F. avenaceum and F. culmorum were both linked to cooler, wet, and humid environments. Parikka et al. [69], who predicted an increase in the importance of F. poae (along with F. langsethiae) under drier conditions in Scandinavia, also confirmed this.
The strong correlation among F. avenaceum, F. culmorum, and F. graminearum s.s. suggests they may share ecological niches or respond to similar environmental triggers. The PCA analysis supports these findings, indicating that these species frequently coexist, especially in samples from 2017 and 2016. However, the lack of correlation with F. langsethiae or F. poae suggests that these species may respond to different environmental conditions. Xu et al. [64] stated that when weather conditions are unfavorable (e.g., drought) for F. graminearum, it can be replaced by secondary FHB species, such as F. poae, which was the most common. The negative correlation between temperature during the stem elongation and milk-dough stages and Fusarium DNA content suggests that higher temperatures at these stages may not promote Fusarium infection, possibly due to faster plant growth or changes in plant susceptibility. Conversely, the positive correlation during booting and heading suggests that the temperature at this stage could lead to increased infection rates.
Overall, this study emphasizes the complex interactions between weather conditions and the presence of Fusarium species in winter wheat grain. Understanding these relationships is essential for developing effective management strategies to reduce the impact of Fusarium on wheat production. The composition of FHB-causing Fusarium species is key to understanding toxin profiles in wheat grain. Future research should focus on exploring how temperature and precipitation specifically influence Fusarium growth and identifying potential methods to lower Fusarium contamination in wheat.
Supplementary Materials
The following supporting information can be downloaded at: Preprints.org, Figure S1: Regional (provincial) averages of the total DNA concentration (pg/μg of wheat DNA) of five Fusarium species in winter wheat grain samples collected from 2014 to 2017 and 2019. Data are shown for specific years and the five-year average. For province names, refer to Figure 4; Figure S2: Regional (provincial) averages of the DNA concentration (pg/μg of wheat DNA) of five Fusarium species in the grain of winter wheat samples collected from 2014 to 2017 and 2019. For province names, refer to Figure 4; Figure S3: Biplot of the principal component analysis (PCA) of DNA concentration (pg/μg) for five Fusarium species in 111 winter wheat grain samples collected over five years (2014-2017, 2019). Factor loading values based on the correlations between Factors (F1 and F3, respectively) and F. avenaceum, F. culmorum, F. graminearum s.s., F. langsethiae, and F. poae are 0.794 and -0.249, 0.803 and -0.026, 0.610 and 0.225, 0.113 and 0.628, and 0.006 and 0.640, respectively. The size of the points reflects the sum of the squared cosines on Factors 1 and 3; Figure S4: Biplot of the principal component analysis (PCA) of DNA concentration (pg/μg) for five Fusarium species in 111 winter wheat grain samples collected over five years (2014-2017, 2019). The factor loading values based on correlations between Factors (F1 and F4, respectively) and F. avenaceum, F. culmorum, F. graminearum s.s., F. langsethiae, and F. poae are 0.794 and -0.228, 0.803 and -0.321, 0.610 and 0.759, 0.113 and -0.203, and 0.006 and -0.152, respectively. The size of the points reflects the sum of the squared cosines on Factors 1 and 4.
Author Contributions
Conceptualization, T.G.; methodology, T.G., P.O., and B.W.; validation, T.G.; formal analysis, T.G.; investigation, T.G., P.O., and B.W.; data curation, T.G.; writing—original draft preparation, T.G.; writing—review and editing, T.G., P.O., and B.W.; visualization, T.G.; project administration, T.G.; funding acquisition, T.G. All authors have read and agreed to the published version of the manuscript.
Funding
The study was supported by the National Program ‘Establishing the scientific foundations of biological progress and safeguarding plant genetic resources as sources of innovation and support for sustainable agriculture and national food security 2015–2020’ financed from the budget. Project ID: 104/2015.
Acknowledgments
The first author thanks Katarzyna Grelewska-Nowotko for her expert help with real-time PCR analysis and Katarzyna Marzec-Schmidt for assistance with statistical analysis.
Conflicts of Interest
The authors declare no conflicts of interest.
References
- Parry, D.W.; Jenkinson, P.; McLeod, L. Fusarium Ear Blight (Scab) in Small Grain Cereals—a Review. Plant Pathol 1995, 44, 207–238. [CrossRef]
- Bottalico, A. Fusarium Diseases of Cereals: Species Complex and Related Mycotoxin Profiles, in Europe. Journal of Plant Pathology 1998, 80, 85–103. [CrossRef]
- Bottalico, A.; Perrone, G. Toxigenic Fusarium Species and Mycotoxins Associated with Head Blight in Small-Grain Cereals in Europe. Eur J Plant Pathol 2002, 108, 611–624. [CrossRef]
- Jestoi, M.N.; Paavanen-Huhtala, S.; Parikka, P.; Yli-Mattila, T. In Vitro and in Vivo Mycotoxin Production of Fusarium Species Isolated from Finnish Grains. Archives Of Phytopathology And Plant Protection 2008, 41, 545–558. [CrossRef]
- Somma, S.; Alvarez, C.; Ricci, V.; Ferracane, L.; Ritieni, A.; Logrieco, A.; Moretti, A. Trichothecene and Beauvericin Mycotoxin Production and Genetic Variability in Fusarium Poae Isolated from Wheat Kernels from Northern Italy. Food Addit Contam Part A Chem Anal Control Expo Risk Assess 2010, 27, 729–737. [CrossRef]
- Vanheule, A.; De Boevre, M.; Moretti, A.; Scauflaire, J.; Munaut, F.; De Saeger, S.; Bekaert, B.; Haesaert, G.; Waalwijk, C.; Van Der Lee, T.; et al. Genetic Divergence and Chemotype Diversity in the Fusarium Head Blight Pathogen Fusarium Poae. Toxins (Basel) 2017, 9, 255. [CrossRef]
- Vogelgsang, S.; Sulyok, M.; Hecker, A.; Jenny, E.; Krska, R.; Schuhmacher, R.; Forrer, H.-R.R. Toxigenicity and Pathogenicity of Fusarium Poae and Fusarium Avenaceum on Wheat. Eur J Plant Pathol 2008, 122, 265–276. [CrossRef]
- Nielsen, L.K.; Jensen, J.D.; Nielsen, G.C.; Jensen, J.E.; Spliid, N.H.; Thomsen, I.K.; Justesen, A.F.; Collinge, D.B.; Jørgensen, L.N. Fusarium Head Blight of Cereals in Denmark: Species Complex and Related Mycotoxins. Phytopathology 2011, 101, 960–969. [CrossRef]
- Uhlig, S.; Jestoi, M.; Parikka, P. Fusarium Avenaceum – the North European Situation. Int J Food Microbiol 2007, 119, 17–24. [CrossRef]
- Yli-Mattila, T.; Paaavanen-Huhtala, P.; Parikka, P.; Hietaniemi, V.; Jestoi, M.; Rizzo, A. Real-Time PCR Detection and Quantification of Fusarium Poae as Compared to Mycotoxin Production in Grains in Finland. In the Proceedings of the 2nd International Symposium on Fusarium Head Blight; incorporating the 8th European Fusarium seminar; Canty, S.M., Boring, T., Wardwell, J., Ward, R.W., Eds.; Orlando, FL, USA. East Lansing, MI: Michigan State University., 2004; pp. 422–425.
- Yli-Mattila, T.; Paavanen-Huhtala, S.; Jestoi, M.; Parikka, P.; Hietaniemi, V.; Gagkaeva, T.; Sarlin, T.; Haikara, A.; Laaksonen, S.; Rizzo, A. Real-Time PCR Detection and Quantification of Fusarium Poae, F. Graminearum, F. Sporotrichioides and F. Langsethiae in Cereal Grains in Finland and Russia. Archives of Phytopathology and Plant Protection 2008, 41, 243–260. [CrossRef]
- O’Donnell, K.; Kistler, H.C.; Tacke, B.K.; Casper, H.H. Gene Genealogies Reveal Global Phylogeographic Structure and Reproductive Isolation among Lineages of Fusarium Graminearum, the Fungus Causing Wheat Scab. Proceedings of the National Academy of Sciences 2000, 97, 7905–7910. [CrossRef]
- O’Donnell, K.; Ward, T.J.; Geiser, D.M.; Kistler, H.C.; Aoki, T. Genealogical Concordance between the Mating Type Locus and Seven Other Nuclear Genes Supports Formal Recognition of Nine Phylogenetically Distinct Species within the Fusarium Graminearum Clade. Fungal Genetics and Biology 2004, 41, 600–623. [CrossRef]
- Starkey, D.E.; Ward, T.J.; Aoki, T.; Gale, L.R.; Kistler, H.C.; Geiser, D.M.; Suga, H.; Tóth, B.; Varga, J.; O’Donnell, K. Global Molecular Surveillance Reveals Novel Fusarium Head Blight Species and Trichothecene Toxin Diversity. Fungal Genet Biol 2007, 44, 1191–1204. [CrossRef]
- Amarasinghe, C.; Sharanowski, B.; Dilantha Fernando, W.G. Molecular Phylogenetic Relationships, Trichothecene Chemotype Diversity and Aggressiveness of Strains in a Global Collection of Fusarium Graminearum Species. Toxins (Basel) 2019, 11, 263. [CrossRef]
- Talas, F.; Parzies, H.K.; Miedaner, T. Diversity in Genetic Structure and Chemotype Composition of Fusarium Graminearum Sensu Stricto Populations Causing Wheat Head Blight in Individual Fields in Germany. Eur J Plant Pathol 2011, 131, 39–48. [CrossRef]
- van der Lee, T.; Zhang, H.; van Diepeningen, A.; Waalwijk, C. Biogeography of Fusarium Graminearum Species Complex and Chemotypes: A Review. Food Addit Contam Part A Chem Anal Control Expo Risk Assess 2015, 32, 453–460. [CrossRef]
- Backhouse, D. Global Distribution of Fusarium Graminearum, F. Asiaticum and F. Boothii from Wheat in Relation to Climate. Eur J Plant Pathol 2014, 139, 161–173. [CrossRef]
- Del Ponte, E.M.; Moreira, G.M.; Ward, T.J.; O’Donnell, K.; Nicolli, C.P.; Machado, F.J.; Duffeck, M.R.; Alves, K.S.; Tessmann, D.J.; Waalwijk, C.; et al. Fusarium Graminearum Species Complex: A Bibliographic Analysis and Web-Accessible Database for Global Mapping of Species and Trichothecene Toxin Chemotypes. Phytopathology 2022. [CrossRef]
- Bottalico, A. Fusarium Diseases of Cereals: Species Complex and Related Mycotoxin Profiles, in Europe. Journal of Plant Pathology 1998, 80, 85–103. [CrossRef]
- Bottalico, A.; Perrone, G. Toxigenic Fusarium Species and Mycotoxins Associated with Head Blight in Small-Grain Cereals in Europe. Eur J Plant Pathol 2002, 108, 611–624. [CrossRef]
- Sundheim, L.; Brodal, G.; Hofgaard, I.S.; Rafoss, T. Temporal Variation of Mycotoxin Producing Fungi in Norwegian Cereals. Microorganisms 2013, 1, 188–198. [CrossRef]
- Hofgaard, I.S.; Aamot, H.U.; Torp, T.; Jestoi, M.; Lattanzio, V.M.T.; Klemsdal, S.S.; Waalwijk, C.; Van Der Lee, T.; Brodal, G. Associations between Fusarium Species and Mycotoxins in Oats and Spring Wheat from Farmers Fields in Norway over a Six-Year Period. World Mycotoxin J 2016, 9, 365–378. [CrossRef]
- Maiorano, A.; Blandino, M.; Reyneri, A.; Vanara, F. Effects of Maize Residues on the Fusarium Spp. Infection and Deoxynivalenol (DON) Contamination of Wheat Grain. Crop Protection 2008, 27, 182–188. [CrossRef]
- Obst, A.; Lepschy-von Gleissenthall, J.; Beck, R. On the Etiology of Fusarium Head Blight of Wheat in South Germany – Preceding Crops, Weather Conditions for Inoculum Production and Head Infection, Proneness of the Crop to Infection and Mycotoxin Production. Cereal Res Commun 1997, 25, 699–703. [CrossRef]
- Parikka, P.; Hakala, K.; Tiilikkala, K. Expected Shifts in Fusarium Species’ Composition on Cereal Grain in Northern Europe Due to Climatic Change. Food Addit Contam Part A Chem Anal Control Expo Risk Assess 2012, 29, 1543–1555. [CrossRef]
- Miller, J.D. Mycotoxins in Small Grains and Maize: Old Problems, New Challenges. Food Addit Contam Part A Chem Anal Control Expo Risk Assess 2008, 25, 219–230. [CrossRef]
- Scherm, B.; Balmas, V.; Spanu, F.; Pani, G.; Delogu, G.; Pasquali, M.; Migheli, Q. Fusarium Culmorum: Causal Agent of Foot and Root Rot and Head Blight on Wheat. Mol Plant Pathol 2013, 14, 323–341. [CrossRef]
- Xu, X.; Nicholson, P. Community Ecology of Fungal Pathogens Causing Wheat Head Blight. Annu Rev Phytopathol 2009, 47, 83–103. [CrossRef]
- Stępień, Ł.; Chełkowski, J. Fusarium Head Blight of Wheat: Pathogenic Species and Their Mycotoxins. World Mycotoxin J 2010, 3, 107–119. [CrossRef]
- Bilska, K.; Jurczak, S.; Kulik, T.; Ropelewska, E.; Olszewski, J.; Żelechowski, M.; Zapotoczny, P. Species Composition and Trichothecene Genotype Profiling of Fusarium Field Isolates Recovered from Wheat in Poland. Toxins (Basel) 2018, 10, 325. [CrossRef]
- Kuzdraliński, A.; Nowak, M.; Szczerba, H.; Dudziak, K.; Muszyńska, M.; Leśniowska-Nowak, J. The Composition of Fusarium Species in Wheat Husks and Grains in South-Eastern Poland. J Integr Agric 2017, 16, 1530–1536. [CrossRef]
- Okorski, A.; Milewska, A.; Pszczółkowska, A.; Karpiesiuk, K.; Kozera, W.; Agnieszka, J.; Abrowska, D.˛; Radwí Nska, J. Prevalence of Fusarium Fungi and Deoxynivalenol Levels in Winter Wheat Grain in Different Climatic Regions of Poland. Toxins 2022, 14, 102. [CrossRef]
- Iwaniuk, P.; Konecki, R.; Snarska, K.; Łozowicka, B. Quantitative Evaluation of Fusarium Species and Crop Quality Traits in Wheat Varieties of Northeastern Poland. J Plant Prot Res 2018, 58, 413–419. [CrossRef]
- Wiśniewska, H.; Stępień, Ł.; Waśkiewicz, A.; Beszterda, M.; Góral, T.; Belter, J. Toxigenic Fusarium Species Infecting Wheat Heads in Poland. Cent Eur J Biol 2014, 9, 163–172. [CrossRef]
- Góral, T.; Ochodzki, P.; Nielsen, L.K.; Walentyn-Góral, D. Species of the Genus Fusarium and Fusarium Toxins in the Grain of Winter and Spring Wheat in Poland. Biuletyn Instytutu Hodowli i Aklimatyzacji Roślin 2021, 296, 25–42. [CrossRef]
- Postupolski, J.; Starski, A.; Ledzion, E.; Kurpińska-Jaworska, J.; Szczęsna, M. Assessment of Changes in the Occurrence of Fusarium Toxin and Ochratoxin A in Poland Related to Extreme Weather Phenomena. Rocz Panstw Zakl Hig 2019, 70, 127–135. [CrossRef]
- Bryla, M.; Ksieniewicz-Wozniak, E.; Yoshinari, T.; Waskiewicz, A.; Szymczyk, K. Contamination of Wheat Cultivated in Various Regions of Poland during 2017 and 2018 Agricultural Seasons with Selected Trichothecenes and Their Modified Forms. Toxins (Basel) 2019, 11, 88. [CrossRef]
- Kowalska, G.; Kowalski, R. Occurrence of Mycotoxins in Selected Agricultural and Commercial Products Available in Eastern Poland. Open Chem 2021, 19, 653–664. [CrossRef]
- Marzec-Schmidt, K.; Börjesson, T.; Suproniene, S.; Jędryczka, M.; Janavičienė, S.; Góral, T.; Karlsson, I.; Kochiieru, Y.; Ochodzki, P.; Mankevičienė, A.; et al. Modelling the Effects of Weather Conditions on Cereal Grain Contamination with Deoxynivalenol in the Baltic Sea Region. Toxins (Basel) 2021, 13, 737. [CrossRef]
- Gourdain, E.; Piraux, F.; Barrier-Guillot, B. A Model Combining Agronomic and Weather Factors to Predict Occurrence of Deoxynivalenol in Durum Wheat Kernels. World Mycotoxin J 2011, 4, 129–139. [CrossRef]
- Aleksandrowicz, E. Factors Influencing the Occurrence of Fusarium Mycotoxins in the Grain of Winter Wheat. Polish Journal of Agronomy 2020, 103–112. [CrossRef]
- Mielniczuk, E.; Skwaryło-Bednarz, B. Fusarium Head Blight, Mycotoxins and Strategies for Their Reduction. Agronomy 2020, 10. [CrossRef]
- Góral, T. Nowe Dopuszczalne Limity Zawartości Toksyn Fuzaryjnych (Deoksyniwalenol, Toksyny T-2/HT-2) w Ziarnie Zbóż i Produktach Zbożowych. Biuletyn Instytutu Hodowli i Aklimatyzacji Roślin 2024, 45–47. [CrossRef]
- Góral, T.; Walentyn-Góral, D. Zróżnicowanie Podatności Odmian Pszenicy Ozimej i Jarej Na Fuzariozę Kłosów Badanych w Latach 2009–2016. Biuletyn Instytutu Hodowli i Aklimatyzacji Roślin 2018, 284, 3–11. [CrossRef]
- Nicolaisen, M.; Suproniene, S.; Nielsen, L.K.; Lazzaro, I.; Spliid, N.H.; Justesen, A.F. Real-Time PCR for Quantification of Eleven Individual Fusarium Species in Cereals. J Microbiol Methods 2009, 76, 234–240. [CrossRef]
- Skelsey, P.; Newton, A.C. Future Environmental and Geographic Risks of Fusarium Head Blight of Wheat in Scotland. Eur J Plant Pathol 2015, 142, 133–147. [CrossRef]
- Zhang, X.; Halder, J.; White, R.P.; Hughes, D.J.; Ye, Z.; Wang, C.; Xu, R.; Gan, B.; Fitt, B.D.L. Climate Change Increases Risk of Fusarium Ear Blight on Wheat in Central China. Annals of Applied Biology 2014, 164, 384–395. [CrossRef]
- Madgwick, J.W.; West, J.S.; White, R.P.; Semenov, M.A.; Townsend, J.A.; Turner, J.A.; Fitt, B.D.L. Impacts of Climate Change on Wheat Anthesis and Fusarium Ear Blight in the UK. Eur J Plant Pathol 2011, 130, 117–131. [CrossRef]
- Matengu, T.T.; Bullock, P.R.; Mkhabela, M.S.; Zvomuya, F.; Henriquez, M.A.; Ojo, E.R.T.; Fernando, W.G.D. Weather-Based Models for Forecasting Fusarium Head Blight Risks in Wheat and Barley: A Review. Plant Pathol 2024, 73, 492–505. [CrossRef]
- Kharbikar, L.L.; Dickin, E.T.; Edwards, S.G. Impact of Post-Anthesis Rainfall, Fungicide and Harvesting Time on the Concentration of Deoxynivalenol and Zearalenone in Wheat. Food Addit Contam Part A Chem Anal Control Expo Risk Assess 2015, 32, 2075–2085. [CrossRef]
- Cowger, C.; Patton-Ozkurt, J.; Brown-Guedira, G.; Perugini, L. Post-Anthesis Moisture Increased Fusarium Head Blight and Deoxynivalenol Levels in North Carolina Winter Wheat. Phytopathology 2009, 99, 320–327. [CrossRef]
- Duba, A.; Goriewa-Duba, K.; Wachowska, U. Trichothecene Genotypes Analysis of Fusarium Isolates from Di-, Tetra- And Hexaploid Wheat. Agronomy 2019, 9, 698. [CrossRef]
- Birzele, B.; Meier, A.; Hindorf, H.; Krämer, J.; Dehne, H.W. Epidemiology of Fusarium Infection and Deoxynivalenol Content in Winter Wheat in the Rhineland, Germany. Eur J Plant Pathol 2002, 108, 667–673. [CrossRef]
- Waalwijk, C.; Van Der Heide, R.; De Vries, I.; Van Der Lee, T.; Schoen, C.; Costrel-de Corainville, G.; Häuser-Hahn, I.; Kastelein, P.; Köhl, J.; Lonnet, P.; et al. Quantitative Detection of Fusarium Species in Wheat Using TaqMan. Eur J Plant Pathol 2004, 110, 481–494. [CrossRef]
- Isebaert, S.; De Saeger, S.; Devreese, R.; Verhoeven, R.; Maene, P.; Heremans, B.; Haesaert, G. Mycotoxin-Producing Fusarium Species Occurring in Winter Wheat in Belgium (Flanders) during 2002-2005. Journal of Phytopathology 2009, 157, 108–116. [CrossRef]
- Giraud, F.; Pasquali, M.; El Jarroudi, M.; Vrancken, C.; Brochot, C.; Cocco, E.; Hoffmann, L.; Delfosse, P.; Bohn, T. Fusarium Head Blight and Associated Mycotoxin Occurrence on Winter Wheat in Luxembourg in 2007/2008. Food Addit Contam Part A Chem Anal Control Expo Risk Assess 2010, 27, 825–835. [CrossRef]
- Chandelier, A.; Nimal, C.; André, F.; Planchon, V.; Oger, R. Fusarium Species and DON Contamination Associated with Head Blight in Winter Wheat over a 7-Year Period (2003–2009) in Belgium. Eur J Plant Pathol 2011, 130, 403–414. [CrossRef]
- Talas, F.; Parzies, H.K.; Miedaner, T. Diversity in Genetic Structure and Chemotype Composition of Fusarium Graminearum Sensu Stricto Populations Causing Wheat Head Blight in Individual Fields in Germany. Eur J Plant Pathol 2011, 131, 39–48. [CrossRef]
- Laszlo, E.; Varga, B.; Veisz, O. Composition of Fusarium Species Causing Natural Spike Infection in Wheat. Acta Agronomica Hungarica 2011, 59, 255–260. [CrossRef]
- van der Fels-Klerx, H.J.; de Rijk, T.C.; Booij, C.J.H.; Goedhart, P.W.; Boers, E.A.M.; Zhao, C.; Waalwijk, C.; Mol, H.G.J.; van der Lee, T.A.J. Occurrence of Fusarium Head Blight Species and Fusarium Mycotoxins in Winter Wheat in the Netherlands in 2009. Food Addit Contam Part A Chem Anal Control Expo Risk Assess 2012, 29, 1716–1726. [CrossRef]
- Goliński, P.; Perkowski, J.; Kostecki, M.; Grabarkiewicz-Szczȩsna, J.; Chełkowski, J. Fusarium Species and Fusarium Toxins in Wheat in Poland - a Comparison with Neighbour Countries. Sydowia 1996, 48, 12–22.
- Kulik, T.; Jestoi, M. Quantification of Fusarium Poae DNA and Associated Mycotoxins in Asymptomatically Contaminated Wheat. Int J Food Microbiol 2009, 130, 233–237. [CrossRef]
- Xu, X.M.; Parry, D.W.; Nicholson, P.; Thomsett, M. A.; Simpson, D.; Edwards, S.G.; Cooke, B.M.; Doohan, F.M.; Brennan, J.M.; Moretti, A.; et al. Predominance and Association of Pathogenic Fungi Causing Fusarium Ear Blight in Wheat in Four European Countries. Eur J Plant Pathol 2005, 112, 143–154. [CrossRef]
- Sakalauskas, S.; Stumbriene, K.; Suproniene, S.; Svegzda, P. Changes in Fusarium Link Species Composition From Lithuanian Wheat Grain in Years 2005-2007 to 2011-2013. Proceedings of the Latvia University of Agriculture 2014, 32, 45–50. [CrossRef]
- Audenaert, K.; van Broeck, R.; van Bekaert, B.; de Witte, F.; Heremans, B.; Messens, K.; Höfte, M.; Haesaert, G.; Broeck, R.; Bekaert, B.; et al. Fusarium Head Blight (FHB) in Flanders: Population Diversity, Inter-Species Associations and DON Contamination in Commercial Winter Wheat Varieties. Eur J Plant Pathol 2009, 125, 445–458. [CrossRef]
- Hörberg, H.M. Patterns of Splash Dispersed Conidia of Fusarium Poae and Fusarium Culmorum. Eur J Plant Pathol 2002, 108, 73–80. [CrossRef]
- Xu, X.-M.; Nicholson, P.; Thomsett, M.A.; Simpson, D.; Cooke, B.M.; Doohan, F.M.; Brennan, J.; Monaghan, S.; Moretti, A.; Mule, G.; et al. Relationship Between the Fungal Complex Causing Fusarium Head Blight of Wheat and Environmental Conditions. Phytopathology 2008, 98, 69–78. [CrossRef]
- Parikka, P.; Hakala, K.; Tiilikkala, K. Expected Shifts in Fusarium Species’ Composition on Cereal Grain in Northern Europe Due to Climatic Change. Food Addit Contam Part A Chem Anal Control Expo Risk Assess 2012, 29, 1543–1555. [CrossRef]
Figure 1.
Map of Poland indicating the locations of winter wheat plots where grain samples were collected from 2014 to 2017 and in 2019.
Figure 1.
Map of Poland indicating the locations of winter wheat plots where grain samples were collected from 2014 to 2017 and in 2019.
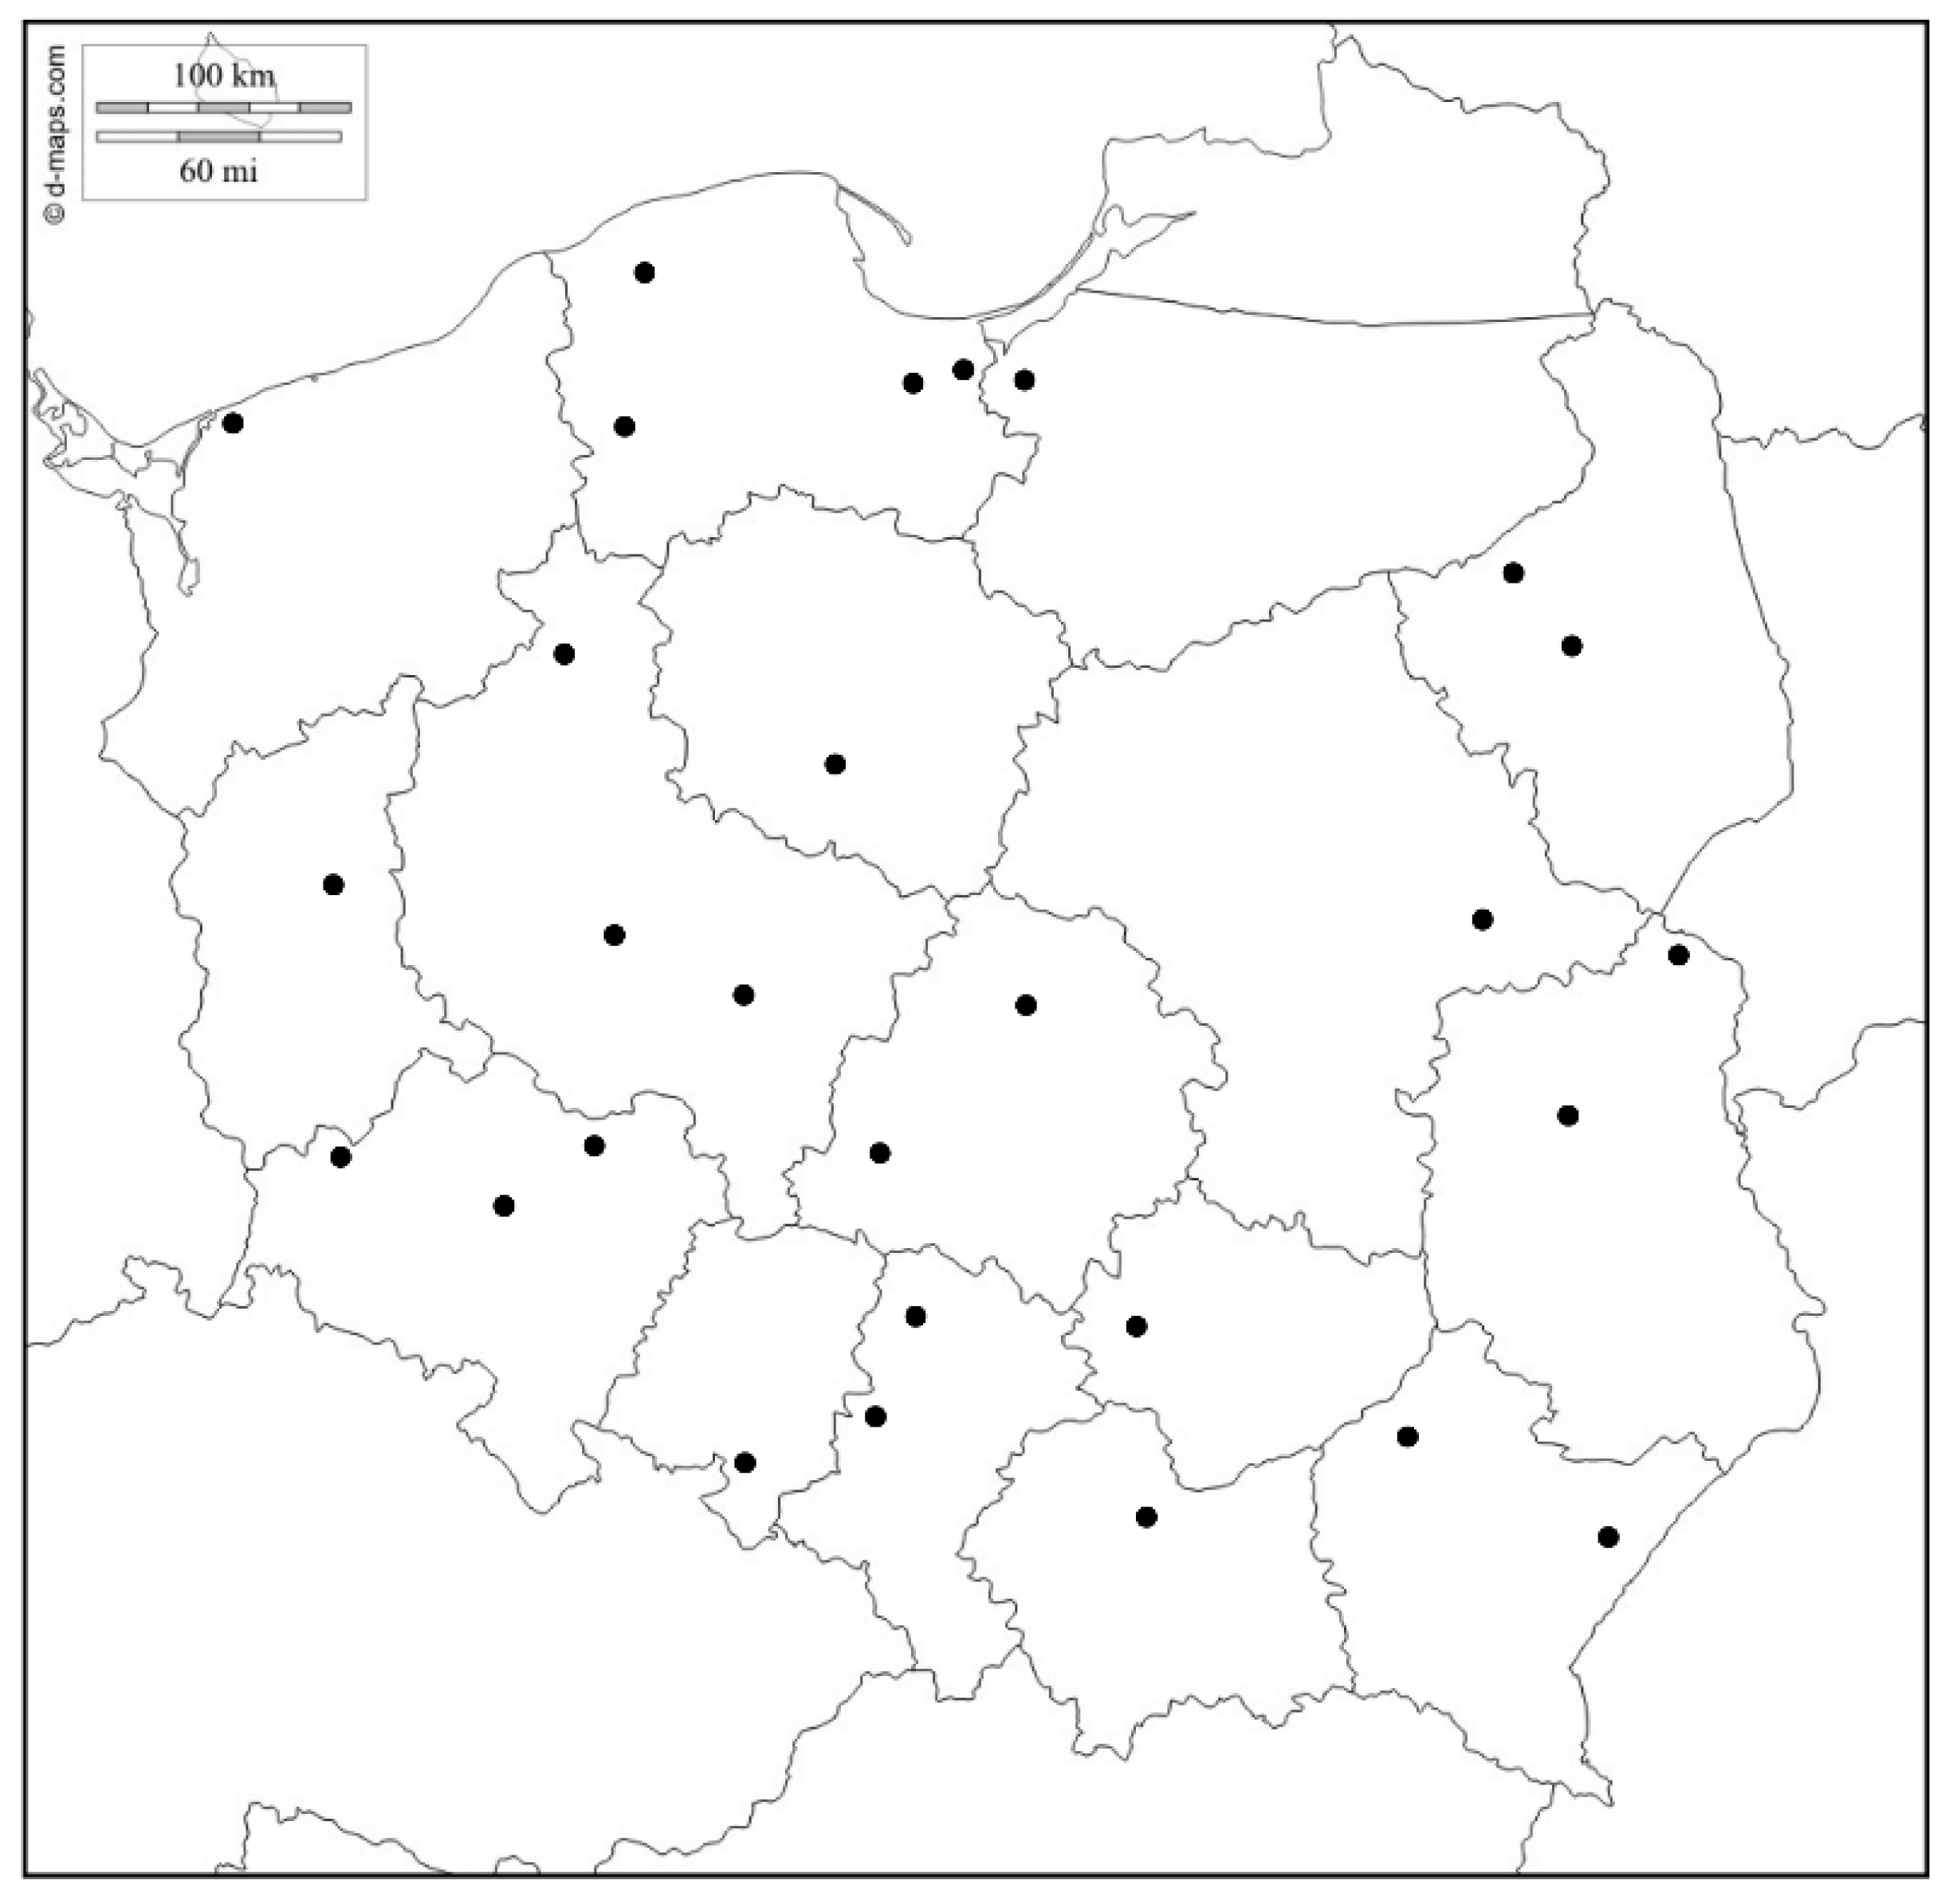
Figure 2.
Weather conditions (average monthly temperature and total monthly precipitation) for May, June, and July from 2014 to 2017 and in 2019. Data are averaged from 26 wheat grain sampling locations. * The highest total precipitation in July of 2016 was 408 mm.
Figure 2.
Weather conditions (average monthly temperature and total monthly precipitation) for May, June, and July from 2014 to 2017 and in 2019. Data are averaged from 26 wheat grain sampling locations. * The highest total precipitation in July of 2016 was 408 mm.
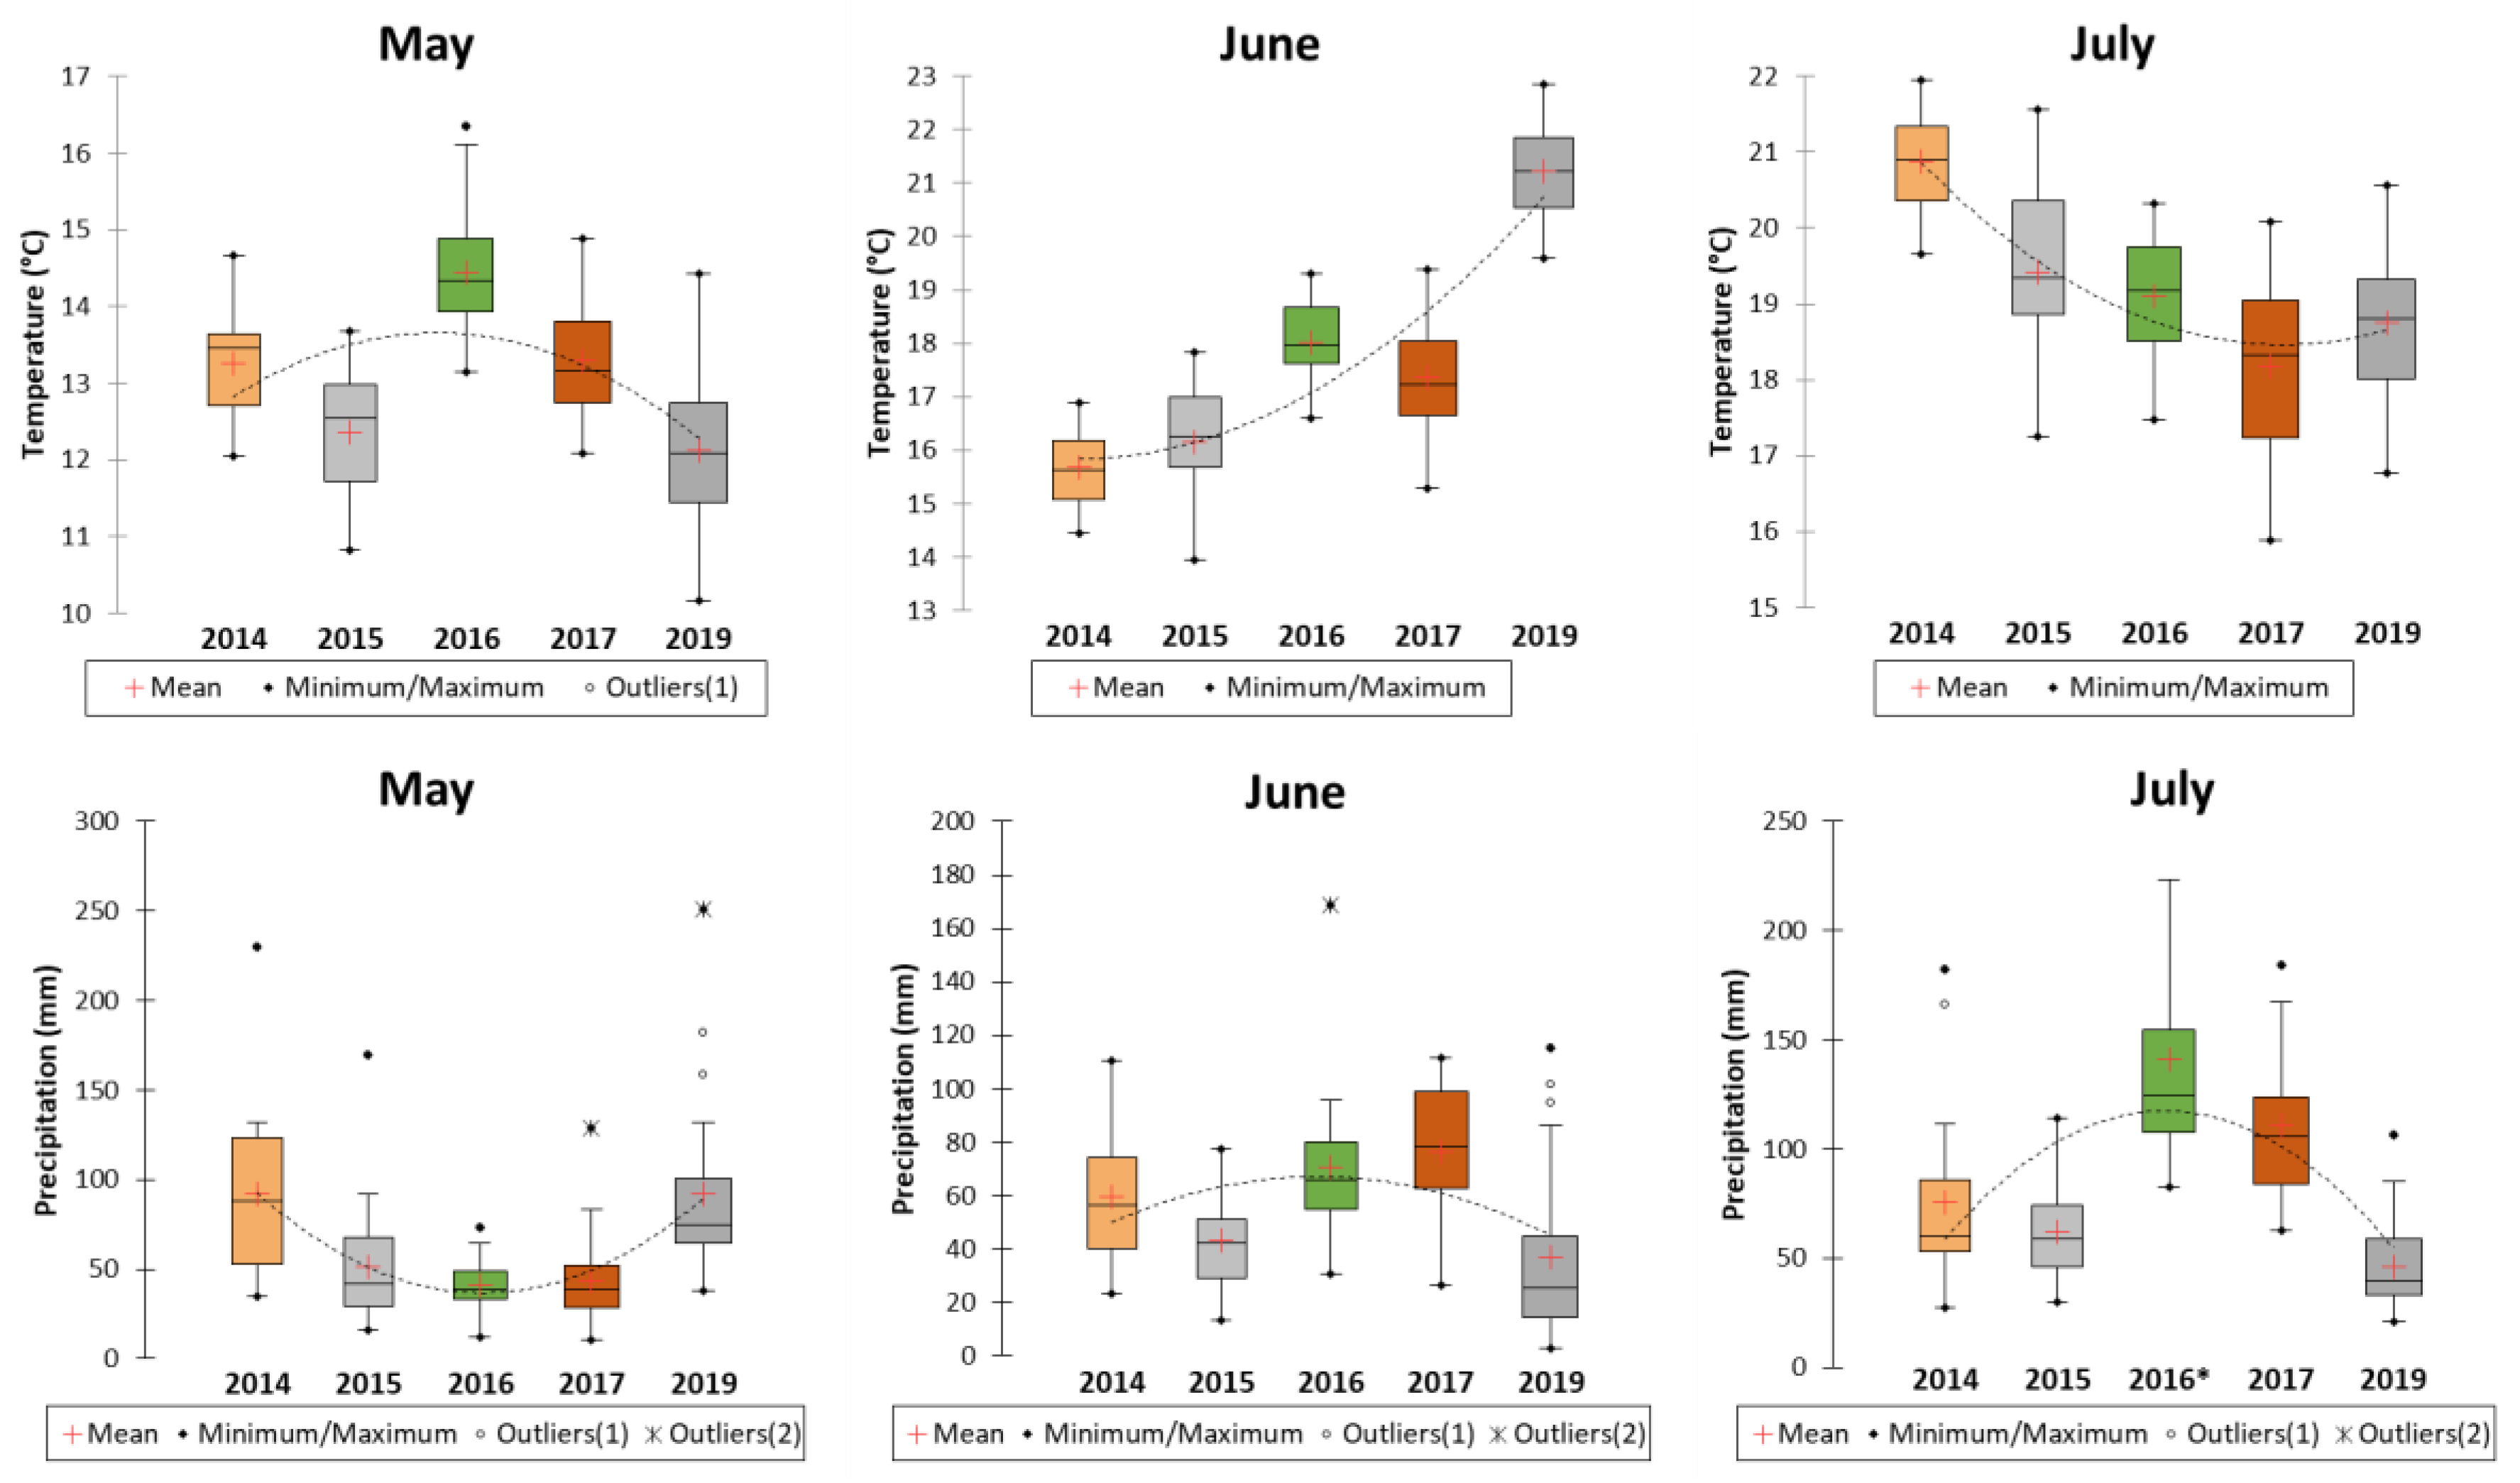
Figure 3.
Average DNA concentration (pg/μg of wheat DNA) for five Fusarium species in winter wheat grain samples from 2014 to 2017 and 2019. 2014-2017, 2019—total DNA concentration of the five species each year. F.av. – F. avenaceum; F.culm. – F. culmorum; F.gramin. – F. graminearum s.s.; F.lang – F. langsethiae.
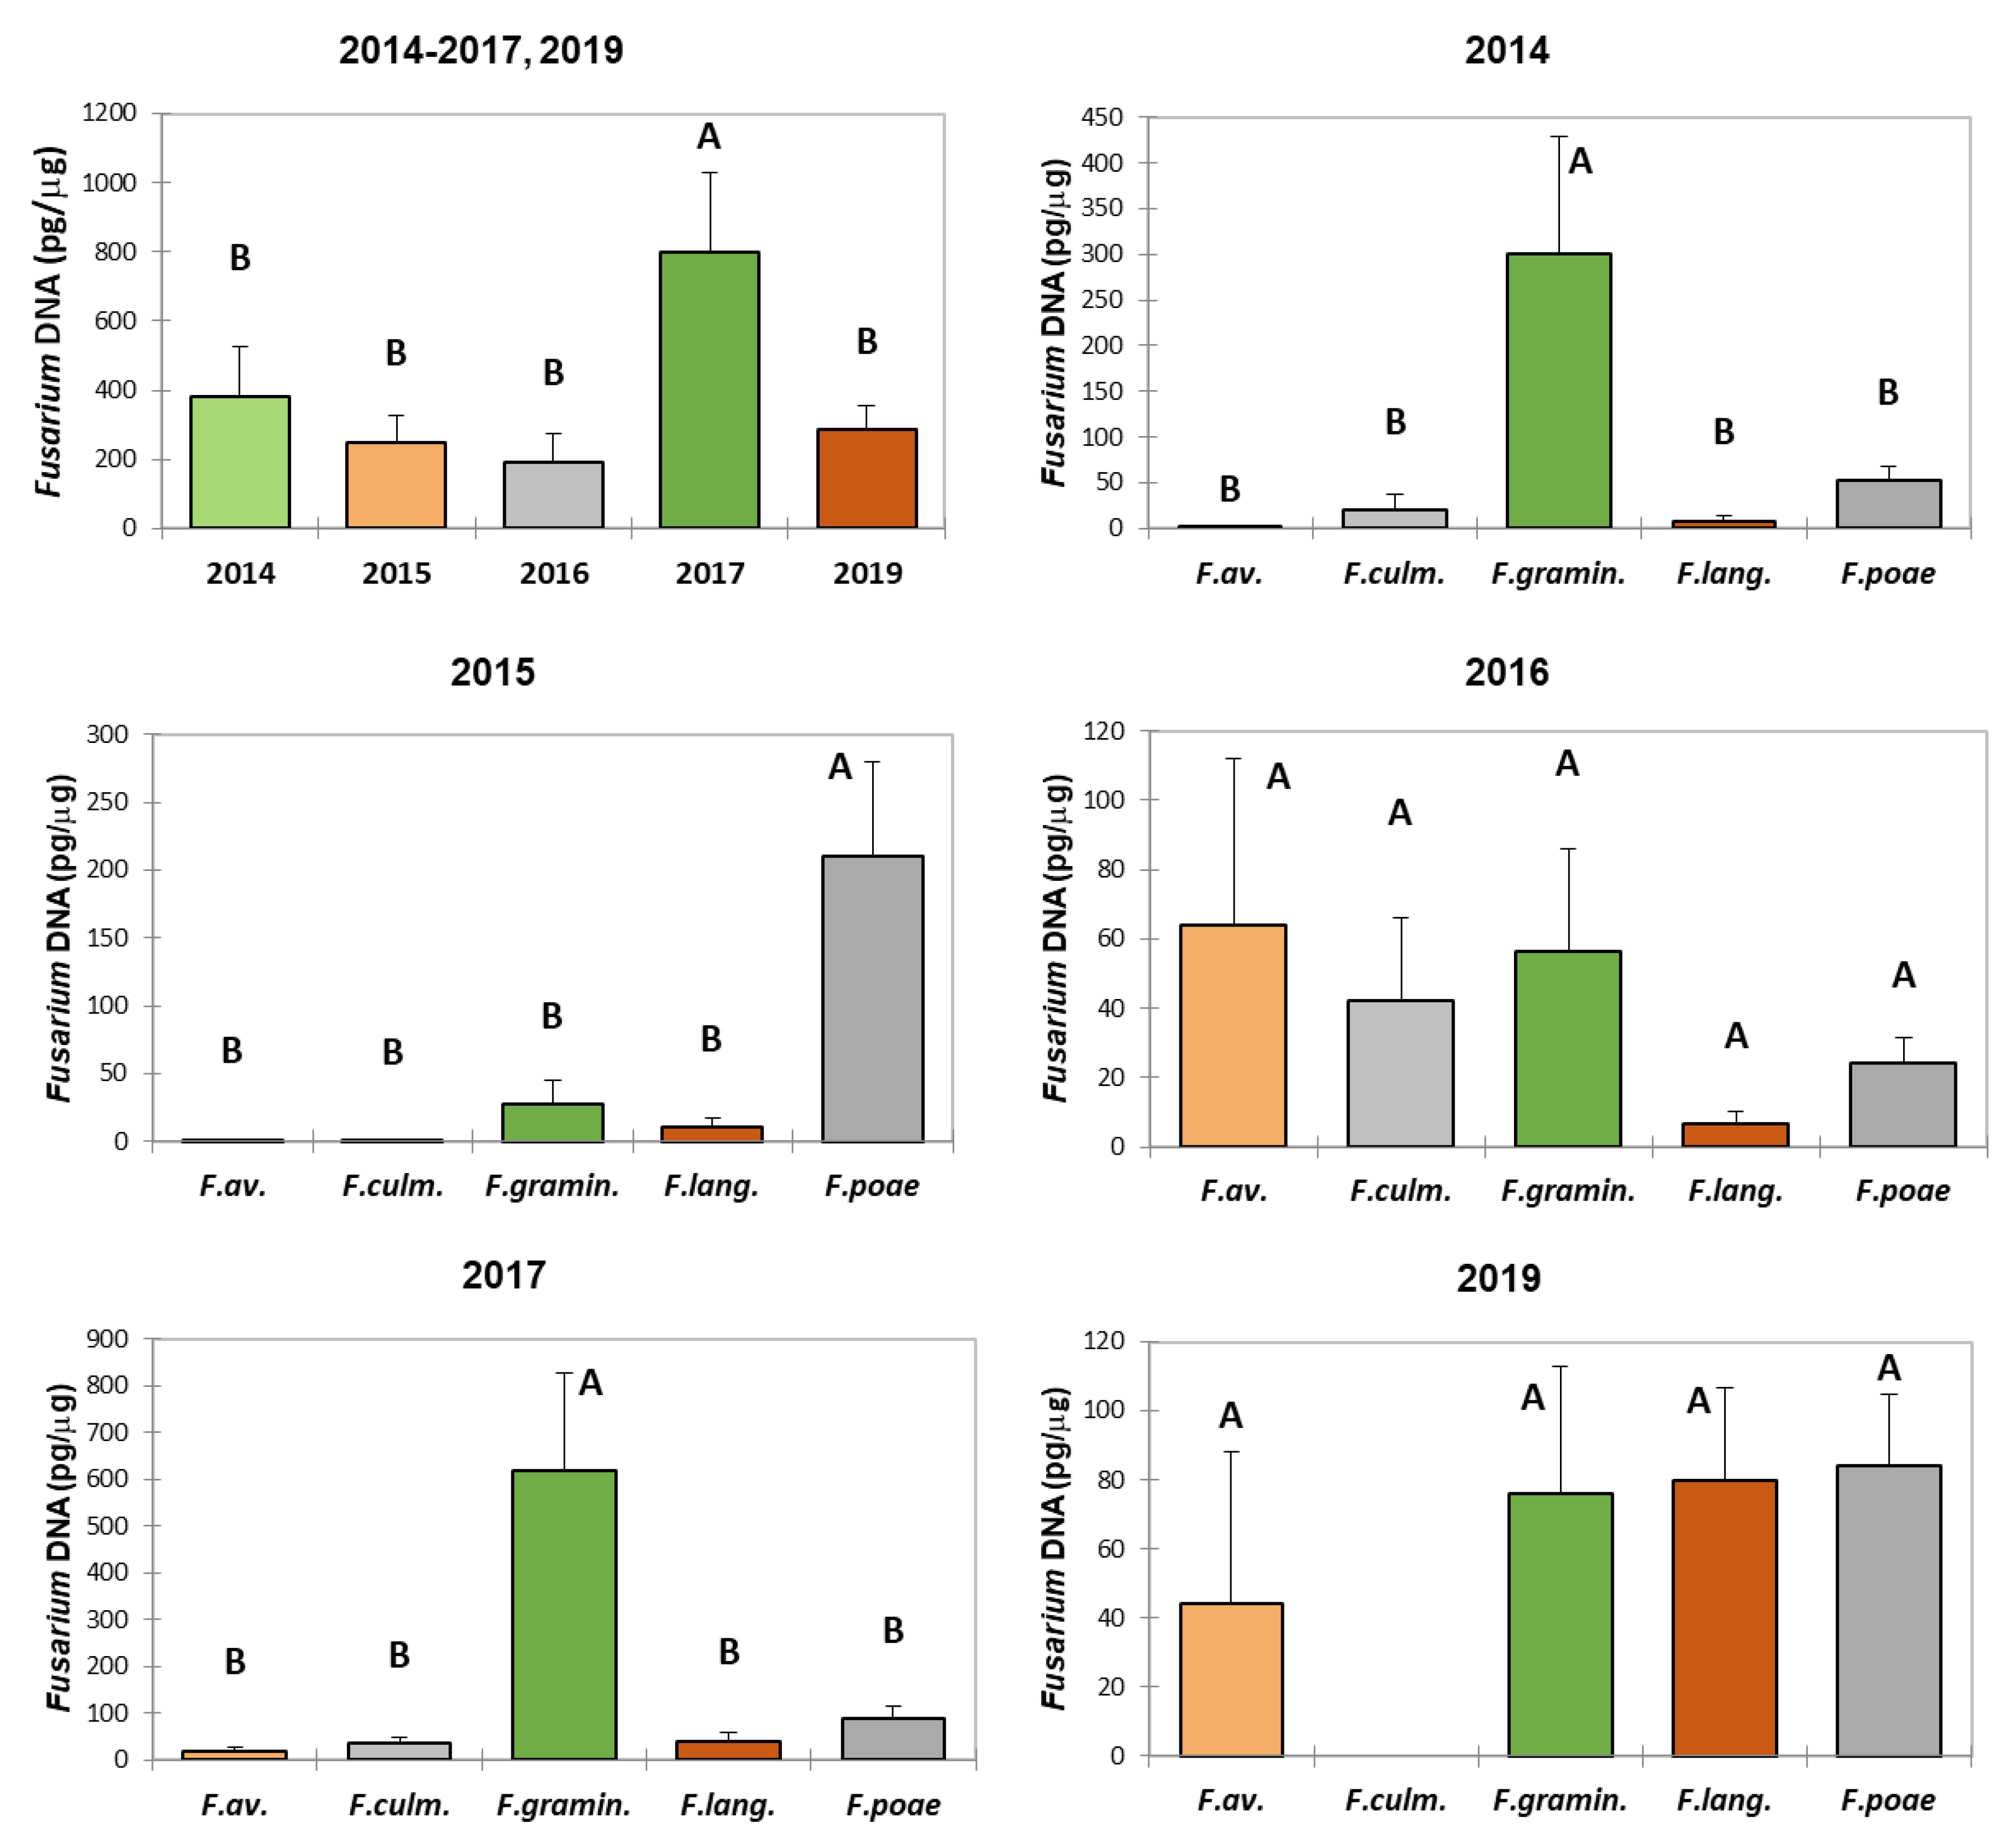
Figure 4.
Regional (provincial) averages of total DNA concentration (pg/μg of wheat DNA) for five Fusarium species in winter wheat grain samples collected from 2014 to 2017 and in 2019. Woj. – province.
Figure 4.
Regional (provincial) averages of total DNA concentration (pg/μg of wheat DNA) for five Fusarium species in winter wheat grain samples collected from 2014 to 2017 and in 2019. Woj. – province.
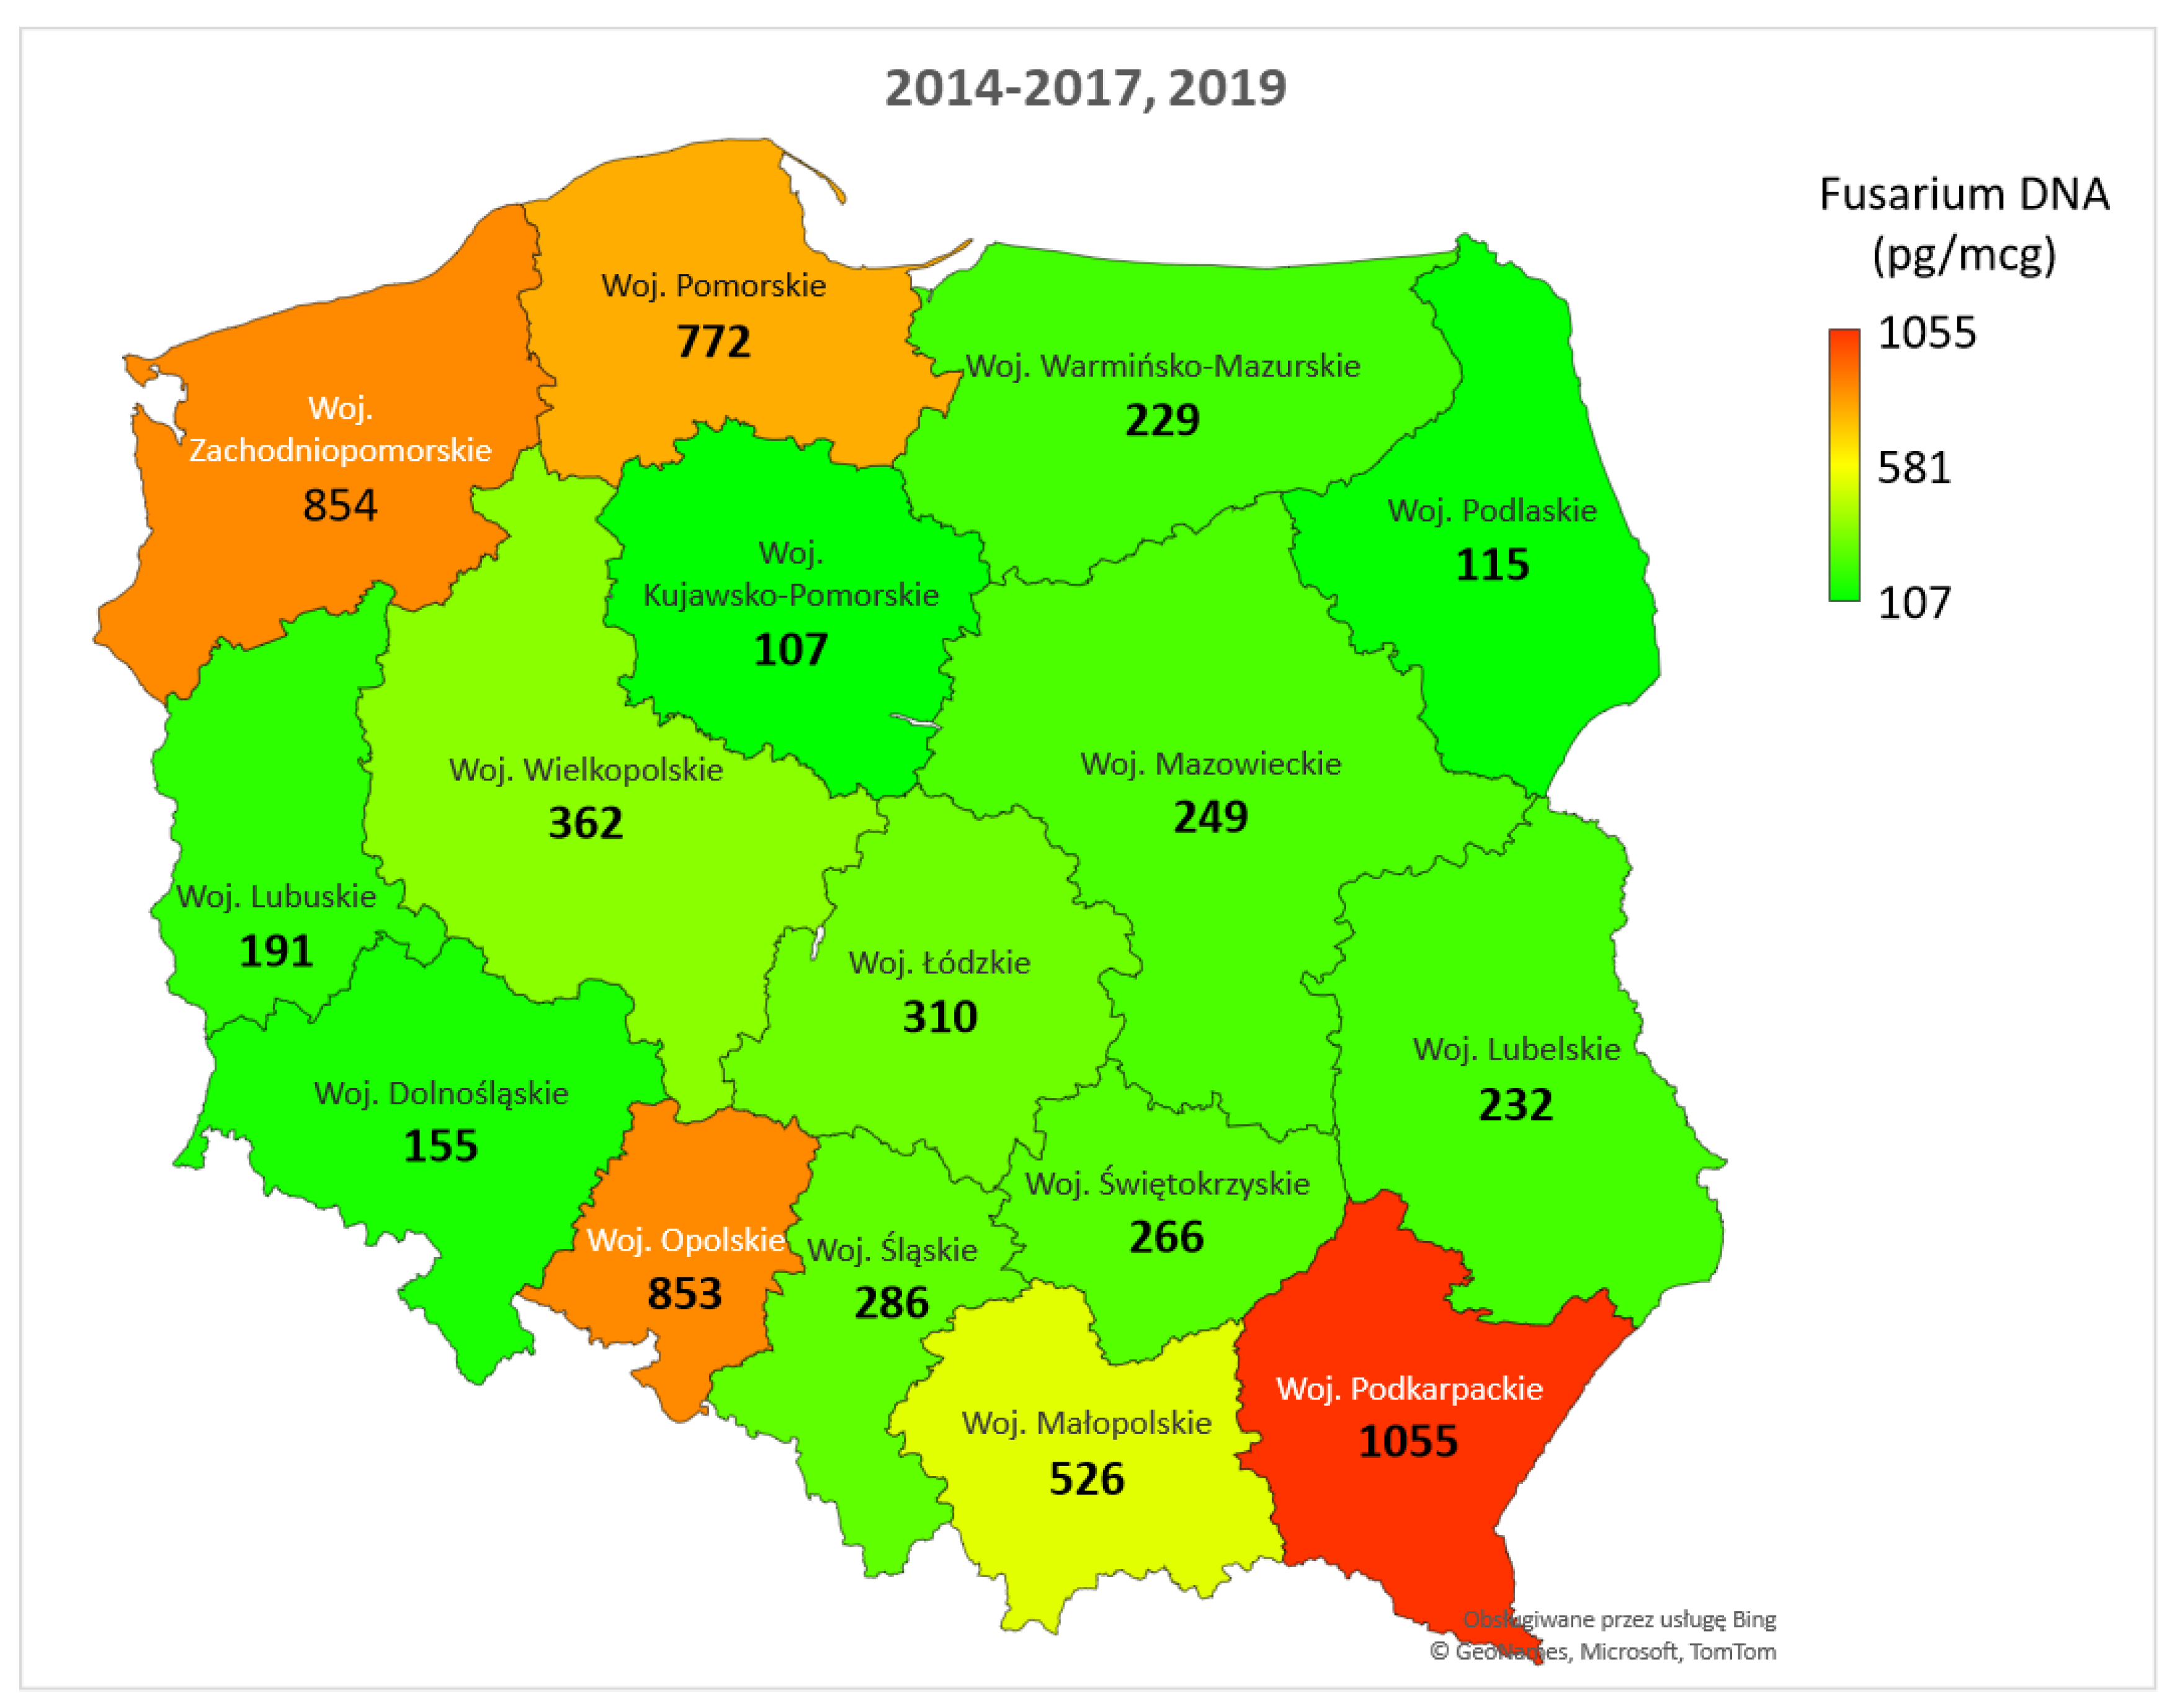
Figure 5.
Biplot of the principal component analysis (PCA) of the DNA concentration (pg/μg) of five Fusarium species in 111 samples of winter wheat grain collected over five years (2014-2017, 2019). The factor loading values based on the correlations between the factors (F1 and F2, respectively) and F. avenaceum, F. culmorum, F. graminearum s.s., F. langsethiae, and F. poae are equal: 0.794 and 0.027, 0.803 and 0.064, 0.610 and 0.001, 0.113 and -0.688, and 0.006 and 0.764, respectively. The size of the points shows the sum of squared cosines on the first two factors.
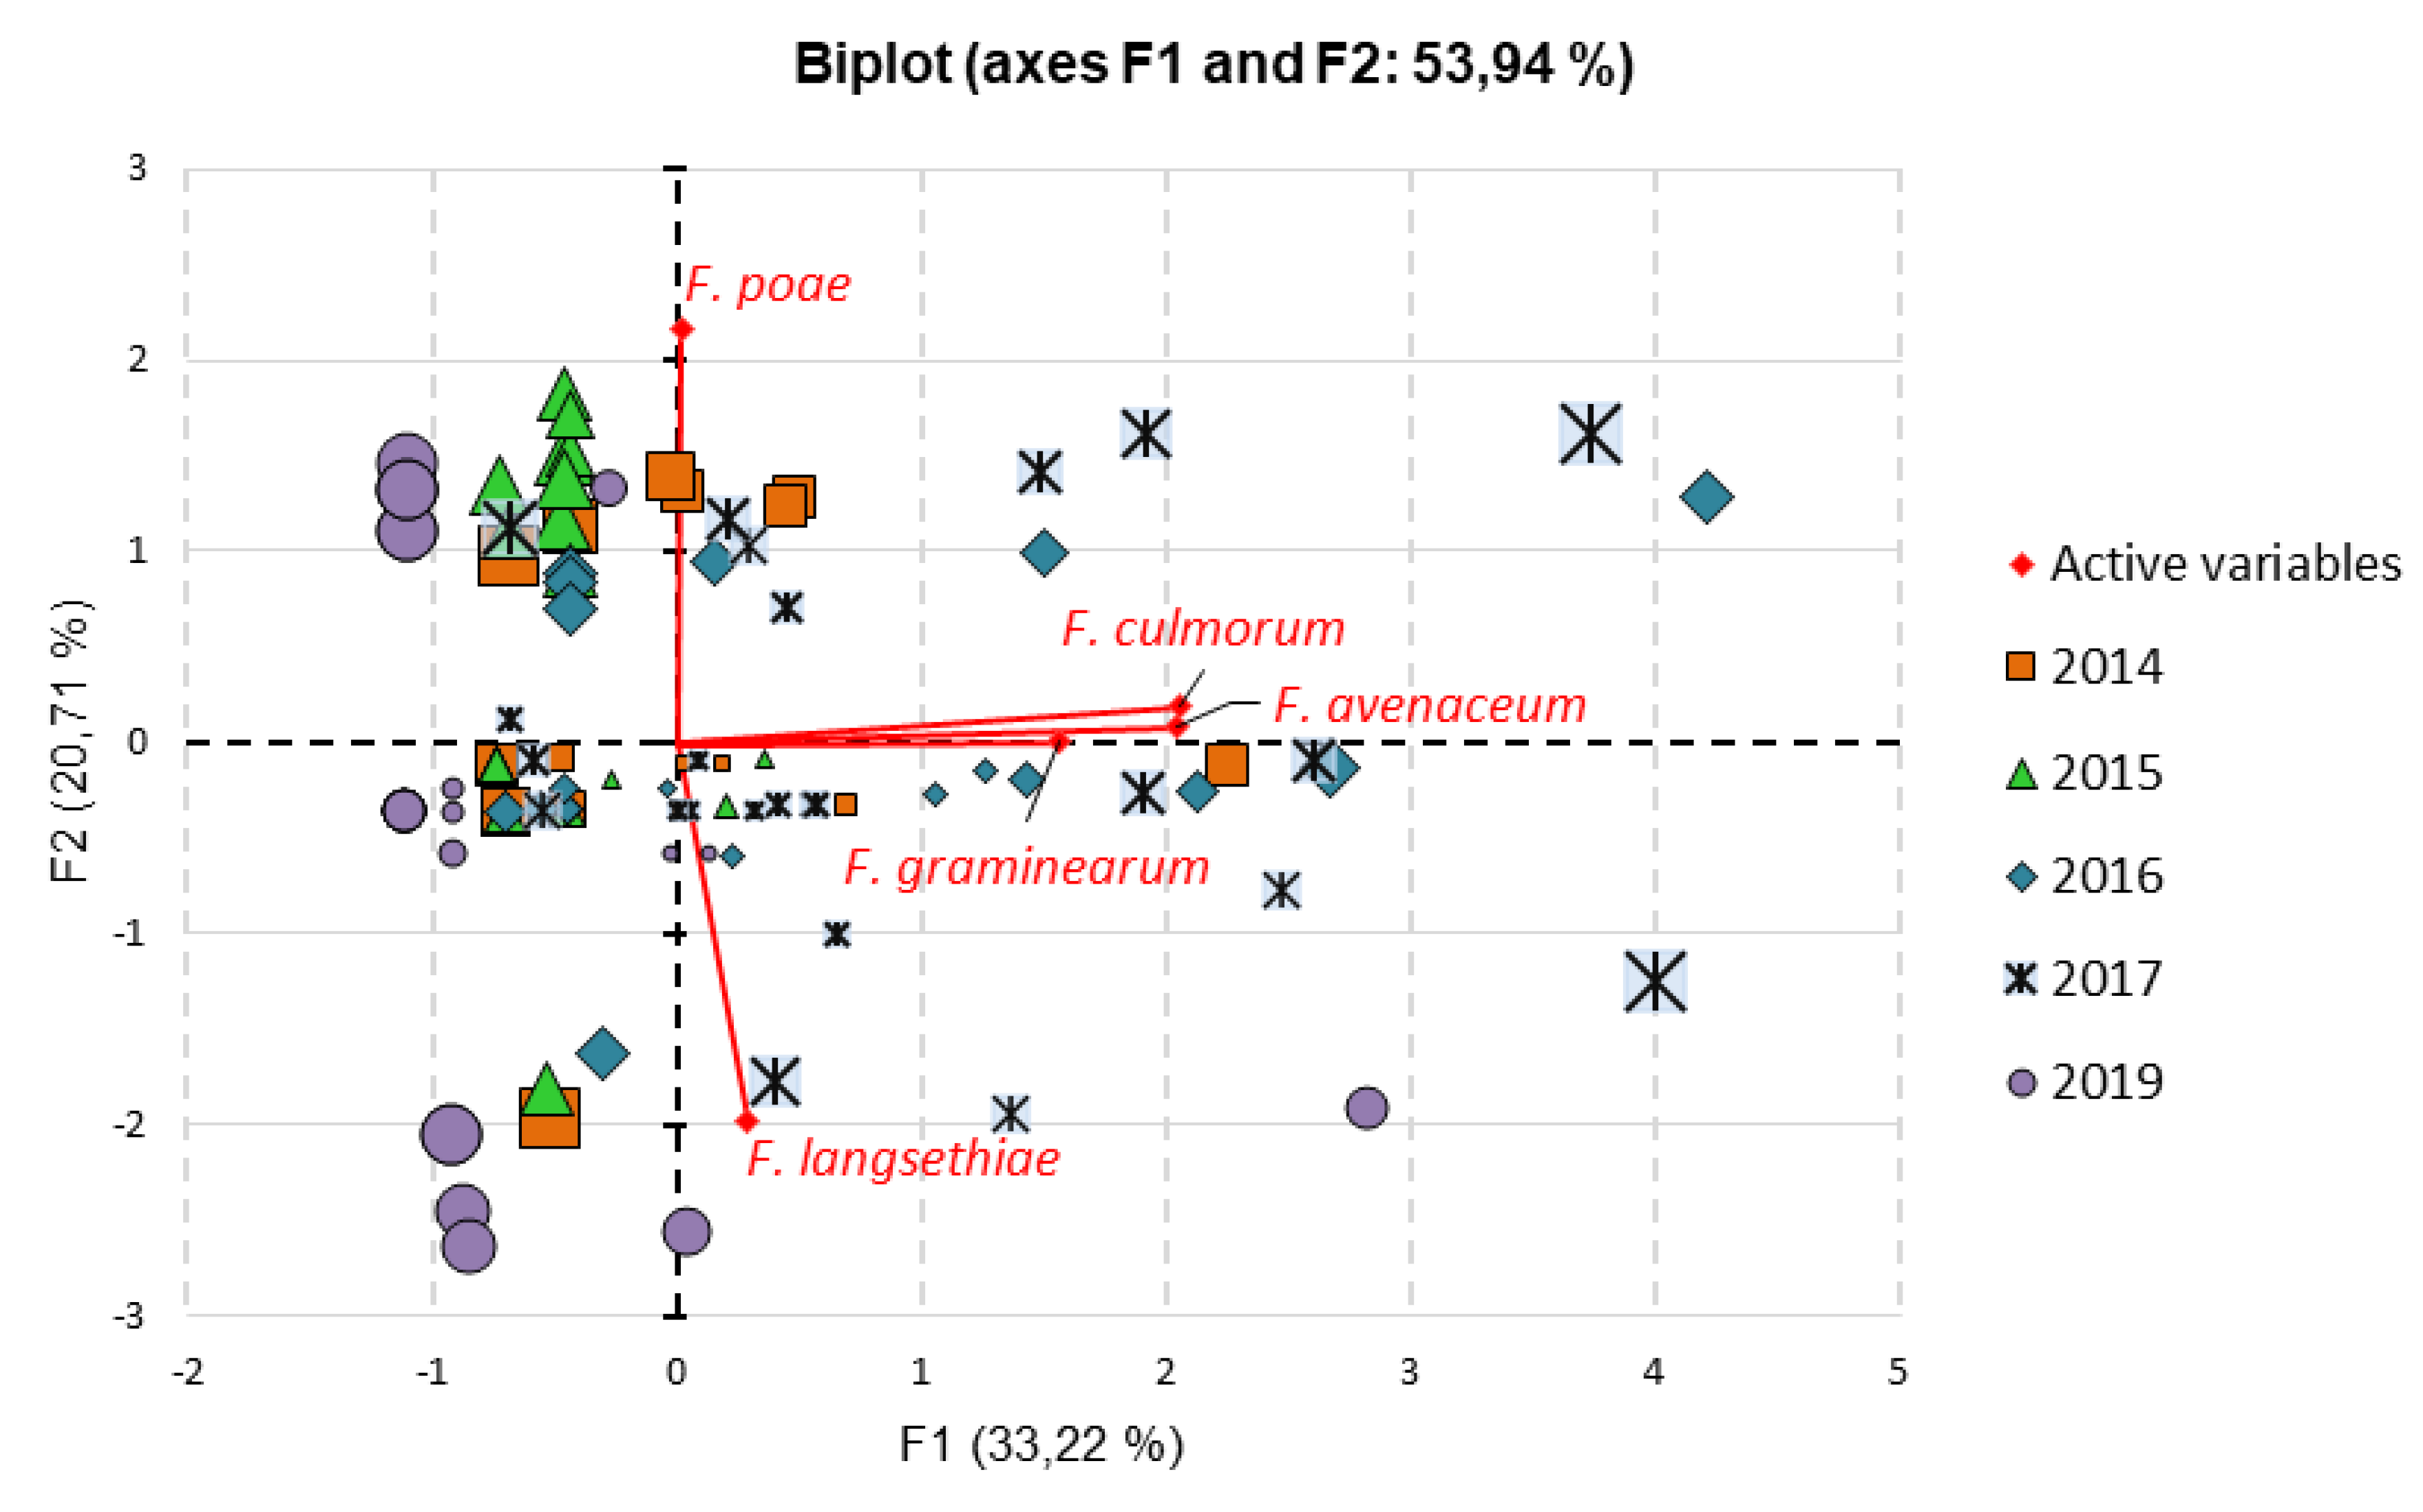
Figure 6.
Spearman’s rank correlation coefficient for Fusarium DNA content in winter wheat at harvest and different weather factors estimated for 14-day moving windows during the growing season. Red indicates a positive correlation and blue a negative correlation (both p ≤ 0.01) between DNA content and a particular weather variable, with a darker color indicating a higher value of the correlation coefficient. Tmean = daily mean temperature.
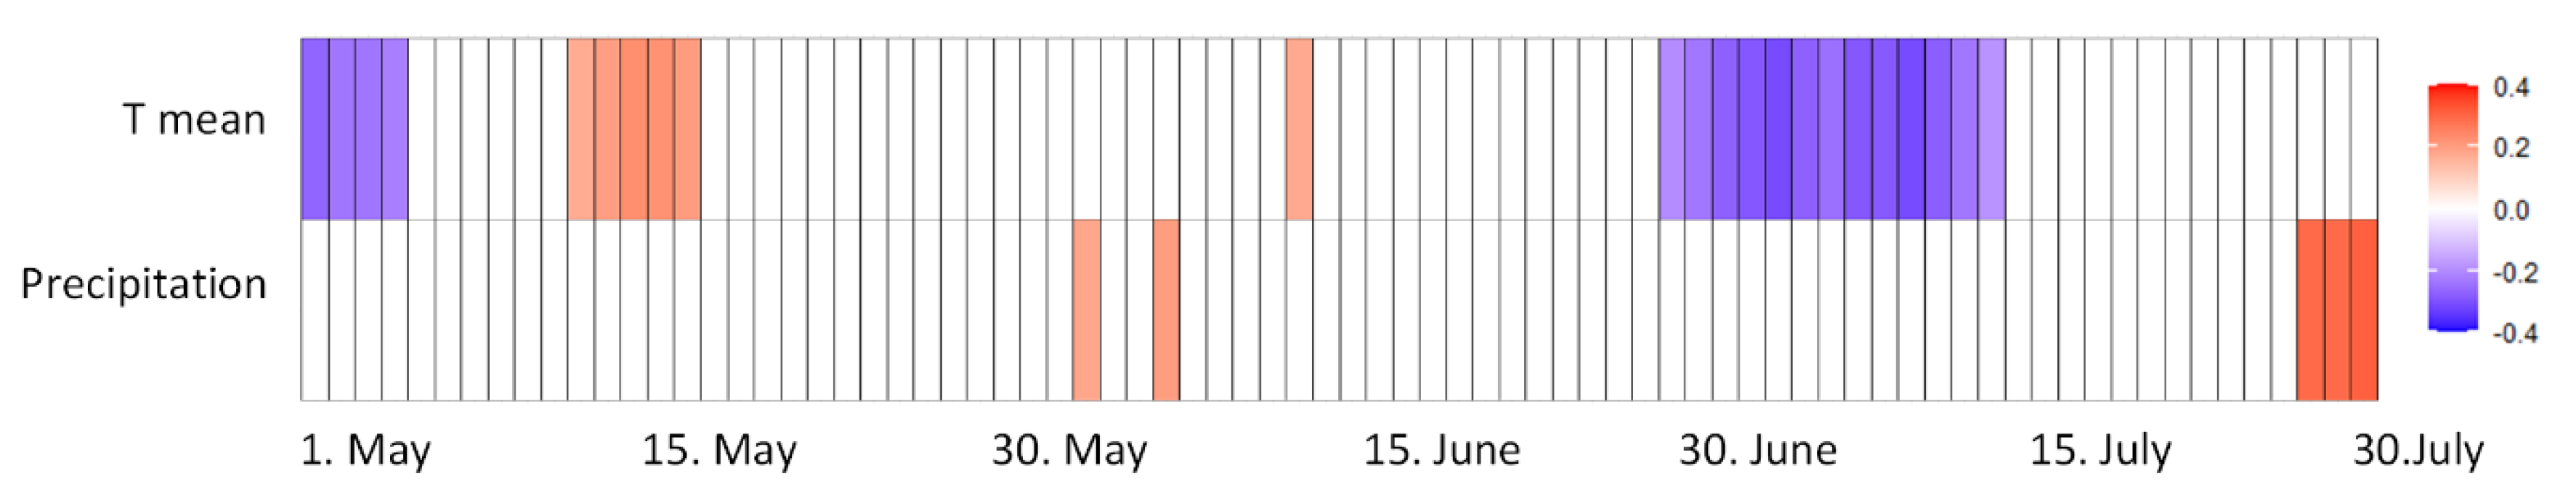
Table 1.
Sequences and names of species-specific primers.
| Target | Primer name | Sequence (5’-3’) |
|---|---|---|
| F. graminearum | Fgram F | CCATTCCCTGGGCGCT |
| species complex | Fgram R | CCTATTGACAGGTGGTTAGTGACTGG |
| F. culmorum | Fcul F | CACCGTCATTGGTATGTTGTCACT |
| Fcul R | CGGGAGCGTCTGATAGTCG | |
| F. langsethiae | Flang F | CAAGTCGACCACTGTGAGTACCTCT |
| Flang R | TGTCAAAGCATGTCAGTAAAGATGAC | |
| F. avenaceum | Fave F | TATGTTGTCACTGTCTCACACCACC |
| Fave R | AGAGGGATGTTAGCATGATGAAG | |
| F. poae | Fpoae F | ACCGAATCTCAACTCCGCTTT |
| Fpoae R | GTCTGTCAAGCATGTTAGCACAAGT | |
| EF1α | Hor1F | TCTCTGGGTTTGAGGGTGAC |
| Hor2R | GGCCCTTGTACCAGTCAAGGT |
Disclaimer/Publisher’s Note: The statements, opinions and data contained in all publications are solely those of the individual author(s) and contributor(s) and not of MDPI and/or the editor(s). MDPI and/or the editor(s) disclaim responsibility for any injury to people or property resulting from any ideas, methods, instructions or products referred to in the content. |
© 2025 by the authors. Licensee MDPI, Basel, Switzerland. This article is an open access article distributed under the terms and conditions of the Creative Commons Attribution (CC BY) license (http://creativecommons.org/licenses/by/4.0/).
Copyright: This open access article is published under a Creative Commons CC BY 4.0 license, which permit the free download, distribution, and reuse, provided that the author and preprint are cited in any reuse.


