
Submitted:
17 September 2025
Posted:
18 September 2025
You are already at the latest version
Abstract
Animal welfare assessments increasingly aim to quantify enclosure use and activity to support naturalistic behavior and improve Quality of Life (QoL). Traditionally, this is achieved through manual observations, which are time-consuming, subject to observer bias, and limited in temporal resolution due to short observation periods. Here, we compared manual tracking using ZooMonitor with automated pose estimation (SLEAP) in a mother–son pair of black-headed spider monkeys (Ateles fusciceps) at Aalborg Zoo. Manual observations were collected on six non-consecutive days (median daily duration: 62 min, mean: 66 min, range: 52–90 min) and visualized as spatial heatmaps. Pose estimation was applied to the same video footage, tracking four body parts to generate corresponding heatmaps. Across most days, the methods showed strong agreement (overlap 83–99%, Pearson’s r = 0.93–1.00), with both highlighting core activity areas on the floor near the central climbing structures and by the door with feeding gutters. Both methods also produced comparable estimates of time spent active, with no significant difference across days (p = 0.952). These results demonstrate that computer vision technology can provide a reliable and scalable tool for monitoring enclosure use and activity, enhancing the efficiency and consistency of zoo-based welfare assessments while reducing reliance on labor-intensive manual observations.
Keywords:
Ateles fusciceps
; Pose Estimation
; SLEAP
; ZooMonitor
; Animal Welfare
; Machine Learning
1. Introduction
Black-headed spider monkeys (Ateles fusciceps Gray, 1866), hereafter referred to as spider monkeys, are diurnal, arboreal primates inhabiting the rainforests of Colombia, Ecuador and Panama [1,2]. They exhibit a fission-fusion social structure, forming dynamic subgroups during the day to reduce competition for food [3,4]. They are omnivorous and primarily feed on ripe fruits and supplement with leaves, insects and other foods [2,5]. Spider monkeys are listed on Convention on International Trade in Endangered Species’ Appendix II [6]. This designation indicates that, while the species is not currently at risk of extinction, it is vulnerable to the impacts of unregulated trade [7], and the International Union for Conservation of Nature categorizes them as vulnerable [1,8].
In response to conservation and welfare goals, zoological institutions, hereafter referred to as zoos, increasingly seek to promote natural behaviors and activity patterns, and stimulate full enclosure use [9,10]. Assessing enclosure use reveals how animals engage with the space and resources available to them. Uneven space use or limited locomotor activity can indicate husbandry or design issue that constrain welfare, whereas diverse movement patterns and balanced enclosure use are linked to more positive welfare states [10,11]. Quality of Life (QoL) assessments similarly emphasize the importance of monitoring locomotion, exploration and the use of enclosure features as indicators of behavioral health and engagement, since both inactivity and stereotypic pacing may signal compromised welfare [9]. Together, these approaches highlight that activity and enclosure use are not only measures of physical health and stimulation but also vital indicators of whether zoo environments are enabling animals to thrive. However, these assessments often rely on behavioral observations, through video footage or live observations, but such assessment are time-consuming, subjective, and difficult to scale across numerous individuals [11,12,13].
Machine learning (ML) in the form of computer vision technology, particularly pose estimation, can offer promising solutions for automated, standardized behavior monitoring [12,14]. These methods can reduce observer bias, increase temporal resolution, and allow continuous data collection even in multi-animal settings [12,15]. Pose estimation uses trained neural networks to locate defined body parts within each video frame, generating spatial coordinates that can be used to reconstruct postures and movements [14,16]. Tools such as SLEAP, DeepLabCut and others have demonstrated high accuracy in both laboratory and field settings, enabling fine-scale quantification of behavior, activity tracking, and space use [14,16,17,18]. These approaches are increasingly recognized as valuable for welfare monitoring, as they provide both spatial and postural data that can inform enrichment, and enclosure design [12,15].
In this study, we compare manual enclosure-use tracking and automated pose estimation to evaluate spatial activity in a mother–son pair of spider monkeys at Aalborg Zoo (Denmark). By assessing the overlap between methods, we explore the potential of computer vision for improving the efficiency and consistency of welfare monitoring.
2. Materials and Methods
Two spider monkeys housed at Aalborg Zoo, were observed for this study: a female born in 1997 and her male offspring born in 2009. Observations focused exclusively on the indoor enclosure due to camera limitations. The indoor enclosure (approx. 97 m²) included climbing structures such as a central tree, five wooden shelves, fire hoses, and ropes. Visitor viewing was separated by netting, vegetation, and fencing.
Video data were collected on six non-consecutive days between October 26th and November 16th, 2024, in three sessions a day around feeding time during the zoo’s off-season. The total daily filming duration ranged from 52 to 90 minutes (median: 62 min). A wide-lens camera (Kitvision Escape HD5 and 4KW) was positioned to provide the most optimal coverage of the indoor enclosure.
The manual observations were carried out by six observers, using the program ZooMonitor [19]. The footage was scored using interval focal sampling [20] in intervals of 12 seconds on a top-down schematic drawing of the enclosure. A heatmap was produced from observations. Coordinates for the focals were denoted using a custom 2D Habitat Map in ZooMonitor and then visualized as heatmaps using R [21].
To compare manual scoring with automated approaches, we applied computer vision using pose estimation. Pose estimation involves training a neural network to detect and track specific body parts of the animals in each video frame, thereby generating coordinates that can be used to reconstruct their movements and enclosure use. For this purpose, SLEAP [14] was used to create a model trained on 313 frames from the footage collected on October 26th, 2024. The model was trained to recognize four body parts to track the individuals. This was done with the use of a skeleton with five nodes: head, shoulder, hip, tail1, and tail2 (Figure 1 and Figure 2). The model was built and trained through SLEAP’s prediction-assisted labeling workflow until the model consistently produced accurate predictions across multiple frames and diverse conditions.. The final best model was reached after 40 epochs with a validation loss of 0.000745. The frame rate of the videos was reduced to 1 fps and converted to grayscale for analysis. The resulting pose data were used to generate heatmaps for comparison with manual scoring. These heatmaps were produced in R [21] using the following packages: tidyverse (version 2.0.0) [22], ggpointdensity (version 0.2.0.9000) [23], and jpeg (version 0.1-11) [24].
Furthermore, daily active time was calculated for both methods. In ZooMonitor, consecutive 12 seconds samples were considered “movement” if x–y changes exceeded 7 pixels. In SLEAP, each frame pose was reduced to the best-scored hip/shoulder point, with movement defined as changes >30 pixels. For each method, the durations of movement were summed. Methods were compared with a paired t-test.
3. Results
Spatial activity patterns of the two spider monkeys within the indoor enclosure were visualized using heatmaps generated from both manual observations (ZooMonitor) and automated pose estimation (SLEAP) (Figure 2). A total of 12 heatmaps are presented: six pairs corresponding to six observation dates. Each pair displays the manually scored top-down heatmap alongside the automatically generated front-facing heatmap from SLEAP, arranged side by side to facilitate direct comparison.
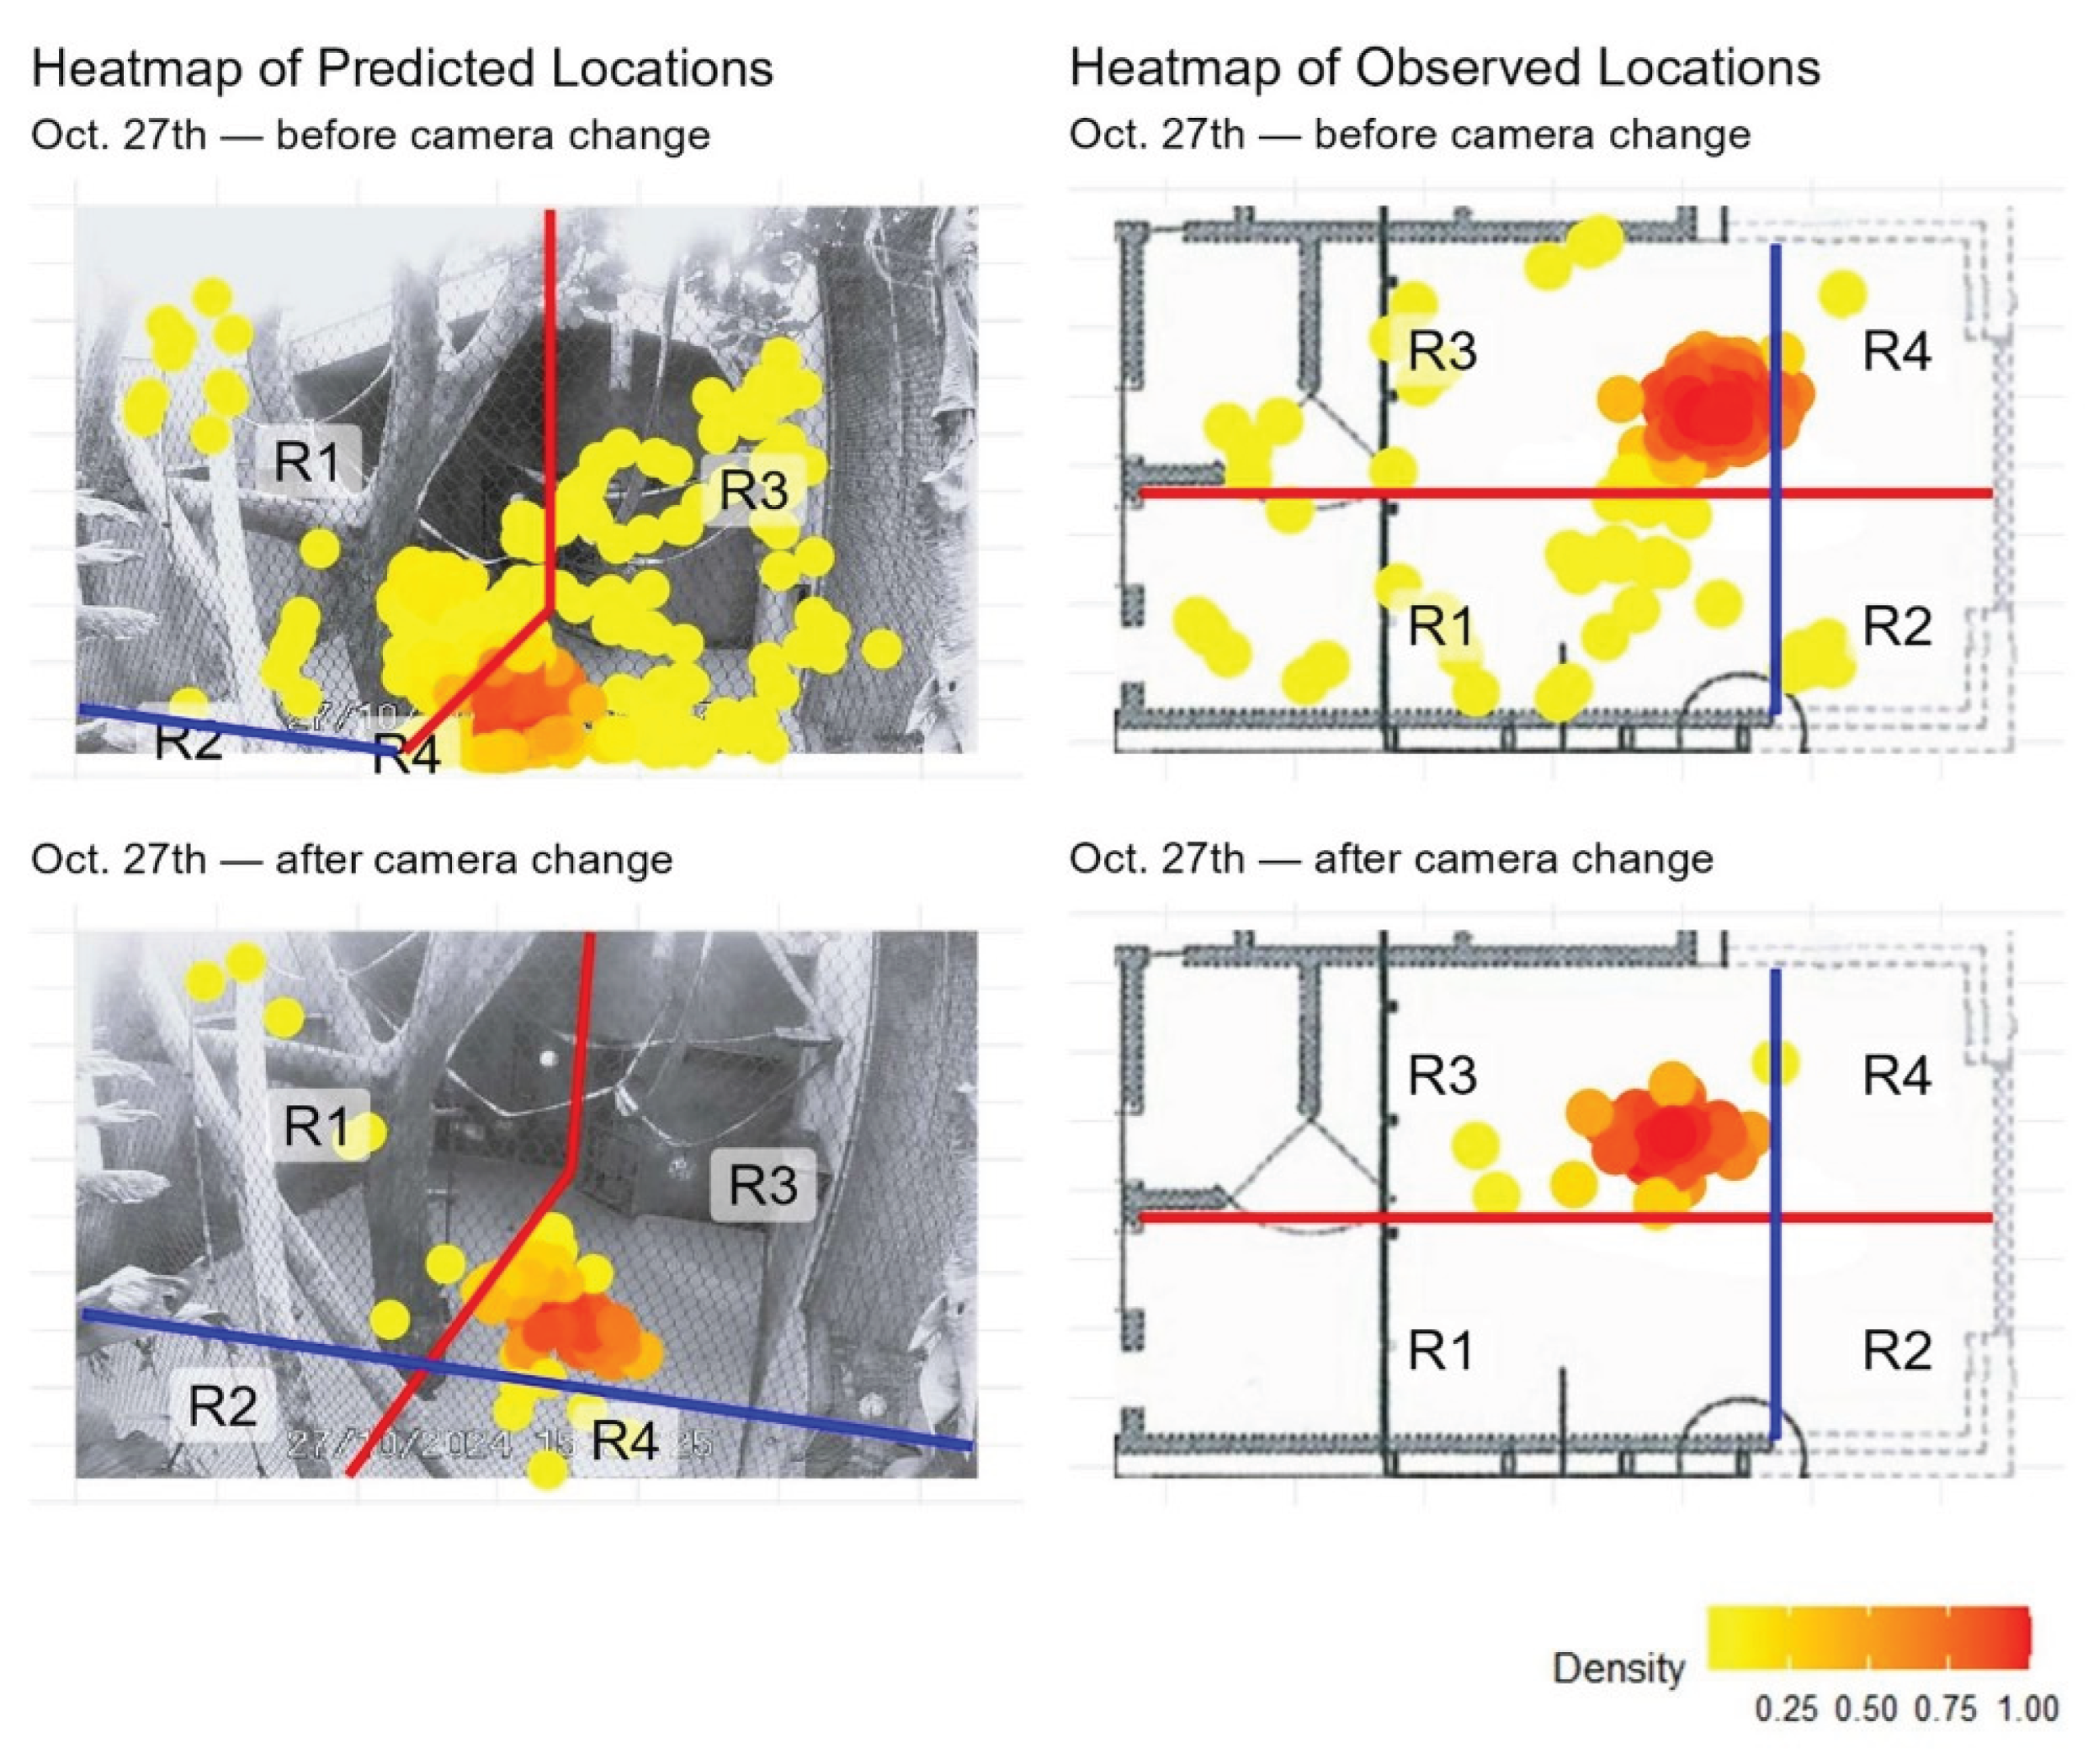
Overall, the heatmaps from both methods revealed similar spatial use patterns, with high-occupancy zones consistently centered around the enclosure’s central climbing structures and the door with feeding gutters. To facilitate direct comparison, the enclosure was divided into four regions (R1–R4), and the distribution of locations across these regions is summarized in Appendix A. Comparison between the methods showed a high degree of agreement for most days, with percentage overlap values ranging from 44.75% to 99.00% and Pearson correlation coefficients: 0.237 ≤ r ≤ 1.000 across observation days (Table 1). Minor discrepancies appeared on some observation dates, most notably on October 27th where a major discrepancy was found. Further inspection revealed that a major camera shift occurred partway through that day, which affected the alignment of the two methods. To account for this, the data was split into pre- and post-shift segments (Appendix B). When analyzed separately, the overlap between methods was 95.02% and 97.51%, with r = 0.99 and r = 1.00, respectively.
The analysis of activity calculated from the tracking results from the two methods, SLEAP and ZooMonitor, generally produced comparable estimates of the individuals’ activity across the observed days (Figure 3). On some days, the ZooMonitor method measured higher activity than SLEAP (Oct 27th, Oct 31st and Nov 16th), while the SLEAP method measured higher activity on other days (Oct 28th, Nov 1st, Nov 9th). The paired t-test resulted in no significant difference between the two methods (t = 0.062, df = 5, p-value = 0.952).
4. Discussion
This study compared manual enclosure-use tracking with automated pose estimation using SLEAP to evaluate spatial activity in a mother–son pair of spider monkeys. Our results demonstrate a strong overall agreement between methods, supported by high overlap percentages and correlation coefficients, which indicates that computer vision can reliably capture enclosure-use patterns that are traditionally assessed through direct observation. Importantly, both methods identified the same hotspots around the central climbing structures and the door with feeding gutters.
A further dimension of comparison was overall activity levels (Figure 3). Here, both methods produced similar estimates of time spent in movement, with only slight differences between them. Although daily variation occurred, sometimes ZooMonitor estimated higher activity and sometimes SLEAP did, the lack of systematic bias suggests that automated tracking can reliably replicate activity measures. Because both inactivity and abnormal locomotion, such as stereotypic pacing, can signal compromised welfare, these results strengthen the case for computer vision as a valid monitoring tool.
A major advantage of pose estimation was the ability to generate fine-scale, continuous data that minimized observer bias and revealed subtle positional shifts not easily detected with interval sampling. By contrast, manual heatmaps tended to produce more diffuse activity zones, reflecting both the coarser temporal resolution and the subjective estimation of placement of points on schematic maps. This highlights the potential for automated methods to provide a more precise and scalable approach to welfare monitoring, especially in settings where large datasets are required.
Despite the overall strong agreement, some discrepancies occurred, highlighting that camera placement and perspective can strongly influence outcomes and must be carefully managed in future applications. Broader coverage, multiple angles, or automated correction methods could help mitigate such issues.
The findings also raise the question of whether manual tracking remains necessary when reliable automated tools are available. While SLEAP successfully reproduced enclosure-use patterns and overall activity levels, manual observations still hold value for recording nuanced behaviors, social interactions, and context-specific welfare indicators that pose estimation cannot yet capture alone. Future work should therefore integrate pose-based behavior classification and multi-individual tracking, extending beyond space use to assess how animals interact with their environment, such as enrichment. As demonstrated by Hayden et al. (2022) [17], who successfully used pose estimation to quantify specific behaviors in primates. Such extensions would allow welfare monitoring, through computer vision, to move beyond spatial measures toward richer behavioral profiles.
In summary, our results demonstrate that automated pose estimation offers a valid and efficient alternative to manual enclosure-use monitoring. While manual methods may remain important for capturing behavioral nuance, computer vision provides scalable, objective data that can strengthen welfare assessments by enabling continuous, fine-grained monitoring of activity and enclosure use.
5. Conclusions
This study demonstrates that computer vision, using pose estimation with SLEAP, can effectively replicate spatial tracking data obtained through manual observations in ZooMonitor. Both enclosure-use patterns and activity levels were captured consistently, highlighting automated tracking as a reliable and scalable method for monitoring welfare-relevant indicators in spider monkeys housed in Aalborg Zoo. Manual observations remain valuable for capturing behavioral nuance, but integrating AI-based methods can enhance the efficiency, consistency, and resolution of welfare assessments. Future work should expand on behavior classification and test generalizability across individuals, environments, and contexts to fully realize the potential of computer vision in zoo-based welfare monitoring.
Author Contributions
Conceptualization, S.M.L., F.G., J.N., L.L.N.L., N.C., S.P.H., T.K., H.H.Ø.R., S.M.S., and B.Ø.T.; methodology, S.M.L., F.G., J.N., L.L.N.L., N.C., S.P.H., T.K., H.H.Ø.R., S.M.S., and B.Ø.T.; validation, S.M.L., F.G., and J.N.; formal analysis, S.M.L.; investigation, S.M.L., L.L.N.L., N.C., S.P.H., T.K., H.H.Ø.R., S.M.S., and B.Ø.T.; data curation, S.M.L., L.L.N.L., N.C., S.P.H., T.K., H.H.Ø.R., S.M.S., and B.Ø.T.; writing—original draft preparation, S.M.L., F.G., J.N., L.L.N.L., N.C., S.P.H., T.K., H.H.Ø.R., S.M.S., and B.Ø.T.; writing—review and editing, all authors; visualization, S.M.L.; supervision, S.P., T.L.F., and C.P.; funding acquisition, S.M.L., F.G., J.N., and C.P. All authors have read and agreed to the published version of the manuscript.
Funding
This research was funded by Aalborg Zoo Conservation Foundation (AZCF), grant number 2024-06 and 2025-02
Institutional Review Board Statement
The Ethical Review Board was not consulted for the purposes of this study, as this study did not interfere with the daily routines of the studied subjects, and solely involved passive observation through video footage.
Informed Consent Statement
We obtained approval from Aalborg Zoo, and the study guarantees all work was carried out within good animal welfare and ethical circumstances. There was no change in daily routines for the animals of concern.
Data Availability Statement
The data presented in this study are available on request from the corresponding author.
Acknowledgments
We would like to thank Aalborg Zoo for allowing us to conduct this study at their facilities.
Conflicts of Interest
The authors declare no conflicts of interest.
Appendix A
Appendix A.1. SLEAP

Table A1.
Number of observations (n) and corresponding percentages (%) of spider monkey locations in each region (R1–R4) for the SLEAP method across observation dates.
Table A1.
Number of observations (n) and corresponding percentages (%) of spider monkey locations in each region (R1–R4) for the SLEAP method across observation dates.
| Date | R1 (n) | R1 (%) | R2 (n) | R2 (%) | R3 (n) | R3 (%) | R4 (n) | R4 (%) |
| Oct 27th | 131 | 6.16 | 6 | 0.28 | 780 | 36.71 | 1208 | 56.85 |
| Oct 28th | 314 | 12.78 | 0 | 0.00 | 2136 | 86.94 | 7 | 0.28 |
| Oct 31st | 568 | 27.32 | 3 | 0.29 | 1492 | 71.77 | 16 | 0.77 |
| Nov 1st | 147 | 7.84 | 0 | 0.00 | 1717 | 91.53 | 12 | 0.64 |
| Nov 9th | 937 | 45.60 | 6 | 0.29 | 1109 | 53.97 | 3 | 0.15 |
| Nov 16th | 1225 | 65.79 | 6 | 0.32 | 623 | 33.46 | 8 | 0.43 |
Appendix A.2. ZooMonitor
Table A2.
Number of observations (n) and corresponding percentages (%) of spider monkey locations in each region (R1–R4) for the ZooMonitor method across observation dates.
Table A2.
Number of observations (n) and corresponding percentages (%) of spider monkey locations in each region (R1–R4) for the ZooMonitor method across observation dates.
| Date | R1 (n) | R1 (%) | R2 (n) | R2 (%) | R3 (n) | R3 (%) | R4 (n) | R4 (%) |
| Oct 27th | 30 | 12.00 | 6 | 2.40 | 210 | 84 | 4 | 1.60 |
| Oct 28th | 10 | 3.58 | 0 | 0.00 | 266 | 95.34 | 3 | 1.08 |
| Oct 31st | 82 | 41.41 | 5 | 2.53 | 108 | 54.55 | 3 | 1.52 |
| Nov 1st | 22 | 8.24 | 0 | 0.00 | 232 | 86.89 | 13 | 4.87 |
| Nov 9th | 62 | 44.60 | 1 | 0.72 | 75 | 53.96 | 1 | 0.72 |
| Nov 16th | 170 | 79.44 | 6 | 2.80 | 37 | 17.29 | 1 | 0.47 |
Appendix B
Appendix B.1. Heatmaps
Figure A1.
Heatmaps of model-predicted locations from SLEAP (left column) and observed locations recorded in ZooMonitor (right column) from October 27th before and after camera angle shift. Observed locations are plotted over a schematic map of the study area, while predicted locations are plotted over video frames from the corresponding date. The blue and red lines split the enclosure in regions with the climbing tree as the center. Yellow to red colors represent increasing location density, with red indicating the highest density.
Appendix B.2. Overlap and Correlation
Table A3.
Percentage overlap and Pearson correlation (r) between observed locations recorded in ZooMonitor and model-predicted locations from SLEAP from October 27th before and after camera angle shift.
Table A3.
Percentage overlap and Pearson correlation (r) between observed locations recorded in ZooMonitor and model-predicted locations from SLEAP from October 27th before and after camera angle shift.
| Date | Overlap (%) | Pearson Correlation (r) |
| Oct 27th before camera change | 95.02 | 0.99 |
| Oct 27th after camera change | 97.51 | 1.00 |
Appendix B.3. SLEAP
Table A4.
Number of observations (n) and corresponding percentages (%) of spider monkey locations in each region (R1–R4) for the SLEAP method from October 27th before and after camera angle shift.
Table A4.
Number of observations (n) and corresponding percentages (%) of spider monkey locations in each region (R1–R4) for the SLEAP method from October 27th before and after camera angle shift.
| Date | R1 (n) | R1 (%) | R2 (n) | R2 (%) | R3 (n) | R3 (%) | R4 (n) | R4 (%) |
| Oct 27th before camera change | 255 | 16.79 | 0 | 0.00 | 1264 | 83.21 | 0 | 0.00 |
| Oct 27th after camera change | 10 | 1.66 | 0 | 0.00 | 588 | 97.51 | 5 | 0.83 |
Appendix B.4. ZooMonitor
Table A5.
Number of observations (n) and corresponding percentages (%) of spider monkey locations in each region (R1–R4) for the ZooMonitor method from October 27th before and after camera angle shift.
Table A5.
Number of observations (n) and corresponding percentages (%) of spider monkey locations in each region (R1–R4) for the ZooMonitor method from October 27th before and after camera angle shift.
| Date | R1 (n) | R1 (%) | R2 (n) | R2 (%) | R3 (n) | R3 (%) | R4 (n) | R4 (%) |
| Oct 27th before camera change | 30 | 14.93 | 6 | 2.99 | 161 | 80.10 | 4 | 1.99 |
| Oct 27th after camera change | 0 | 0.00 | 0 | 0.00 | 49 | 100 | 0 | 0.00 |
References
- IUCN Ateles Fusciceps: Moscoso, P. , Link, A., Defler, T.R., de La Torre, S., Cortes-Ortíz, L., Méndez-Carvajal, P.G. & Shanee, S.: The IUCN Red List of Threatened Species 2021: E.T135446A191687087 2020.
- Campbell, C.J.; Aureli, F.; Chapman, C.A.; Ramos-Fernández, G.; Matthews, K.; Russo, S.E.; Suarez, S.; Vick, L. Terrestrial Behavior of Ateles Spp. Int. J. Primatol. 2005, 26, 1039–1051. [Google Scholar] [CrossRef]
- Aureli, F.; Schaffner, C.M.; Boesch, C.; Bearder, S.K.; Call, J.; Chapman, C.A.; Connor, R.; Fiore, A.D.; Dunbar, R.I.M.; Henzi, S.P.; et al. Fission-Fusion Dynamics: New Research Frameworks. Curr. Anthropol. 2008, 49, 627–654. [Google Scholar] [CrossRef]
- Price, E.E.; Stoinski, T.S. Group Size: Determinants in the Wild and Implications for the Captive Housing of Wild Mammals in Zoos. Appl. Anim. Behav. Sci. 2007, 103, 255–264. [Google Scholar] [CrossRef]
- Dew, J.L. Foraging, Food Choice, and Food Processing by Sympatric Ripe-Fruit Specialists: Lagothrix Lagotricha Poeppigii and Ateles Belzebuth Belzebuth. Int. J. Primatol. 2005, 26, 1107–1135. [Google Scholar] [CrossRef]
- UNEP-WCMC Convention on International Trade in Endangered Species of Wild Fauna and Flora (CITES) Appendices I, II and III Available online:. Available online: https://cites.org/eng/app/appendices.php (accessed on 3 July 2025).
- Ramos-Fernández, G.; Wallace, R.B. Spider Monkey Conservation in the Twenty-First Century: Recognizing Risks and Opportunities. In Spider Monkeys; Campbell, C.J., Ed.; Cambridge University Press, 2008; pp. 351–376 ISBN 978-0-521-86750-4.
- Link, A.; Di Fiore, A.; Spehar, S.N.; Wrangham, R.W.; Muller, M.N. Female-Directed Aggression and Social Control in Spider Monkeys. In Sexual Coercion in Primates and Humans; Harvard University Press: Cambridge, MA and London, England, 2015; pp. 157–183. ISBN 0-674-03324-8. [Google Scholar]
- Campbell-Ward, M. Quality-of-Life Assessments in Zoo Animals: Not Just for the Aged and Charismatic. Animals 2023, 13, 3394. [Google Scholar] [CrossRef] [PubMed]
- Tallo-Parra, O.; Salas, M.; Manteca, X. Zoo Animal Welfare Assessment: Where Do We Stand? Animals 2023, 13, 1966. [Google Scholar] [CrossRef] [PubMed]
- Rose, P.E.; Riley, L.M. Conducting Behavioural Research in the Zoo: A Guide to Ten Important Methods, Concepts and Theories. J. Zool. Bot. Gard. 2021, 2, 421–444. [Google Scholar] [CrossRef]
- Lund, S.M.; Nielsen, J.; Gammelgård, F.; Nielsen, M.G.; Jensen, T.H.; Pertoldi, C. Behavioral Coding of Captive African Elephants (Loxodonta Africana): Utilizing DeepLabCut and Create ML for Nocturnal Activity Tracking. Animals 2024, 14, 2820. [Google Scholar] [CrossRef] [PubMed]
- Sherwen, S.L.; Hemsworth, L.M.; Beausoleil, N.J.; Embury, A.; Mellor, D.J. An Animal Welfare Risk Assessment Process for Zoos. Animals 2018, 8, 130. [Google Scholar] [CrossRef] [PubMed]
- Pereira, T.D.; Tabris, N.; Matsliah, A.; Turner, D.M.; Li, J.; Ravindranath, S.; Papadoyannis, E.S.; Normand, E.; Deutsch, D.S.; Wang, Z.Y.; et al. SLEAP: A Deep Learning System for Multi-Animal Pose Tracking. Nat. Methods 2022, 19, 486–495. [Google Scholar] [CrossRef] [PubMed]
- Tuyttens, F.A.M.; De Graaf, S.; Heerkens, J.L.T.; Jacobs, L.; Nalon, E.; Ott, S.; Stadig, L.; Van Laer, E.; Ampe, B. Observer Bias in Animal Behaviour Research: Can We Believe What We Score, If We Score What We Believe? Anim. Behav. 2014, 90, 273–280. [Google Scholar] [CrossRef]
- Wiltshire, C.; Lewis-Cheetham, J.; Komedová, V.; Matsuzawa, T.; Graham, K.E.; Hobaiter, C. DeepWild: Application of the Pose Estimation Tool DeepLabCut for Behaviour Tracking in Wild Chimpanzees and Bonobos. J. Anim. Ecol. 2023, 92, 1560–1574. [Google Scholar] [CrossRef] [PubMed]
- Hayden, B.Y.; Park, H.S.; Zimmermann, J. Automated Pose Estimation in Primates. Am. J. Primatol. 2022, 84, e23348. [Google Scholar] [CrossRef]
- Liptovszky, M.; Polla, E. Artificial Intelligence’s Potential in Zoo Animal Welfare. Zoo Biol. 2025. [Google Scholar] [CrossRef]
- ZooMonitor. Available online: https://zoomonitor.org/ (accessed on 3 July 2025).
- Altmann, J. Observational Study of Behavior: Sampling Methods. Behaviour 1974, 49, 227–267. [Google Scholar] [CrossRef] [PubMed]
- R Core Team R: A Language and Environment for Statistical Computing; Vienna, Austria, 2023.
- Wickham, H. ; RStudio Tidyverse: Easily Install and Load the “Tidyverse” 2023.
- Kremer, L.P.M.; Anders, S. Ggpointdensity: A Cross Between a 2D Density Plot and a Scatter Plot 2025.
- Urbanek, S. Jpeg: Read and Write JPEG Images 2025.
Figure 1.
Example from a labeled frame from SLEAP showing the skeleton used for training with the 5 nodes: head, shoulder, hip, tail1 and tail2.
Figure 1.
Example from a labeled frame from SLEAP showing the skeleton used for training with the 5 nodes: head, shoulder, hip, tail1 and tail2.
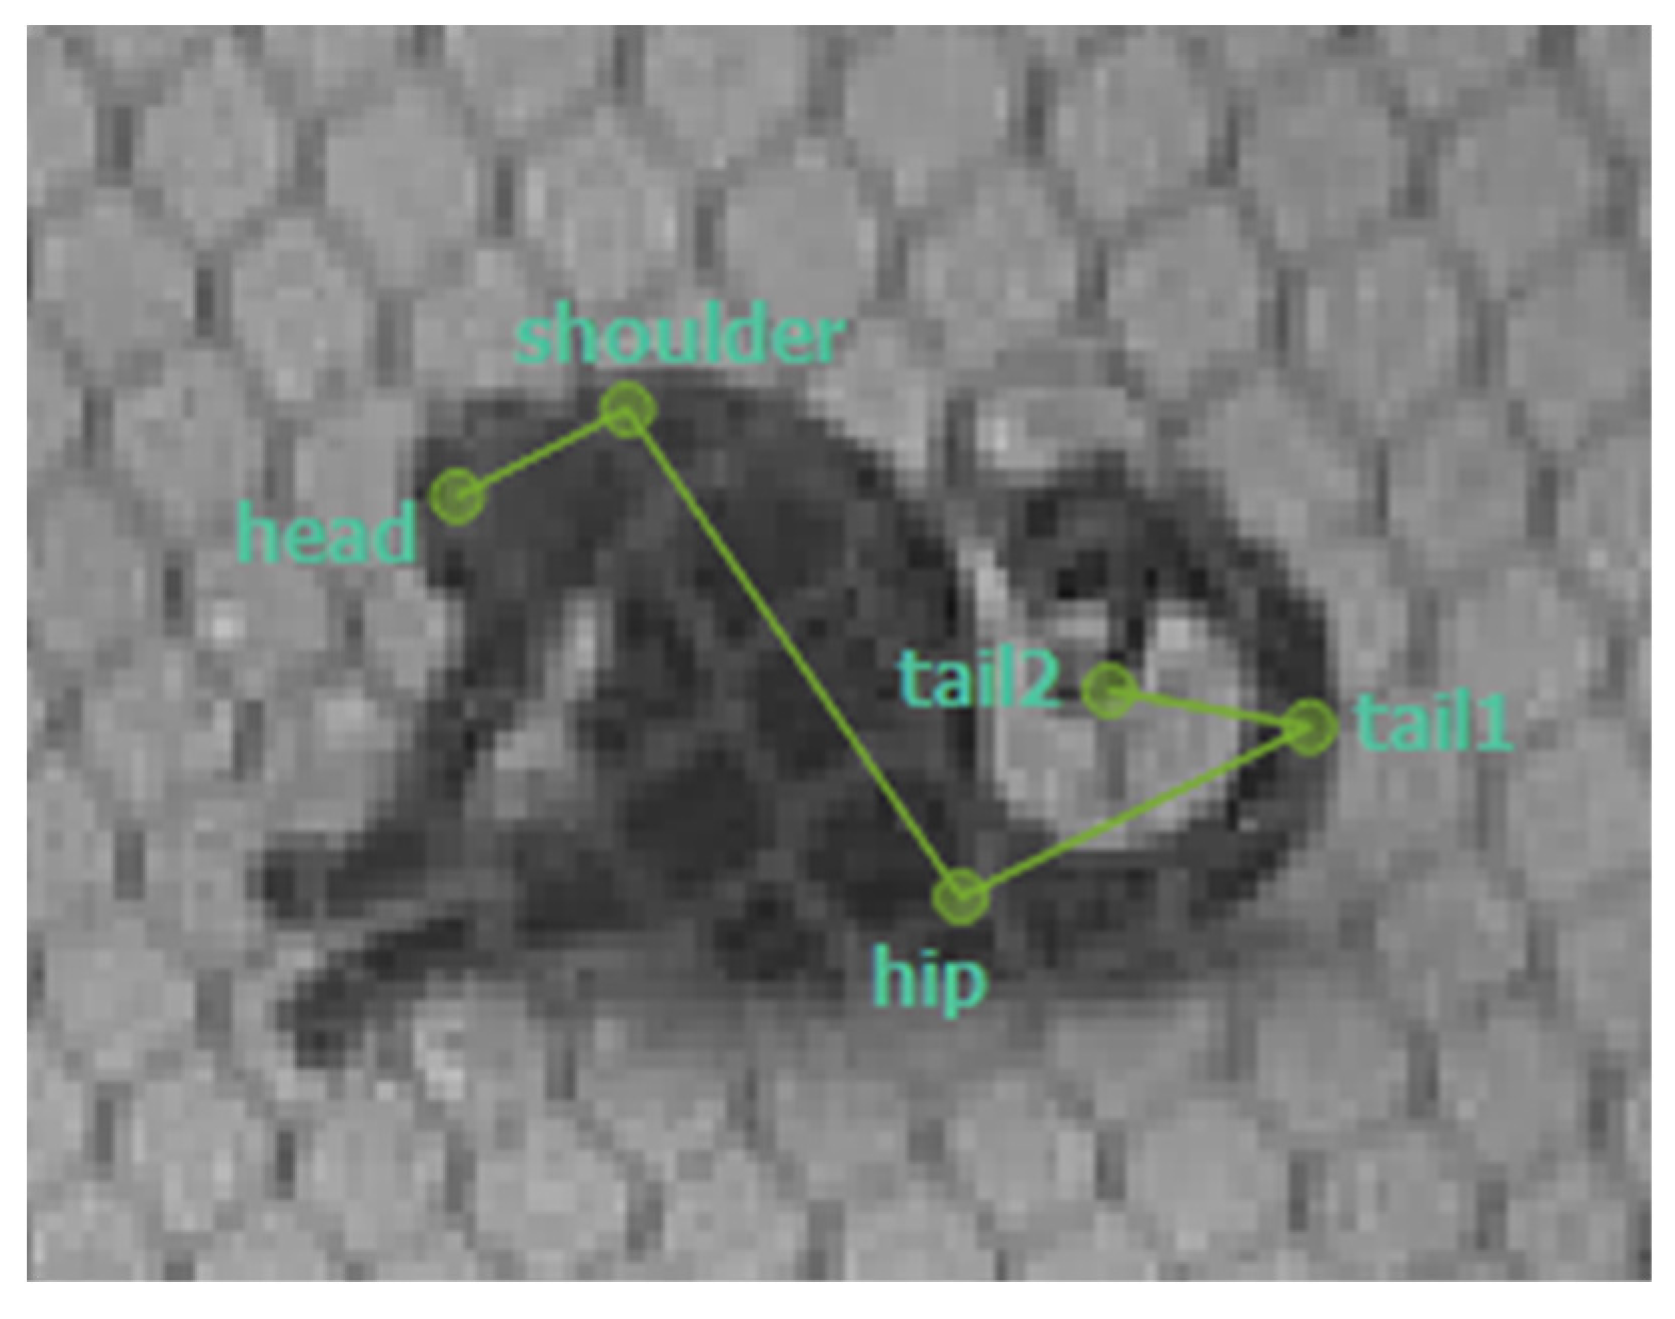
Figure 2.
(a) Heatmaps of model-predicted locations from SLEAP (left column) and observed locations recorded in ZooMonitor (right column) for two focal spider monkeys. Observed locations are plotted over a schematic map of the study area, while predicted locations are plotted over video frames from the corresponding date. The blue and red lines split the enclosure in regions with the climbing tree as the center. Yellow to red colors represent increasing location density, with red indicating the highest density. Dates are shown above each pair of panels. (b) Heatmaps of predicted (left column) and observed (right column) locations for each sampling date, as described in the previous page.
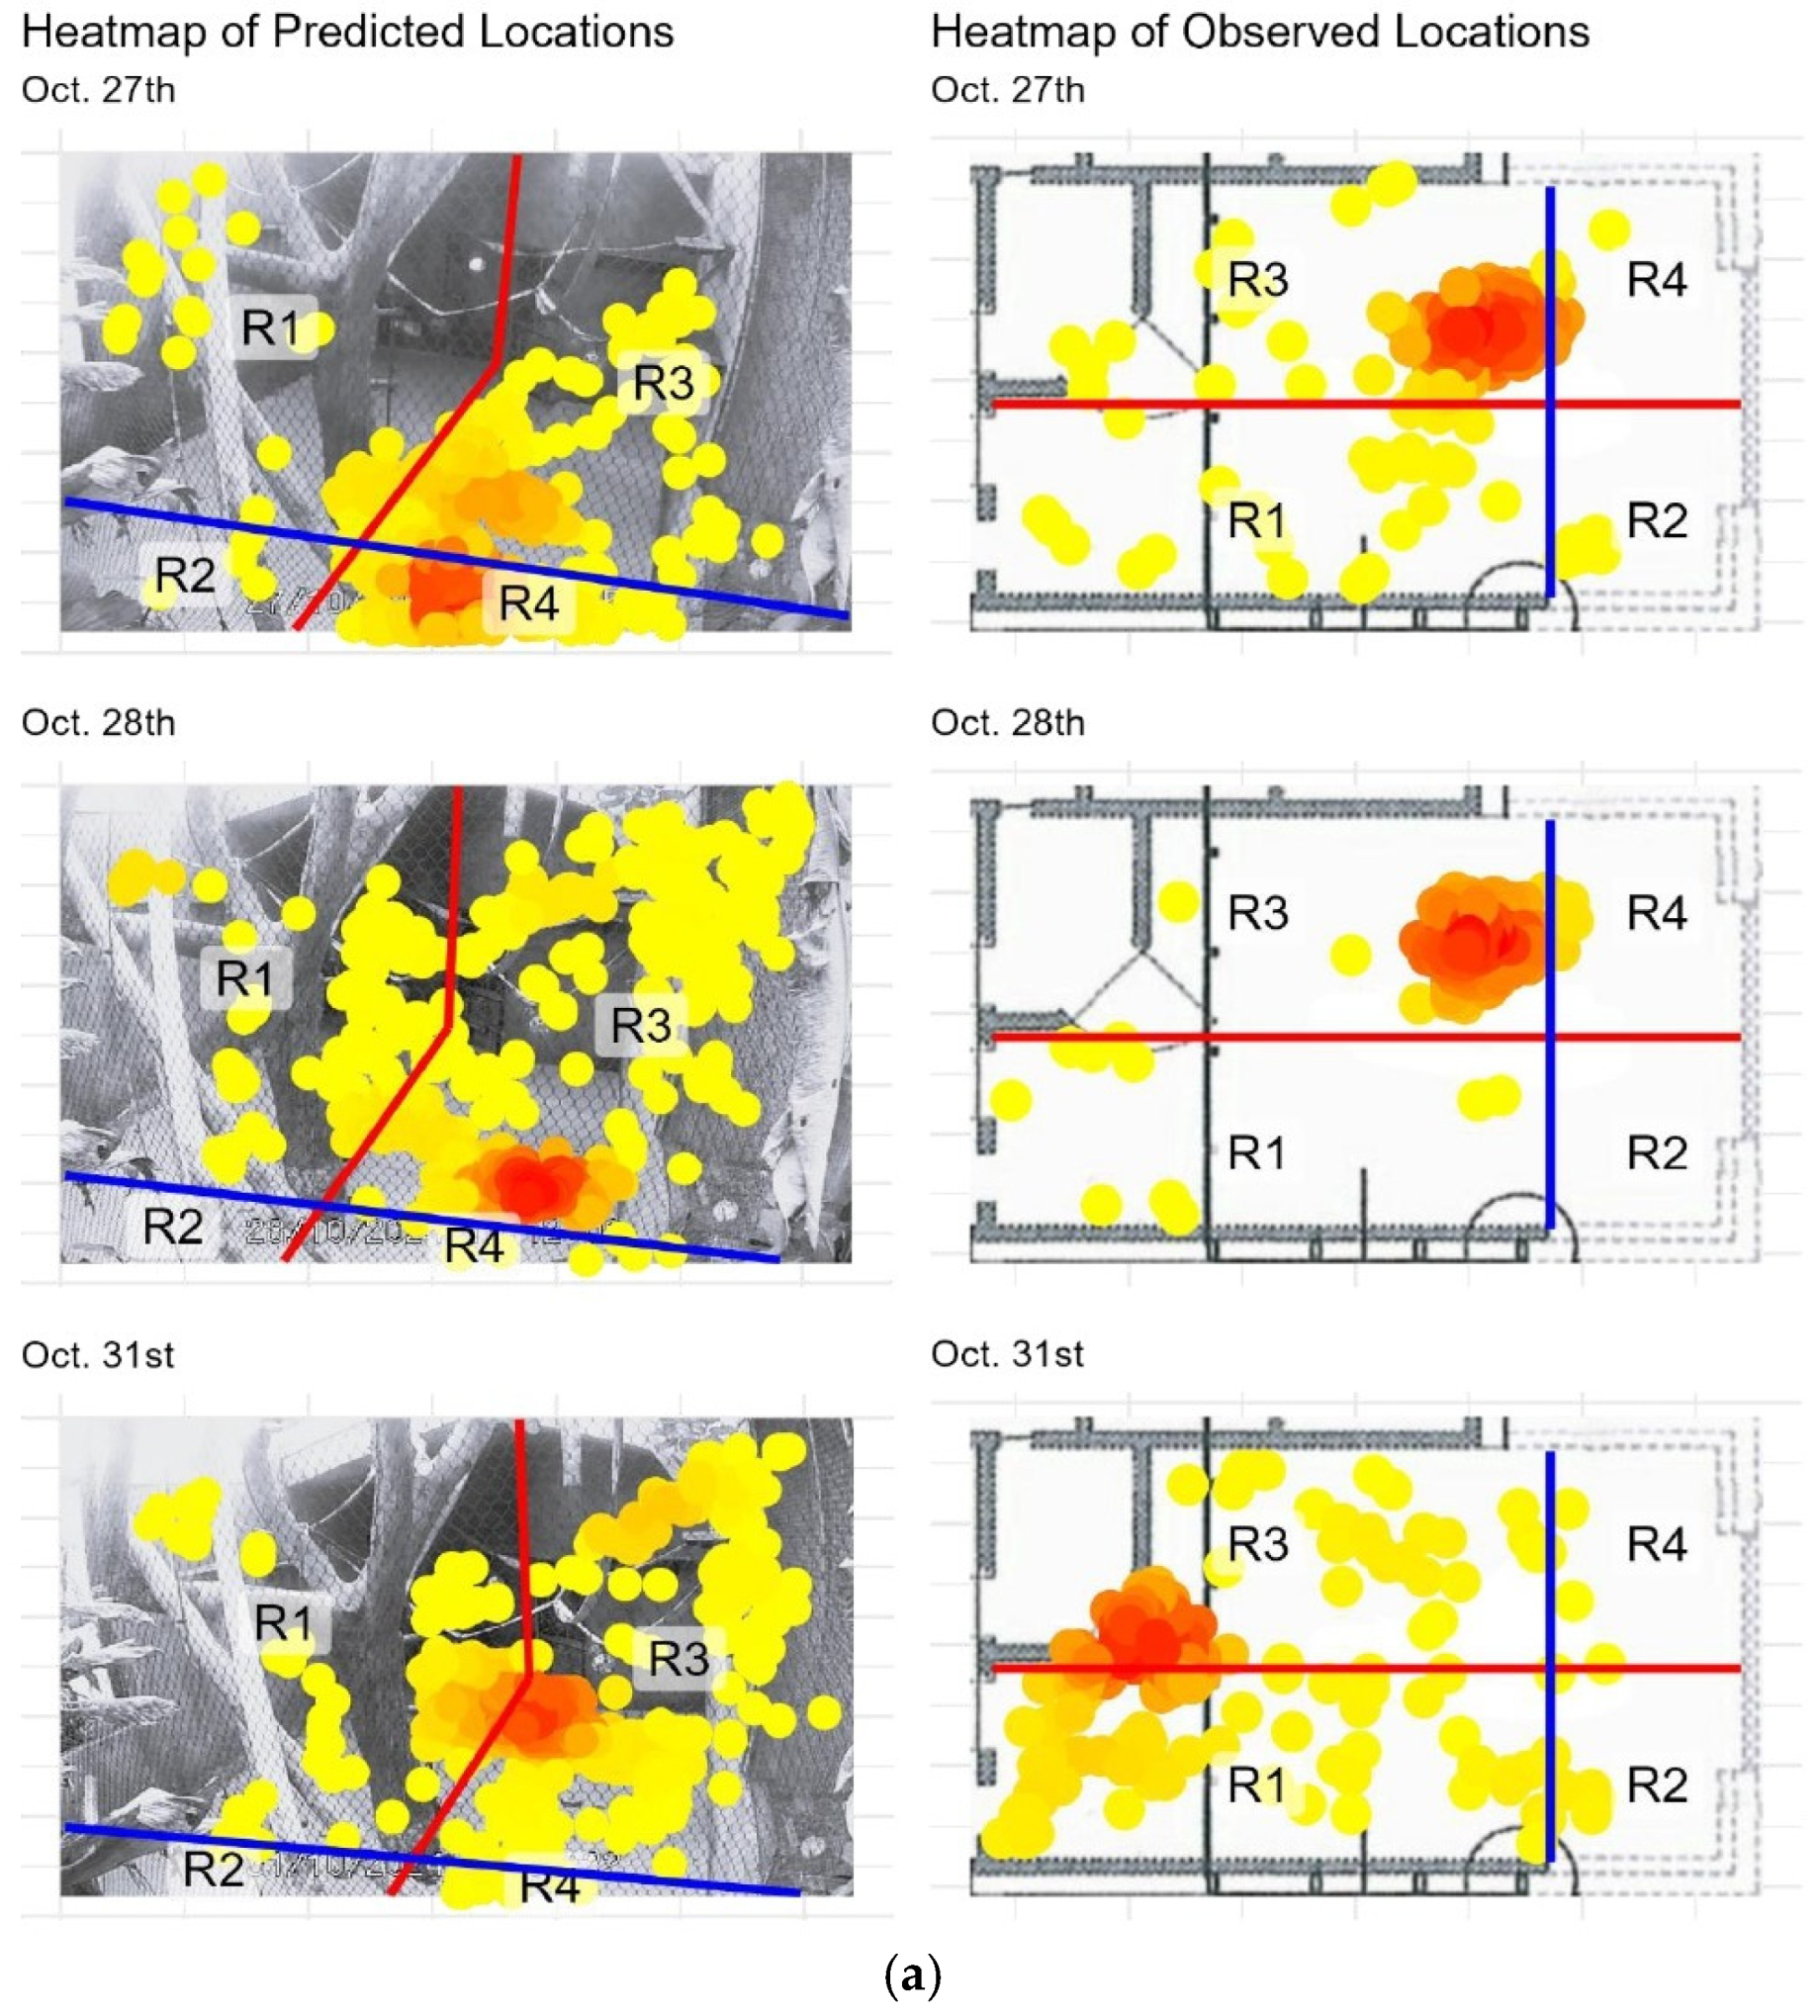
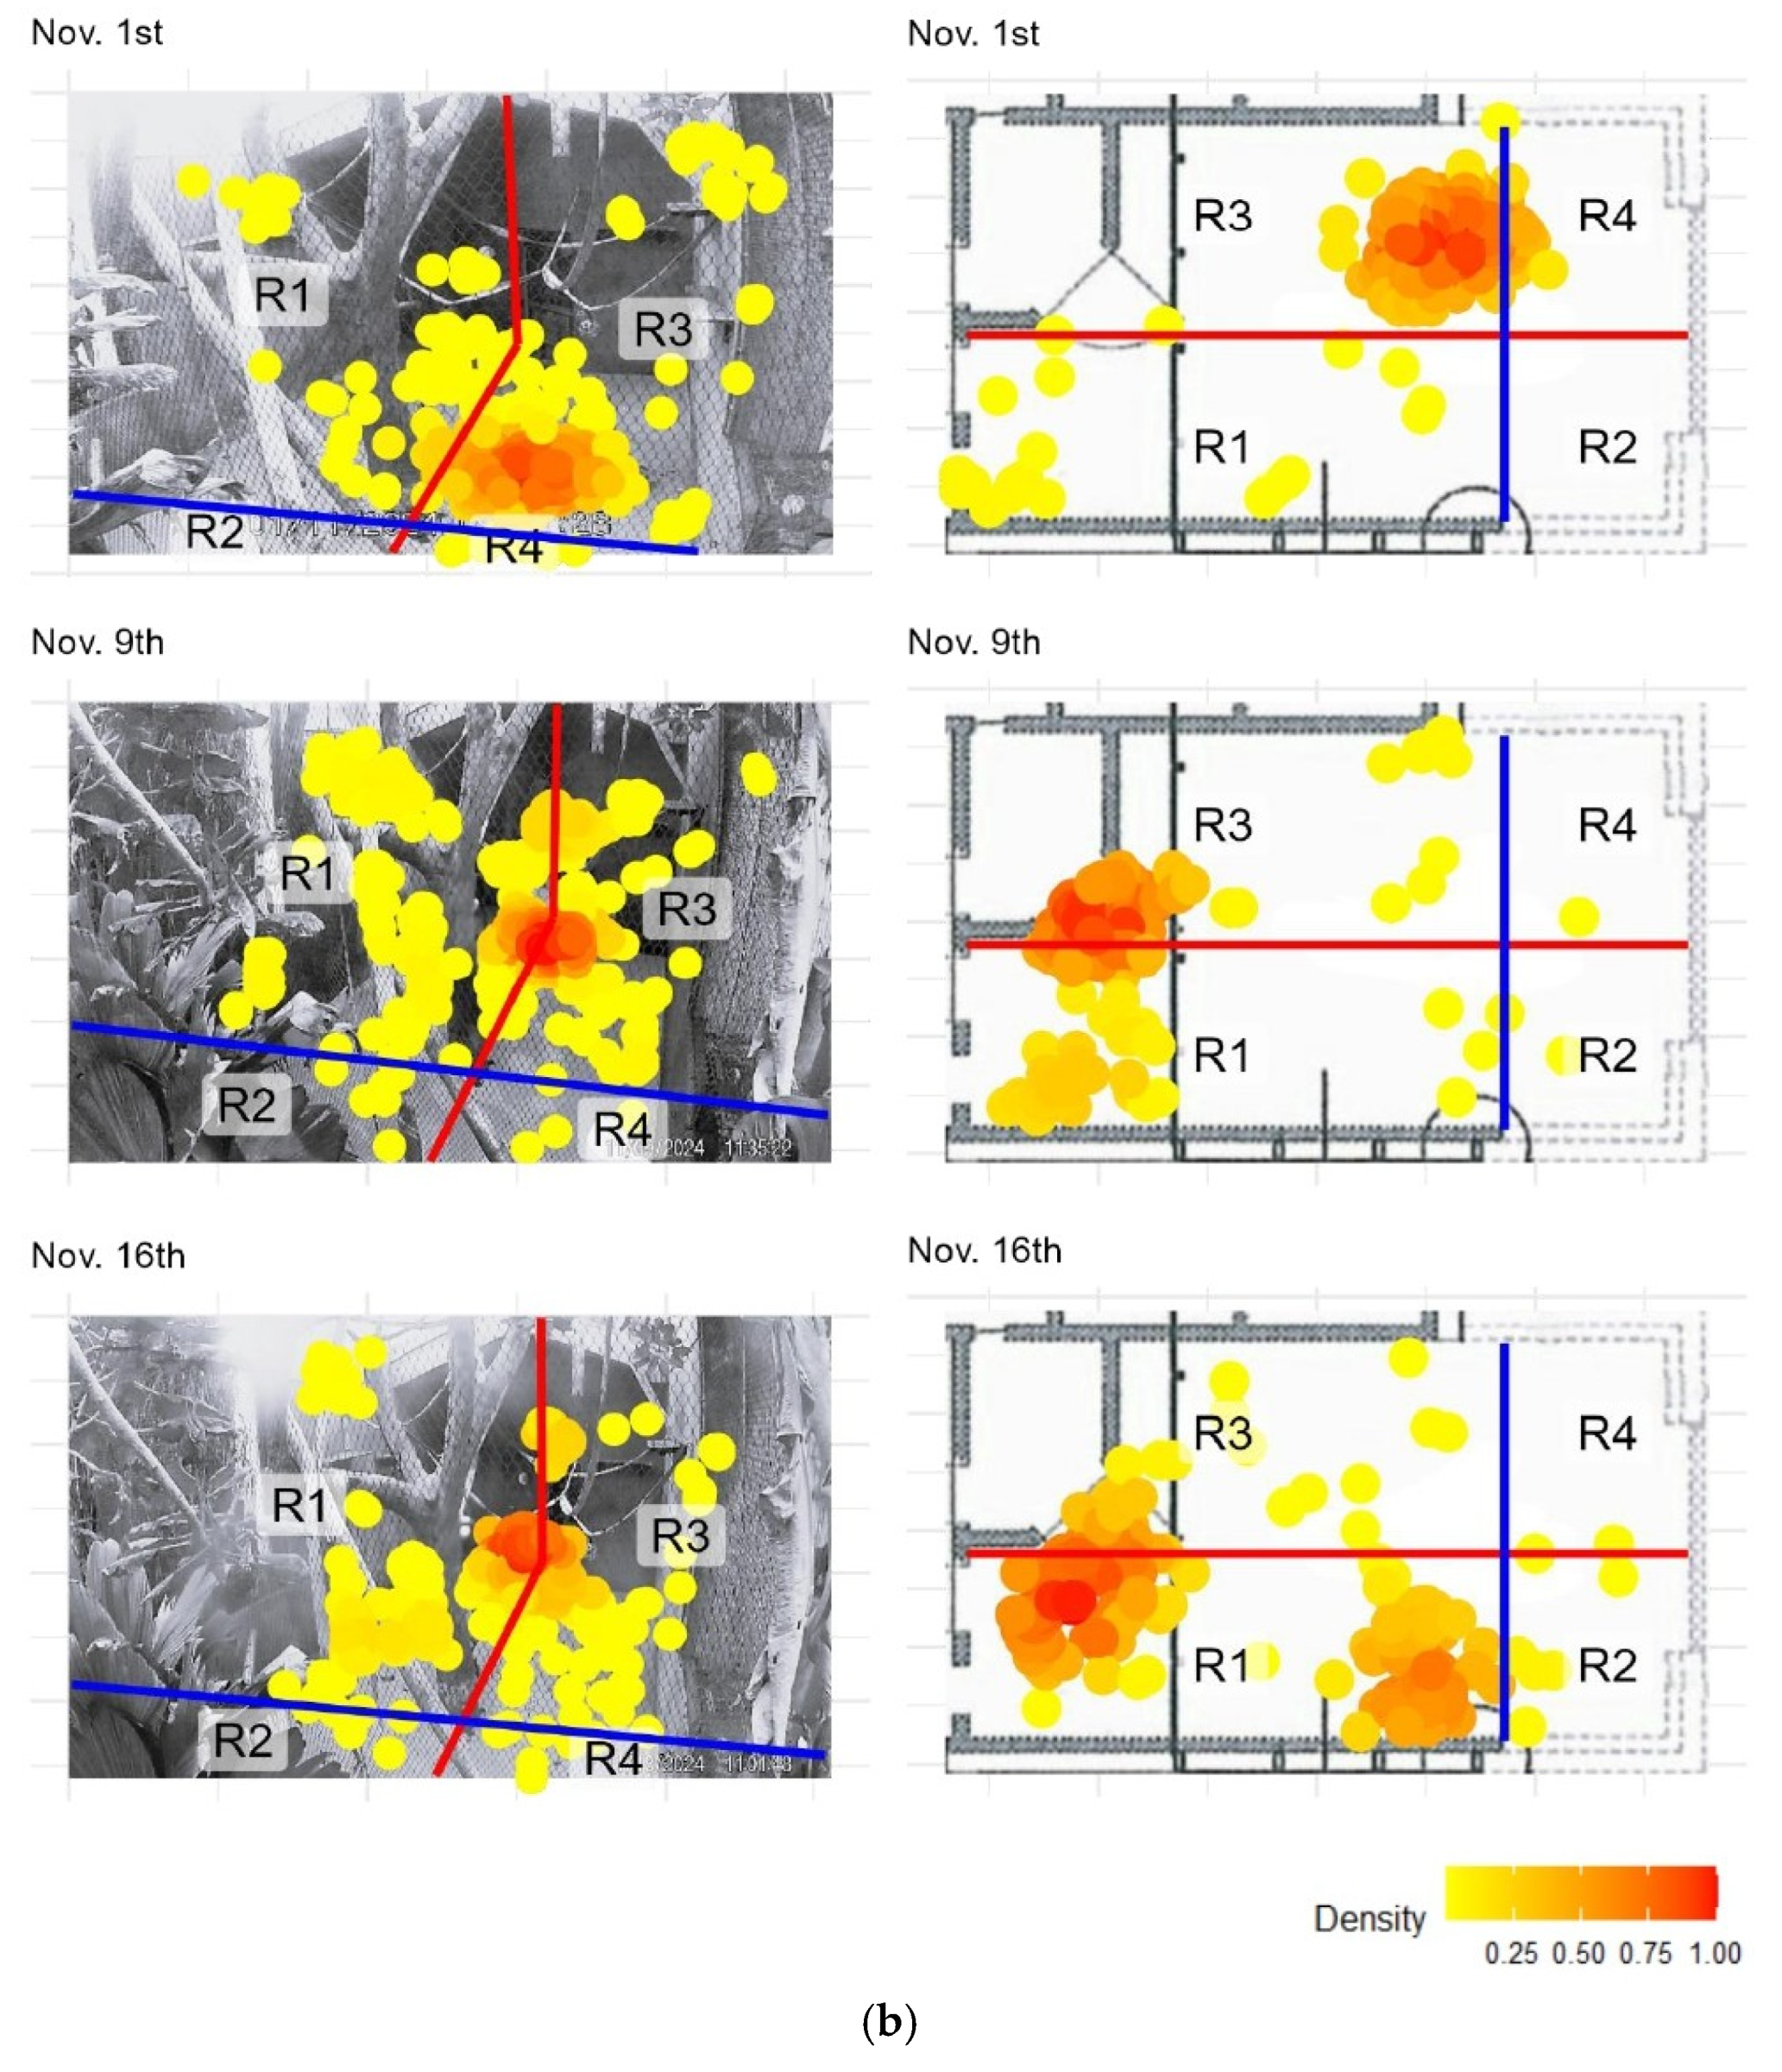
Figure 3.
Comparison of activity (seconds in movement) measured with ZooMonitor and SLEAP on 6 non-consecutive days. Bars show the sum of seconds where each spider monkey was in movement according to each method. The numbers on top of the bars indicate the observed value.
Figure 3.
Comparison of activity (seconds in movement) measured with ZooMonitor and SLEAP on 6 non-consecutive days. Bars show the sum of seconds where each spider monkey was in movement according to each method. The numbers on top of the bars indicate the observed value.
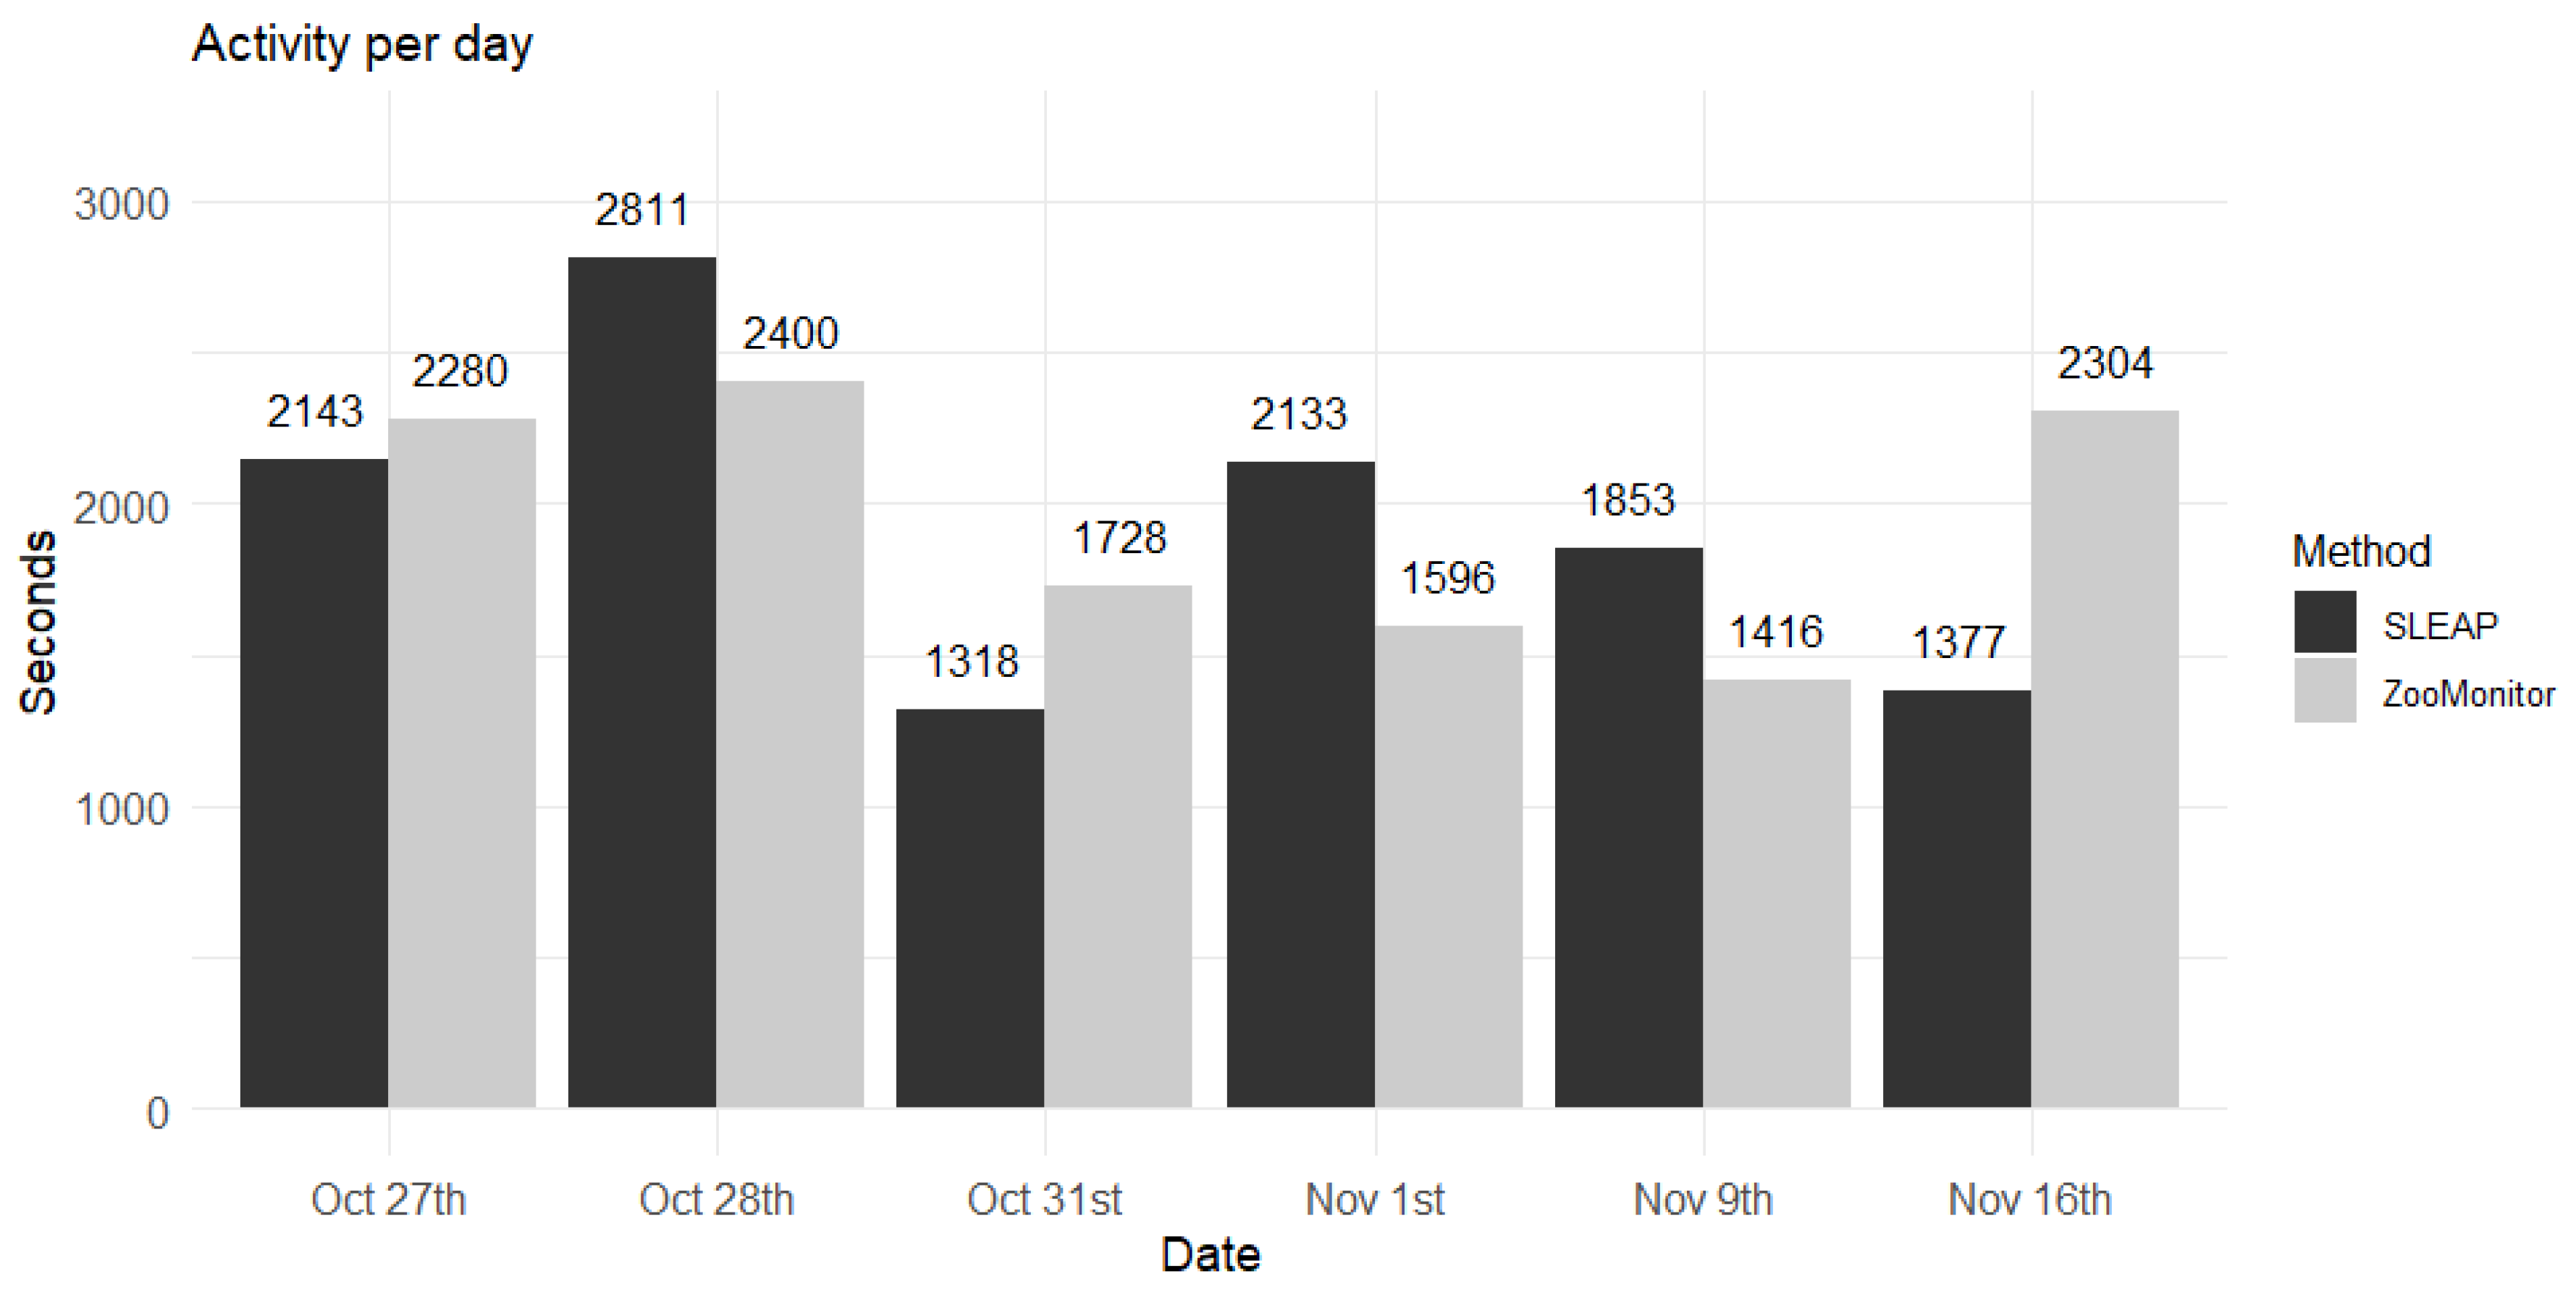
Table 1.
Percentage overlap and Pearson correlation (r) between observed locations recorded in ZooMonitor and model-predicted locations from SLEAP across observation dates.
Table 1.
Percentage overlap and Pearson correlation (r) between observed locations recorded in ZooMonitor and model-predicted locations from SLEAP across observation dates.
| Date | Overlap (%) | Pearson correlation (r) |
| Oct 27th | 44.75% | 0.24 |
| Oct 28th | 90.94% | 0.99 |
| Oct 31st | 82.78% | 0.93 |
| Nov 1st | 95.37% | 1.00 |
| Nov 9th | 99.00% | 1.00 |
| Nov 16th | 83.83% | 0.95 |
Disclaimer/Publisher’s Note: The statements, opinions and data contained in all publications are solely those of the individual author(s) and contributor(s) and not of MDPI and/or the editor(s). MDPI and/or the editor(s) disclaim responsibility for any injury to people or property resulting from any ideas, methods, instructions or products referred to in the content. |
© 2025 by the authors. Licensee MDPI, Basel, Switzerland. This article is an open access article distributed under the terms and conditions of the Creative Commons Attribution (CC BY) license (http://creativecommons.org/licenses/by/4.0/).
Copyright: This open access article is published under a Creative Commons CC BY 4.0 license, which permit the free download, distribution, and reuse, provided that the author and preprint are cited in any reuse.


