
Submitted:
10 September 2025
Posted:
11 September 2025
You are already at the latest version
Abstract
The vibration properties of materials play a role in their conduction of elec-tric charges. Relevant in this respect are also ionic conductors such as electrodes and solid electrolytes. The vibration properties are typically assessed with infrared and Raman spectroscopy, and inelastic neutron scattering, which all allow for the deriva-tion of the phonon density of states (PDOS) in part of full portion of the Brioullin zone. A novel method is nuclear resonant vibration spectroscopy (NRVS), which produces the element specific PDOS from Mössbauer active isotopes in a compound. We have employed NRVS operando on a pouch cell battery containing a Li57FePO4 electrode and thus could derive the PDOS of the 57Fe in the electrode during charging and discharg-ing. The spectra reveal reversible vibrational changes associated with the two-phase conversion between LiFePO₄ and FePO₄, as well as signatures of metastable intermedi-ate states. We demonstrate how the NRVS data can be used to tune the atomistic sim-ulations to accurately reconstruct the full vibration structures of the battery materials in operando conditions. Unlike optical techniques, NRVS provides bulk-sensitive, ele-ment-specific access to the full phonon spectrum under realistic operando conditions. These results establish NRVS as a powerful method to probe lattice dynamics in work-ing batteries and to advance the understanding of ion transport and phase transfor-mation mechanisms in electrode materials.
Keywords:
NRVS
; vibrational spectroscopy
; phonon DOS
; LiFePO4
; lithium ion battery
1. Introduction
Lithium iron phosphate (LFP) with olivine structure is one of the main cathode materials for lithium-ion batteries. One of the main advantages that make the olivine cathode an attractive material is the improved stability compared to the layered cathodes like nickel-manganese-cobalt oxides [1]. One of the drawbacks of olivine cathodes is the slower cycling rate, which is limited mostly by solid-state diffusion within the olivine structure. Lithium diffuses through 1-D channels framework in olivine structure, which is generally considered slower than 2-D diffusion in layered oxides.
The ionic diffusion in solids, especially in case of light ions, is a complex process where many parameters are involved. For example, it was proposed that some vibration modes of the lattice may propel the ionic transport by dynamically lowering the jump barrier. It was shown that low-energy phonons in olivine structure enhance lithium diffusion, allowing the higher cycling rate [2]. Generally, the lower phonon frequencies suggest softer lattice and enhanced ionic transport, so phonon density of states can be used as a predictor for ionic conductivity [3,4]. Therefore, understanding the vibration properties of the cathode material is crucial for understanding the solid-state mass transfer phenomena and for designing the materials for fast charging devices.
Study of vibration properties of battery materials, especially in operando conditions, is a complex task. The most convenient techniques like optical (Raman or IR) vibrational spectroscopy lack penetration depth, so they require notable modifications of the cell and material to make acquisition of the signal possible. Such modifications like holes in current collector or separator often lead to non-uniform current distribution and distorted signal [5]. Moreover, the carbon coating, that is common in LFP cathodes, was shown to block the Raman and IR signal from iron phosphate [6]. In addition, the information obtained from IR or Raman spectra gives only limited insights of the phonon structure, as it only shows some modes around gamma-point of Brillouin zone. Techniques like inelastic neutron scattering can be used to study the vibrational properties of active materials. It was demonstrated that the difference between surface and bulk phonons, measured with INS, allows us to get some insights on morphology of the active particles. Despite the great penetration depth of neutrons, the technique is not very well suited for operando conditions due to many components of the battery that obfuscate already complex signal.
Thanks to the presence of iron in the structure, LFP opens the possibility to use techniques based on nuclear resonance, like Mössbauer spectroscopy. Such techniques suit perfectly for operando experiments due to combination of signal penetration depth and element specificity, that guarantees that signal is coming exclusively from the cathode material. The nuclear resonance vibrational spectroscopy (NRVS) is a synchrotron-based technique that allows to study the vibrational density of states, projected on a Mössbauer-active element [7]. This technique was used to study the dynamics of active centers in biological systems [8], or the phonon structure of crystalline solids [9]. Here we for the first time demonstrate the operando study of the phonon structure of an active cathode material using NRVS technique during the cell cycling.
2. Materials and Methods
2.1. Synthesis
57Fe-enriched LFP was synthesized using the modified method from [10]. We need to mention here that 57Fe isotope is hardly available as salt or oxide. We were therefore required to develop our own synthesis route, illustrated in the flow diagram in Figure 1, based with available iron metal. As a source of 57Fe isotope, 57Fe -enriched metal foil (Neonest AB (BuyIsotope.com), SE-171 50 Solna, Sweden) was used, the isotope contents of which detailed in Table 1 and according to which the 57Fe content is larger than 96%.
3.5 ml of concentrated HNO3 were mixed with 2 ml of deionized water and 0.5g of 57Fe were dissolved in the nitric acid. After the complete dissolution, water was added to a total of ~9 ml of solution. Separately 0.63 g of P2O5 (Sigma-Aldrich) were slowly dissolved in 10 ml of water to obtain the H3PO4 solution. Then the H3PO4 solution was added dropwise to the iron nitride solution under intensive stirring. Then 5M NH4OH solution was added to the mixture under stirring and heating at 50°C until pH reached value of ~4, when thick gel-like sediment was formed. The mixture was left stirring for at least 12 hours, then filtered on Buchner vacuum funnel and washed with deionized water until neutral pH. Then the sediment was dried at 60°C, ground in a mortar and dried again at 120°C for 5 hours. This resulted in an amorphous FePO4·xH2O that does not show any Bragg reflections. A portion of amorphous FePO4·xH2O was annealed at 650°C for 1 hour to estimate the amount of water and measure Raman spectra of delithiated FP. After annealing the amorphous FP crystallizes and the sample demonstrates narrow XRD peaks, corresponding to the FePO4 crystal-line phase. The mass loss after annealing was 11% so the estimated amount of water in amorphous powder was x=1.
Stoichiometric amounts of amorphous FePO4·H2O and Li2CO3 (5% excess) with 8 wt.% of total mixture mass of glucose (final mass ratio: FePO4·H2O : Li2CO3 : glucose = 9.3 : 2.14 : 1) were mixed in a mortar with isopropanol and thoroughly ground, then dried at 60°C for 1 hour. Then the mixture was pressed in a pellet and sintered at 700°C for 4 hours resulting in black pellet. The sintered pellet was then crushed and ground in a mortar, resulting in Li FePO4 particles covered with carbon. The phase composition was validated with XRD, demonstrating LFP phase with small amount of impurities.
2.2. Pouch Cell Battery Assembly
The obtained powder was assembled to a battery positive electrode as follows. To prepare the slurries, LFP powder was mixed with polyvinylidene fluoride dissolved in N-Methyl-2-pyrrolidon (NMP) and carbon black (super C-65) in mass ratio 90:5:5 and mixed in a planetary mixer. The slurries were cast on Al foil with a doctor blade applicator, dried at 80°C in air, then pressed and vacuum-dried in the antechamber of the glovebox. The resulting active material mass loading was approximately 8 mg/cm2.
The cells were assembled in a glove box in argon (Ar) atmosphere. As a counter electrode graphite on Cu foil was used (active material loading ~12 mg/cm2). The electrodes were separated with Whatman glass-fiber separator, and approximately 800 µl of 1M LiPF6 solution in a mixture of ethylene carbonate : diethyl carbonate : dimethyl carbonate (1:1:1 mass) were added as electrolyte. Cells were assembled in a pouch case with a 7×14 mm window covered with Kapton tape. During the experiment the cell was clamped with an aluminum frame to ensure tight contact between the electrodes. The photo of the cell and the placement of the cell in the beamline are displayed in Figure 2.
2.3. Battery Charging and Discharging
The cell was cycled with IVIUM Vertex.100mA potentiostat at constant current at the rate of approx. C/30 (50 µA/cm2). After reaching the threshold potential of 4.2 V, the cell was held potentiostatically for ~1 hour at this potential and then discharged at the same rate.
2.4. Nuclear Resonant Vibration Spectroscopy
Nuclear resonance vibration spectroscopy was performed at beamline BL19LXU at Spring-8 in Hyogo, Japan [11,12]. The incident X-ray energy was set around 14.413 keV to excite the γ-transition of 57Fe [13]. The spectra were acquired in the range from approximately -42 to +65 meV from the elastic peak. Spectra were acquired continuously in operando mode, with each spectrum acquisition taking approximately 20 minutes. This means that the state of charge of the battery was not kept constant while the NRVS scans were in course. NRVS spectra were processed using "NRVS tool" from spectra.tools [14] PHOENIX software [15] to obtain the Fe-projected phonon density of states (PDOS).
We briefly explain how an NRVS spectrum is generated [7,14]. The battery cell containing 57Fe is scanned (this is not a scan over position, but a scan of the energy) with the X-ray beam energy in the aforementioned range covering the nuclear γ-transition at E1 = 14.413 keV of 57Fe with included vibrational levels. This results in nuclear back radiation of scattered energy E2 = hν1, comparable to the scheme on the left of Figure 1 in our previous publication [9]. There is also X-ray fluorescence from the K shell electrons of 57Fe by internal conversion with energy hν2. The X-ray intensities at hv1 and hv2 are recorded versus the vibration energy Evib = E1-E2 = 14.413 keV - hν1. The resulting spectrum is comparable with an optical Raman spectrum with elastic peak and Stokes and anti-Stokes shifted peaks. But it probes only the 57Fe.
2.5. Optical Raman Spectroscopy
Optical Raman spectra of the carbon-coated LFP powder, the LFP powder cast on Al foil and annealed FP powder were obtained using a Renishaw inVia Qontor spectrometer. The laser wavelength was 532 nm, with 10 s exposure time, 6% power (1.9 mW) and 5 accumulations. A representative spectrum is shown in Figure 8. For comparison, the Raman shifts of LFP and FP agree well with the characteristic peaks documented and explained in the publications by Wu et al. [16] and Zhang et al. [17], respectively.
2.6. Calculation of Total and Partial Vibrational Density of States (PVDOS)
Phonon properties were simulated using a deep-learning atomistic model MatterSim [18]. To obtain the Fe-projected phonon density of states (PDOS), the structures were relaxed, and the phonon structure was calculated using finite displacement method using PHONOPY code [19,20] with applied non-analytical term correction (NAC). The dielectric constant and Born effective charges for the NAC were calculated using Quantum ESPRESSO package [21,22,23]. To compare with the experimental phonon DOS, the gaussian broadening was applied to the calculated phonon DOS with the width derived from the elastic peak in the experimental spectra, which was taken as a resolution function.
3. Results and Discussion
3.1. Crystallographic Structure
The X-ray diffractograms of the pristine LFP material show in Figure 3 that the samples are phase-pure LFP.
Rietveld refinement shows a slight, ~10% deficiency in lithium positions, which may be associated with lithium sublimation during the annealing [24] despite the excess of lithium carbonate. It is therefore plausible that the cells demonstrate a slightly lower total capacity (~135 mAh/g) is slightly lower than the usually observed values. The occupancy of all sites was determined by Rietveld refinement and is listed in Table 2.
Figure 4, a shows the electrochemical cycling curve (voltage profile) of the cell, the corresponding NRVS operando spectra and the derived Fe-projected partial vibrational DOS (PVDOS). The cycling curve shows a slight slope in the beginning of charging and a sharp voltage drop on discharge before the end of charge. We speculate that this observation might come from moisture from the outside, which may have leaked into the cell through the Kapton window, which is known to be permeable for water [25,26,27,28]. Nevertheless, the NRVS spectra show the reversible behavior with the changes still happening after the voltage drop at ~35 hours. This indicates that the lithiation of LFP continues, which can be explained by extraction of lithium from the electrolyte due to water-related loss of lithium inventory.
The NRVS spectra show reversible changes upon lithiation and delithiation, which correspond to the two-phase conversion:
LiFePO4 → Li+ + FePO4 + e-
Figure 4, c displays the Fe-projected PVDOS, obtained from the NRVS spectra. The phonon DOS clearly demonstrates the decrease of the peaks at ~15 and 20 meV and appearance of peaks at ~29 and 35-45 meV upon delithiation. We used the PVDOS in the initial state and the PVDOS obtained at the end of charging as the basis components and fitted all the intermediate PVDOS with a linear combination of the two basis components. The coefficients as a function of time and charge are shown in Figure 5. The linear relation between charge and the fraction of components indicates that all the intermediate spectra are at large composed of two phases that represent fully lithiated and delithiated states, which are LiFePO4 and FePO4. Figure 5,d shows the residuals of the least square fit, obtained by equation:
where Si, Sinit and Sf are i-th PVDOS, initial PVDOS in fully lithiated state, and the final PVDOS in the fully charged state, respectively, a1 and a2 are the coefficients shown in Figure 5, a and b. The residuals show a systematic pattern for intermediate states (Figure 5, d). The pattern looks symmetrical for the charge and discharge half-cycles, what indicates that it does not originate from the change of the state during the spectrum acquisition but is an indicator of presence of more phases [18] than just FP and LFP. It was previously reported that the conversion from LFP to FP goes via the metastable intermediate phase [29,30], which was detected with NRVS. At a certain state of charge the notable change of the pattern can be observed: for example, the peak at ~16 meV disappears, and the peak at 20 meV appears. We cannot rule out, based on the observed reversible change of the pattern, more than one intermediate phase. Confirmation of such scenario would require further study.
Figure 6 displays the comparison between the experimental Fe PVDOS in fully charged and fully discharged states and calculated PVDOS of FP and LFP. While for the FP phase the perfect agreement between the experimental and calculated data was achieved immediately, for the LFP the best fit was achieved by stretching the energy scale of calculated data by a factor of 1.064. Application of such scaling is usual for the simulated vibrational spectra [31] and is justified by the semi-empirical nature of DFT (the choice of exchange-correlation functional and Hubbard U parameters). This way, NRVS here was used to tune the model to the experimental data. Such tuning is additionally verified by the good fitting of the experimental Raman spectrum, as shown in Figure 5. For example, the highest peak at ~118 meV, which corresponds to the vibrations of PO4 tetrahedra and is not directly related to Fe atoms, is also precisely reproduced by the simulation, fitted to experimental NRVS.
Our experimental PVDOS lends empirical confirmation to our calculations and support also those DFT calculations, which are reported in the literature [32]. The MatterSim [18] force field was shown to simulate the phonon properties with level of accuracy close to that of DFT [33], giving confidence in the simulation results. This way, the NRVS data can serve to tune the calculation parameters and validate the calculated vibration structure.
The calculated PVDOS of FP reproduces the experimental one with great accuracy, reproducing all the observed features. The PVDOS of LFP, however, shows slight deviation between the experiment and calculations, with a peak at ~17 meV not reproduced by calculations. This may be attributed to the presence of Li vacancies in the initial state, which is not fully lithiated, which may introduce additional features to the phonon structure. The same phenomenon led to the systematic error, shown in Figure 3, d, which is presumably produced by the presence of the third intermediate phase, which may have some ordered Li vacancies, and whose phonon spectrum cannot be described as a linear combination of the fully lithiated and fully delithiated phases.
Figure 5 shows the experimental optical Raman spectrum of LFP and the NRVS-derived PVDOS in comparison with the calculated phonon structure. The Raman spectrum agrees with the reported in literature in situ [16,34] or ex situ [17] spectra. For the orientation of the reader: the prominent peak at below 120 meV corresponds to the symmetric stretch vibration of the phosphate cage PO34- with ν1≈950 eV. Due to the experimental constrains, the in situ Raman spectra reported in the literature only allows to observe the highest peak at ~950 cm-1 (= 118 meV) that corresponds to the relatively flat band, associated with PO4 tetrahedra vibrations with Ag symmetry. The two smaller peaks at 123 meV and 132 meV are the asymmetric stretch of the same structure. The vibrations of PO4 octahedra obviously are sensitive to the presence of lithium in the crystal structure, allowing to monitor the lithium content in the material.
The vibrations associated with Fe all have lower energy and are confined below ~50 meV (≈400 cm-1, this is around the two well developed peaks at 22 and 35 meV, corresponding to 220 and 290 cm-1 with translation or Fe and coupled translation and vibration of the phosphate cage), so the operando NRVS focuses on the different regions of the vibration structure. Wu et al. find this region interesting because of the prominent differences between lithiated and non-lithiated material [16]. It was shown that vibrations in this region may indicate differences in microstructure [32]; in addition, our results show that they also allow to monitor the lithium content, and to study the superstructure, formed in the intermediate phase, as shown above.
While the Fe vibrations are not directly affected by the presence of lithium, they have strong overlap with the vibrations of oxygen and phosphorus, as shown in Figure 7. Upon delithiation the vibrations of Fe shift to the higher energies (Figure 3) same way as the Raman peaks [16,34] due to lattice contraction and stiffening of Fe-O bonds.
Compared to the other vibrational spectroscopy techniques, NRVS gives valuable insights into the phonon structure of the material. It allows to perform operando measurements with high temporal resolution. The acquisition of a single spectrum in our experiments took approx. 20 minutes, providing decent statistics to reconstruct the PVDOS with sufficient accuracy. It also does not require substantially large amounts of material and provides the component specificity (i.e., it focuses on the signal from the active material), in contrast, for example, to the inelastic neutron scattering. In addition, it provides higher energy resolution, than usually available for inelastic neutron scattering [35]. Another significant advantage is that it allows for measuring the realistic cell with minimal modifications to allow the operando measurement thanks to high penetration depth of high-energy X-rays.
Conclusions
We have described the experiment to measure the vibrational properties of the active electrode material of Li-ion battery with NRVS technique. We have demonstrated that this technique is a powerful tool and is very well suited for operando setup, compared to other vibrational spectroscopy techniques.
It was previously shown that vibrational spectroscopy allows to detect phenomena associated with the microstructure of the material. By combining the prior structural knowledge with the experimental vibrational data, computational simulations allow us to precisely reconstruct the vibrational structure, which allows not only to derive the various thermodynamical properties, but also to get insights into the atomic structure or microstructure of the material.
Author Contributions
Conceptualization, A.B. and A.R.; methodology, A.B., S.P.C., and H.W; validation, A.R., Y.Y., A.B, Q.C.; formal analysis, A.R., A.B., H.L.; investigation, A.B. and A.R.; resources, N.H., Y.Y., Q.C. H.L.; writing—original draft preparation, A.R., A.B; writing—review and editing, A.R. A.B.; visualization, A.R., H.L.; supervision, A.B.; project administration, A.B.; funding acquisition, A.B. All authors have read and agreed to the published version of the manuscript.
Funding
This work was funded by the European Commission Green Deal program as Euramet metrology projects 21GRD01 and 24GRD09 via Swiss State Secretariat of Education and Research Übergangsmassnahmen Horizon-Paket 2021-2027 Kredit A231.0435, Contract number 22.00459. S.P.C. acknowledges financial support by project US NIH GM65440. The NRVS synchrotron radiation experiments were performed at BL19LXU of SPring-8 with the approval of the Japan Synchrotron Radiation Research Institute (JASRI) (Proposal No 2024B1461). NRVS raw data treatment was performed under the XSIM project on the CORI computing system at NERSC, a U.S. Department of Energy Office of Science User Facility operated under Contract No. DE-AC02-05CH11231. We are grateful to Georg Spescha for information on water permeability on polyimide, and Corsin Battaglia and Edouard Querel (all Empa) for providing the hardware for electrode coating hardware and cell assembly.
Data Availability Statement
The data can be obtained upon personal request by contacting Artur Braun and Alexey Rulev.
Acknowledgments
We are grateful to Leland B. Gee (SSRL SLAC, Stanford) for support with the conversion software for NRVS raw spectra
Conflicts of Interest
The authors declare no conflicts of interest.
Abbreviations
The following abbreviations are used in this manuscript:
| PDOS | Phonon Density of States |
| NRVS | Nuclear Resonant Vibration Spectroscopy |
| LFP | Lithium Iron Phosphate |
| IR | Infra-Red |
| FP | Iron Phosphate |
| XRD | X-ray Diffraction |
| NMP | N-Methyl-2-pyrrolidon |
| DOS | Density of States |
| PVDOS | Partial Vibrational Density of States |
| NAC | non-analytical term correction |
References
- Evro, S.; Ajumobi, A.; Mayon, D.; Tomomewo, O.S. Navigating battery choices: A comparative study of lithium iron phosphate and nickel manganese cobalt battery technologies. Future Batteries 2024, 4. [Google Scholar] [CrossRef]
- Oh, H.; Noh, C.; Cho, A.Y.; Kim, J.C.; Kim, N.; Kim, K.H. Enhancing 1D ionic conductivity in lithium manganese iron phosphate with low-energy optical phonons. Sci Rep 2025, 15, 28421. [Google Scholar] [CrossRef]
- Sagotra, A.K.; Chu, D.; Cazorla, C. Influence of lattice dynamics on lithium-ion conductivity: A first-principles study. Physical Review Materials 2019, 3. [Google Scholar] [CrossRef]
- Muy, S.; Schlem, R.; Shao-Horn, Y.; Zeier, W.G. Phonon–Ion Interactions: Designing Ion Mobility Based on Lattice Dynamics. Advanced Energy Materials 2020, 11. [Google Scholar] [CrossRef]
- Rosser, T.E.; Dickinson, E.J.F.; Raccichini, R.; Hunter, K.; Searle, A.D.; Kavanagh, C.M.; Curran, P.J.; Hinds, G.; Park, J.; Wain, A.J. Improved Operando Raman Cell Configuration for Commercially-Sourced Electrodes in Alkali-Ion Batteries. Journal of The Electrochemical Society 2021, 168. [Google Scholar] [CrossRef]
- Zaghib, K.; Mauger, A.; Goodenough, J.B.; Julien, C.M. Design and Properties of LiFePO4 Nano-materials for High-Power Applications. In Nanotechnology for Lithium-Ion Batteries; Nanostructure Science and Technology; 2012; pp. 179-220.
- Wang, H.; Braun, A.; Cramer, S.P.; Gee, L.B.; Yoda, Y. Nuclear Resonance Vibrational Spectroscopy: A Modern Tool to Pinpoint Site-Specific Cooperative Processes. Catalysts 2021, 11. [Google Scholar] [CrossRef]
- Xiao, Y.M.; Fisher, K.; Smith, M.C.; Newton, W.E.; Case, D.A.; George, S.J.; Wang, H.X.; Sturhahn, W.; Alp, E.E.; Zhao, J.Y.; et al. How nitrogenase shakes - Initial information about P-cluster and FeMo-cofactor normal modes from nuclear resonance vibrational Spectroscopy (NRVS). Journal of the American Chemical Society 2006, 128, 7608–7612. [Google Scholar] [CrossRef]
- Rulev, A.; Wang, H.; Erat, S.; Aycibin, M.; Rentsch, D.; Pomjakushin, V.; Cramer, S.P.; Chen, Q.; Nagasawa, N.; Yoda, Y.; et al. 119Sn Element-Specific Phonon Density of States of BaSnO3. Crystals 2025, 15. [Google Scholar] [CrossRef]
- Zhu, Y.; Tang, S.; Shi, H.; Hu, H. Synthesis of FePO4·xH2O for fabricating submicrometer structured LiFePO4/C by a co-precipitation method. Ceramics International 2014, 40, 2685–2690. [Google Scholar] [CrossRef]
- Baron, A.Q.R.; Tanaka, Y.; Miwa, D.; Ishikawa, D.; Mochizuki, T.; Takeshita, K.; Goto, S.; Matsushita, T.; Kimura, H.; Yamamoto, F.; et al. Early commissioning of the SPring-8 beamline for high resolution inelastic X-ray scattering. Nuclear Instruments and Methods in Physics Research Section A: Accelerators, Spectrometers, Detectors and Associated Equipment 2001, 467-468, 627–630. [Google Scholar] [CrossRef]
- Yoda, Y. X-ray beam properties available at the nuclear resonant scattering beamline at SPring-8. Hyperfine Interactions 2019, 240. [Google Scholar] [CrossRef]
- Sprouse, G.D.; Hanna, S.S. Gamma ray transitions in 57Fe. Nuclear Physics 1965, 74, 177–183. [Google Scholar] [CrossRef]
- Gee, L.B.; Wang, H.; Cramer, S.P. NRVS for Fe in Biology: Experiment and Basic Interpretation. Methods Enzymol. 2018, 599, 409–425. [Google Scholar] [CrossRef]
- Sturhahn, W. CONUSS and PHOENIX: Evaluation of nuclear resonant scattering data. Hyperfine Interactions 2000, 125, 149–172. [Google Scholar] [CrossRef]
- Wu, J.; Dathar, G.K.; Sun, C.; Theivanayagam, M.G.; Applestone, D.; Dylla, A.G.; Manthiram, A.; Henkelman, G.; Goodenough, J.B.; Stevenson, K.J. In situ Raman spectroscopy of LiFePO4: size and morphology dependence during charge and self-discharge. Nanotechnology 2013, 24, 424009. [Google Scholar] [CrossRef]
- Zhang, L.; Brow, R.K. A Raman Study of Iron–Phosphate Crystalline Compounds and Glasses. Journal of the American Ceramic Society 2011, 94, 3123–3130. [Google Scholar] [CrossRef]
- Yang, H.; Hu, C.; Zhou, Y.; Liu, X.; Shi, Y.; Li, J.; Li, G.; Chen, Z.; Chen, S.; Zeni, C.; et al. MatterSim: A Deep Learning Atomistic Model Across Elements, Temperatures and Pressures. 2024; arXiv:2405.04967. [Google Scholar] [CrossRef]
- Togo, A. First-principles Phonon Calculations with Phonopy and Phono3py. Journal of the Physical Society of Japan 2023, 92. [Google Scholar] [CrossRef]
- Togo, A.; Chaput, L.; Tadano, T.; Tanaka, I. Implementation strategies in phonopy and phono3py. J Phys Condens Matter 2023, 35. [Google Scholar] [CrossRef] [PubMed]
- Giannozzi, P.; Baroni, S.; Bonini, N.; Calandra, M.; Car, R.; Cavazzoni, C.; Ceresoli, D.; Chiarotti, G.L.; Cococcioni, M.; Dabo, I.; et al. QUANTUM ESPRESSO: a modular and open-source software project for quantum simulations of materials. J Phys Condens Matter 2009, 21, 395502. [Google Scholar] [CrossRef] [PubMed]
- Giannozzi, P.; Andreussi, O.; Brumme, T.; Bunau, O.; Buongiorno Nardelli, M.; Calandra, M.; Car, R.; Cavazzoni, C.; Ceresoli, D.; Cococcioni, M.; et al. Advanced capabilities for materials modelling with Quantum ESPRESSO. J Phys Condens Matter 2017, 29, 465901. [Google Scholar] [CrossRef]
- Giannozzi, P.; Baseggio, O.; Bonfa, P.; Brunato, D.; Car, R.; Carnimeo, I.; Cavazzoni, C.; de Gironcoli, S.; Delugas, P.; Ferrari Ruffino, F.; et al. Quantum ESPRESSO toward the exascale. J Chem Phys 2020, 152, 154105. [Google Scholar] [CrossRef]
- Halankar, K.K.; Mandal, B.P.; Jangid, M.K.; Mukhopadhyay, A.; Meena, S.S.; Acharya, R.; Tyagi, A.K. Optimization of lithium content in LiFePO(4) for superior electrochemical performance: the role of impurities. RSC Adv 2018, 8, 1140–1147. [Google Scholar] [CrossRef]
- Chen, G.Q.; Scholes, C.A.; Qiao, G.G.; Kentish, S.E. Water vapor permeation in polyimide membranes. Journal of Membrane Science 2011, 379, 479–487. [Google Scholar] [CrossRef]
- GmbH, C.K. Water vapor permeability of various plastic films. Available online: https://www.cmc.de/en/blog/know-how-5/water-vapor-permeability-of-various-plastic-films-181 (accessed on 12 August 2025).
- Su, L.; Choi, P.; Parimalam, B.S.; Litster, S.; Reeja-Jayan, B. Designing reliable electrochemical cells for operando lithium-ion battery study. MethodsX 2021, 8, 101562. [Google Scholar] [CrossRef]
- Bak, S.-M.; Shadike, Z.; Lin, R.; Yu, X.; Yang, X.-Q. In situ/operando synchrotron-based X-ray techniques for lithium-ion battery research. NPG Asia Materials 2018, 10, 563–580. [Google Scholar] [CrossRef]
- Nishimura, S.; Natsui, R.; Yamada, A. Superstructure in the Metastable Intermediate-Phase Li2/3 FePO4 Accelerating the Lithium Battery Cathode Reaction. Angew Chem Int Ed Engl 2015, 54, 8939–8942. [Google Scholar] [CrossRef] [PubMed]
- Orikasa, Y.; Maeda, T.; Koyama, Y.; Murayama, H.; Fukuda, K.; Tanida, H.; Arai, H.; Matsubara, E.; Uchimoto, Y.; Ogumi, Z. Direct observation of a metastable crystal phase of Li(x)FePO4 under electrochemical phase transition. J Am Chem Soc 2013, 135, 5497–5500. [Google Scholar] [CrossRef]
- Merrick, J.P.; Moran, D.; Radom, L. An evaluation of harmonic vibrational frequency scale factors. J Phys Chem A 2007, 111, 11683–11700. [Google Scholar] [CrossRef] [PubMed]
- Benedek, P.; Yazdani, N.; Chen, H.R.; Wenzler, N.; Juranyi, F.; Månsson, M.; Islam, M.S.; Wood, V.C. Surface phonons of lithium ion battery active materials. Sustainable Energy & Fuels 2019, 3, 508–513. [Google Scholar] [CrossRef]
- Loew, A.; Sun, D.; Wang, H.-C.; Botti, S.; Marques, M.A.L. Universal machine learning interatomic potentials are ready for phonons. npj Computational Materials 2025, 11. [Google Scholar] [CrossRef]
- Siddique, N.A.; Salehi, A.; Wei, Z.; Liu, D.; Sajjad, S.D.; Liu, F. Length-Scale-Dependent Phase Transformation of LiFePO4 : An In situ and Operando Study Using Micro-Raman Spectroscopy and XRD. Chemphyschem 2015, 16, 2383–2388. [Google Scholar] [CrossRef] [PubMed]
- Muy, S.; Bachman, J.C.; Giordano, L.; Chang, H.-H.; Abernathy, D.L.; Bansal, D.; Delaire, O.; Hori, S.; Kanno, R.; Maglia, F.; et al. Tuning mobility and stability of lithium ion conductors based on lattice dynamics. Energy & Environmental Science 2018, 11, 850–859. [Google Scholar] [CrossRef]
Figure 1.
Flow diagram for our synthesis of iron phosphate and lithium iron phosphate with 57Fe isotope metal sheet as raw material.
Figure 1.
Flow diagram for our synthesis of iron phosphate and lithium iron phosphate with 57Fe isotope metal sheet as raw material.
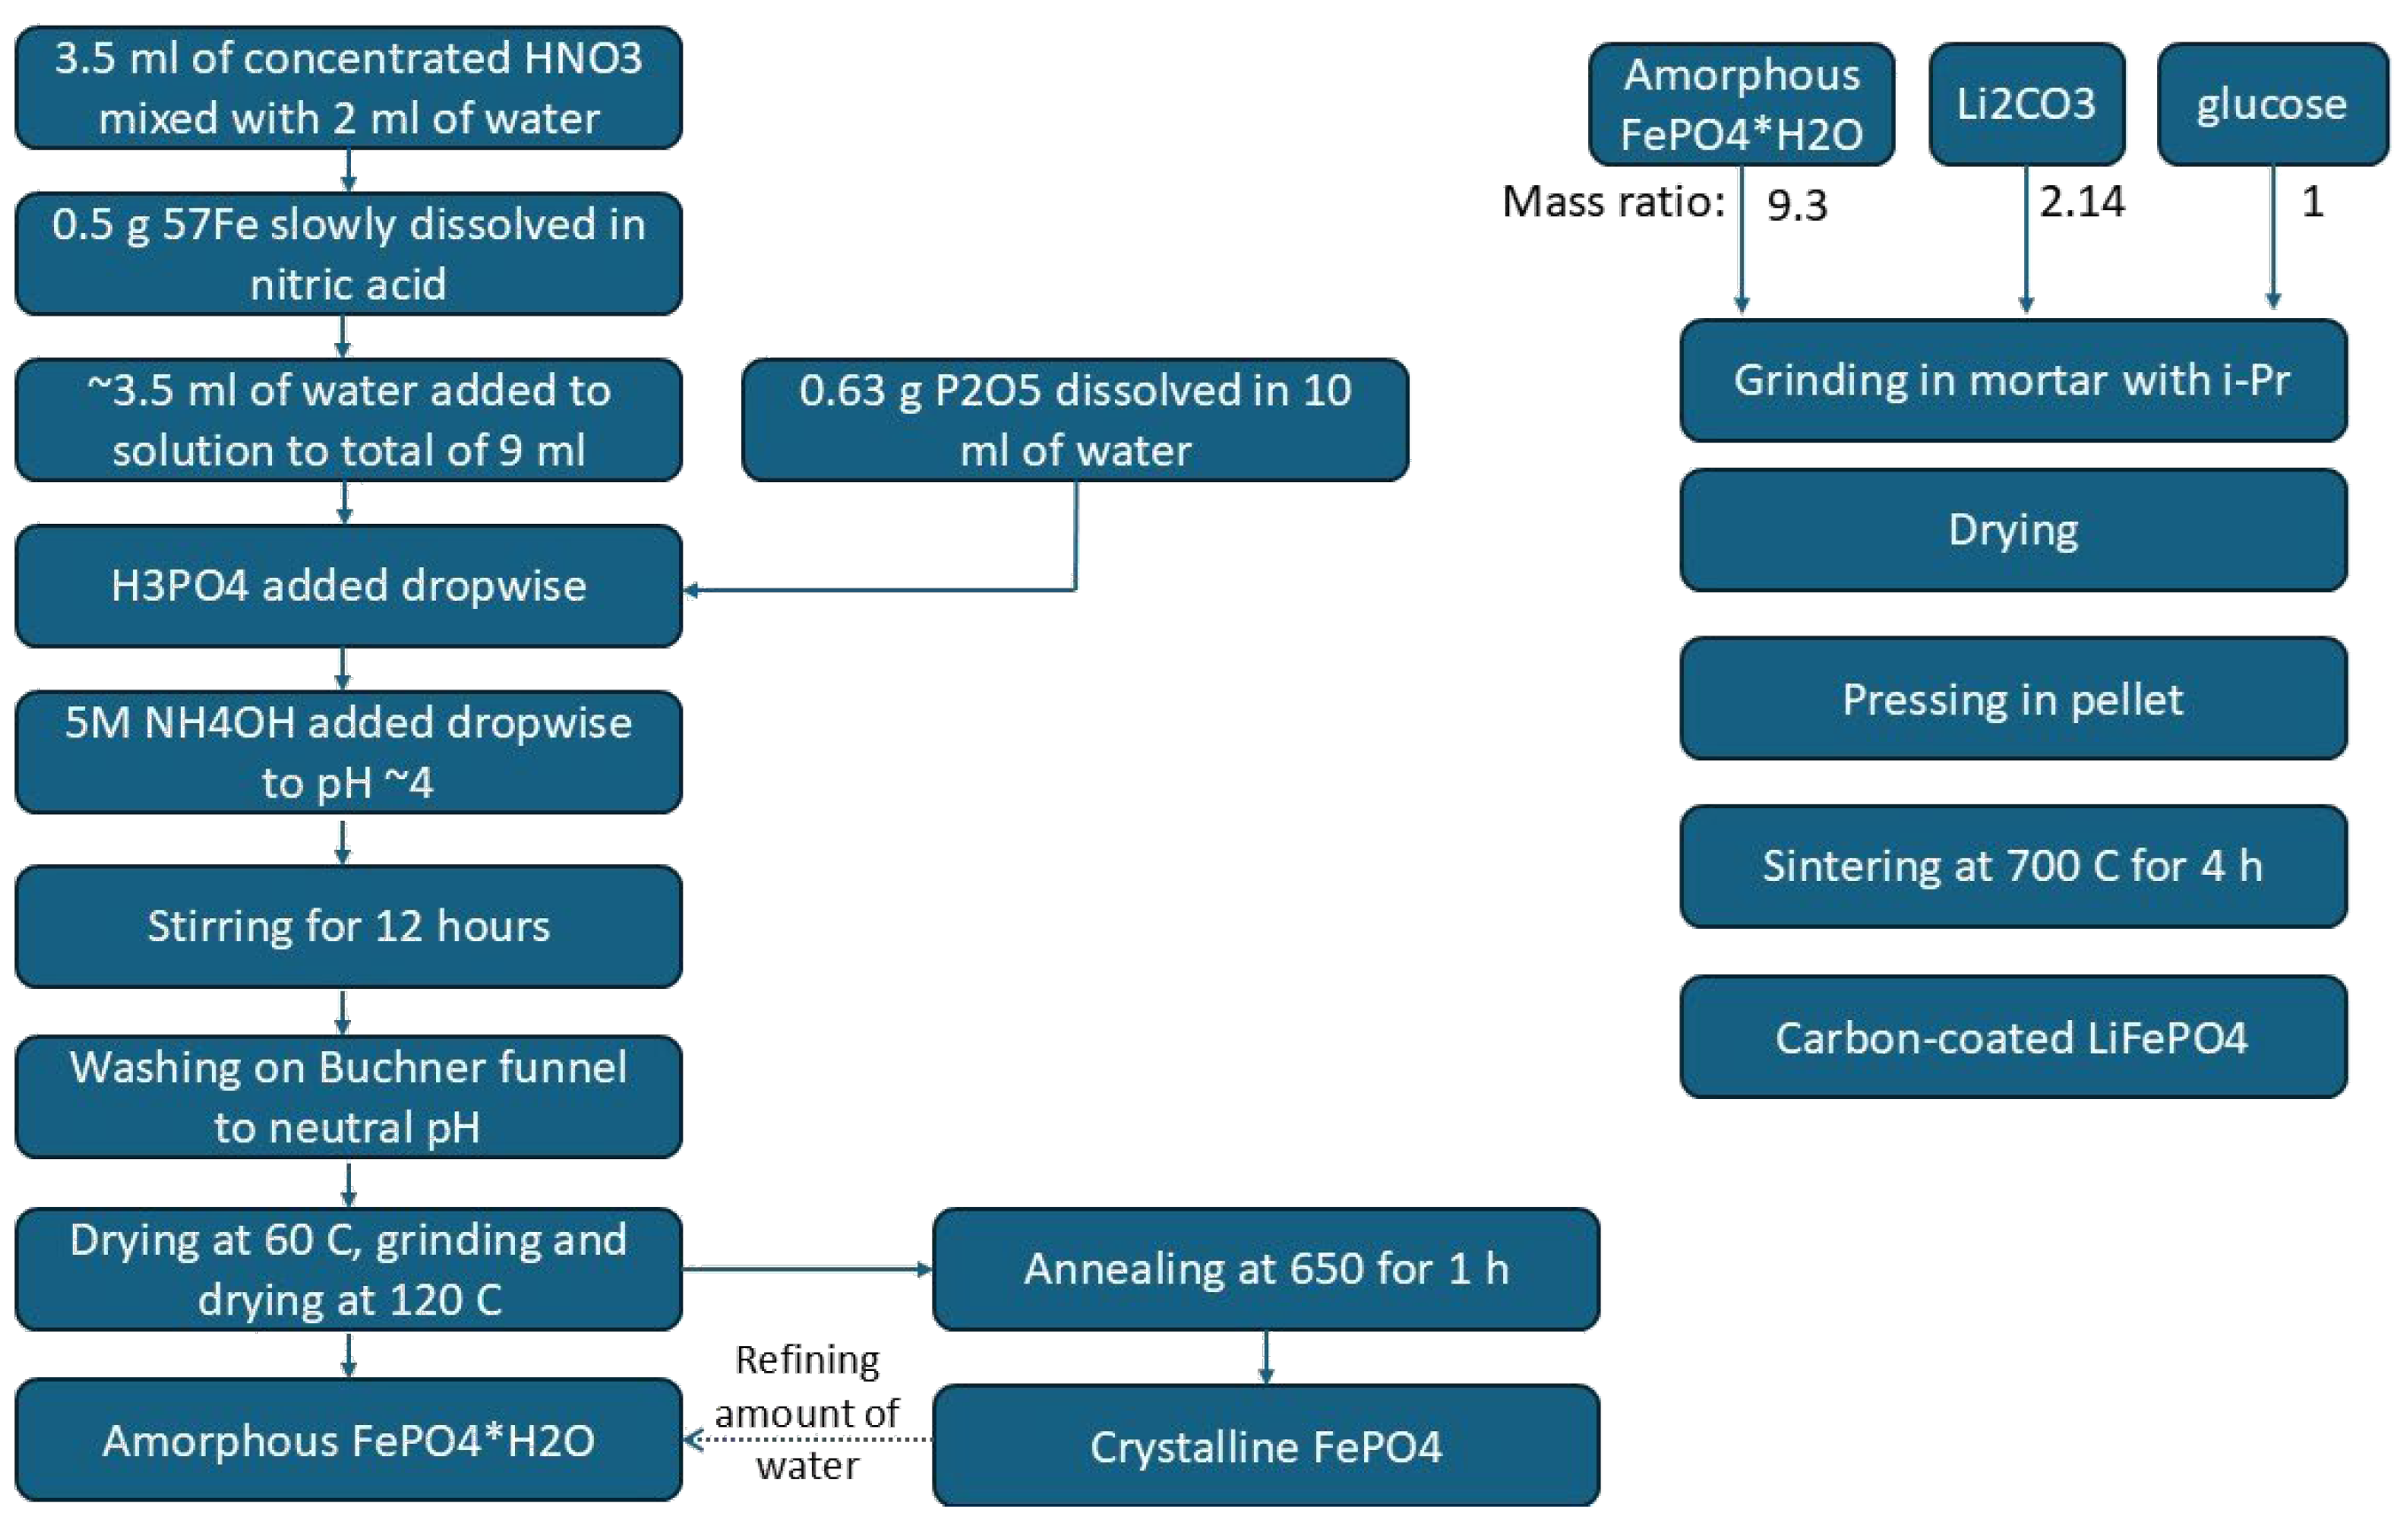
Figure 2.
(left) Photo of the operando cell with Kapton window. (right) photo of the cell in the endstation of the beamline BL19LXU at SPring-8.
Figure 2.
(left) Photo of the operando cell with Kapton window. (right) photo of the cell in the endstation of the beamline BL19LXU at SPring-8.
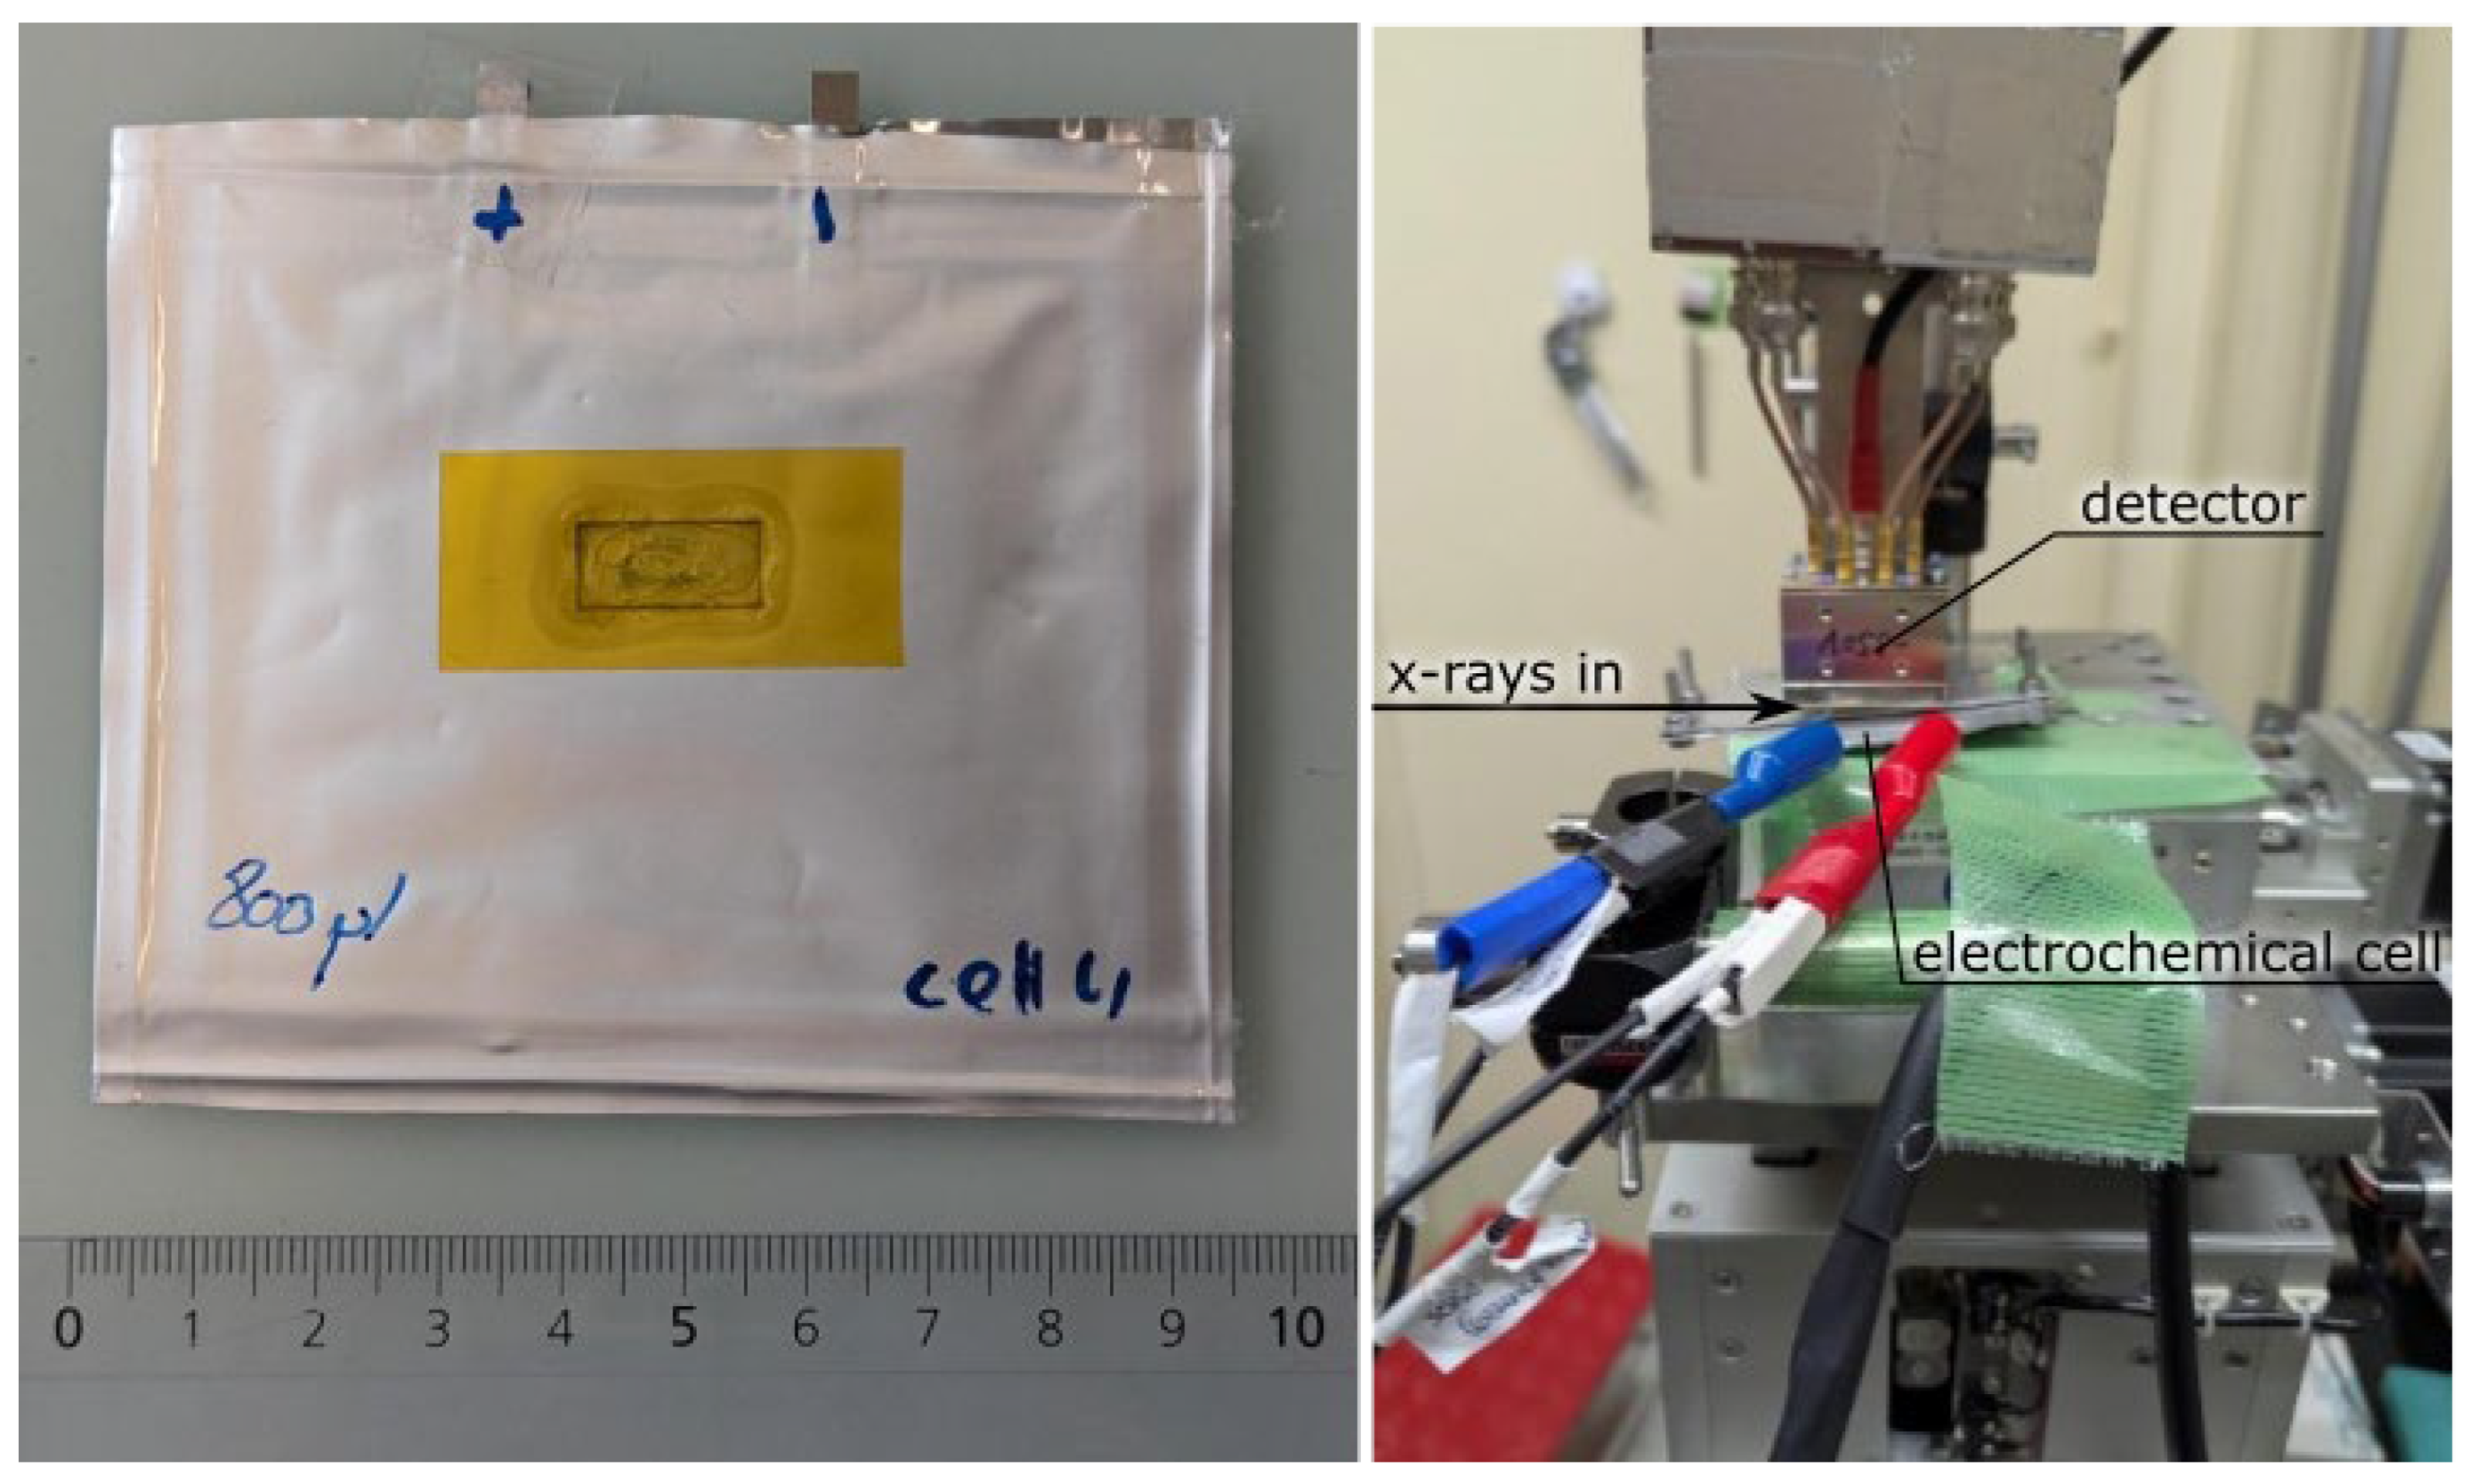
Figure 3.
(a) X-ray diffractograms of LPF and (b) FP . Shown are the measured data points and the profile from Rietveld refinement.
Figure 3.
(a) X-ray diffractograms of LPF and (b) FP . Shown are the measured data points and the profile from Rietveld refinement.
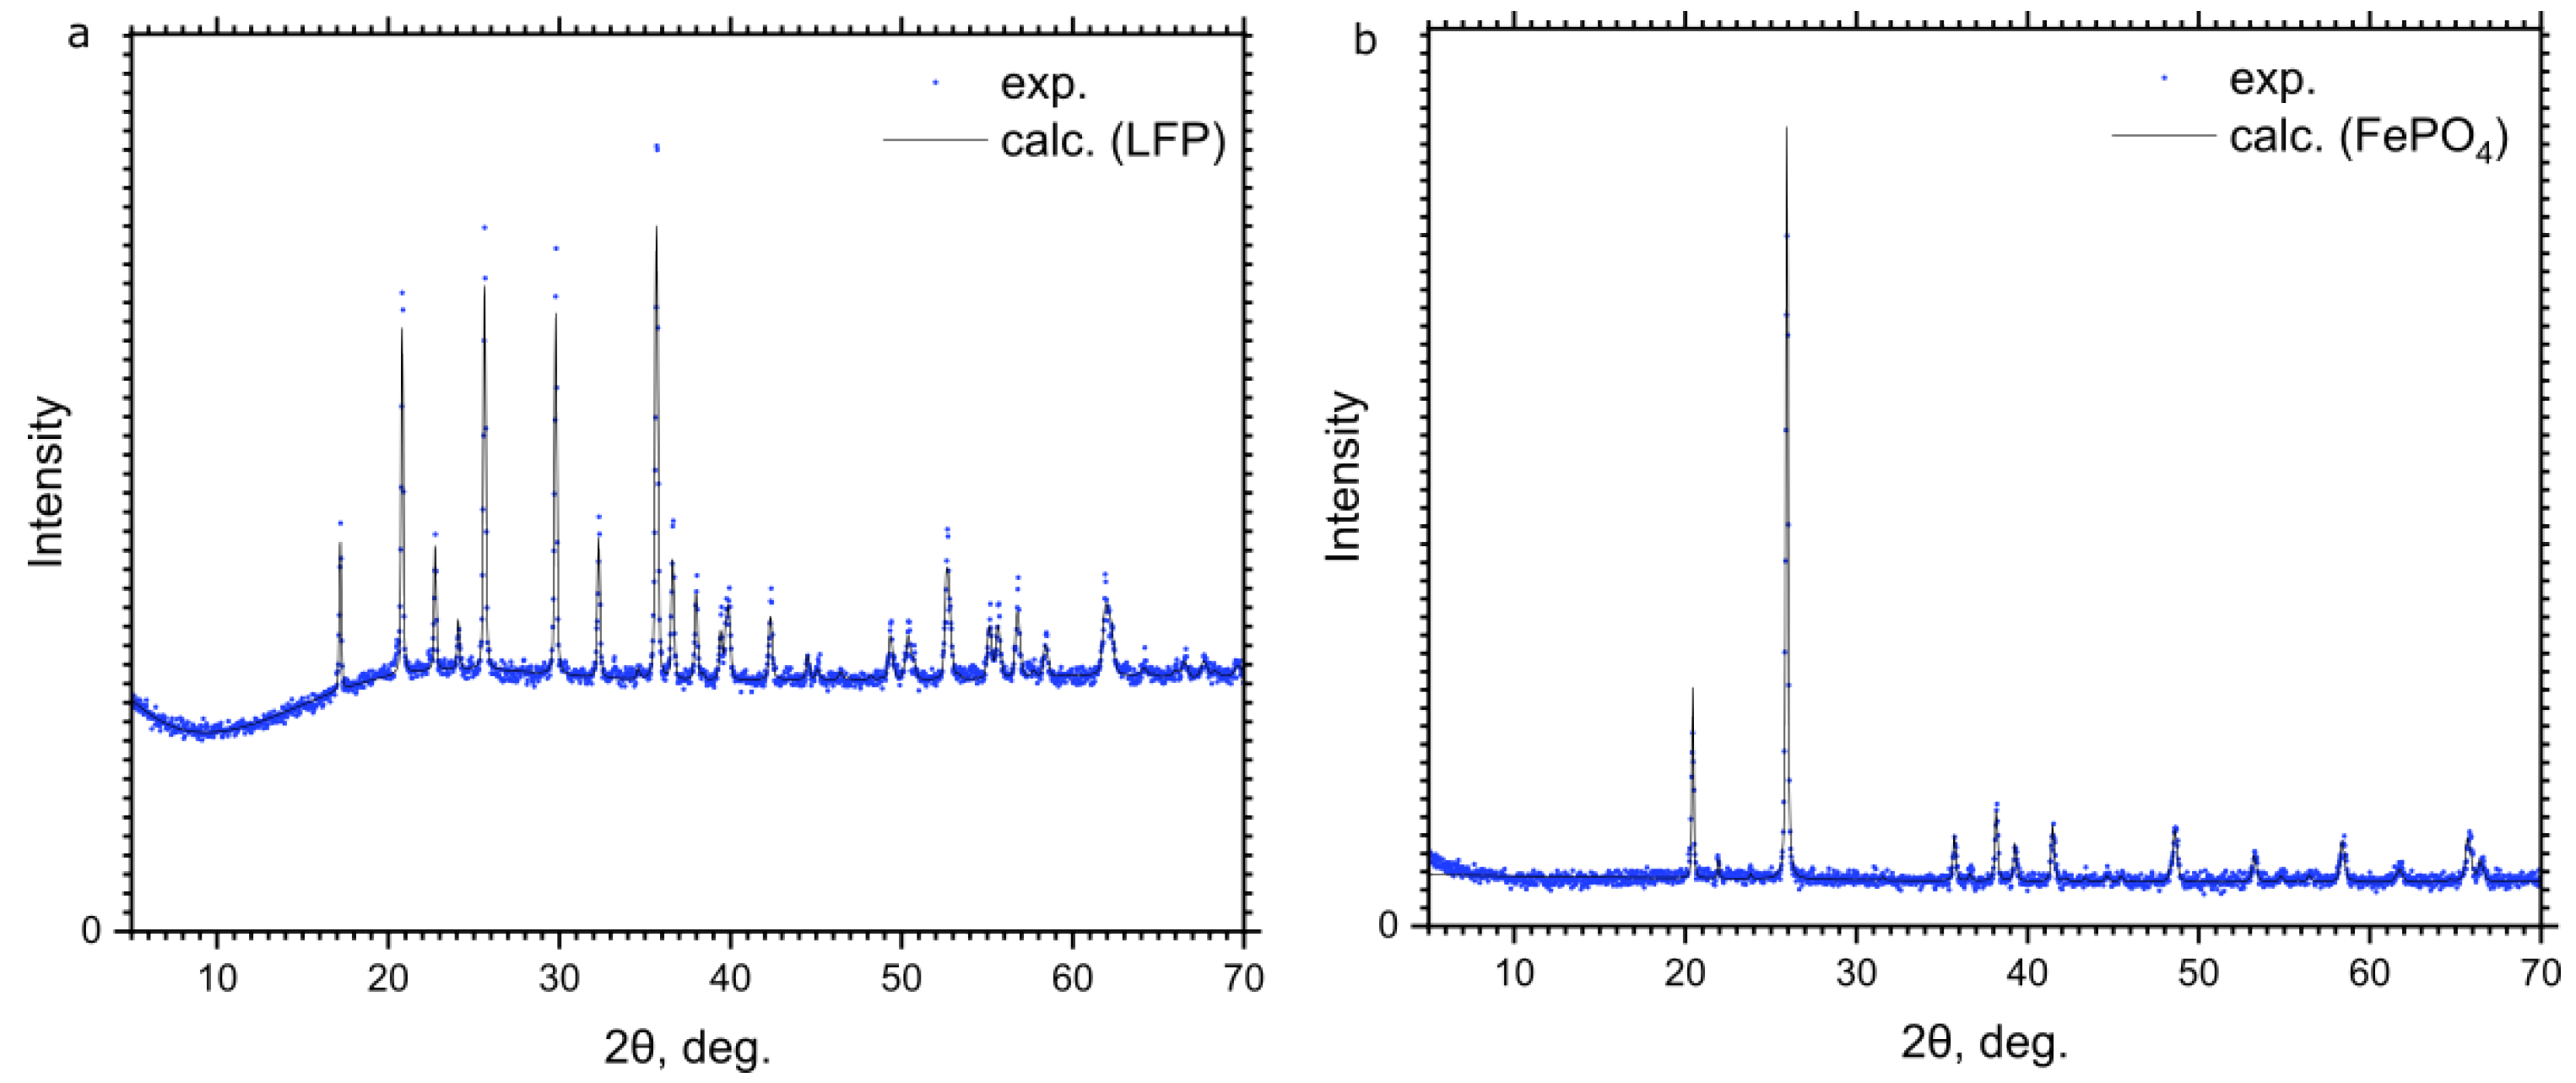
Figure 4.
(a) Voltage profile of the cell during operando experiment and the total charge passed through the cell. (b) raw NRVS spectra, collected from the cell. The spectra were centered so that the energy of the elastic peak is zero. (c) Fe-projected partial vibrational density of states, derived from the NRVS spectra.
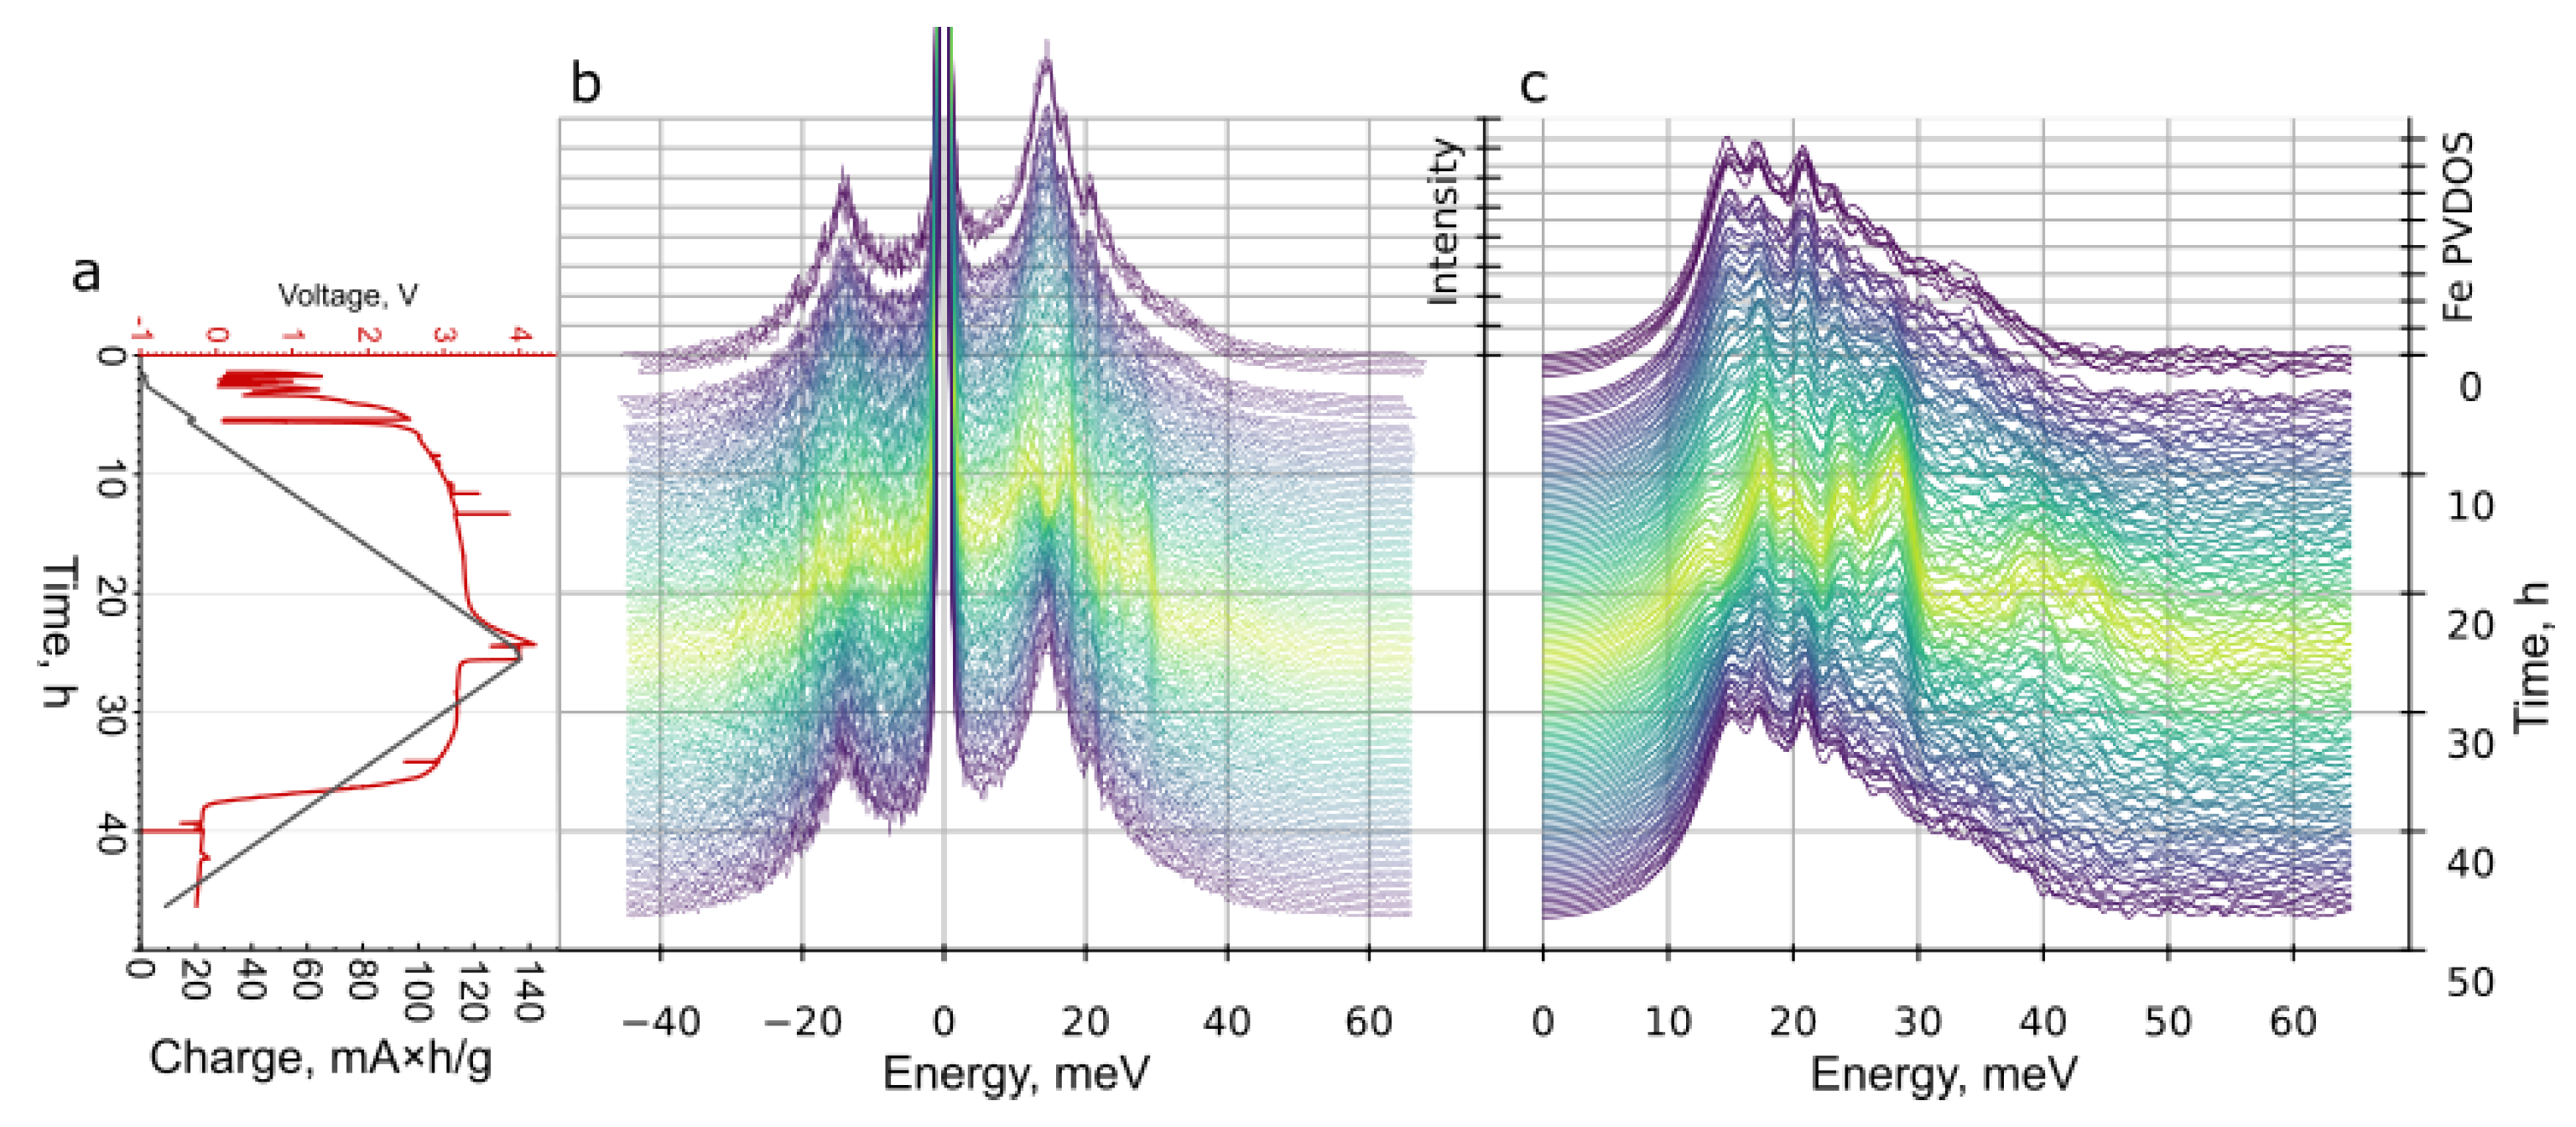
Figure 5.
Weights a1 and a2 of fitting all experimental DOS versus time (a) and charge (b). (c) Example of fitting an intermediate PVDOS (S30) with a linear combination of initial and final PVDOS. (d) Residuals of the fitting of all spectra as a function of time of measurement from the start of experiment.
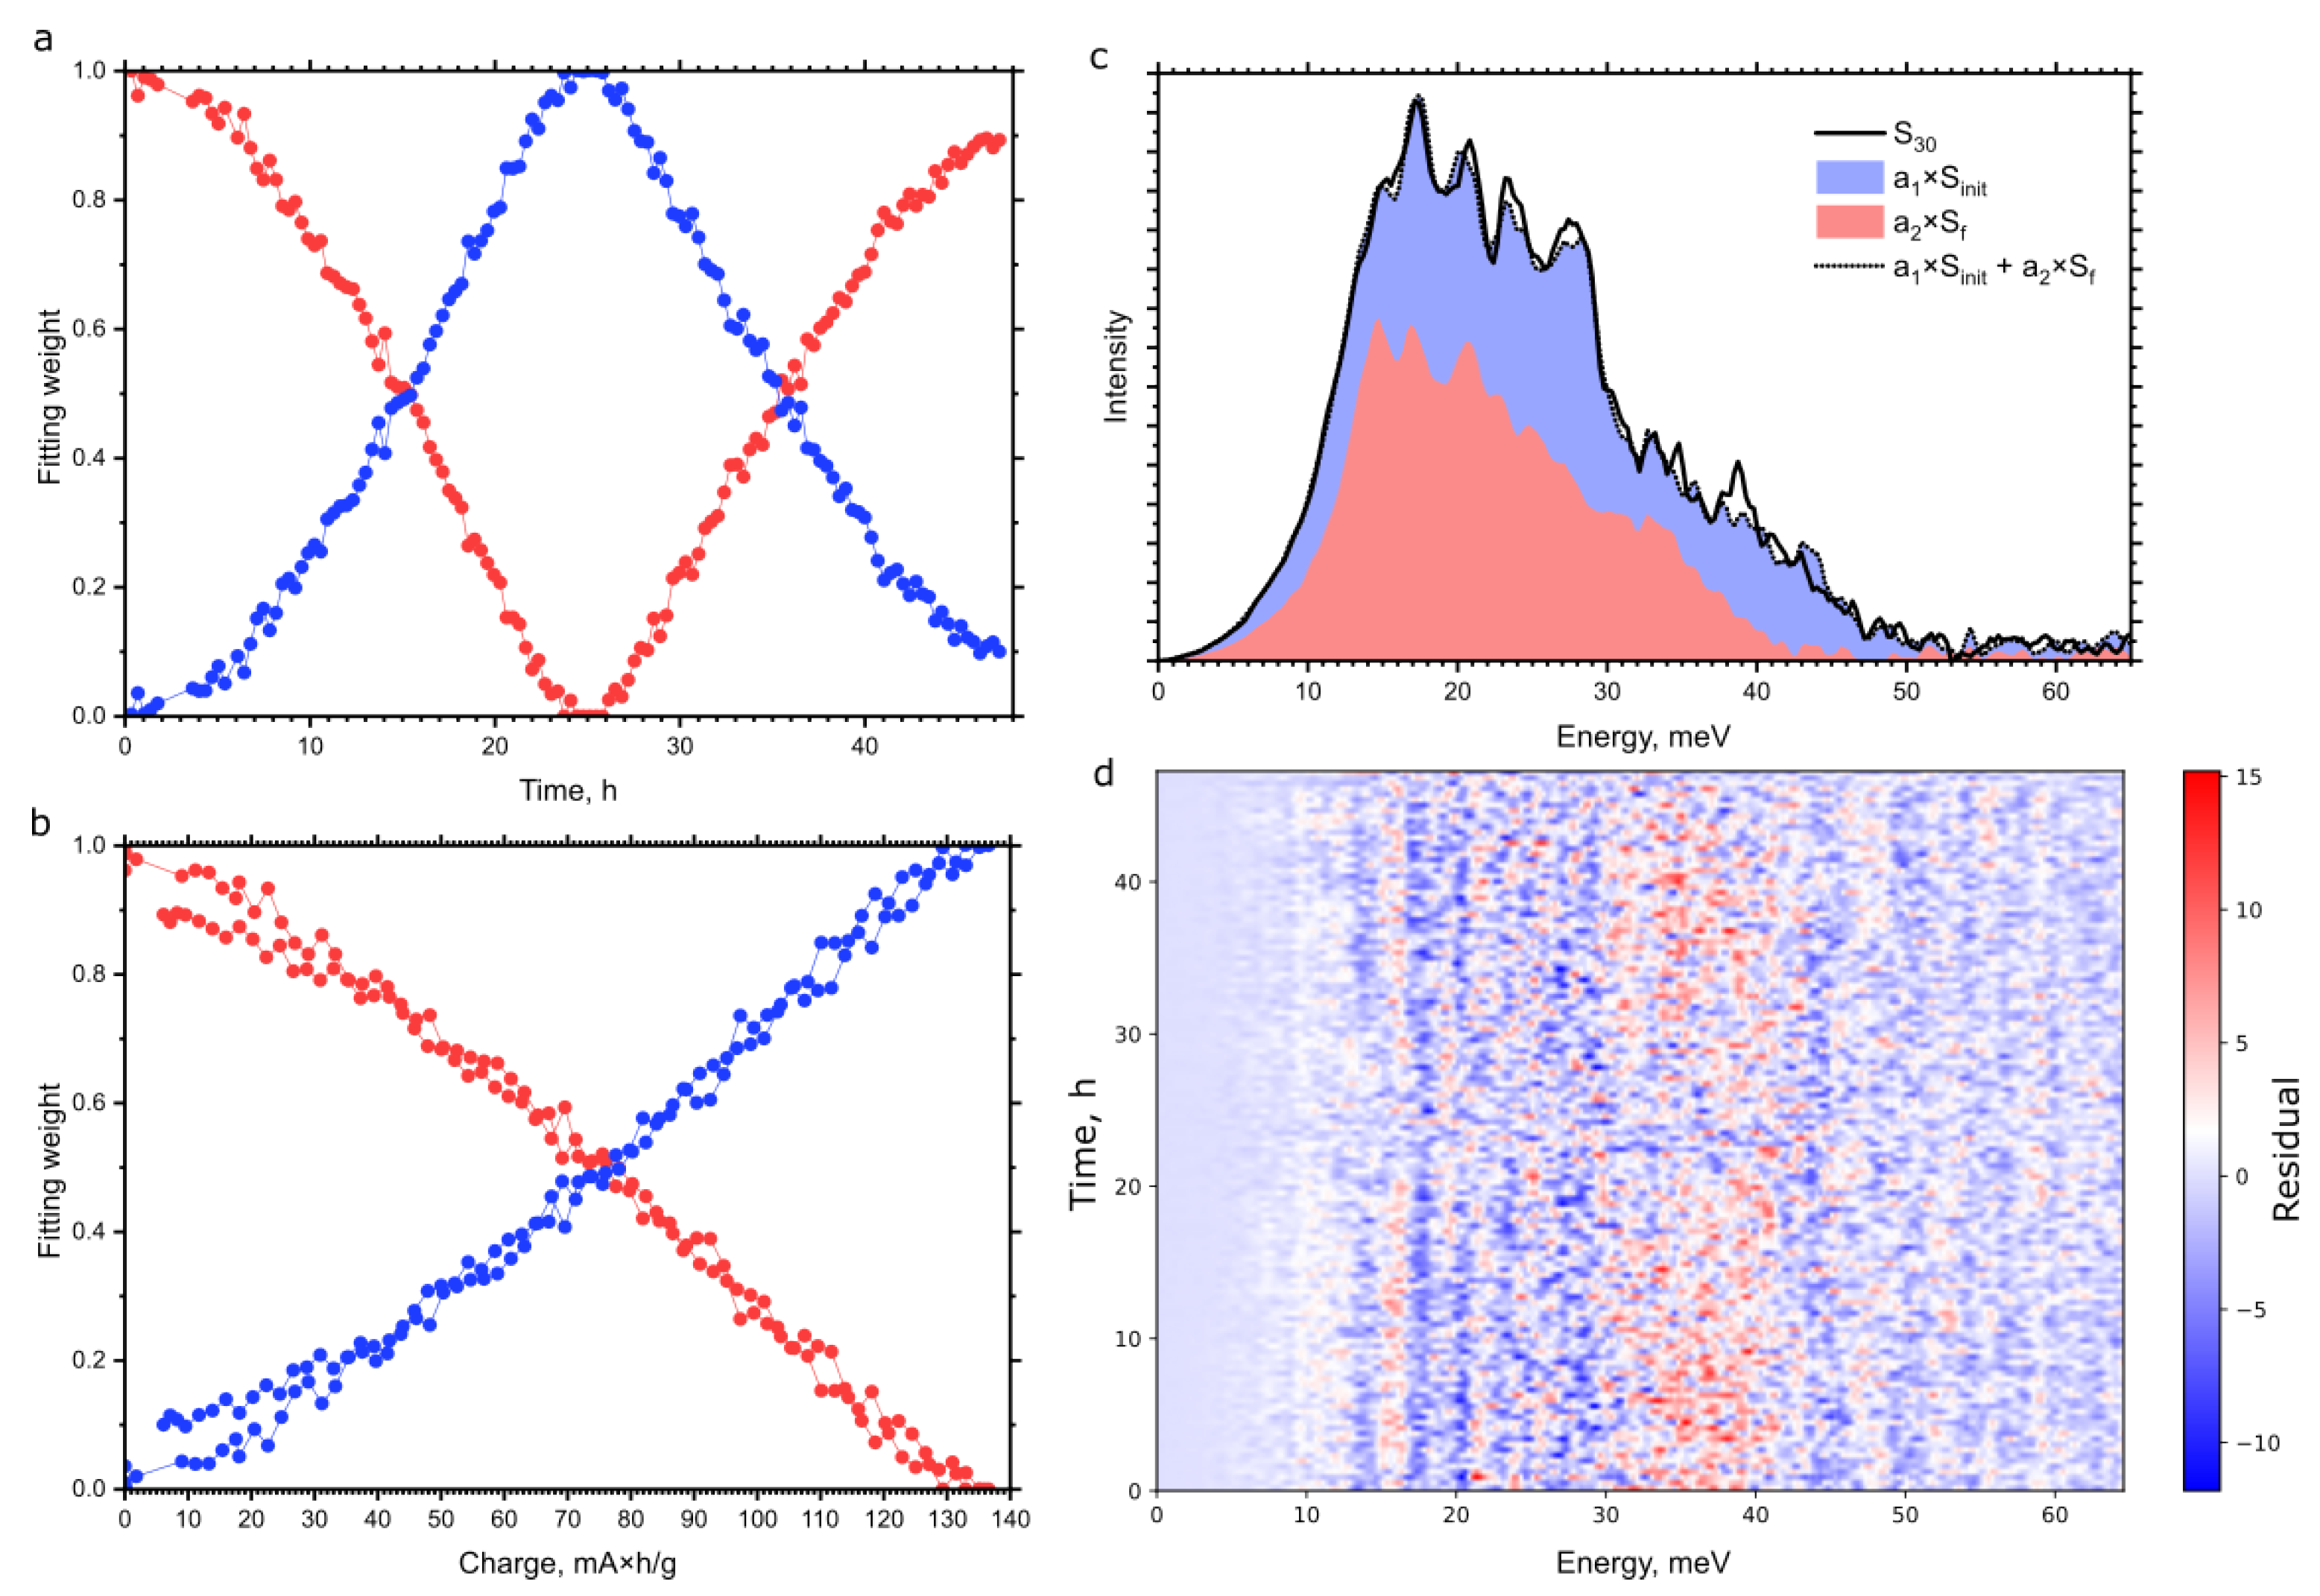
Figure 6.
Experimental (solid lines) and calculated (dotted lines) PVDOS of Fe in LFP and FP.
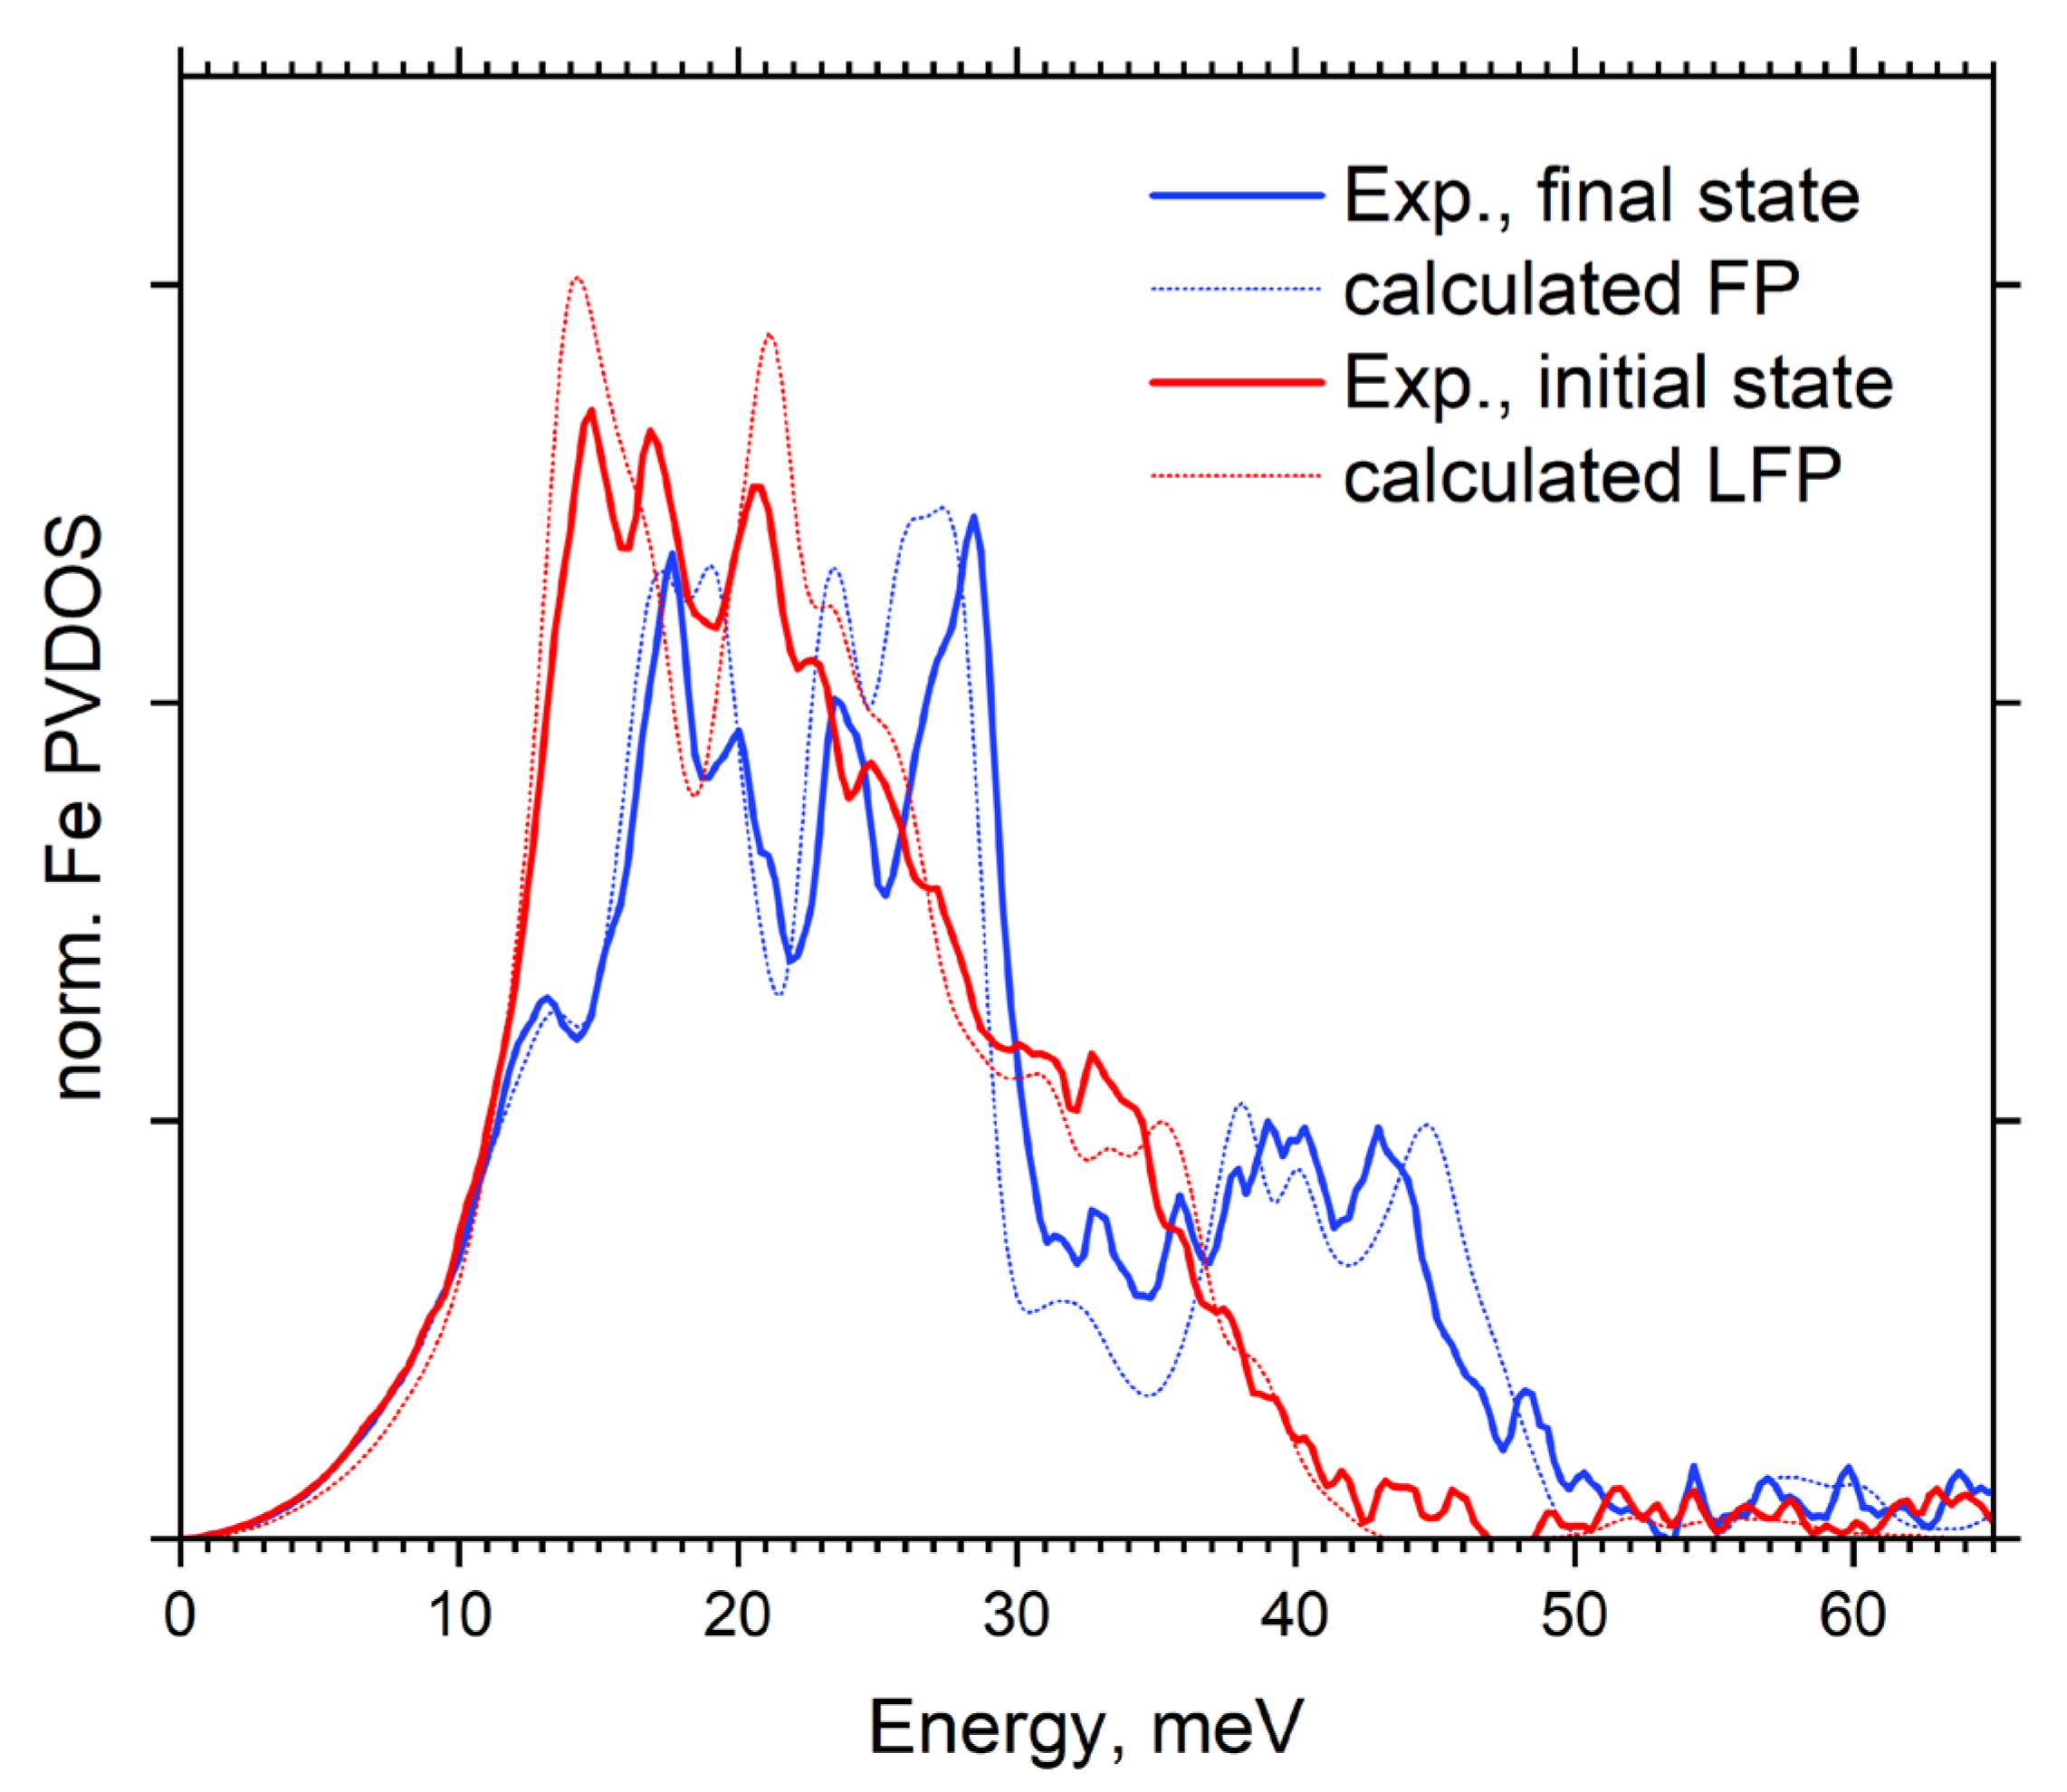
Figure 7.
left: Raman spectrum of LFP powder; center: calculated phonon band structure; right: calculated element-projected PVDOS and NRVS-derived experimental Fe PVDOS.
Figure 7.
left: Raman spectrum of LFP powder; center: calculated phonon band structure; right: calculated element-projected PVDOS and NRVS-derived experimental Fe PVDOS.
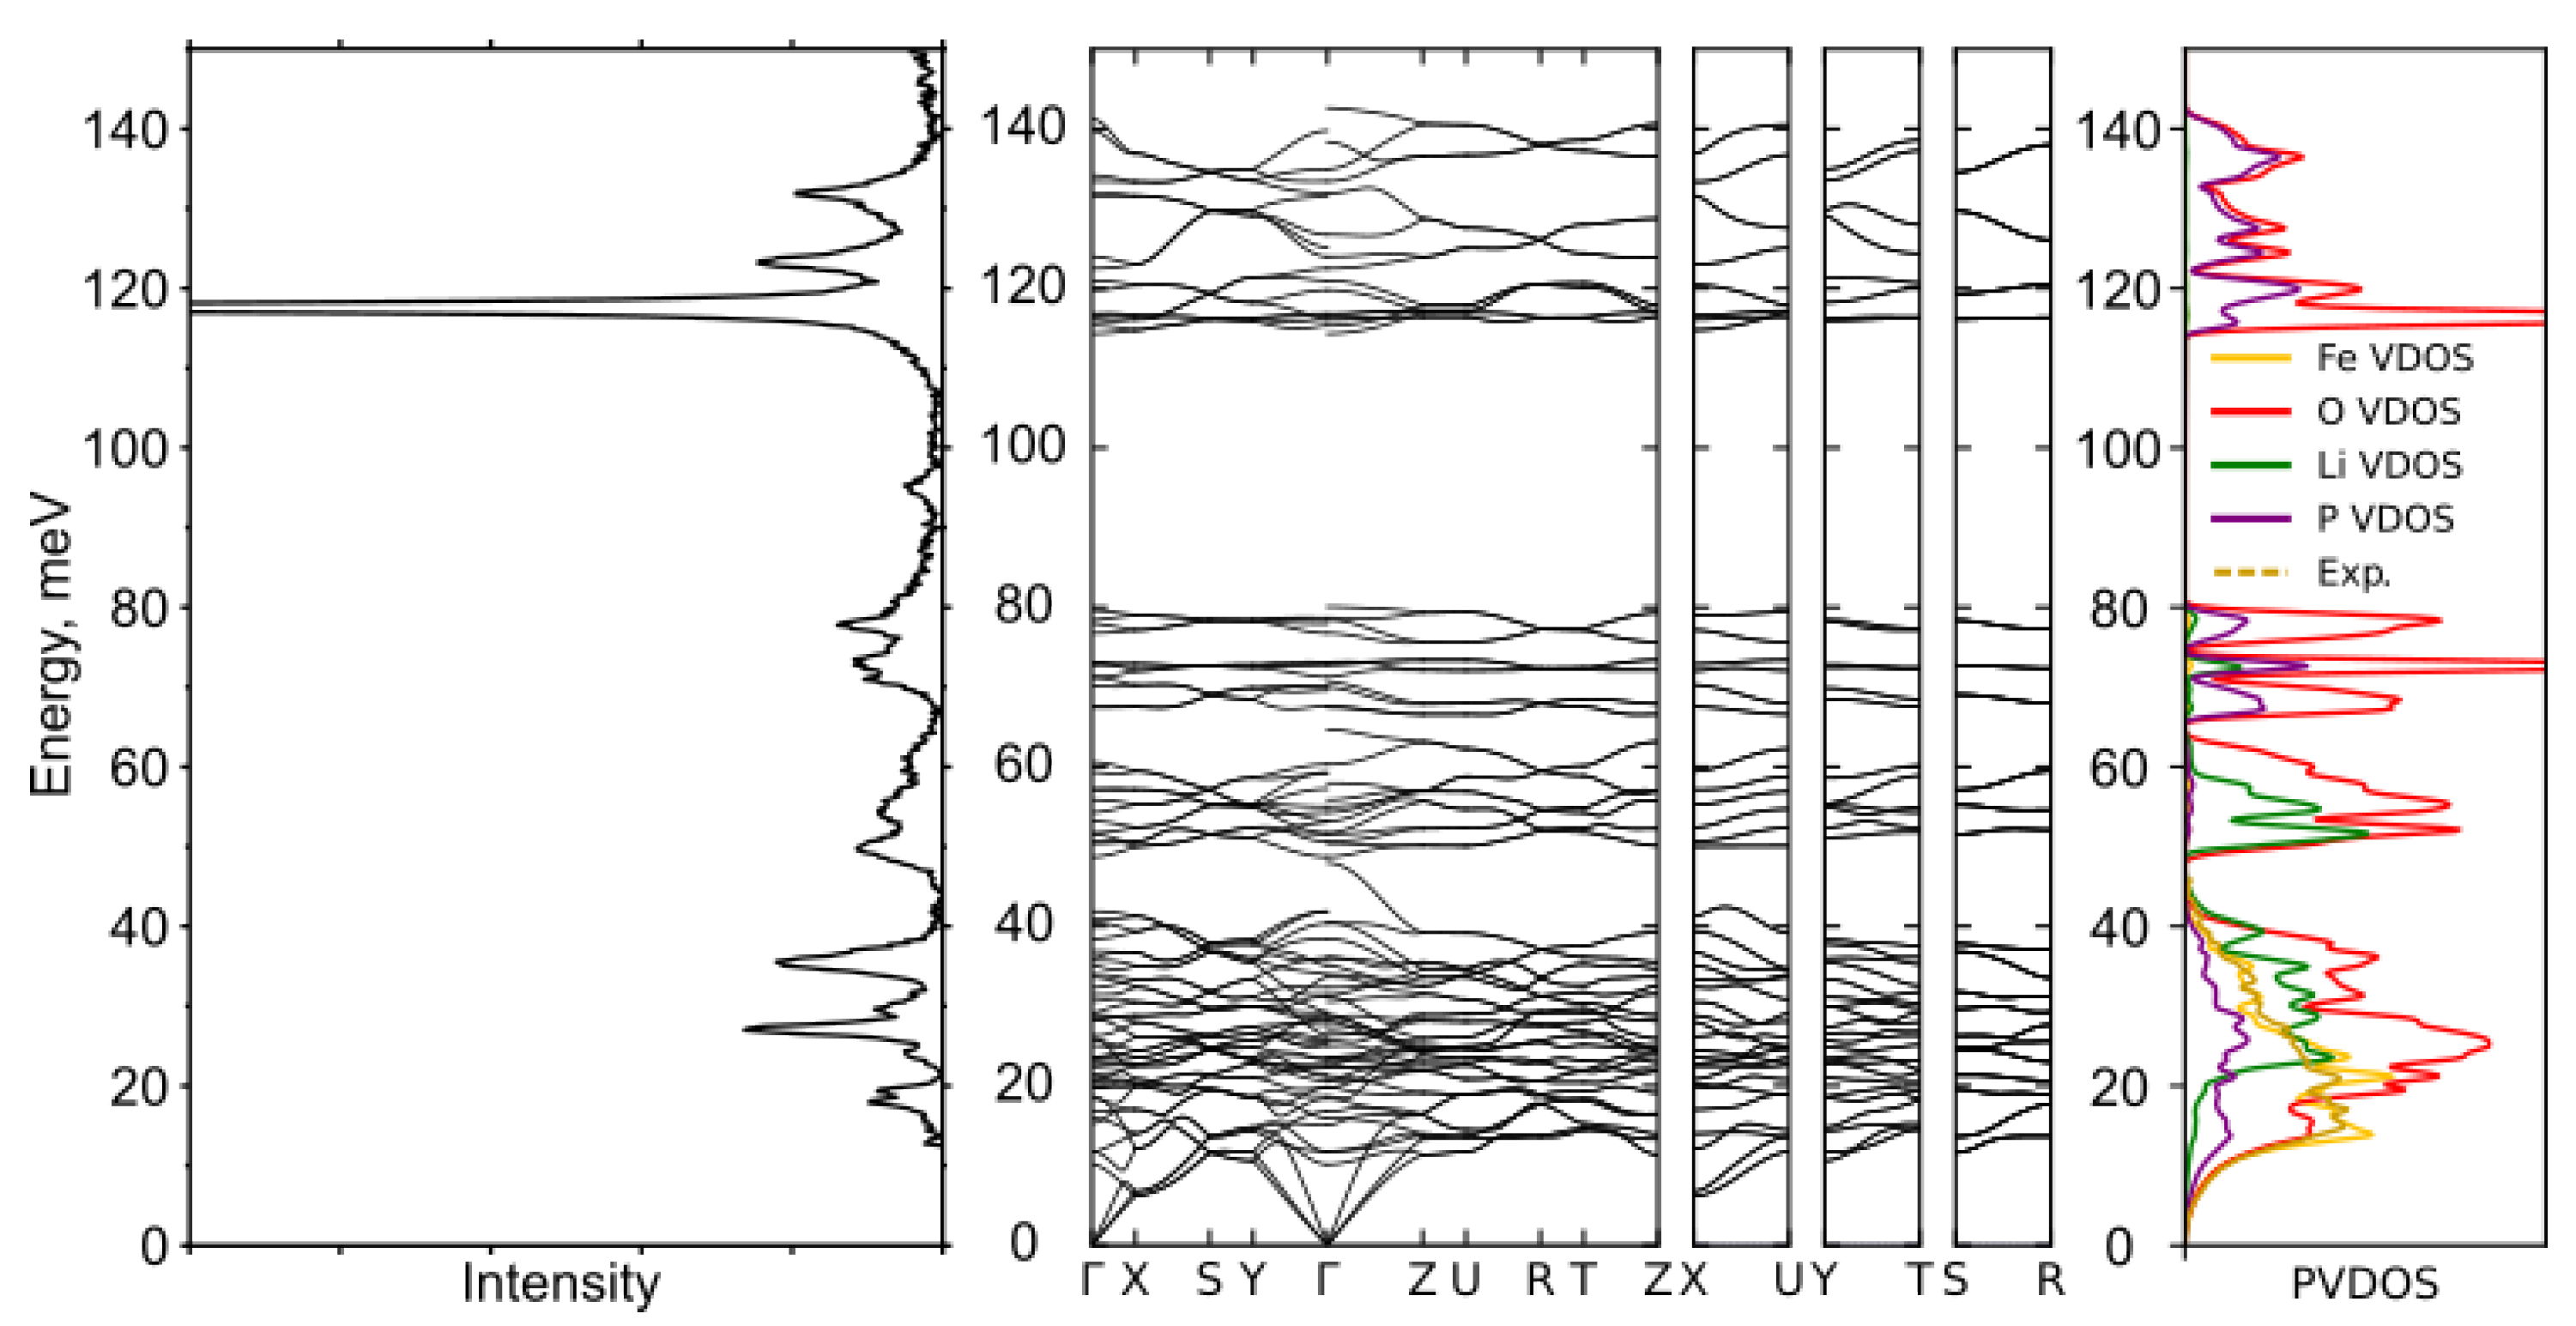

Table 1.
Atomic % concentration of the Fe isotopes of the nominal 57Fe iron sample as provided by the Certificate of Analysis № 240801- 089Sct by Neonest AB issued on 1. September 2025.
Table 1.
Atomic % concentration of the Fe isotopes of the nominal 57Fe iron sample as provided by the Certificate of Analysis № 240801- 089Sct by Neonest AB issued on 1. September 2025.
| Isotope: | Fe-54 | Fe-56 | Fe-57 | Fe-58 |
| Content (at. %): | 0.005 | 0.615 | 96.060 | 3.360 |
Table 2.
Occupancy parameters, obtained by Rietveld refinement of XRD of LFP. Occupancy of Fe was fixed to 1.
Table 2.
Occupancy parameters, obtained by Rietveld refinement of XRD of LFP. Occupancy of Fe was fixed to 1.
| Atom | Fraction |
| Fe | 1 |
| Li | 0.93(13) |
| P | 1.025(30) |
| O1 | 0.84(7) |
| O2 | 0.86(6) |
| O3 | 0.88(6) |
Disclaimer/Publisher’s Note: The statements, opinions and data contained in all publications are solely those of the individual author(s) and contributor(s) and not of MDPI and/or the editor(s). MDPI and/or the editor(s) disclaim responsibility for any injury to people or property resulting from any ideas, methods, instructions or products referred to in the content. |
© 2025 by the authors. Licensee MDPI, Basel, Switzerland. This article is an open access article distributed under the terms and conditions of the Creative Commons Attribution (CC BY) license (http://creativecommons.org/licenses/by/4.0/).
Copyright: This open access article is published under a Creative Commons CC BY 4.0 license, which permit the free download, distribution, and reuse, provided that the author and preprint are cited in any reuse.


