Submitted:
10 September 2025
Posted:
11 September 2025
You are already at the latest version
Abstract
This study employs parametric modeling and numerical simulations to investigate the influences of key geometric parameters on the flow characteristics of a nacelle inlet under ground crosswind conditions. The effects of mass flow rate and crosswind ve-locity on the inlet performance are thoroughly analyzed, as well as the synergistic im-pacts of throat axial location, fan face radius, and lip leading-edge radius. The results indicate that both mass flow rate and crosswind velocity significantly affect the flow separation and reattachment behavior, with the critical mass flow for the disappear-ance of separation being particularly sensitive to crosswind intensity. Regarding the geometric influences, variations in the inner contour leading-edge radius exert a more substantial influence on the flow separation characteristics than the outer contour. The lip leading-edge radius predominantly governs the peak distortion level and critical separation mass flow. Changes in the throat axial location moderately influence both distortion and total pressure recovery, while the fan face radius mainly affects the to-tal pressure recovery with negligible impacts on the distortion. This study concludes that optimizing the inner contour leading-edge geometry is the most effective strategy among all the investigated factors for enhancing nacelle performance in crosswind conditions. This study may provide some instructive supports for the design of high-performance nacelle inlets adaptive to wide-range operating regimes.
Keywords:
nacelle inlet
; crosswind
; flow separation
; total pressure recovery
; total pressure distortion
1. Introduction
Nacelle inlet is an indispensable component of civil aircraft engines, responsible for delivering a uniform and stable flow into the engine. Since cruise conditions dominate the majority of the flight mission profiles, nacelle design is typically optimized at this design point to achieve a high drag reduction efficiency, thereby significantly reducing fuel consumption and enhancing economic performance. However, while prioritizing cruise performance, the inlet must also ensure adequate engine operating margins under various off-design conditions, such as ground operation, angle of attack, crosswind, and wind shear. Among these, ground crosswind is a prevalent off-design factor that can induce flow separation within the nacelle inlet and cause total pressure distortion. Regulatory standards such as FAR Part 25 [1] and CCAR-25-R4 [2] explicitly specify crosswind conditions, highlighting the critical need of investigating their impacts on nacelle inlet performance.
Previous studies have provided valuable but conflicting findings regarding the aerodynamic effects of crosswind on nacelle inlets. In the 1990s, a collaborative effort among Snecma, Rolls-Royce, Hispano-Suiza, ONERA, and DLR led to the development of the Lara nacelle inlet, incorporating Hybrid Laminar Flow (HLF) technology [3]. Testing of the LARA inlet under 90° crosswind conditions (28–35 knots) in the ONERA F1 wind tunnel revealed a complex variation in total pressure distortion with increasing mass flow, i.e., an initial gradual increase, followed by a sharp decrease, and then a steep rise. It is noteworthy that within a certain mass flow range, complete flow reattachment occurred, resulting in nearly zero total pressure distortion—and this phenomenon became more pronounced at higher crosswind velocities [4]. Subsequent studies have further illustrated these complexities. For instance, Colin [5,6,7] systematically evaluated turbulence models and simulation approaches for predicting separation and complete reattachment, though none was proved entirely satisfactory. Zhang [8], accounting for ground effects, also observed the complete disappearance of flow separation and minimal distortion within a specific mass flow range (20–45 knots). In contrast, Nichols [9] reported only a marginal reduction in distortion at high mass flow rates, indicating a fully stalled inlet condition without reattachment. Tourrette [10] reported a consistent increase in distortion with rising mass flow rate. In contrast, Kokubo's [11] investigation on nacelle crosswind distortion demonstratedthrough both experimental and computational results a steady decline in the distortion index DC60 with increasing mass flow rates, showing marked divergence from the ONERA experimental data. These discrepancies underscore the high sensitivity of this phenomenon to the nacelle configuration and the current limited understanding of the factors governing complete flow reattachment under crosswind conditions. Actually, the present authors' prior simulations involving the NACA-1-85-100 and DLR inlets revealed no disappearance of the separation zone with increasing mass flow, further highlighting the critical influence of geometric design.
Numerous studies have been conducted on nacelle configuration design. However, most efforts have focused predominantly on cruise conditions, with relatively limited research devoted to geometric parameter studies under ground crosswind operations. Burley [12] examined the effects of the hub axial location, internal contraction ratio (ICR), and aspect ratio on the angle of attack at which internal flow separation occurred. Younghans [13] evaluated the influence of inlet cowl geometry and Reynolds number on the cowl separation angle of attack and overall inlet performance, noting a strong dependence on lip shape. Others, like Qi [14], explored parameters such as the internal contraction ratio and super-elliptic lip exponents, though primarily in high-speed regimes. Wei [15] investigated the impact of inlet contour and leading-edge radius across speed ranges and under high angles of attack and sideslip. Nevertheless, the influence of key geometric parameters under ground crosswind conditions remains poorly understood.
This knowledge gap is further compounded by the inherent limitations of conventional geometric parameterization techniques. Traditional methods such as super-elliptic equations for lip design and polynomial functions for the throat-to-fan-face contour often fail to ensure curvature continuity at the connection points. The Class Shape Transformation (CST) method, introduced by Kulfan [16], offers a more robust approach by combining the class and shape functions to generate smooth geometries. Its enhanced variant, the intuitive CST (iCST) method developed by Zhu [17], explicitly links design variables to geometric constraints, providing a greater flexibility and precision. The CST method was initially developed for airfoil parameterization and was subsequently extended to nacelle parameterization by Christie [18], Tejero [19], and others. Christie [18] divided the nacelle contour into outer and inner lines starting from the leading-edge point, parameterizing each contour separately. Tejero [19] first constructed several key circumferential section profiles and then applied the iCST method to constrain the variation patterns of these circumferential profiles, thereby achieving the construction of a non-axisymmetric nacelle. This study will also employ the iCST method for the nacelle inlet design.
In summary, the relationship between mass flow and distortion under ground crosswind conditions remains still unclear, and previous parametric studies have largely overlooked ground crosswind operations. This study therefore employs the iCST parameterization method to develop a parametric nacelle inlet model to investigate the variation patterns of the inlet performance and the influences of geometric parameters under crosswind conditions. This study employs numerical simulations to investigate the coupled effects of engine suction (mass flow) and crosswind interactions, with a focus on the influence of throat axial location, fan face radius, and lip leading-edge radius on the flow separation and distortion under ground crosswind conditions. The work aims to clarify the geometric dependencies of complete flow reattachment and provide theoretical insights for designing robust nacelle inlets capable of maintaining high performance in both design and off-design scenarios.
2. Research Object and Methodology
2.1. Nacelle Parameterization Method
With reference to [18], this study employs the iCST parameterization method to reconstruct the lower section of the LARA nacelle inlet, thereby generating an axisymmetric nacelle model. The CST parameterization method describes the geometric profile through the product of a shape function and a class function C(ψ), with the endpoint further modified by the term .
The class function defines the fundamental profile of the curve, where the exponents and determine the geometric characteristics at the start and end points. For shapes such as nacelles and airfoils, which typically feature a rounded leading edge and a tapered trailing edge, the values are conventionally set to and .
The shape function provides precise control over the contour's detailed geometry. The coefficients govern the local shape characteristics of the curve, while represents the Bernstein polynomial basis. The shape function critically determines both the fitting accuracy and the complexity of the curve representation.
Christie [18] proposed seven key constraints for nacelle outer contour design: the leading-edge radius of curvature (ROC_O), the highlight-plane radius (R_hi), the radial coordinate at the maximum thickness location (R_m), the axial location of the maximum thickness (L_m), the trailing-edge radial coordinate (R_te), the axial tangential angle at the trailing edge relative to the engine axis (β_o), and the nacelle length (L_nac). A schematic of these parameters is provided in Figure 1. These seven constraints collectively determine the order and the coefficients of the shape function. The internal contour was constructed using the same method.
Direct application of these key geometric parameters as inputs to reconstruct the lower section of the experimental LARA nacelle model resulted in significant deviations between the parameterized contour and the original geometry. Therefore, while keeping the nacelle length (L_nac) and the trailing-edge tangential angle (β_o) constant, an iterative process was employed to minimize the distance error primarily over the forward nacelle segment. This process adjusted the key parameters until the parameterized profile achieved the closest possible agreement with the original geometry. The final values of the key parameters for the nacelle contour are listed in Table 1. This study employs the super-elliptic equation to parameterize the centerbody. However, the influence of the centerbody shape and its axial location on nacelle flow separation and reattachment characteristics is not involved. The centerbody parameters are fixed to and .
2.2. Numerical Methods and Setup
The computational domain is modeled after the ONERA F1 wind tunnel, with the nacelle vertically mounted on the tunnel wall. The test section measures 11 m × 4.5 m × 3.5 m (length L × witdth W × height H). The wind tunnel inlet is configured as a velocity inlet, while the wind tunnel outlet is designated as a pressure outlet. The wind tunnel walls are treated as adiabatic free-slip walls. Both the nacelle wall and the centerbody wall are specified as adiabatic no-slip walls. The nacelle outlet is set as a pressure outlet with a specified mass flow rate target. The configuration of the boundary conditions is illustrated in Figure 2.
Numerical simulations were performed using the commercial software ANSYS Fluent to solve the flow field around the nacelle. Given the potential occurrence of flow separation and reattachment, the curvature-corrected k-omega SST turbulence model was selected. The transition model employed was the gamma transport equation, which accounts for crossflow transition. The SIMPLEC algorithm was used for pressure-velocity coupling, and the spatial terms were discretized using the second-order upwind scheme.
The computational mesh for the nacelle was generated using Pointwise, employing a structured grid topology. The height of the first layer of the surface boundary layer was set to 0.002 mm, ensuring that the non-dimensional wall distance y+ remained below 1 across all operating conditions. This satisfies the near-wall resolution requirements of the k-omega SST turbulence model.
2.3. Definition of Nacelle Performance Parameters
The total pressure recovery coefficient (σ) is utilized to quantify the degree of total pressure loss after the airflow passes through the inlet. It is defined by the following formula:
where denotes the area-averaged total pressure at the Aerodynamic Interface Plane (AIP) and represents the free-stream total pressure.
The maximum circumferential total pressure distortion index (IDCmax) is employed to quantify the non-uniformity of the total pressure distribution. The formula for calculating IDCmax is defined as follows:
where is the area-averaged total pressure at the AIP, denotes the ring-averaged total pressure of the **-th ring, represents the minimum total pressure within the **-th ring, and is the number of probe rings. The arrangement of the AIP total pressure probes follows the SAE ARP1420 standard [20], distributed in equal-area rings. The total pressure rake consists of five rings and eight radial arms, with each arm spaced at 45-degree intervals. The probe configuration is illustrated in Figure 3.
2.4. Validation of the Computational Method
2.4.1. Mesh Independence Examination
One of the primary focuses of this study is the performance degradation of the nacelle inlet resulting from internal flow separation induced by crosswind. To accurately capture this complex flow phenomenon, a low-mass-flow, high-separation operating condition was selected for grid independence verification. Three sets of computational grids with approximately 3.5 million, 8.58 million, and 12.52 million elements were generated. The specific values of the total pressure recovery coefficient (σ) and the total pressure distortion index (IDCmax) for each mesh are presented in Table 2.
It can be observed that once the grid size reaches 8.58 million elements, both the total pressure recovery coefficient and the total pressure distortion index exhibit minimal changes with further mesh refinement. This indicates that the numerical results are grid-independent. Consequently, the grid configuration corresponding to the 8.58-million-element mesh was adopted for all subsequent simulations.
2.4.2. Validation of Numerical Method
Although extensive experimental research has been carried out on nacelle performance in crosswind conditions, the scarcity of publicly accessible test models hinders the validation of numerical approaches. To verify the reliability of the numerical approach employed in this study, the parametric method described in Section 2.1 was applied to the upper, side, and lower sections of the Lara inlet. After parameterizing these three profiles, interpolation was performed between adjacent profiles to generate sections at various circumferential positions. Finally, a three-dimensional non-axisymmetric nacelle was constructed using surface modeling techniques (see Appendix 1 for detailed implementation). It should be noted that the nacelle model generated through this approach only approximates the original geometry in general configuration. This 3D non-axisymmetric nacelle model was used for method validation. As shown in Figure 4, while certain deviations exist between the numerical simulation results and experimental data, the overall trends show consistency. Note that the mass flow rate shown in this figure has been corrected to be consistent with the reference for the full-scale inlet. This demonstrates that the numerical simulation method adopted in this study provides credible qualitative descriptions.
3. Results and Discussion
3.1. Basic Flow Characteristics of the Inlet Under Crosswind Conditions
An analysis of the basic flow characteristics of the nacelle inlet under crosswind conditions is first conducted. Figure 5 shows the contour plot of the total pressure recovery coefficient of the nacelle under crosswind conditions, along with the definitions of the Line1 to Line5 sections. It is seen that the total pressure is mostly lost at the windward side of the crosswind. Figure 6 presents Mach number contours at cross-sections Line1 to Line5 at three different crosswind velocities. In the absence of crosswind, the internal flow within the nacelle exhibits a well-defined symmetric distribution. The streamtube contracts sharply from the far field to the lip plane, with the airflow accelerating gradually and reaching its maximum velocity near the lip region. Subsequently, the flow decelerates slightly due to the adverse pressure gradient, ultimately passing uniformly through the AIP without any flow separation.
When crosswind is present, the streamtube deflects toward the windward side. The degree of deflection increases with higher crosswind velocities. Due to the crosswind effect, the flow acceleration at the lip in the Line1 section becomes more pronounced. Conversely, the high-speed region near the lip in the Line5 section gradually diminishes under crosswind influence. At a crosswind velocity of 10 knots, no flow separation is observed inside the inlet, and the flow remains relatively uniform. However, when the crosswind velocity reaches 25 knots, a separation zone emerges in the Line1 section, extending from the leading edge toward the AIP. The reattachment point is located downstream of the AIP. The presence of this separation zone reduces the effective flow area of the nacelle. Consequently, under the same mass flow rate, the flow acceleration in the Line1 section intensifies, disrupting the originally uniform flow.
As observed from the static pressure variation at the Line1 section in Figure 7a, in the absence of crosswind, the airflow experiences significant favorable pressure gradients followed by adverse pressure gradients as it passes around the lip. On the outer surface of the leading edge, the flow rapidly accelerates to its maximum velocity under the favorable pressure gradient, then decelerates abruptly due to the adverse pressure gradient on the inner surface. Although the adverse pressure gradient on the inner surface is substantial, the flow remains attached. Under crosswind conditions, the adverse pressure gradient on the inner lip surface intensifies. At a crosswind velocity of 25 knots, the pressure change near the leading edge becomes nearly vertical, indicating an extremely strong adverse pressure gradient that triggers flow separation at the leading edge.
Comparing with the pressure distribution under crosswind-free conditions shown in Figure 7b, the introduction of crosswind attenuates the adverse pressure gradient originally present along Line4 and Line5. On Line5, the pressure effect even shifts from adverse to favorable. Conversely, the adverse pressure gradient intensifies on Line1 to Line3 under crosswind influence. The impact of crosswind on the pressure distribution varies significantly across different circumferential sections of the nacelle. Consequently, as seen in Figure 7b flow separation occurs on Line1 and Line2, while Line3 to Line5 remain attached. Among all the five sections, Line1 experiences the most severe exacerbation of adverse pressure gradient under crosswind effects.
3.2. Influence of Mass Flow on the Inlet Crosswind Flow Characteristics
At a fixed crosswind velocity of 25 knots, the mass flow rate through the nacelle was varied to analyze the coupling effects of engine suction and crosswind on the flow field. The mass flow rate ranged from 5 to 15 kg/s. At lower mass flow rates, the entire flow field remained subsonic, while at higher mass flow rates, localized supersonic regions emerged. Figure 8 illustrates the evolution of the nacelle flow field with increasing mass flow rates. The pressure distribution along Line1 for three selected mass flow conditions is plotted in Figure 9.
Within the mass flow range of 5 to 9.5 kg/s, the combined effects of crosswind and the strong adverse pressure gradient at the lip leading edge of Line1 (as shown in Figure 8 and Figure 9) induced flow separation originating from the leading edge. As the mass flow rate increased further to 10 kg/s, the separation zone disappeared. Beyond this critical mass flow rate, the flow remained relatively uniform with increasing mass flow rate. At 15 kg/s, a very small separation zone was observed near the leading edge of Line1, though it was not prominent. Analysis of Figure 9 reveals that as the mass flow rate increases, the flow acceleration around the outer lip surface at Line 1 under the favorable pressure gradient intensifies, leading to a significant reduction in the wall static pressure. As for the inner surface, after passing the favorable pressure region near the leading edge the flow encounters a strong adverse pressure gradient region. The magnitude of this adverse pressure gradient gradually decreases with increasing mass flow rate. Consequently, the adverse pressure effect on Line1 diminishes, resulting in the disappearance of separation zone at 10 kg/s.
To quantitatively analyze the coupled effects of crosswind and engine suction, the variations of the total pressure recovery coefficient (σ) and the distortion index (IDCmax) with mass flow rate plotted in Figure 10. In the absence of crosswind, IDCmax remains close to zero. However, the situation changes substantially as crosswind is introduced. Under the crosswind condition, as the mass flow increases from the lowest level studied, the intensity of the separation zone initially strengthens (as observed in Figure 8), causing IDCmax to rise. Subsequently, due to the enhanced favorable pressure gradient induced by higher mass flow rates, the flow reattaches and the separation zone dissipates, leading to a rapid decrease in distortion. Since no further separation occurs beyond this reattachment point, the distortion level remains low. The mass flow rate at which the distortion drops sharply divides the variation into two distinct phases, one in which the distortion increases gradually with mass flow rate, and the other in which the distortion remains at a low level despite increasing mass flow rates.
For the total pressure recovery coefficient, in the absence of crosswind, it decreases gradually with increasing mass flow rates due to the heightened total pressure loss caused by intensified boundary layer effects near the wall. Under crosswind conditions, the variation of the recovery coefficient exhibits three phases: in Phase I, the strength of the separation zone increases with mass flow, resulting in greater total pressure loss and a decline in the recovery coefficient. In Phase II, although the low-pressure zone intensifies, the shrinkage of the separation zone due to higher mass flow rates (as shown in Figure 8) ultimately leads to a rebound in the total pressure recovery coefficient. In Phase III, the recovery coefficient declines again, which is due to the increased total pressure loss from the enhanced boundary layer effects at the wall under higher mass flow rates combined with shock waves occurring at further increased mass flow rates.
3.3. Influence of Crosswind Velocity on the Inlet Flow Characteristics
By fixing the mass flow rate at 6 kg/s and varying the crosswind velocity, the impact of crosswind velocity on the inlet performance was analyzed. Based on the combined observations from Figure 6 and Figure 11, the adverse pressure gradient intensifies under the lowest crosswind velocity, inducing flow separation within the nacelle inlet. This separation zone continues to expand as the crosswind velocity increases. Due to the separation caused by crosswind, the effective flow area of the nacelle decreases, which becomes more pronounced with higher crosswind velocities. To adapt to the required mass flow rate at the outlet, the Mach number within the nacelle passage increases with the rising crosswind velocity, particularly more evidently on the separation side.
From Figure 12 it can be observed that at crosswind velocities ranging from 0 to 10 knots, no separation occurs inside the nacelle, resulting in low distortion. Beyond this range, however, separation emerges, leading to a rapid increase in distortion. As the crosswind velocity continues to rise, distortion also shows an increasing trend. Conversely, the total pressure recovery coefficient remains relatively stable when no separation is present but decreases with increasing crosswind velocity once separation occurs. In the previous analysis of the influence of mass flow rate, it was noted that distortion drops sharply at a certain mass flow rate. Combined with the observations in Figure 13a, the distortion index IDCmax initially increases with mass flow rate, then decreases rapidly, and finally stabilizes within a certain mass flow range under crosswind conditions. At a crosswind velocity of 35 knots, the distortion continues to increase within the mass flow range of 14–16 kg/s.
As observed in Figure 13a, under crosswind conditions, the peak distortion index IDCmax may occur at two distinct mass flow rate points, one at which immediately before the rapid decline in distortion, and the other where local supersonic flow induces shock-induced separation. For a crosswind velocity of 35 knots, these correspond to mass flow rates of 10.5 kg/s and 16 kg/s, respectively. The magnitude of the distortion peak and its corresponding mass flow position are closely related to the crosswind velocity. As the crosswind velocity increases, the distortion peak rises progressively, and its associated mass flow position shifts toward higher levels.
As shown in Figure 11, it is evident that higher crosswind velocities degrade the flow uniformity within the nacelle, manifesting as increased distortions at the AIP. The backward shift in the mass flow position of the distortion peak can be explained by the earlier analysis of the Line1 section: an increase in crosswind velocity amplifies the adverse pressure gradient near the wall (as observed in Figure 7a). Although this gradient diminishes with increasing mass flow rates (as observed in Figure 9), a higher mass flow rate is required to counteract the enhanced adverse pressure gradient caused by stronger crosswinds. Consequently, the mass flow position corresponding to the distortion peak shifts backward as the crosswind velocity increases.
As shown in Figure 13b, The total pressure recovery coefficient exhibits a consistent trend under increasing crosswind. It first decreases, then increases, and finally decreases again with rising mass flow rates. The recovery coefficient also displays a trough during this variation. The reasoning for the shift in its mass flow position is similar to that for the distortion. However, the recovery coefficient depends not only on the scope of the low-pressure zone at the AIP but also on its intensity. Therefore, the maximum distortion does not necessarily coincide with the minimum total pressure recovery coefficient. Specially, the mass flow rate at which the recovery coefficient is minimized is generally lower than that at which the distortion is maximized.
As shown in Figure 14, this is because the higher mass flow rate induces local supersonic flow near the lip of the Line1 section, leading to the formation of local separation bubble. The bubble dissipates the total pressure of the airflow and create a low-pressure zone downstream, thereby disrupting the uniformity of the flow at the AIP and increasing distortion. Similar separation bubbles are observed under other high-mass-flow conditions, but their scales are smaller and do not develop into significant separation, thus having negligible effects on distortion and the total pressure recovery coefficient.
3.4. Influence of Geometric Parameters on the Inlet Crosswind Flow Characteristics
This section investigates the effects of four geometric parameters on the nacelle inlet performance under crosswind conditions, i.e., the axial location of the throat, the fan face radius, the leading-edge radius of the outer contour, and the leading-edge radius of the inner contour. Based on the preceding analyses of the impacts of crosswind velocity and mass flow rate, the flow separation studied in this work consistently initiates and develops near the lip leading edge. Consequently, the influence of the leading-edge radius is more pronounced than that of the throat axial location or the fan face radius.
3.4.1. Influence of Throat Axial Location
While maintaining the other design parameters unchanged, three configurations were constructed based on the baseline configuration by varying the axial location of the throat. The ratios of the throat axial location to the inlet length (L_th/L_intake) were set at 65.44%, 50%, and 35%, as illustrated in Figure 15. As the throat position moves toward the leading edge, the radius of curvature of the internal contour near the leading edge increases, resulting in a transition of the leading-edge profile from sharp to blunt. Additionally, slight modifications occur in the aft segment of the geometric contour.
As observed in Figure 16 the wall pressure distribution along the internal contour exhibits significant variations. As the L_th/L_intake ratio decreases, the bluntness of the leading edge increases, thereby reducing the flow acceleration effect around the lip. Consequently, the peak pressure rises, and the pressure rise along the internal contour becomes more gradual, enabling the flow to better resist separation. For the configuration with L_th/L_intake = 35%, the forward shift of the throat location necessitates a non-monotonic expansion from the throat to the AIP to satisfy the curvature continuity requirement. Thus, after an initial rapid rise near the leading edge, the pressure shows a decreasing trend over a certain axial distance.
Overall, the forward shift of the throat location reduces the adverse pressure gradient near the leading edge of the internal contour. As shown in Figure 17a, this results in a decrease in the peak distortion and a forward shift in the corresponding mass flow rate. Meanwhile, Figure 17b indicates an overall improvement in the total pressure recovery coefficient. However, when the configurations operate under high-separation mass flow conditions (within the dashed box area), the distortion index IDCmax is largely unaffected by the axial location of the throat. Similarly, beyond the separation zone, the total pressure recovery coefficient remains nearly insensitive to the throat axial location over a certain mass flow range.
3.4.2. Influence of Fan Face Radius
Based on the configuration with L_th/L_intake = 35%, three variants were developed by varying the fan face radius, resulting in fan-to-highlight radius ratios (R_fan/R_hi) of 86.96%, 88.26%, and 89.57%. As shown in Figure 18, changes in the fan face radius primarily affect the diffuser section, with minor influences on the leading edge of the internal contour. An increase in the diffuser area ratio leads to higher pressure losses.
From the pressure distribution in Figure 19, the fan face radius predominantly influences the pressure field in the aft segment of the inlet, with negligible impact near the leading edge. The pressure peak and pressure gradient at the leading edge remain largely unaffected by changes in the fan face radius ratio. As observed in Figure 20a, variations in R_fan/R_hi have a minimal effect on the distortion trend with mass flow rate. The mass flow rate for the disappearance of separation shifts backward by only 0.5 kg/s between configurations R_fan/R_hi = 88.26% and 89.57%, and their pressure peaks are nearly identical, indicating that pressure characteristics near the leading edge are insensitive to changes in fan face radius.
However, for the total pressure recovery coefficient, Figure 20b reveals a significant decline in the mass flow range of 5–7.5 kg/s as the diffuser area ratio increases. The performance gap between configurations widens with higher mass flow rates. Within this range, the separation point is located near the lip leading edge, and Figure 21 shows that the separation zone expands with increasing diffuser area ratio, leading to a broader low-pressure zone at the AIP. This expansion reduces the total pressure recovery coefficient as the fan face radius increases. Beyond this range, the separation zone dissipates due to a weakened adverse pressure gradient at higher mass flow rates, and the recovery coefficient remains relatively stable across configurations.
In summary, the fan face radius significantly affects the total pressure recovery coefficient and the extent of the low-pressure zone at the AIP prior to the disappearance of separation, but has a minimal impact on the distortion index IDCmax. It is evident that changes in the fan face radius have a lesser influence on distortion and the mass flow rate for the disappearance of separation compared to variations in the throat axial location. Geometrically, the throat axial location directly alters the contour near the leading edge of the internal profile where flow separation originates. In contrast, the fan face radius primarily modifies the diffuser section, increasing pressure loss and thereby exerting a more pronounced effect on the total pressure recovery coefficient.
3.4.3. Influence of Leading-Edge Radius
Employing the iCST parameterization method while maintaining other parameters unchanged, the leading-edge radius of the outer contour was varied by factors of 0.95 and 1.05 relative to the base configuration, yielding two variants: ROC_O = 0.95base and ROC_O = 1.05base. Similarly, the leading-edge radius of the inner contour was adjusted to create ROC_I = 0.95base and ROC_I = 1.05base, yielding a total of five leading-edge configurations, as illustrated in Figure 22.
Figure 23 present the variations of the distortion index IDCmax and the total pressure recovery coefficient with mass flow rate under a crosswind velocity of 25 knots for these five configurations. The relationship between distortion and mass flow rate reveals that the leading-edge radius significantly influences the distortion trend. The peak distortion decreases as the leading-edge radius increases, and the mass flow rate at which distortion drops sharply shifts forward. As shown in Figure 23a when configurations operate under high-separation mass flow conditions (within the dashed box area), the distortion index IDCmax remains largely independent of the leading-edge radius.
For the ROC_O = 0.95base configuration, the distortion decreases from 0.0934 to 0.0665 after reaching its peak, while for ROC_I = 0.95base, it reduces from 0.0829 to 0.0614. This indicates that both configurations with smaller leading-edge radius exhibit severe internal flow separation across all mass flow conditions. In contrast, for ROC_O = 1.05base and ROC_I = 1.05base, the peak distortion drops rapidly to near zero at certain mass flow rates, confirming the disappearance of flow separation. The mass flow rate for the disappearance of separation advances from 10 kg/s for the base configuration to 8 kg/s and 7 kg/s for these two variants, respectively. The peak distortion decreases from 0.0650 for the base configuration to 0.0505 and 0.0405, respectively. The reduction in peak distortion and the forward shift in the critical mass flow rate have practical implications for engine operability.
As observed in Figure 23b, except for the ROC_I = 0.95base configuration, the variation trends of the total pressure recovery coefficient with mass flow rate are similar across the other configurations. As the leading-edge radius decreases, the recovery coefficient declines, and the entire curve shifts toward the lower-right direction. After reaching the mass flow rate for the disappearance of separation (within the dashed box area), the recovery coefficient becomes nearly identical to that under crosswind-free conditions.
To qualitatively analyze the influence of the leading-edge radius, two outer contour configurations were selected for analysis at a mass flow rate of 6 kg/s. As shown in Figure 24, the overall structure of the total pressure recovery coefficient contours is similar among the three configurations. However, as the leading-edge radius increases, the low-pressure zone at the AIP shrinks, resulting in an improvement in the recovery coefficient. The same trend applies to the inner contour leading-edge radius.
From Figure 22, it is evident that the geometric variation of the inner contour is less pronounced than that of the outer contour. However, the ROC_I = 1.05base configuration exhibits a greater forward shift in the mass flow rate for the disappearance of separation compared to the ROC_O = 1.05base configuration. Additionally, the peak distortion of the ROC_O = 0.95base configuration is higher than that of the ROC_I = 0.95base configuration. This indicates that the flow separation under crosswind conditions is more sensitive to changes in the inner contour than to the outer contour.
As established in earlier analysis, during airflow around the lip, the Line1 section experiences extreme favorable pressure gradients followed by adverse pressure gradients near the leading edge. The severe adverse pressure gradient triggers separation originating from the lip leading edge. Therefore, leading-edge parameters likely influence the peak distortion index IDCmax and the mass flow rate for the disappearance of separation by altering the pressure distribution around the lip.
To isolate the pressure changes induced by the leading-edge radius, the wall pressure distribution along the Line1 section for the outer contour configurations under crosswind-free conditions at 6 kg/s is plotted in Figure 25. The results show that changes in the outer leading-edge radius significantly affect the pressure distribution on the inner contour. As the leading-edge radius decreases, the peak pressure at the leading edge drops, indicating stronger flow acceleration around the lip. Simultaneously, the adverse pressure gradient near the inner leading edge intensifies with a smaller radius, manifested as a steeper pressure rise in the figure. Consequently, configurations with smaller leading-edge radius are more prone to separation. While increasing mass flow rate can mitigate the adverse pressure gradient under crosswind conditions, reducing the leading-edge radius exacerbates it. Thus, for configurations with smaller leading-edge radius, the mass flow rate required for the disappearance of separation decreases as the flow rate increases.
In summary, regarding the influence of geometric parameters on the nacelle inlet flow under crosswind conditions, the leading-edge radius exerts the most pronounced effect on both the total pressure distortion and the total pressure recovery. When the leading-edge radius is sufficiently small, flow separation within the nacelle inlet may persist even with increasing mass flow rates, due to the inability of the enhanced favorable pressure gradient to fully suppress separation. In contrast, variations in the fan face radius primarily affect pressure loss in the diffuser section, with a minimal impact on the pressure peak and pressure gradient near the leading edge. Consequently, changes in the fan face radius have a limited effect on the distortion index IDCmax but significantly influence the total pressure recovery coefficient. The axial location of the throat alters the curvature distribution near the leading edge of the internal contour, thereby moderately affecting both the total pressure distortion and the total pressure recovery.
4. Conclusions
This study systematically investigates the flow characteristics and performance of a nacelle inlet under crosswind conditions through numerical simulation, focusing on the effects of crosswind velocity, mass flow rate, and key geometric parameters. The main conclusions are as follows.
1. Influence of mass flow rate. The coupling effect of engine suction and crosswind dictates the flow pattern. The total pressure distortion index (IDCmax) initially increases with mass flow rate due to the strengthening of the separation zone, then drops sharply after a critical mass flow rate is reached due to a complete flow reattachment. The total pressure recovery coefficient (σ) exhibits a more complex three-phase trend with increasing mass flow rates, influenced by the competing roles of separation intensity and separation zone area.
2. Influence of crosswind velocity. Increasing crosswind velocity intensifies the adverse pressure gradient on the windward side, promoting flow separation and expanding the separation zone. This leads to a continuous increase in distortion and a corresponding decrease in the total pressure recovery coefficient. The flow field uniformity at the AIP deteriorates significantly with higher crosswind velocity.
3. Influence of geometric parameters. (1) Leading-edge radius is the most influential geometric parameter. Increasing the radii of both the inner and outer contours effectively reduces the peak distortion value and advances the mass flow rate required for the disappearance of separation by mitigating the adverse pressure gradient near the lip. An insufficient radius can lead to persistent separation at all the mass flow rates of interest. (2) Moving throat axial location forward reduces the lip curvature and adverse pressure gradient, thereby lowering the peak distortion, advancing the critical mass flow rate for the disappearance of separation, and improving the pressure recovery coefficient across the majority of the operating range. (3) Fan face radius primarily affects the diffuser section. This parameter has a minor impact on distortion index but a significant influence on the total pressure recovery coefficient, mainly by altering the total pressure loss characteristics and the extent of the low-pressure zone at the AIP. Its effect on the leading-edge flow separation is limited.
In summary, optimizing the lip leading-edge geometry is the most effective strategy for mitigating the adverse effects of crosswind. The findings of this study may provide some insights and a parametric foundation for the design of nacelle inlets with robust performance across on-design and off-design conditions, particularly under challenging crosswind operations.
Author Contributions
Conceptualization, X.S. and B.T.; methodology, X.S.; software, X.S.; formal analysis, C.L. and Z.W.; investigation, X.S. and Z.W.; resources, B.T. and C.L.; writing—original draft preparation, X.S.; writing—review and editing, Z.W.; visualization, X.S.; All authors have read and agreed to the published version of the manuscript.
Funding
This research was funded by the Aeronautical Science Foundation of China (Grant No. 20240032052001).
Data Availability Statement
The raw data supporting the conclusions of this article will be made available by the authors on request.
Acknowledgments
The authors are grateful for the financial support provided by the Aeronautical Science Foundation of China,which made this research possible.
Conflicts of Interest
The authors declare that they have no known competing financial interests or personal relationships that could appear to influence the work reported in this paper.
Nomenclature
| Matrix of coefficients | |
| AIP | Aerodynamic interface plane |
| Bernstein polynomial | |
| The maximum length of profile | |
| Class function | |
| CST | Class-Shape transformation |
| Index of summation | |
| iCST | Intuitive class shape transformation |
| IDCmax | Maximum circumferential distortion index |
| L_intake | The length of intake |
| L_m | The axial location of the maximum thickness of the nacelle |
| L_nac | The length of nacelle |
| L_th | The axial location of throat |
| Super-elliptic exponent | |
| Bernstein polynomial order or super-elliptic exponent | |
| The number of probe rings | |
| First exponent in the class function | |
| Second exponent in the class function | |
| Total pressure | |
| The average total pressure | |
| qm | Mass flow rate of the nacelle |
| ROC_I | The radius of curvature at leading edge of inner profile |
| ROC_O | The radius of curvature at leading edge of outer profile |
| R_fan | The radius of fan face |
| R_hi | The Radius of highlight plane |
| R_m | The radius of nacelle at the maximum thickness location |
| R_te | The radius of nacelle trailing edge |
| R_th | The radius throat |
| Shape function | |
| SIMPLEC | Semi-implicit method for pressure linked equations |
| SST | Shear-stress transport |
| Vc | Velocity of crosswind |
| Axial coordinate | |
| Radial coordinates | |
| β_i | The boattail angle of inner profile |
| β_o | The boattail angle of outer profile |
| Non-dimensional ordinate | |
| σ | Mass flow averaged total pressure recovery coefficient |
| Non-dimensional abscissa |
Appendix A
Appendix A.1
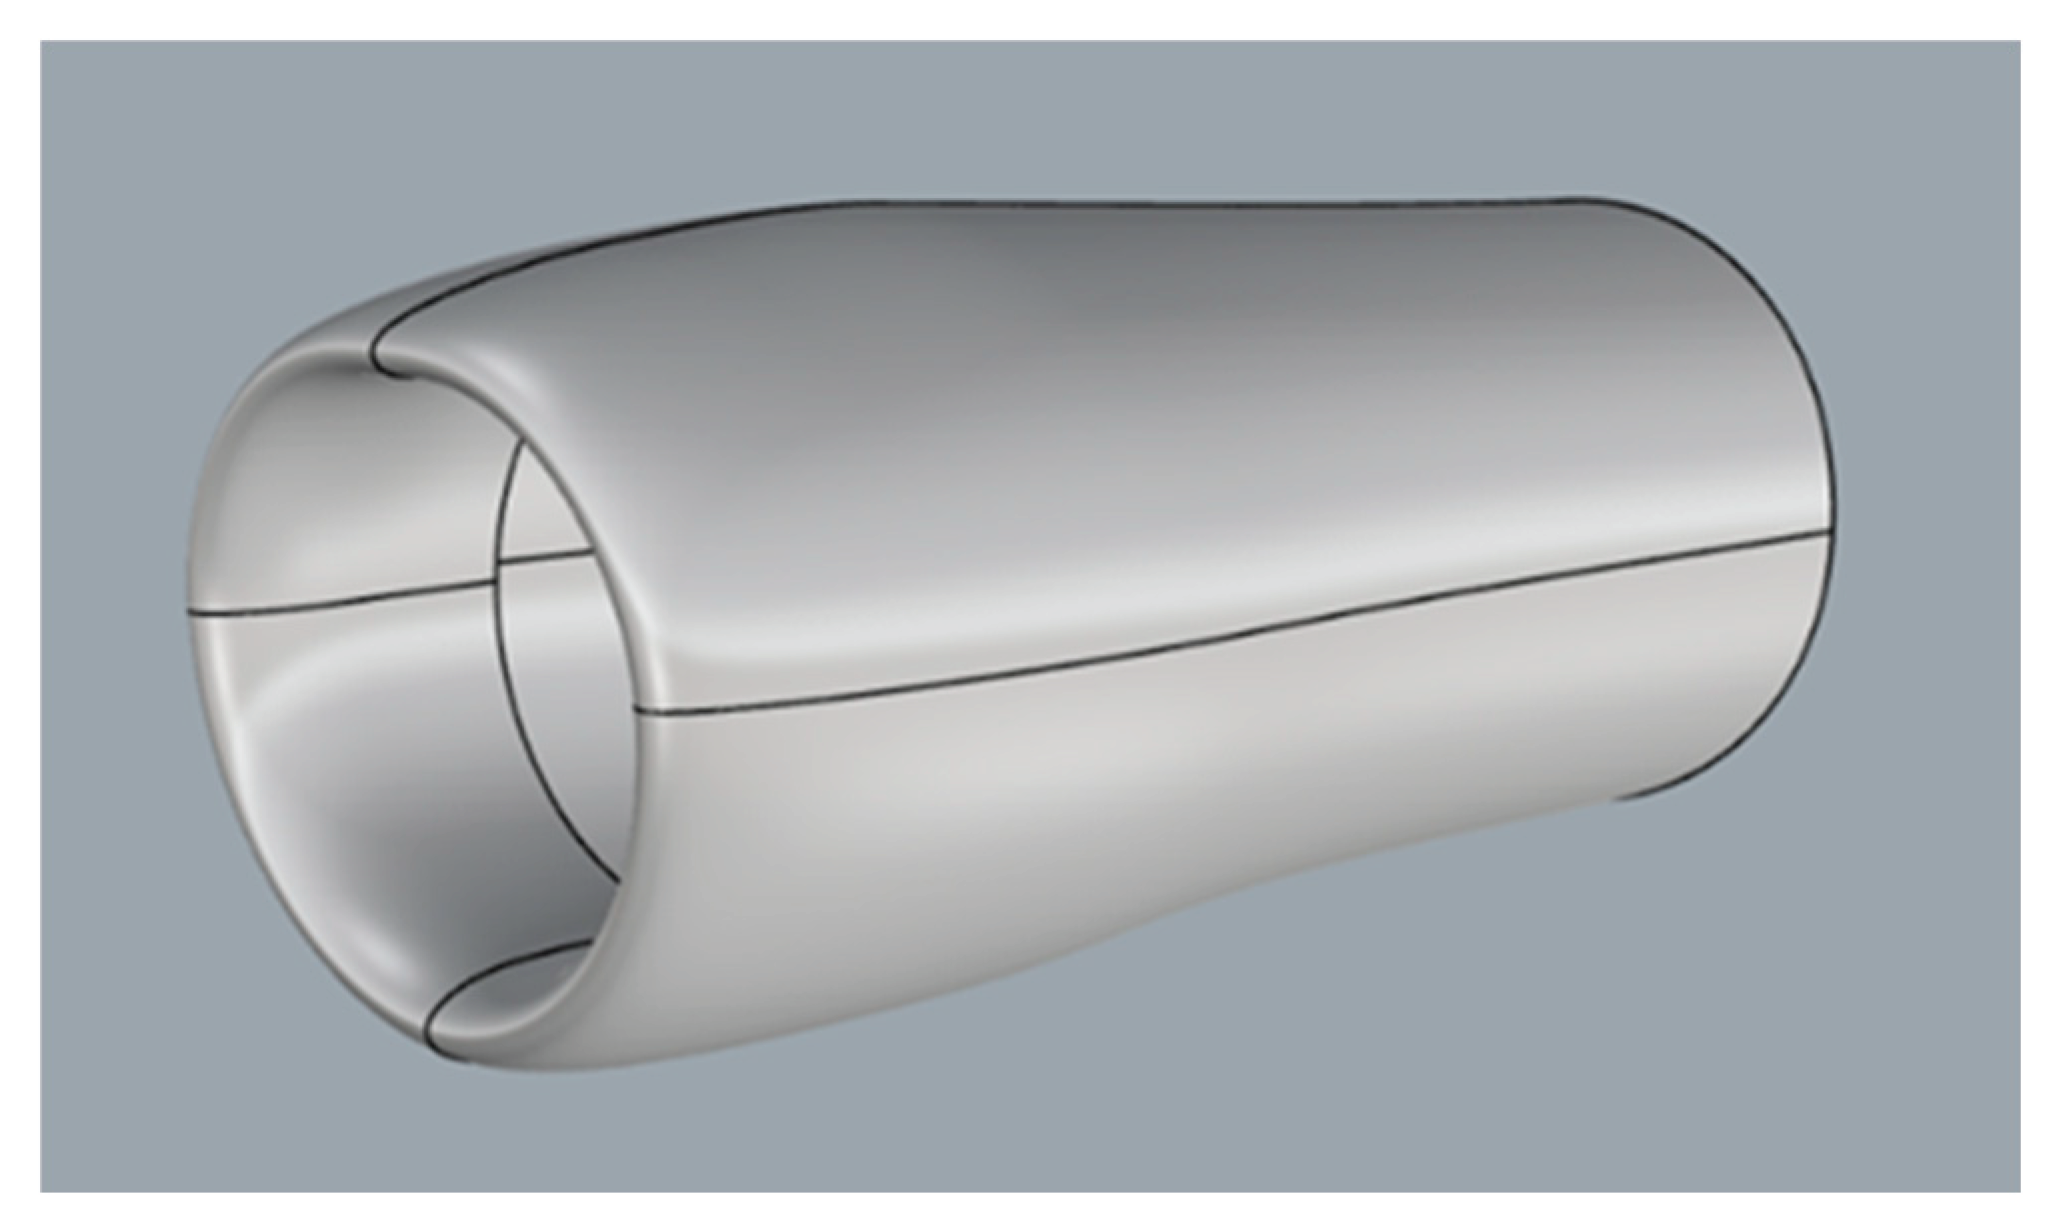
This appendix details the construction methodology of the asymmetric three-dimensional nacelle model employed in this study. First, based on the two-dimensional sectional information provided in Reference [3,5,6,7], discrete point data for three key profiles of the Lara nacelle—namely, the upper, side, and lower sections—were extracted. Subsequently, the two-dimensional profile parameterization method described in Section 2.1 of this paper was applied to generate the corresponding parameterized profiles, the results of which are shown in Figure A1.On this basis, interpolation calculations were performed between each pair of adjacent parameterized profiles to generate a series of transitional sections. The outcomes of this transitional profile generation are presented in Figure A2 All profiles were then spatially arranged circumferentially around the nacelle axis according to their actual corresponding azimuthal positions, as illustrated in Figure A3. Finally, a surface construction technique was employed to generate the complete three-dimensional nacelle model, with the final geometry displayed in Figure A4.
Figure A1.
Parameterized profiles of the upper, side and lower sections for the full-scale model used in Ref. [3].
Figure A1.
Parameterized profiles of the upper, side and lower sections for the full-scale model used in Ref. [3].
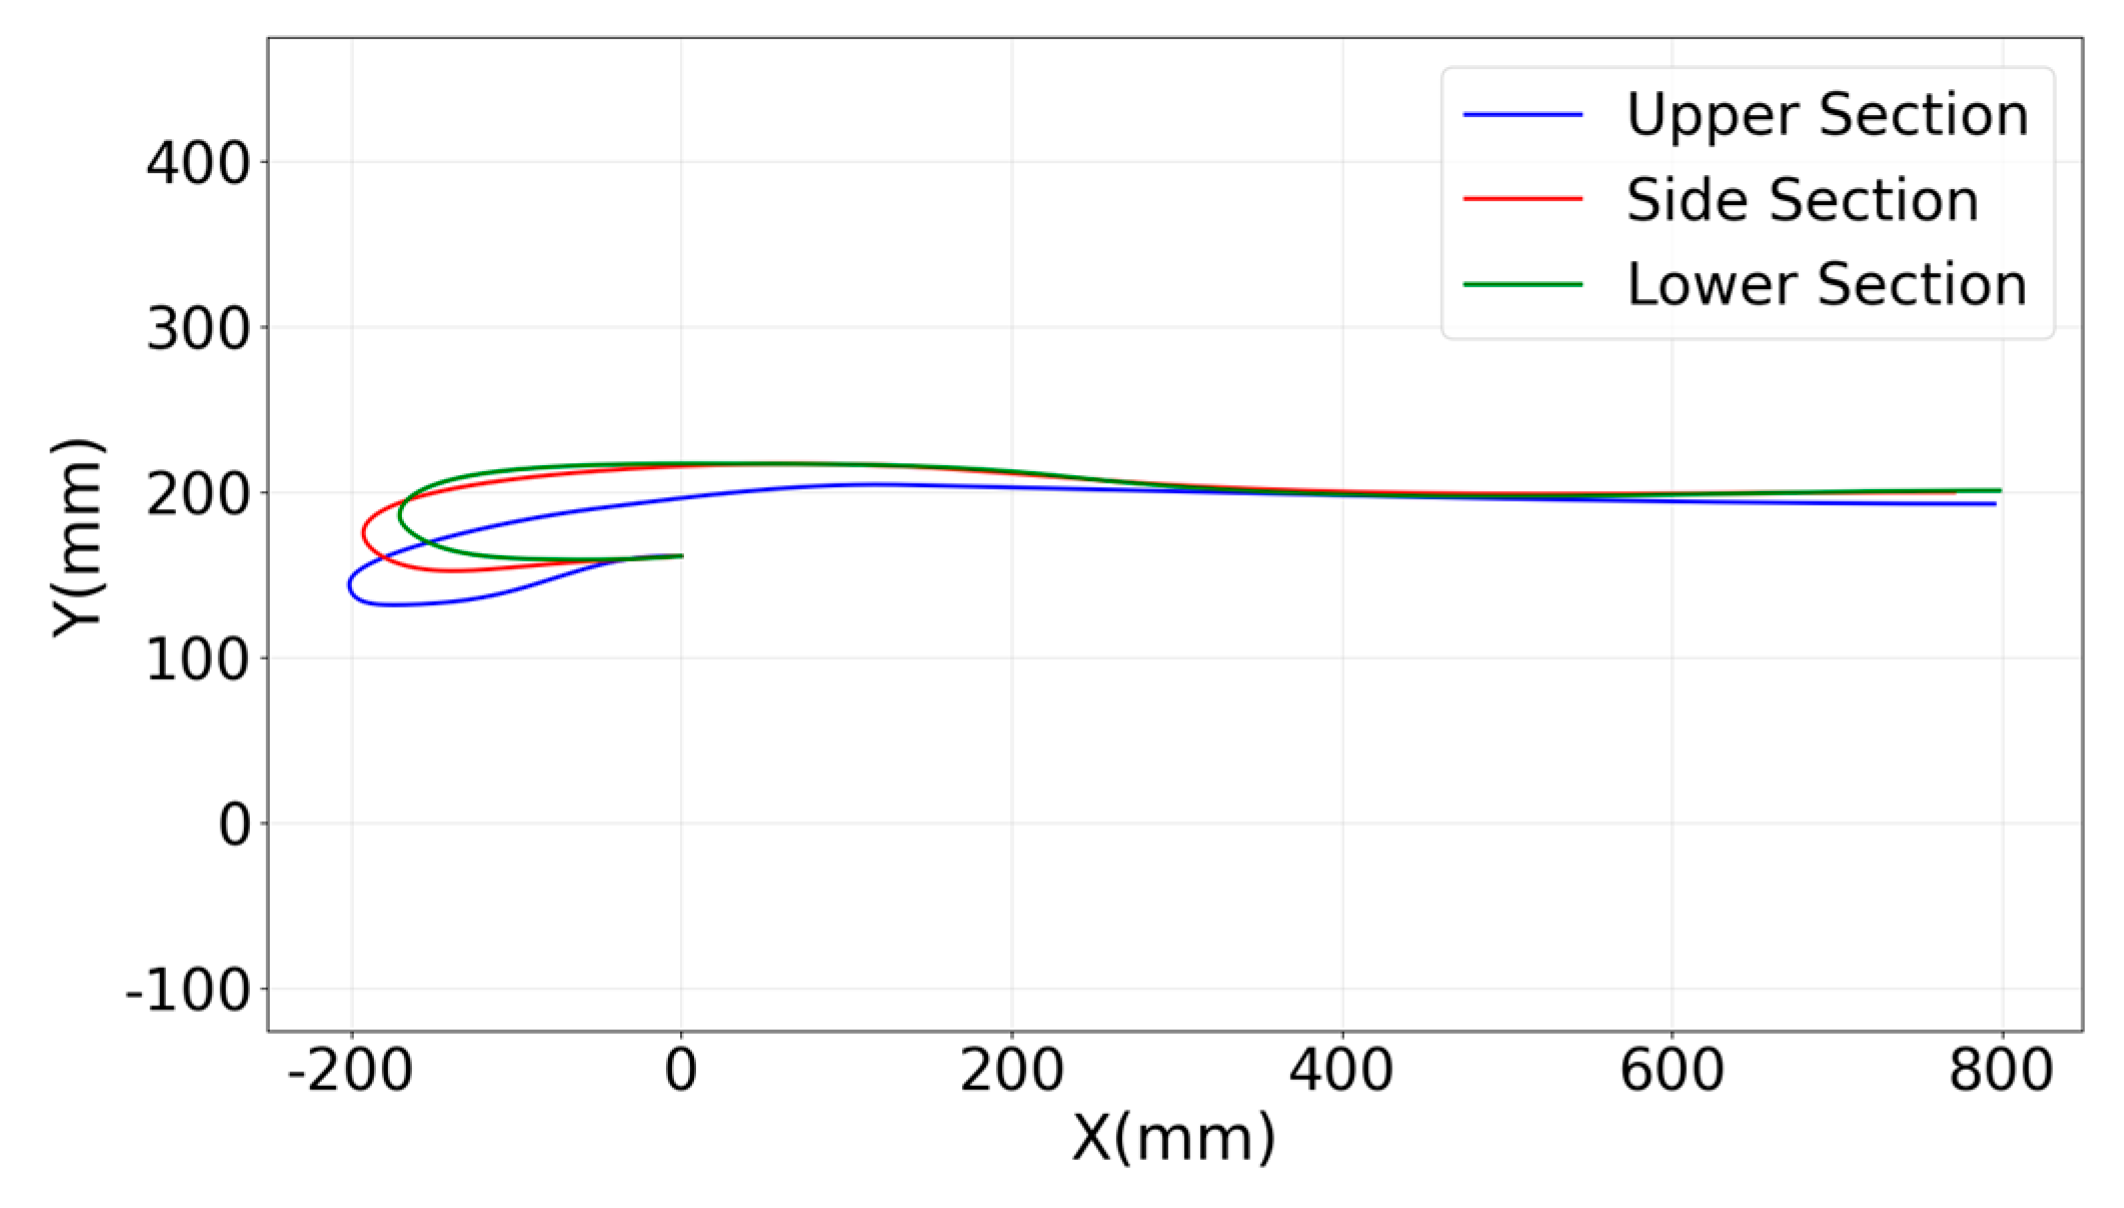
Figure A2.
Interpolated sections between neighboring profiles.
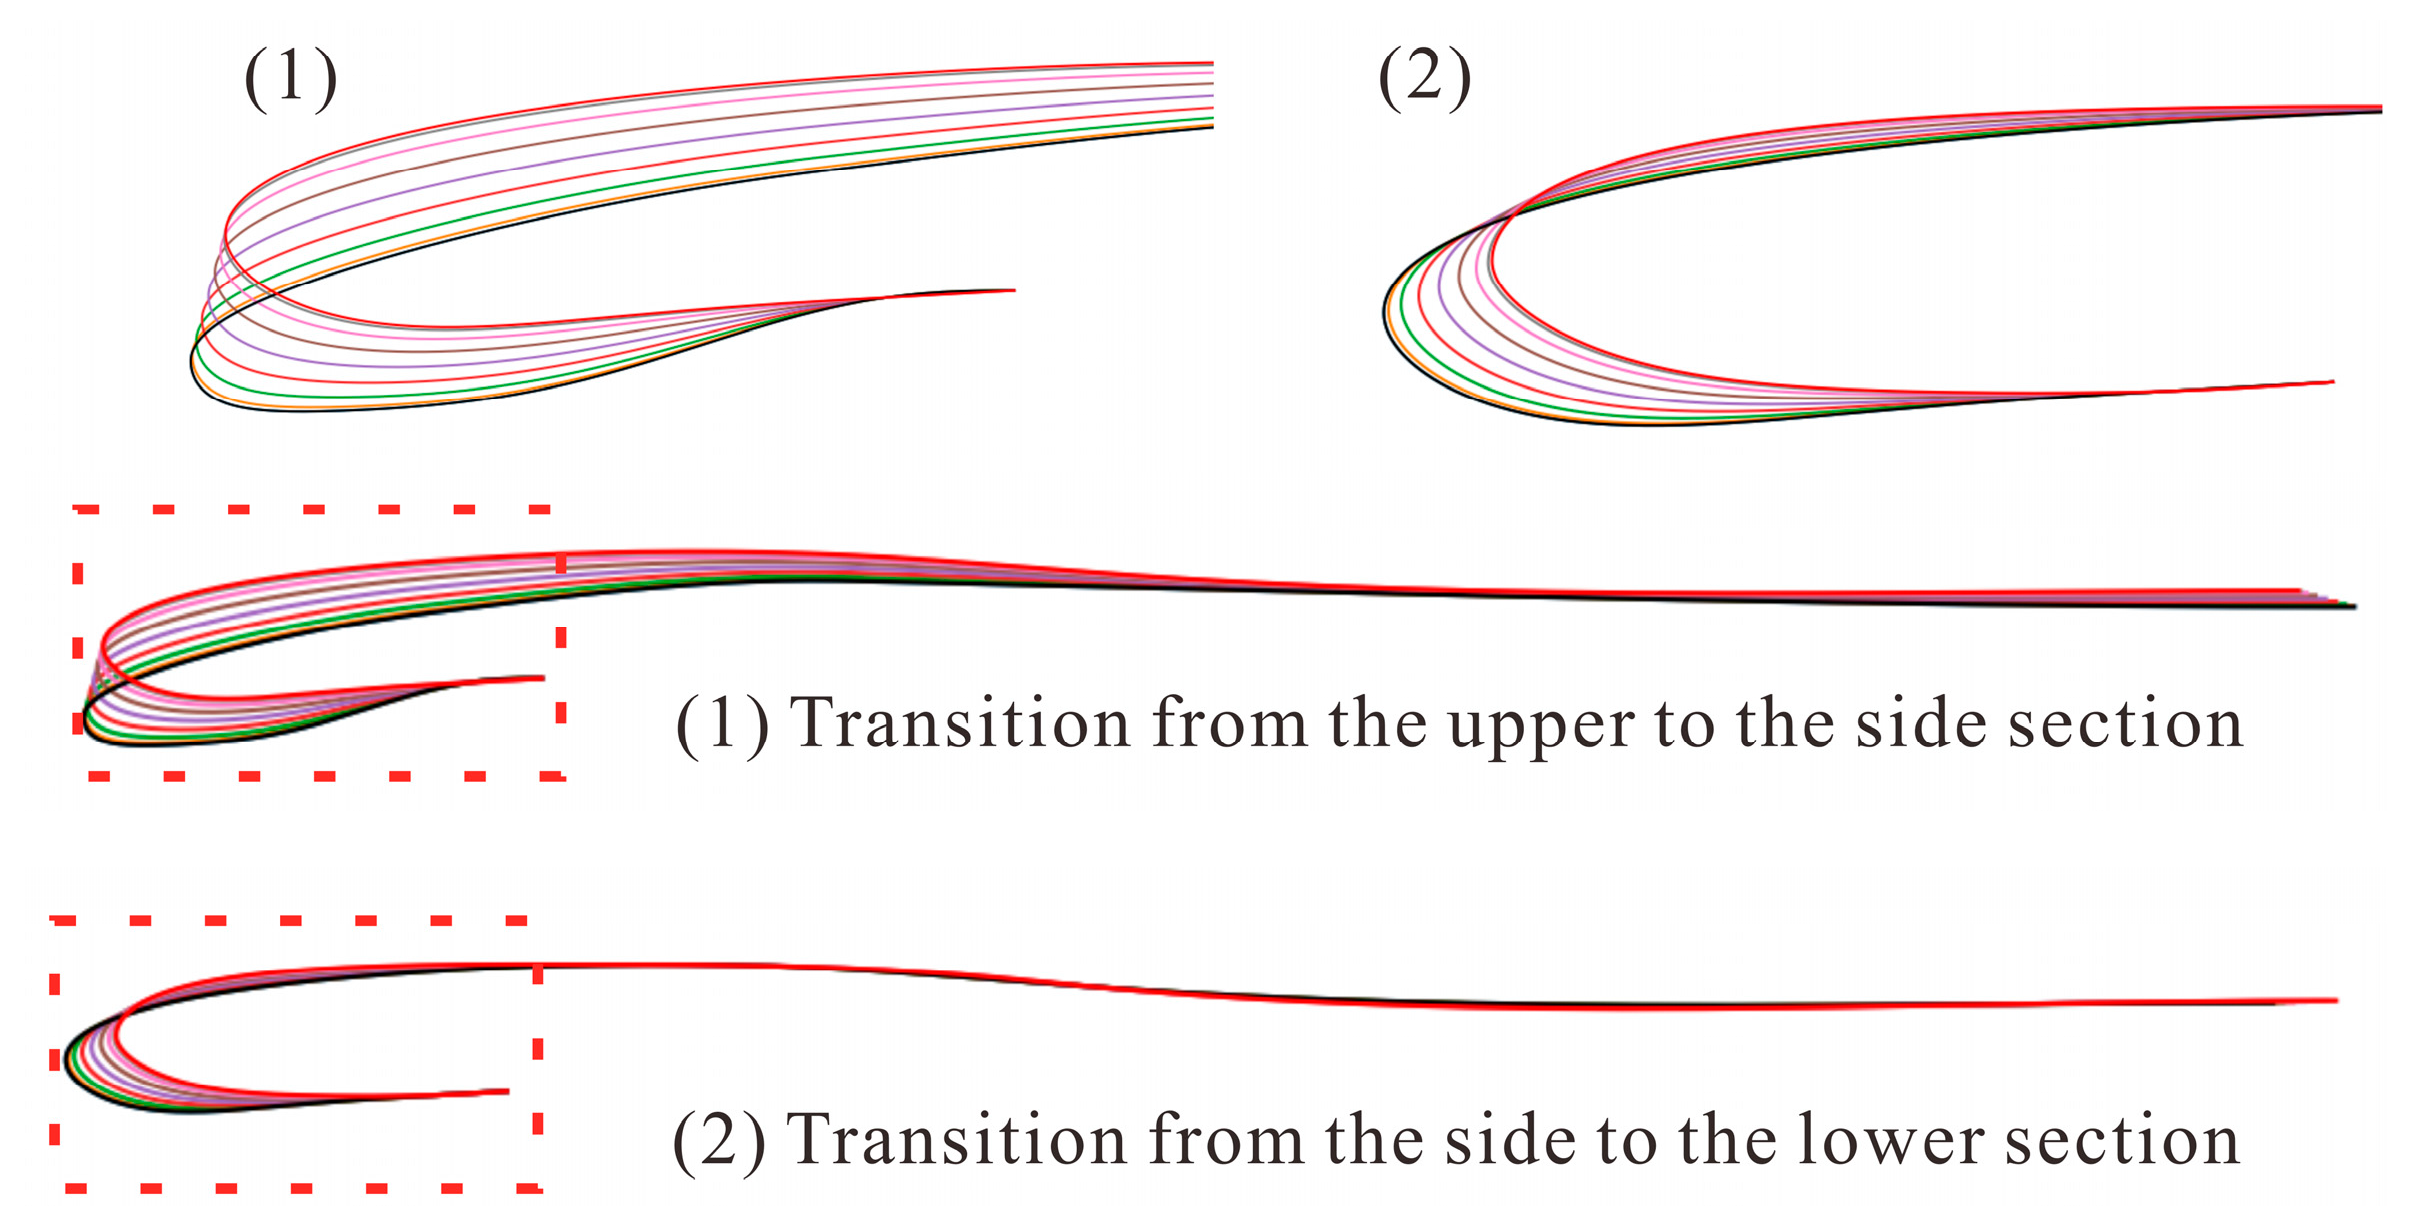
Figure A3.
Schematic of circumferential arrangement of profiles.
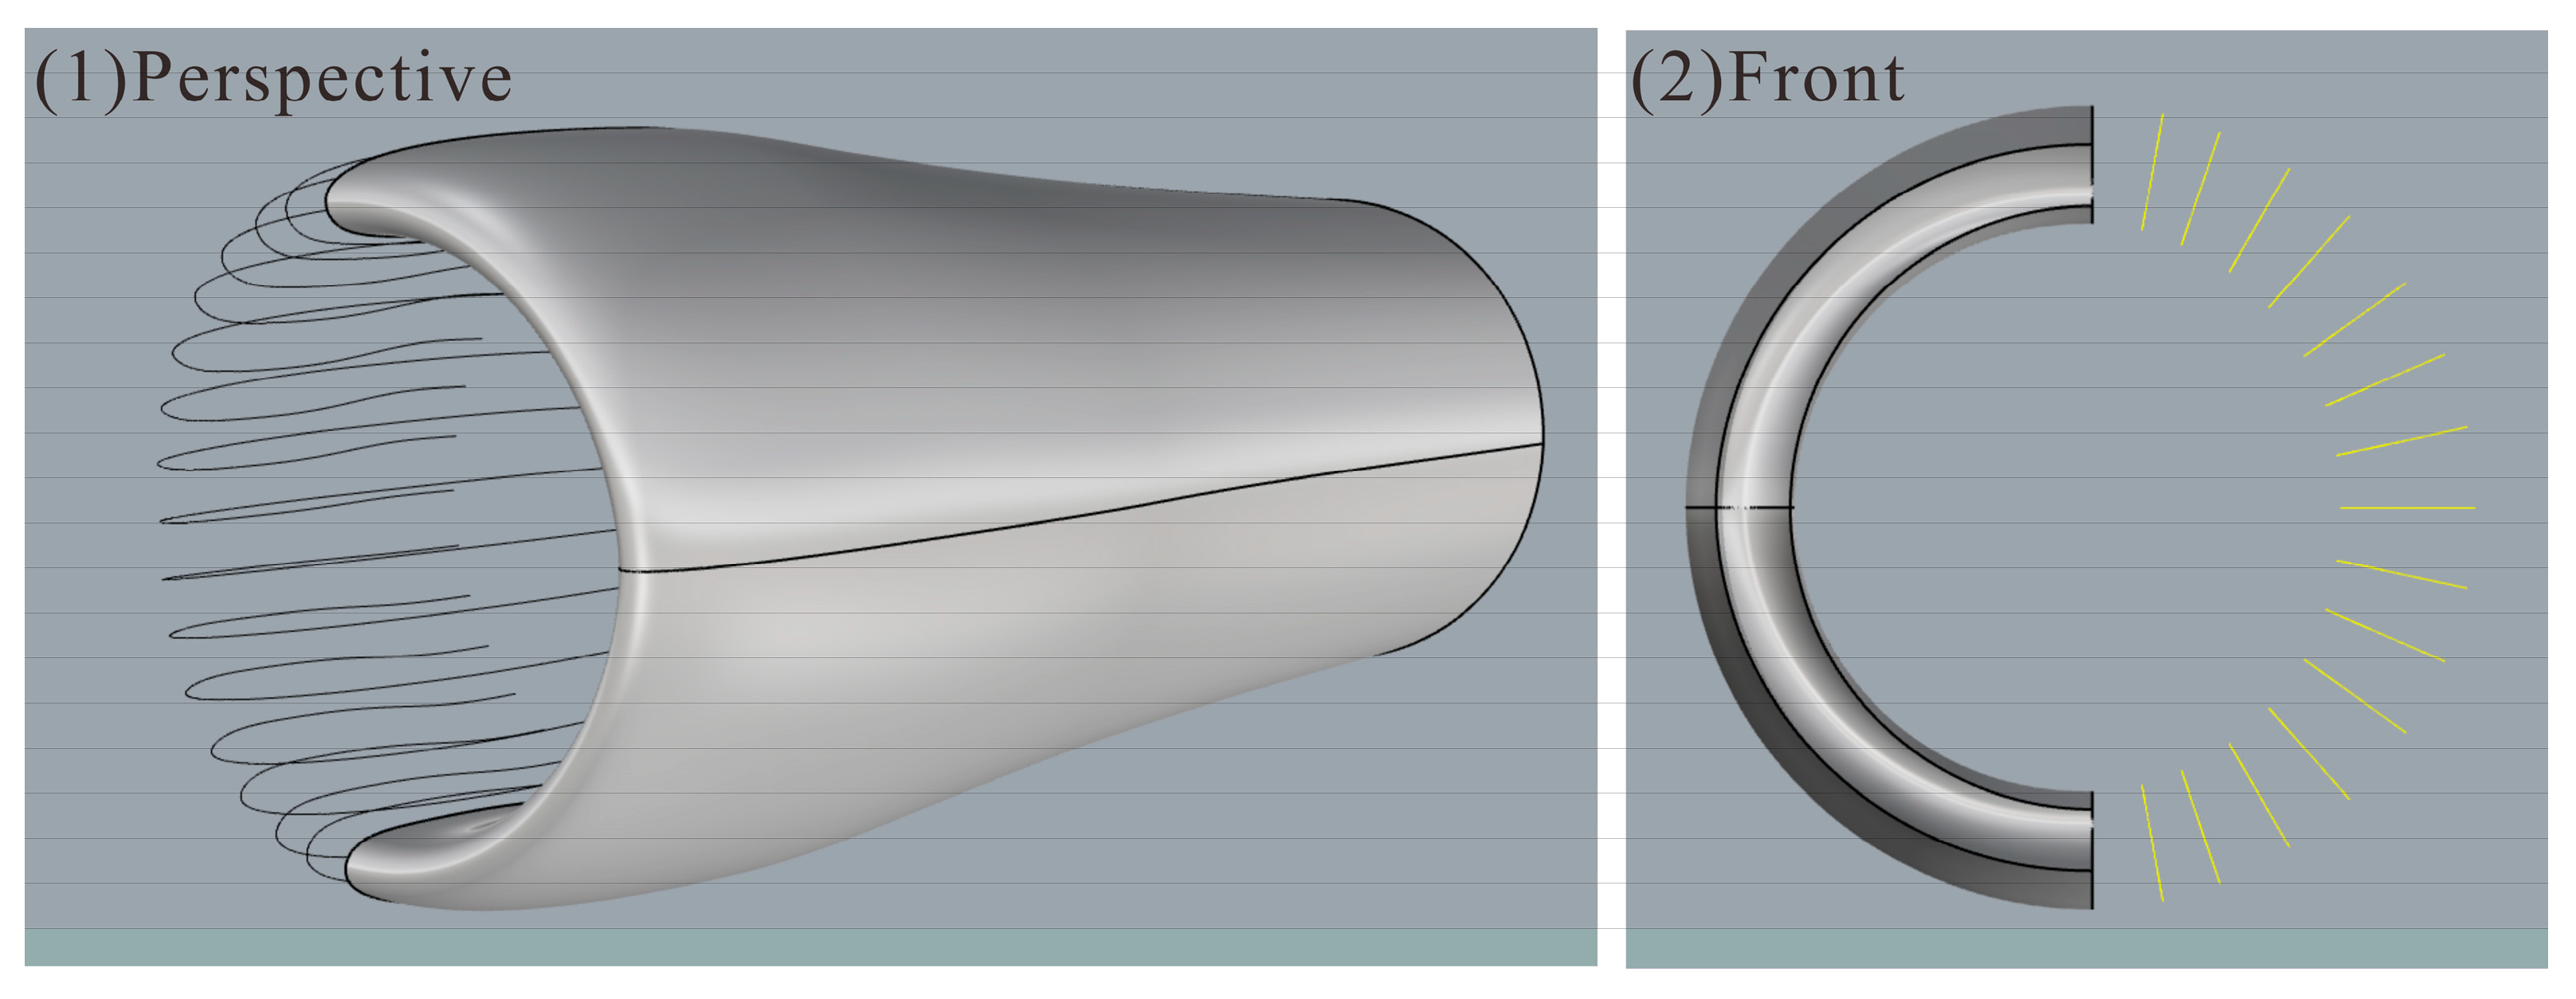
Figure A4.
Three-Dimensional Non-Axisymmetric Nacelle Geometry.
References
- Part F A R. 25: Airworthiness standards: Transport category airplanes[J]. Federal Aviation Administration, Washington, DC, 2002, 7.
- CCAR25-R4 Civil Aviation Regulations of China Part 25 Airworthiness Standards for Aircraft.
- Lecordix J L, Mullender A, Lecossais E, et al. Hybrid laminar flow nacelle design[J]. Tiré à part- Office national d'études et de recherches aerospatiales, 1996.
- Quémard C, Garçon F, Raynal J C. High Reynolds number air intake tests in the ONERA F1 and S1MA wind tunnels[C]//Workshop on airframe engine integration at DLR. 1996.
- Colin Y, Aupoix B, Boussuge J F, et al. Numerical simulation of the distortion generated by crosswind inlet flows[C]//International Symposium on Air Breathing Engines–2007. 2007.
- Colin Y, Aupoix B, Boussuge J F, et al. Prediction of crosswind inlet flows: some numerical and modelling challenges[C]//Proceedings of the 18th ISABE Conference. 2007: 1-13.
- Colin Y, Aupoix B, Boussuge J F, et al. Numerical simulation and analysis of crosswind inlet flows at low Mach numbers[C]//8th International Symposium on Experimental and Computational Aerothermodynamics of Internal Flows Lyon. 2007.
- Zhang M. Numerical investigation of nacelle intake flow distortion at crosswind conditions[C]//32nd Congress of the International Council of the Aeronautical Sciences, ICAS. 2021, 2021: 1-11.
- Nichols D A, Vukasinovic B, Glezer A, et al. Steady and Unsteady Control of Nacelle Inlet Flow in Crosswind[C]//AIAA Scitech 2021 Forum. 2021: 1556.
- Tourrette L. Navier-Stokes simulations of air-intakes in crosswind using local preconditioning[C]//32nd AIAA Fluid Dynamics Conference and Exhibit. 2002: 2739.
- Kokubo R, Fujimura S, Yamamoto M, et al. Numerical study of inlet distortion under crosswind conditions using OpenFOAM[C]//AIAA AVIATION FORUM AND ASCEND 2024. 2024: 3920.
- Burley R. Effect of lip and centerbody geometry on aerodynamic performance of inlets for tilting-nacelle VTOL aircraft[C]//17th Aerospace Sciences Meeting. 1979: 381.
- Younghans J, Hoelmer W, Stockman N. Low speed effects of Reynolds number and lip geometry on high bypassratio inlet performance[C]//20th Aerospace Sciences Meeting. 1982: 59.
- QI Min, WANG Zhan-xue, ZHOU Li, et al. Numerical Study on Effects of Lip Geometric Parameters on Performance of Nacelle Inlet[J]. Journal of Propulsion Technology, 2020, 41(9): 2021-2030.
- WEI Y B, DUAN Z Y, GUO Z D, et al. Parameterization investigation method for nacelle aerodynamic performance[J]. Acta Aeronautica et Astronautica Sinica, 2022, 43(11): 526742 (in Chinese).
- Kulfan B M. Universal parametric geometry representation method[J]. Journal of aircraft, 2008, 45(1): 142-158. [CrossRef]
- Zhu F, Qin N. Intuitive class/shape function parameterization for airfoils[J]. AIAA journal, 2014, 52(1): 17-25. [CrossRef]
- Christie R, Heidebrecht A, MacManus D. An automated approach to nacelle parameterization using intuitive class shape transformation curves[J]. Journal of Engineering for Gas Turbines and Power, 2017, 139(6): 062601. [CrossRef]
- Tejero F, Christie R, MacManus D, et al. Non-axisymmetric aero-engine nacelle design by surrogate-based methods[J]. Aerospace Science and Technology, 2021, 117: 106890. [CrossRef]
- SAE APR1420B, Gas Turbine Engine Inlet Flow Distortion Guidelines, 2011.
Figure 1.
Geometric parameter definition of the nacelle.
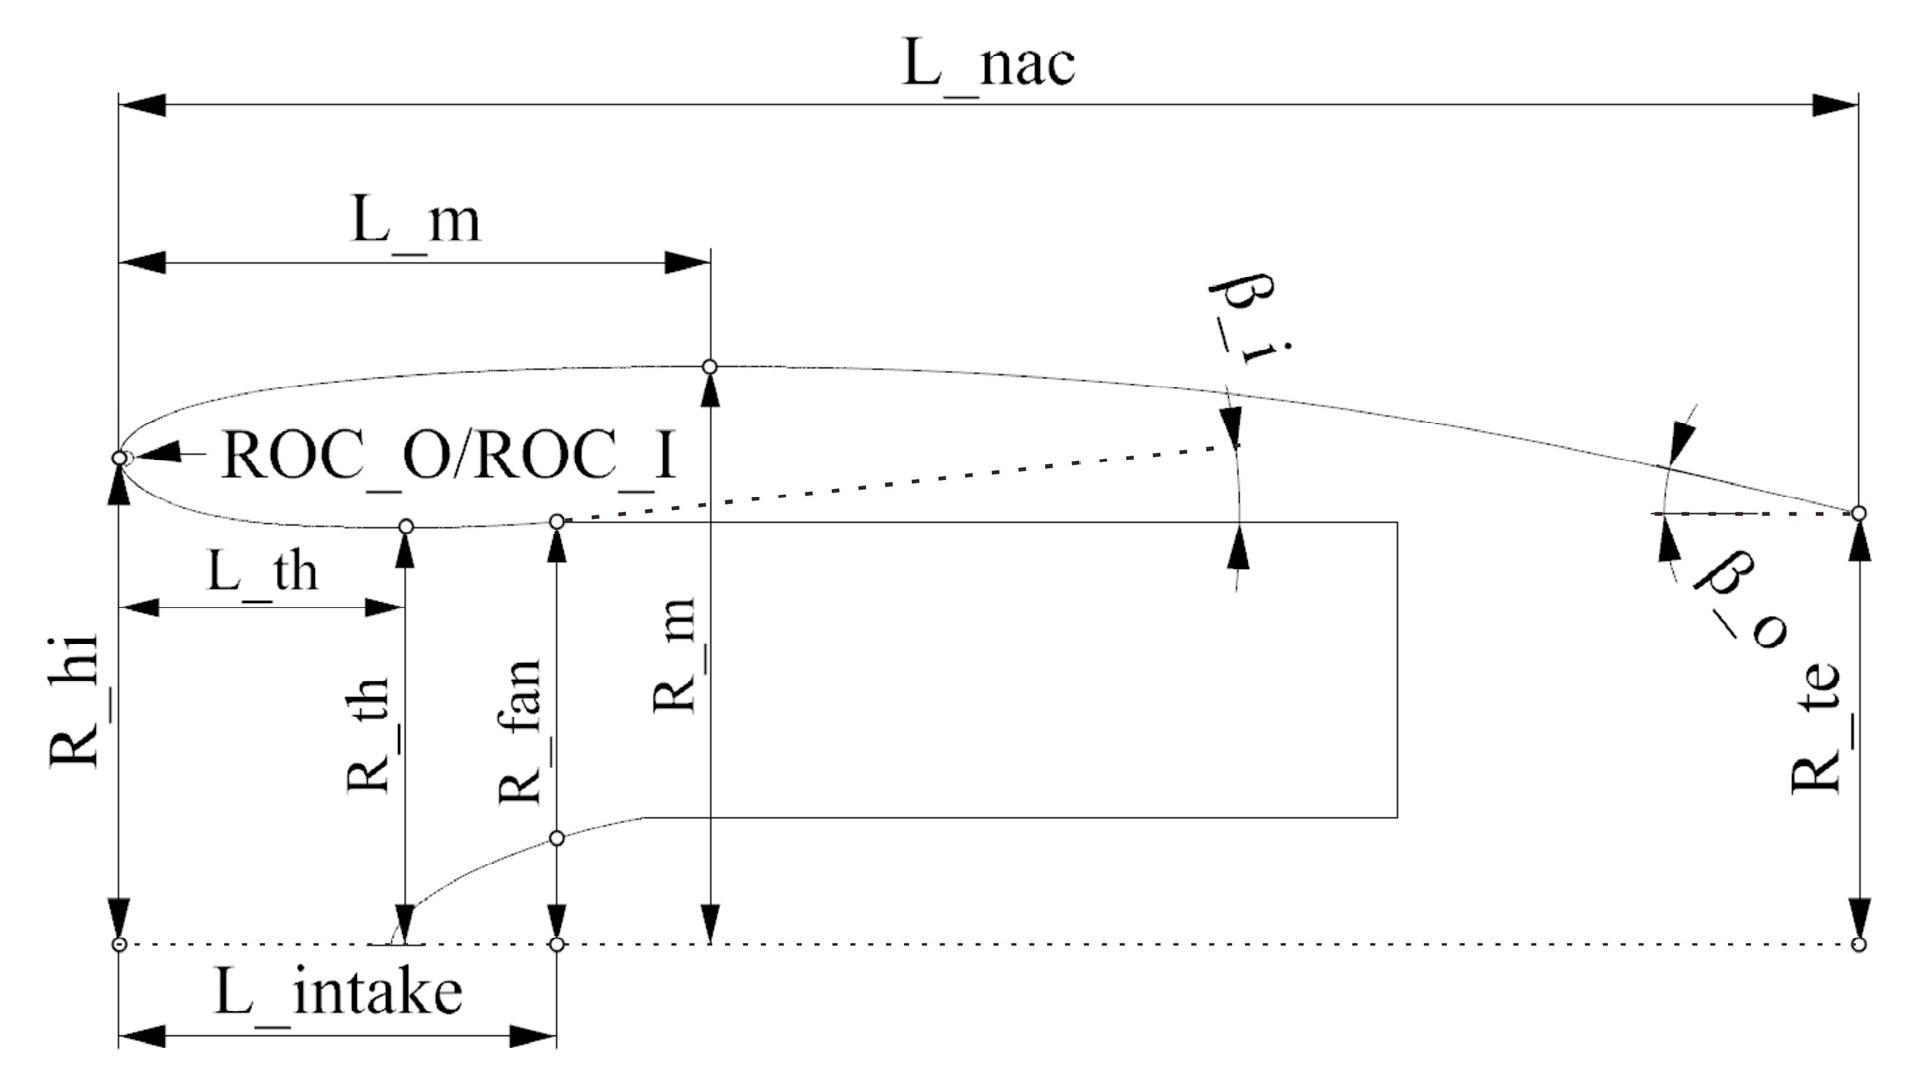
Figure 2.
Configuration of the computational domain.
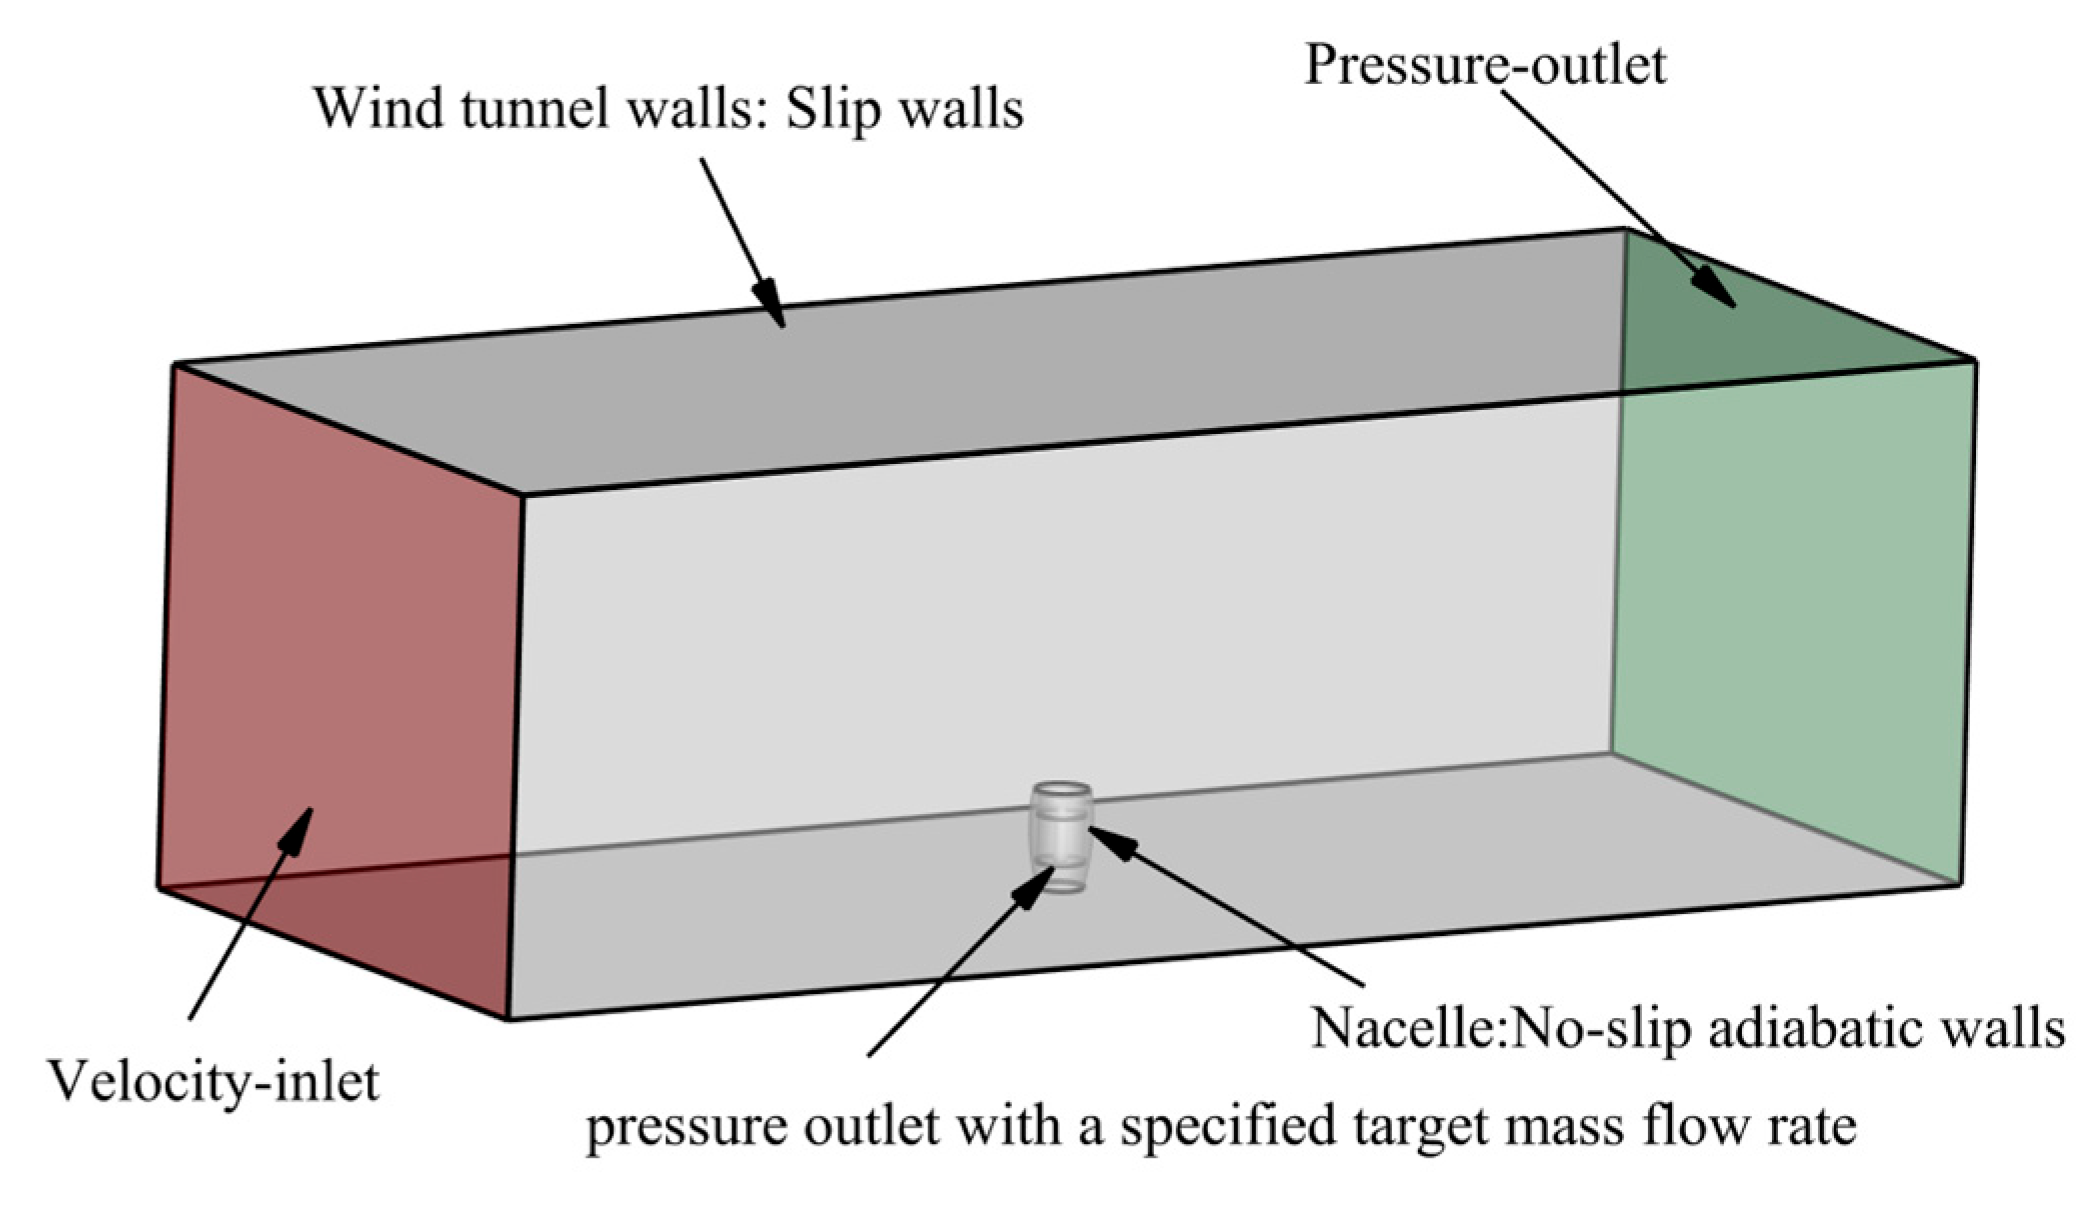
Figure 3.
Schematic of the AIP total pressure rake.
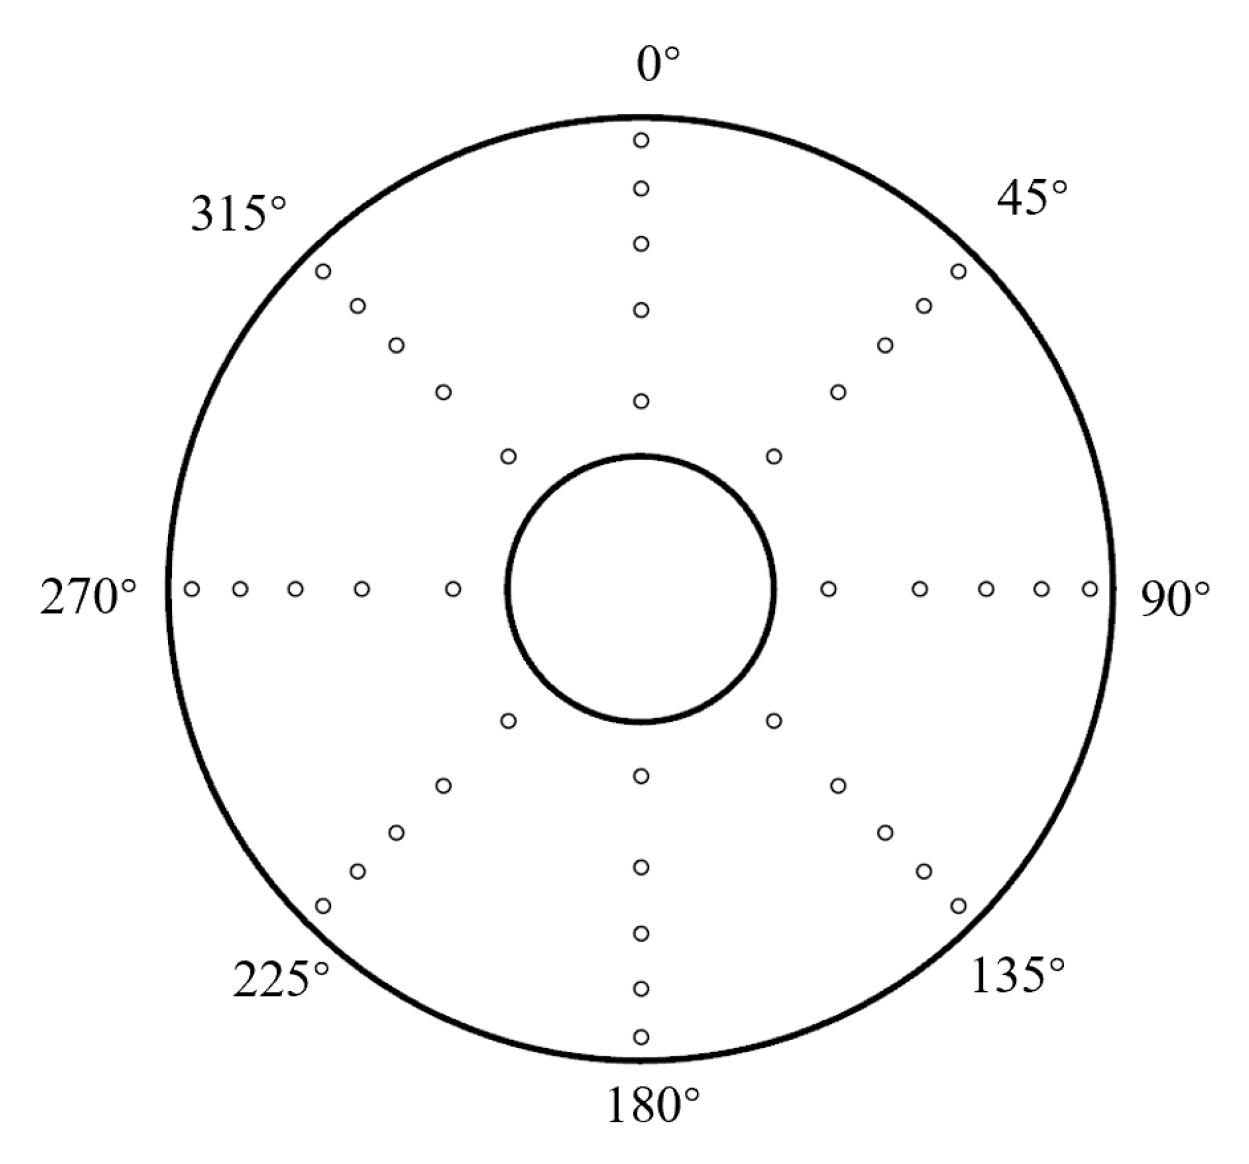
Figure 4.
Validation of Numerical Results with Experimental Data [3].
Figure 4.
Validation of Numerical Results with Experimental Data [3].
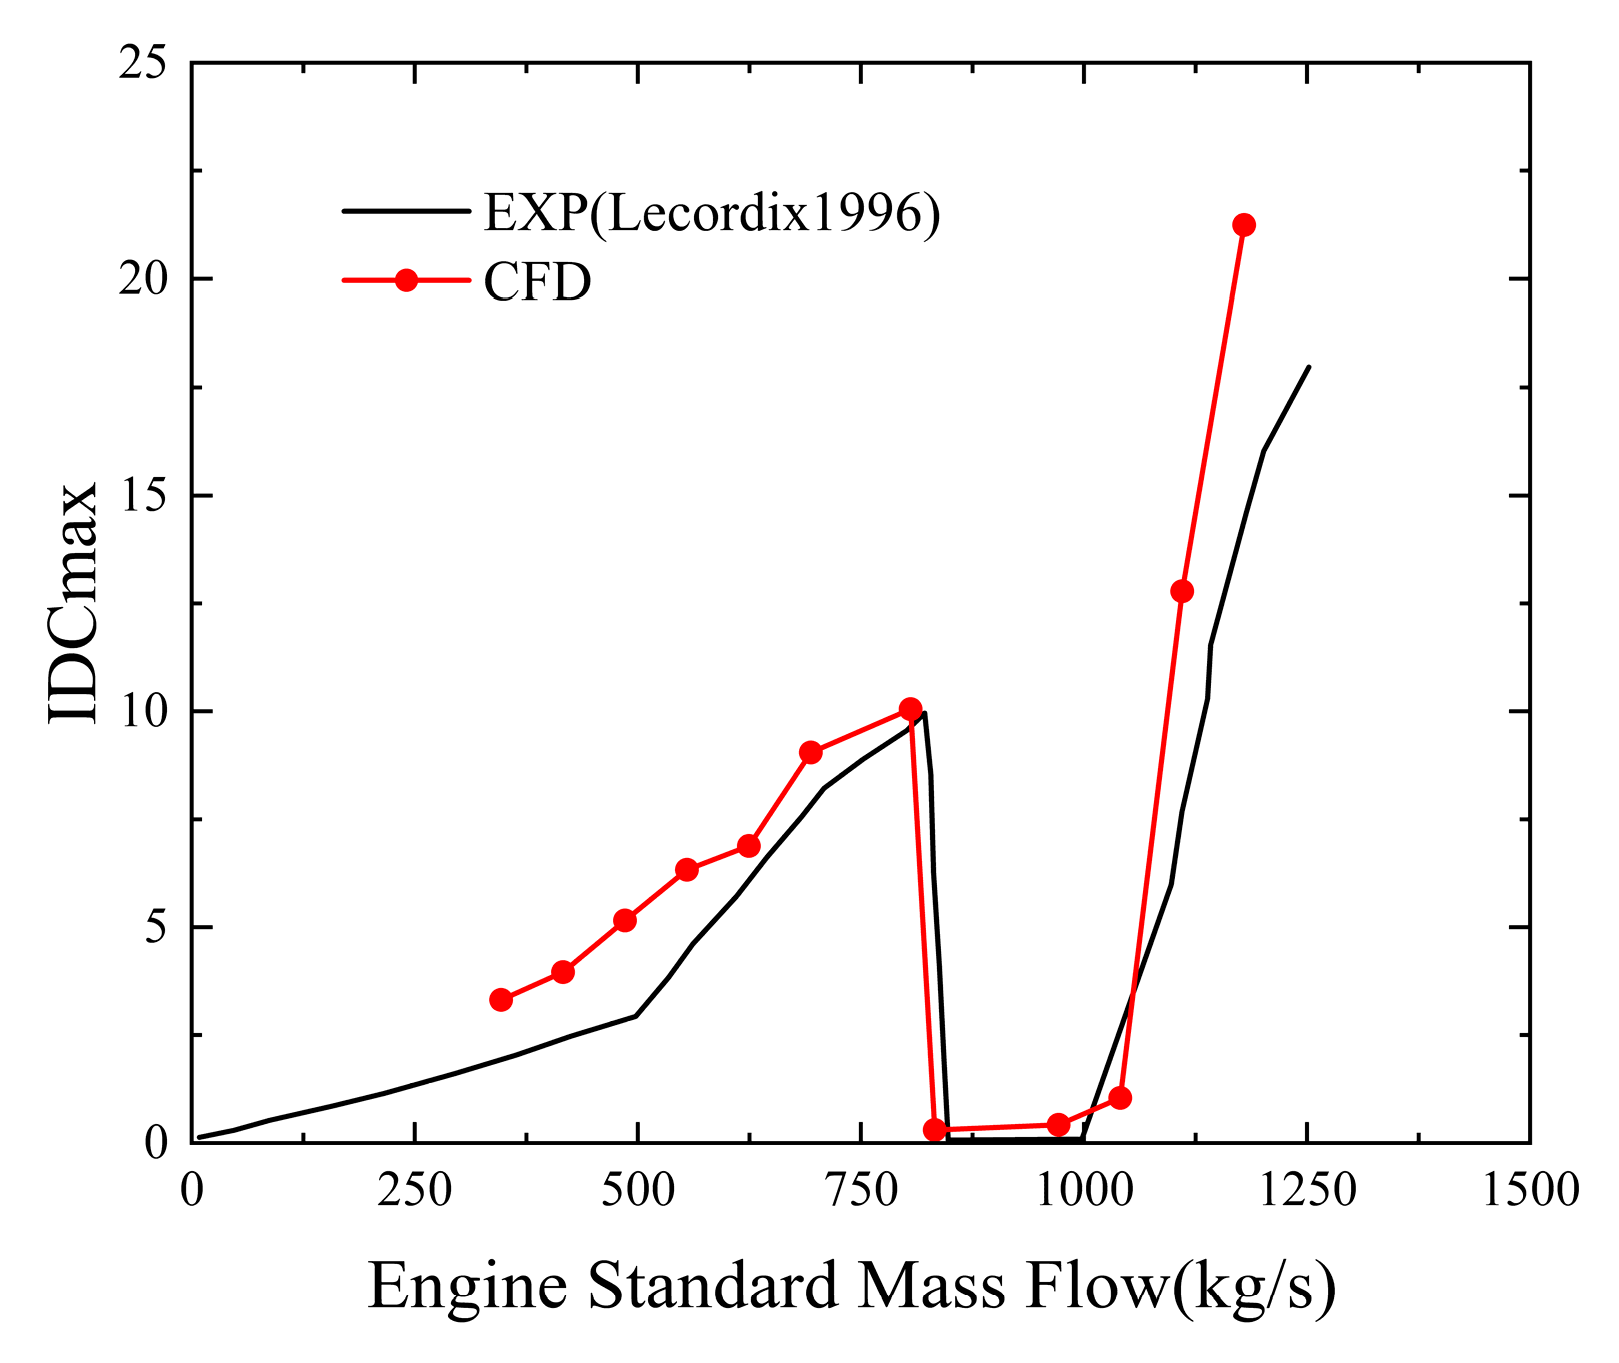
Figure 5.
Schematic of different circumferential sections (qₘ = 6 kg/s, V꜀ = 25 kt).
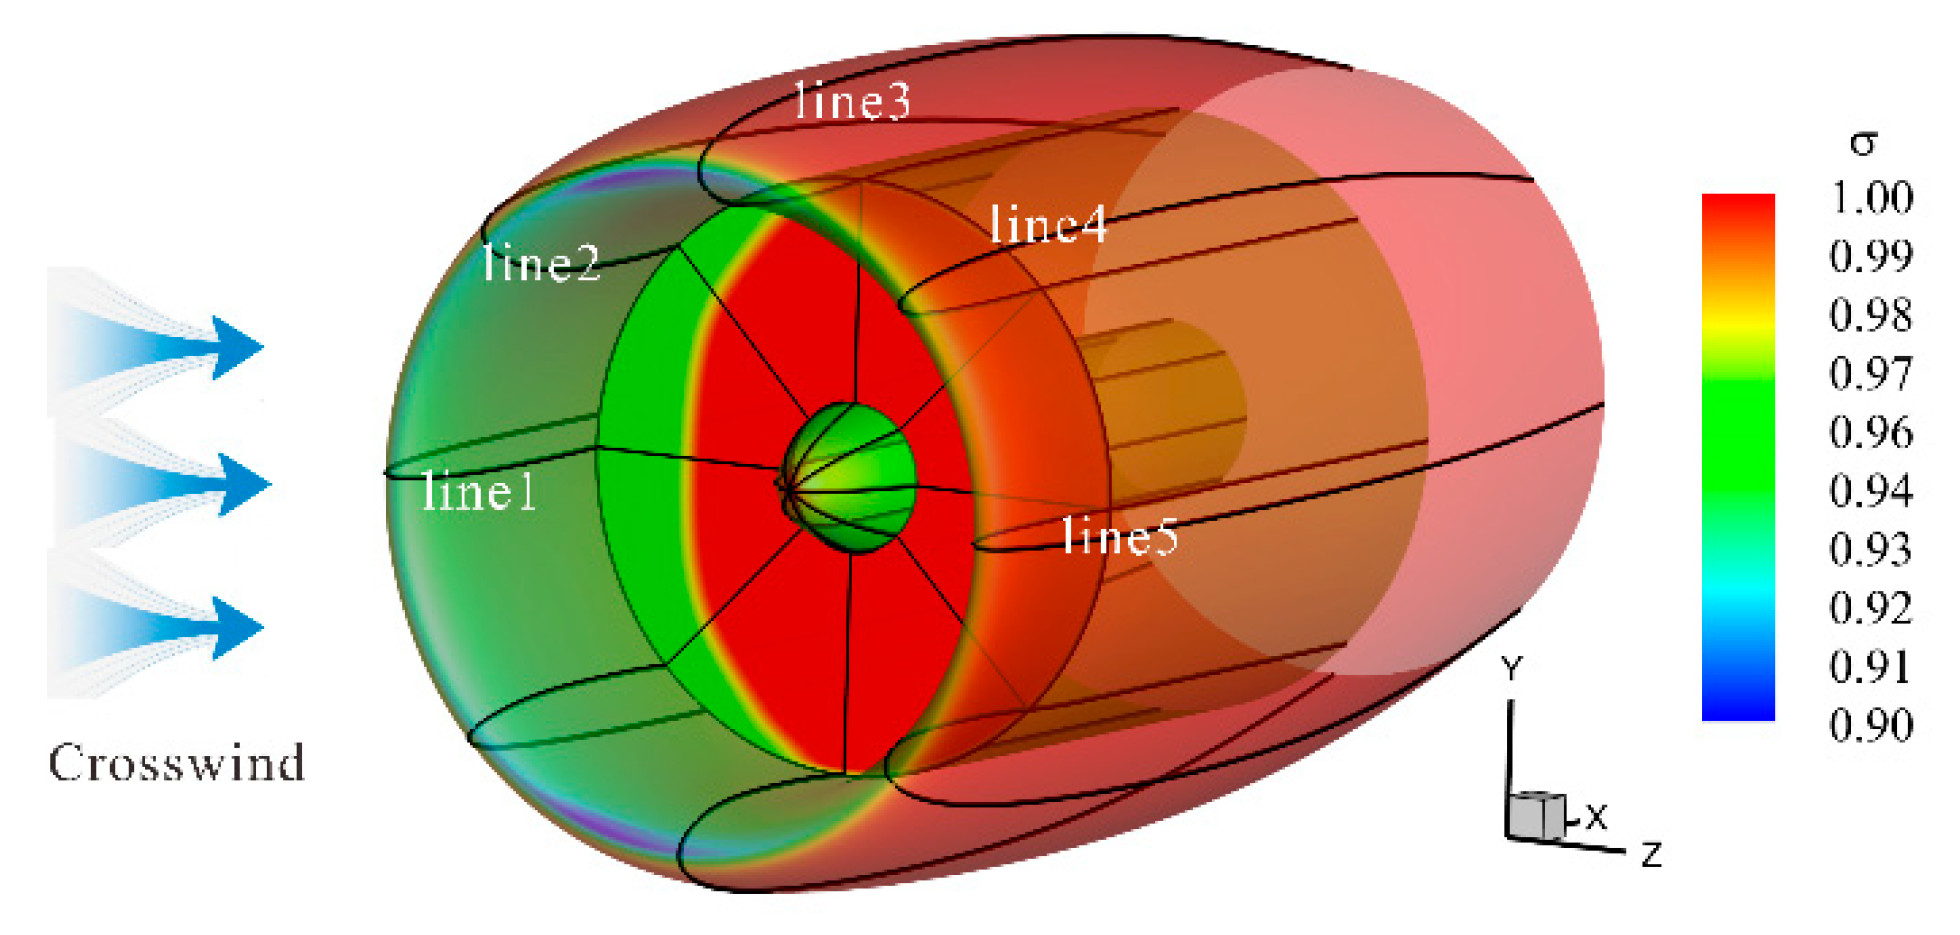
Figure 6.
Mach number contours at Line1-Line5 section under different crosswind velocities (qₘ = 6 kg/s).
Figure 6.
Mach number contours at Line1-Line5 section under different crosswind velocities (qₘ = 6 kg/s).
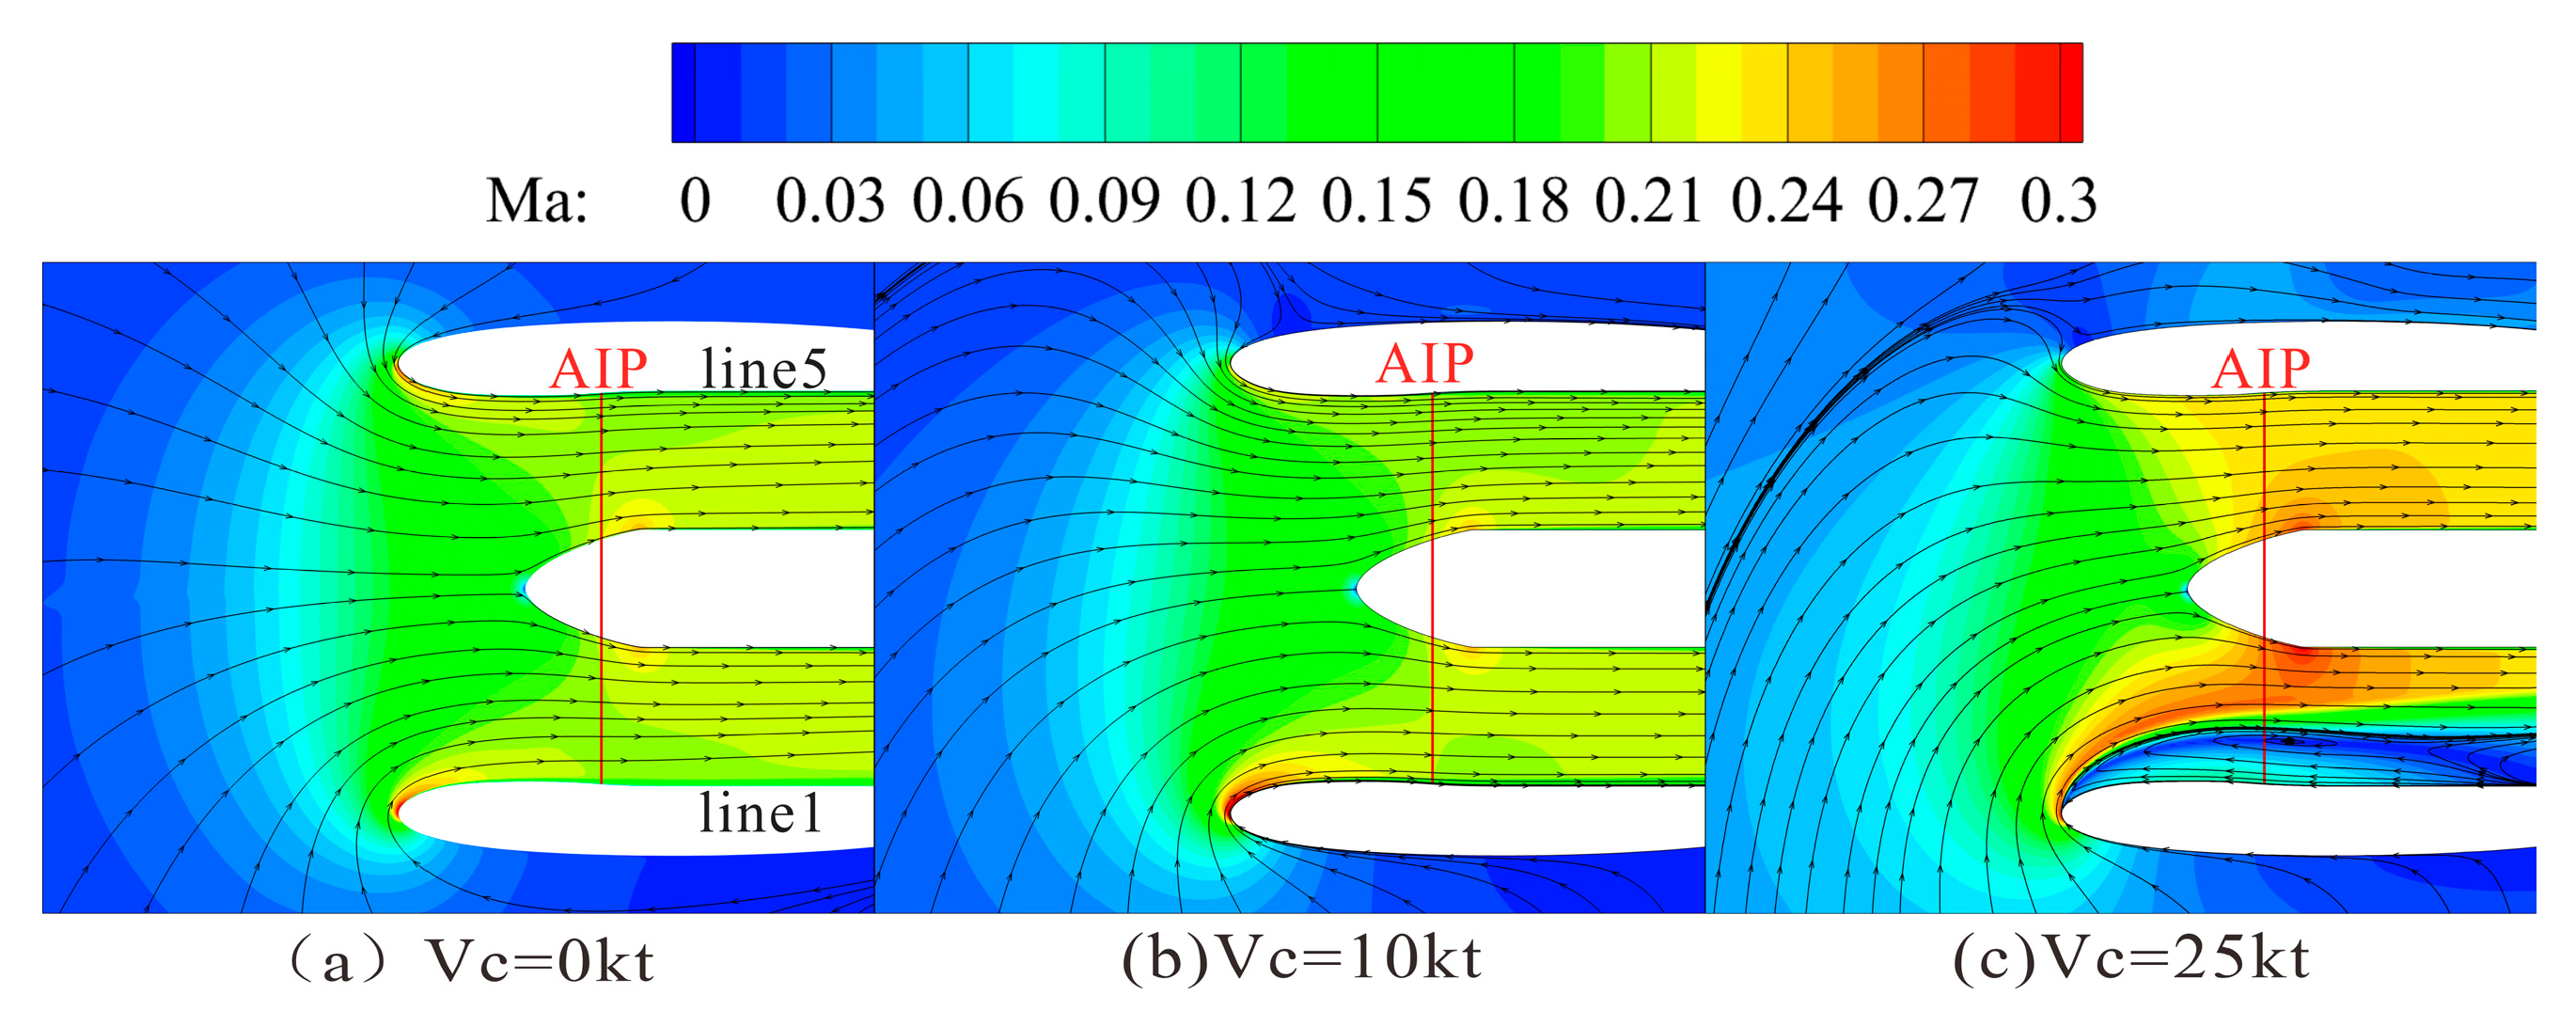
Figure 7.
(a)Effect of crosswind velocity on pressure distribution at Line1 section (qₘ = 6 kg/s); (b) Static pressure variation at different circumferential sections (qₘ = 6 kg/s, Vc = 25 kt).
Figure 7.
(a)Effect of crosswind velocity on pressure distribution at Line1 section (qₘ = 6 kg/s); (b) Static pressure variation at different circumferential sections (qₘ = 6 kg/s, Vc = 25 kt).
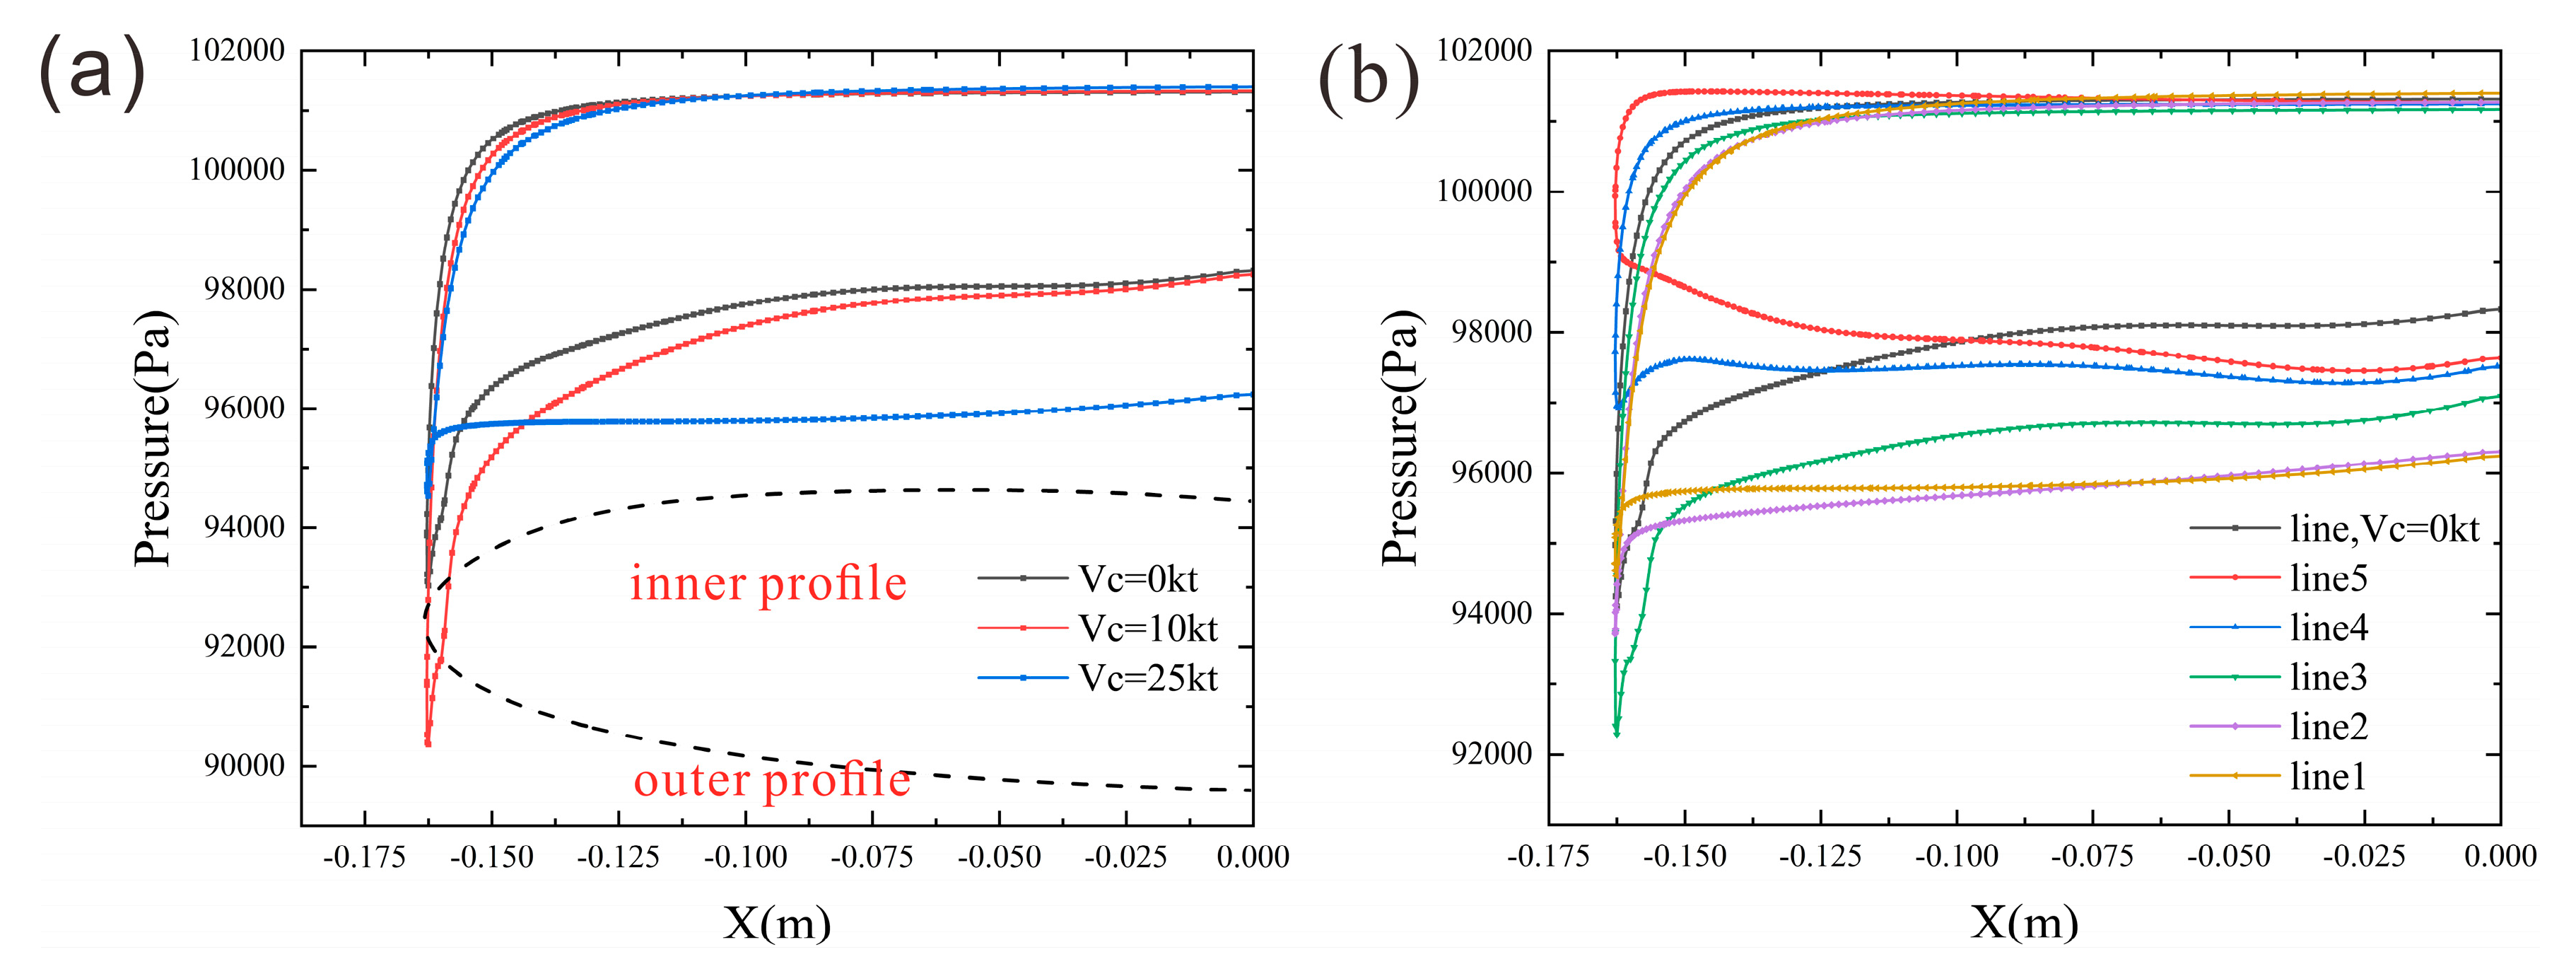
Figure 8.
Evolution of the flow field at Line1-Line5 section with varying mass flow rate (Vc = 25 kt).
Figure 8.
Evolution of the flow field at Line1-Line5 section with varying mass flow rate (Vc = 25 kt).
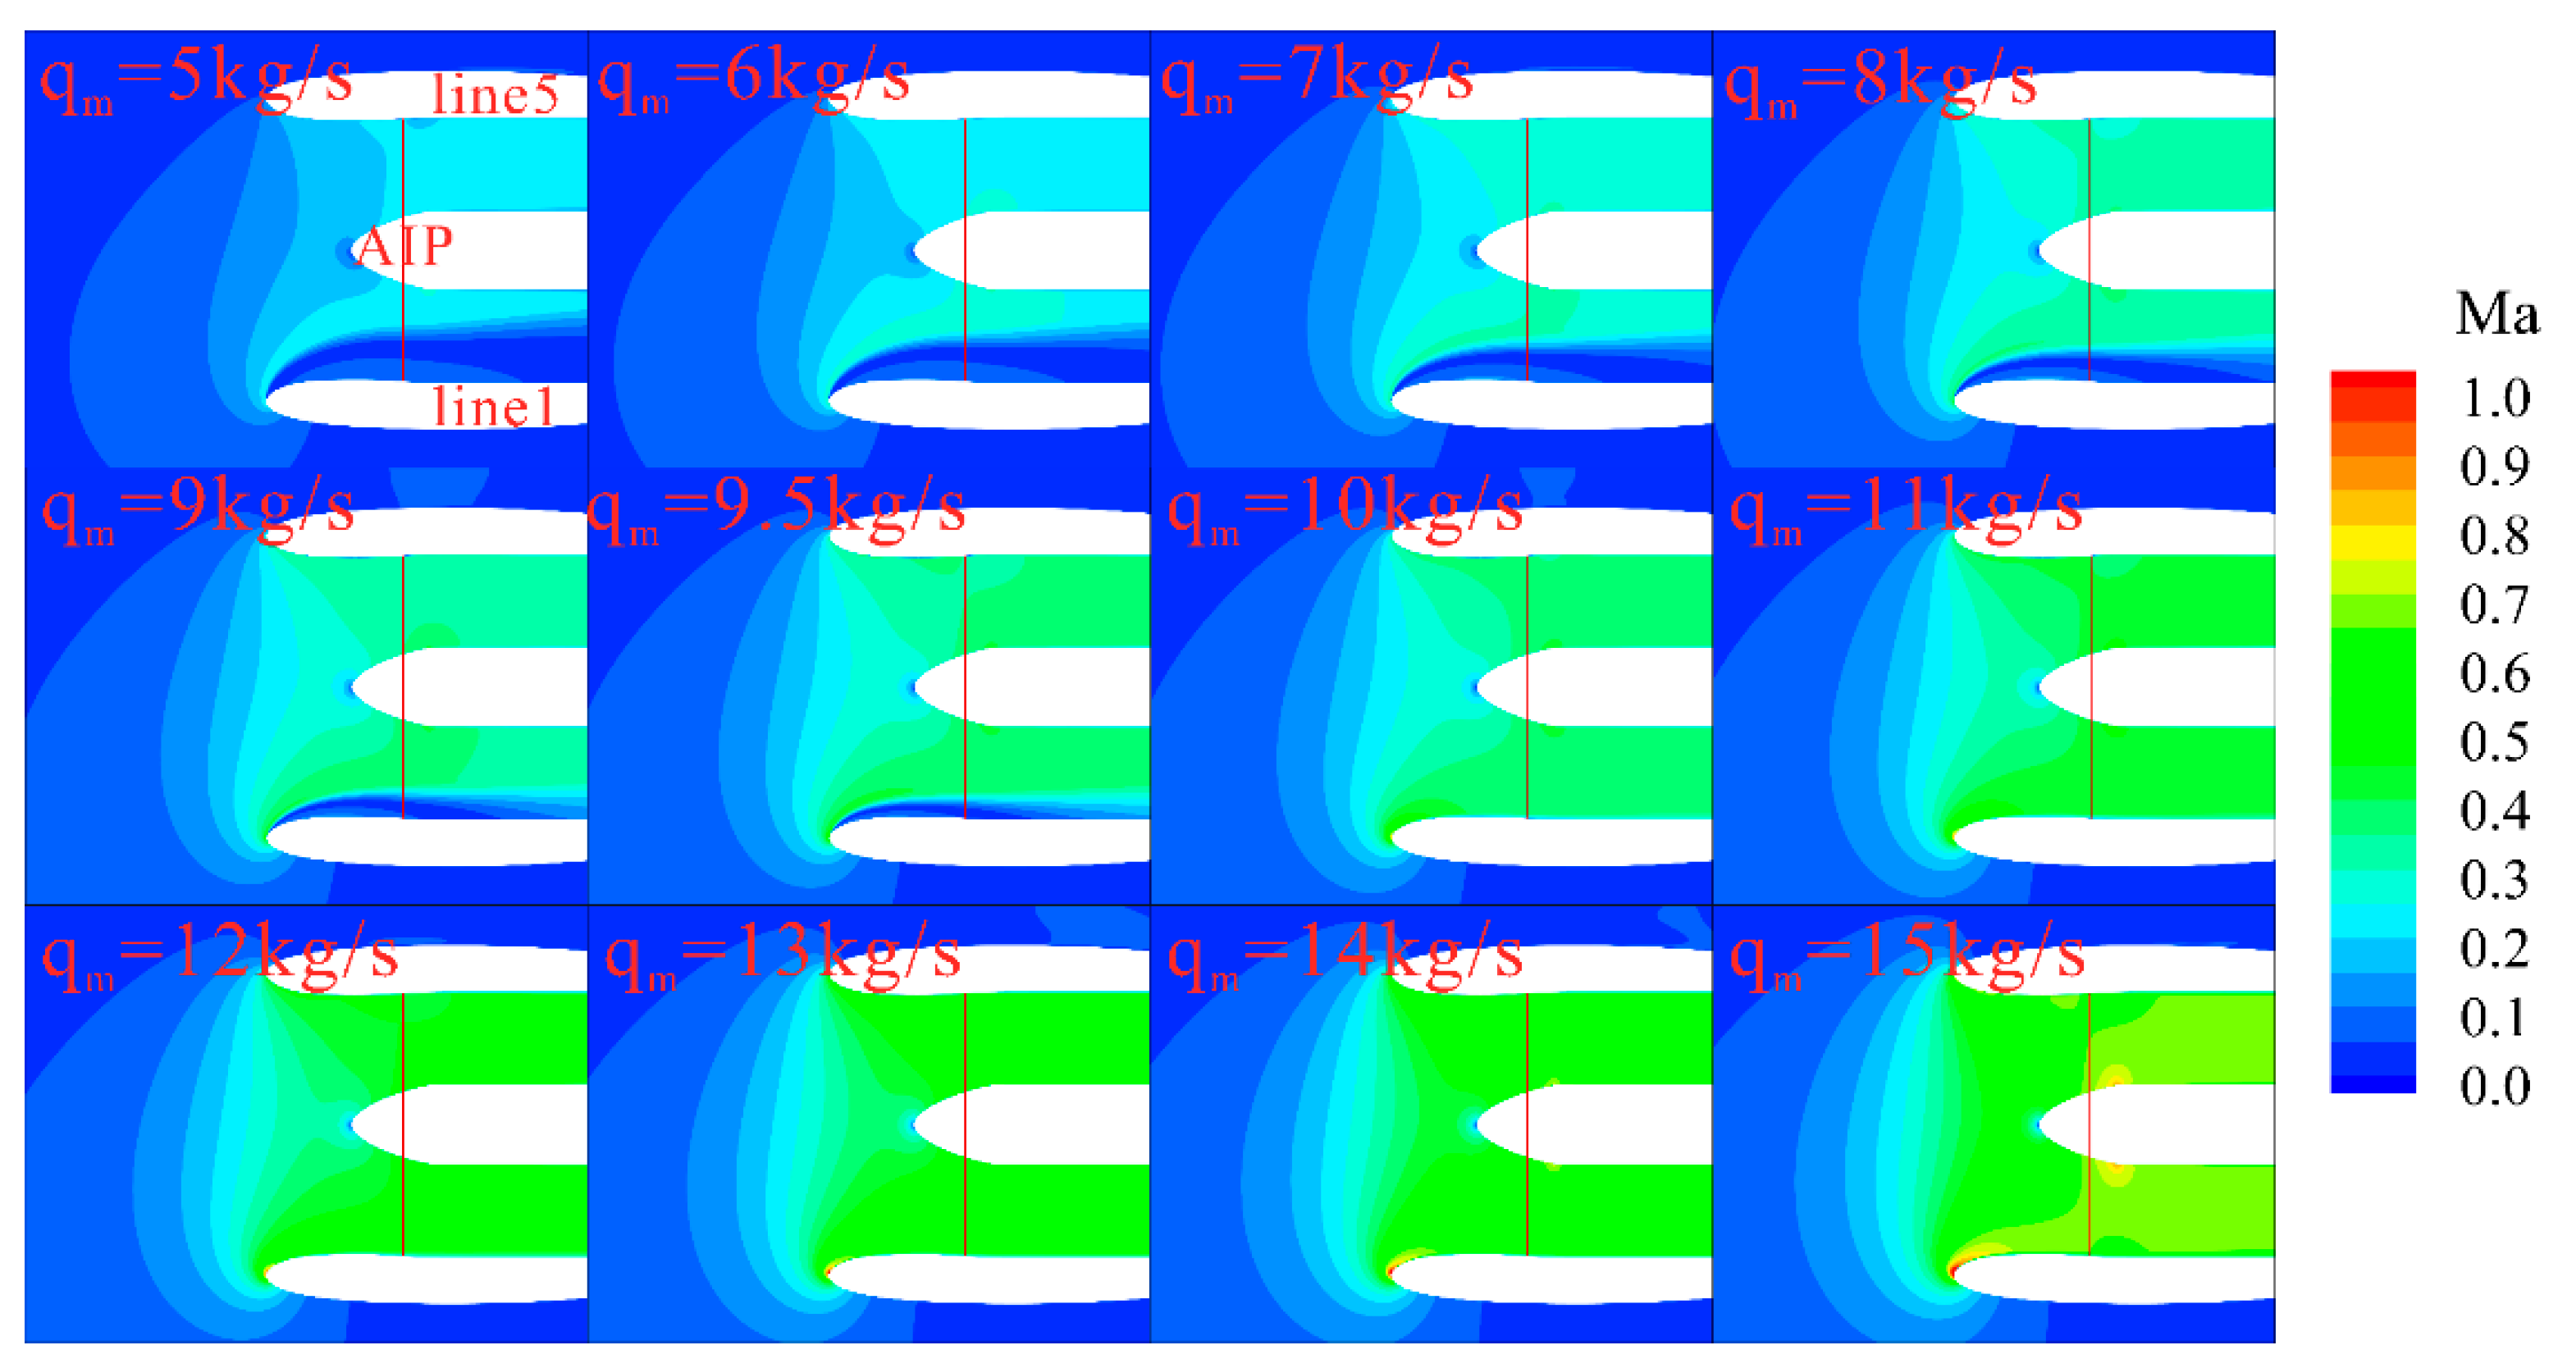
Figure 9.
Effect of mass flow rate on pressure distribution at Line1 section (Vc = 25 kt).
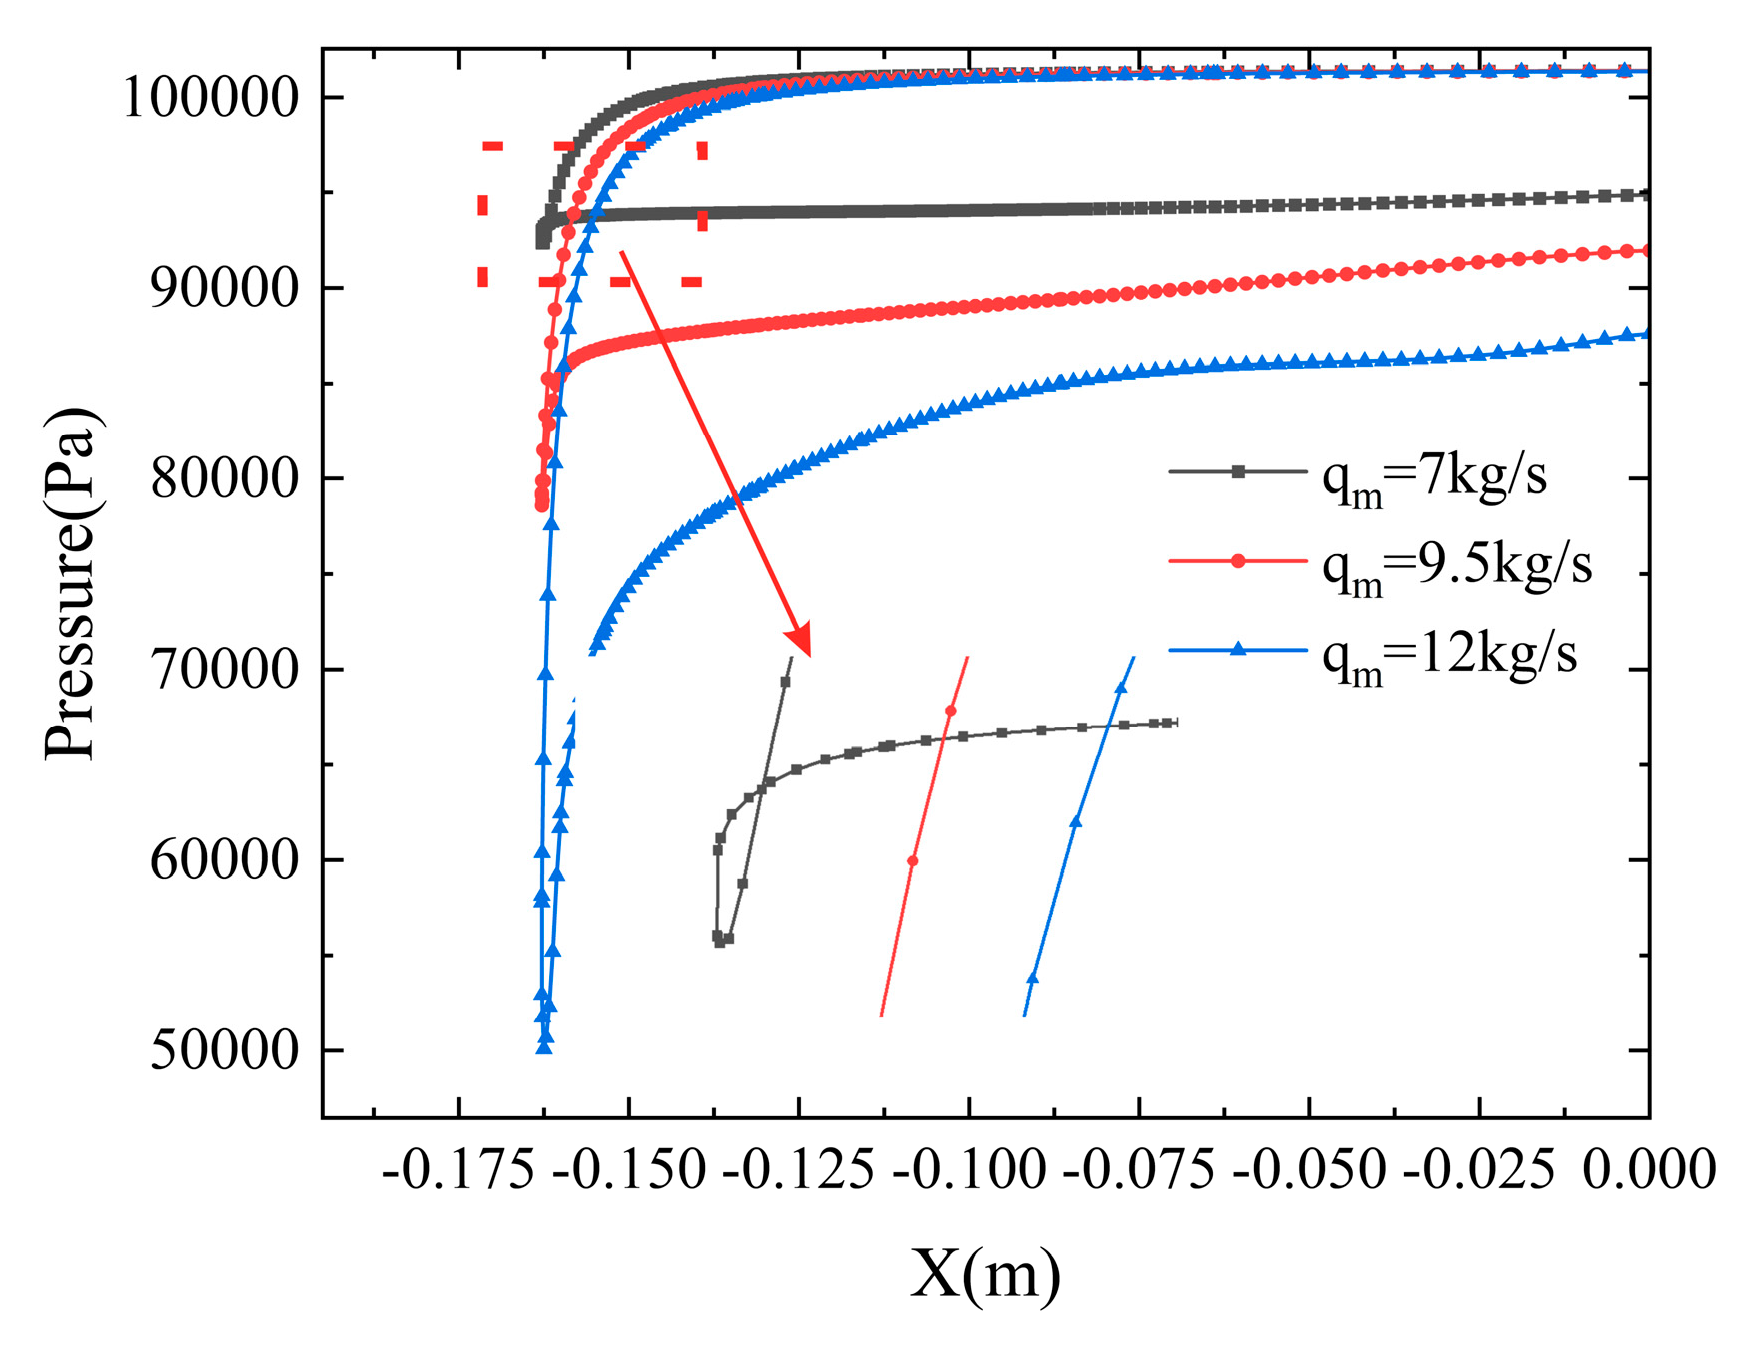
Figure 10.
Variation of IDCmax and σ with mass flow rate.
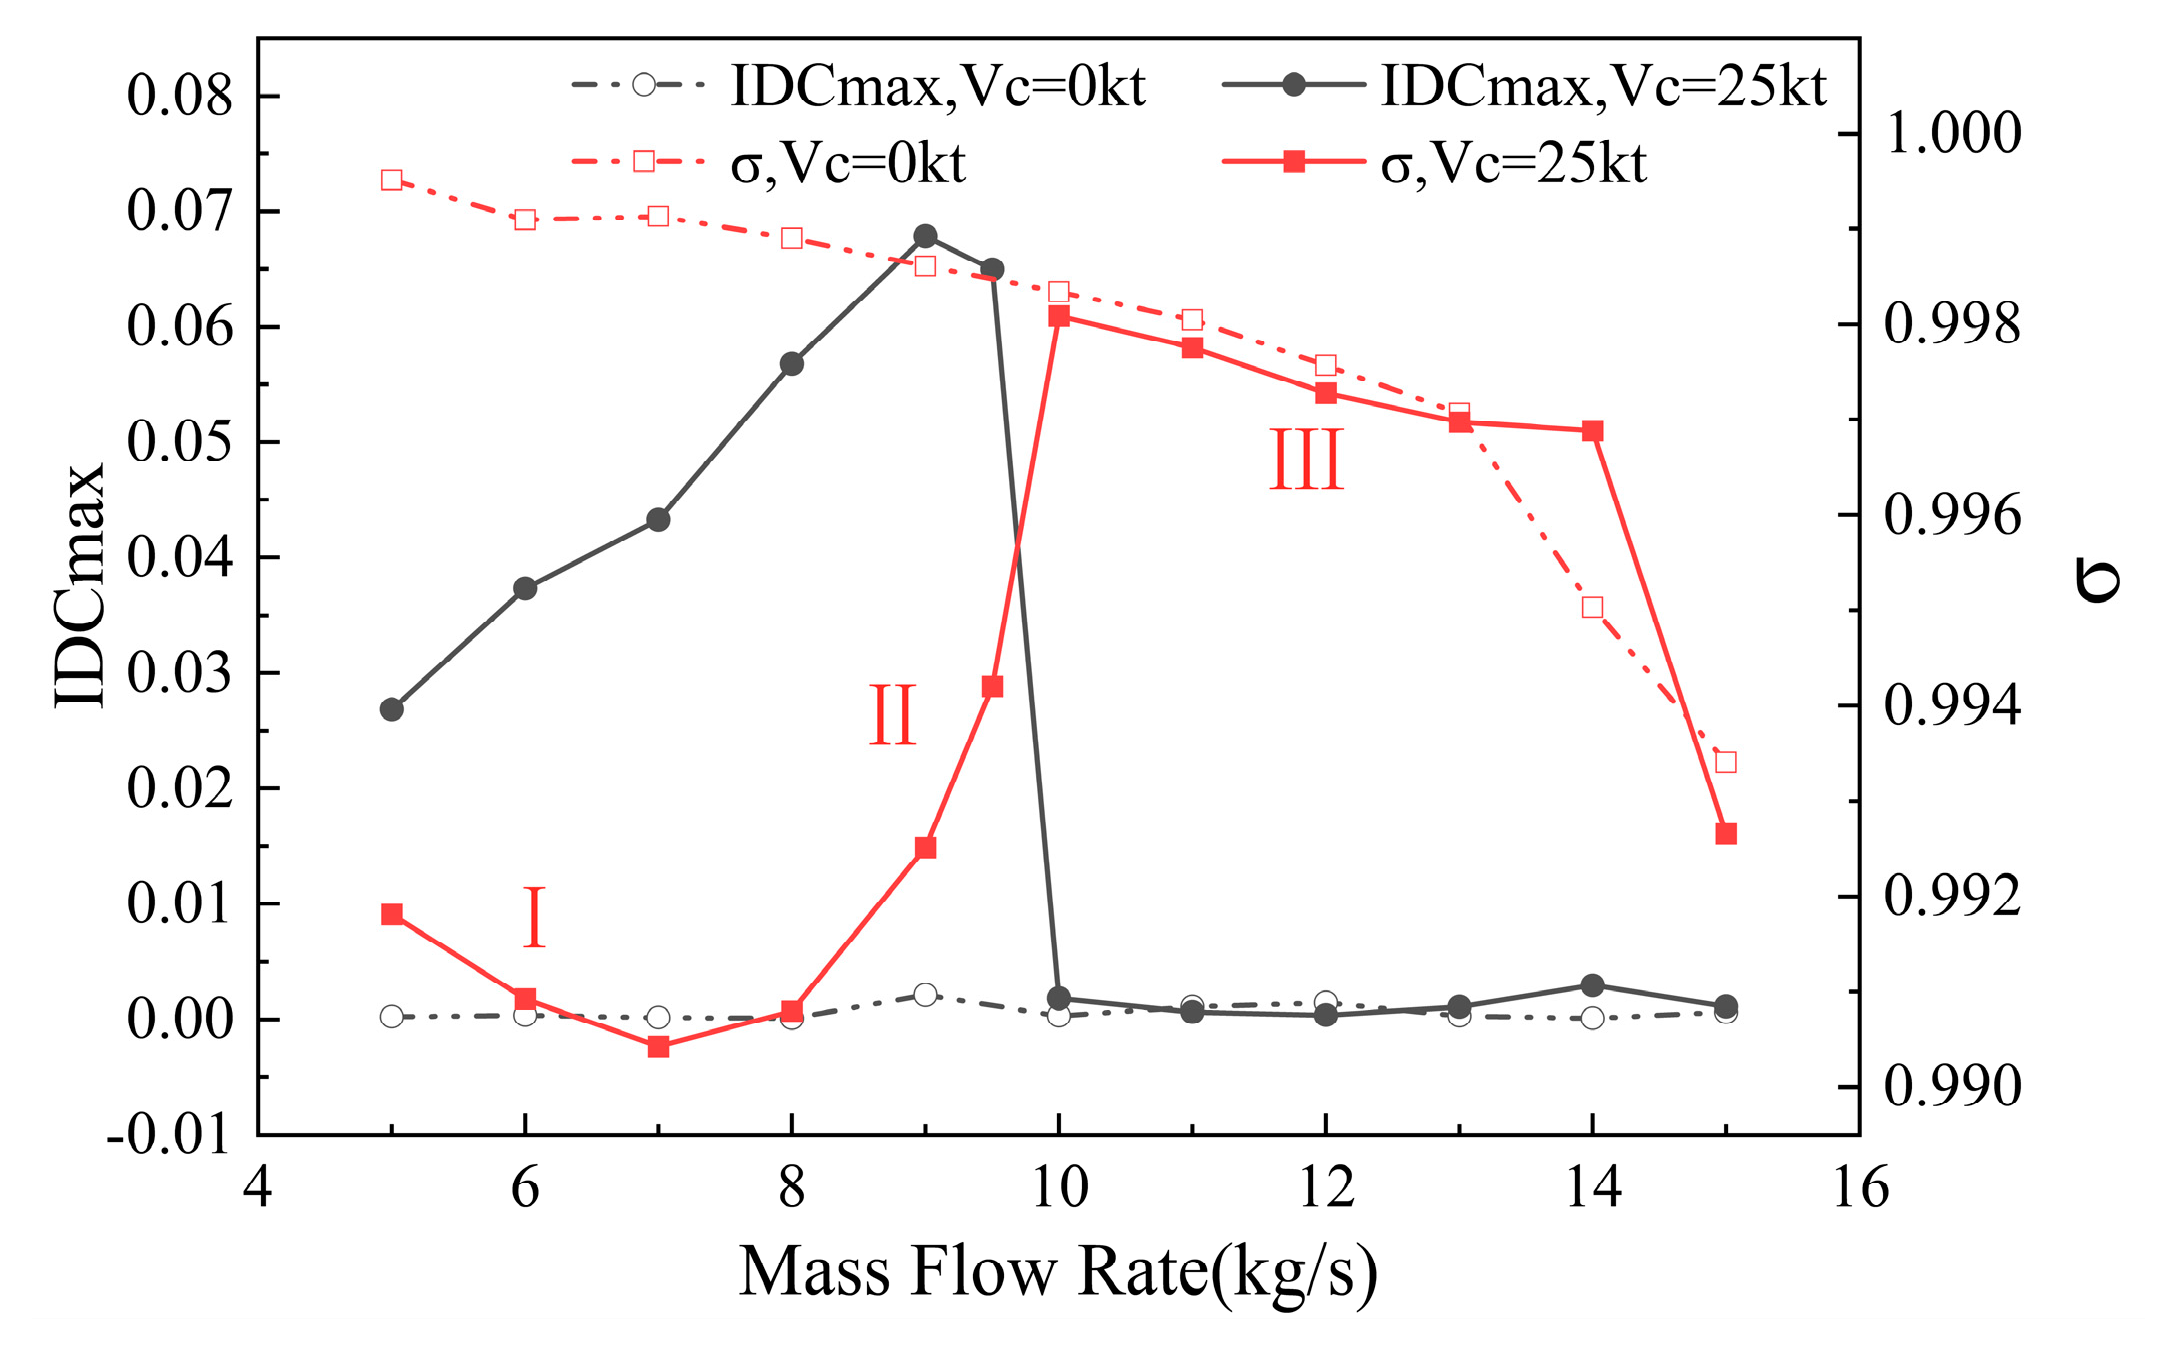
Figure 11.
Mach number distribution at the Line1-Line5 section under different crosswind velocities (qₘ = 6 kg/s).
Figure 11.
Mach number distribution at the Line1-Line5 section under different crosswind velocities (qₘ = 6 kg/s).
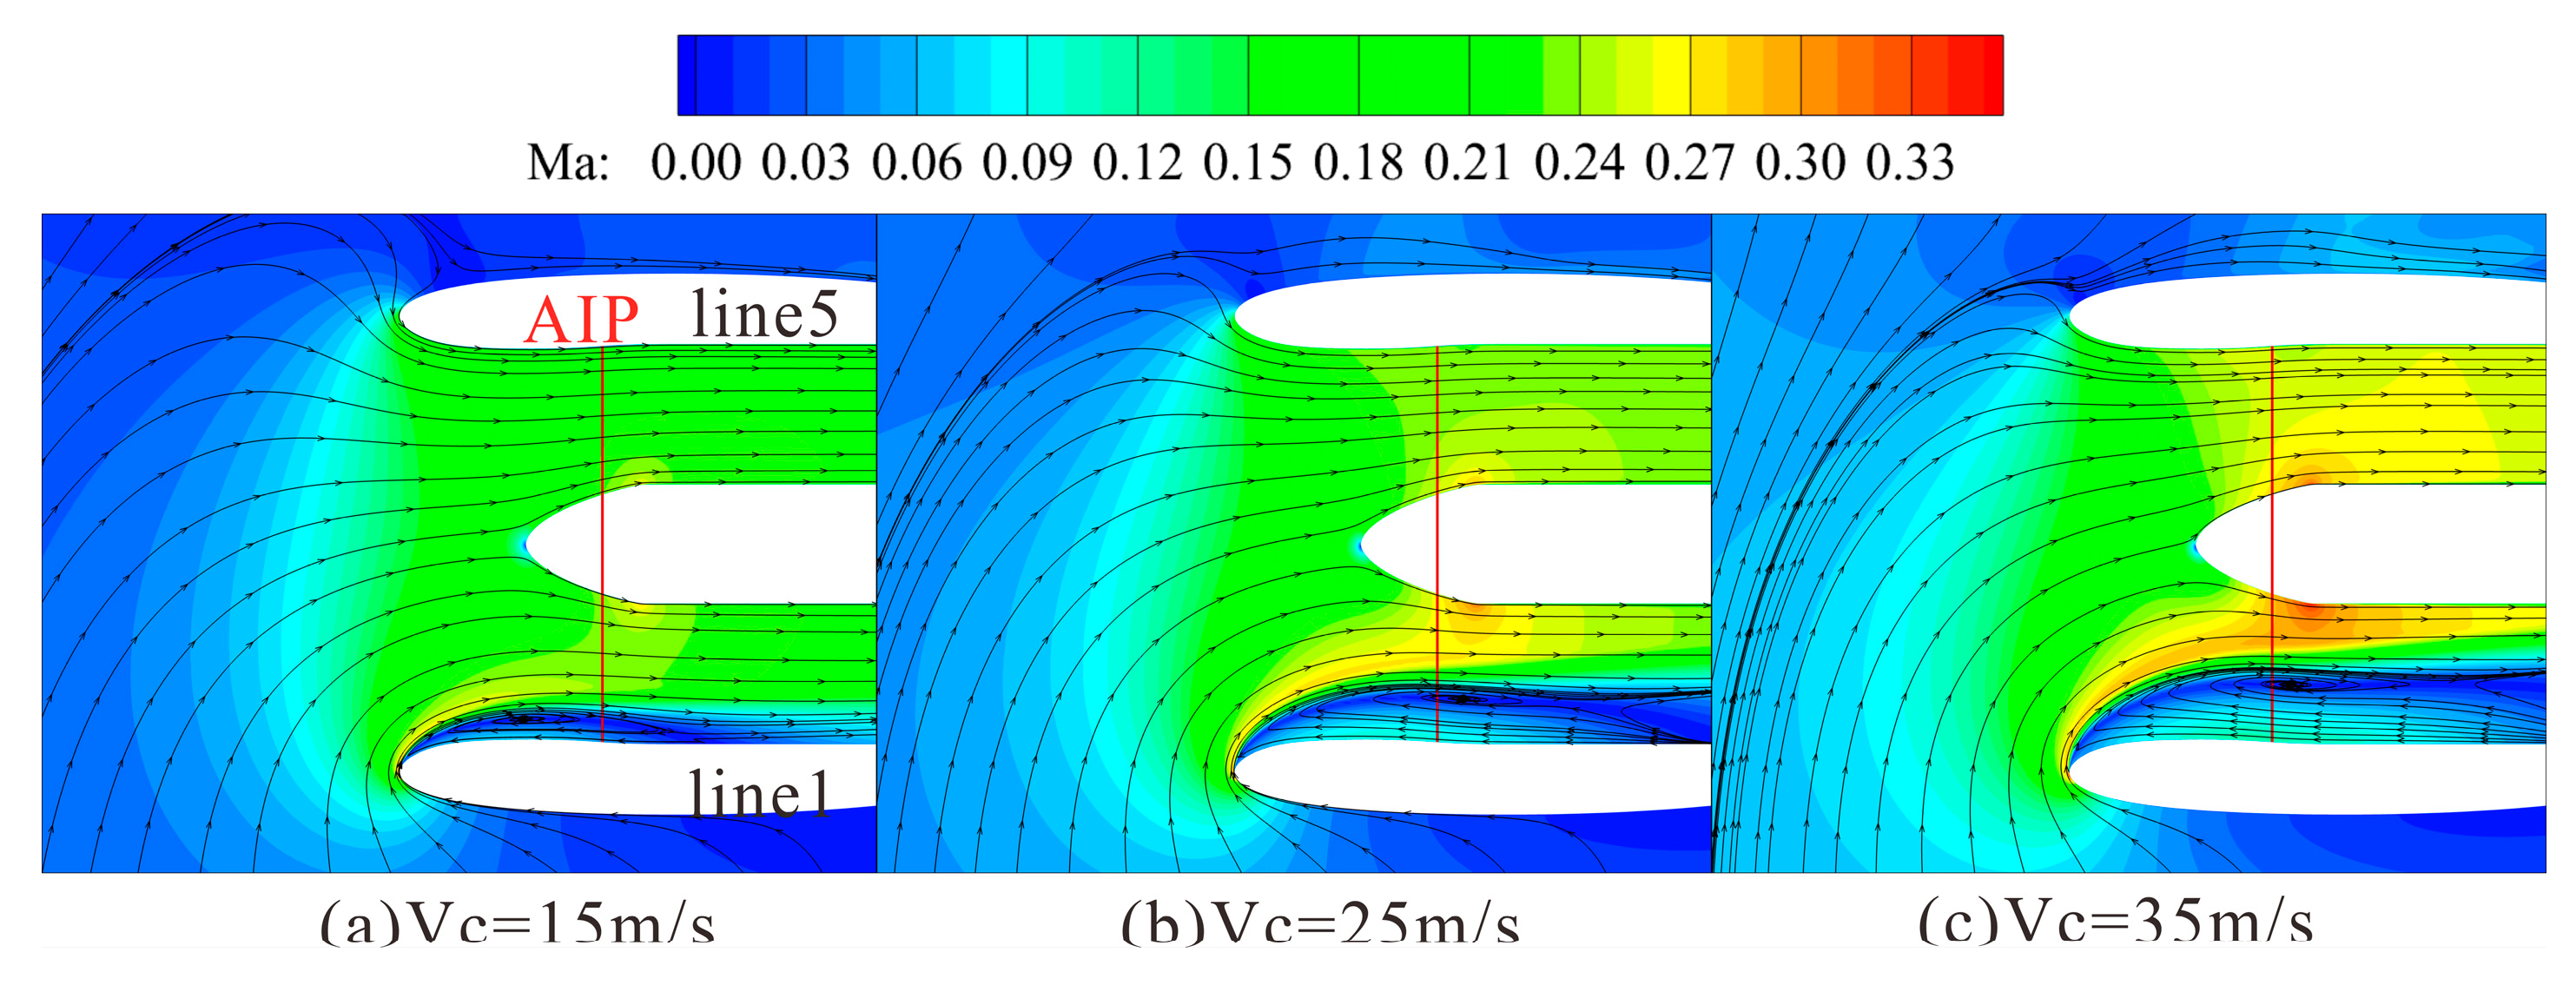
Figure 12.
Variation of IDCmax and σ with crosswind velocity (qₘ = 6 kg/s).
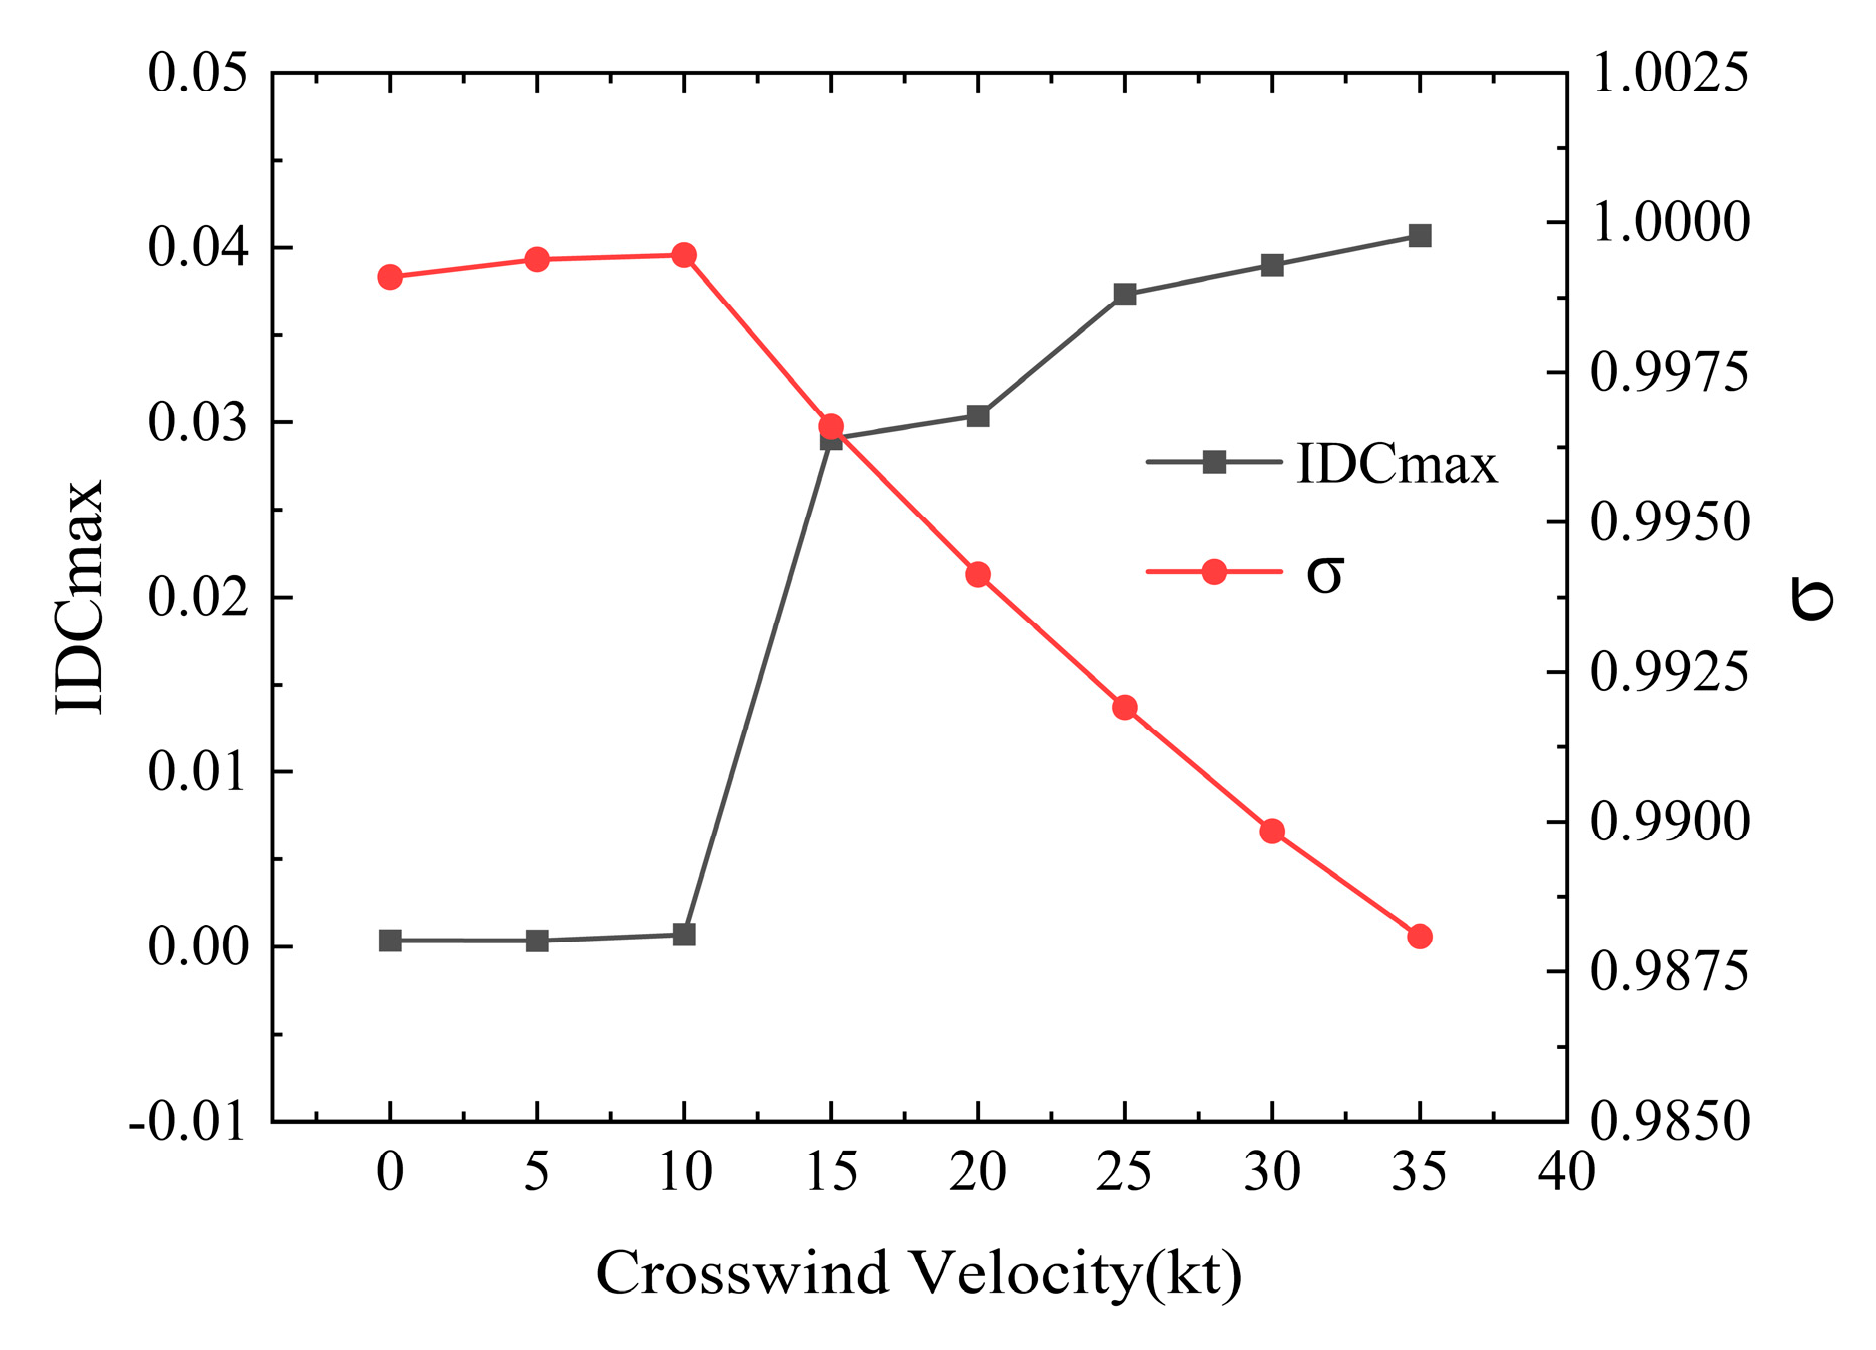
Figure 13.
(a) Influence of crosswind velocity on the variation of IDCmax with mass flow rate; (b) Influence of crosswind velocity on the variation of σ with mass flow rate.
Figure 13.
(a) Influence of crosswind velocity on the variation of IDCmax with mass flow rate; (b) Influence of crosswind velocity on the variation of σ with mass flow rate.
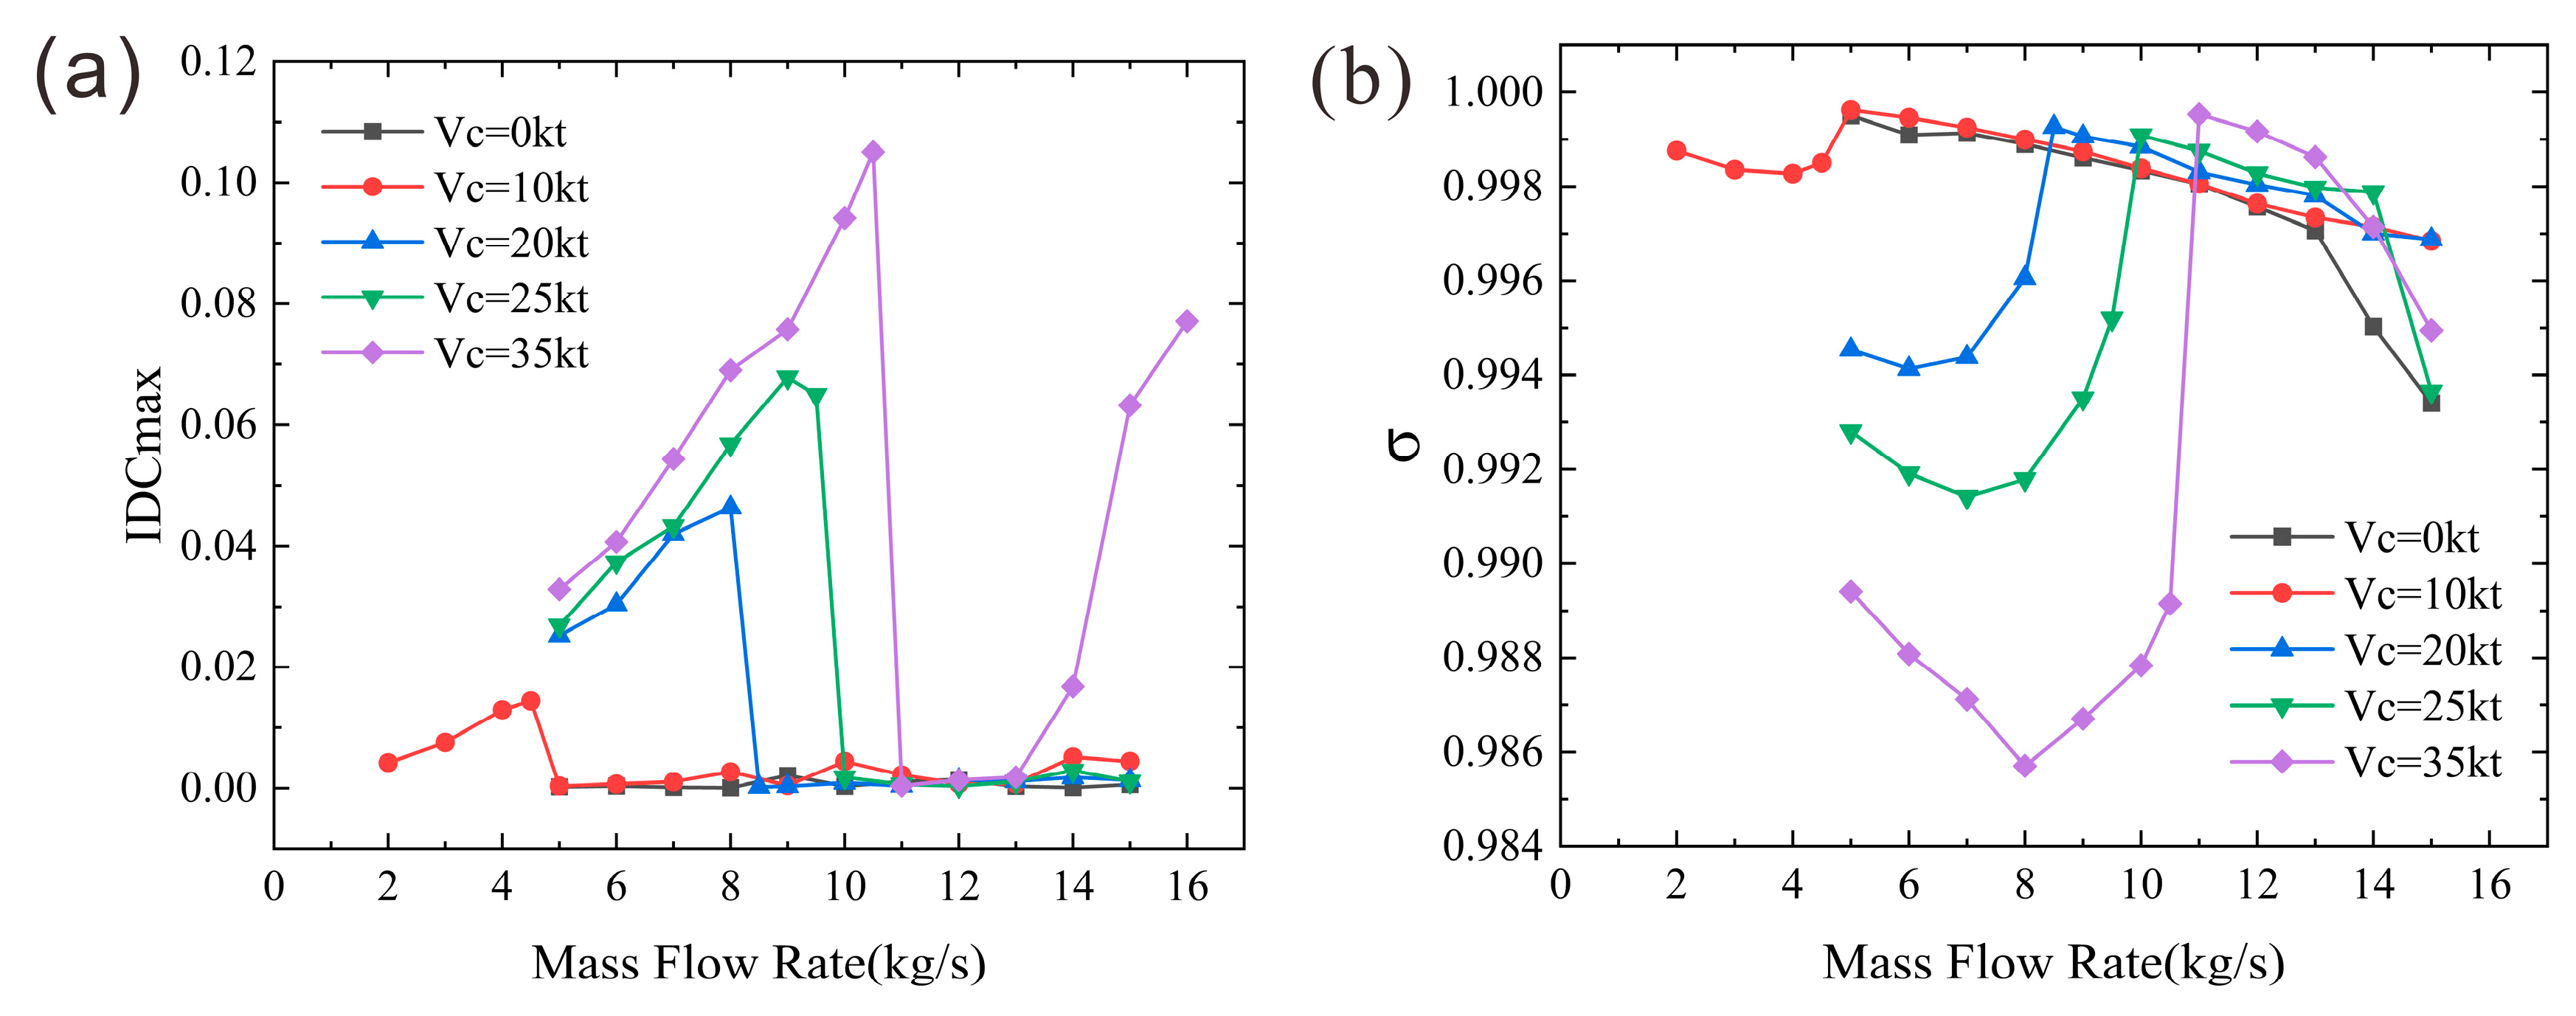
Figure 14.
Mach number contours and separation bubble at Line1-Line5 section (qₘ = 15 kg/s, Vc = 35 kt).
Figure 14.
Mach number contours and separation bubble at Line1-Line5 section (qₘ = 15 kg/s, Vc = 35 kt).
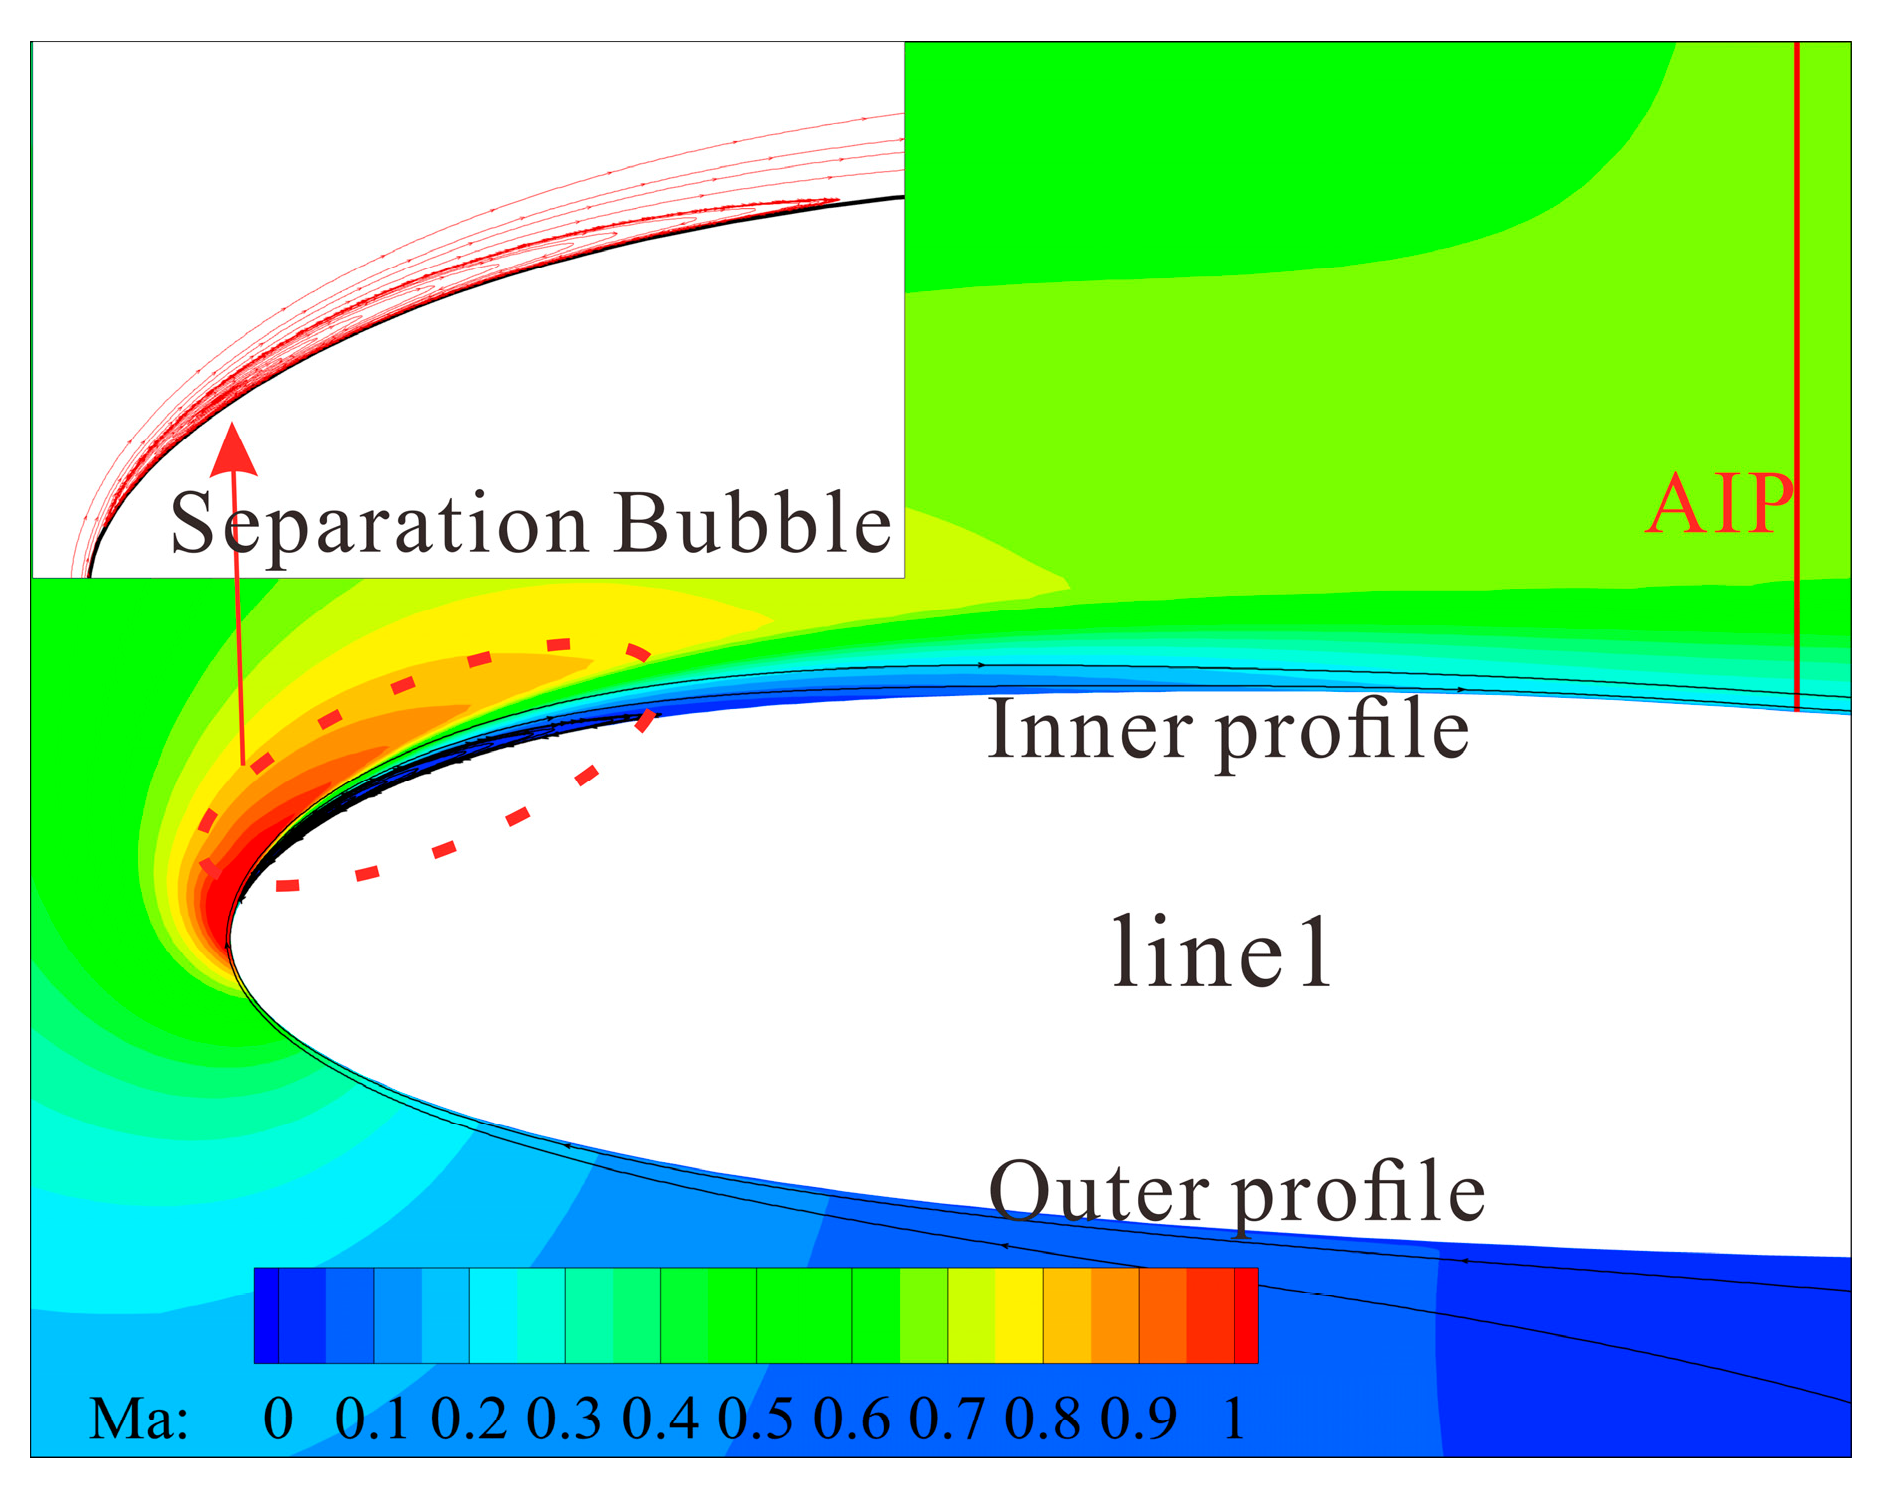
Figure 15.
Schematic of throat axial location variation.
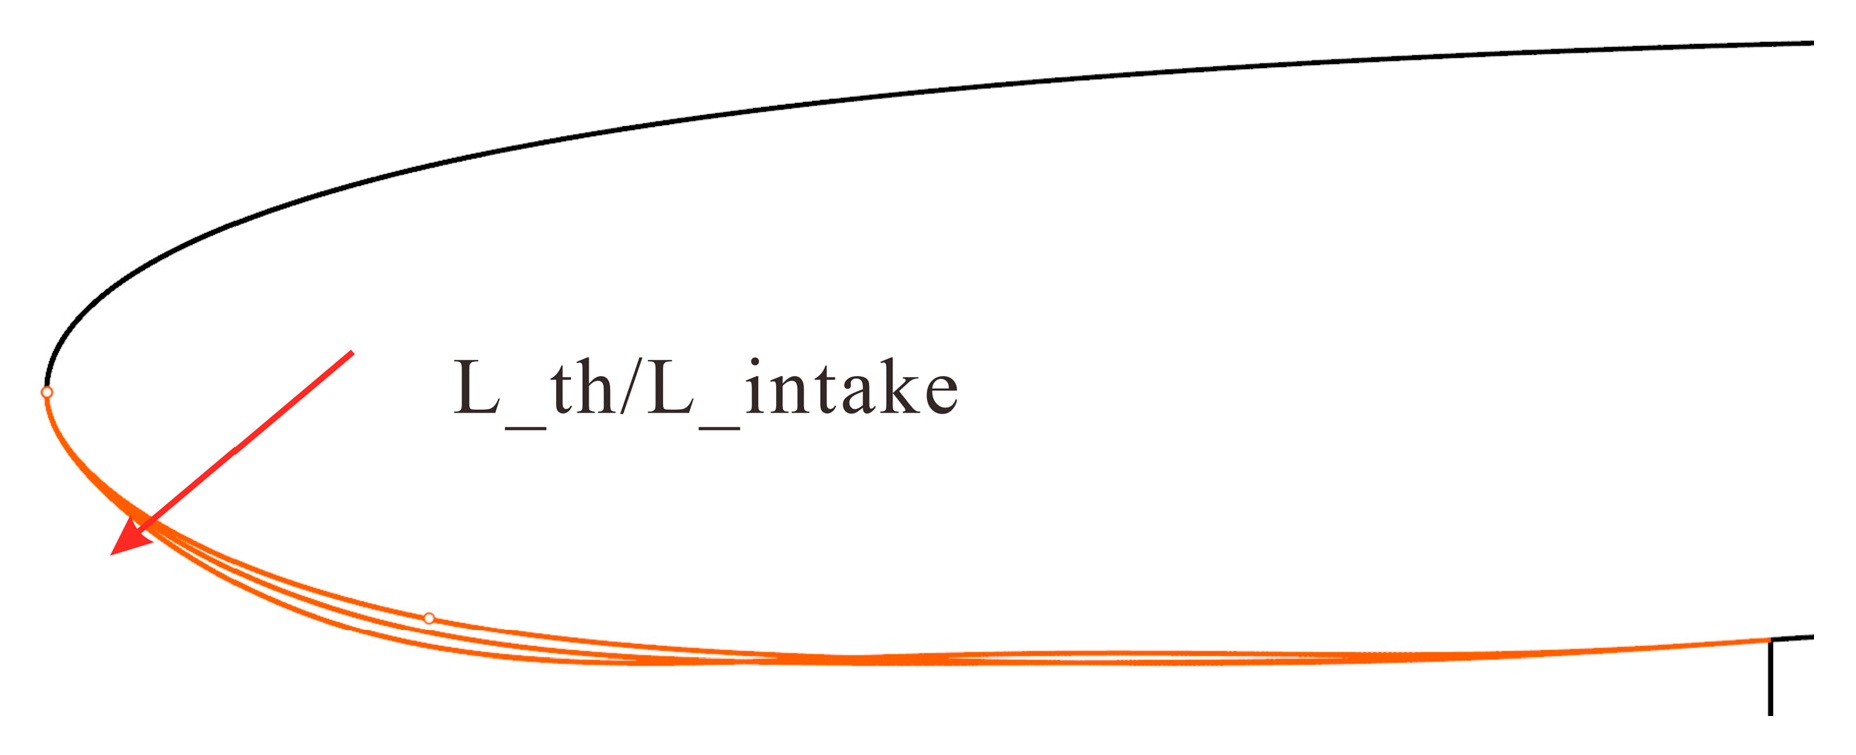
Figure 16.
Influence of throat axial position variation on pressure distribution at Line1 section(qₘ = 6 kg/s, Vc = 0 kt).
Figure 16.
Influence of throat axial position variation on pressure distribution at Line1 section(qₘ = 6 kg/s, Vc = 0 kt).
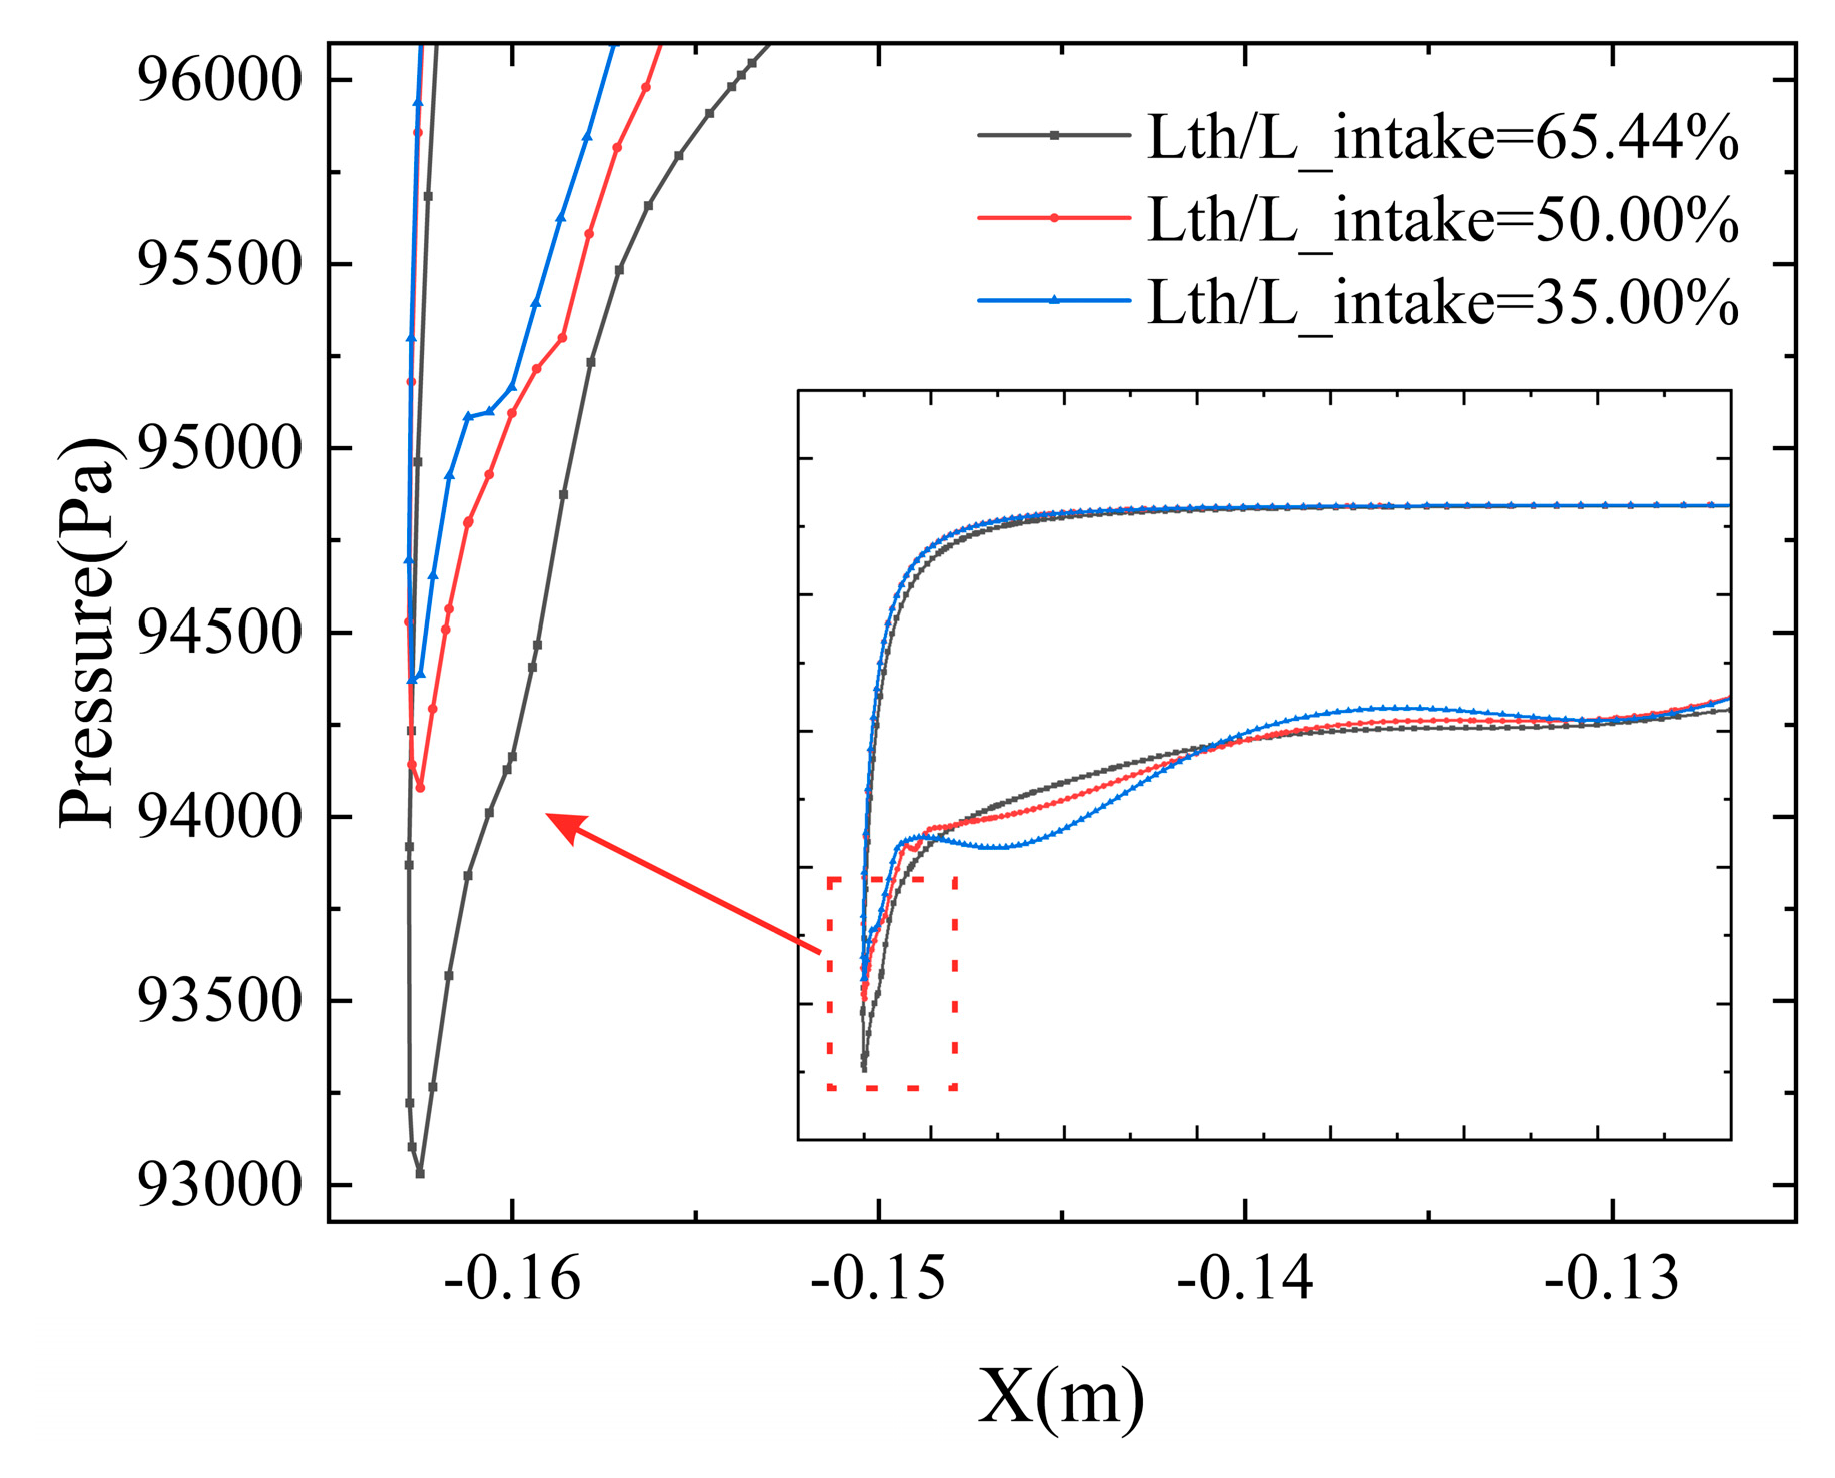
Figure 17.
(a) Influence of throat axial position on the IDCmax-mass flow rate relationship (Vc = 25kts); (b) Influence of throat axial position on the σ-mass flow rate relationship (Vc = 25kts).
Figure 17.
(a) Influence of throat axial position on the IDCmax-mass flow rate relationship (Vc = 25kts); (b) Influence of throat axial position on the σ-mass flow rate relationship (Vc = 25kts).
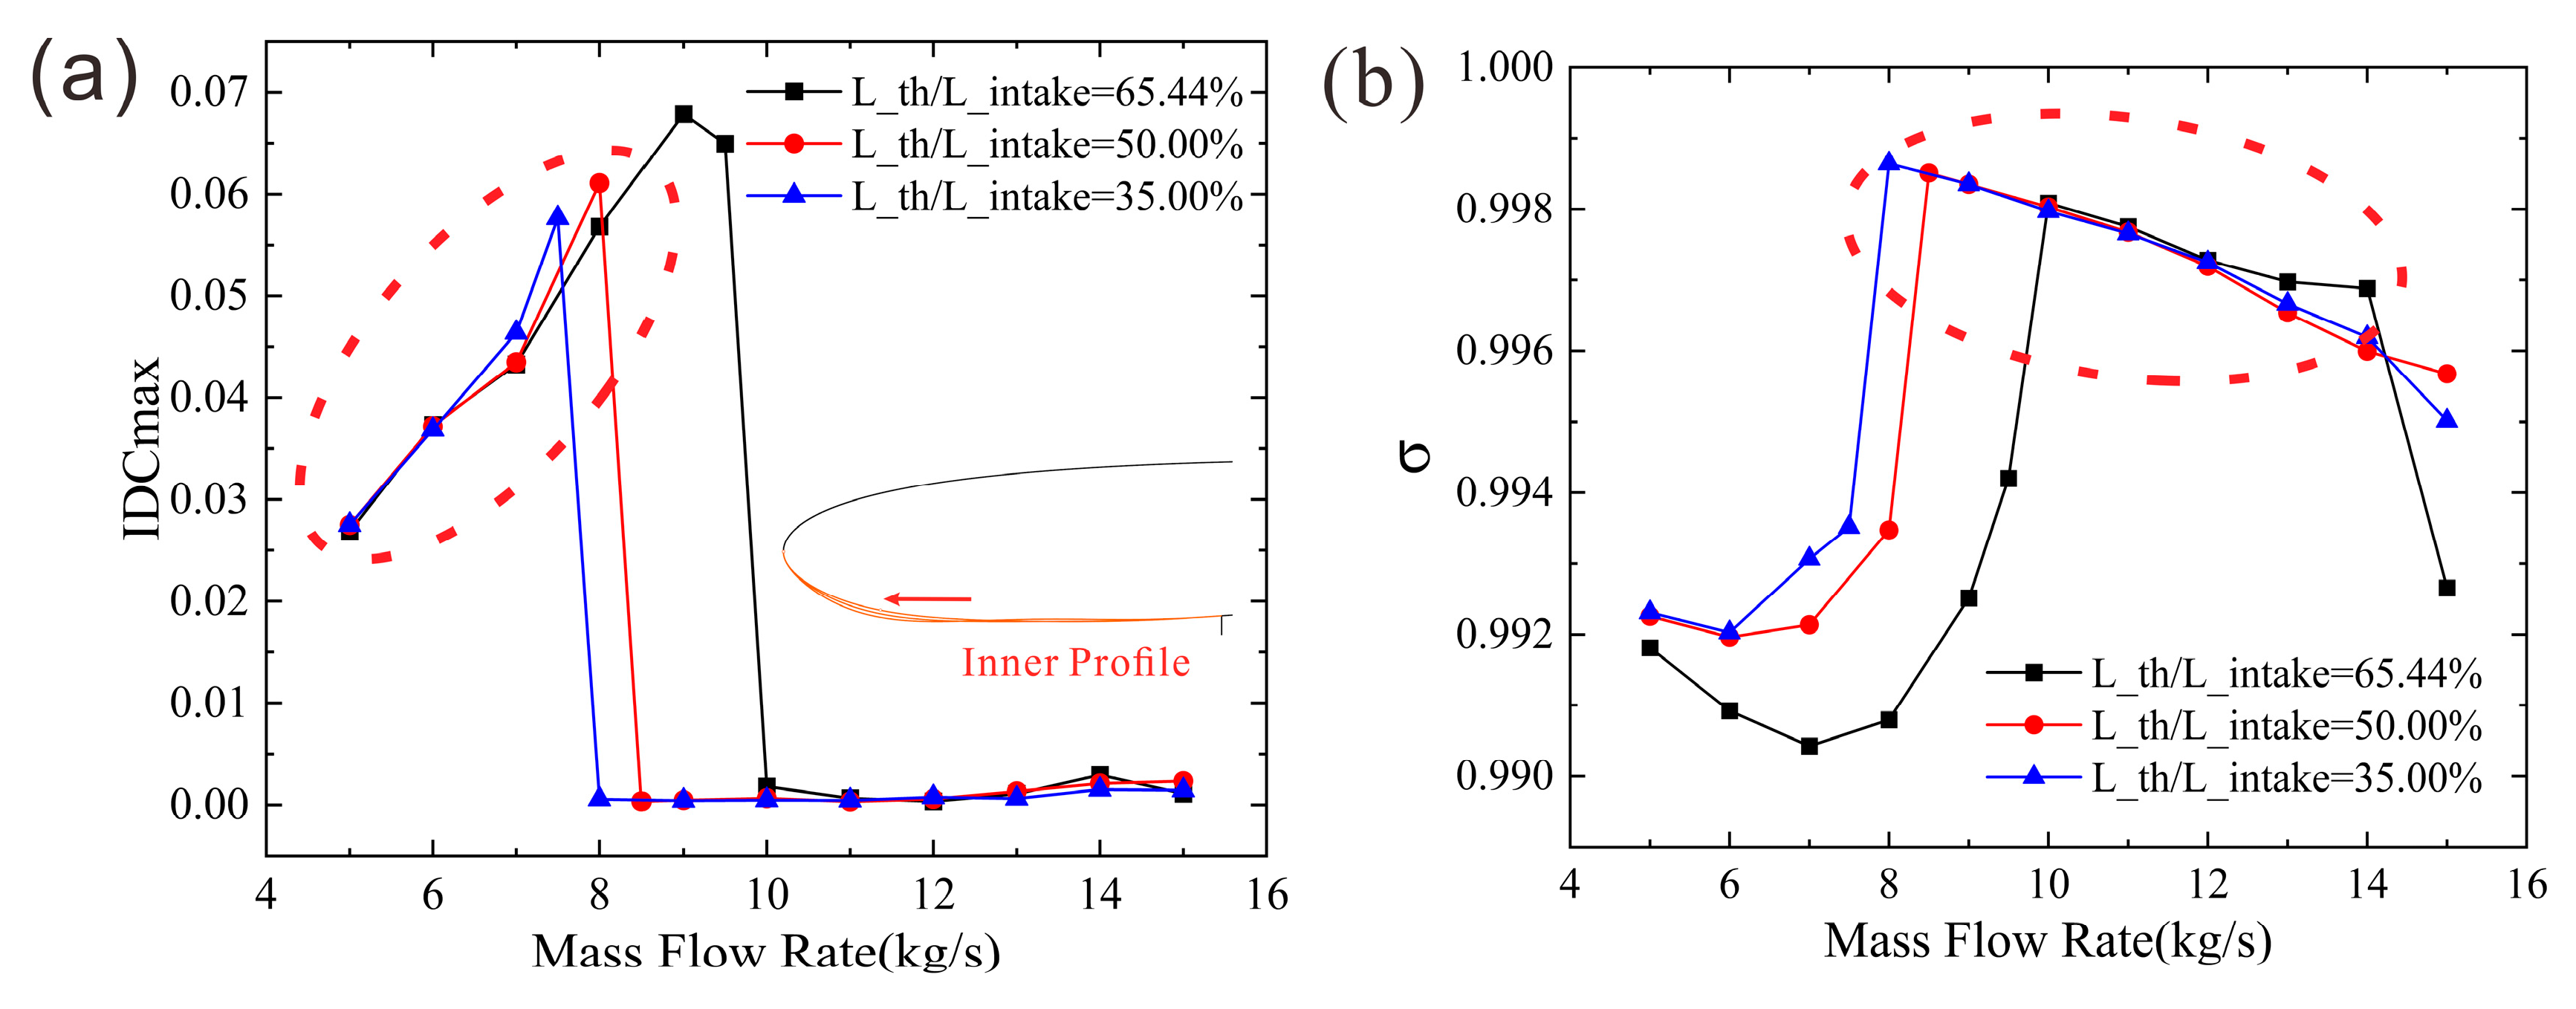
Figure 18.
Schematic of fan face radius variation.
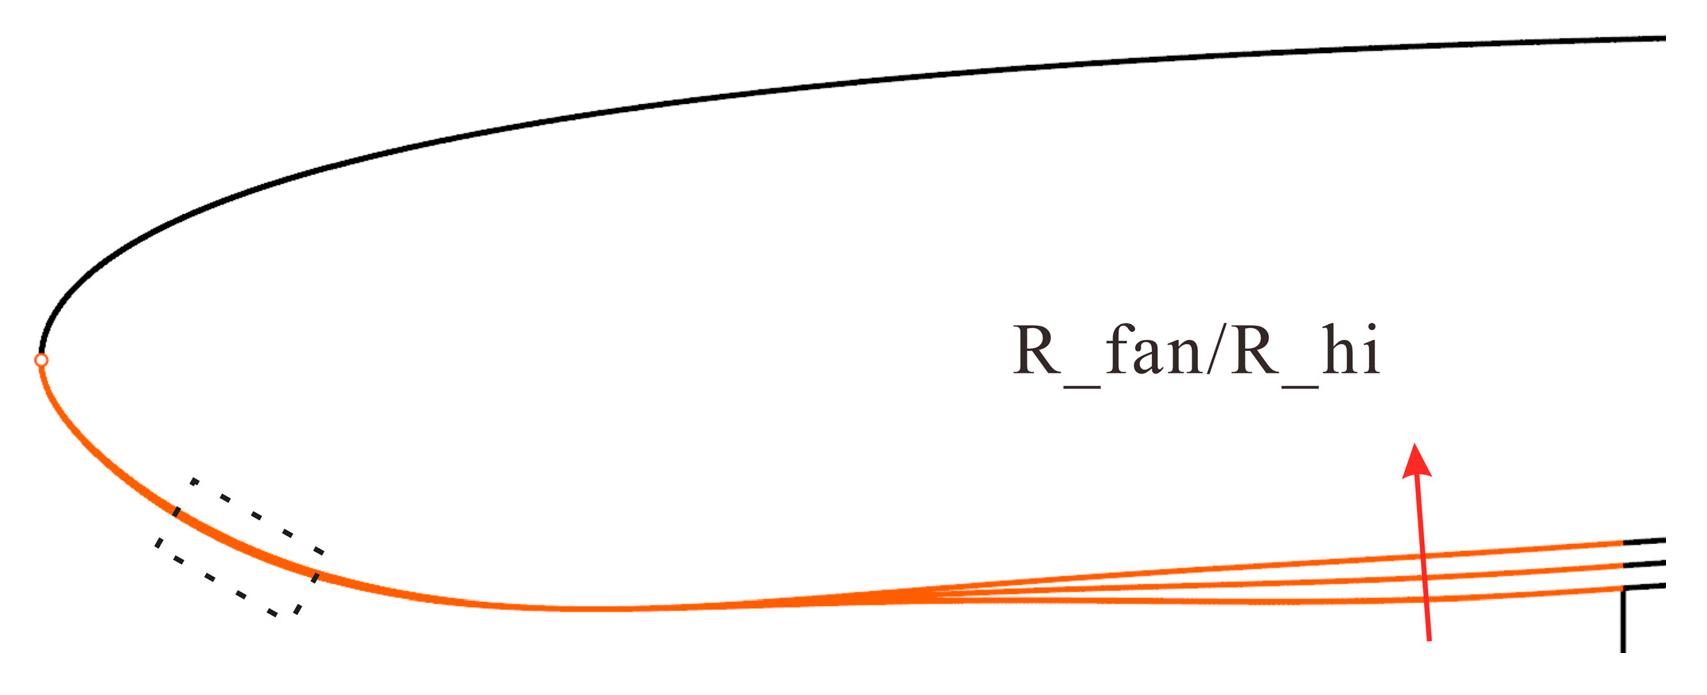
Figure 19.
Influence of fan face radius variation on pressure distribution at Line1 section (qₘ = 6 kg/s, Vc = 0 kt).
Figure 19.
Influence of fan face radius variation on pressure distribution at Line1 section (qₘ = 6 kg/s, Vc = 0 kt).
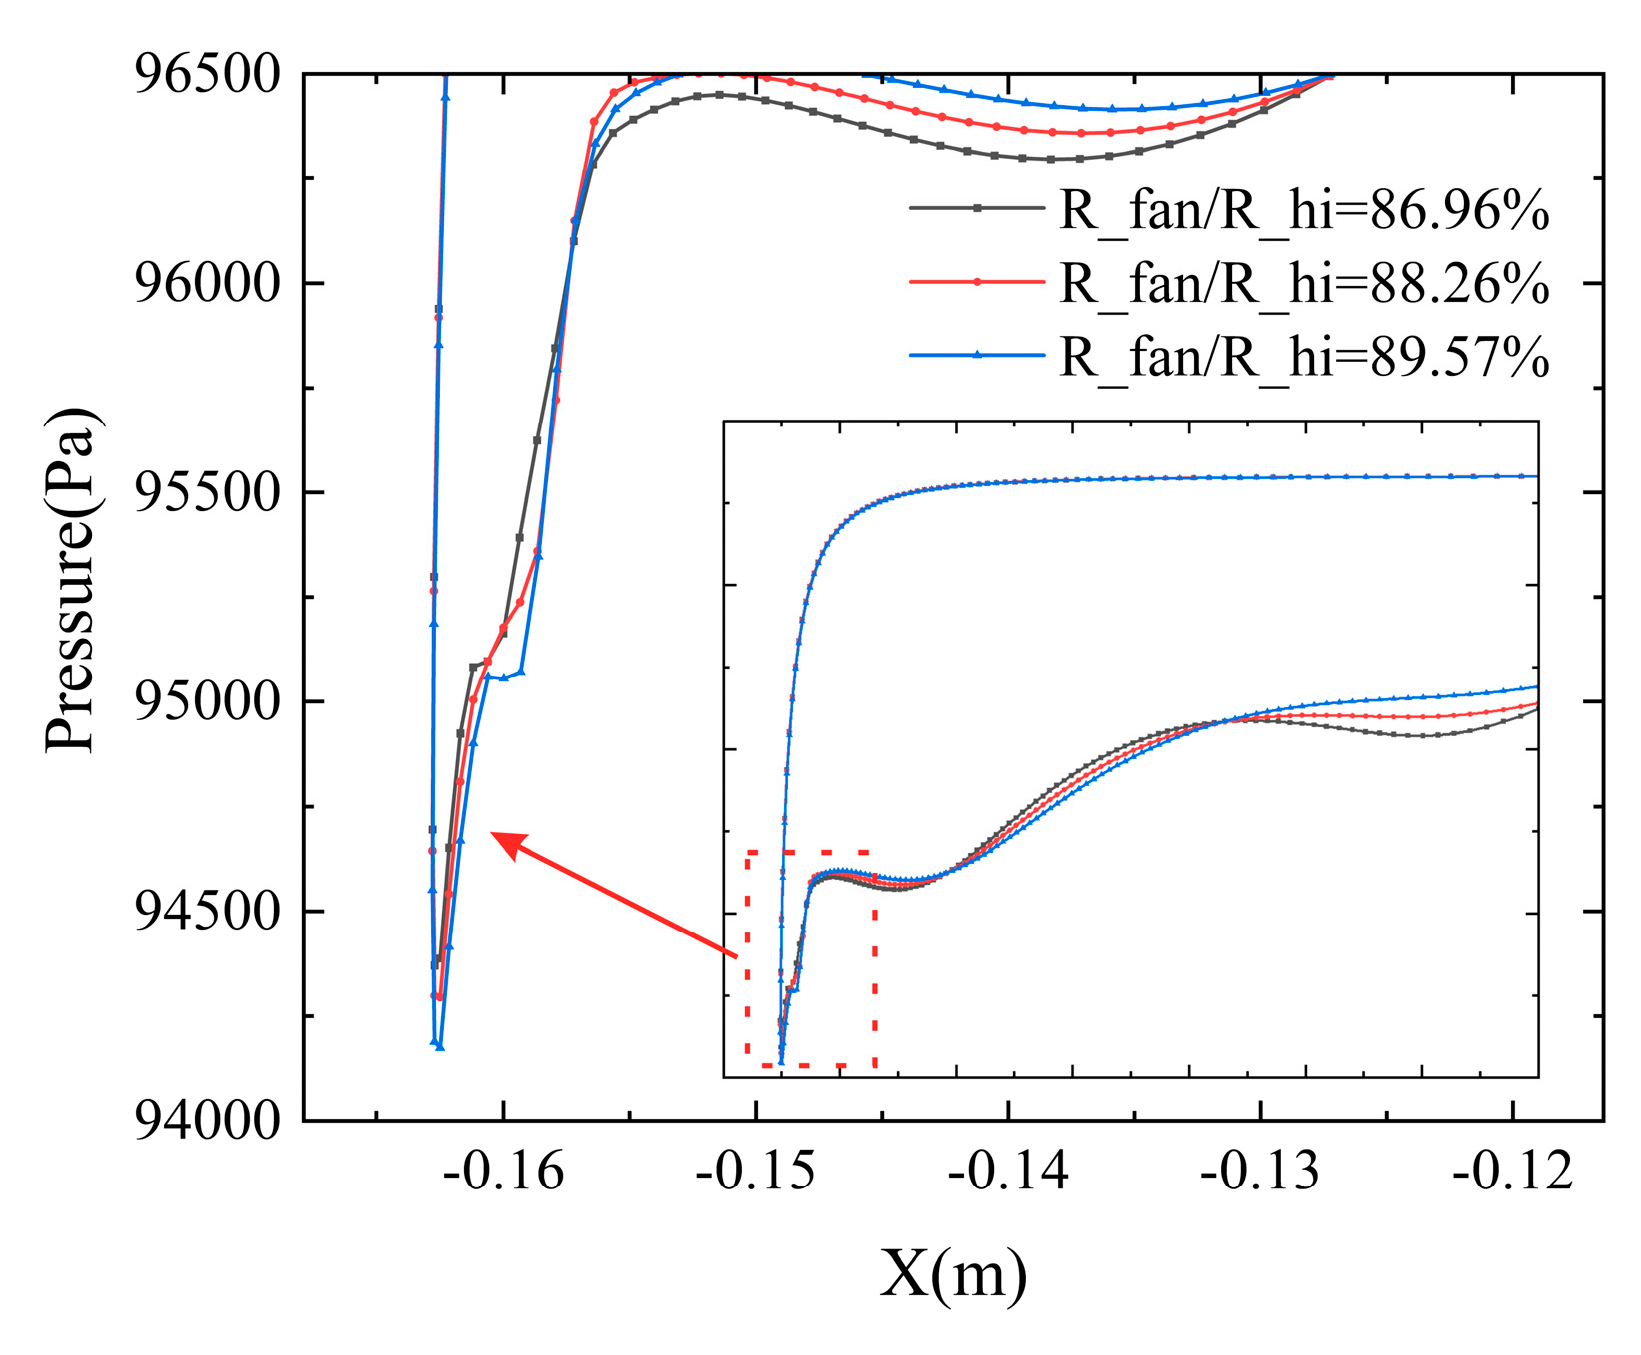
Figure 20.
(a) Influence of fan face radius on the IDCmax-mass flow rate relationship (Vc = 25kts); (b) Influence of fan face radius on the σ-mass flow rate relationship (Vc = 25kts).
Figure 20.
(a) Influence of fan face radius on the IDCmax-mass flow rate relationship (Vc = 25kts); (b) Influence of fan face radius on the σ-mass flow rate relationship (Vc = 25kts).
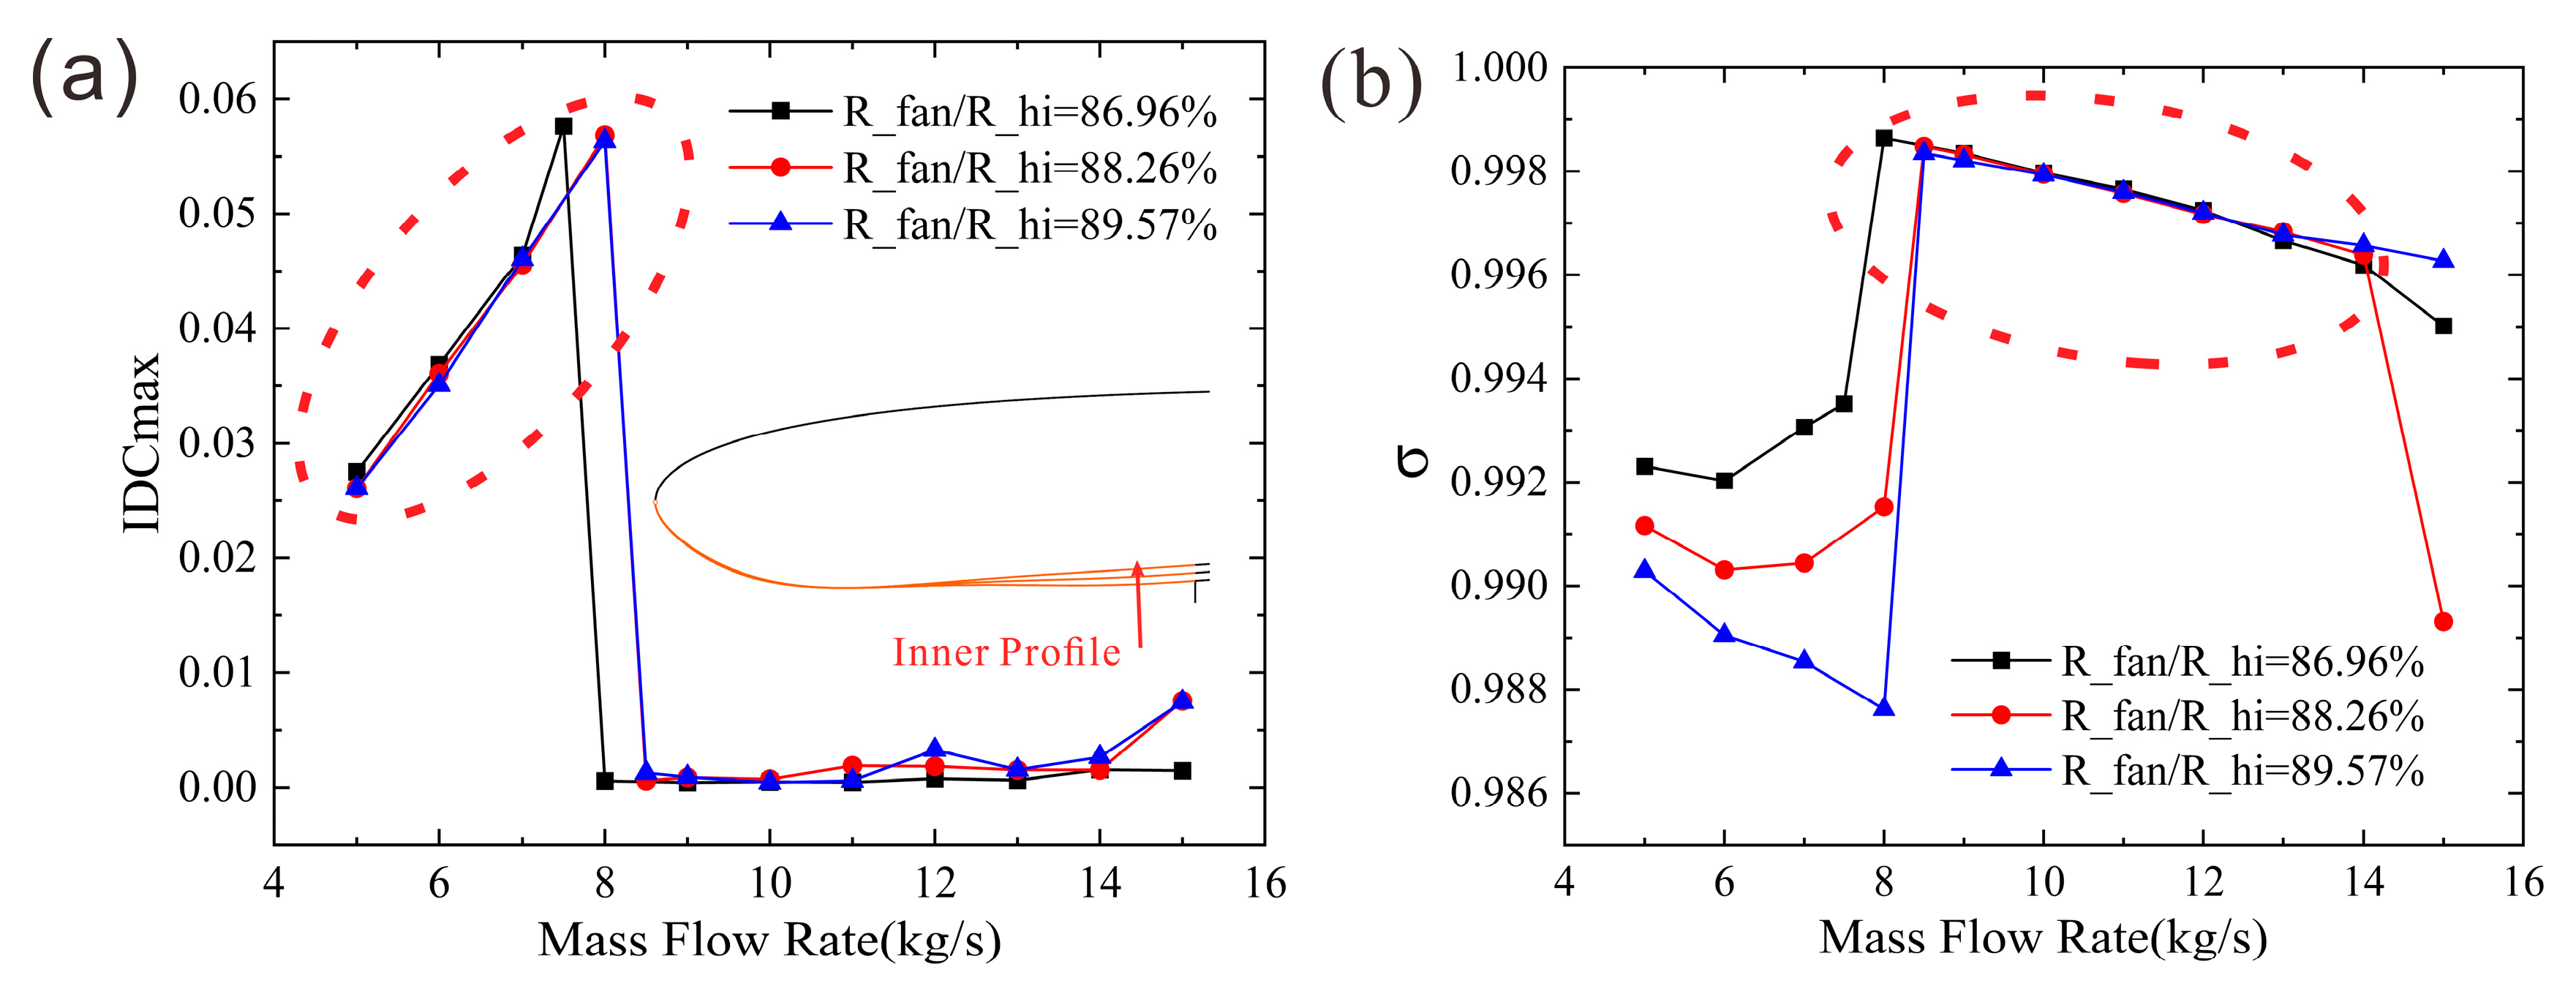
Figure 21.
AIP total pressure recovery distribution under various fan face radii (qₘ = 6 kg/s, Vc = 25 kt).
Figure 21.
AIP total pressure recovery distribution under various fan face radii (qₘ = 6 kg/s, Vc = 25 kt).
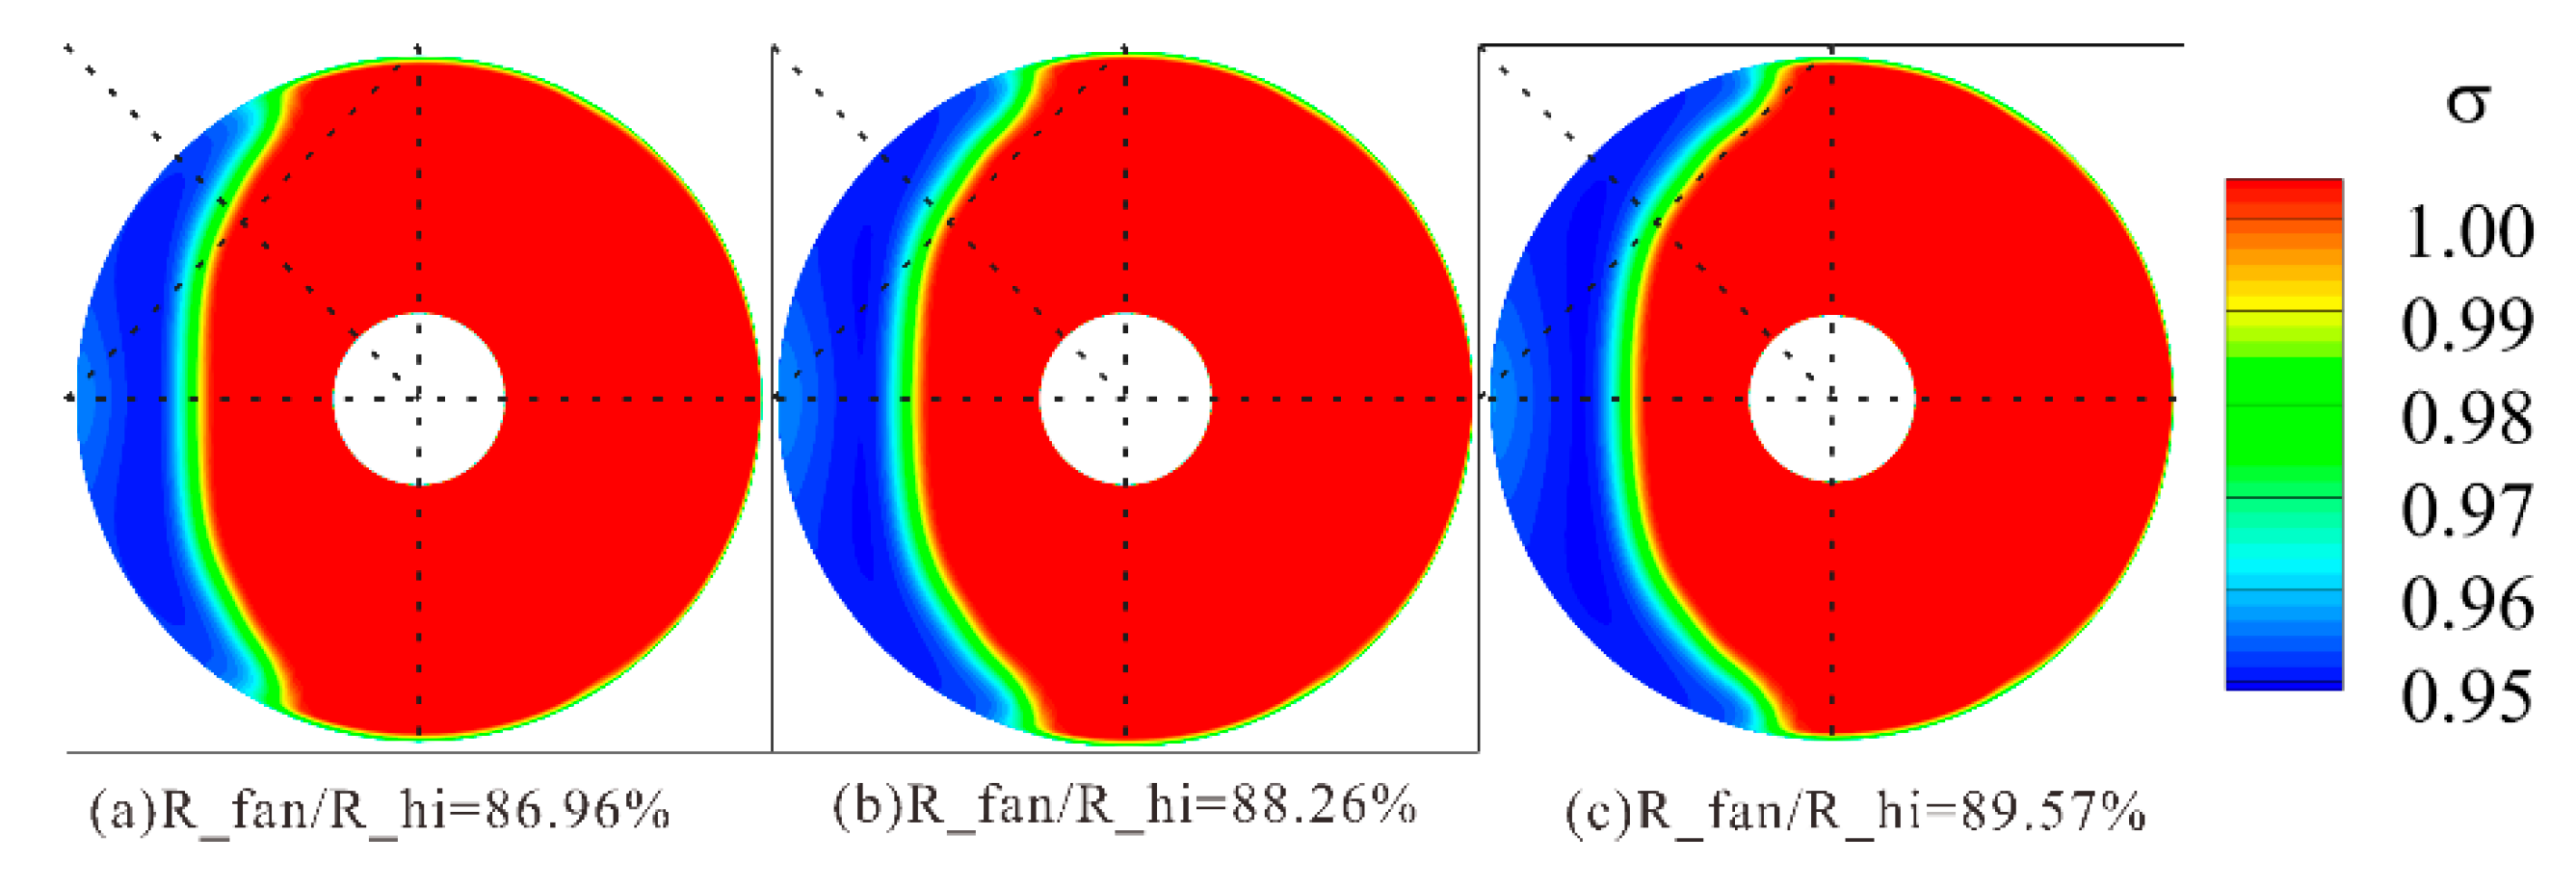
Figure 22.
Schematic of leading-edge radius variations for outer and inner contours.
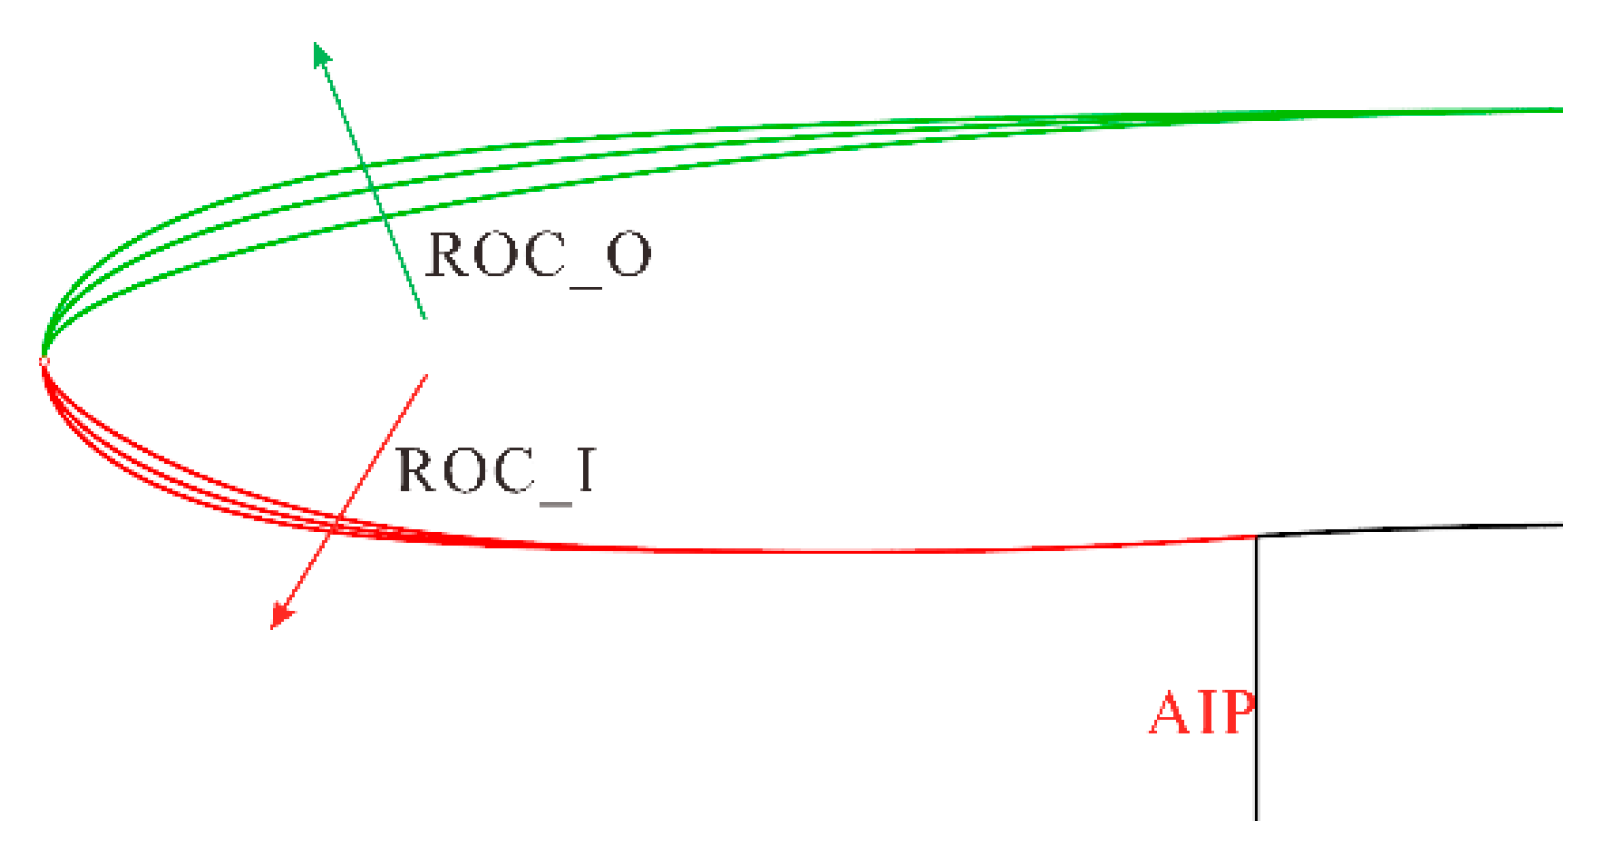
Figure 23.
(a) Influence of leading-edge radius on the IDCmax-mass flow rate relationship (Vc = 25kts); (b) Influence of leading-edge radius on the σ-mass flow rate relationship (Vc = 25kts).
Figure 23.
(a) Influence of leading-edge radius on the IDCmax-mass flow rate relationship (Vc = 25kts); (b) Influence of leading-edge radius on the σ-mass flow rate relationship (Vc = 25kts).
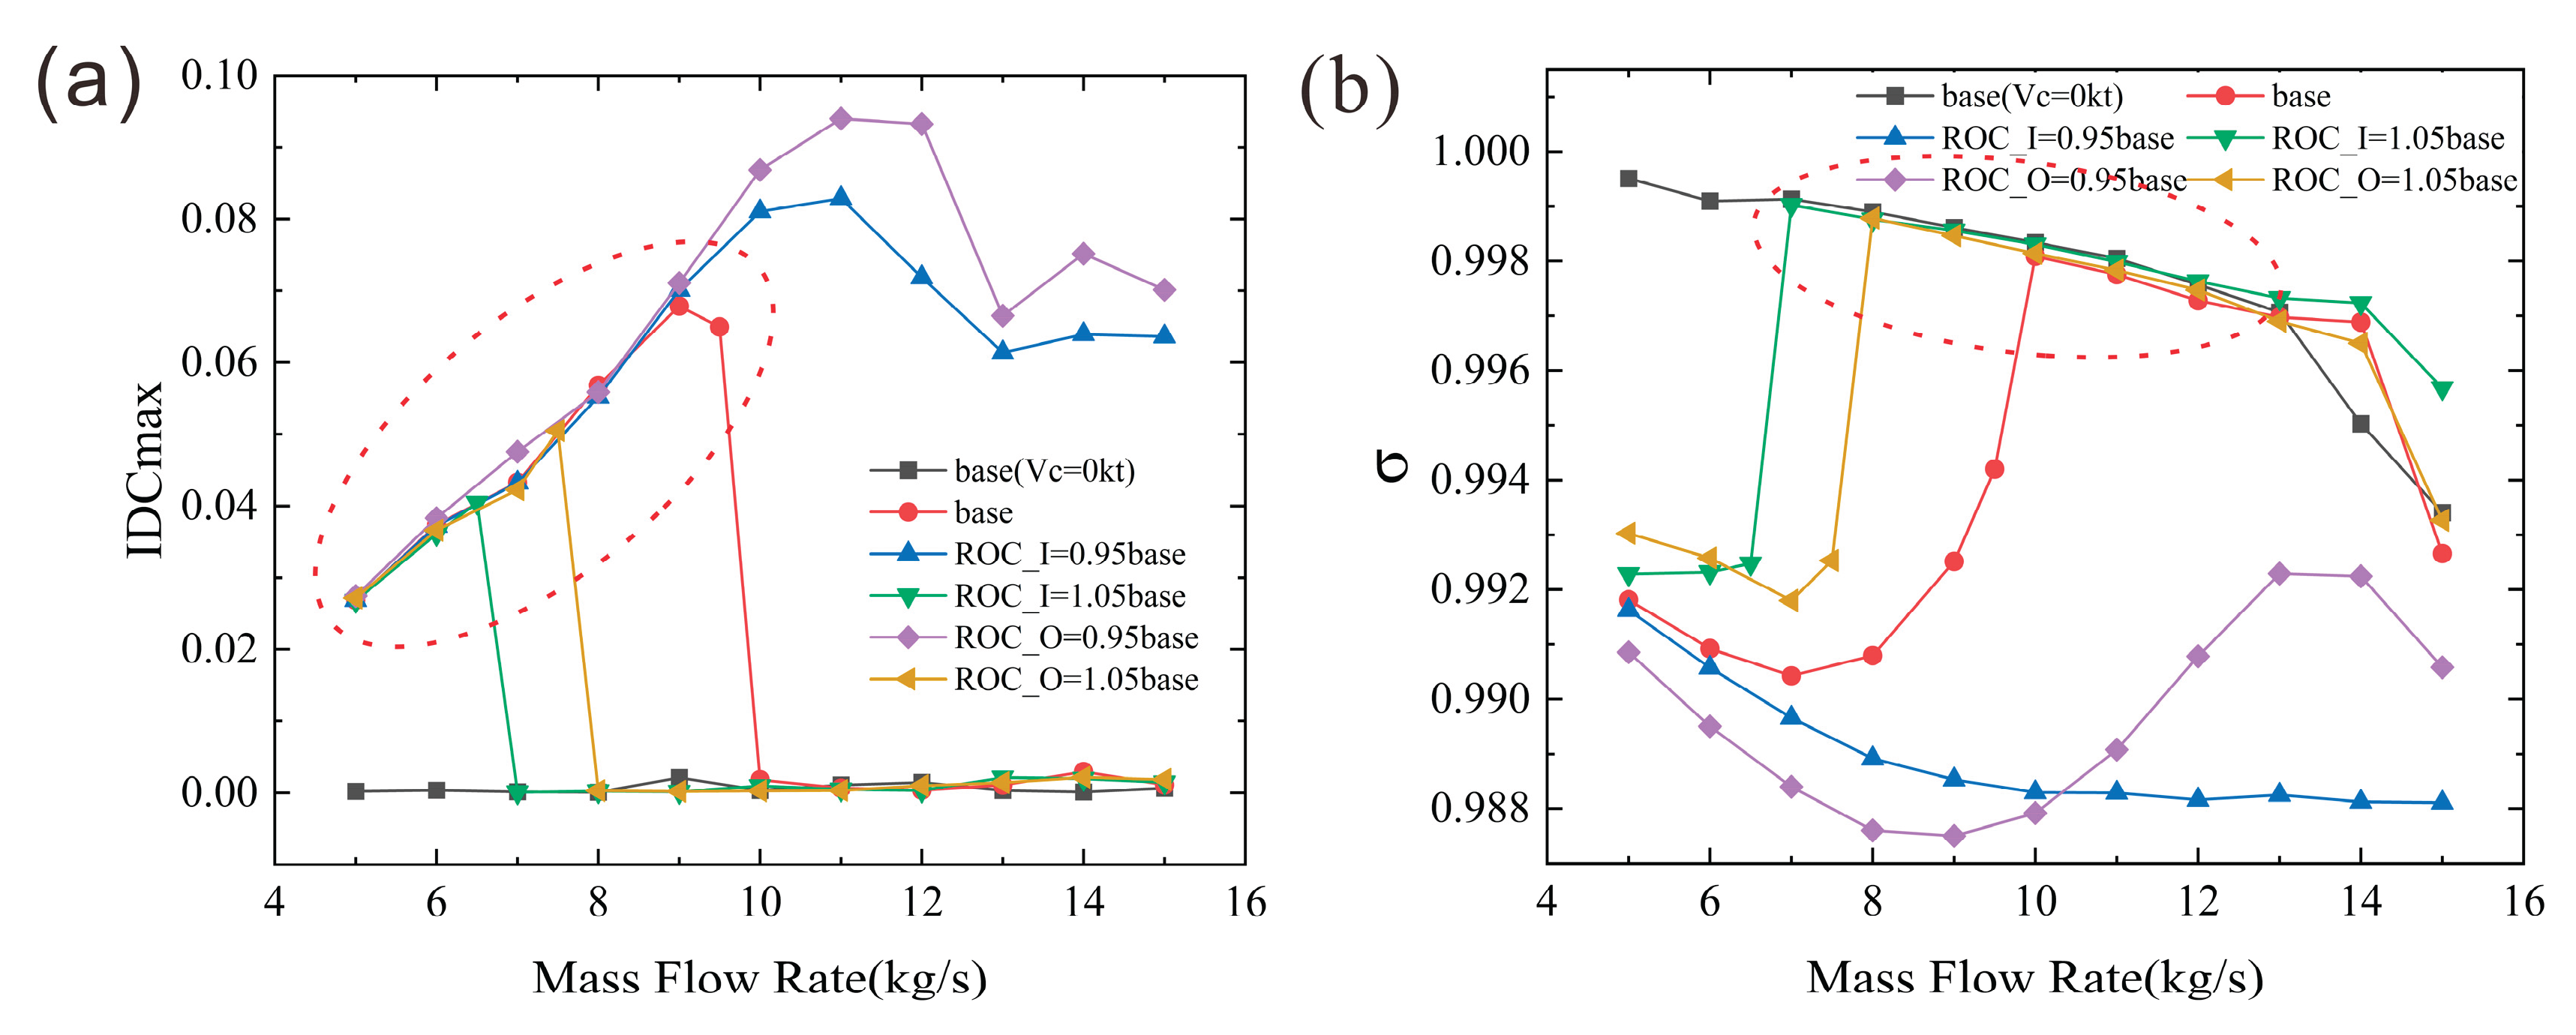
Figure 24.
Contours of total pressure recovery coefficient at AIP under different outer contour leading-edge radius (qₘ = 6 kg/s, Vc = 25 kt).
Figure 24.
Contours of total pressure recovery coefficient at AIP under different outer contour leading-edge radius (qₘ = 6 kg/s, Vc = 25 kt).
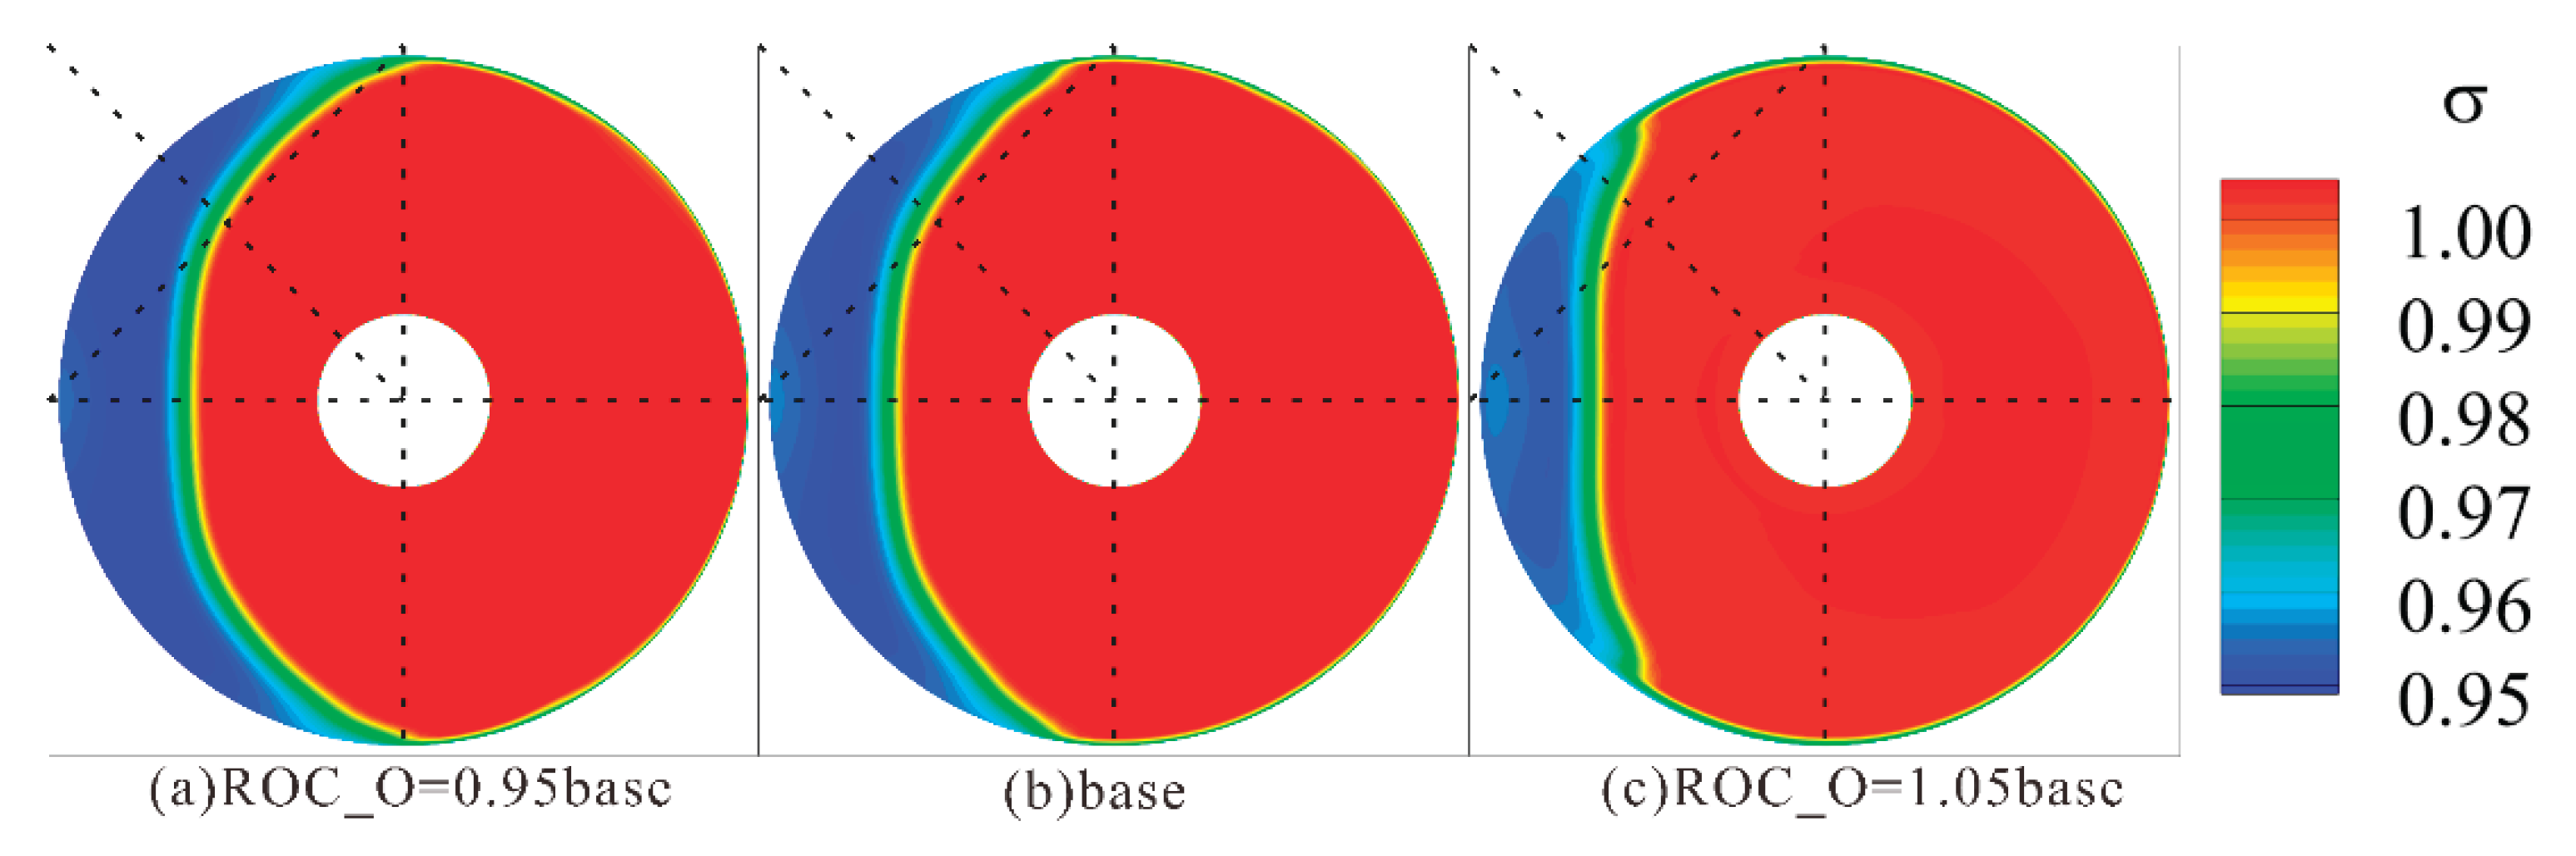
Figure 25.
Influence of outer contour leading-edge radius variation on pressure distribution at Line1 section (qₘ = 6 kg/s, Vc = 0 kt).
Figure 25.
Influence of outer contour leading-edge radius variation on pressure distribution at Line1 section (qₘ = 6 kg/s, Vc = 0 kt).
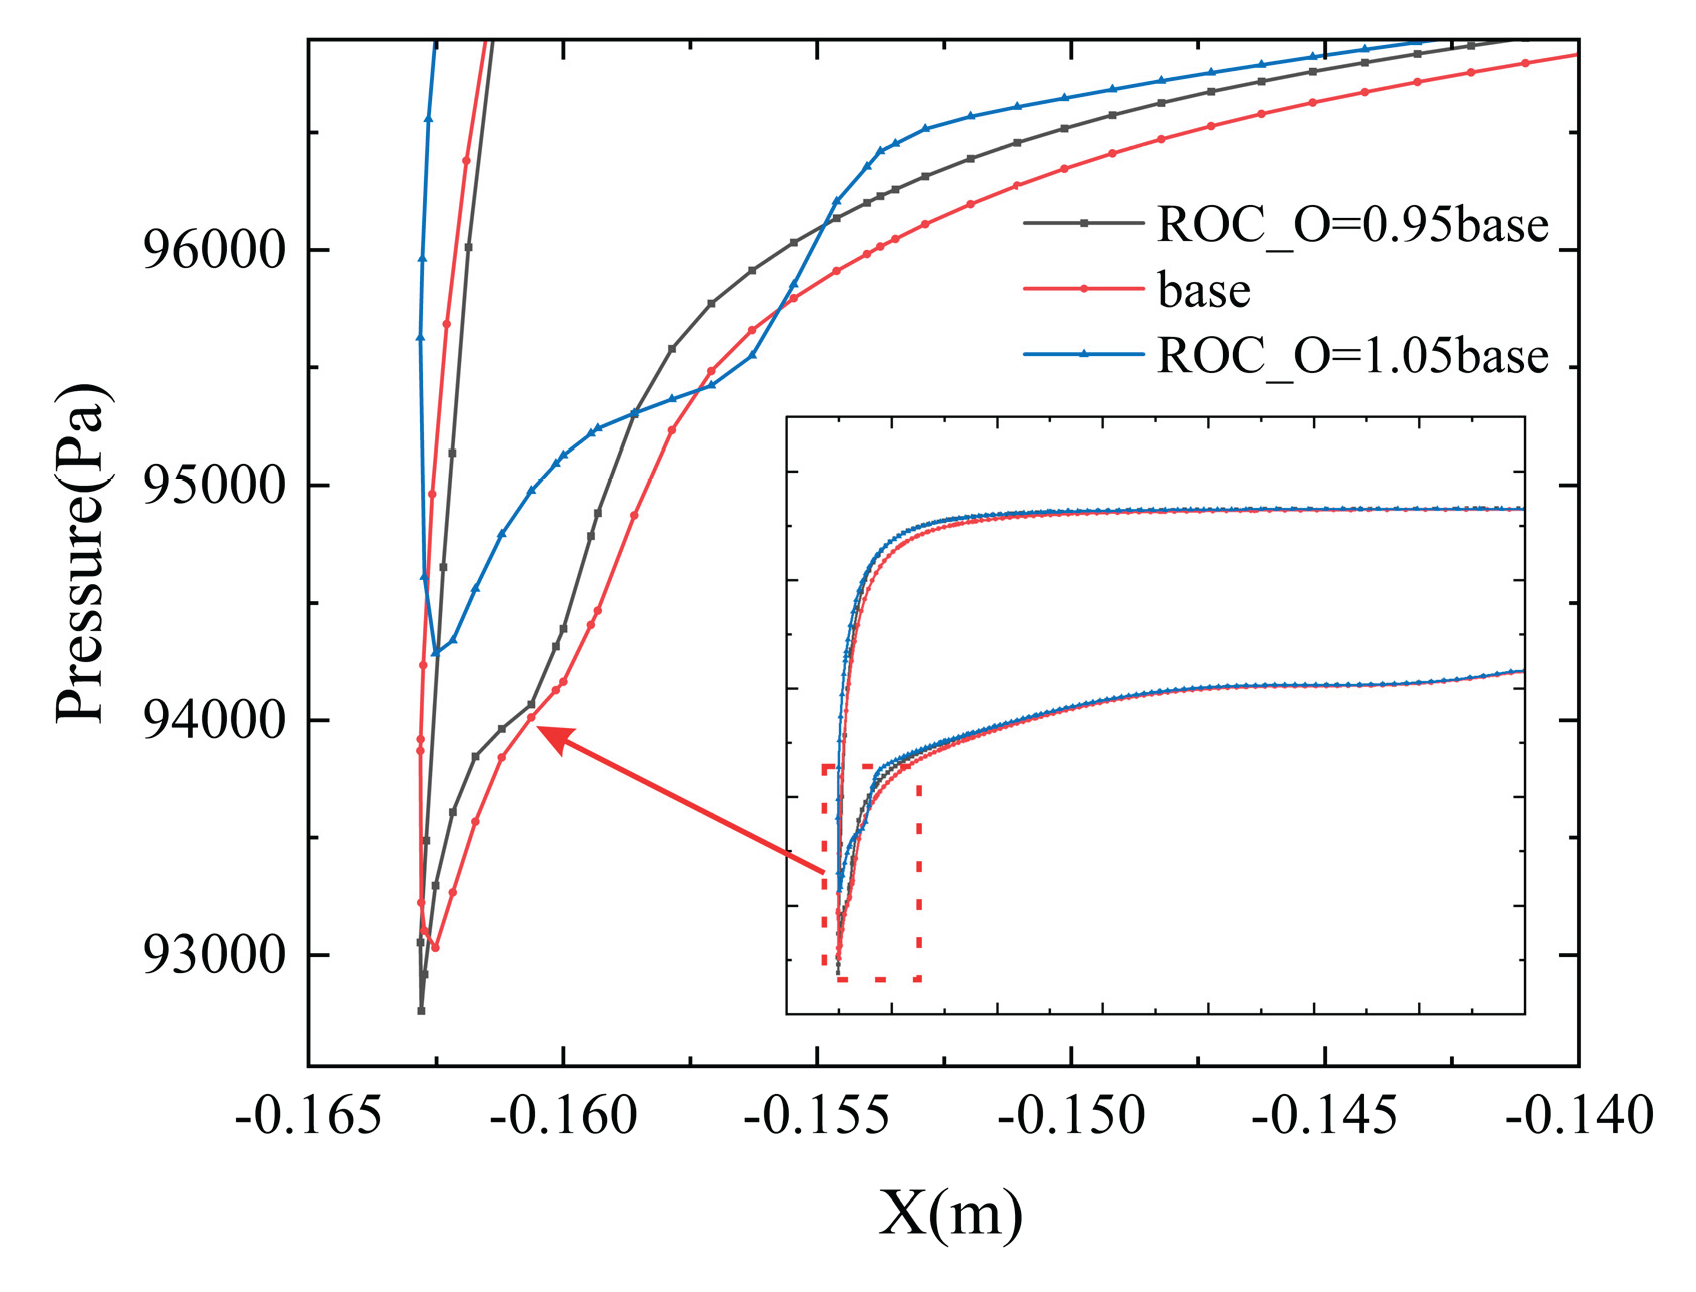

Table 1.
Geometric parameters of the baseline inlet configuration.
| Parameters (Outer Profile) |
Value (Outer Profile) |
Parameters (Inner Profile) |
Value (Inner Profile) |
|---|---|---|---|
| R_hi/mm | 180.00 | R_hi/mm | 180.00 |
| L_nac/mm | 647.70 | L_intake/mm | 162.82 |
| ROC_O/mm | 86.09 | ROC_I/mm | 63.49 |
| R_m/mm | 213.79 | R_th/mm | 154.41 |
| L_m/mm | 219.66 | L_th/mm | 106.55 |
| R_te/mm | 159.48 | R_fan/mm | 156.53 |
| β_o/(°) | 13.27 | β_i/(°) | 4.02 |
Table 2.
Variation of nacelle performance with grid resolution.
| grid resolution (millions) |
σ | IDCmax |
|---|---|---|
| 3.50 | 0.986 684 | 0.032 497 |
| 8.58 | 0.987 475 | 0.032 859 |
| 12.52 | 0.987 952 | 0.032 826 |
Disclaimer/Publisher’s Note: The statements, opinions and data contained in all publications are solely those of the individual author(s) and contributor(s) and not of MDPI and/or the editor(s). MDPI and/or the editor(s) disclaim responsibility for any injury to people or property resulting from any ideas, methods, instructions or products referred to in the content. |
© 2025 by the authors. Licensee MDPI, Basel, Switzerland. This article is an open access article distributed under the terms and conditions of the Creative Commons Attribution (CC BY) license (http://creativecommons.org/licenses/by/4.0/).
Copyright: This open access article is published under a Creative Commons CC BY 4.0 license, which permit the free download, distribution, and reuse, provided that the author and preprint are cited in any reuse.


