1. Introduction
The isotropic phase of rod-like nematic liquid crystals (LC) is a gateway to liquid crystal (LC) mesophases whose extraordinary properties inspired and later validated the Landau–de Gennes model, one of crucial models in the
Physics of Liquid Crystals [
1,
2,
3,
4,
5,
6,
7,
8]. Its significance has expanded to the
Soft Matter category, which includes liquid crystals, polymers, colloids, micellar systems, supercoiling glass formers, …. and biosystems [
9,
10,
11,
12,
13].
The isotropic phase of nematogens is also important in
Critical Phenomena and Phase Transitions Physics, due to a melting/freezing unusual discontinuous phase transition related to only one element of symmetry [
14,
15,
16].
The isotropic phase of rod-like nematogenic LC has also proven to be significant for studying previtreous properties in glass-forming systems, i.e., for the
Glass Transition Physics [
17,
18,
19,
20,
21].
A unique significance of the isotropic phase of the nematogens also stems from the fact that it constitutes an experimental model-system, facilitating the cognitive feedback process: .
The LdG model serves as a fundamental reference in each of the aforementioned fields. However, when compared with experimental results for the canonical isotropic phase, several essential problems arise.
This report presents and discusses this peculiar experimental evidence, also proposing a coherent model-based explanation of emerging challenges.
Five decades ago, Pierre Gilles de Gennes published seminal papers discussing the anomalous increase of the Cotton-Mouton effect (CME) in the isotropic liquid phase of rod-like liquid crystalline (LC) compounds, when approaching the isotropic-nematic (I-N) transition [
22,
23]. To explain the surprisingly simple and common pattern of changes, de Gennes considered the expansion of the Landau model free energy,
, using the uniaxial quadrupolar order parameter [
22,
23]:
Substituting the tensorial uniaxial order parameter
, where
refers to the component of the director vector with ‘nematic’
and
and
is the scalar metric of ordering, de Gennes obtained the expansion with the scalar metric [
1,
2]:
De Gennes introduced the extrapolated temperature of a hypothetical continuous phase transition in order to take into account the long-range pre-transitional effect associated with discontinuous phase transitions: , where is the I-N ‘clearing’ temperature and is the I-N discontinuity metric. Consequently, the amplitude of second order term in above relation is given by: .
The last term in the above equations reflects the impact of the external field. Refs. [
22,
23] recalled CME (i.e., refractive index birefringence induced by a strong magnetic field), available at that time.
In subsequent years, apart from the Cotton-Mouton effect CME) [
24], such modelling was employed for the Optical Kerr effect (
OKE) [
25,
27], Electro-optic Kerr effect (
EKE) [
27,
28,
29], Rayleigh Light Scattering (
LS,
) [
30], turbidity (
) [
31], compressibility (
) [
31,
32], and Nonlinear Dielectric Effect (
NDE,) [
33]. For each of these methods, the same temperature pattern for the strong and long-range pretransitional effect was reported [
1,
2,
3,
4,
14,
22,
33]:
where
is the amplitude related to the given method; parameters
.
In basic monographs for
Liquid Crystals Physics the reciprocal plots for CME, KE or LS are presented as the crucial validation of the Landau – de Gennes (LdG) model, and more general mean-field description [
1,
2,
3,
4,
5,
6,
7]. The success of the LdG model was a significant factor Pierre G. de Gennes Nobel Prize in 1991 [
34].
However, in the first edition of the grand monograph ‘
The Physics of Liquid Crystals’ (1974, [
1]), de Gennes pointed out some essential weaknesses of the above model:
(Q1) For the majority of second order phase transitions the Landau model approximation does not occur (magnetic systems, superfluid Helium, ...) showing for response functions the behavior
, with the exponent
, but not
[
1].
It becomes even more puzzling when including later results for electrooptic Kerr Effect (EKE) and NDE on approaching the critical consolute point, with anomalies described by exponent
and
, respectively [
35,
36].
(Q2) Why is the temperature singular
is so close to
, i.e.,
?’ [
1].
It means that the experimentally detected discontinuity via properties encountered in Equation (3) is equal to
[
1,
4,
14,
15,
24,
25,
26,
27,
28,
29,
30,
31,
32,
33]. Notable mean field analysis via basic Landau–de Gennes or Maier–Saupe models gives
[
1,
4,
6,
37,
38,
39].
The results obtained in subsequent decades showed that this list can be supplemented:
(Q3) For
,
, and
pretransitional changes characteristic deviations from LdG Equation (3) in the immediate vicinity
are reported. They are commented only heuristically via the impact of 'cybotactic groups' [
24,
25,
26,
27,
28,
29,
30,
31,
32,
40,
41,
42,
43,
44,
45,
46,
47].
(Q4) Heat capacity/specific heat shows the pretransitional anomaly
, with the exponent
, in the isotropic liquid and in the nematic phases [
4,
14,
48,
49,
50,
51,
52]. The basic LdG model yields in the isotropic liquid phase
[
4,
5,
6]
(Q5) The puzzle regarding explanation of pretransitional anomaly of dielectric constant
[
52,
53,
54,
55,
56,
57,
58,
59,
60]. Moreover, its appearance depends on the molecular structure [
37,
38].
(Q6) Nonlinear Dielectric Effect (NDE) is the strong electric field-related extension of dielectric constant [
61,
62]:
Generally, the infinite rise of NDE on approaching the critical point is expected:
. However, for some exceptional LC materials the ‘negative pretransitional anomaly was found:
[
63].
The unusual, universalistic pretransition changes described by Equation (3) served as the inspiration and origin for the development of the Landau-de Gennes model. Hence, significant experimental problems may raise both concerns and clarification necessity
Notably, the Landau-de Gennes model has remained the subject of intensive theoretical research for decades, aimed at testing its peculiarities and the limits of its applicability [
1,
2,
3,
4,
5,
6,
7,
14,
15,
37,
38,
39,
48,
64,
65,
66,
67,
68,
69]. However, this report refers to the puzzling experimental evidence (
Q1-Q6), essential for the ultimate validation.
For the model hypothesis addressing this challenge, focused studies of the dielectric constant and NDE are essential. These results are presented below and followed by the Discussion section, which comments on and explains the puzzling experimental features recalled in questions Q1-Q6.
2. Results
Results presented below are for three nematogenic rod-like liquid crystalline compounds, with the following mesomorphism:
4-cyano-4-n-pentylbiphenyl (pentylcyanobiphenyl, 5CB), with the following mesomorphism [
4,
48,
59]:
4-(2-methylbutyl)-4´-cyanobiphenyl (isopentylcyanobiphenyl, 5*CB [
63,
70,
71]:
p-methoxy-benzylidene p-n-butyl-anilline, MBBA [
4,
16,
72]
:
5CB and 5*CB share the same chemical formula C
18H
19N, but they differ slightly in molecular structure, as depicted in
Figure 1 and
Figure 2, below. 5CB essentially crystallizes on cooling. Supercooling is only possible when fast cooling is matched with a specially prepared sample [
73]. 5*CB can be supercooled at an arbitrary cooling rate down to the glass temperature that occurs in the chiral nematic phase at
[
63,
70,
71]. Both 5CB and 5*CB are associated with the permanent dipole moment
, approximately parallel to the main, cyanobiphenyl part of molecules [
4,
70]. It leads to the positive anisotropy of dielectric permittivity,
for 5CB [
4].
MBBA is related to the permanent dipole moment, almost perpendicular to the long molecular axis
, located at the angle
, in respect to the long molecular axis. It leads to the negative anisotropy of dielectric permittivity,
[
72].
The tested compounds were purchased from Fluka and carefully degassed before the experiments.
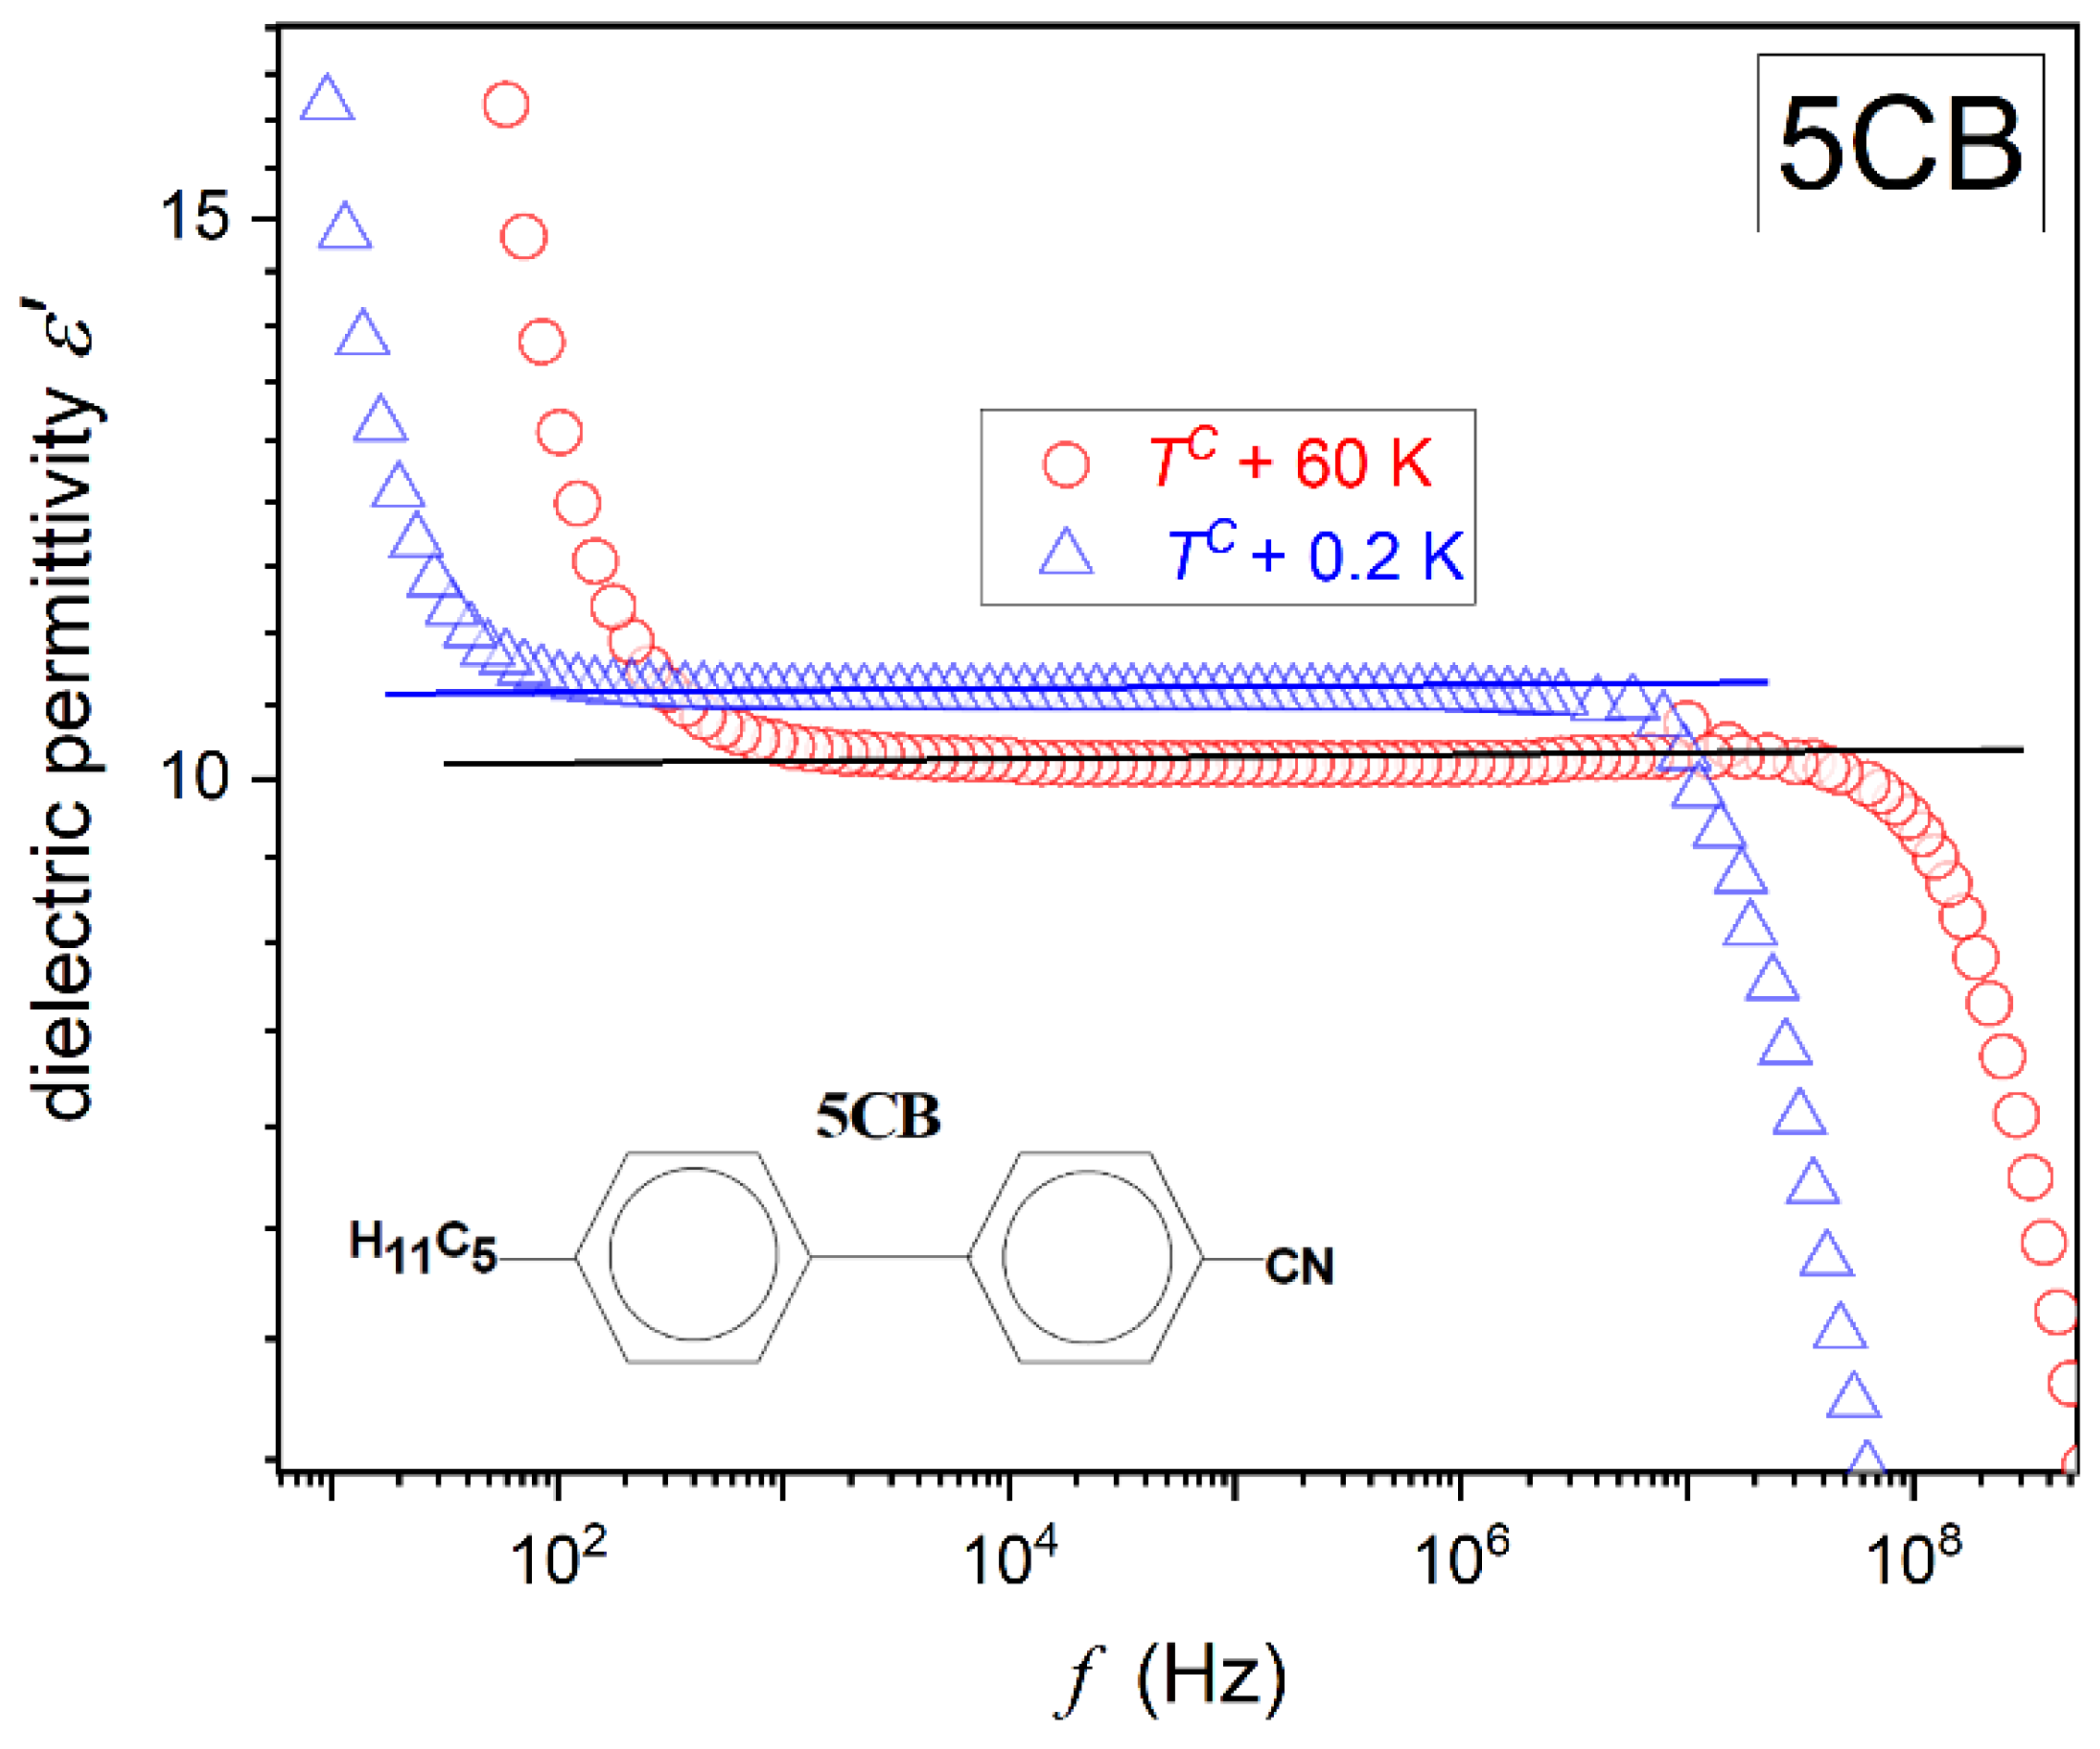
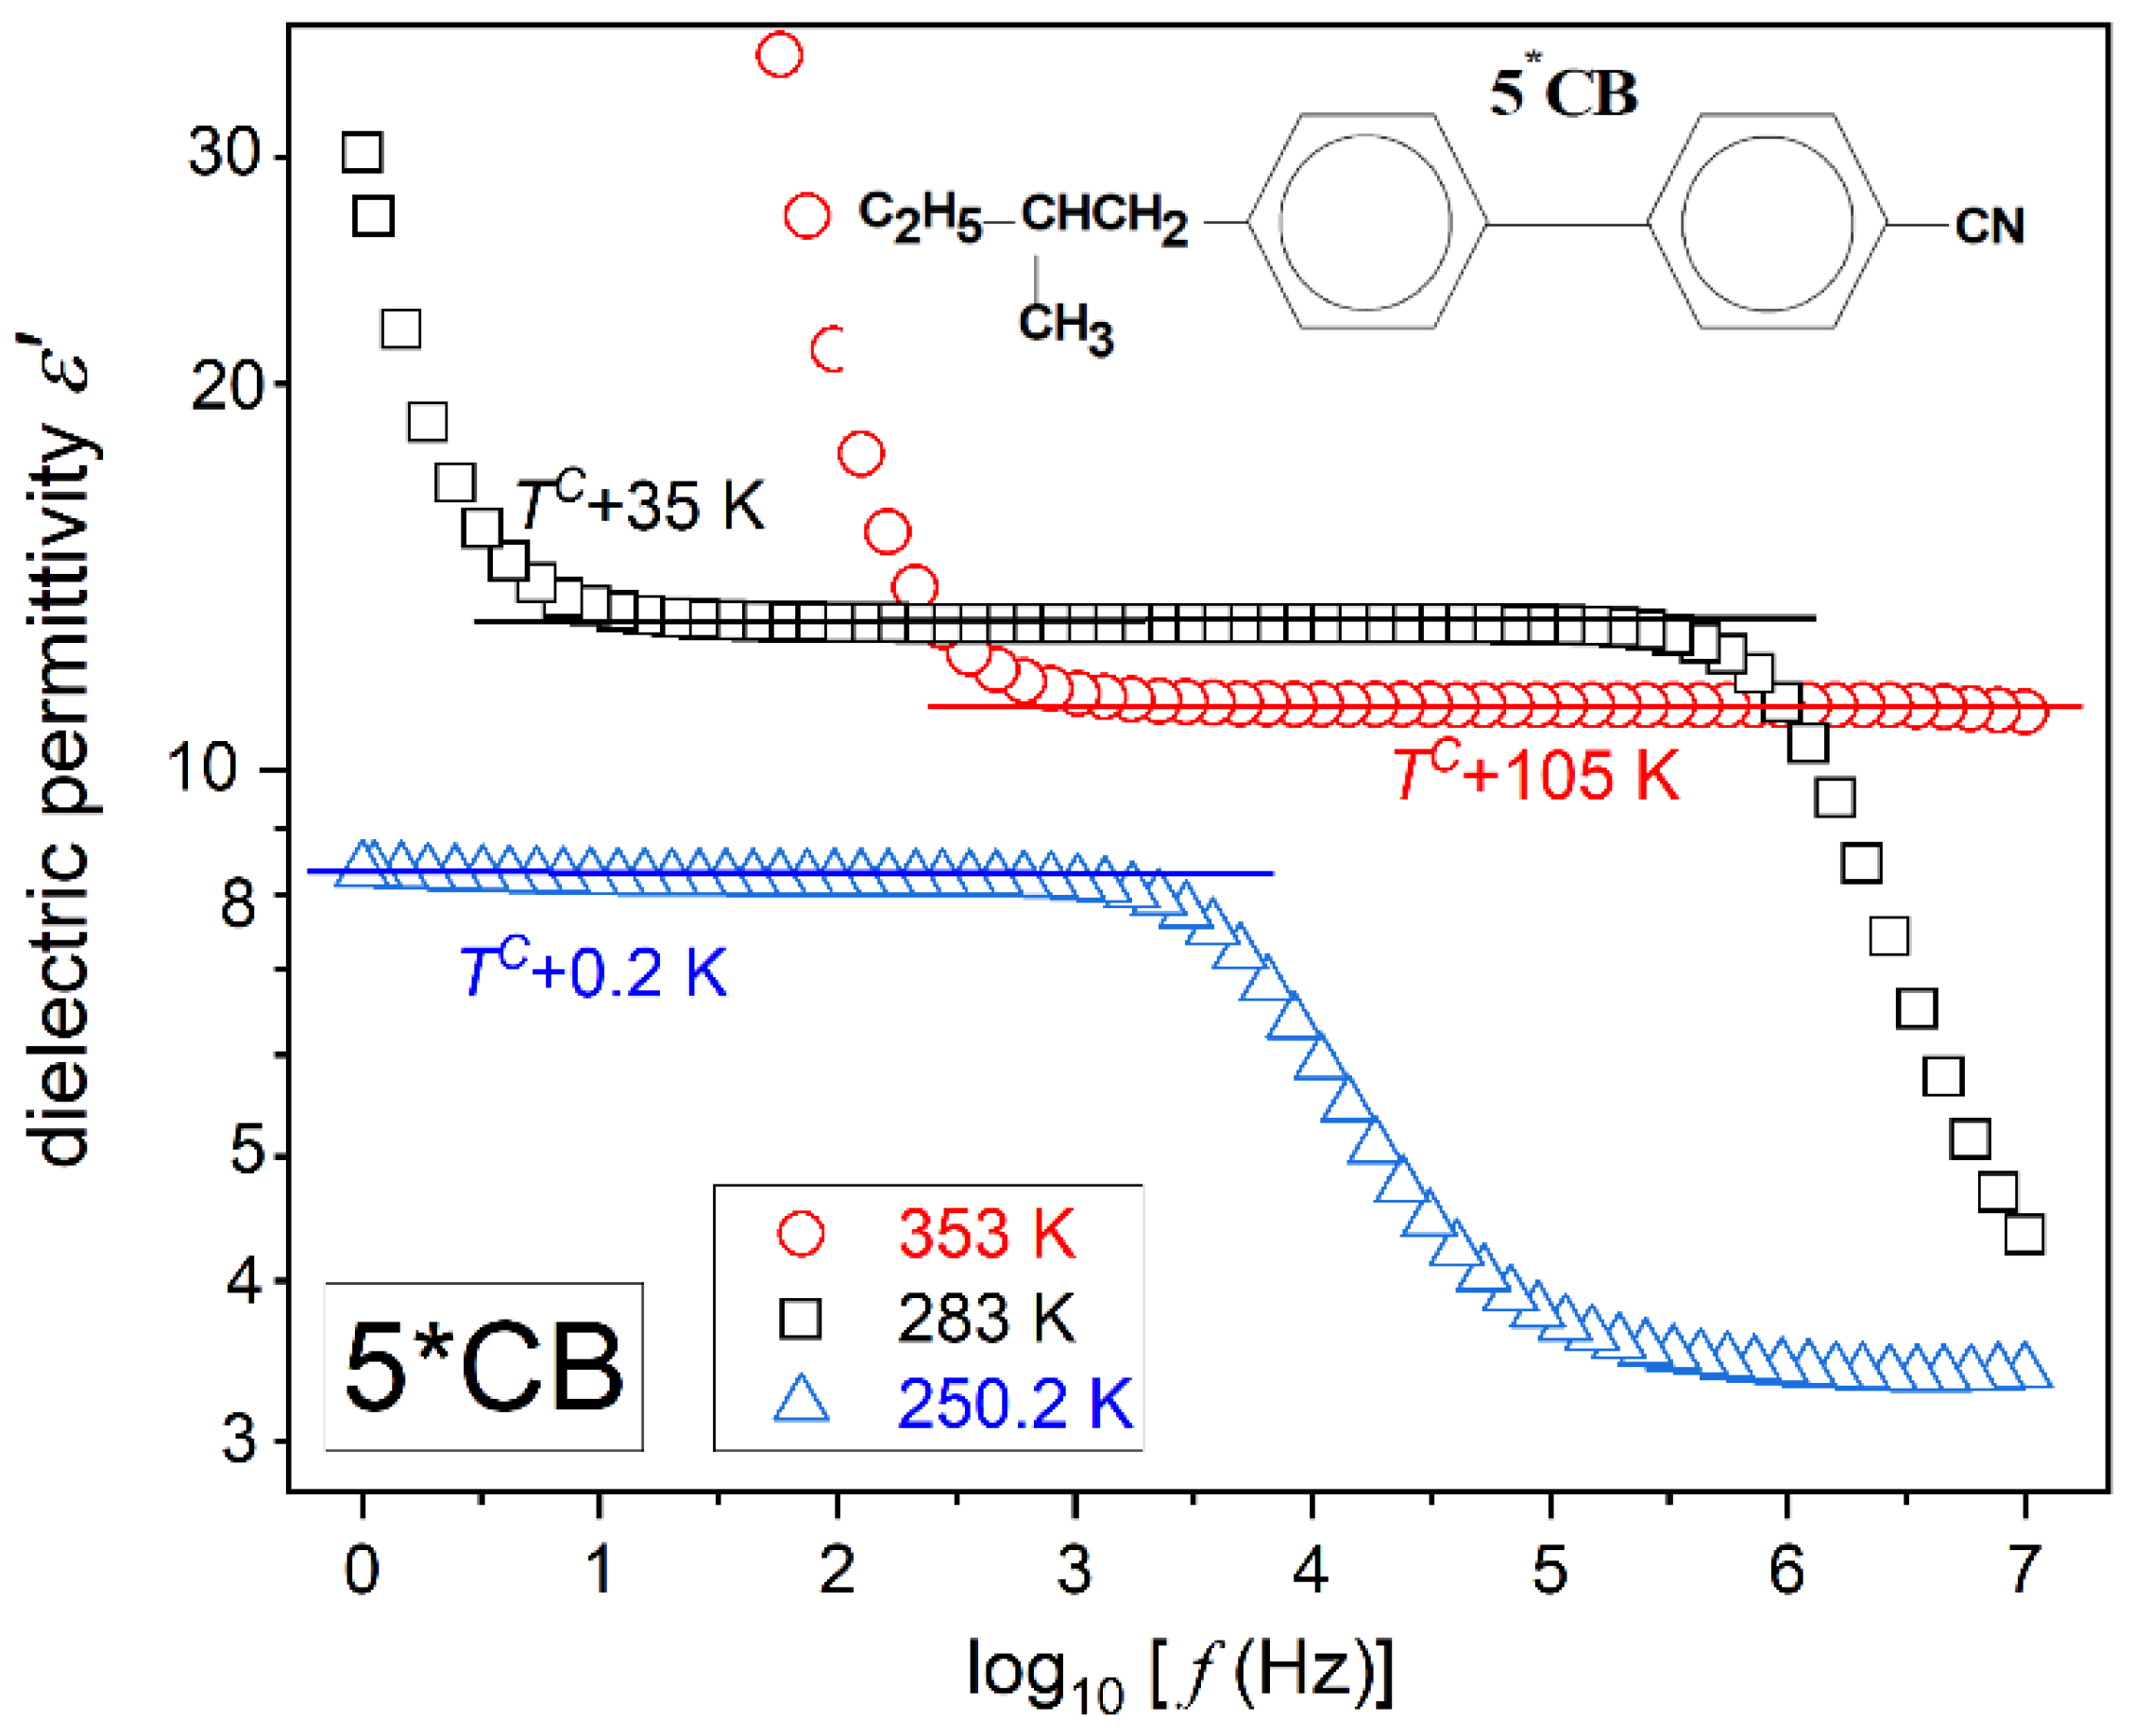
Figure 1 and
Figure 2 present examples of registered spectra for the real part of dielectric permittivity in 5CB and 5*CB, focusing on features relevant to the physical properties discussed in the given report. High-resolution spectra for MBBA have only recently been reported in ref. [
60] Both
Figures show the same pattern, with a long horizontal domain where the frequency shift does not change the value of
. This is the static domain, defining dielectric constant, i.e.,
[
61].
When increasing the frequency above the static domain
drops, which is the hallmark that the long molecular axis gradually ceases to follow changes of the electric field. This is the onset of the dynamic domain used for testing dynamic properties, which are not the focus of the given report. On lowering the frequency below the static domain, values of
‘dramatically’ rises. It is the low-frequency region, and the rise is generally linked to ‘ionic impurities’, whose impact can be detected for low enough excitation frequencies [
60]. For the authors, an alternative explanation via translational shifts of the basic molecules can yield a similar registered output.
Generally, experimental studies of dielectric constant temperature evolution of the real part of dielectric permittivity at a constant selected frequency, most often in the range from 10 kHz to 100 kHz, are carried out. Such scenario can be successful for 5CB and also MBBA, with a similar
spectrum. However, in the isotropic phase of 5*CB the static domain significantly shifts on cooling, which is related to the enormous temperature range possible for testing and approaching the glass temperature. It causes the above constant frequency scenario to fail. For the 5*CB dielectric constant, consideration should be focused on the middle of the static domain, shifted towards lower frequencies upon cooling. As visible in
Figure 2, for 5*CB the static domain extends from ca ~3kHz to well below 1 Hz just above the clearing temperature. For 5CB, and also MBBA, it is related to the frequency range
.
2.1. Pretransitional Behaviour of Dielectric Constant
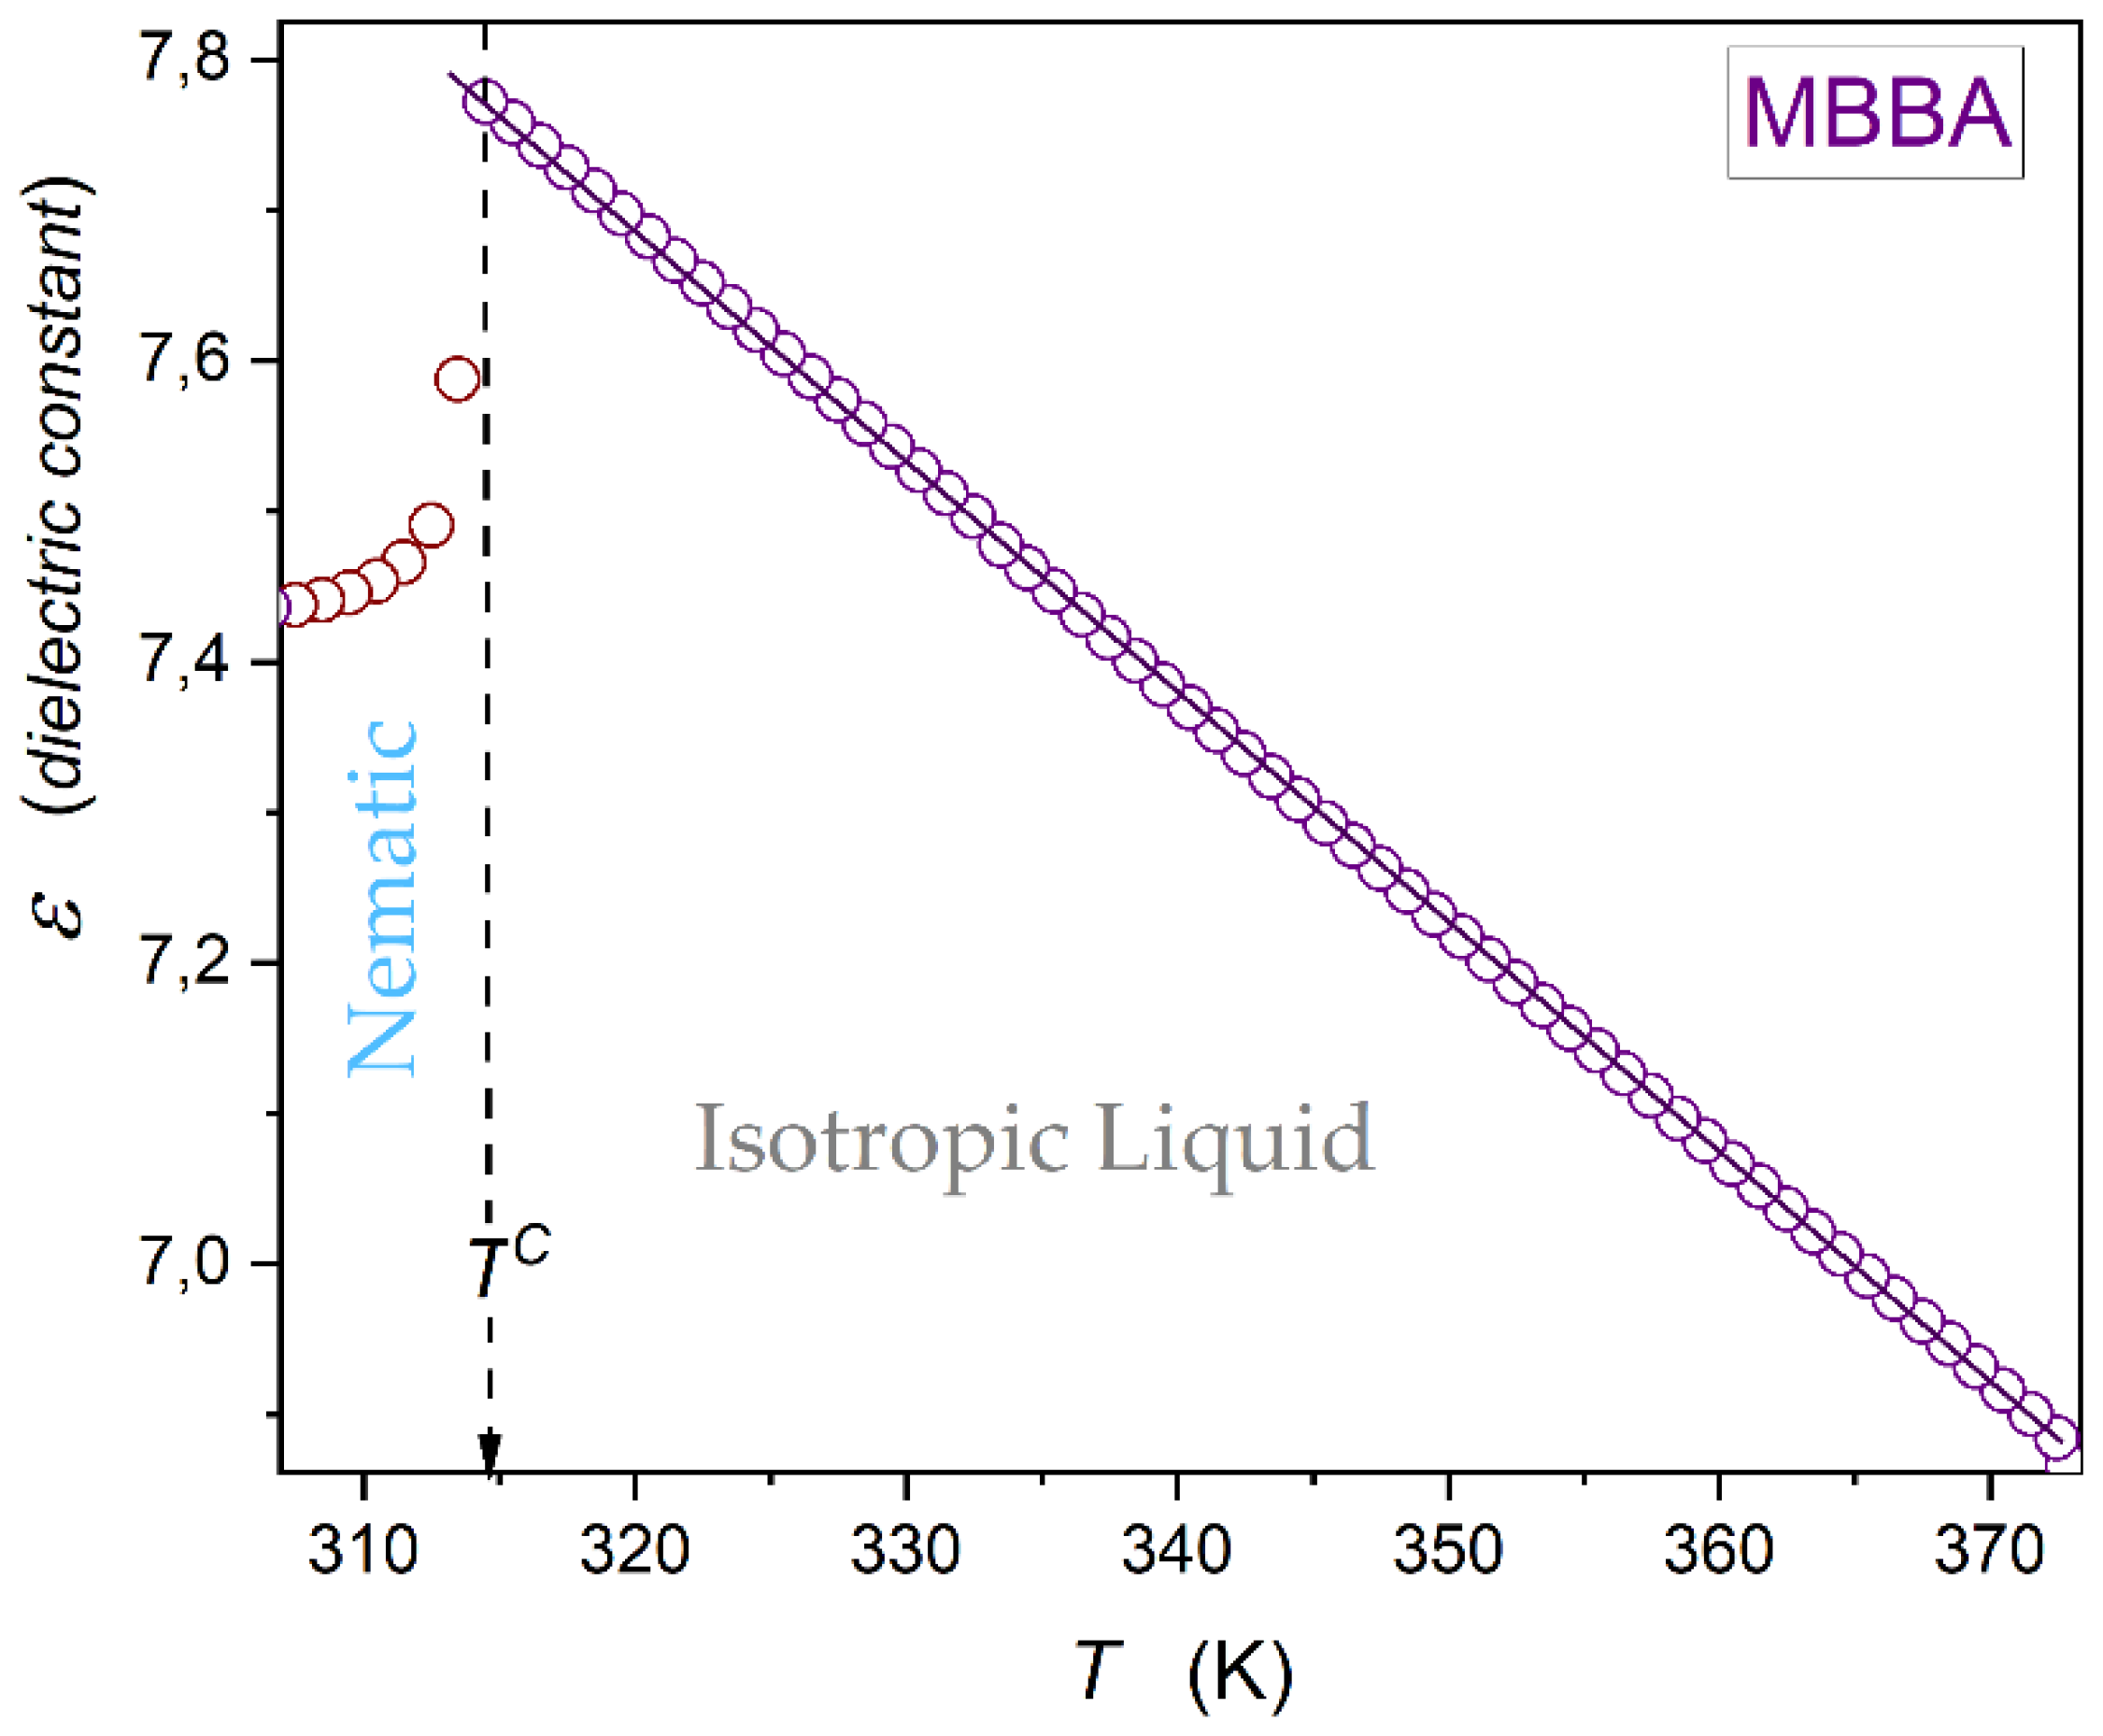
Figure 3 shows dielectric constant changes in the isotropic liquid phase of MBBA, up to
. There is an explicit linear behaviour, with no hallmarks of a pretransitional effect for
, i.e., approaching the I-N transition. Nevertheless, the derivative analysis of high-resolution data in ref. [
60] revealed a weak hallmarks of the pretransitional behaviour for
tests, enabling subtle distortions detection.
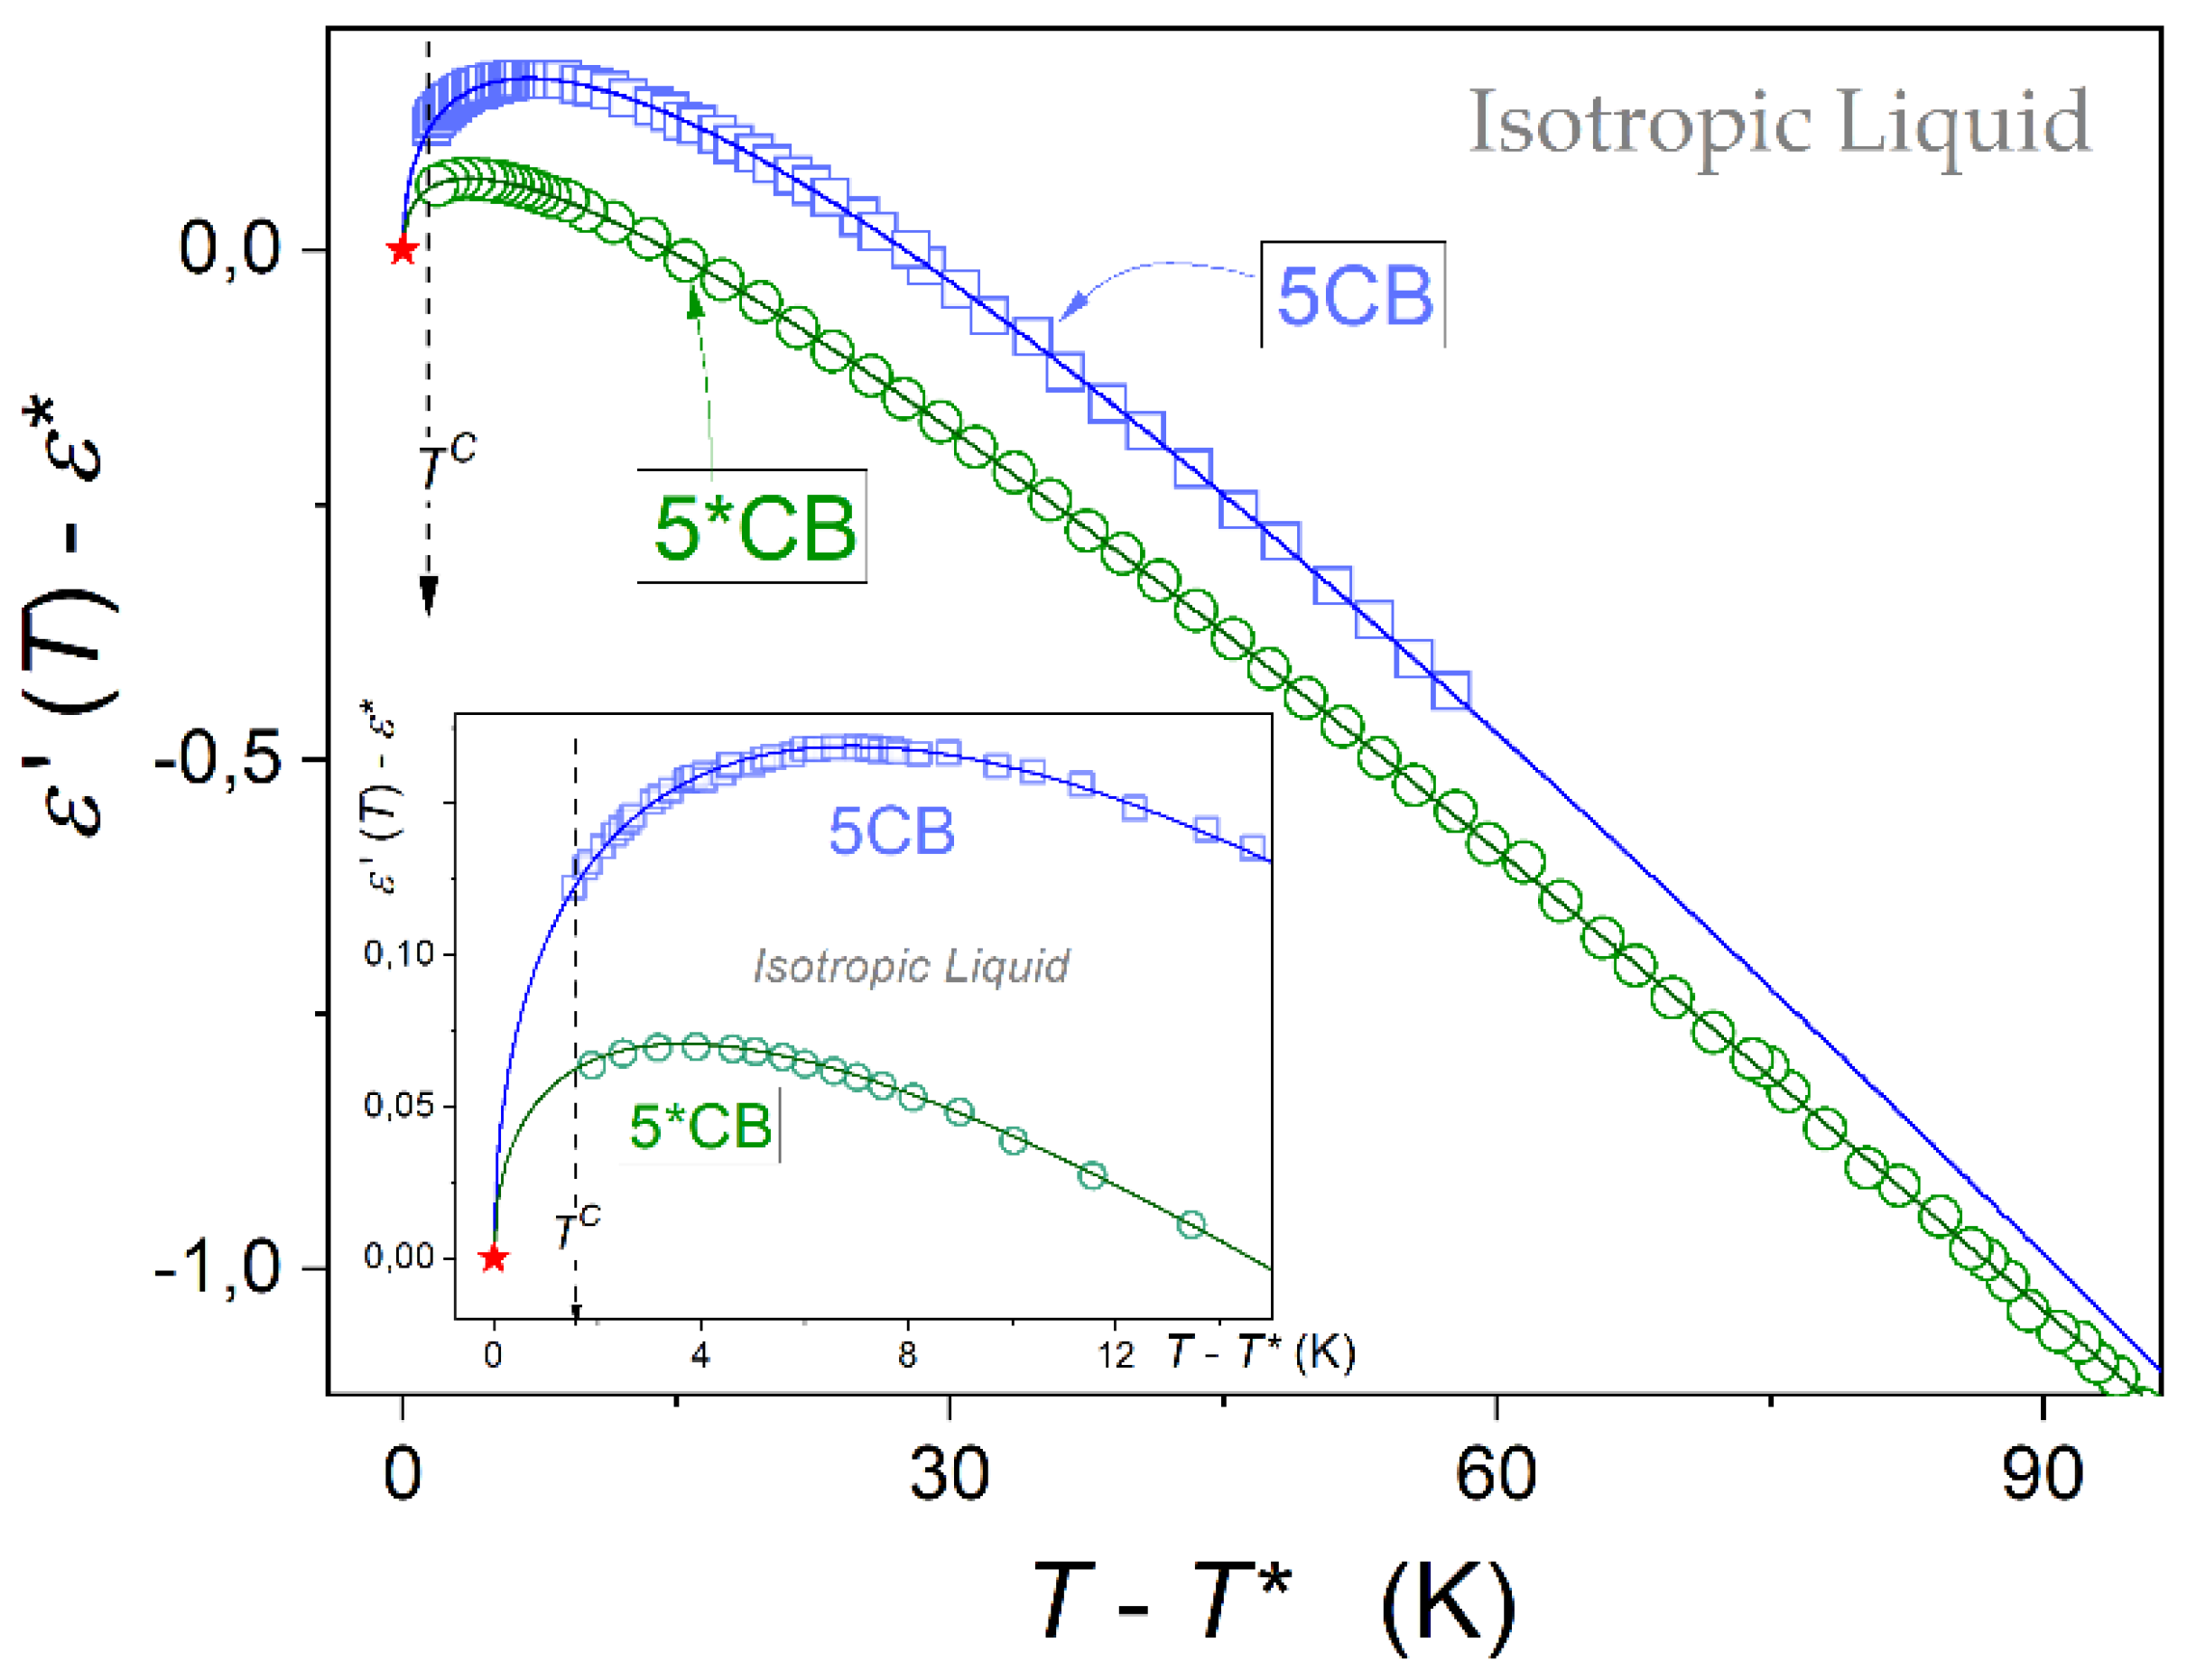
Figure 4 presents changes of dielectric constant in the isotropic liquid phase of 5CB and 5*CB, using the normalizes scales. The plot shows the explicit manifestation of pretransitional effects, namely:
where the clearing temperature
is related to I-N transition for 5CB and I-N* for 5*CB.
Such pretransitional behaviour is particularly evident in the inset in
Figure 5, for the focused behaviour in the close vicinity of
. The curves portraying pretransitional changes are related to the following relation [
52,
53,
54,
55,
56,
57,
58,
59,
60]:
where
is for parameters describing the hypothetical continuous phase transition, the tested temperatures
; the exponent is related to the one describing the mean-field related heat capacity anomaly, namely:
[
54,
59].
For 5CB and 5*CB dielectric constant tests enable determining the values of the discontinuity metric: both compounds within the limit of the experimental error,
, for both compounds Worth stressing is the range of the extreme range of pretransitional effects and significantly lesser ‘strength of the pretransitional effect for 5*CB in comparison with 5CB. It is reflected by the relation of amplitudes
, as results from data given in
Table 1 and visible in
Figure 4.
There are essential problems of the direct derivation of the relation for directly from the Landau–de Gennes model, and explaining the molecular structure dependence.
To portray
anomaly in the isotropic phase, Drozd-Rzoska [
54,
59] recalled Mistura’s [
74] model-reasoning for precritical changes of dielectric constant in the homogeneous phase above the critical consolute point (CCP) and gas–liquid–critical point (GLCP). Mistura indicated the link to the critical behaviour of the specific heat/heat capacity
[
74]:
where
denotes the critical temperature.
For systems with CCP and GLCP the critical exponent
. It is the value for
(space dimensionality) and
(order parameter dimensionality) universality class [
13,
14,
75]. Mistura model concept [
74] served as the essential reference for Sengers et al. [
76] model analysis, leading to an equation that portrays
changes on approaching CCP and GLCP, solving theoretically the challenge that has existed since 1934 [
77]. The functional form of the model relation derived by Sengers et al. [
76] agrees with Equation (6), although it additionally includes critical corrections-to-scaling terms, important as we move away from the CCP, starting only from
above
[
78,
79]
Drozd-Rzoska [
54,
59] noted that Mistura's model [
74] analysis does not explicitly refers to systems associated with the critical universality class
, but addresses generally a supercritical liquid with the dominant impact of pretransitional, critical, fluctuations. For the isotropic phase of nematogens, prenematic fluctuations are observed, and the critical temperature can be linked to the extrapolated singular temperature, for instance, of a pseudospinodal type [
80]. Drozd-Rzoska further recalled the mean-field character of the isotropic phase, leading to the critical exponent
for the specific heat anomaly. Subsequently, the integration of Equation (7) directly yielded Equation (6), when additionally taking into account the ‘background’ term reflecting linear temperature changes of the non-dipolar polarization component [
54]. Finally, for the mean-field description correction-to-scaling terms, appearing in Sengers et al. [
76] model are inherently absent.
In 1983, Thoen and Menu [
53] carried out high-resolution dielectric constant measurements in the isotropic liquid phase on n-octyl-cyanobiphenyl, a rod-like LC compound with
mesomorphism. They demonstrated a fair portrayal using Equation (6), with the heuristic explanation indicating some informal similarity to the behavior noted in the homogeneous phase as it approaches the critical consolute point. The Drozd-Rzoska model [
54,
59] provides a formal justification for this preliminary result.
2.2. Pretransitional Behaviour of Nonlinear Dielectric Effect
This section presents the essential evidence for the dielectric constant counterpart of a strong electric field - the Nonlinear Dielectric Effect (NDE), defined by Equation (4). The pattern of NDE temperature changes in the isotropic phase of nematogenic LC compounds can be directly derived from the Landau–de Gennes model, similarly to other properties encountered in Equation (3). Recalling the analysis presented in ref. [
81], one obtains:
Consequently, the NDE reciprocal should follow a linear pattern, as indicated in Equation (4). It essentially simplifies the analysis of experimental results.
In the above relation . The coefficient a is related to the second order amplitude in Eq. (2) and it is related to the amplitude of compressibility or alternatively order parameter related susceptibility with ; is the local field related factor reflecting the fact the electric field acting on a molecule within a dielectric material differs from the externally applied one; and are metrics of molecular anisotropies of ‘dielectric constant’ for the hypothetical zero-frequency limit and the applied measurement frequency. This is related to the action of the DC strong electric field and the weak scanning field, respectively. Recalling experimental conditions, values of molecular anisotropies in Eq. (8) should be associated with the real part of dielectric anisotropy determined for frequencies in the static domain for LC samples in the nematic phase perfectly oriented by a strong magnetic field in directions perpendicular and parallel to the scanning electric field. Hence, in the static domain and , i.e., it can cover also frequencies beyond the static domain.
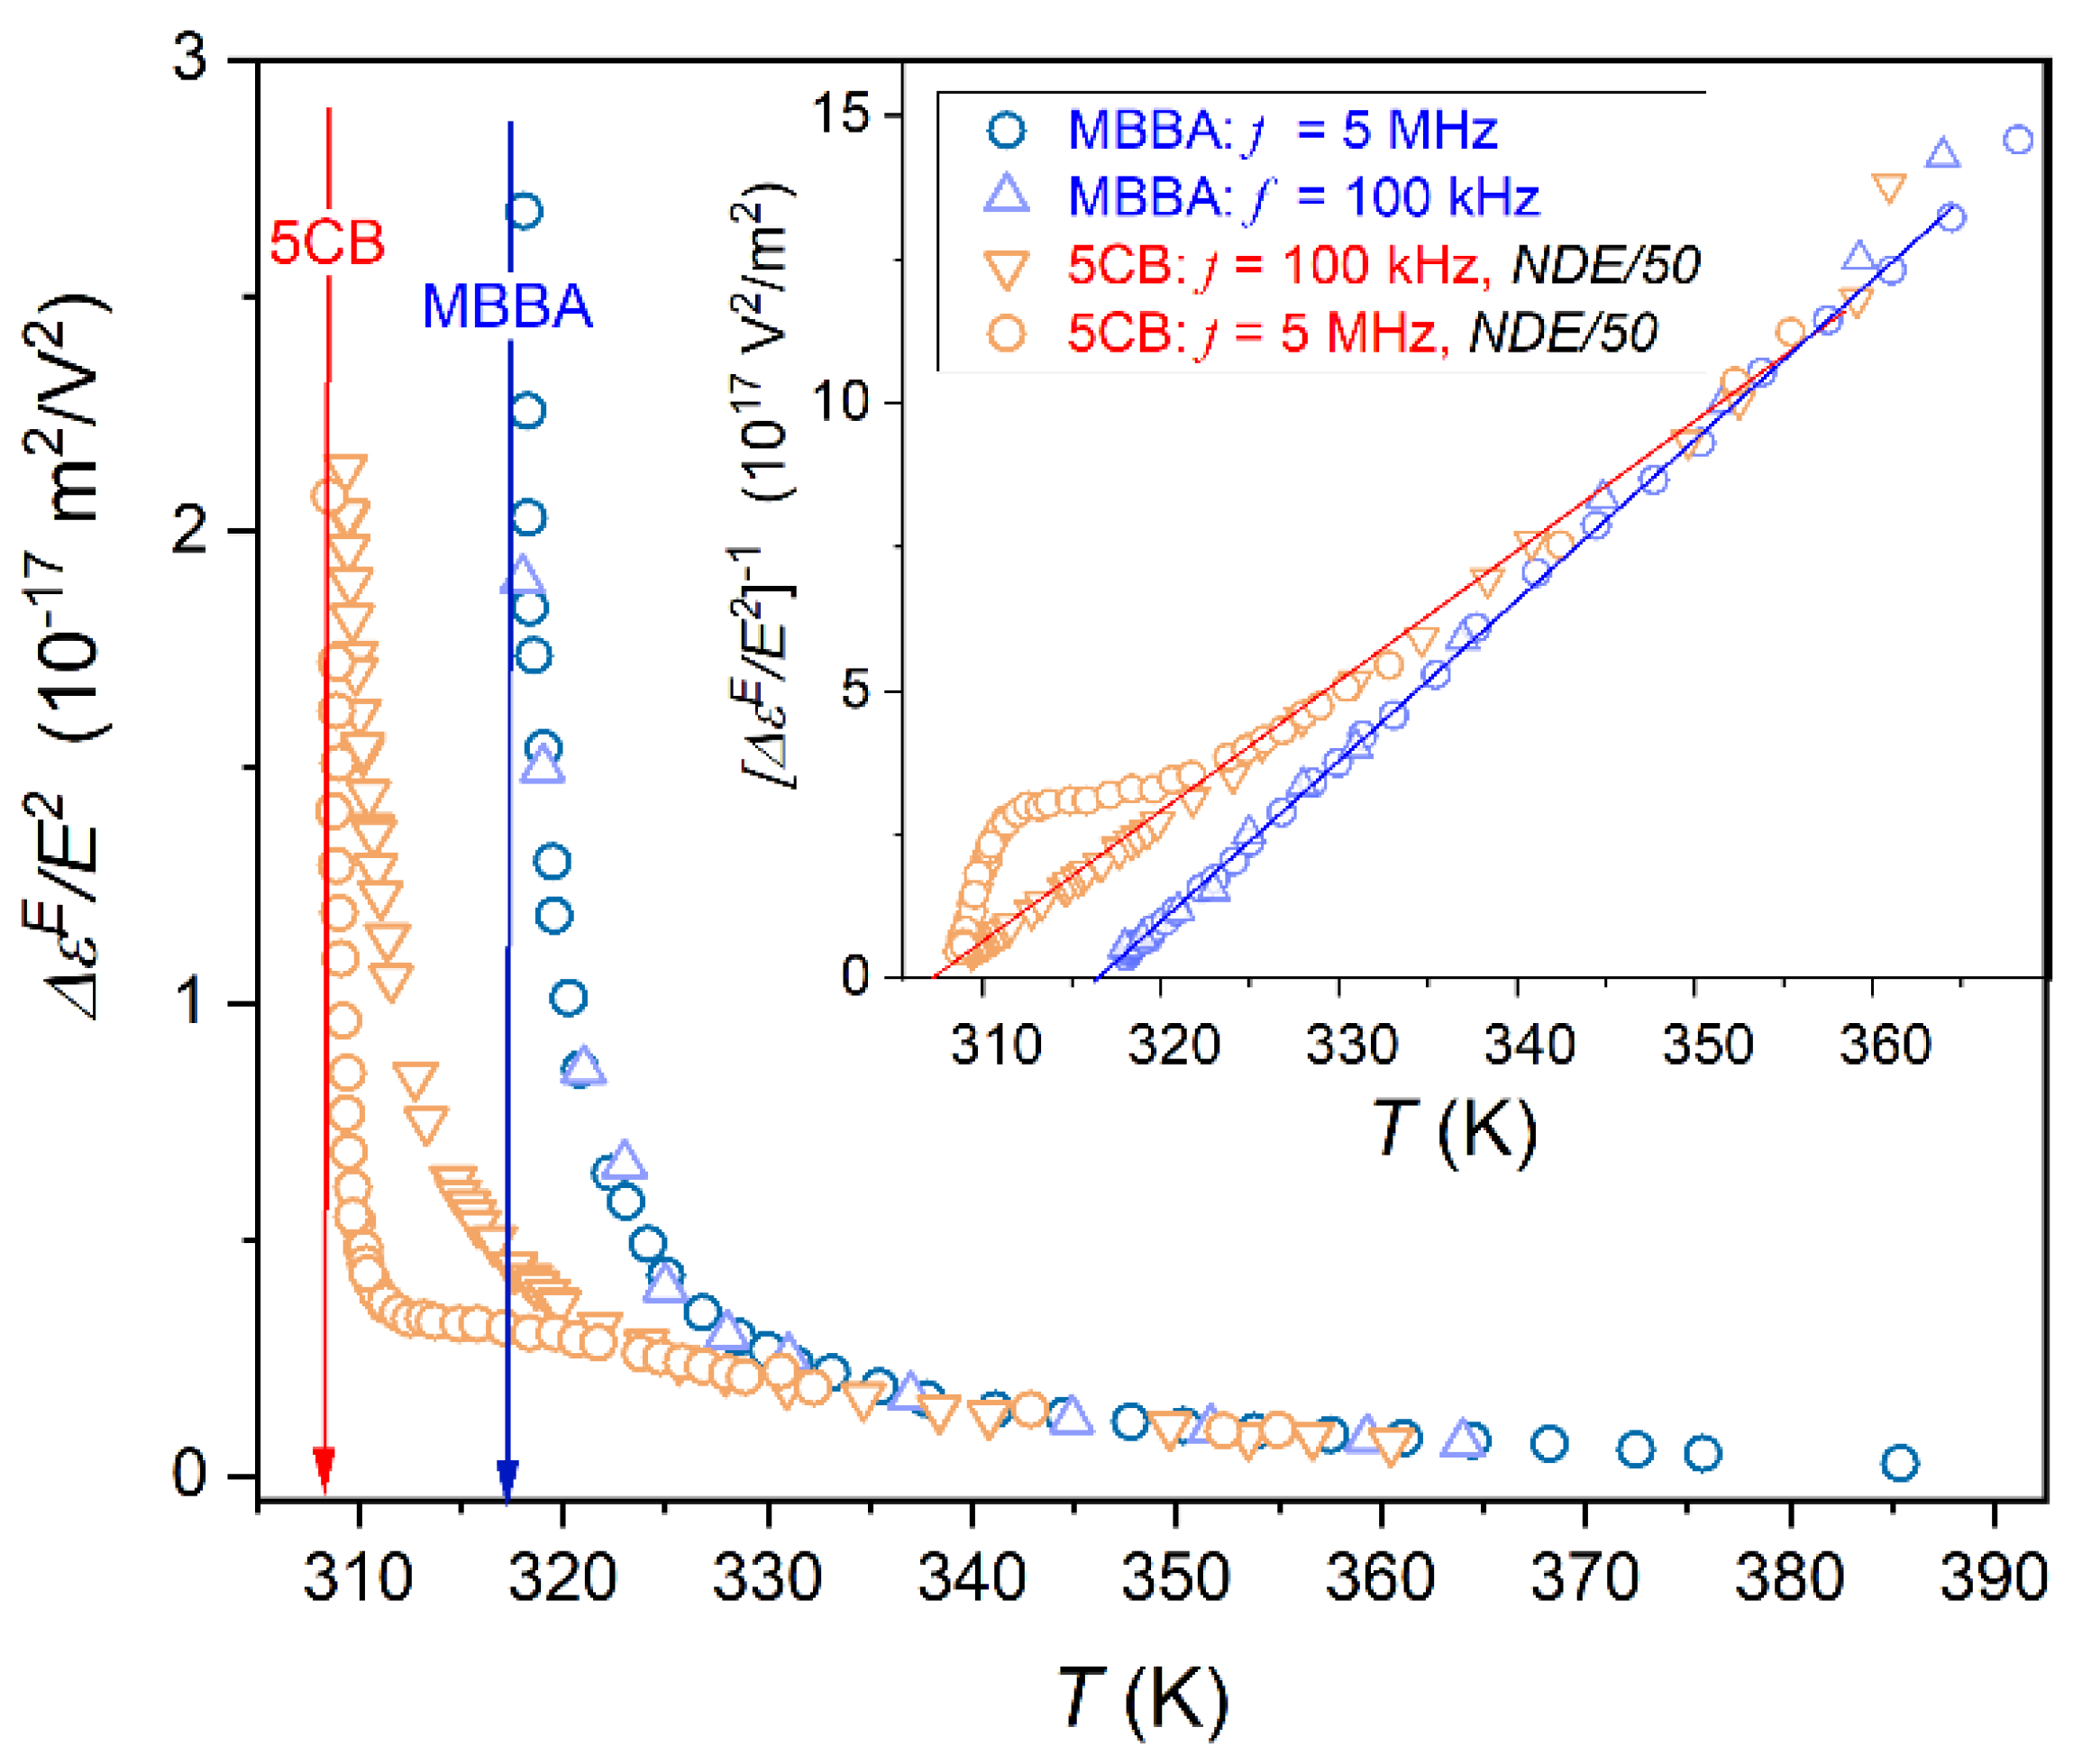
Figure 5 shows NDE pretransitional rise in the isotropic phase of 5CB and MBBA, for two scanning frequencies of the weak electric field. For MBBA, the pretransitional effect is ca. 50x less than for 5CB, it means it is of the order
for MBBA and
for 5CB. This difference does not influence the resolution of registered NDE values. Gor the given apparatus concept one can detect even the lowest possible contribution to NDE from statistical polarization fluctuations in nondipolar liquid, of the order
[
61].
The inset in
Figure 5 is for the reciprocal of NDE changes from the main part of the plot, focused on the visual validation of the LdG model-related temperature pattern (Eqs. (3) and (8)). Notable is the range of such description extending even above
. For MBBA, the shift of the scanning frequency does not influence the phenomenon. However, such an impact significantly manifests in 5CB, for the scanning frequency
. It should be stressed that both frequencies are related to the static domain of dielectric constant, as shown in
Figure 1 for 5CB, and in ref. [
60] for MBBA.
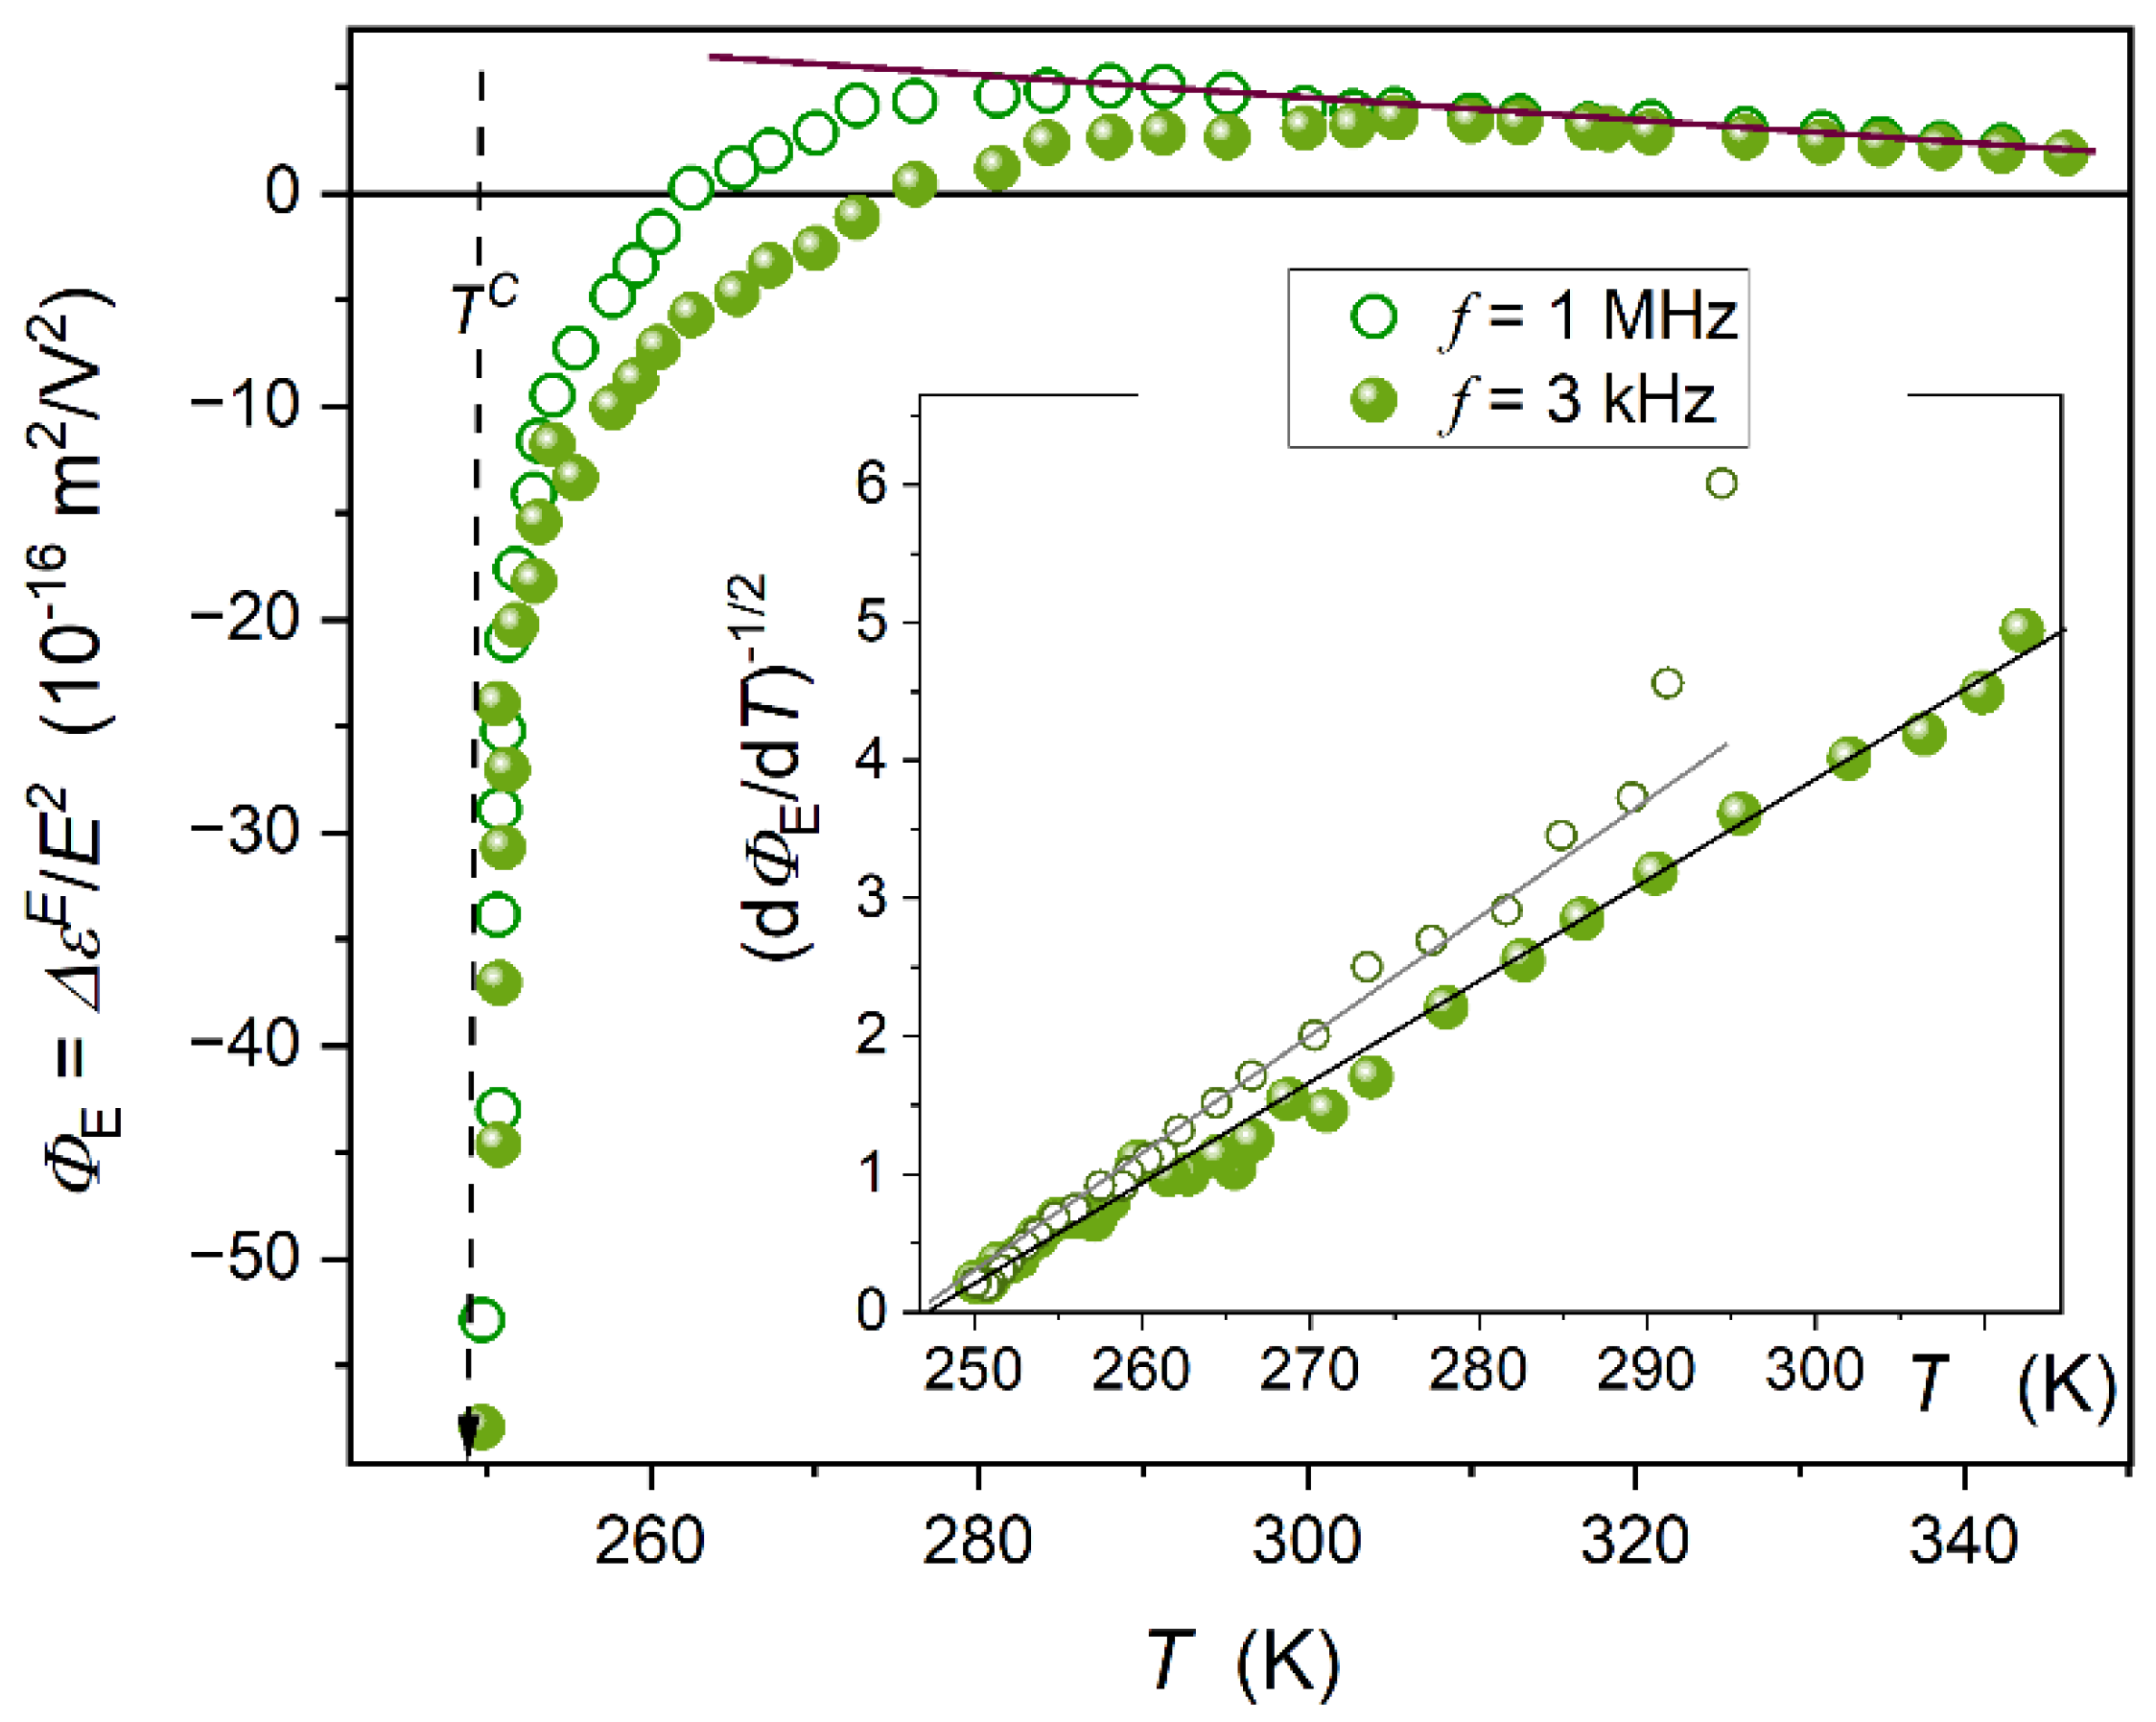
Figure 6 presents the pretransitional behavior in the isotropic liquid phase of glass-forming 5*CB. The striking feature is the anomalous pretransitional effect, which tends toward negative values. The impact of the scanning frequency is also visible. The lower of the tested frequencies corresponds to the static domain of the dielectric constant, as shown in
Figure 2.
Generally, for obtaining the ‘negative’ pretransitional anomaly for NDE within the Landau- de Gennes model opposite signs of anisotropies and are required, in frames of Equation (8). However, it is not possible to obtain these single-molecule-related properties of 5*CB. Nevertheless, the question arises whether the temperature pattern of changes predicted by the LdG model (Eqs. 1 and 8) is met.
The standard way of testing such behaviour is the ‘reciprocal plot’, as the one shown in the inset in
Figure 5. For 5*CB the crossover :
excludes such analysis.
To overcome this problem, the following transformation of experimental data has been carried out:
where constant parameters related to the linear behaviour:
and
.
The inset in
Figure 6 shows results of the experimental data transformation following Equation (9). The fair linear behaviour validates the means-field type evolution
.
As for the behaviour well remote from the clearing temperature, one may expect that the influence of pretransitional fluctuation diminishes. The form of the temperature evolution in this domain, stressed by the brown line, allows us to recall the classic Piekara model for liquid molecular liquids with the tendency to pair dipole-dipole coupling [
61,
82]:
where
is for the number of permanent dipole moment in a unit volume,
denotes the permanent dipole moment metric,
is the Boltzmann factor and
denotes the Piekara’s factor describing the possible dipole-dipole coupling – for the antiparallel arrangement
;
is the local electric field factor.
Originally, Equation (8) was introduced to explain the positive NDE value in nitrobenzene, with the explicit antiparallel dipole-dipole local arrangements [
61,
82].
3. Discussion
This section addresses the experimental challenges presented in questions Q1–Q6, with a particular emphasis on the experimental results discussed above. Subsection 4.1 provides some cognitive background comments, recalling the Physics of Critical Phenomena, which are significant for the isotropic phase of rod-like nematogenic liquid crystalline materials.
3.1. Critical Fluctuations and Mean-Field Behaviour
The Isotropic – Nematic transition in rod-like molecular systems exhibits unique features of an experimental model system, i.e., a system that can be relatively simply mirrored by a conceptual/theoretical model, offering exceptional
cognitive feedback analysis [
4,
14,
18,
19,
20,
64,
65,
66,
67,
68,
69].
For this path, of particular importance is the molecular field interaction model for uniaxial rods proposed by Onsager in 1946 [
83], later developed by Flory [
84] and followers [
85,
86,
87,
88], also implemented for elongated ellipsoids. These theoretical studies, later supplemented by simulations, showed that a specific I-N solidification process is associated only with uniaxial orientation, i.e., a single element of symmetry, freezing. The discontinuous character, with step changes in relevant physical properties, can be considered a generic feature of such systems, as indicated already by Onsager [
83].
It is the generic discontinuous character of the I-N transition in rod-like LC systems.
However, a question arises as to why this discontinuity is so small, as pointed out by de Gennes in his Q2 question. It seems that a simple heuristic answer might be the 'freezing' limited to only one element of symmetry. Two further essential experimental facts should also be considered: (i) the extremely long-range pretransitional effects, which are generally absent for standard discontinuous melting/freezing transitions (ii) the mean-field nature of these pretransitional effects.
Regarding the first issue, for weakly discontinuous phase transitions, the nature of the phenomenon often causes it to be associated with a critical-like anomaly 'hidden' just below the transition. An example is pseudospinodal behaviour in the close surrounding of a critical point [
80]. Such a ‘pseudospinodal’ picture can resemble the behaviour observed for the I-N phase transition [
89,
90,
91].
Generally, pretransitional effects are caused by the appearance of multimolecular pretransitional fluctuations, which exhibit locally features of the next, approaching phase. For the given case, they are prenematic fluctuations. The size (correlation length,
) and lifetime (
) of pretransitional fluctuations critically increase on approaching the singular temperature, critical
or the pseudospinodal
temperatures [
14,
75]:
where
GLC and CCP case the exponent
, and the dynamic exponent
for the conserved and
for the non-conserved order parameter. For the I-N transition, assuming
:
and
[
14,
75]
Notable, that values of critical exponents are described by the space
and order parameter
dimensionalities. Hence, all near-critical systems can be arranged in (
universality classes [
75]. Remote from the critical/singular temperature, the correlation length of critical fluctuations reduces to as few as two, or even fewer, molecules. It is matched with their extremely short lifetime. Consequently, the impact of standard intermolecular interactions may become dominant again. This crossover is described by the Ginzburg criterion [
75,
92]. It is also the boundary between the non-classical description characteristic of GLC and CCP, and the ‘classic’ mean-field type. However, pretransitional fluctuations remain relevant because the system's properties are still described in relation to the critical/singular point. It is often emphasized that in the classic domain, the long-range intermolecular interactions, in comparison to critical fluctuations, cause the influence of the latter to be averaged out [
75]. However, there are systems where a mean-field description occurs despite the presence of large, multi-element pretransitional fluctuations. Ferroelectrics in the paraelectric phase are a canonical example. They are associated with long-range Coulomb interactions, as well as a dominance of uniaxiality, which also appears to be essentially important [
93].
In practice, the 'infinite' range of interactions means the possibility of interacting with a larger number of molecules (or species) than is possible via a direct, 'geometric' environment of the same type of molecules. This can be achieved by a sufficiently high effective dimension of space. For a single, isolated critical point, this is
. For this basic mean-field case, a universal description emerges for any system, regardless of its microscopic features. It is expressed by critical exponents: for compressibility
, correlation length
, and order parameter
. For the specific heat (heat capacity)
in the low temperature phase (below
) and
(no anomaly) in the high temperature phase [
14,
75].
Another type of mean-field behavior and pretransitional effect appears in the vicinity of the tricritical point (TCP) where it intersects three lines of critical points. In some systems, a simplified symmetric TCP form appears via a smooth crossover from the line of discontinuous to the line of continuous phase transitions [
70,
71]. It was noted for some magnetic systems or phase transitions associated with the superfluid behaviour [
71,
72]. For TCP, the border dimensionality reduces to
, and pretransitional effect are coupled to following values of exponents:
,
,
and
both above and below the TCP singular temperature [
75,
94,
95].
3.2. I-N Transition Mean Field Nature
The evidence for universalistic long-range anomalous changes in the Cotton–Mouton effect, Kerr effect, and Rayleigh light scattering, obtained at the turn of the 1960s and 1970s (see Equation (3)) [
22,
23,
25,
30], has became the crucial evidence for the mean-field nature of the I-N transition. The hallmark feature is the exponent
for describing critical changes in compressibility, linked also to other properties recalled in Equation (3). It should be noted that at that time, only Rayleigh light scattering could be explicitly linked to compressibility. The link between the Kerr effect, NDE, and a simple extension to CMEs was demonstrated only in 1993 [
33].
The behaviour of these properties can be phenomenologically described by the basic LdG model formulation, given in Equations (1) and (2). However, it also yields the exponent
in the high temperature phase, which means no anomaly for the specific heat and related properties in the isotropic phase, in explicit disagreement with the experimental evidence for the specific heat [
4,
14,
51,
52] or dielectric constant (see also Results section).
The problem was solved by implementing the more general Landau &Ginzburg model expansion, which takes into account the impact of certain supplementary factors, particularly local density fluctuations [
4,
6,
14,
37]. Nevertheless, these supplementary factors introduce some additional parameters for relations describing pretransitional changes, making the fitting of experimental data tricky.
To reflect the behaviour of collective behaviour expressed by Equation (11), the gradient term for local changes has been included. This is the extended Landau-Ginzburg-de Gennes (L-G-dG) model [
4,
14].
The agreement with the specific heat can also be reached by extending the Landau–de Gennes expansion up to the term proportional to
, which means assuming that the near-tricritical nature of the I-N transition [
4,
14,
38,
39], in fact, the TCP pseudospinodal type behaviour. It naturally yields the required form of the pretransitional anomaly for the specific.
The discussion regarding the basic mean-field vs. TCP-type origin of the I-N transition has a long history [
4,
14,
38,
39,
96,
97,
98,
99,
100], and only unambiguous experimental results can be decisive. Essential can be ultimate estimation of the order parameter exponent value in the nematic phase, since
for TCP and:
for the basic mean field [
36,
73]. However, matching experimental data, often based on refractive index or dielectric constant measurements, appears to be a challenging task due to he discontinuity of the phase transition, i.e.. experimental data are available only well beyond the singular temperature. These biasing factors can be minimized by the linearized, distortion-sensitive analysis, which for nematogenic 8OCB, and 5CB yielded
, in agreement with the TCP hypothesis [
52,
59].
Another ultimate test of the ‘TCP hypothesis’ can be the experimental demonstration of the mentioned above crossover from a discontinuous phase transition line to a continuous phase transition line. Several experimental studies suggest that achieving such behavior for the I-N transition can be achieved under a sufficiently strong external electric field.
The authors of this report have extensive experience in NDE and electro-optic Kerr effect studies, which are inherently associated with strong electric fields. In our opinion. The results reported so far are ambiguous. First, these they involve electric fields up to
[
14,
96,
97,
98,
99,
100]. Such extreme electric fields can introduce numerous parasitic impacts, e.g., related to electrical conductivity and local heating. Second, doubt is related to the visible "stretching" of the I-N transition in the range of even 1-2K, rather than the strong reduction in the discontinuity metric.
For the authors, another factor can be decisive: the length of the rod-like molecule, i.e., the primary structural factor. This may be indicated by the variability of the discontinuity value
in the homologous series of n-cyanobiphenyls to which 5CB belongs: from ~10K for 14CB to ~0.7K for 4CB, as shown in the
Appendix A. The rising length of rod-like molecules, matched with the rising ability to undergo a uniaxial ordering, can be a decisive parameter defining the reduction of discontinuity, and a continuous transition can appear below some minimal molecular length. This interpretation supports the recently obtained continuous, within the experimental error limit, phase transition at pressure approach to the I-N transition in 5CB with a small addition of paraelectric BaTiO
3 nanoparticles.
In the temperature tests for a given LC compound, only one point from such a defined ‘near-TCP line is empirically available. For 5CB, it is associated with discontinuity.
3.3. Discontinuity of the I-N Transition
De Gennes question (
Q2) indicates the unique ‘weakness’ of the I-N transition which reflects small values of
, which can be precisely determined using properties encountered in Equation (3). This issue was partially discussed at the end of the last subsection. A notable commentary to de Gennes's concern may be the qualitatively large model estimates of the discontinuity metric. For the basic LdG model, it is
, and for the alternative Maier-Saupe model, it is even
[
4,
37,
38,
39]. Approximate agreement with experiment was obtained by Mukherjee in 1998 [
39], assuming the TCP character of the I-N transition.
The discontinuity metric
value is considered a significant experimental checkpoint for theoretical models. It is also a recognized 'material' characteristic of LC materials. However, it is rarely noted that this meaning of
has some limitations. In nematogenic LC materials, the discontinuity value strongly increases with compressing, for example, in 5CB it can reach ~7K at a relatively moderate pressure of
[
59]. As indicated in refs. [
59,
101,
102], at least in the homologous series nCB, pressure changes lead to the appearance of the Isotropic – Nematic – Smectic A triple point associated with the only
value specific value for a given material.
3.4. Dielectric Constant: Model Explanation
In the Results section, Drozd-Rzoska model analysis was presented to describe the pretransitional behavior of dielectric constant in the isotropic phase [
54,
59]. It employed Mistura's (1974) [
74] and Sengers et al.'s (1980) [
76] concepts, developed to explain the critical anomaly of the dielectric constant as one approaches the critical consolute point (CCP) in mixtures of limited miscibility.
However, one can also consider the application of the droplet model introduced by Oxtoby for the approximate description of critical effects in liquids (1977) [
103,
104], and next implemented to describe anomalies in dielectric properties, namely dielectric constant, Kerr effect, and NDE in critical binary mixtures (1979)
. It led to the following relation of dielectric constant excess change on approaching CCP [
104]
:
The Oxtoby model [
103,
104] considers exclusively the excess value of the dielectric constant, a, in the system, which arises due to precritical fluctuations approximated as droplets with a radius that changes as the correlation length in Equation (11). Hence, it can also be directly implemented in the isotropic nematic phase if system-specific features are taken into account. It includes elements of the inherent uniaxial anisotropy, specific to the next nematic phase, semi-continuous and mean-field type nature. Following the above reasoning, Equation (12) directly transforms into the isotropic phase-related Equation (6)
The characteristic feature of continuous/critical phase transition is the appearance of pretransitional fluctuations with features of the next, approaching phase. For the isotropic phase of nematogens, it is related to prenematic fluctuations. They have to show the basic feature of the nematic phase, i.e., the uniaxial ordering, whose dominant direction is indicated by the director. It is significant that directors
and
, indicating the dominant uniaxial ordering, are equivalent [
4]. The latter feature directly leads to the approximate ‘cancellation of contribution from permanent dipole moments, if they are parallel to the long molecular axis. Notable that the cancellation does not require intermolecular dipole-dipole coupling and is purely ‘statistical’. Consequently, the dielectric constant within fluctuations is essentially less than that of the ‘chaotic’ surrounding. A ‘contrast factor’ appears. It yields explicit conditions for the above-considered modelling, which recalls the droplet model background.
The same framework excludes the appearance of the dielectric constant pretransitional effect in the isotropic phase of MBBA, specifically with respect to the transverse permanent dipole moment. In the given case, the ‘cancellation’ of the permanent dipole moment has to be absent. There is no ‘contrast factor’, and therefore no pretransitional anomaly.
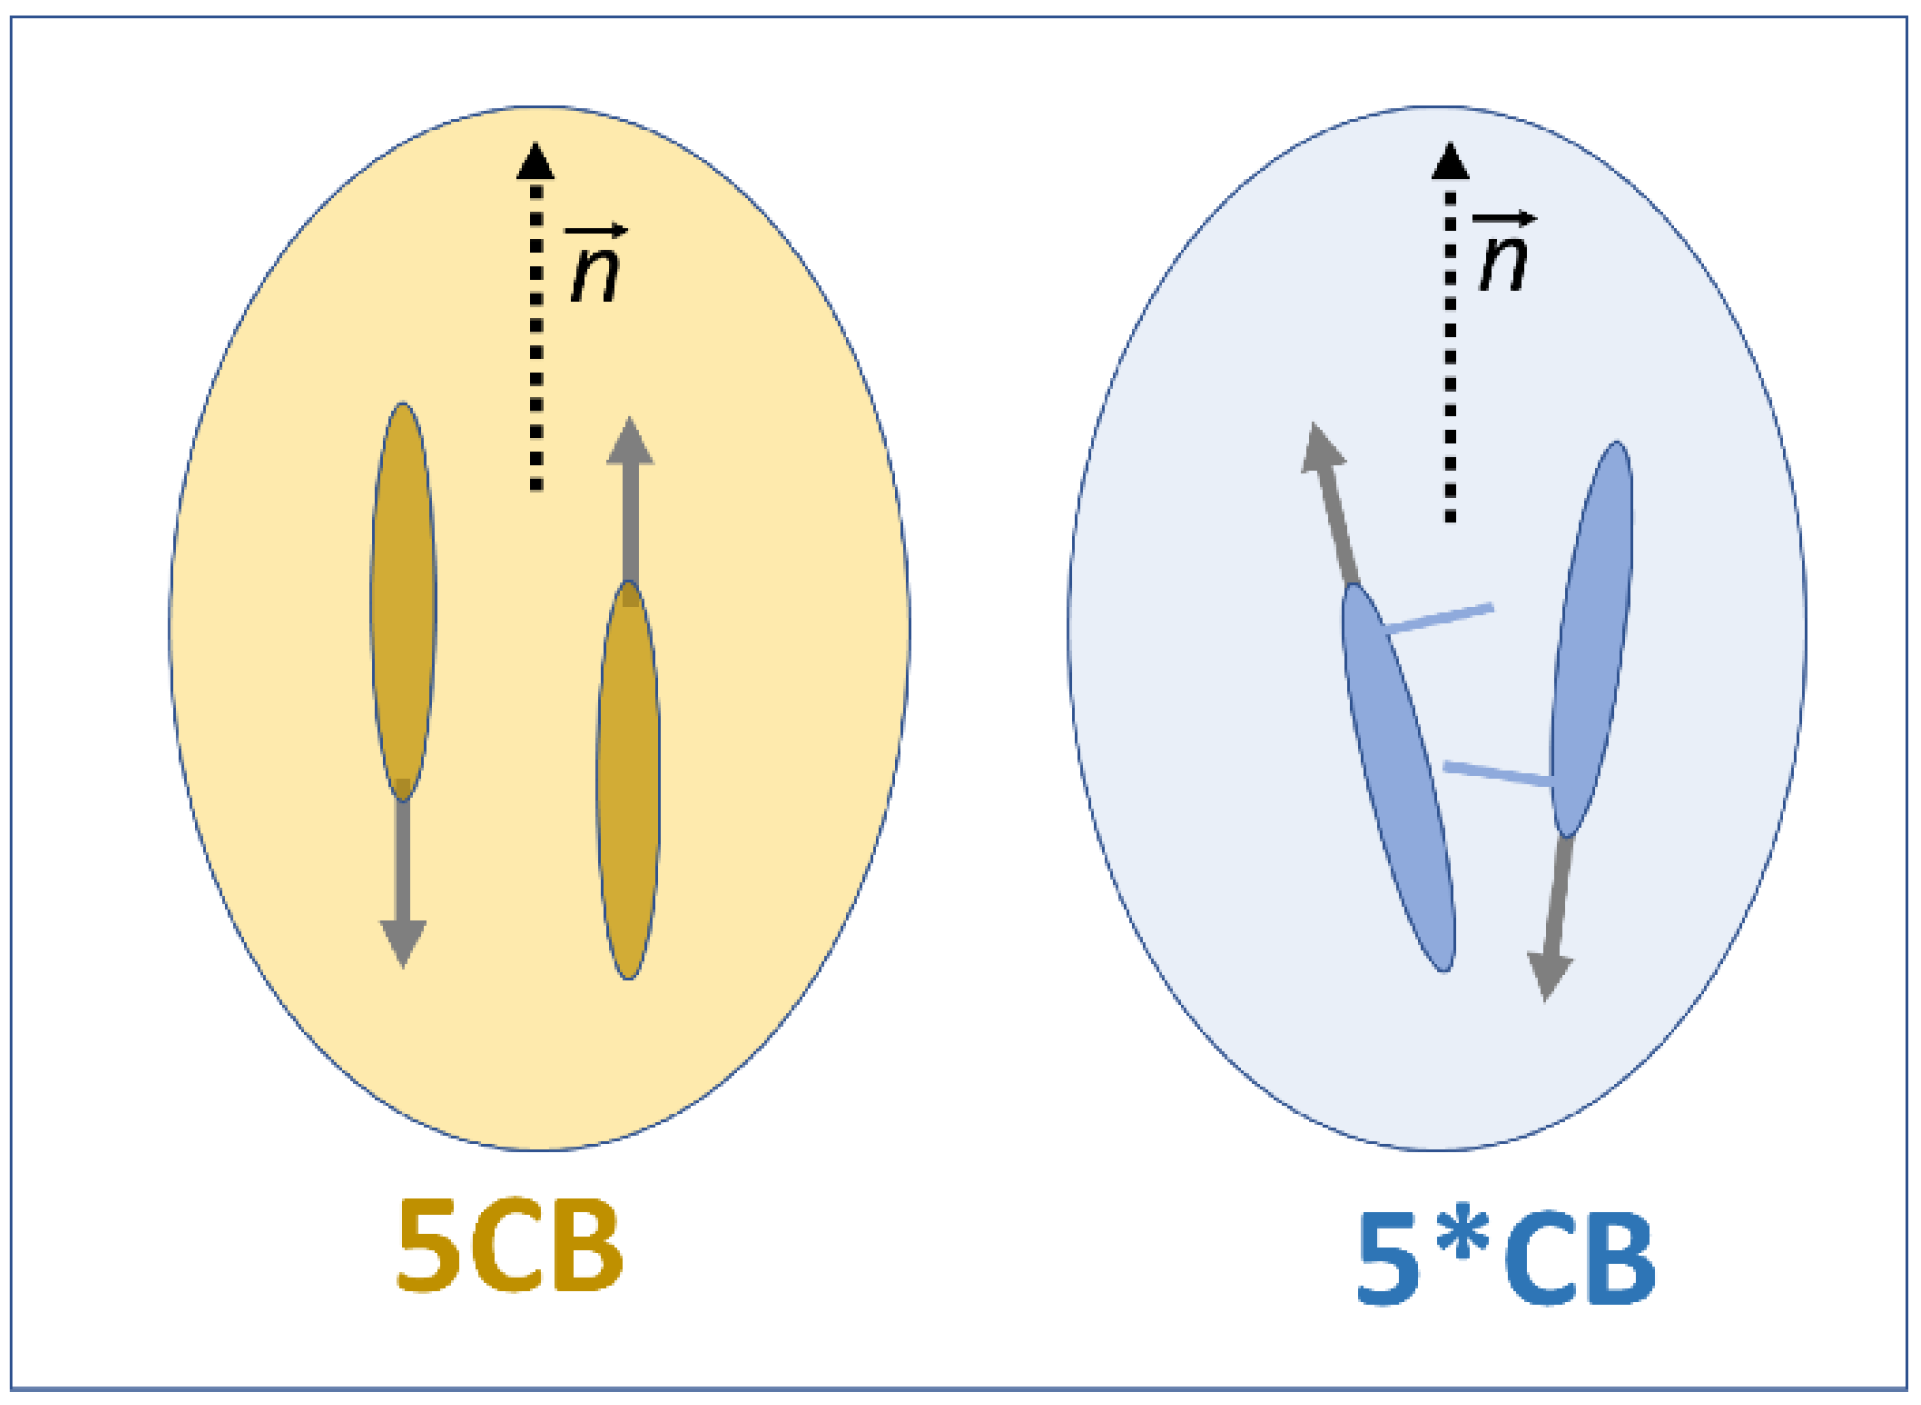
Regarding the significant difference in the manifestation of pretransitional effects between the isotropic phases of 5CB and 5*CB, it is worth noting that they are isomeric compounds, sharing the same permanent dipole moment with respect to the long molecular axis, but showing a slight structural difference, as illustrated in Figures 1 and. For 5*CB a steric hindrance associated with the molecular structure distorts the prenematic arrangement within fluctuations, as illustrated in
Figure 7. For 5CB, the contribution of permanent dipole moments can be almost totally cancelled. For 5*CB, one can see that the decoupling
, and only the parallel component can be subject to prenematic cancellation. Consequently, a non-vanishing transverse component of the permanent dipole moment (
) for the prenematic fluctuations appears. The limited cancellation of the permanent dipole moment leads to a lesser contrast factor in 5*CB than in 5CB. It leads to a lesser manifestation of dielectric constant pretransitional anomaly in 5*CB than in 5C, visible in
Figure 4 and
Table 1.
Dielectric constant scans register the effective changes of this quantity in the total volume of the sample, which in a given specific 'critical colloid' consists of a part occupied by the isotropic part with chaotically arranged molecules and a part occupied by prenematic fluctuations: The volume occupied by the fluctuations increases on cooling which is related to the simultaneous decrease of the part. Contributions to the register value of dielectric constant form volumes and equilibrate when on cooling towards the clearing temperature. This is a case of the indirect detection of critical fluctuations impact.
3.5. Nonlinear Dielectric Effect: Time-Scale Meaning and the Model Explanation
The Kerr effect (KE), the Cotton–Mouton effect (CME), light scattering (LS), and the nonlinear dielectric effect (NDE) are methods that directly register the response from multimolecular fluctuations. NDE introduces the issue of the interplay between the timescale associated with the scanning electric field employed by the method and the relevant system timescale. The latter method directly detects fluctuations and is associated with their lifetime, which critically rises with cooling, as shown in Equation (11). For 5CB it terminates at
, which is ca. 3 decades lesser than the molecular relaxation time
[
59].
KE, CE, LS are method employing light for detecting properties. For the ‘red’ light limit it is related to frequency
and then the scanning time scale
. Hence, for mentioned light-related methods:
, at any temperature in the isotropic liquid phase. NDE detects system’s properties using a radio-frequency weak electric field, in the
range [
40]. It gives the scanning time scale
from ca.
to
. The NDE scanning timescale coincides with the system timescale (
) in the isotropic phase.
Experimental evidence for OKE, EKE, CME, and LS shows the (apparent) agreement with the LdG model (Eq. 3), regarding both the temperature behaviour pattern and the method-related amplitude . For the LdG model, the latter includes significant molecular properties, particularly anisotropies of the refractive index or dielectric constant . Following the discussion in the given report, the detection carried out by OKE, EKE, CME, and LS methods, they ‘observe’ fluctuations as an average from individual molecules constituting the average fluctuation.
The scanning time scale of NDE causes the entire pretransitional (prenematic) fluctuation is ‘observed’. In the particular case of Low Frequency (LF) NDE, it is possible that , and the effective average response of the fluctuation group is recorded.
In 1993, Rzoska [
35] proposed a model for explaining the mystery of NDE and EKE pretransitional effects in the homogeneous phase of critical binary mixtures. It led to the output equation [
35]:
where
is mean of the local ordered parameter fluctuations square and
is order parameter related susceptibility, i.e., the compressibility;
is the physical magnitude related model constant.
In ref. [
36], it was also extended for the supercritical domain above the gas-liquid critical point.
Further, unique conditions yielded by the strong electric field were indicated [
35]:
initially spherical/isotropic critical fluctuations becomes elongated, semi-uniaxial, under the strong electric field, so the correlation length become uniaxial , and additionally shows a ‘mixed criticality: , i.e., it follow the standard for critical mixtures non-classical pattern, and , i.e., it follows the mean field pattern,
significant are different definitions of NDE: , & EKE,,
In ref. [
36], the implementation of the gas–liquid critical point was shown.
The above model can be extended for the isotropic phase above the I-N transition. First, one should consider the substitution in Equation (12). Next, one should take into account that for deriving Equation (3), only the term is taken into account. Further terms in LdG series given by Equations (1) and (2) can be neglected for the methods encountered in Equation (3). It is explained by the phase transition discontinuity. The authors of this report indicate that a strong external electric (or magnetic) field can change the tested system, creating a ‘uniaxial’ semi-critical colloid. Consequently, under such conditions, the system may return to its basic mean-field state.
Consequently, in the isotropic phase, the above relation transforms to the formula:
The mean field character causes the decoupling of the order parameter fluctuations and the temperature behaviour governed by the susceptibility: .
For NDE, local order parameter fluctuations are associated with local dielectric constant fluctuations; for the static domain in a hypothetical zero-frequency limit, which is related to the DC strong electric field inducing the anisotropy (), and for scanning frequency of the weak measuring field testing the average fluctuation (). The DC ‘frequency’ background of causes that it is reduced to a single molecule related anisotropy of dielectric constant. For component one should note that it reflects the fluctuations.
Equation (13) apparently resembles LdG Equation (8). However, the parameters in Equation (13) are related to the ‘whole’ fluctuations, detected via a method relevant to the scanning time scale. For LdG Equation (8), there are explicitly molecular properties.
Following the above, one can consider pretransitional NDE anomalies presented in
Figure 5 and
Figure 6:
For MBBA,
. For , one can consider the uniaxial ordering of rod like molecules with the transverse permanent dipole moment which allows for a free rotation and then the common orientation under strong electric field, yielding for fluctuations
and then
, in agreement with
Figure 5.
For 5*CB,
However, for fluctuations only the component of the permanent dipole moment parallel to the director can be cancelled due to the prenematic arrangement and the significant transverse component of permanent dipole remains (See
Figure 7). It can be freely oriented under the strong leading electric field, leading to
and then
, i.e. the negative pretransitional anomaly, in agreement with results presented in
Figure 6.
For 5CB both
and
, leading
, as evidenced in
Figure 5.
For a sufficiently low scanning frequency, the averaged response from a few fluctuations is detected, thus eliminating the detection of disturbing impacts, such as pre-Smectic arrangements within fluctuations. It can explain the validity of Equation (13) for the I-SmA or I-SmE transition. When increasing the scanning frequency, the impact of permanent weakens, which opens the possibility of testing fluctuations related dynamics via multifrequency NDE measurements.
3.6. Distortions from Landau – de Gennes Model Pattern Close to I-N Transition
A significant and still inconclusive discussion concerns small deviations from the LdG temperature pattern (Equation 3) that occur in the immediate vicinity of the I-N transition for KE, CME, or LS. They are particularly evident when testing reciprocals of the above properties, via a ‘bending down’ from the expected linear behaviour. It is heuristically explained as the influence of undefined 'cybotactic groups' [
4,
14,
24,
25,
26,
27,
30,
32,
105,
106].
For the authors, a possible explanation of this ‘inherent’ distortion is possible when analysing the phenomenon via the model Equation (13). The extreme detection frequency, in comparison with the lifetime of fluctuations, for the mentioned light-related methods, causes the detection of fluctuations to reduce to an apparent average single-molecule-related property. The crucial meaning is related to the molecular anisotropy of the refractive index. However, this is an average value seen over the entire uniaxially ordered prenematic fluctuation. The image of the prenematic fluctuation for 5CB in
Figure 1 is an idealization. In reality, the molecules are slightly disoriented, and the director indicates only the dominant averaged prenematic direction. Uniaxial ordering must improve when approaching the I-N transition, which is also related to the large increase in the number of molecules in the fluctuation. The mentioned methods, in fact, also detect (anisotropic) fluctuations. Therefore, it can be assumed that detection using these methods is essentially related to the nondipolar component of dielectric polarization in the director direction. As
is approached, this component increases due to the improved ordering. The CME, OKE, and EKE amplitudes do not increase compared to the value away from the
. A 'bending down' occurs.
An indirect evidence for this picture could be explained by the anomalous changes in the higher frequency NDE pretransitional effect shown in the inset in
Figure 5.
It can be explained by the joint impacts of the measurement frequency and, first and foremost, the imperfect uniaxial ordering reducing the amplitude
. On cooling towards
a registerable effective transverse component for large enough fluctuations appears, which decreases
, and starts the route towards the negative NDE (as for 5*CB). It is the ‘bending up’ in the inset in
Figure 5. However, on approaching the singular temperature the compressibility critically rises, which under the strong electric field improves uniaxiality. The initial trend diminishes, and the ‘bending down’ in the inset in
Figure 5 appears.
rises towards the value related to the perfect uniaxial arrangements.
4. Materials and Methods
Liquid Crystalline compounds were purchased from Fluka, and times the cycle freezing, vapour removal, melting and heating up to and then freezing were carried out. It degassed samples and removed parasitic contaminations. The mesomorphism of the tested compound is given in the Results section.
Broadband dielectric spectroscopy studies were carried out using a Novocontrol impedance analyzer, for frequencies from to , with the voltage of the measurement (scanning) electric field , which yielded the optimal resolution of measurements. Samples were placed in a flat-parallel capacitor with the gap , which yields for the intensity of the scanning electric field. The capacitor was placed in the Quattro Novocontrol unit for temperature control, enabling stabilization . Temperature was monitored using a Pt100 thermistor, placed within one of the capacitor’s plates.
For the nonlinear dielectric effect (NDE), the single-resonant circuit concept was employed, where a strong electric field pulse is applied to the tested sample, causing a frequency shift. The latter was monitored via a modulation domain analyzer, allowing for frequency versus time scans. The design of the apparatus is given in refs. [
62]. The strong electric field was applied in the form of ‘rectangular’ pulses lasting
, with the voltage changing from
to
. For the applied capacitor it leads to the electric field intensities (
) from
to
. For the weak scanning electric field the intensity
was applied. During experiment the condition related to Equation (4)
was permanently tested and this condition was tested during experiments.
5. Conclusions
The isotropic phase of rod-like nematic compounds is a unique experimental model system that provides a significant reference point for theoretical and simulation analyses in the
Physics of Liquid Crystals and the broader category of
Soft Matter systems. It is also particularly important for
Critical Phenomena Physics, due to the emergence of strong, long-range critical-like pretransitional effects despite the discontinuous nature of the I–N transition. The Landau–de Gennes model (1969/1970) [
22,
23] plays a key role here, as it was inspired by pretransition effects exhibiting the parameterisation shown in Equation (3). Numerous monographs and review reports have validated the Landau–de Gennes model using experimental results related to this equation. However, already in 1974, the model's creator, Pierre-Gilles de Gennes, in his famous monograph, pointed out troubling problems with the LdG model for the I-N transition, which are recalled as questions
Q1 and
Q2 in the Introduction [
1]. Over time, more such issues have emerged and are indicated as questions
Q3 –
Q6 in the Introduction. This report presents the first coherent answer to all these questions. Particular attention is paid to the importance of 'linear' (dielectric constant) and 'nonlinear' (NDE) dielectric studies, where the manifestation of unusual and diverse features of pretransition effects in the isotropic phase is pervasive.
This work demonstrates that a fundamental understanding of various aspects of pretransitional effects, which manifest as apparent deviations from the mean-field description, is possible in the context of
Critical Phenomena Physics. However, it is essential to acknowledge factors such as the role of exceptional prenematic, pretransitional fluctuations, the impact of molecular structure on these fluctuations, and the fundamental importance of specific measurement methods, particularly the introduction of the scanning time scale. This is where the model introduced in refs. [
54,
59] becomes particularly important, as demonstrated by the discussion of Equations (12) and (13). It enables a consistent description of the pretransitional effects, including KE, SL, and NDE, as well as the unusual negative one shown in
Figure 6. It also provides a common interpretation of the pretransitional effects in the isotropic phase of nematogens and in the supercritical domains near the critical consolute and gas-liquid critical points. It answers question
Q1, which particularly troubled de Gennes.
The report shows that it is possible to provide a coherent explanation for questions Q1–Q6, indicating puzzling problems related to the isotropic phase of nematogens.
However, the question arises whether this explanation falls within or beyond the framework of the Landau–de Gennes model?