
Submitted:
09 September 2025
Posted:
11 September 2025
You are already at the latest version
Abstract
This paper investigates how multi-vendor loyalty programs influence customer behavior, specifically within the context of an airline's program and its various partners. It examines cross-buying activities between flying (the core service) and partners across different categories, such as other airlines, car hire, hotels, and less complementary services like credit cards and fuel vendors. Utilizing a generalized additive model (GAM) analysis on data from the Voyager loyalty program, the research tests hypotheses related to the impact of partner category fit, bonus awards, and membership duration on core service usage and cross-buying. The findings reveal complex and varied relationships between partner categories and core service engagement, highlighting that less complementary partners exhibit a strong positive and nearly linear relationship with core service usage. The study also explores the effect of bonus miles and membership duration on customer loyalty and purchasing patterns across the different partner types.
Keywords:
Loyalty Programs (LPs)
; Multi-vendor Loyalty Programs
; Partner Categories
; Membership Duration
; Generalized Additive Model (GAM)
; Customer Retention
; Tier Levels
1. Summary Statement
This research investigates the reinforcing effects within an airline's multi-vendor loyalty program (LP), specifically the Voyager loyalty program, to understand how different partner categories influence customer behavior, core service usage (flying), and cross-buying. Utilizing a Generalized Additive Model (GAM) analysis on seven years of customer data, the study examines the impact of partner category fit, bonus awards/miles, and membership duration on customer engagement.
Key findings reveal complex and varied relationships between partner categories and core service usage, with less complementary partners (e.g., credit cards, fuel vendors) demonstrating a strong positive and nearly linear relationship with core service usage, especially in the South African context where daily fuel purchases lead to consistent mile accumulation. In contrast, airline partners often exhibit a negative effect on the core service due to competitive dynamics, while complementary partners (car hire, hotels) show limited engagement. The study also indicates that bonus awards from airline partners initially correlate positively with usage but can taper off, and higher tier levels generally show a stronger association with core service usage.
While cross-buying activity varies based on partner fit (H1) and core service usage increases with bonus awards (H2) for certain categories, the duration of LP membership was not consistently significant in increasing cross-buying activity, except for less complementary partners after a long tenure (H3). Overall, the research highlights the importance of strategic partner selection and program refinement to optimize LP effectiveness and cultivate enduring customer relationships.
2. Introduction
Customer retention constitutes a central objective within the domain of marketing, necessitating a nuanced understanding of consumer behaviour and preferences (CodeMint, 2016; Rese et al., 2013; Steinhoff & Zondag, 2021). In recent years, organizations have increasingly adopted loyalty programs (LPs) as strategic mechanisms to cultivate and sustain customer loyalty while simultaneously augmenting overall customer expenditure (McKenzie et al., 2020; Saleky et al., 2018; Steinhoff & Zondag, 2021). These programs serve as critical components in business models where customer interactions are typically characterised by one-time purchases, thus complicating efforts to foster repeat patronage. Service-oriented and retail enterprises, in particular, have leveraged LPs to stimulate recurring transactions and, by extension, enhance customer loyalty (Chen et al., 2020; Thamrin et al., 2020).
The essence of customer loyalty lies in the ability to engage consumers and motivate repeat or increased purchases (Chen et al., 2020; Saleky et al., 2018; Wilson, 2021). However, the capacity of LPs to deliver value that extends beyond an organisation’s extant value proposition has been increasingly scrutinised (Saleky et al., 2018; Wilson, 2021; Yang et al., 2019). Mostafa and Kasamani (2021), Steinhoff and Zondag (2021), and Tuominen et al. (2022) highlight several underlying beliefs that have contributed to the sustained interest of marketing managers in loyalty programs: consumers demonstrate a desire for brand engagement, many exhibit strong brand allegiance, and loyal customers—owing to their higher purchase frequency—constitute a particularly profitable segment. To reinforce loyalty, targeted marketing strategies, such as personalised communication, have been advocated as effective tools to sustain and deepen customer commitment (Dhameeth, 2019; Esmaeilpour, 2015; Rese et al., 2013; Saroha & Diwan, 2017).
Although loyalty programs (LPs) have gained considerable traction in marketing strategies, research has consistently identified challenges to their effectiveness, despite prevailing managerial optimism. Nonetheless, the widespread adoption of LPs continues unabated, driven by the persistent corporate imperative to retain customers and increase market share through innovative mechanisms (Bruneau et al., 2018; Chen et al., 2020; Σταθοπούλου & Balabanis, 2016; Stourm et al., 2020). Early studies on loyalty primarily concentrated on the supplier–customer relationship, with findings indicating that consumers tend to purchase more frequently from suppliers with whom they maintain favourable relationships (Dowling & Uncles, 1997; Richards & Liaukonytė, 2019; Saroha & Diwan, 2017). This insight laid the groundwork for a broader inquiry into the benefits of cultivating customer loyalty, which include reduced service costs, diminished price sensitivity, and increased sales volume and referrals (CodeMint, 2016; Human et al., 2020; Richards & Liaukonytė, 2019). Furthermore, it is generally acknowledged that retaining existing customers is more cost-effective than acquiring new ones (Richards & Liaukonytė, 2019; Saroha & Diwan, 2017).
Effective deployment of loyalty programs necessitates a sophisticated understanding of customer profiles to identify and nurture loyalty among key consumer segments. Such efforts are often more feasible within business-to-business (B2B) environments compared to business-to-consumer (B2C) contexts, owing to the greater availability of structured customer data in B2B markets (Nastasoiu & Vandenbosch, 2018; Rese et al., 2013; Richards & Liaukonytė, 2019; Steinhoff & Zondag, 2021). In these contexts, organisations can harness data analytics to assess customer profitability and lifetime value, although this process is resource-intensive and costlier in consumer-facing sectors. When launching LPs, firms typically articulate strategic objectives centred on improving customer retention, profitability, loyalty, and opportunities for cross-selling (Chen et al., 2020; Dutta & Bhattacharya, 2019; Li et al., 2022; Yang et al., 2019). Empirical evidence suggests that a relatively small proportion of highly loyal customers often contributes disproportionately to overall revenue generation. LPs thus serve not only as instruments for fostering loyalty but also as valuable mechanisms for collecting behavioural data, which can inform marketing decisions and signal emerging competitive threats (Au & Tse, 2021; Saroha & Diwan, 2017).
The influence of LPs on consumer behaviour is typically assessed using a range of performance indicators, including market share, purchase frequency, and the proportion of loyal customers relative to those who engage in multi-brand purchasing (Richards & Liaukonytė, 2019; Steinhoff & Zondag, 2021). Other sources underscore the phenomenon of "polygamous loyalty," wherein most consumers exhibit loyalty to multiple brands, thereby complicating efforts to develop an exclusively loyal customer base (Hadlock et al., 2021; Richards & Liaukonytė, 2019). Factors such as brand availability, category characteristics, and the broader context of brand selection all contribute to this behaviour. Continuous research into the evolving impact of LPs on consumer decision-making remains essential—particularly in dynamic markets where successful innovations are often quickly replicated by competitors (Fernandes & Moreira, 2019; Khairulya, 2018; McKenzie et al., 2020; Saleky et al., 2018; Thamrin et al., 2020; Yang et al., 2019).
This research addresses a critical gap in the literature by examining the reinforcing effects embedded in multi-vendor loyalty programs. Specifically, it investigates the extent to which such effects stimulate broader purchasing behaviour and loyalty across different vendors. The central research question is: How do reinforcing effects differ across various categories of vendors in the Voyager loyalty program?
3. Literature Review
As companies increasingly recognize that competitive advantage often stems from their interactions with consumers (Dawar, 2013), many have implemented loyalty programs (LPs) to foster customer retention and loyalty (Basrowi et al., 2022; Urdea & Constantin, 2021). LPs are defined in various ways. The American Marketing Association describes an LP as "continuity incentive programs offered by a retailer to reward customers and encourage repeat business." Dorotic, Bijmolt, and Verhoef (2012) extend this definition to include manufacturers and other sectors. The term encompasses programs such as reward programs, frequent-shopper programs, loyalty cards, and frequent flyer programs (Breugelmans et al., 2014; Kautsiro & Awolusi, 2020).
4. Drivers Behind Introducing Loyalty Programs
Companies implement LPs to achieve goals such as customer retention, increased sales, and brand building (Alshurideh et al., 2020; Chen et al., 2020). These objectives shape the LP design and typically include fostering loyalty to increase attitudinal and behavioral commitment (Kumar & Reinartz, 2018), building long-term relationships for cross-selling and upselling (Dorotić, 2019; Kumar, 2019), creating ongoing marketing opportunities, and calculating customer lifetime value at an individual level (Siebert et al., 2020).
5. Loyalty Program Design
The structure, rewards, and partnerships within an LP significantly influence its effectiveness. Structural designs commonly include frequency rewards and customer tiers (Kwiatek et al., 2020; Nastasoiu & Vandenbosch, 2019; So et al., 2015). Frequency rewards offer benefits after a certain number of purchases (Nastasoiu & Vandenbosch, 2019), while tier systems allocate rewards based on customer value, motivating tier upgrades or penalizing downgrades (Gandomi & Zolfaghari, 2017; Kumar & Shah, 2004). Research indicates that higher-tier customers are more sensitive to service failures, with downgrades causing more dissatisfaction than upgrades provide positive effects (Chang, 2020; Li, 2020).
Rewards can be direct or indirect, economic or psychological. Direct rewards, such as free products, tend to strengthen brand attitudes. Psychological rewards, such as preferential treatment, enhance attitudinal commitment (Kim & Ahn, 2017). Conversely, economic rewards like discounts can shift focus from the brand to the reward itself, especially among price-sensitive customers (Nastasoiu & Vandenbosch, 2019).
Consumer preferences vary between immediate and delayed rewards, with the latter appealing more to long-term goals in variety-seeking markets (Jalili & Pangburn, 2020; Nastasoiu & Vandenbosch, 2019). The rise of multi-vendor LPs, where companies collaborate to offer shared rewards, has further increased customer engagement and cross-selling opportunities (Bruneau et al., 2018; Chen et al., 2020; Chun et al., 2020).
6. Attaining Membership in Loyalty Programs
The decision to join an LP depends on perceived benefits versus costs (Dorotić et al., 2021; Kwiatek et al., 2020; Nastasoiu & Vandenbosch, 2019; So et al., 2015). Economic benefits attract price-sensitive customers, but their influence wanes over time as long-term commitment factors gain importance (Bruneau et al., 2018; Chen et al., 2020; Dorotić, 2019; Gandomi & Zolfaghari, 2017; So et al., 2015).
Ease of joining also impacts membership. High participation costs, including privacy concerns, deter enrolment (Breugelmans et al., 2014; Keller et al., 2020). Early adopters, often high-income users, show higher engagement and loyalty, frequently recruiting others through word-of-mouth (Bruneau et al., 2018; Chen et al., 2020; Ieva & Ziliani, 2017; Kwiatek et al., 2020; Stourm et al., 2020).
7. Loyalty Program Quality
LPs yield modest but positive changes in customer behavior, such as increased purchase frequency and share of wallet (Nastasoiu & Vandenbosch, 2019; Stourm et al., 2020). LPs are particularly effective in competitive markets, where they create economic and psychological switching costs (Belli et al., 2022; Dorotić et al., 2021; Tulabandhula et al., 2021).
The quality of LPs influences customer satisfaction and loyalty. Issues such as qualification barriers and difficulty claiming rewards negatively affect customer experiences (Breugelmans et al., 2014; Chen et al., 2020; Kumar, 2019; Kumar & Reinartz, 2018). Personalization of rewards and communication enhances perceived LP quality, leading to higher customer commitment (Yang et al., 2019).
Research highlights that cross-buying tendencies vary among customers in multi-partner LPs. Some customers focus on core services, while others engage with partner brands, demonstrating a synergistic loyalty effect (Bariha, 2021).
8. Customer Retention and Cross-Buying
Cross-buying often strengthens loyalty but may plateau as customer engagement diminishes over time (Breugelmans et al., 2014; Bruneau et al., 2018). Alignment between LP benefits and customer goals sustains long-term engagement and loyalty (Dorotić, 2019; So et al., 2015; Yang et al., 2019).
Cross-buying tends to increase when the benefits offered by a loyalty program (LP) align with customers' long-term personal goals and values. Rewards perceived as valuable, relevant, and achievable motivate customers to engage with the LP and its partner brands (Kim & Ahn, 2017; So et al., 2015; Yang et al., 2019). The alignment between customers' individual needs, preferences, and aspirations and the LP's offerings is crucial for sustaining long-term loyalty and cross-buying behavior (Belli et al., 2021; Dorotić, 2019; So et al., 2015; Stourm et al., 2020). Customers are more likely to remain engaged with an LP when its rewards resonate with their personal objectives and lifestyles. This synergistic relationship between customers' circumstances and the LP's value proposition drives sustained cross-buying activity (Chen et al., 2020; Dorotić et al., 2021; So et al., 2015; Stourm et al., 2020).
LPs are powerful tools for fostering customer loyalty and driving cross-buying behavior. Well-designed programs that offer valuable rewards, build lasting relationships, and reduce switching costs significantly influence customer behavior, leading to higher sales and retention. However, the long-term success of LPs depends on their adaptability to evolving customer expectations and market conditions. This review highlights how LPs, through strategic design, quality, and partnerships, influence customer behavior and loyalty. The hypotheses derived from this review are:
- H1: Cross-buying activity varies based on the fit between the core service and LP partners.
- H2: Core service usage (flying) increases as bonus awards among the participating vendors increases.
- H3: Cross-buying activity increases with the duration of LP membership.
These hypotheses provide a framework for assessing the effectiveness of a multi-vendor LP. For this case study this effectiveness is measured by the amount of cross-buying amongst the LP partners.
9. Methodology
This study employs both quantitative and qualitative methods and focuses on the Voyager loyalty program and its partners as a case study. A generalized additive model (GAM) statistical analysis is applied to identify and examine cross-buying effects; this method provides a detailed view of the nature and complexity of the relationships between the dependent and the explanatory variables and does not assume or force the existence of a linear relationship where such a relationship may not be sufficiently strong to warrant using linear regression.
10. Research Design
The analysis investigates cross-buying activities between the core product (flying) and partner categories, classified into four distinct groups (Evanschitzky et al., 2017). This research further analyses the impact of bonus miles awards amongst and within partners.

Table 1.
Partner categories.
|
Airlines in Star Alliance partnership CBUY (A) |
Airlines outside Star Alliance partnership CBUY (B) |
Complementary partners (Car hire, hotel) CBUY (C) |
Less complementary partners (Credit card) CBUY (D) |
|
|
|
|
Table 1. Categories of the Voyager LP partners.
The model investigates activity within a category represented by the most popular partners within that category.
Figure 1.
Model.
11. Sample and Population
Data was sourced from the Voyager loyalty program database, encompassing passenger miles data spanning seven years. A random sample of 850 active program members, defined as those accumulating miles across all partner categories, was selected to focus on engaged participants (Bruneau et al., 2018; George & Wakefield, 2017; Voorhees et al., 2014). Records with zero miles in any category were excluded to maintain data accuracy. After cleaning the data and combining duplicate records the final dataset used for the analysis is 610.
12. Data Analysis
Data was analysed using R. The data is annual base and bonus miles for each Voyager member aggregated over a period of seven years, and it was transformed using a cubic root function to balance the scale across the variables. Descriptive statistics following the cubic root transformation show that the bonus miles data for three of the four partners categories are still heavily skewed; median = minimum = 0, such as for more than half the observations, the miles and or/ the bonus miles are zeros.
The Generalised Additive Model approach to test the effects of cross buying on the core service was adopted. The same approach was deployed to test the effects of bonus miles awards on the core service. The parametric coefficients pertaining to the categorical variables (tier levels) are back- transformed to original data by cubing. The error terms are back- transformed using the delta method estimation.
To test the effects of the LP membership duration on cross buying, an ordinal regression analysis was used.
13. Results
Hypothesis 1: Cross-buying activity varies based on the fit between the core service and LP partners.
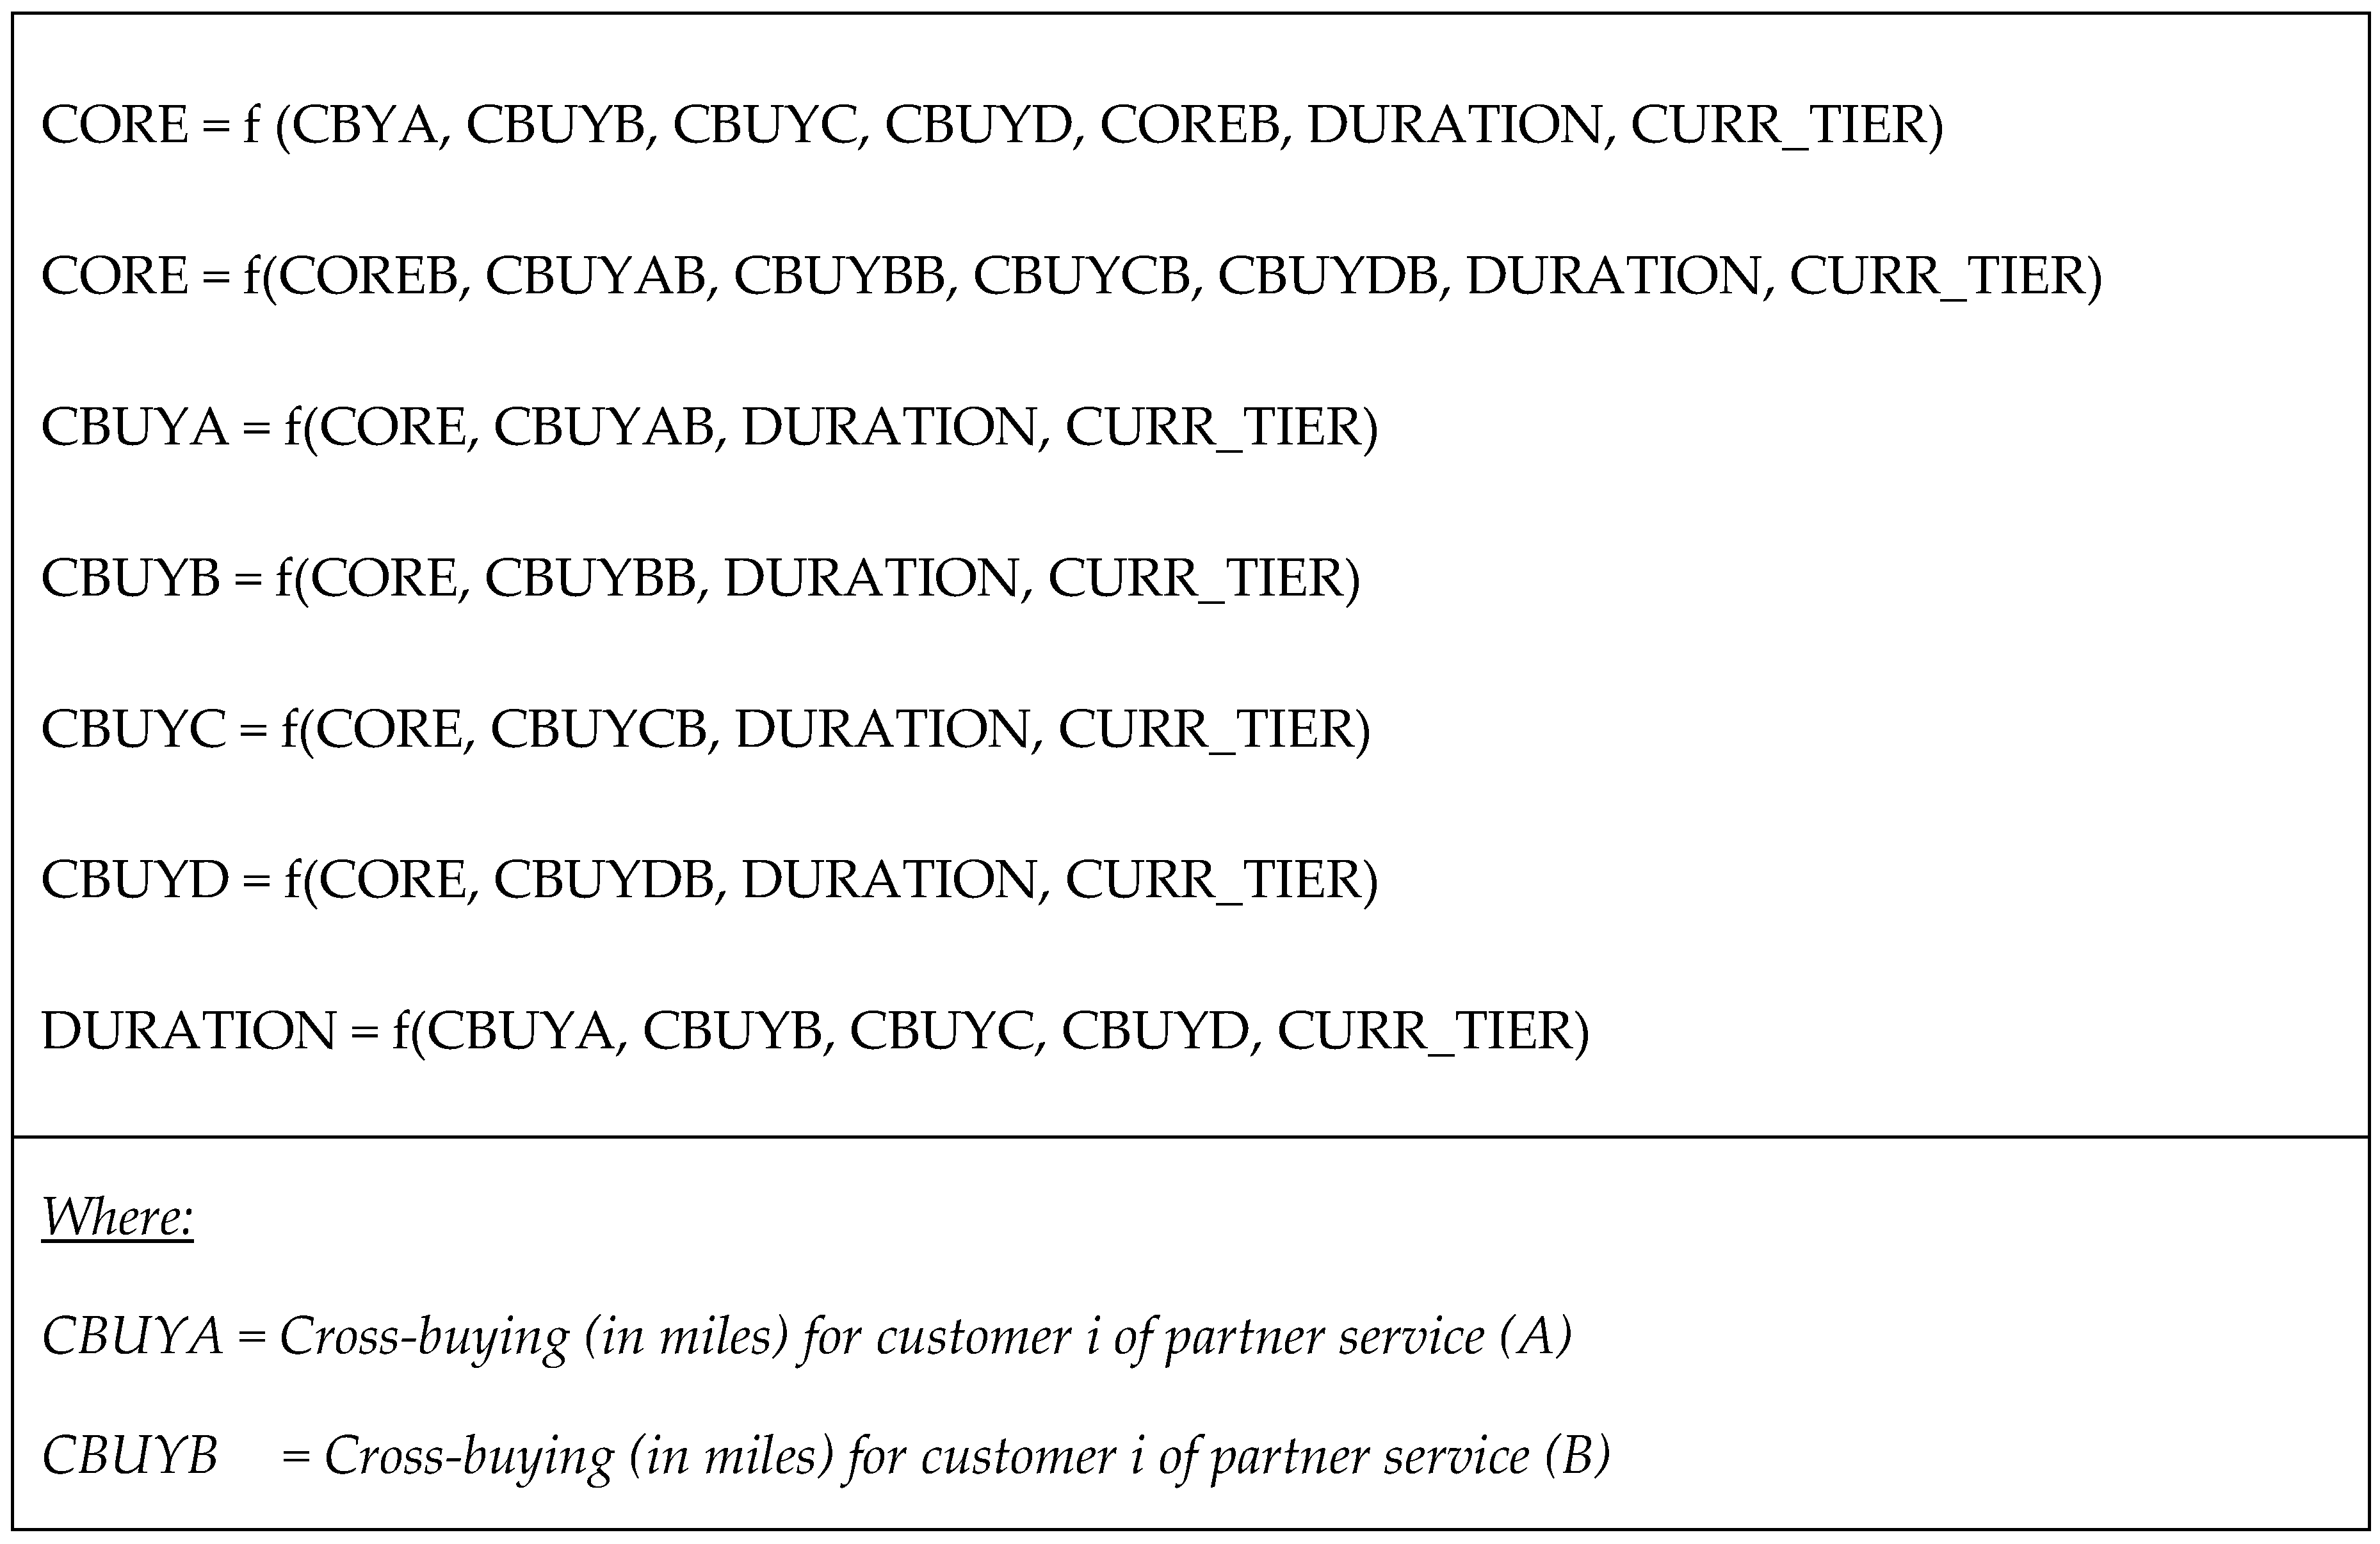
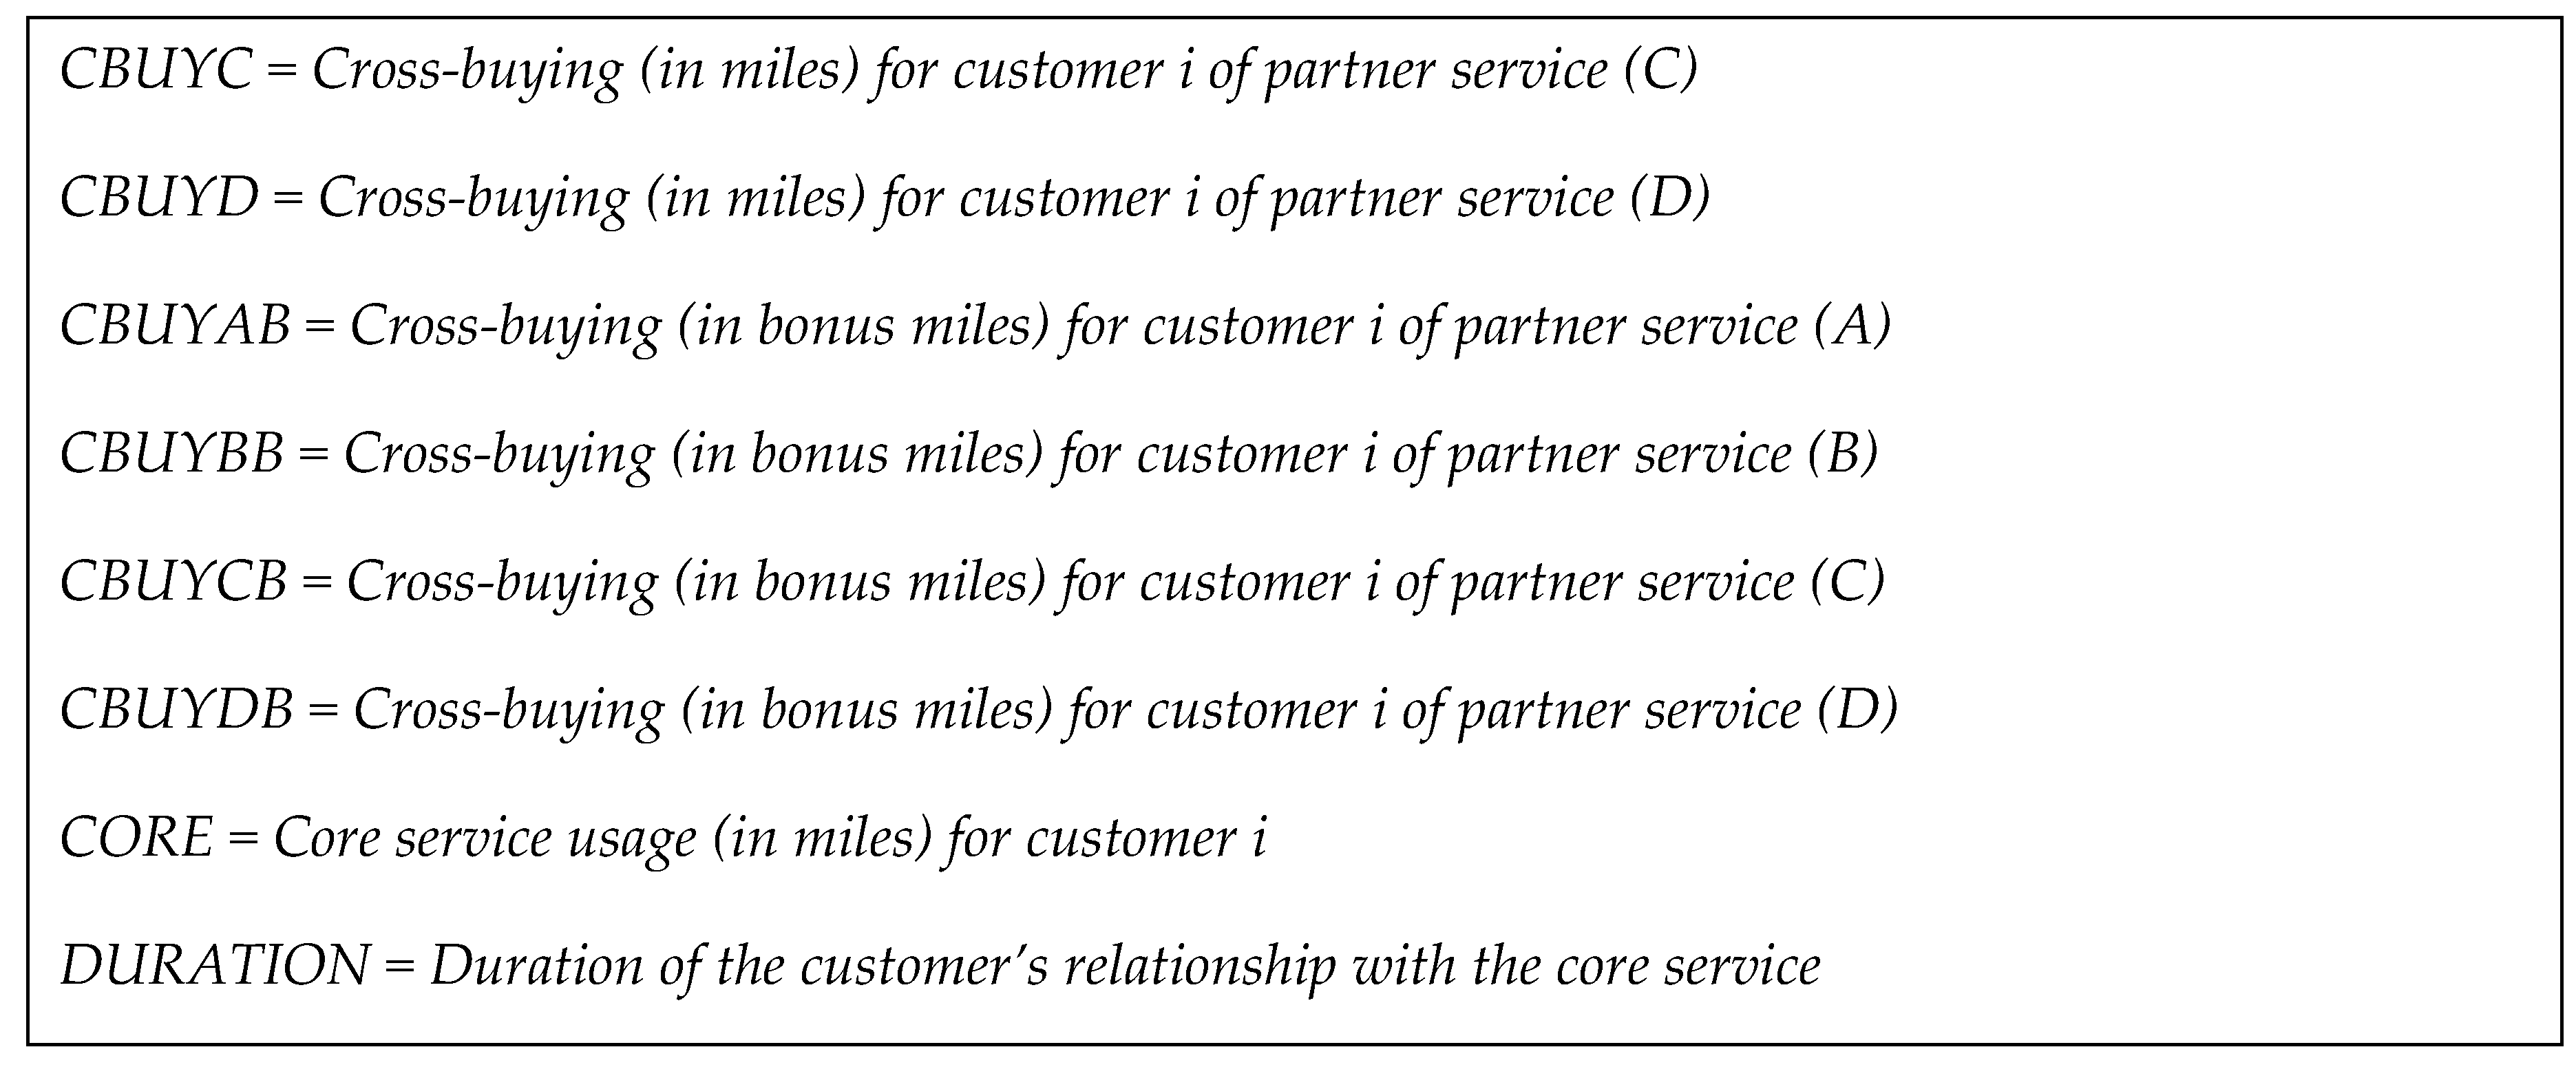
The following model assesses the effects of cross-buying between the LP partners and the core flying service:
CORE = f (CBUYA, CBUYB, CBUYC, CBUYD, DURATION, CURR_TIER)
The model's results indicate that all partnerships are significant, except the complementary partner category. Duration of membership is not significant.
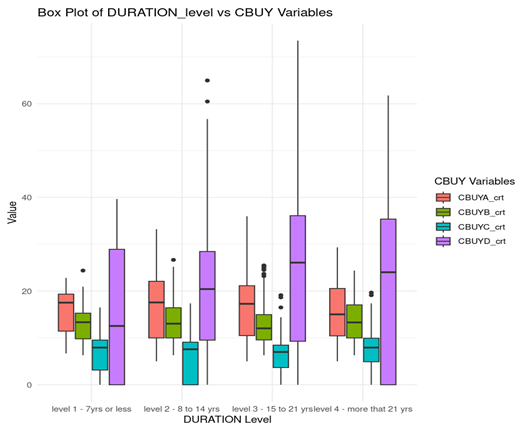
Table 2.
Significance of the smooth terms post cubic root transformation.
| Smooth term | edf | F-value | p-value |
| s(CBUYA_crt) | 5.282 | 4.781 | 6.50e-05 *** |
| s(CBUYB_crt) | 3.127 | 2.394 | 0.0529 . |
| s(CBUYC_crt) | 1.504 | 2.528 | 0.1318 |
| s(CBUYD_crt) | 1.006 | 27.874 | 8.52e-07 *** |
| s(DURATION_crt) | 1.547 | 0.259 | 0.7876 |
The smooth diagrams indicate a positive effect with the less complementary partner category, while both airline partner categories exhibit a negative effect. The findings also demonstrate that the airlines explanatory variables have high effective degrees of freedom (edf), suggesting a highly complex relationships with the core service (dependent variable). In contrast, the less complementary partner variable has an edf close to one, indicating a nearly linear relationship between the core service and this partner category. Further examination of the Star Alliance partner variable smooth reveals a steep positive incline up to around 2000 base miles, followed by a decline. Similarly, for the other airlines partner variable, there is a gradual incline up to approximately 8000 base miles, after which there is a rapid drop. The visual representation of these smooths below provides further insight into these findings.
Figure 2.
The smooth diagrams (cube root transformed data).
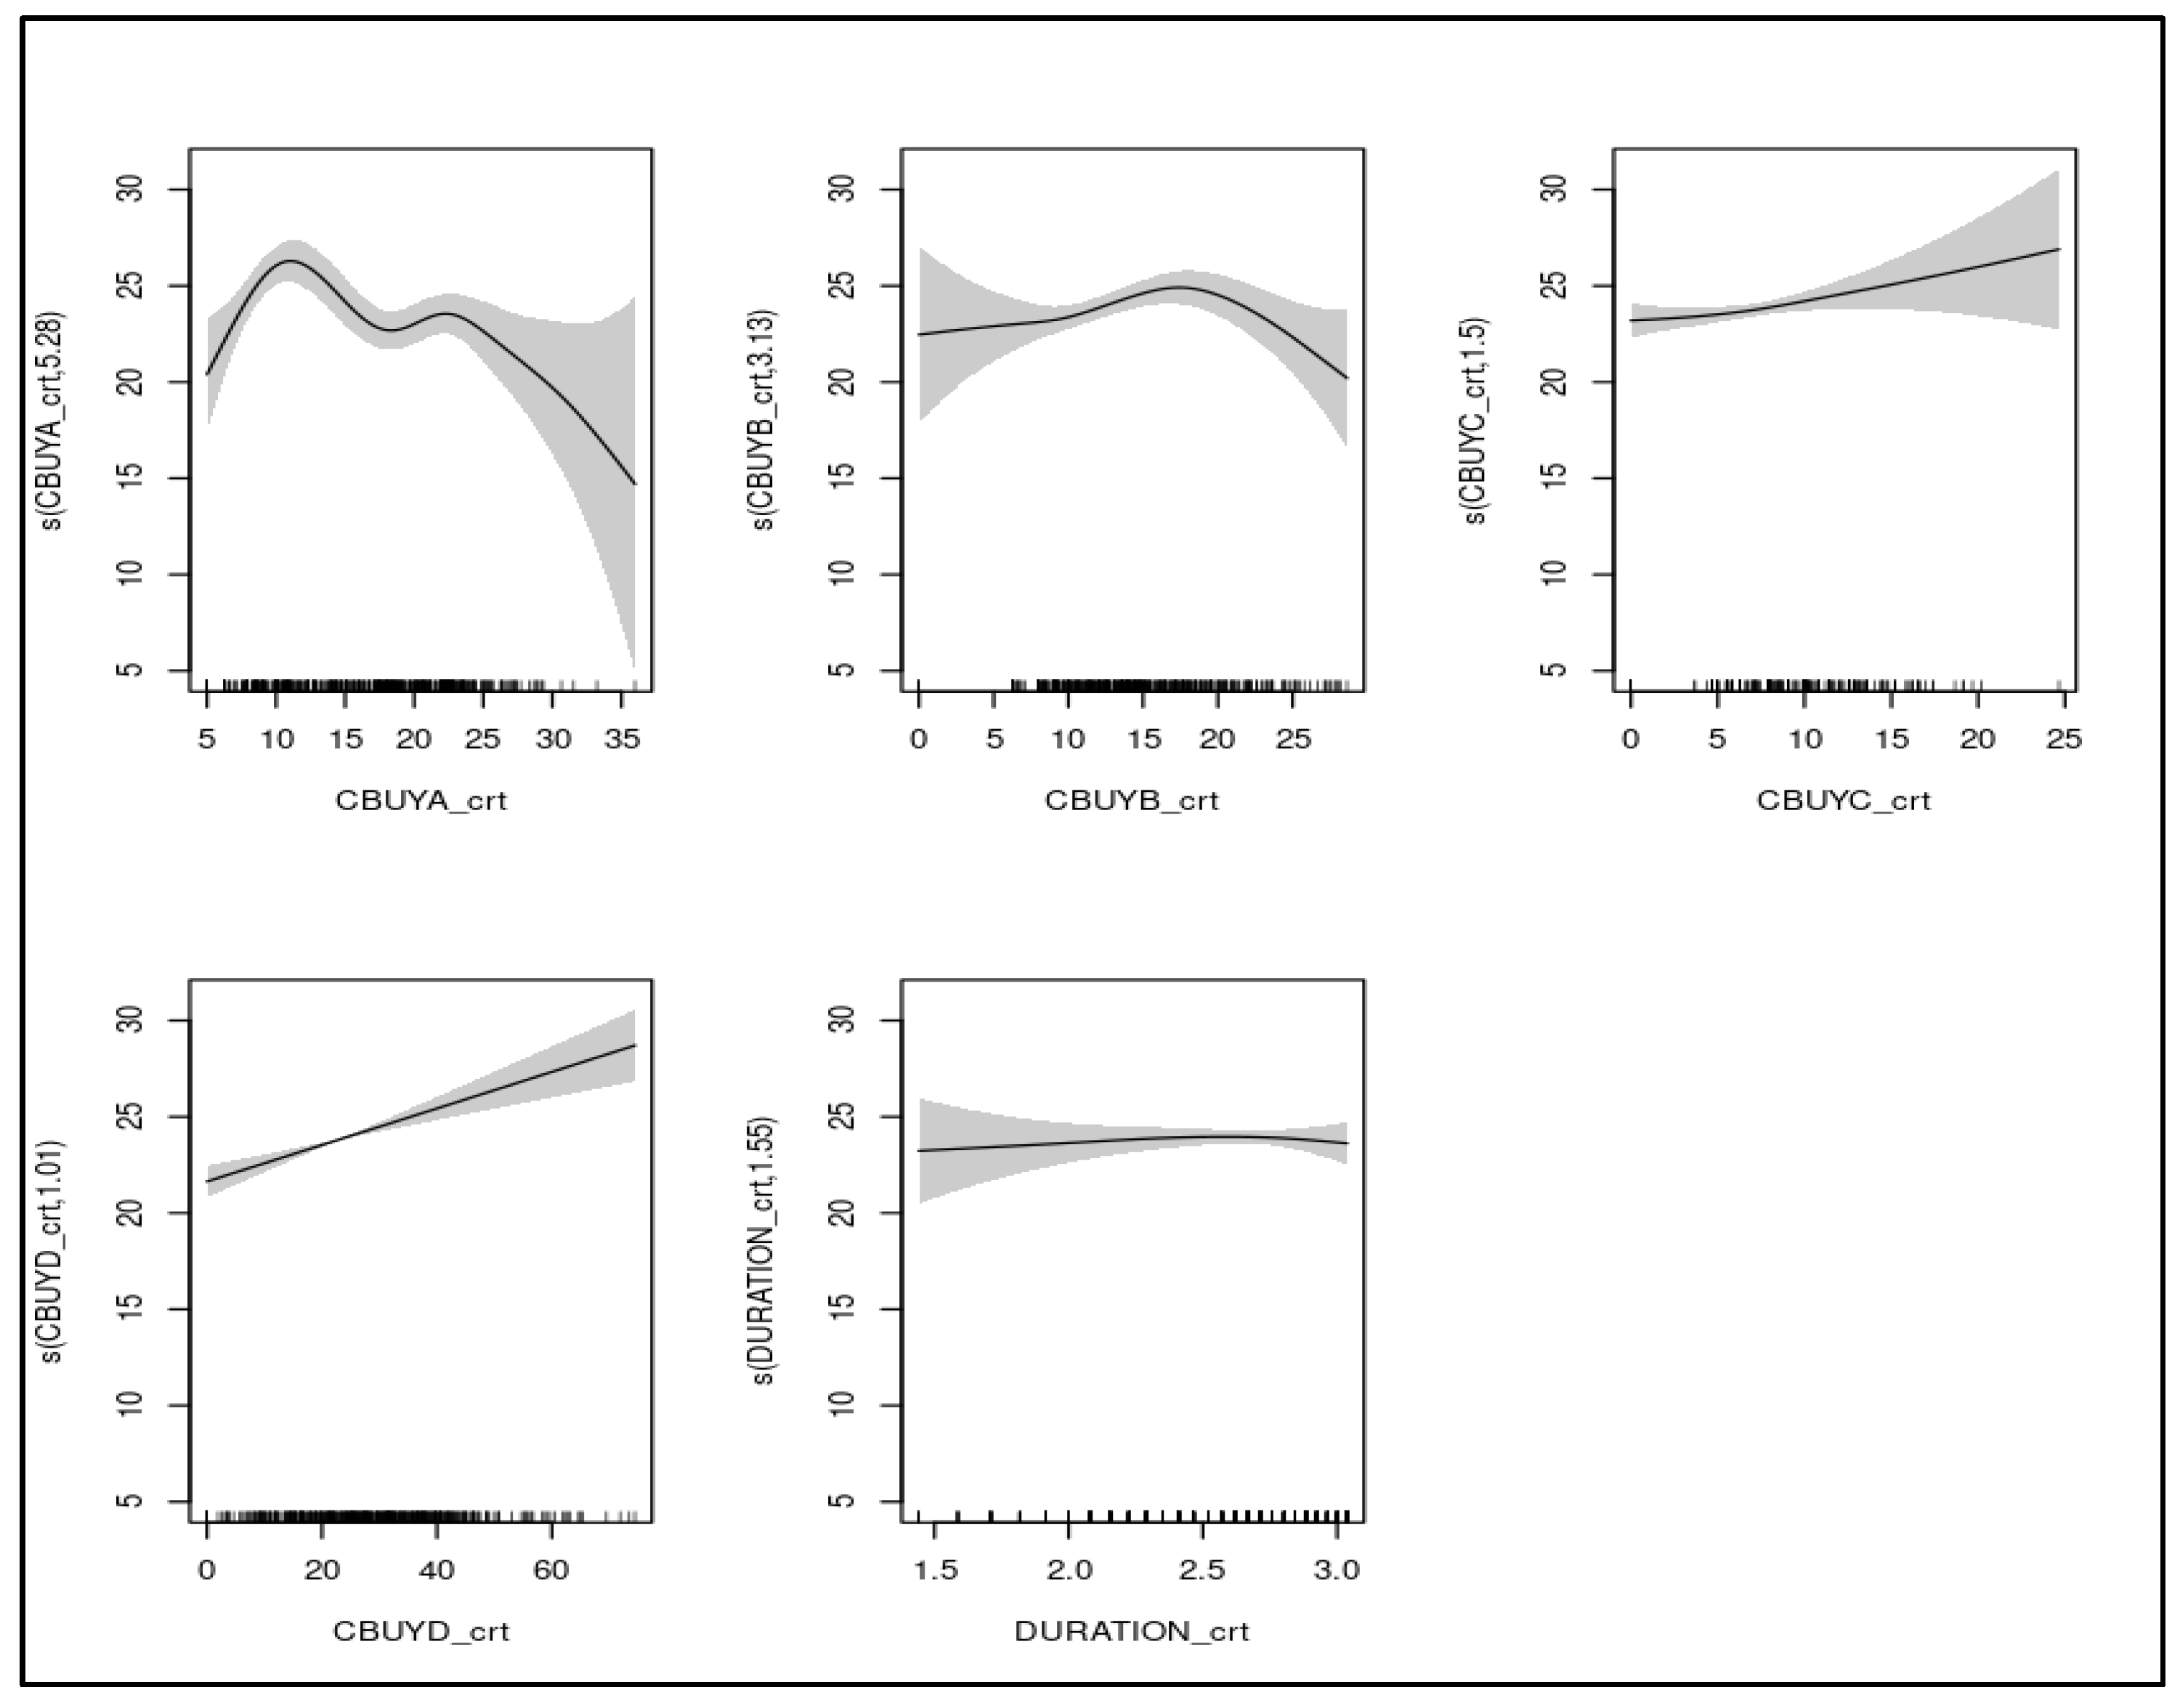
The duration of membership is not significant, but all the Tier Levels have a positive effect on the core service. Platinum has the largest coefficient, followed by LT Platinum, and the Blue Tier, which is the base tier, has the smallest coefficient.
Parametric coefficients:
Table 3.
Significance of the smooth terms post cubic root transformation.
| Tier Level | coefficient | std error | t value | Pr(>|t|) |
| Blue | 13515 | 749 | 18,05 | < 2e-16 *** |
| Gold | 36793 | 4281 | 8,59 | 8.53e-13 *** |
| LT Platinum | 42985 | 3792 | 11,34 | < 2e-16 *** |
| Platinum | 50612 | 3653 | 13,85 | < 2e-16 *** |
| Silver | 22569 | 1917 | 11,78 | 3.89e-08 *** |
This model was checked using the gam.check() function in R and the results of the test provide evidence that the assumptions of normality of the dataset, linearity (reasonable linearity between the response variable and the fitted values) and homoscedasticity (equal variances of error terms) were met. The model could explain 47% variance (Deviance Explained) which implies a moderately strong model for a GAM.
This hypothesis was also tested using the linear regression model, but the results failed the normality checks.
Hypothesis 2: Core service usage (flying) increases as bonus awards among the participating vendors increases.
To test the effects of bonus miles awards across the partnerships on the core service, the following model was fitted:
CORE = f (COREB, CBYAB, CBUYBB, CBUYCB, CBUYDB, DURATION, CURR_TIER)
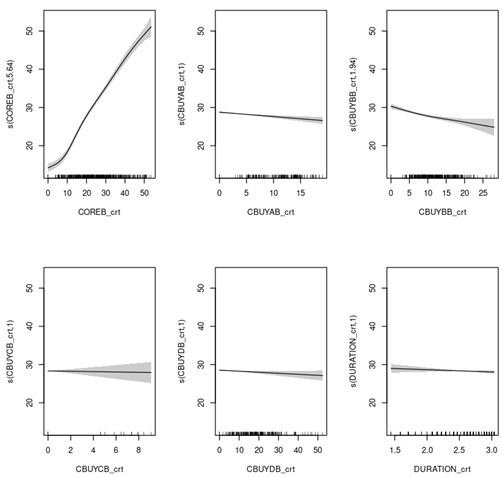
All partner categories are significant except the category of complementary partners.
Approximate significance of smooth terms:
Table 4.
Significance of the smooth terms post cubic root transformation.
| Smooth term | edf | F-value | p-value |
| S(COREB_crt) | 5.65 | 198.31 | < 2e-16 *** |
| s(CBUYAB_crt) | 1.00 | 15.15 | 0.000112 *** |
| s(CBUYBB_crt) | 1.94 | 13.68 | 9.05e-07 *** |
| s(CBUYCB_crt) | 1.00 | 0.09 | 0.768325 |
| s(CBUYDB_crt) | 1.00 | 3.44 | 0.064108 . |
| s(DURATION_crt) | 1.00 | 1.42 | 0.233759 |
The results also show a positive relationship between the core service base and bonus miles. For this model, all the tier levels are significant and all have positive coefficients. Like the results of the CORE model, Platinum has the largest coefficient, followed by LT Platinum, Gold, Silver and Blue respectively. Duration of LP membership is not significant in this model.
The model is strong at 85% Deviance Explained, satisfying the required model assumptions (normality, linearity and homoscedasticity).
The effect of bonus awards on the core service was also tested with a linear regression model. The results of the regression model and the gam were consistent – the only significant variables are the two airline categories, with negative coefficients. Removing tier level and the duration of membership variables from the linear regression equation resulted in a strong model with R-squared at 82%, very close to the Deviance Explained for the gam model at 85%. Normality of the residuals was confirmed by the Shapiro-Wilk p-value of 0.06.
Coefficients for linear model
| Estimate | Pr(>|t|) | |
| Intercept | 4096.01 | < 2e-16 *** |
| COREB_crt | 0.33 | < 2e-16 *** |
| CBUYAB_crt | -0.001 | 0.000253 *** |
| CBUYBB_crt | -0.009 | 1.86e-08 *** |
| CBUYCB_crt | -0.000007 | 0.909262 |
| CBUYDB_crt | -0.000003 | 0.361652 |
To test the effects of bonus miles for each of the LP partners, the following gam models were fitted:
Star Alliance partners: CBUYA = f(CBUYAB, CORE, DURATION, TIER_LEVEL)
Other Airlines: CBUYA = f(CBUYBB, CORE, DURATION, TIER_LEVEL)
Complementary partners: Not sufficient bonus miles data for this category
Noncomplementary partners: CBUYD = f(CBUYDB, CORE, DURATION, TIER_LEVEL)
Summary of results: bonus miles and core service effects on partners
Table 5.
Significance of the smooth terms post cubic root transformation. Summary of the results: Tier Levels effects
Table 5.
Significance of the smooth terms post cubic root transformation. Summary of the results: Tier Levels effects
| Star Alliance partners | Other airlines | Complementary partners | Noncomplementary partners | |
| Core service | Significant | Significant | N/A | Significant |
| Bonus miles | Significant | Significant | N/A | Significant |
| Duration | Not significant | Not Significant | N/A | Significant |
Table 6.
Significance of the smooth terms post cubic root transformation.
| Star Alliance partners | Other airlines | Complementary partners | Noncomplementary partners | |
| Blue | Significant, positive | Significant, positive | N/A | Significant, positive |
| Silver | Significant, positive | N/A | ||
| Gold | N/A | |||
| Platinum | Significant, positive | Significant, positive | N/A | |
| LT Platinum | Significant, positive | N/A | Significant, positive | |
| Binary variable | Significant, positive | Significant, positive | N/A | Significant, negative |
The following sections provide more detailed findings from these models.
14. Star Alliance Partners
Model: CBUYA = f(CBUYAB, CORE, DURATION, TIER_LEVEL)
The initial fitting of the gam model revealed that there was change in data characteristics around the annual base miles of 8000. A binary variable was thus added to the above function and the model was refitted. The results of the model show that the bonus miles are significant; showing a negative relationship up to around 125 bonus miles, followed by a sharp upwards trend that ends around 1000 bonus miles, up again around 3500 bonus miles. This is a complex relationship depicted by edf of 6.4.
The binary factor variable for CBUYA < = 8 000 is significant with a negative coefficient. This implies for Star Alliance partners, when base miles less than 8000, bonus miles have a negative effect. In addition, the core service variable is significant, however, the smooths plots indicate a generally negative and near linear cross-buying relationship the Star Alliance partner category.
All the tier levels are significant with positive coefficients except Gold and LT Platinum.
The model checked satisfactory and is a relatively strong fit at 69% Deviance Explained. The residual plot and the response vs fitted values plot show two clusters of values, indicative of the added binary variable in the model.
15. Other Airlines
Model: CBUYB = f(CBUYBB, CORE, DURATION, CURR_TIER)
Similar to the CBUYA model, the initial fitting of the gam model revealed that there was change in data characteristics around the annual base miles of 8000. A binary variable was thus added to the above function and the model was refitted.
Both the core service and bonus miles for other airlines (CBUYBB) are significant. The smooth of the CORE variable show a near straight line with a negative gradient, indicating a near linear but negative effect of CORE on other airlines base miles. The smooth for the CBUYA bonus miles show a negative effect that levels up at 125 bonus miles and continues upwards thereafter, implying a generally positive effect. Overall, a complex relationship between base and bonus miles with edf of 6.8. The binary variable was is significant, indicating that there is a dependence that changes the characteristics of the data at around 8 000 base miles. Duration of membership is not significant. All tier levels are significant except Gold and Silver.
The model is strong at 76% Deviance Explained. All the assumptions of the gam model are satisfied.
16. Complementary partners (Car Hires and Accommodation)
Approximately 90% of the LP members have not recorded bonus miles for over seven years in this partner category implying that bonus miles are not a key feature. Thus assessing the associated effects may not be meaningful for the context of this study.
17. Less Complementary Partners (Credit Card and Fuel)
A binary factor variable for the base miles that are zero or less due to high prevalence of zeros in the dependent variable was introduced. A two-part modelling approach was initially deployed unsuccessfully; one model satisfied the necessary assumptions, but had very low Deviance Explained, the other model had basis functions problems for the bonus miles variable. The adopted approach was to add a binary variable into the original model.
All the explanatory variables are significant. The smooth for the bonus miles show a steady incline that peaks around 8 000 bonus miles and begins a steady decline thereafter. The core service smooth diagram shows an incline that stays positive throughout, showing positive cross-buying effects between the core service and the less complementary partner category.
This is the only category where duration of membership is significant. The DURATION smooth diagram is flat and starts a slow incline after 10 years of membership, implying that the positive effects on the base miles are only seen after 10 years of membership.
The model checks satisfactorily, with Deviance Explained at 58%, a moderately strong performance for a GAM model. The normality assumption holds, the residual plots show two separate clusters of points reflective of the binary factor in the model.
Hypothesis 3: Cross-buying activity increases with the duration of LP membership.
The duration of membership was part of the earlier models, where DURATION was one of the predictor variables in the analysis. For this hypothesis, DURATION is the dependent variable grouped into four levels to enable ordinal regression modelling. The following was fitted:
Model: DURATION = f(CBUYA, CBUYB, CBUYC, CBUYD, CURR_TIER)
The model satisfied the multicollinearity of independent variables test and the parallel regression assumptions. Below are the results. The two highest tiers are significant with positive coefficients. Two durations levels are significant: the lowest level with a negative log-odds ratio, the highest level with a positive log-odds ratio.
| index | Estimate | Std_Error | t_value | p_value |
| CBUYA_crt | -0,0053 | 0,0139 | -0,38 | 0,704 |
| CBUYB_crt | -0,0065 | 0,0187 | -0,3483 | 0,7276 |
| CBUYC_crt | 0,0005 | 0,019 | 0,0267 | 0,9787 |
| CBUYD_crt | 0,0055 | 0,0054 | 1,0151 | 0,3101 |
| CURR_TIER Gold | 0,2509 | 0,3697 | 0,6787 | 0,4973 |
| CURR_TIERLT Platinum | 1,4026 | 0,3053 | 4,5942 | 4,34E-06* |
| CURR_TIER Platinum | 0,71 | 0,2664 | 2,6654 | 0,0077* |
| CURR_TIER Silver | 0,3779 | 0,2318 | 1,6307 | 0,103 |
|
level 1 - 7yrs or less| level 2 - 8 to 14 yrs |
-2,4263 | 0,4366 | -5,5577 | 2,73E-08* |
|
level 2 - 8 to 14 yrs| level 3 - 15 to 21 yrs |
-0,3076 | 0,4081 | -0,7539 | 0,4509 |
|
level 3 - 15 to 21 yrs| level 4 - more than 21 yrs |
1,4371 | 0,4129 | 3,4804 | 0,0005* |
The following diagrams provide further insight into the total cross buying over 15 years, clearly indicating how Category D mirrors the core service in terms of volumes. Also, the amount of cross buying for this category is much higher than volumes from the other partners.
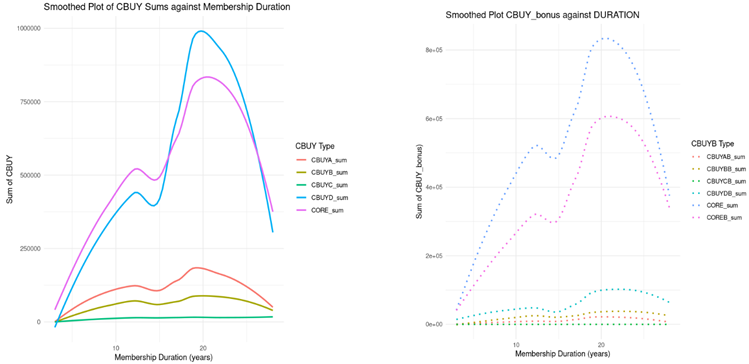
These diagrams show that with the exception of accommodation partners, which shows very little movement, the amount of cross buying tapers off around twenty years of membership for all partners in this LP. This holds for the core service as well.
18. Discussion
The application of the Generalized Additive Models (GAM) approach facilitated a nuanced analysis of cross-buying behaviors between the core service and various Loyalty Program (LP) partners (Chen & Bowman, 2021). This methodology effectively captured the intricate data patterns and complex interdependencies among variables. While the smooth functions of the explanatory variables exhibit nonlinearity and considerable variability, the overall directionality of the relationships remains discernible (Liu et al., 2023). Inflection points—where the smooths change direction—offer critical insights for refining and enhancing the design elements of the LP (Arın et al., 2021).
H1:
With respect to base miles, the analysis indicates a generally negative effect of cross-buying on the core service in relation to both categories of airline partners—those within the Star Alliance and those outside it (Baxter, 2019; Duque, 2017). This outcome aligns with expectations, given that both partner groups operate within the same industry and are natural market competitors (Zou et al., 2010). Notably, the relationship between cross-buying and base miles initially demonstrates a positive trend before declining after a certain threshold. This inflection point presents a strategic opportunity to optimize LP design and marketing initiatives to sustain growth beyond this threshold.(Chen et al., 2020; Taylor & Hollenbeck, 2021).
The "rich-get-richer" phenomenon is amplified by the cannibalization effects observed among partners, which underscores the importance of strategic partner selection and program design (Dorotić et al., 2021). Careful consideration of partner interactions and their potential impact on overall program performance is crucial. The implementation of mobile-driven loyalty apps significantly reduces consumer search costs, thereby enhancing on-demand information accessibility and facilitating the monitoring of reward points (Son et al., 2020).
Unexpectedly, the variable representing complementary partners—such as car rental services and hotels—did not emerge as statistically significant. Over 90% of LP members did not receive bonus miles from these partners during the seven-year observation period, suggesting limited engagement in this segment.(Taylor & Hollenbeck, 2021) This raises pertinent questions regarding the suitability of current hotel partners: it is plausible that these accommodations do not reflect the most commonly preferred options among customers, who may favor smaller, boutique-style establishments over large hotel chains(Hernandez, 2021; Olorunsola et al., 2023). Alternatively, customers might be prioritizing price over loyalty benefits when booking accommodations (Chen et al., 2020; Gookeh Mahsa & Mohammad Jafar, 2013).
To maximize the value and utility of loyalty programs, partnerships with non-hotel brands can effectively differentiate the offerings and drive member engagement (Yoo et al., 2018). These findings underscore the necessity for firms to consistently assess and refine their LP strategies to ensure alignment with evolving consumer preferences and market dynamics (So et al., 2015; Xiong et al., 2014). By leveraging technological advancements and data-driven insights, businesses can enhance the effectiveness of their loyalty programs and cultivate enduring customer relationships (Breugelmans et al., 2014). Companies are now shifting their focus toward retaining their most valuable customers through loyalty programs, but surprisingly, only about half of these companies actually measure the success of these programs using this critical indicator (Zavalishchin, 2021).
The most substantial contributor to cross-buying behavior was found to be the category of less complementary partners (e.g., credit card issuers, Diners Club, fuel/gas vendors). The data reveal a nearly linear and positive relationship between engagement with these partners and usage of the core service (Evanschitzky et al., 2017; Lee et al., 2017). This finding is contextually significant in the South African setting, where there is high private vehicle usage for commuting, making fuel purchases a daily and consistent opportunity to accumulate miles. In contrast, flying—the core service—is used less frequently, making it a less regular source of mile accumulation (Eisenhut et al., 2021; Sithole et al., 2021; Wait & Lekhuleni, 2020).
H2:
From the perspective of the core service, bonus miles issued through partnerships with non–Star Alliance airlines initially correlate positively with usage but taper off after approximately 8,000 bonus miles. Identifying the drivers of this threshold could inform strategies to maintain momentum in customer engagement (Bhuvaneswaran et al., 2018; Montoya & Flores, 2019). Furthermore, from the airline partners' perspective, a generally positive—though occasionally fluctuating—relationship is observed between base miles and bonus miles. Among less complementary partners, bonus miles contribute positively up to approximately 3,500 miles, after which the effect diminishes (Hoszman et al., 2019).
The success of loyalty programs hinges on providing tangible value to customers, enhancing customer retention, and fostering stronger brand advocacy (Steinhoff & Zondag, 2021). By understanding these dynamics and tailoring program elements accordingly, businesses can optimize the effectiveness of their loyalty initiatives. Implementing sophisticated personalization techniques and utilizing diverse data sources are essential components of successful customer loyalty programs (Zavalishchin, 2021).
Finally, while the overall relationship between the core service and base miles cross buying is complex, the overall effects of bonus miles have a linear relationship with the core service, enabling effective predictions and management of the program.
H3:
Finally, the analysis confirms a plateau effect in core service usage over the duration of membership. However, engagement with less complementary partners (credit cards, fuel vendors) shows a consistent positive correlation with both base miles earned and membership tenure (Steinhoff & Zondag, 2021; Zavalishchin, 2021). Tier-level analysis corroborates these findings: higher-tier members demonstrate the strongest association with core service usage, while members in the lower tiers exhibit the weakest. (Lin et al., 2021; Wang & Jin, 2022; Yoo et al., 2018) These insights highlight the importance of continuous program refinement and optimization. Interestingly, while loyalty programs are widely used, there is not enough proof of their long-term effects or if they even work (Liu, 2007). Some people even think that customers in loyalty programs don't actually spend more money but only move their spending from one place to another (Bolton et al., 2000).
The design of frequent flyer programs determines how travelers accumulate and redeem miles, influencing the benefits they receive (Suzuki, 2003). Airlines need to balance program costs with attracting and retaining valuable customers. Many firms have embraced loyalty programs to cultivate enduring relationships with their customer base (Bariha, 2021).
Loyalty programs are now regarded as an indispensable component of contemporary marketing strategies, strategically designed to nurture enduring customer relationships and amplify brand advocacy (Panjaitan, 2021). These programs function by furnishing customers with exclusive incentives, discounts, or rewards as a token of appreciation for their sustained patronage (Miranda-, 2024). In today's fiercely competitive business landscape, where customers are presented with an overwhelming array of choices, loyalty programs play a pivotal role in distinguishing a brand and cultivating a dedicated customer base. These initiatives enable businesses to collate invaluable data pertaining to customer behavior, preferences, and purchasing patterns, thus enabling customized marketing endeavors and the provision of bespoke customer experiences (Jarosz, 2022).
19. Conclusions
Overall, the category we have defined as less complementary partner category has the strongest positive cross buying activity with the core service (flying). The relationship is simple, almost linear, making it more predictable(Dorotić et al., 2021). Our data reveals, in the South African context, most people use a private vehicle to commute and will use fuel daily/consistently to accumulate miles from the programme. In comparison, flying (the core service) is used less frequently providing fewer regular opportunities to accumulate miles.
The airline partners demonstrate higher levels of competition. The accommodation and car hire partners do not produce visible, verifiable outcomes. Classification of customers by tier levels is effective from the core service perspective, thus the positive coefficients for all tiers ordered by the tier level(Gandomi & Zolfaghari, 2017; Li et al., 2021; Rosario, 2022). The bonus miles earned from non–Star Alliance airlines positively influences core service usage up to approximately 8000 bonus miles. It would be useful to isolate the reason why this threshold is observed. The airline partners show a generally positive relationship between base miles and bonus miles, but there are a few periods where the relationship is negative, suggesting customers change loyalty once a certain level of engagement is reached with airline partners.
In the less complementary partner category, the bonus miles positively influences up to approximately 3500 bonus miles. Once again, it is useful to isolate the reason why this threshold is observed. When measured over the period of membership, there is a plateauing effect from the core service usage. The less complementary partners continue to show a positive relationship between the base miles earned and the period of membership.
The category that is defined as less complementary partner category has the strongest positive cross buying activity with the core service. Classification of customers by tier levels is effective from the core service perspective, thus the positive coefficients for all tiers ordered by the tier level (Steinhoff & Zondag, 2021).
20. Further Research
Further research is required to understand how the marketing managers should design suitable loyalty program by considering factors such as customer behaviors, customer satisfaction, and customer relationship management and the utilization of digital platforms (Gookeh Mahsa & Mohammad Jafar, 2013). A well-designed loyalty program can significantly enhance customer value, primarily by reducing attrition rates (Gopalakrishnan et al., 2016). This reduction in attrition is crucial because acquiring new customers is often more expensive than retaining existing ones.
In the lodging industry, for example, hotels have seen significant revenue increases when customers participate in loyalty programs, primarily due to increased patronage by existing, loyal customers (Voorhees et al., 2014). By understanding the results from studies, hotel operators may have guidelines for differentiated marketing strategies in intensely competitive markets (Yusof et al., 2018). A loyalty program, at its core, is a structured marketing effort designed to incentivize loyal customers through various rewards (Hendrawan & Anggraeni, 2020). This approach not only encourages repeat business but also strengthens the emotional connection between the customer and the brand.
Appendix A: Descriptive statistics
| index | n | median | min | max | skew | kurtosis | se |
| CORE | 610 | 24305,75 | 250,00 | 164111,00 | 1,43 | 2,36 | 1059,61 |
| COREB | 610 | 9772,70 | 0,00 | 164899,00 | 2,08 | 4,08 | 1272,09 |
| CBUYA | 610 | 4985,75 | 125,00 | 70719,00 | 3,03 | 19,19 | 267,46 |
| CBUYAB | 610 | 0,00 | -2696,00 | 6944,00 | 2,09 | 4,41 | 52,31 |
| CBUYB | 610 | 2295,00 | 0,00 | 37000,00 | 3,01 | 11,60 | 203,92 |
| CBUYBB | 610 | 625,00 | 0,00 | 41000,00 | 4,98 | 34,85 | 150,09 |
| CBUYC | 610 | 387,50 | 0,00 | 15000,00 | 4,80 | 36,83 | 49,81 |
| CBUYCB | 610 | 0,00 | 0,00 | 37500,00 | 24,50 | 600,55 | 61,52 |
| CBUYD | 610 | 12848,50 | -10307,00 | 619452,40 | 4,90 | 31,67 | 2716,30 |
| CBUYDB | 610 | 0,00 | -22190,00 | 297968,00 | 8,53 | 99,70 | 788,33 |
| DURATION | 610 | 19,00 | 3,00 | 28,00 | -0,28 | -0,76 | 0,25 |
| CURR_TIER* | 610 | 2,00 | 1,00 | 5,00 | 0,35 | -1,55 | 0,07 |
| CORE_crt | 610 | 28,97 | 6,30 | 54,75 | -0,10 | -0,32 | 0,38 |
| COREB_crt | 610 | 21,38 | 0,00 | 54,84 | 0,17 | -0,59 | 0,55 |
| CBUYA_crt | 610 | 17,08 | 5,00 | 41,35 | 0,23 | -0,46 | 0,25 |
| CBUYAB_crt | 608 | 0,00 | 0,00 | 19,08 | 0,97 | -0,62 | 0,23 |
| CBUYB_crt | 610 | 13,19 | 0,00 | 33,32 | 0,80 | 0,93 | 0,21 |
| CBUYBB_crt | 610 | 8,55 | 0,00 | 34,48 | 0,48 | 0,21 | 0,26 |
| CBUYC_crt | 610 | 7,29 | 0,00 | 24,66 | 0,14 | -0,26 | 0,19 |
| CBUYCB_crt | 610 | 0,00 | 0,00 | 33,47 | 13,00 | 221,63 | 0,07 |
| CBUYD_crt | 582 | 24,58 | 0,00 | 85,25 | 0,40 | 0,00 | 0,72 |
| CBUYDB_crt | 533 | 0,00 | 0,00 | 66,79 | 1,54 | 2,14 | 0,51 |
| DURATION_crt | 610 | 2,67 | 1,44 | 3,04 | -0,86 | 0,34 | 0,01 |
References
- Agarwal, R. (2023). Does Loyalty Program Membership Lead to Repeat Purchase: A.
- Demographic Analysis with Customer Profiling and Machine Learning. In Deleted Journal (Vol. 23, Issue 2). [CrossRef]
- Agarwal, R. (2023). Does Loyalty Program Membership Lead to Repeat Purchase: A.
- Demographic Analysis with Customer Profiling and Machine Learning. Deleted Journal, 23(2). [CrossRef]
- Alshurideh, M. , Gasaymeh, A., Ahmed, G., Alzoubi, H. M., & Kurd, B. A. (2020).
- program effectiveness: Theoretical reviews and practical proofs. Uncertain Supply Chain Management, 599. [CrossRef]
- Arın, K. P., Minniti, M., Murtinu, S., & Spagnolo, N. (2021). Inflection Points, Kinks, and.
- Jumps: A Statistical Approach to Detecting Nonlinearities. Organizational Research Methods, 25(4), 786. [CrossRef]
- Au, A. , & Tse, A. C. B. (2021). Customer Accounting: Antecedents, Consequences and Moderators. In Harvard Deusto Business Research (Vol. 10, Issue 1, p. 81). [CrossRef]
- Bariha, P. P. (2021). Customer Loyalty Program and Retention Relationship.
- Psychology and Education Journal, 58(1), 5069. [CrossRef]
- Bariha, P. P. (2021). Customer Loyalty Program and Retention Relationship.
- Psychology and Education Journal, 58(1), 5069. [CrossRef]
- Basrowi, B. , Ali, J., & Suyanto, T. (2022).
- TRENDS: BIBLIOMETRY ANALYSIS. National Conference on Applied Business Education & Technology (NCABET), 2(1), 1. [CrossRef]
- Baxter, G. (2019). Capturing and Delivering Value in the Trans-Atlantic Air Travel.
- Market: The Case of the Air France-KLM, Delta Air Lines, and Virgin Atlantic Airways Strategic Joint Venture. MAD - Magazine of Aviation Development, 7(1), 17. [CrossRef]
- Becerril-Arreola, R., Zhou, C., Srinivasan, R., & Seldin, D. (2017). Service Satisfaction–.
- Market Share Relationships in Partnered Hybrid Offerings. Journal of Marketing, 81(5), 86. [CrossRef]
- Belli, A., O’Rourke, A.-M., Carrillat, F. A., Pupovac, L., Melnyk, V., & Napolova, E. (2021).
- 40 years of loyalty programs: how effective are they? Generalizations from a meta-analysis. Journal of the Academy of Marketing Science, 50(1), 147. [CrossRef]
- Belli, A., O\’Rourke, A.-M., Carrillat, F. A., & Napolova, E. (2022). 40 years of loyalty.
- programs: how effective are they? https://www.researchgate.net/publication/353914348_40_years_of_loyalty_programs_how_effective_are_they_Generalizations_from_a_meta-analysis#:~:text=Based%20on%20a%20data%20set,attitudinal%20loyalty%20is%20more%20challenging.
- Berman, B. L. (2006). Developing an Effective Customer Loyalty Program. California.
- Management Review, 49(1), 123. [CrossRef]
- Bhuvaneswaran, R., Venkatasamy, R., & Ramarajan, R. (2018). Service Quality towards.
- Customer Satisfaction in Low Cost Airline Industries. International Journal of Management Studies, 125. [CrossRef]
- Boer, E. R. de, & Gudmundsson, S. V. (2012). 30 years of frequent flyer programs.
- Journal of Air Transport Management, 24, 18. [CrossRef]
- Bolton, R. N., Kannan, P. K., & Bramlett, M. D. (2000). Implications of Loyalty Program.
- Membership and Service Experiences for Customer Retention and Value. Journal of the Academy of Marketing Science, 28(1), 95. [CrossRef]
- Breugelmans, E. , Bijmolt, T. H. A., Zhang, J., Basso, L. J., Dorotić, M., Kopalle, P. K.
- Minnema, A. , Mijnlieff, W. J., & Wünderlich, N. V. (2014). Advancing research on loyalty programs: a future research agenda. Marketing Letters, 26(2), 127. [CrossRef]
- Breugelmans, E. , Bijmolt, T. H. A., Zhang, J., Basso, L. J., Dorotić, M., Kopalle, P. K.
- Minnema, A. , Mijnlieff, W. J., & Wünderlich, N. V. (2014). Advancing research on loyalty programs: a future research agenda. Marketing Letters, 26(2), 127. [CrossRef]
- Bruneau, V. , Swaen, V., & Zidda, P. (2018). Are loyalty program members really engaged?
- Measuring customer engagement with loyalty programs. In Journal of Business Research (Vol. 91, p. 144). Elsevier BV. [CrossRef]
- Bruneau, V., Swaen, V., & Zidda, P. (2018). Are loyalty program members really.
- engaged? Measuring customer engagement with loyalty programs. Journal of Business Research, 91, 144. [CrossRef]
- Cabral, L. (2016). Dynamic pricing in customer markets with switching costs. Review.
- of Economic Dynamics, 20, 43. [CrossRef]
- Chang, W. (2020). Different status reevaluation period and communication styles for.
- top-tier and bottom-tier customers in multi-tier loyalty programs. European Journal of Marketing, 54(12). [CrossRef]
- Chen, L., & Bowman, D. (2021). The impact of introducing a customer loyalty.
- program on category sales and profitability. Journal of Retailing and Consumer Services, 64, 102769. [CrossRef]
- Chen, Y., Mandler, T., & Meyer-Waarden, L. (2020). Three decades of research on.
- loyalty programs: A literature review and future research agenda [Review of Three decades of research on loyalty programs: A literature review and future research agenda]. Journal of Business Research, 124, 179. Elsevier BV. [CrossRef]
- Chen, Y., Mandler, T., & Meyer-Waarden, L. (2020). Three decades of research on loyalty.
- programs: A literature review and future research agenda [Review of Three decades of research on loyalty programs: A literature review and future research agenda]. Journal of Business Research, 124, 179. Elsevier BV. [CrossRef]
- Chen, Y., Mandler, T., & Meyer-Waarden, L. (2020). Three decades of research on.
- loyalty programs: A literature review and future research agenda [Review of Three decades of research on loyalty programs: A literature review and future research agenda]. Journal of Business Research, 124, 179. Elsevier BV. [CrossRef]
- Chun, S. Y., Iancu, D. A., & Trichakis, N. (2020). Loyalty Program Liabilities and Point.
- Values. Manufacturing & Service Operations Management, 22(2), 257. [CrossRef]
- CodeMint, T. (2016). CUSTOMER RELATIONSHIP MANAGEMENT AND MARKETING PERFORMANCE IN THE NIGERIA BANKING INDUSTRY. https://codemint.net/marketing/customer-relationship-management-and-marketing-performance-in-the-nigeria-banking-industry/index.html.
- Curatman, A., Suroso, A., Junaedi, J., Maulana, Y., Rahmadi, R., & Maulany, S. (2019).
- Could the Loyalty Program Increase Store Loyalty? [CrossRef]
- Dhameeth, G. S. (2019). Predictive Modeling of the Brand Equity: Analysis Based on.
- Multiple Logistic Regression and Backward Stepwise Model Selection Methods. In International Journal of Data Science and Analysis (Vol. 5, Issue 4, p. 67). Science Publishing Group. [CrossRef]
- Dorotić, M. (2019). Keeping Loyalty Programs Fit for the Digital Age. In NIM Marketing.
- Intelligence Review (Vol. 11, Issue 1, p. 24). De Gruyter. [CrossRef]
- Dorotić, M. (2019). Keeping Loyalty Programs Fit for the Digital Age. NIM Marketing.
- Intelligence Review, 11(1), 24. [CrossRef]
- Dorotic, M., Bijmolt, T. H. A., & Verhoef, P. C. (2011). Loyalty Programmes: Current.
- Knowledge and Research Directions. https://onlinelibrary.wiley.com/doi/10.1111/j.1468-2370.2011.00314.x.
- Dorotić, M., Bijmolt, T. H. A., & Verhoef, P. C. (2011). Loyalty Programmes: Current.
- Knowledge and Research Directions*. In International Journal of Management Reviews.
- (Vol. 14, Issue 3, p. 217). Wiley. [CrossRef]
- Dorotić, M., Fok, D., Verhoef, P. C., & Bijmolt, T. H. A. (2010). Do vendors benefit from.
- promotions in a multi-vendor loyalty program? In Marketing Letters (Vol. 22, Issue 4, p. 341). Springer Science+Business Media. [CrossRef]
- Dorotić, M., Fok, D., Verhoef, P. C., & Bijmolt, T. H. A. (2021). Synergistic and.
- cannibalization effects in a partnership loyalty program. Journal of the Academy of Marketing Science, 49(5), 1021. [CrossRef]
- Dorotić, M., Fok, D., Verhoef, P. C., & Bijmolt, T. H. A. (2021). Synergistic and.
- cannibalization effects in a partnership loyalty program. Journal of the Academy of Marketing Science, 49(5), 1021. [CrossRef]
- Duque, O. V. (2017). The Costs of Loyalty. On Loyalty Rewards and Consumer.
- Welfare. SSRN Electronic Journal. [CrossRef]
- Dutta, S. , & Bhattacharya, S. (2019). Cross selling of investment products and services: a case study of leading financial services organisation. In International Journal of Business Forecasting and Marketing Intelligence (Vol. 5, Issue 2, p. 241). [CrossRef]
- Eisenhut, D. , Moebs, N., Windels, E., Bergmann, D., Geiß, I., Reis, R., & Strohmayer, A.
- (2021). Aircraft Requirements for Sustainable Regional Aviation. Aerospace, 8(3), 61. [CrossRef]
- El-Manstrly, D. (2016). Enhancing customer loyalty: critical switching cost factors.
- Journal of Service Management, 27(2), 144. [CrossRef]
- Elrayah, M., & Semlali, Y. (2023). Sustainable Total Reward Strategies for Talented.
- Employees’ Sustainable Performance, Satisfaction, and Motivation: Evidence from the Educational Sector. Sustainability, 15(2), 1605. [CrossRef]
- Esmaeilpour, F. (2015). The role of functional and symbolic brand associations on brand.
- loyalty. In Journal of Fashion Marketing and Management (Vol. 19, Issue 4, p. 467). Emerald Publishing Limited. [CrossRef]
- Evanschitzky, H. , Malhotra, N., Wangenheim, F. von, & Lemon, K. N. (2017).
- Antecedents of peripheral services cross-buying behavior. Journal of Retailing and Consumer Services, 36, 218. [CrossRef]
- Evanschitzky, H. , Malhotra, N., Wangenheim, F. von, & Lemon, K. N. (2017).
- Antecedents of peripheral services cross-buying behavior. Journal of Retailing and Consumer Services, 36, 218. [CrossRef]
- Felix, R. (2016). Multi-Brand Loyalty: Propositions and Insights from a Quantitative.
- Study. In Developments in marketing science: proceedings of the Academy of Marketing Science (p. 101). Springer International Publishing. [CrossRef]
- Fernandes, T., & Moreira, M. (2019). Consumer brand engagement, satisfaction and brand.
- loyalty: a comparative study between functional and emotional brand relationships. In Journal of Product & Brand Management (Vol. 28, Issue 2, p. 274). Emerald Publishing Limited. [CrossRef]
- Furinto, A. (2013). Price or Privilege? Customer Perception on Loyalty Programs.
- ASEAN Marketing Journal, 3(2). [CrossRef]
- Furinto, A., Pawitra, T., & Balqiah, T. E. (2009). Designing competitive loyalty.
- programs: How types of program affect customer equity. Journal of Targeting Measurement and Analysis for Marketing, 17(4), 307. [CrossRef]
- Gandomi, A., & Zolfaghari, S. (2013). Profitability of loyalty reward programs: An.
- analytical investigation. Omega, 41(4), 797. [CrossRef]
- Gandomi, A., & Zolfaghari, S. (2017). To tier or not to tier: An analysis of multitier.
- loyalty programs׳ optimality conditions. Omega, 74, 20. [CrossRef]
- Gandomi, A., & Zolfaghari, S. (2017). To tier or not to tier: An analysis of multitier.
- loyalty programs׳ optimality conditions. Omega, 74, 20. [CrossRef]
- George, M., & Wakefield, K. L. (2017). Modeling the consumer journey for.
- membership services. Journal of Services Marketing, 32(2), 113. [CrossRef]
- Gookeh Mahsa, E., & Mohammad Jafar, T. (2013). Customer Lifetime Value Models:.
- literature Survey. 24(4), 317.
- Gopalakrishnan, A., Jiang, Z., Nevskaya, Y., & Thomadsen, R. (2016). Can Non-Tiered.
- Frequency Reward Programs Be Profitable? SSRN Electronic Journal. [CrossRef]
- Gopalakrishnan, A., Jiang, Z., Nevskaya, Y., & Thomadsen, R. (2021). Can Non-tiered.
- Customer Loyalty Programs Be Profitable? Marketing Science, 40(3), 508. [CrossRef]
- Gray, D., D’Alessandro, S., Johnson, L. W., & Carter, L. (2017). Inertia in services:.
- causes and consequences for switching. Journal of Services Marketing, 31(6), 485. [CrossRef]
- Hadlock, P., Raja, S., Black, B., Gell, J., Gormley, P., Sprecher, B., Davey, K. (KK) S., &.
- Satchu, J. (2021). The Digital Future: A Game Plan for Consumer Packaged Goods. https://www.bcg.com/publications/2014/digital-future-game-plan-consumer-packaged-goods.
- Hendrawan, D., & Anggraeni, R. (2020). IS THE LOYALTY PROGRAM EFFECTIVE IN.
- CREATING LOYALTY PROGRAM SATISFACTION AND STORE LOYALTY? AN EVIDENCE FROM INDONESIA RETAIL INDUSTRY. Jurnal Aplikasi Manajemen, 18(4), 645. [CrossRef]
- Hernandez, J. Z. (2021). Trends and Issues of Hotel Industry in CALABARZON: Inputs.
- to Tourism and Hospitality Development Planning. International Multidisciplinary Research Journal, 3(1), 118. [CrossRef]
- Hoszman, A., Marciszewska, E., & Zagrajek, P. (2019). Frequent Flyer Programs –.
- Overview of Existing Models. Transport and Communications, 7(1), 26. [CrossRef]
- Huang, G., & Sudhir, K. (2020). The Causal Effect of Service Satisfaction on Customer.
- Loyalty. Management Science, 67(1), 317. [CrossRef]
- Human, G., Ferreira, C., Robertson, J., & Witherspoon, M. (2020). Customer experience,.
- satisfaction and loyalty in business-to-business markets: Does the chain hold across customer segments? In Acta Commercii (Vol. 20, Issue 1). AOSIS. [CrossRef]
- Ieva, M., & Ziliani, C. (2017). Towards digital loyalty programs: insights from customer.
- medium preference segmentation. International Journal of Retail & Distribution Management, 45(2), 195. [CrossRef]
- Jalili, M., & Pangburn, M. S. (2020). Understanding the Value of Delayed Discounts in.
- Retail Rewards Programs. Decision Sciences, 52(4), 952. [CrossRef]
- Jarosz, J. (2022). The Introduction of Loyalty Programs for the Retail Industry.
- International Journal of Innovation in Marketing Elements, 2(1), 59. [CrossRef]
- Kautsiro, F., & Awolusi, O. D. (2020). Loyalty programs for the passenger.
- transportation industry: a study of Zimbabwean Companies. Journal of Education and Vocational Research, 11(1), 5. [CrossRef]
- Keiningham, T. L., Frennea, C., Aksoy, L., Buoye, A., & Mittal, V. (2015). A Five-.
- Component Customer Commitment Model. Journal of Service Research, 18(4), 433. [CrossRef]
- Keller, P. A., Hesselton, K., & Volpp, K. G. (2020). Increasing Recruitment and.
- Engagement with Time-Limited Financial Incentives. Journal of the Association for Consumer Research, 5(3), 259. [CrossRef]
- Khairulya, D. (2018). COMMERCIAL MARKET DEVELOPMENT OF BULOG.
- (INDONESIAN LOGISTIC BUREAU) THROUGH SMALL-RETAIL BUSINESS BASED ON COMMUNITY SERVICE (RPK / RUMAH PANGAN KITA). In International Journal of Advanced Research (Vol. 6, Issue 7, p. 649). [CrossRef]
- Kim, K.-J., Kim, H., & Kwon, R.-H. (2010). Evaluating the impact of a loyalty program:.
- A case study in automobile industry. [CrossRef]
- Kim, K., & Ahn, S. J. (2017). Rewards that undermine customer loyalty? A motivational.
- approach to loyalty programs. Psychology and Marketing, 34(9), 842. [CrossRef]
- Kolluru, M. (2020). Association Between Rewards and Employee Performance: An.
- Empirical Research on Omani Banks. SSRN Electronic Journal. [CrossRef]
- Koo, B., Yu, J., & Han, H. (2020). The role of loyalty programs in boosting hotel guest.
- loyalty: Impact of switching barriers. International Journal of Hospitality Management, 84, 102328. [CrossRef]
- Kristiani, E., Sumarwan, U., Yuliati, L. N., & Saefuddin, A. (2013). Managing Rewards to.
- Enhance Customer Lifetime Value. Asian Social Science, 10(2). [CrossRef]
- Kumar, V. (2019). Global implications of cause-related loyalty marketing. International.
- Marketing Review, 37(4), 747. [CrossRef]
- Kumar, V., & Reinartz, W. (2018). Loyalty Programs: Design and Effectiveness. In Springer.
- texts in business and economics (p. 179). Springer International Publishing. [CrossRef]
- Kumar, V. , & Reinartz, W. (2018). Loyalty Programs: Design and Effectiveness. In.
- Springer texts in business and economics (p. 179). Springer International Publishing. [CrossRef]
- Kumar, V., & Shah, D. (2004). Building and sustaining profitable customer loyalty for the.
- 21st century. In Journal of Retailing (Vol. 80, Issue 4, p. 317). Elsevier BV. [CrossRef]
- Kumar, V., George, M. S., & Pancras, J. (2008). Cross-buying in retailing: Drivers and.
- consequences. Journal of Retailing, 84(1), 15. [CrossRef]
- Kwiatek, P., Morgan, Z., & Thanasi-Boçe, M. (2020). The role of relationship quality.
- and loyalty programs in building customer loyalty. Journal of Business and Industrial Marketing, 35(11), 1645. [CrossRef]
- Lee, C., Ofek, E., & Steenburgh, T. J. (2017). Personal and Social Usage: The Origins of.
- Active Customers and Ways to Keep Them Engaged. Management Science, 64(6), 2473. [CrossRef]
- Li, D. (2020). When less is more: Recovery technology investment and segmentation.
- for uptime-centered services. European Journal of Operational Research, 286(1), 267. [CrossRef]
- Li, K., Shao, G., Yang, N., Fang, X., & Song, Y. (2022). Billion-user Customer Lifetime.
- Value Prediction: An Industrial-scale Solution from Kuaishou. In Proceedings of the 31st ACM International Conference on Information & Knowledge Management. [CrossRef]
- Li, Z., Chang, H., Fu, X., & Liu, X. (2021). Beyond complainers: reclassifying customers.
- of travel agency regarding post-failure behavior and loyalty performance. Asia Pacific Journal of Tourism Research, 26(3), 329. [CrossRef]
- Lin, R.-H., Chuang, W.-W., Chuang, C., & Chang, W.-S. (2021). Applied Big Data.
- Analysis to Build Customer Product Recommendation Model. Sustainability, 13(9), 4985. [CrossRef]
- Liu, Y. (2007). The Long-Term Impact of Loyalty Programs on Consumer Purchase.
- Behavior and Loyalty. Journal of Marketing, 71(4), 19. [CrossRef]
- Liu, Y., Duffy, K., Dy, J., & Ganguly, A. R. (2023). Explainable deep learning for insights.
- in El Niño and river flows. Nature Communications, 14(1). [CrossRef]
- McCall, M., & Voorhees, C. M. (2009). The Drivers of Loyalty Program Success. Cornell.
- Hospitality Quarterly, 51(1), 35. [CrossRef]
- McKenzie, R. , Baraya, A. R., Wyld, D. C., Medina, C. G., & González, A. M. G. (2020). The.
- Value of Loyalty: Understanding Brand Loyalty from A Consumer Point of View. In International Journal of Managing Value and Supply Chains (Vol. 11, Issue 1, p. 1). [CrossRef]
- Meyer-Waarden, L. (2007). The effects of loyalty programs on customer lifetime.
- duration and share of wallet. Journal of Retailing, 83(2), 223. [CrossRef]
- Meyer-Waarden, L. (2015). Effects of loyalty program rewards on store loyalty.
- Journal of Retailing and Consumer Services, 24, 22. [CrossRef]
- Miranda-, G. M. (2024). Relationship Marketing and Customer Loyalty: A Quantitative.
- Analysis in the Retail Sector. IBIMA Business Review, 1. [CrossRef]
- Montoya, R., & Flores, C. (2019). Buying free rewards: the impact of a points-plus-.
- cash promotion on purchase and reward redemption. Marketing Letters, 30(1), 107. [CrossRef]
- Mostafa, R. B., & Kasamani, T. (2021). Brand experience and brand loyalty: is it a matter of.
- emotions?. Asia Pacific Journal of Marketing and Logistics, 33(4), 1033-1051.
- Nastasoiu, A., & Vandenbosch, M. (2018). Competing with loyalty: How to design.
- successful customer loyalty reward programs. In Business Horizons (Vol. 62, Issue 2, p. 207). Elsevier BV. [CrossRef]
- Nastasoiu, A., & Vandenbosch, M. (2019). Competing with loyalty: How to design.
- successful customer loyalty reward programs. Business Horizons, 62(2), 207. [CrossRef]
- Ning, F., Zhang, M., & Saili, T. (2010). Impact of loyalty programs on relationship.
- benefits and customer loyalty: A customer perspective. [CrossRef]
- Olorunsola, V. O. , Saydam, M. B., Lasisi, T. T., & Eluwole, K. K. (2023). Customer.
- experience management in capsule hotels: a content analysis of guest online review. Journal of Hospitality and Tourism Insights, 6(5), 2462. [CrossRef]
- Panjaitan, R. (2021). The Role of Digital Loyalty Program towards Customer Loyalty.
- through a Measure of Satisfaction. The Winners, 22(2). [CrossRef]
- Rese, M. , Hundertmark, A., Schimmelpfennig, H., & Edinger-Schons, L. M. (2013). Loyalty.
- program types as drivers of customer retention: a comparison of stand-alone programs and multi-vendor loyalty programs through the lens of transaction cost economics. In The International Review of Retail Distribution and Consumer Research (Vol. 23, Issue 3, p. 305). Routledge. [CrossRef]
- Richards, T. J. , & Liaukonytė, J. (2019). Switching Costs and Store Choice. In SSRN.
- Electronic Journal. RELX Group (Netherlands). [CrossRef]
- Rosario, F. S. (2022). The Availability and Adequacy, and Level of Importance of the.
- Facilities and Services Offered by Hotel Fragaria: An Input for Partnership Program. INTERNATIONAL JOURNAL OF MULTIDISCIPLINARY RESEARCH AND ANALYSIS, 5(10). [CrossRef]
- Saleky, S. R. J. , Wen, L. C., Payangan, O. R., Jusni, J., & Pono, M. (2018). Identification of.
- Customer Loyalty Determinants in Service Industry. In Journal of business and management sciences (Vol. 6, Issue 4, p. 171). [CrossRef]
- Saroha, R. , & Diwan, S. P. (2017). Modelling customer satisfaction and customer loyalty in.
- the frame of telecommunications industry: a review [Review of Modelling customer satisfaction and customer loyalty in the frame of telecommunications industry: a review]. EuroMed J of Management, 2(1), 15. [CrossRef]
- Serfontein, E. , & Govender, K. (2020). Stakeholders’ views regarding macro-.
- environment impacts on commercial flight operations in South Africa. Journal of Transport and Supply Chain Management, 14. [CrossRef]
- Siebert, A. , Gopaldas, A., Lindridge, A., & Simões, C. (2020). Customer Experience.
- Journeys: Loyalty Loops Versus Involvement Spirals. Journal of Marketing, 84(4), 45. [CrossRef]
- Sithole, L. T. , Luke, R., & Nabee, S. G. (2021). The impact of measuring driver.
- performance on the bulk fuel supply chain. Journal of Transport and Supply Chain Management, 15. [CrossRef]
- So, J. T. , Danaher, T. S., & Gupta, S. (2015). What do Customers Get and Give in.
- Return for Loyalty Program Membership? Australasian Marketing Journal (AMJ), 23(3), 196. [CrossRef]
- So, J. T. , Danaher, T. S., & Gupta, S. (2015). What do Customers Get and Give in Return for.
- Loyalty Program Membership? In Australasian Marketing Journal (AMJ) (Vol. 23, Issue 3, p. 196). SAGE Publishing. [CrossRef]
- So, J. T. , Danaher, T. S., & Gupta, S. (2015). What do Customers Get and Give in.
- Return for Loyalty Program Membership? Australasian Marketing Journal (AMJ), 23(3), 196. [CrossRef]
- Son, Y., Oh, W., Han, S. P., & Park, S. (2020). When Loyalty Goes Mobile: Effects of.
- Mobile Loyalty Apps on Purchase, Redemption, and Competition. Information Systems Research, 31(3), 835. [CrossRef]
- Steinhoff, L. , & Zondag, M. M. (2021). Loyalty programs as travel companions:.
- Complementary service features across customer journey stages. Journal of Business Research, 129, 70. [CrossRef]
- Steinhoff, L. , & Zondag, M. M. (2021). Loyalty programs as travel companions:.
- Complementary service features across customer journey stages. In Journal of Business Research (Vol. 129, p. 70). Elsevier BV. [CrossRef]
- Steinhoff, L. , & Zondag, M. M. (2021). Loyalty programs as travel companions:.
- Complementary service features across customer journey stages. Journal of Business Research, 129, 70. [CrossRef]
- Stourm, V. , Allenby, G. M., Bradlow, E. T., Breugelmans, E., Chun, S. Y., Gardete, P. M.
- Kannan, P. K. , Kopalle, P. K., Park, Y.-H., Amariles, D. R., Thomadsen, R., Liu–Thompkins, Y., & Venkatesan, R. (2020). Refocusing loyalty programs in the era of big data: a societal lens paradigm. Marketing Letters, 31(4), 405. [CrossRef]
- Stourm, V. , Neslin, S. A., Bradlow, E. T., Breugelmans, E., Chun, S. Y., Gardete, P. M.
- Kannan, P. K. , Kopalle, P. K., Park, Y.-H., Amariles, D. R., Thomadsen, R., Liu–Thompkins, Y., & Venkatesan, R. (2020). Refocusing loyalty programs in the era of big data: a societal lens paradigm. In Marketing Letters (Vol. 31, Issue 4, p. 405). Springer Science+Business Media. [CrossRef]
- Suzuki, Y. (2003). Airline frequent flyer programs: equity and attractiveness.
- Transportation Research Part E Logistics and Transportation Review, 39(4), 289. [CrossRef]
- Taylor, W. , & Hollenbeck, B. (2021). Leveraging loyalty programs using competitor.
- based targeting. Quantitative Marketing and Economics, 19, 417. [CrossRef]
- Thamrin, G., Bernarto, I., & Kawata, Y. (2020). The influence of trust, satisfaction, value,and.
- brand image on loyalty. In BISMA (Bisnis dan Manajemen) (Vol. 12, Issue 2, p. 168). [CrossRef]
- Tulabandhula, T. , Ouksel, A. M., & Nguyen, S. (2021). Price Discrimination in the.
- Presence of Customer Loyalty and Differing Firm Costs. arXiv (Cornell University). [CrossRef]
- Tuominen, S. , Reijonen, H., Nagy, G., Buratti, A., & Laukkanen, T. (2022). Customer-centric.
- strategy driving innovativeness and business growth in international markets. International Marketing Review, 40(3), 479-496.
- Urdea, A.-M. , & Constantin, C. (2021). Exploring the impact of customer experience.
- on customer loyalty in e-commerce. Proceedings of the... International Conference on Business Excellence, 15(1), 672. [CrossRef]
- Villacé-Molinero, T. , Reinares-Lara, P., & Lara, E. M. R. (2016). Multi-Vendor Loyalty.
- Programs: Influencing Customer Behavioral Loyalty? Frontiers in Psychology, 7. [CrossRef]
- Voorhees, C. M., McCall, M., & Carroll, B. (2014). Assessing the Benefits of Reward.
- Programs: A Recommended Approach and Case Study from the Lodging Industry. https://scholarship.sha.cornell.edu/chrpubs/157/.
- Voorhees, C. M. , McCall, M., & Carroll, B. (2014). Assessing the Benefits of Reward.
- Programs: A Recommended Approach and Case Study from the Lodging Industry. https://scholarship.sha.cornell.edu/chrpubs/157/.
- Voorhees, C. M. , White, R. C., McCall, M., & Randhawa, P. (2015). Fool’s Gold?
- Assessing the Impact of the Value of Airline Loyalty Programs on Brand Equity Perceptions and Share of Wallet. Cornell Hospitality Quarterly, 56(2), 202. [CrossRef]
- Wait, M. , & Lekhuleni, N. (2020). Exploring factors that determine effective fuel.
- loyalty programmes in South Africa, an emerging economy. Cogent Business & Management, 7(1), 1793522. [CrossRef]
- Wang, J. , & Jin, F. (2022). Power and variety-seeking: A compensatory perspective.
- Frontiers in Psychology, 13. [CrossRef]
- Wang, X. , Liu, T., & Miao, J. (2019). A Deep Probabilistic Model for Customer Lifetime.
- Value Prediction. arXiv (Cornell University). [CrossRef]
- Wilson, N. (2021). The Effect of Brand Image, Website Quality, and Trust Towards.
- Customer Loyalty in the Indonesian Consumer-to-Consumer (C2C) E-Commerce Business. In Advances in economics, business and management research/Advances in Economics, Business and Management Research. Atlantis Press. [CrossRef]
- Wirtz, J. , Mattila, A. S., & Lwin, M. O. (2007). How Effective Are Loyalty Reward.
- Programs in Driving Share of Wallet? Journal of Service Research, 9(4), 327. [CrossRef]
- Woolley, K. , & Fishbach, A. (2016). For the Fun of It: Harnessing Immediate Rewards.
- to Increase Persistence in Long-Term Goals. Journal of Consumer Research, 42(6), 952. [CrossRef]
- Xiong, L. , King, C., & Hu, C. (2014). Where is the love? International Journal of.
- Contemporary Hospitality Management, 26(4), 572. [CrossRef]
- Yang, M. X. , Chan, H., Yu, I. Y., & Fock, H. (2019). Consumer Motivation for Reward.
- Pursuit: A Culture-Based and Progress-Based Model of Loyalty Program Effectiveness. In Journal of Global Marketing (Vol. 32, Issue 4, p. 255). Taylor & Francis. [CrossRef]
- Yang, M. X. , Chan, H., Yu, I. Y., & Fock, H. (2019). Consumer Motivation for Reward.
- Pursuit: A Culture-Based and Progress-Based Model of Loyalty Program Effectiveness. Journal of Global Marketing, 32(4), 255. [CrossRef]
- Yoo, M. , Berezan, O., & Krishen, A. S. (2018). Do members want the bells and.
- whistles? Understanding the effect of direct and partner benefits in hotel loyalty programs. Journal of Travel & Tourism Marketing, 35(8), 1058. [CrossRef]
- Yusof, J. Mohd., Ahmad, N., Ariffin, S., & Mohid, F. M. M. (2018). Examining the Effects.
- of Service Performance, Hotel Attributes and Experiential Quality on Brand Loyalty: The Case of Hotel Impiana Morib. International Journal of Academic Research in Business and Social Sciences, 8(11). [CrossRef]
- Zavalishchin, D. (2021). Optimal loyalty program management. AIP Conference.
- Proceedings, 2343, 40002. [CrossRef]
- Zou, L. , Oum, T. H., & Yu, C. (2010). Assessing the price effects of airline alliances on.
- complementary routes. Transportation Research Part E Logistics and Transportation Review, 47(3), 315. [CrossRef]
- Σταθοπούλου, A. , & Balabanis, G. (2016). The effects of loyalty programs on customer.
- satisfaction, trust, and loyalty toward high- and low-end fashion retailers. In Journal of Business Research (Vol. 69, Issue 12, p. 5801). Elsevier BV. [CrossRef]
Disclaimer/Publisher’s Note: The statements, opinions and data contained in all publications are solely those of the individual author(s) and contributor(s) and not of MDPI and/or the editor(s). MDPI and/or the editor(s) disclaim responsibility for any injury to people or property resulting from any ideas, methods, instructions or products referred to in the content. |
© 2025 by the authors. Licensee MDPI, Basel, Switzerland. This article is an open access article distributed under the terms and conditions of the Creative Commons Attribution (CC BY) license (http://creativecommons.org/licenses/by/4.0/).
Copyright: This open access article is published under a Creative Commons CC BY 4.0 license, which permit the free download, distribution, and reuse, provided that the author and preprint are cited in any reuse.


