
Submitted:
18 December 2023
Posted:
26 December 2023
You are already at the latest version
Preprints on COVID-19 and SARS-CoV-2
Abstract
Customer satisfaction is the process of reaching a customer's expectations to generate delightful experiences with a product or a brand. Delight involves delivering an unforgettable experience to users by focusing on their requirements, desires, and interests. Delighting Customers is crucial for organizations’ economic growth worldwide, especially in the airline industry. This study aims to determine if safety measures, ticketing policies, and the cost of air travel impact among the airline passengers’ satisfaction post-COVID-19 in Malaysia. A research framework is designed to present an in-depth understanding of the mentioned variables. In this study, a comprehensive survey using online questionnaire was used and 388 valid responses were obtained from airline passengers in Malaysia. Data were analyzed by employing data reduction technique and multivariate data analysis. The results revealed that safety appears to be the most essential aspect of airline customer satisfaction among Malaysians, while cost is perceived as a significant factor. Moreover, as the cost of living rose because of the pandemic, many of the income earners in the lower category are less inclined to take vacations. In a nutshell, the study recommends that airlines implement a conscious practice that contributes to the happiness of passengers, which in turn increases profitability and ensures sustainable growth of the airlines.
Keywords:
corporate sustainability
; covid-19
; customer satisfaction
; consumer behavior
; delighting customers
; sustainable growth
1. Introduction
Customer satisfaction encompasses cravings, information gathering, decision-making, and experience according to [1]. [2] confirms that it is a crucial factor in gauging customer loyalty and corporate profitability. Happy customers are more likely to continuously engage in organizations and this can generate future profits. A company's ultimate goal is customer happiness, which can be achieved through satisfaction with the product or service according to [3].
[4] states that customers desire a consistent experience, but satisfaction is an after-choice evaluative judgment based on the purchase conditions. [2] found that 40% of participants in his study want products that make their lives easier, 36% want simple to use products, 25% want products related to families and small households, and 25% desire custom-made products. [5] argue that customers also seek value-based items at the highest price, as well as products or services that provide physical or mental stimulation or reward throughout the purchasing experience. Satisfaction with a purchase can also be defined as an experience based on encounter or usage of a particular service [6], that results in customer loyalty [7], repeat purchases, positive word-of-mouth [8] and ultimately, greater accomplishments and profitability [9]. [6] defines it as a dynamic experience in the service industry that is comparable to evaluation of customer experience. Customers establish product or service criteria, which become the standard prior to a transaction.
According to researchers, the global airline industry faces challenges due to rising fuel prices [10], protection premiums, and industry liberalization [11]. As a result, airlines are rethinking strategies and entering new alliances to gain competitive advantage and effective positioning [12]. In the moments following the outbreak of the unanticipated COVID-19 pandemic, the airline industry collapsed [13]. Not only do these factors impede the continued growth of air travel, but they further contribute to a situation in which many airlines struggle to retain customers due to rapid changes in the highly competitive business atmosphere and customers' increased expectations and demands [14]. Even if it involves compromising service quality and customer satisfaction, the current market climate has compelled airlines to focus on cost reductions in order to operate more efficiently [15].
According to [16] a company may be successful if its products and services meet consumer expectations. Moreover, the environment in which the business operates may have an emotional effect on consumers, causing them to maintain or discontinue purchasing from the company [6]. In this case, management just has to be aware of their surroundings and cultivate a pleasurable atmosphere for their customers, which would ultimately result in customer satisfaction [17]. [18] contends that consumer satisfaction is an unreliable indicator of future behavior. Customer satisfaction is a highly personal choice regarding branding and strategy in general, even if it is business-related [19]. According to a survey conducted by [20], there is no significant difference between age or gender in terms of customer satisfaction. Customers would rate their overall service experience based on the value of the flight they purchased, and they would purchase from the same airline again even if they were dissatisfied because they could not determine what else they would receive for the price.
Although there are numerous studies on customer satisfaction, there are contradictory conclusions by various researchers regarding the factors that influence customer satisfaction, as well as a dearth of studies in the post-pandemic era, particularly at the local level. Therefore, the purpose of this investigation is to identify the factors influencing Malaysian customers’ satisfaction in the airline industry post-COVID-19 so that industry participants can comprehend the current environment and take the necessary corrective actions to improve their services. The research questions are: (1) post-COVID-19, will safety measures and ticket policy have an impact on the customer satisfaction of airline passengers, and (2) post-COVID-19, will cost of air travel have an impact on customer satisfaction of airline passengers? This study focuses on a restricted number of variables to achieve its goals. The objective of this study is to determine the effect of safety (controlling measures), ticketing policy, and the cost on airline customer satisfaction among post-Covid 19 Malaysian passengers.
Previous studies on customer satisfaction have primarily focused on the pre-pandemic era, with few studies conducted in the post-pandemic era. However, there is limited studies on Malaysian locations and sectors to better understand customer satisfaction and its characteristics. Previous research studies have primarily focused on price and brand image rather than safety criteria. Customers prioritize price when choosing a carrier, and they view full-service and low-cost airlines similarly. Secondly, the safety measures were followed by ticketing and other issues. However, there is still a gap in the literature on customer satisfaction related to Malaysia's airline sector during the pandemic and post-pandemic eras. This study aims to fill this gap by understanding the impact of ticketing policy, cost (price), and safety (controlling) measures on customer happiness when experiencing services.
2. Review of Literature
2.1. Viewpoints Surrounding Customer Satisfaction
It has been a lengthy debate to determine the scope of customer satisfaction, given that it is the starting point and a component of the affective state [3]. According to [21], satisfaction is an emotional response to buying behaviors. Furthermore, customer fulfilment is a crucial business strategy for maintaining long-term client relationships, and very few businesses can thrive without it. Consistent customer satisfaction is a key indicator of business success [22]. Understanding the nature of consumer satisfaction can help businesses maintain a competitive advantage and increase sales revenue [23]. According to [24], the relationship between price and customer satisfaction may differ considerably between countries. According to an annual statistic on transported passengers, the average annual growth rate in the number of passengers carried by foreign airlines between 2014 and 2018 was 14.1% [25]. For local airlines, allocating services to customers in a manner that maximizes customer satisfaction has always posed a formidable challenge. In order to tackle this issue, most authors advocated a connection between price components and consumer satisfaction [26].
Due to both the restrictions imposed on flights worldwide in various nations and the unwillingness of travelers to engage in air travel, the aviation industry is one of the sectors most severely impacted by the coronavirus outbreak. [27,28]. Since March 2020, the global aviation industry has experienced a 70% to 95% decline in passenger demand. In addition, [29] conducted an empirical study on the satisfaction of air traffic consumers in Croatia, with the results indicating that customers prioritize price and safety when purchasing tickets. In addition, they stress the importance of focusing on customer satisfaction and quality control, as these two factors are directly related to the number of passengers [29]. However, since the emergence of COVID-19, there may be new requirements that affect customer satisfaction. The pandemic of COVID-19, which emerged at the beginning of the year 2020, has altered the factors that shape customer satisfaction to include hygiene and environmental conditions.
Due to the complexity of human behaviour and perception, the concept of customer satisfaction has become a fascinating area of study in a wide range of industries. According to [30] analysis of the landscape in local airlines, customer satisfaction has become a primary concern, particularly when competition is intense, and customers have more bargaining power. Service innovations in Malaysia, especially in the form of low-cost carriers advancing new service business models, have prompted airlines to focus on essential soft marketing concepts such as satisfaction with service, cost, and branding, in lieu of measurable marketing metrics such as growth, revenue, and profits [12]. When it comes to long-distance travel, most consumers prefer air travel due to its adaptability and time efficiency [10]. As a result of the rapid advancements in the competitive business environment, the increasing demands and expectations of customers create a situation in which many businesses in the airline industry struggle to retain their customers [14,15]. The current challenging market atmosphere has compelled airlines to prioritize cost reduction to achieve efficient business operations, even if it means sacrificing service quality and consumer satisfaction. However, airlines must take established standards seriously, as service quality can directly influence behavioral intention and contribute to customer satisfaction.
Customer satisfaction is a crucial marketing metric because it contributes to increased market share, market growth, and market penetration, as well as a profitable customer lifetime value [12]. Satisfaction with a purchase is a socially constructed reaction to the customer's relationship, good or service, and enterprise or business, rather than being firmly rooted in the customer or the product. In this scenario, customer satisfaction can be defined more broadly by perceptions of product quality, service, and pricing, in addition to contextual and personal factors [7]. If a customer's level of satisfaction exceeds their expectations, they will continue to utilize the same product or service, resulting in a high level of satisfaction [31].
2.2. Variables Affecting Customer Satisfaction of the Study
The results of previous studies highlighted above, prove that the various viewpoints have created a gap in a real understanding of the fact that customer satisfaction, the service, safety, and the cost are crucial and have direct correlation with a business's profitability. The customer's urge to engage in transactions that are influenced by product or service’s quality and price precedes the purchase decision [32]. In the post-pandemic world, however, the parameters for customer satisfaction have shifted and the pandemic has made interpersonal communications more difficult.
2.2.1. Ticket Policy
Ticket policy, according to [33], refers to the terms and conditions under which airlines offer ticket options in the form of rescheduling, rerouting, or vouchers in response to certain situations. Ticket refunds are related to the survival of the aviation sector and the tourism sector; when the ticket which has been paid for is refunded to the prospective passenger, cash flow challenges due to high cancelled tickets impact companies in both sectors [34]. IATA estimated that global airlines owe prospective passengers approximately $35 billion due to flight cancellations through June 2020. According to an analysis of airline ticket refund and change rates in China, the refund and change rates between January and May 2020 were substantially higher than the same period in 2019, with the highest refund and change rates occurring in February 2020 [34]. According to [33], passengers with purchased tickets may incur losses because of ticket refunds in the form of vouchers that not all passengers want to use.
[35] discovered that allowing passengers to rebook if they prefer a flight with less capacity is one of the factors that increase passenger confidence in using airlines. According to [36], different event providers offer various refund mechanisms, such as automatic refunds for cancelled events, notification that rescheduled tickets are valid for the new date, and varying refund request deadlines. [33] stated that COVID-19 restrictions have severely impacted the air transportation sector, leading to the cancellation of many airline tickets for passengers. Over 70% of passengers expressed a desire to exchange tickets for future events or receive credit. Passengers' ticketing concerns remain unresolved, with a lower proportion of middle-aged, elderly, and children traveling. [34], suggest that airlines focus on adjusting and fostering travel confidence to improve ticketing practices.
The study by [36] also found that unfair ticket policies led to negative press coverage and legal actions against companies. In Malaysia's context, the local pandemic rebound has had a significant impact on refunds and ticket changes, posing a greater risk for airlines. In a normalized scenario, airlines should have plans for refunds and changes. Based on the mentioned literature review, the hypothesis proposed for the study is:
Hypothesis 1.
Ticket policy has no influence on airline customer satisfaction in Malaysia post-COVID-19.
2.2.2. Safety Measures
According to [37], airlines implemented safety measures to reduce risks during the COVID-19 pandemic. Enclosed spaces in airline transport pose a risk of spreading the virus, causing social and economic effects. Consumers seek private transportation, affecting airline transportation. [35] found that factors affecting passenger willingness to fly during the pandemic include perceived threat, agreeableness, affect, and fear. Wearing masks and infection precautions are effective in influencing passenger perceptions. Airlines can alleviate passenger distrust by providing reliable information on flight loads, seat allocation, frequent flyer points, upgrades, and safety issues.
The air traffic industry has been closely linked to past pandemics like SARS-associated coronavirus (SARS-CoV) and Middle East respiratory syndrome coronavirus (MERS-CoV), affecting both regional and global scales. Airlines must ensure passenger safety and health during these challenging times, as the COVID-19 pandemic has significantly impacted the industry. Studies by [38] show that perceived safety positively impacts overall satisfaction, with passengers highly satisfied with public transport when they perceive more safety. [39] found five measures relevant to Korean Airlines passengers which are COVID-19 prevalence, self-isolation requirements, destination conditions, social atmosphere, and aviation preventative measures. Social distancing, a controversial measure, has been discussed for its benefits in reducing coronavirus spread and potentially impacting mental health and emotional wellbeing. All other related studies concluded that practicing social distancing on airplanes can ensure passengers' health and safety during the COVID-19 outbreak.
Airlines have implemented a multi-pronged approach to prevent COVID-19 transmission, including improved gate ventilation, boarding, and disembarking strategies, enhanced aircraft disinfection, and pre-flight screening. These measures aim to manage the stigma associated with the virus, which stems from factors like misinformation, insecurity, fear of responsibility, administrative malfunction, and lack of trust in treatment. Consumer preferences have an impact on a product's or service's profitability [40]. Hence, this study proposes a second hypothesis:
Hypothesis 2.
Safety measures has no influence on airline customer satisfaction in Malaysia post-COVID 19.
2.2.3. Cost
Price represents the agreement between the parties, and it is the value consumers exchange for a product or services. Price is also referred to as the cost incurred by a consumer’s procurement or experience with that purchase. It influences customers' perceptions of the transaction's value, usefulness, and happiness. The study by [30] show that lower prices or savings lead to customers recognizing a service as more convenient. [41] highlight that pricing and promotion significantly impact customer preference, financial compensation, and loyalty. Price satisfaction influences buyer actions and loyalty, while perceived value and willingness to pay a price premium determine the buyer's willingness to pay for extra characteristics. Competitive pricing influences customer decisions, influencing their purchasing decisions based on perceived price levels rather than true value, and considering price-weighted factors [42]. Pricing measures product quality and influences customer loyalty [43]. High prices are considered low, while low prices are considered low. Final pricing positively impacts customer loyalty and has an intermediate role in buying behavior and customer happiness according to [44]. A study by [45] found that price, cultural, societal factors, brand image, and trust significantly impact purchasing decisions. Different customers perceive pricing differently, making them more susceptible to price volatility and unable to accept high-priced items.
Cost is typically the expense incurred in the production of a product or service that a business sell. It refers to the quantity of money a customer is willing to pay for a good or service according to [1]. The production cost of airline services has a direct effect on both the service's price and its profit margin. In an airline's case, a cost-based pricing strategy may determine the selling prices of its services based on their production costs, whereas a value-based pricing strategy demands the price of the service based on its perceived value to the passengers. Therefore, the study considers the cost paid by passengers as an essential overall variable. The third hypothesis proposed for this study is:
Hypothesis 3.
Cost has no influence on airline customer satisfaction in Malaysia post-COVID-19.
2.3. Kano Model of Customer Satisfaction
[46] describe the Kano Model as a concept for product creation and consumer satisfaction. Kano model, also known as an attractive quality theory, has five dimensions of quality, based on the relationship between the degree of validity of a particular quality attribute on the horizontal axis and customer satisfaction with that quality attribute on the vertical axis. The quality and customer satisfaction of a product or service are multidimensional. Figure 1 illustrates the Kano Model.
[47] confirm the Kano Model is crucial for tying product, service, price, and service quality in relation to industrial performance. It helps identify customer satisfaction and dissatisfaction by comparing perceived and expected quality [46]. Consistent service and product quality have a significant impact on overall customer satisfaction, while fluctuations in service and product performance have a symmetrical impact. Product and service variables are considered important quality factors due to their impact on customer satisfaction.
2.4. Framework of the Study
Considering the above, Figure 2 shows the conceptual framework of the study. The framework is designed to examine the relationship between ticketing policy, safety measures, and cost with airline customer satisfaction in Malaysia post-COVID 19.
3. Materials and Methods
3.1. Materials
Malaysia's air passenger count reached 8.7 million in the first quarter of 2022, an increase from 7 million in the first quarter of 2020, reflecting a slow increase after the COVID-19 pandemic's impact. The survey was done to 450 randomly selected individuals, with the unit of analysis being individuals, as airline travelers in Malaysia are the focus. The questionnaires were delivered to 550 selected participants through WhatsApp and emails, from which 388 valid responses were received. Thus, the survey generated a 70.5% response rate. The hypotheses were tested using multiple regression analysis for the influence of independent variables on the dependent variable.
3.2. Participants
Table 1 presents a descriptive analysis of all respondents to this study, including their gender, age group, income group, mode of air travel, and destination. [48] agreed with [49] sample size calculations, as it exceeds the suggested sample size of 384 and is sufficient to generate statistically valid results.
The demographic analysis shows a nearly even gender distribution with 201 respondents being female (51.8%) and 187 male (48.1%). Most respondents are between 31 and 40 years old, with 129 respondents contributing 33.2% of the total number. Many respondents earn between RM3,001-7000, with 97 respondents earning below RM3,000 and 91 respondents earning above RM10,000. The least number of respondents are from the RM7,001-RM10,000 income group. The questionnaire also includes the number of respondents who have traveled by air after April 1st, 2022, with 235 (60.6%) responding "Yes" and 153 (39.4%) not yet traveling. Most respondents are domestic-bound travelers, followed by both domestic and international travelers.
4. Results
The study utilized multiple linear regression data analysis to comprehend the relationship between several quantitative variables. This can be accomplished by observing the variables in a scatter plot and quantifying the association's strength with correlation analysis. The multiple regression model has been pursued by researchers since empirical and theoretical associations have been established. The resulting model is used to predict the value of customer satisfaction (the outcome) based on the values of the ticketing policy, safety measures, and costs (the predictors) in the model.
4.1. Measurement Instrument Validation
Exploratory Factor Analysis (EFA) was performed to group variables with similar characteristics or to explain variance in observed variables in terms of latent factors [50]. Factor analysis was used to reveal the underlying factors in customer satisfaction among airline passengers.
This study uses Kaiser-Meyer-Olkin (KMO) and Bartlett's Test of Sphericity to determine whether the samples are sufficient and whether the data is suitable for factor analysis. Acceptable KMO values exceed 0.6 [51]. [52] stated that the significance level of Bartlett's test for sphericity must be less than 0.05 in order for the factor analysis to be suitable for further study. Table 2 demonstrates that the Kaiser-Meyer-Olkin Measure of Sampling Adequacy is 0.86 (greater than 0.6) and the significance of Bartlett's Test of Sphericity is 0.000 (less than 0.05), indicating the adequacy of this survey as well as the good construct validity of the scale and significant correlations.
Table 3 depicts communalities ranging between 0.583 and 0.897. Principal components analysis in data extraction was performed in this study for three factors, which are safety, ticket policy, price, and customer satisfaction towards airlines, with an eigenvalue greater than 1.0 and a total variance explained of above 69 percent (Table 4). Eigenvalues greater than 1.0 are deemed significant, and total variances greater than 60 percent are deemed acceptable [51].
Table 4 results demonstrated that the extracted factors explain a predetermined amount of variance; consequently, it can be concluded that the questionnaire's content validity is suitable for further analysis.
Table 5 demonstrates that the independent variables (safety, cost, ticket policy) and dependent variable (customer satisfaction) are internally consistent and reliable, as their Cronbach's Alpha values are greater than 0.70. Overall, when all variables (18 items) were combined, it was determined to have excellent consistency (Cronbach's Alpha = 0.868), indicating that all 18 items guarantee data reliability.
4.2. Hypotheses Testing
A multiple linear regression analysis was employed to evaluate the three hypotheses and determine if they were rejected or accepted, as well as to establish the relationship between both independent and dependent variables.
Table 6, the regression model showed that the variables safety, ticketing policy and cost explained 33.02% of the variance from the variable customer satisfaction.
An ANOVA was used to test whether this value was significantly different from zero. As shown in Table 7, using the present sample, it was found that the effect was significantly different from zero, F = 63.09, p ≤ 0.001, R2 = 0.33. Nonetheless, this also suggests that further 67 percent of airline consumer satisfaction among post-COVID 19 Malaysians can be attributed to factors that are not being investigated. According to Zikmund et al. (2013), residuals are not correlated if the Durbin-Watson statistic falls between 1.5 and 2.5, and the Durbin-Watson value in this study was 1.586, which falls within the acceptable range. Beta coefficient is used to determine the extent to which each predictor influences the outcome if the effects of all other predictors are held constant; a positive beta coefficient indicates that for each unit increase in the independent variable, the dependent variable will increase by the beta coefficient value [53].
According to the results in Table 8, safety has the greatest impact on airline consumer satisfaction, followed by cost. In contrast, there is no significant relationship between ticket policy and airline customer satisfaction. Safety can account for 47.5 percent of the variance in customer satisfaction, whereas cost can account for only 17.7 percent. Also, the tolerance value for all three independent variables was found to be greater than 0.1, and the VIF values were found to be less than 10, so it can be concluded that there is no multicollinearity within the data.
Figure 3 depicts the results of the model of the study using multiple regression analysis. [54] uses the multiple regression formula in the analysis of relationships between dependent and multiple independent variables, and the formula is represented by the equation:
where, Y is the dependent variable, X1, X2 ,… Xk are the k independent variables, ε is the error term and β0, β1 , β2 ,…, βk are the regression coefficients.
Y = β0 + β1X1 + β2X2 + … + βpXk + ε
Based on the Table 8, the multiple regression equation is:
Customer Satisfaction = 1.021 + 0.561 (SM) + 0.147 (C)
Thus, for every unit increase in safety, customer satisfaction will increase by 0.561, provided the customer’s cost of air travel and ticketing policy remain unchanged. Similarly, for every unit increase in the cost, customer satisfaction will go up by 0.147 units provided the airline maintains the same safety measures. The multiple regression result shows that the safety and cost predictor variables are statistically significant because its p-values equal 0.000. On the other hand, ticketing policy is not statistically significant because its p-value (0.541) is more than the usual significance level of 0.05. Thus, following the standard practice, this ticketing policy variable has been removed from the equation model for the model’s precision.
5. Discussion
This research aims to determine if there is a significant and positive relationship between airline consumer satisfaction and safety, ticket policy, and cost of air traveling among post-COVID 19 Malaysian passengers. The conceptual framework is developed as a result of a thorough literature review. Three hypotheses were devised to address the research questions and objectives. Below are the discussions in nutshell: H1: Ticket policy has no influence on airline customer satisfaction in Malaysia post-COVID-19. Results show that p-value is 0.541 (p = 0.05) and beta value is 0.028. Among Malaysian Post-COVID 19 participants, the ticket policy was found to have a negative relationship with consumer satisfaction. As shown in Figure 3, therefore, it can be concluded that there is no significant relationship between ticket policy and airline passenger satisfaction, despite the existence of a positive relationship. Consequently, null hypothesis 1 is accepted. Customers do not perceive ticket policy as a factor in their satisfaction, as evidenced by the survey. The fact that most respondents (75%) earn more than RM 3,001 also contributes to this result. They may view the current ticketing policy as reasonable and be able to afford any ticket-related penalties or modifications.
H2: Safety measures has no influence on airline customer satisfaction in Malaysia post-COVID 19. Results show that p-value is < 0.001 (p<0.05s) and the beta value is 0.561. As shown in Figure 3, therefore, it can be determined that there is a significant relationship between airline safety and customer satisfaction among post-COVID 19 Malaysians. Therefore, the null hypothesis 2 is rejected. Evidentially, safety appears to be the most essential aspect of airline customer satisfaction, while cost is perceived as a significant factor.
H3: Cost has no influence on airline customer satisfaction in Malaysia post-COVID-19. Results shows that p-value is <0.001 (p<0.05) and beta value is 0.147. As shown in Figure 3, Cost is shown to have a significant positive relationship with airline consumer satisfaction among Malaysian Post-COVID 19 respondents. Therefore, null hypothesis 3 is rejected. One of the contributing factors is that more than half (58%) of respondents earn less than RM 7,001, which and costly flights will discourage them from travelling. Moreover, as the cost of living rises because of the pandemic, many of the income earners in this category may be less inclined to take vacations.
This study has answered both research questions and accomplished its goals and objectives. Results of the analysis revealed that safety measures, ticket policy, and cost have an impact on the satisfaction of airline customers post-COVID-19 in Malaysia. This study contains a few limitations. The findings and results may not be applicable to all industries in general, as data was collected only from Malaysian passengers, and the research may not be representative of all passengers around the globe, as data collection was conducted only in Malaysia. Only an online questionnaire is used to collect data for this study, which may compromise the commitment of respondents. Due to varying interpretations of the questions, there is a chance that respondents may fail to respond to the questionnaire truthfully and will do so abruptly without due consideration. In order to improve our understanding of airline customers' satisfaction post COVID-19 and to gain a deeper comprehension of their needs, the questionnaire design for future research may be improved. The data may be obtained through interviews with respondents. In addition, future research may be conducted on other variables not addressed in this study, as this will provide a clearer picture of the primary factors influencing airline customers' satisfaction in Malaysia after COVID 19.
Author Contributions
Dwi Suhartanto conceived the idea for the manuscript, and Arasu Raman and Mohd Hareez wrote the manuscript. Arasu Raman done publication funding acquisition. All authors have read and agreed to the published version of the manuscript.
Funding
This research received no external funding. The publication charges for this manuscript are funded by the Research Management Centre, INTI International University.
Informed Consent Statement
Informed consent was obtained from all subjects involved in the study and they were informed that they were free to choose not to participate in the research.
Data Availability Statement
Data are contained within the manuscript.
Acknowledgments
The authors would like to thank the research assistants for their administrative and technical support during the data collection phase.
Conflicts of Interest
The authors declare no conflict of interest. The funders had no role in the design of the study; in the collection, analyses, or interpretation of data; in the writing of the manuscript; or in the decision to publish the results.
References
- Kotler, P.; Keller, K.; Brady, M.; Goodman, M.; Hansen, T. Marketing Management; Pearson UK, 2019.
- Masojada, M. #BizTrends2018: What is shaping grocery retail in South Africa - Part 1 http://www.bizcommunity.com/Article/196/731/172117.html.
- Ilmi, Z.; Darma, D. C. Can SERVQUAL Mediate from The Store Atmosphere and Customer Satisfaction? Management Theory and Studies for Rural Business and Infrastructure Development 2020, 42 (3), 359–368. [CrossRef]
- McCamley, C. 5 ways bricks-and-mortar shops can survive the onslaught of e-commerce https://www.bizcommunity.com/Article/196/182/180075.html.
- Customer Satisfaction and Customer Loyalty in the Post-Crisis Banking Sector of Ghana. Journal of Marketing and Consumer Research 2021. [CrossRef]
- Özkan, P.; Süer, S.; Keser, İ. K.; Kocakoç, İ. D. The Effect of Service Quality and Customer Satisfaction on Customer Loyalty. International Journal of Bank Marketing 2019, 38 (2), 384–405. [CrossRef]
- Chicu, D.; Pàmies, M. del M.; Ryan, G.; Cross, C. Exploring the Influence of the Human Factor on Customer Satisfaction in Call Centres. BRQ Business Research Quarterly 2019, 22 (2), 83–95. [CrossRef]
- Bramanti, G. W.; Wibawa, B. M.; Aulia, M. F. The Effect Of Retail Shop Format on Customer Relationship and Customer Loyalty With Customer Trust as Mediation Variables (Case Study : Make Over Retail Stores in Surabaya). Procedia Business and Financial Technology 2021, 1. [CrossRef]
- Moorthy, K.; Chun T’ing, L.; Ai Na, S.; Tze Ching, C.; Yuin Loong, L.; Sze Xian, L.; Wei Ling, T. Corporate Image No Longer Leads to Customer Satisfaction and Loyalty: A Malaysian Perspective. International Journal of Law and Management 2018, 60 (4), 934–952. [CrossRef]
- Farooq, M. S.; Salam, M.; Fayolle, A.; Jaafar, N.; Ayupp, K. Impact of Service Quality on Customer Satisfaction in Malaysia Airlines: A PLS-SEM Approach. Journal of Air Transport Management 2018, 67, 169–180. [CrossRef]
- Homsombat, W.; Lei, Z.; Fu, X. Competitive Effects of the Airlines-within-Airlines Strategy – Pricing and Route Entry Patterns. Transportation Research Part E: Logistics and Transportation Review 2014, 63, 1–16. [CrossRef]
- The Influence of Perceived Service Quality towards Customer Satisfaction and Loyalty in Airasia Self Check-in System. The Journal of Social Sciences Research 2018, No. SPI 2, 766–775. [CrossRef]
- González-Rodríguez, M. R.; Díaz-Fernández, M. C.; Font, X. Factors Influencing Willingness of Customers of Environmentally Friendly Hotels to Pay a Price Premium. International Journal of Contemporary Hospitality Management 2020, 32 (1), 60–80. [CrossRef]
- Lekobane, K. R.; Selelo, G. B. Effects of Service Quality on Customers Satisfaction on Botswana’s Mobile Telecommunications Industry. Archives of Business Research 2017, 5 (3). [CrossRef]
- Service Quality, Brand Image and Customer Satisfaction Influence Loyalty (Study on Citilink Airline Passengers). European Journal of Business and Management 2019. [CrossRef]
- Akeem Musari, A.; Folasayo Ayo, M. Product Branding on the Effectiveness and Performance of Manufacturing Industry. Business Management and Strategy 2019, 10 (2), 181. [CrossRef]
- Tanisah, T.; Maftukhah, I. The Effects of Service Quality, Customer Satisfaction, Trust, and Perceived Value Towards Customer Loyalty. Jurnal Dinamika Manajemen 2015, 6 (1). [CrossRef]
- Han, S.; Anderson, C. K. The Dynamic Customer Engagement Behaviors in the Customer Satisfaction Survey. Decision Support Systems 2022, 154, 113708. [CrossRef]
- Management & Leadership https://www.thebalancecareers.com/managementissues-surrounding-customer-satisfaction-2275735.
- SS, M. Determining Shopping Malls Customers’ Satisfaction and Loyalty. Journal of Business & Retail Management Research 2018, 13 (01). [CrossRef]
- Bae, S.; Jung, T. H.; Moorhouse, N.; Suh, M.; Kwon, O. The Influence of Mixed Reality on Satisfaction and Brand Loyalty in Cultural Heritage Attractions: A Brand Equity Perspective. Sustainability 2020, 12 (7), 2956. [CrossRef]
- Komalasari, F. P.; Budiman, S. F. Customer Retention Strategy Through Customer Satisfaction and Customer Loyalty: The Study on Traveloka Loyalty Program. TRJ Tourism Research Journal 2018, 2 (1), 69. [CrossRef]
- Parmar, H. Factors Affecting Customer Satisfaction for Organized Retail Store in Surat City. Asian Journal of Research in Marketing 2018, 7 (3), 1. [CrossRef]
- Murti, A.; Deshpande, A.; Srivastava, N. Patient Satisfaction and Consumer Behavioural Intentions. Journal of Health Management 2013, 15 (4), 549–577. [CrossRef]
- Al-Shukaili, A.; Al-Maniri, A. Writing a Research Proposal to The Research Council of Oman. Oman Medical Journal 2017, 32 (3), 180–188. [CrossRef]
- Ali, F.; Dey, B. L.; Filieri, R. An Assessment of Service Quality and Resulting Customer Satisfaction in Pakistan International Airlines. International Journal of Quality & Reliability Management 2015, 32 (5), 486–502. [CrossRef]
- Naletina, D.; Petljak, K.; Sremac, M. Characteristics and the Overview of Air Traffic in the Republic of Croatia. Pomorstvo 2018, 32 (2), 297–311. [CrossRef]
- Burns, J.; Movsisyan, A.; Stratil, J. M.; Coenen, M.; Emmert-Fees, K. M.; Geffert, K.; Hoffmann, S.; Horstick, O.; Laxy, M.; Pfadenhauer, L. M.; von Philipsborn, P.; Sell, K.; Voss, S.; Rehfuess, E. Travel-Related Control Measures to Contain the COVID-19 Pandemic: A Rapid Review. Cochrane Database of Systematic Reviews 2020. [CrossRef]
- Naletina, D.; Petljak, K.; Sremac, M. Empirical Research on User Satisfaction with the Transport and the Supporting Services at Croatian Airports. Pomorstvo 2019, 33 (1), 92–101. [CrossRef]
- Mohammed, R.; Murova, O. The Effect of Price Reduction on Consumer’s Buying Behavior in the U.S. Differentiated Yogurt Market. Applied Economics and Finance 2019, 6 (2), 32. [CrossRef]
- Maisarah, N.; Kee, D. M. H.; Syakirah, N.; Hanif, M. A.; Bella, A.; Pandey, R.; Almuhaini, R. F.; Quttainah, M. A. Customer Satisfaction Towards Service Quality: A Study of Malindo Air. International Journal of Tourism and Hospitality in Asia Pasific 2020, 3 (3), 40–51. [CrossRef]
- Arnaud Costinot; Stephen Martin. Price Effect on Consumer Buying Interest With Customer Satisfaction As Intervening Variables (Case Study of Community Users of Health Facilities in the United States). MEDALION JOURNAL: Medical Research, Nursing, Health and Midwife Participation 2021, 2 (3), 86–108. [CrossRef]
- Wahyuni, S.; Esther Masri; Sufiarina. The Problems of Cancellation of Aircraft Tickets During the Covid-19 Pandemic from The Point of View of Consumer Protection in Indonesia and in the European Union. KRTHA BHAYANGKARA 2022, 16 (1), 81–88. [CrossRef]
- Zhang, L.; Yang, H.; Wang, K.; Bian, L.; Zhang, X. The Impact of COVID-19 on Airline Passenger Travel Behavior: An Exploratory Analysis on the Chinese Aviation Market. Journal of Air Transport Management 2021, 95, 102084. [CrossRef]
- Lamb, T. L.; Ruskin, K. J.; Rice, S.; Khorassani, L.; Winter, S. R.; Truong, D. A Qualitative Analysis of Social and Emotional Perspectives of Airline Passengers during the COVID-19 Pandemic. Journal of Air Transport Management 2021, 94, 102079. [CrossRef]
- Rothschild, P.; Vowels, K.; Rothschild, C. Cancel, Postpone, or Reschedule: The Live Music Industry’s Response to Ticket Refunds During the COVID-19 Pandemic. Journal of the Music and Entertainment Industry Educators Association 2020, 20 (1), 45–83. [CrossRef]
- Naboush, E.; Alnimer, R. Air Carrier’s Liability for the Safety of Passengers during COVID-19 Pandemic. Journal of Air Transport Management 2020, 89, 101896. [CrossRef]
- Dong, H.; Ma, S.; Jia, N.; Tian, J. Understanding Public Transport Satisfaction in Post COVID-19 Pandemic. Transport Policy 2021, 101, 81–88. [CrossRef]
- Salari, M.; Milne, R. J.; Delcea, C.; Kattan, L.; Cotfas, L.-A. Social Distancing in Airplane Seat Assignments. Journal of Air Transport Management 2020, 89, 101915. [CrossRef]
- Wen, E. C. Y.; Hoo, W. C.; Lee, A.; Cheng, A. Y. Mobile Banking Application (App) Adoption Behaviour Amongst Malaysian Consumers. WSEAS TRANSACTIONS ON BUSINESS AND ECONOMICS 2023, 20, 759–769. [CrossRef]
- Melovic, B.; Cirovic, D.; Dudic, B.; Vulic, T. B.; Gregus, M. The Analysis of Marketing Factors Influencing Consumers’ Preferences and Acceptance of Organic Food Products—Recommendations for the Optimization of the Offer in a Developing Market. Foods 2020, 9 (3), 259. [CrossRef]
- Pandey, M.; Kumar, S. The Impact of Psychological Pricing Strategy on Consumers’ Buying Behaviour: A Qualitative Study. International Journal of Business and Systems Research 2017, 11 (1/2), 101. [CrossRef]
- Hidayat, A.; Adanti, A. P.; Darmawan, A.; Setyaning, A. N. A. Factors Influencing Indonesian Customer Satisfaction and Customer Loyalty in Local Fast-Food Restaurant. International Journal of Marketing Studies 2019, 11 (3), 131. [CrossRef]
- Zhao, H.; Yao, X.; Liu, Z.; Yang, Q. Impact of Pricing and Product Information on Consumer Buying Behavior with Customer Satisfaction in a Mediating Role. Frontiers in Psychology 2021, 12. [CrossRef]
- Aslam, W.; Frooghi, R. Switching Behaviour of Young Adults in Cellular Service Industry: An Empirical Study of Pakistan. Global Business Review 2018, 19 (3), 635–649. [CrossRef]
- Dominici, G.; Palumbo, F.; Basile, G. The Drivers of Customer Satisfaction for Academic Library Services: Managerial Hints from an Empirical Study on Two Italian University Libraries Using the Kano Model. International Journal of Management in Education 2015, 9 (3), 267. [CrossRef]
- Dinesh.P; Norida.A; Ali.H.M.R. Customer Satisfaction and Retention Towards Retail Store In Malaysia. International Journal of Human and Technology Interaction 2018, 2 (2), 57–65.
- Chanuan, U.; Kohohnsak, C.; Nittaya, S. Sample Size Estimation Using Yamane and Cochran and Krejcie and Morgan and Green Formulas and Cohen Statistical Power Analysis by G*Power and Comparisons. Apheit International Journal 2021, 10 (2), 76–87.
- Krejcie, R.V.; Morgan, D.W. Determining Sample Size for Research Activities. Educational and psychological measurement 1970, 30 (3), 607–610. [CrossRef]
- Zikmund, W. G.; Babin, B. J.; Griffin, M.; Carr, J. C. Business Research Methods; Cengage Learning, 2010.
- Tabachnick, B. G.; Fidell, L. S.; Ullman, J. B. Using Multivariate Statistics; 2018.
- Cohen, L.; Manion, L.; Morrison, K. Research Methods in Education, 8th ed.; Routledge: London, 2018. [CrossRef]
- Saunders, M. N. K.; Lewis, P. Doing Research in Business and Management; 2017.
- Bougie, R.; Sekaran, U. Research Methods for Business; John Wiley & Sons, 2019.
Figure 1.
Kano Model of Customer Satisfaction.
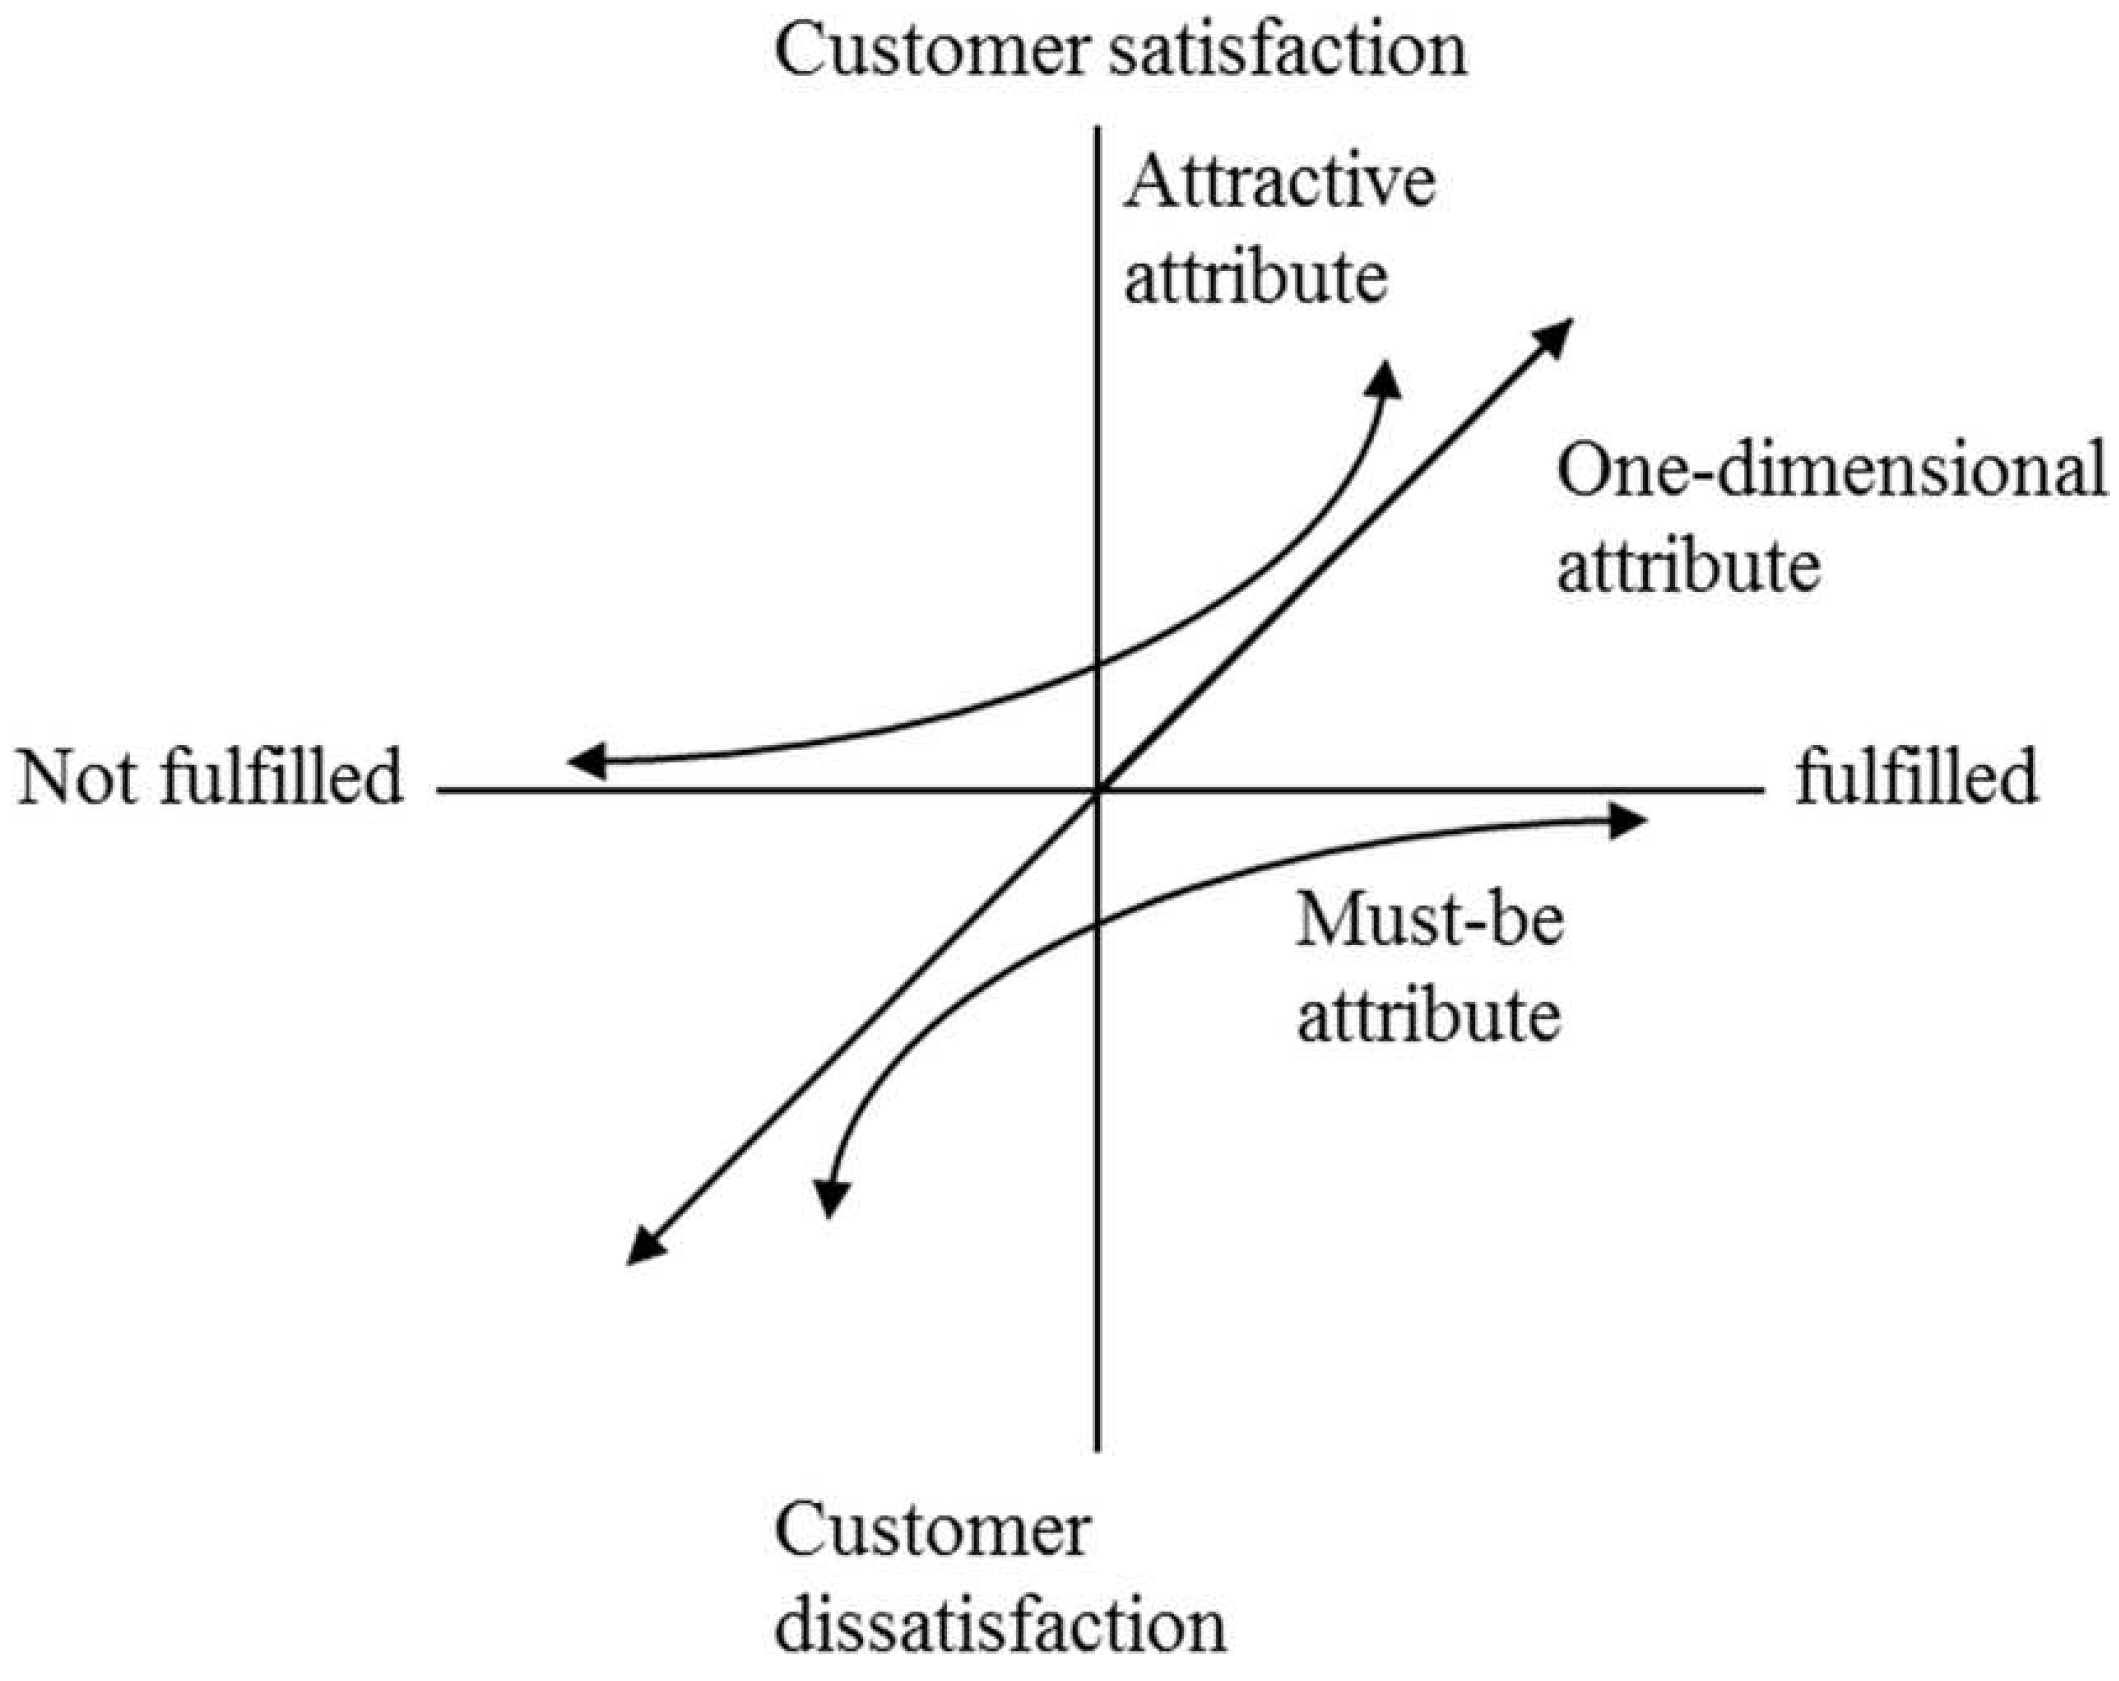
Figure 2.
Conceptual Framework of the Study.
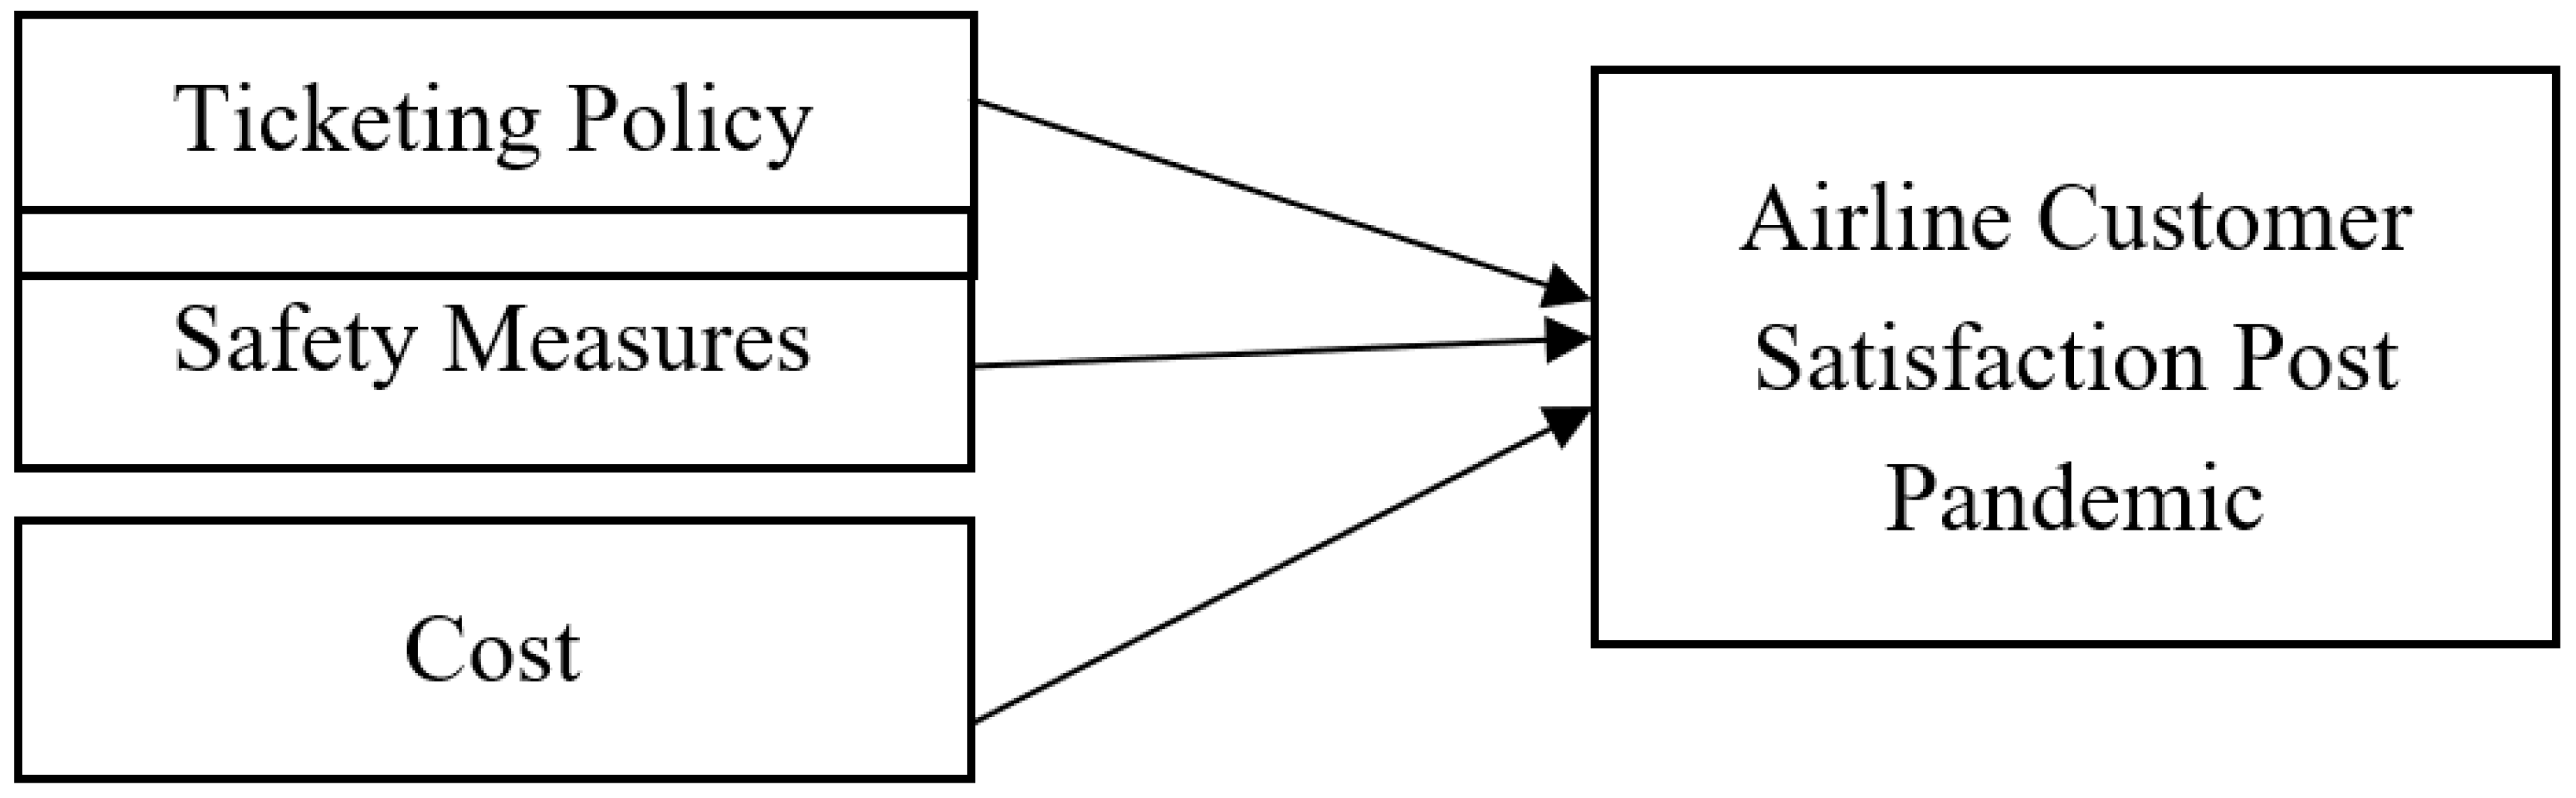
Figure 3.
Multiple Linear Regression Model.
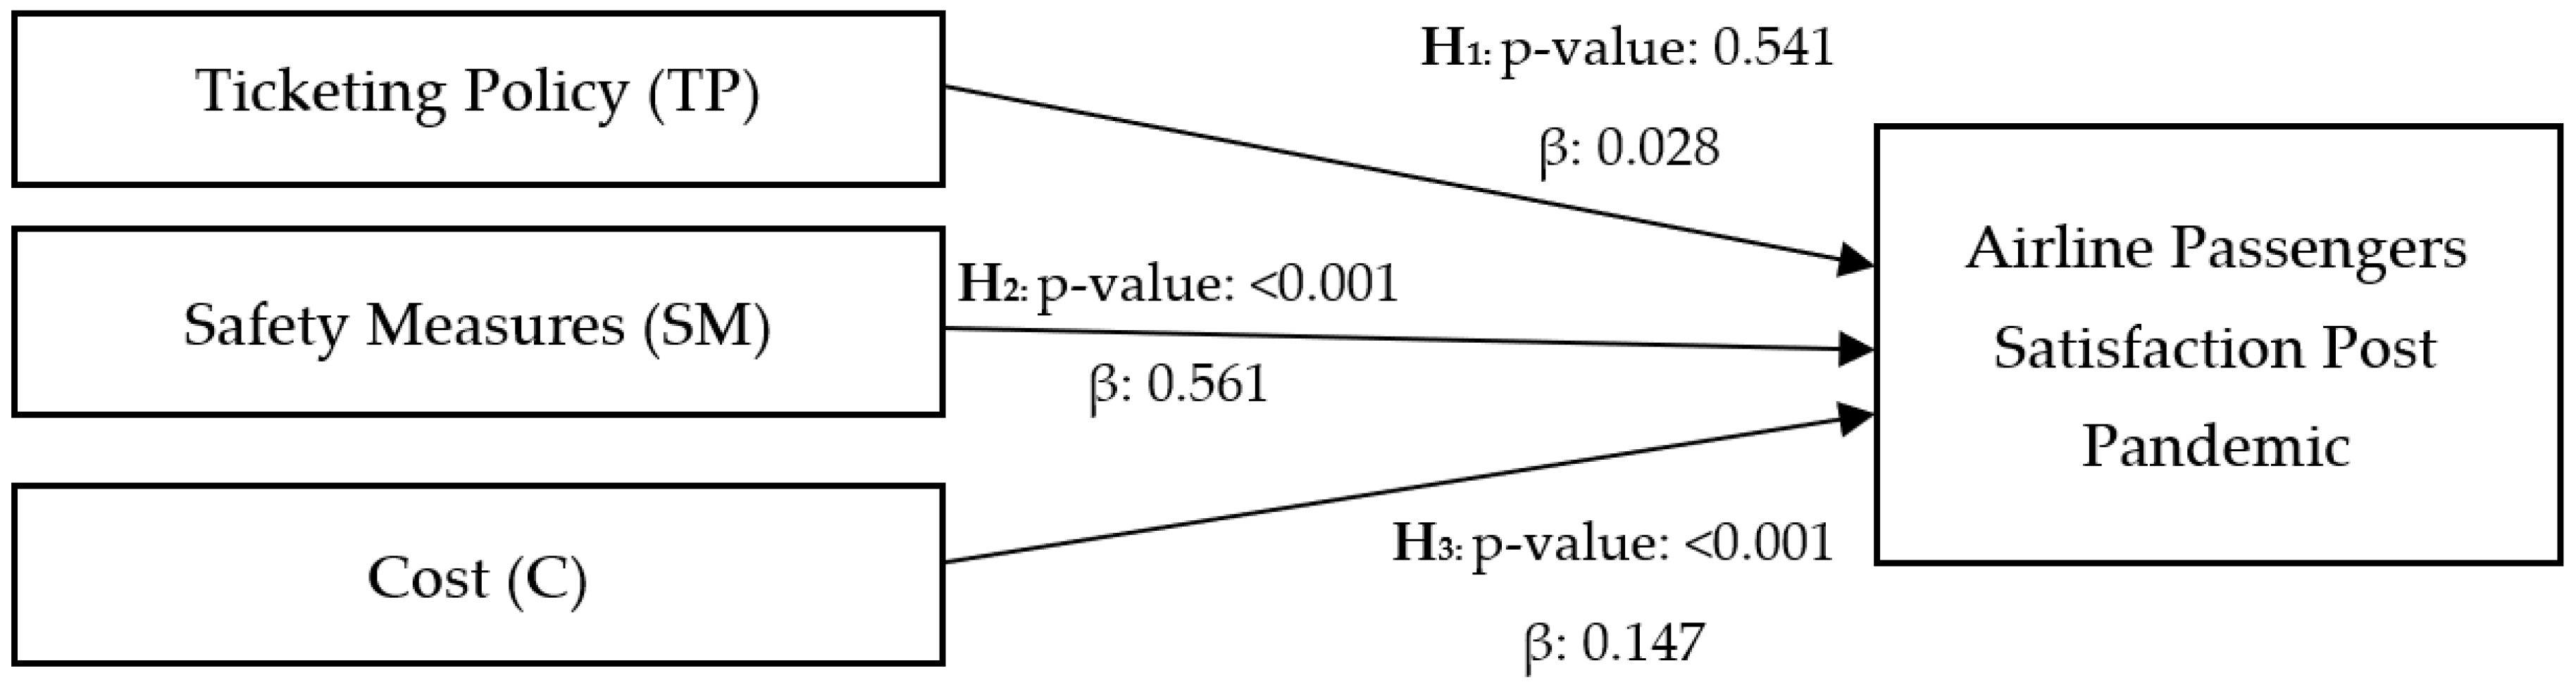

Table 1.
Demographics of the Study.
| Demographic Profile | Frequency | Percent | Valid Percent |
Cumulative Percent | |
|---|---|---|---|---|---|
| Gender | Male | 187 | 48.2 | 48.2 | 48.2 |
| Female | 201 | 51.8 | 51.8 | 100.0 | |
| Age Group | 18-30 | 101 | 26.0 | 26.0 | 26.0 |
| 31-40 | 129 | 33.2 | 33.2 | 59.3 | |
| 41-50 | 79 | 20.4 | 20.4 | 79.6 | |
| Above 51 | 79 | 20.4 | 20.4 | 100.0 | |
| Nationality | Malaysian | 388 | 100.0 | 100.0 | 100.0 |
| Income Group | RM3,000 and below | 97 | 25.0 | 25.0 | 25.0 |
| RM3,001-7,000 | 128 | 33.0 | 33.0 | 58.0 | |
| RM7,001-10,000 | 72 | 18.6 | 18.6 | 76.5 | |
| RM10,001 and above | 91 | 23.5 | 23.5 | 100.0 | |
| Travel by Air Post 1st April 2022 | Yes | 235 | 60.6 | 60.6 | 60.6 |
| No | 153 | 39.4 | 39.4 | 100.0 | |
| Travel Destination | Domestic | 138 | 35.6 | 35.6 | 35.6 |
| International | 46 | 11.9 | 11.9 | 47.4 | |
| Both | 65 | 16.8 | 16.8 | 64.2 | |
| Not Available | 139 | 35.8 | 35.8 | 100.0 | |
Table 2.
KMO and Bartlett's Test of Sphericity.
| Kaiser-Meyer-Olkin Measure of Sampling Adequacy | 0.860 | |
| Bartlett's Test of Sphericity | Approx. Chi-Square | 3287.608 |
| df | 153 | |
| Sig. | 0.000 | |
Table 3.
Communalities.
| Variables | Items | Initial | Extraction |
|---|---|---|---|
| Customer Satisfaction (CS) |
DV1- It is important for airlines to maintain customer satisfaction. | 1.000 | 0.638 |
| DV2- I often choose the same airline when traveling if I have had good experience with the airline in the past. | 1.000 | 0.583 | |
| DV3- I do not mind spending more money on airline tickets for a better experience. | 1.000 | 0.705 | |
| DV4- I have higher demands / requirements when it comes to airline standards post COVID-19 pandemic. | 1.000 | 0.620 | |
| DV5- I expect airlines to provide same if not better service after the COVID-19 pandemic. | 1.000 | 0.590 | |
| Safety Measures (SM) |
S1- Airline safety measures are an important factor to me when travelling. | 1.000 | 0.783 |
| S2- It gives me peace of mind knowing that the airline I am traveling with, takes precautionary measures against COVID-19 to ensure the safety of all customers. | 1.000 | 0.762 | |
| S3- I am at ease knowing that the airline I am traveling with is constantly reminding all passengers of the safety rules/measures. | 1.000 | 0.685 | |
| S4- I am happy to oblige to all safety rules imposed by the airline to stop the spread of COVID-19. | 1.000 | 0.763 | |
| Ticket Policy (TP) |
T1- Airline flexible ticket policy gives me peace of mind. | 1.000 | 0.602 |
| T2- It is important to me for an airline to allow free ticket cancellation. | 1.000 | 0.730 | |
| T3- It is important to me for an airline to allow unlimited rescheduling at any time. | 1.000 | 0.658 | |
| T4- It is important to me for an airline to provide refunds if a flight is cancelled. | 1.000 | 0.711 | |
| Cost (C ) |
P1- Air ticket prices have a significant effect on customer satisfaction. | 1.000 | 0.710 |
| P2- Air ticket prices have been priced at reasonable rates after the COVID-19 pandemic. | 1.000 | 0.651 | |
| P3- Reduced air ticket price will encourage people to travel by air post COVID-19 pandemic. | 1.000 | 0.706 | |
| P4- Paying more for an airline ticket means better service from the airline. | 1.000 | 0.877 | |
| P5- Paying more for an airline ticket means better safety precautionary measures against the spread of COVID-19. | 1.000 | 0.897 |
Extraction Method: Principal Component Analysis.
Table 4.
Total Variance Explained.
| Component | Initial Eigenvalues | Extraction Sums of Squared Loadings | Rotation Sums of Squared Loadingsa | ||||
|---|---|---|---|---|---|---|---|
| Total | % of Variance | Cumulative % | Total | % of Variance | Cumulative % | Total | |
| 1 | 6.043 | 33.574 | 33.574 | 6.043 | 33.574 | 33.574 | 4.305 |
| 2 | 2.300 | 12.778 | 46.352 | 2.300 | 12.778 | 46.352 | 3.448 |
| 3 | 1.865 | 10.362 | 56.714 | 1.865 | 10.362 | 56.714 | 2.724 |
| 4 | 1.333 | 7.406 | 64.120 | 1.333 | 7.406 | 64.120 | 3.764 |
| 5 | 1.005 | 5.585 | 69.704 | 1.005 | 5.585 | 69.704 | 2.730 |
Table 5.
Reliability Test (Cronbach’s Alpha) (n=388).
| Construct | Cronbach’s Alpha (α) | Items |
|---|---|---|
| Customer Satisfaction | 0.805 | 5 |
| Safety | 0.869 | 4 |
| Ticket Policy | 0.808 | 4 |
| Cost | 0.799 | 5 |
| Overall | 0.868 | 18 |
Table 6.
Model Summary.
| Model | R | R Square | Adjusted R Square | Std. Error of the Estimate |
|---|---|---|---|---|
| 1 | 0.57a | 0.33 | 0.32 | 0.46 |
a. Predictors: (Constant), Cost, Safety, Ticket Policy. b. Dependent Variable: Customer Satisfaction.
Table 7.
Analysis of Variance (ANOVA).
| Model | Sum of Squares | df | Mean Square | F | Sig. | |
|---|---|---|---|---|---|---|
| 1 | Regression | 40.562 | 3 | 13.521 | 63.089 | 0.000b |
| Residual | 82.294 | 384 | 0.214 | |||
| Total | 122.856 | 387 | ||||
a. Dependent Variable: Customer Satisfaction. b. Predictors: (Constant), Cost, Safety, Ticket Policy.
Table 8.
Coefficients.
| Model 1 |
UC | SC | t | Sig. | 95.0% Confidence Interval for B |
Collinearity Statistics |
||||
|---|---|---|---|---|---|---|---|---|---|---|
| B | Std. Error |
Beta | Lower Bound | Upper Bound | Tolerance | VIF | ||||
| 1 | (Constant) | 1.021 | 0.265 | 3.857 | 0.000 | 0.501 | 1.542 | |||
| SM | 0.561 | 0.054 | 0.475 | 10.360 | 0.000 | 0.455 | 0.668 | 0.828 | 1.208 | |
| TP | 0.028 | 0.046 | 0.028 | 0.612 | 0.541 | -0.062 | 0.117 | 0.826 | 1.211 | |
| C | 0.147 | 0.039 | 0.177 | 3.809 | 0.000 | 0.071 | 0.224 | 0.808 | 1.237 | |
a. Dependent Variable: Customer Satisfaction. b. UC: Unstandardized Coefficients. c. SC: Standardized Coefficients.
Disclaimer/Publisher’s Note: The statements, opinions and data contained in all publications are solely those of the individual author(s) and contributor(s) and not of MDPI and/or the editor(s). MDPI and/or the editor(s) disclaim responsibility for any injury to people or property resulting from any ideas, methods, instructions or products referred to in the content. |
© 2023 by the authors. Licensee MDPI, Basel, Switzerland. This article is an open access article distributed under the terms and conditions of the Creative Commons Attribution (CC BY) license (http://creativecommons.org/licenses/by/4.0/).
Copyright: This open access article is published under a Creative Commons CC BY 4.0 license, which permit the free download, distribution, and reuse, provided that the author and preprint are cited in any reuse.


