
Submitted:
29 December 2023
Posted:
03 January 2024
You are already at the latest version
Abstract
The recent market and pandemic, with their complex nature and unpredictable developments, have had a great impact on coffee chains. The recovery factor in today's fiercely competitive coffee market is also derived from customer satisfaction, and the product's perceived value and ever with businesses' capabilities and recovery strategies. The research is based on the Customer and Service Recovery Performance model. Therefore, this study aims to investigate the impact of the Customer Satisfaction premise on the service recovery of the coffee chain and some other effects. After collecting surveys from 300 customers who have used beverages at famous coffee chains in Vietnam and performing data analysis via SEM-PLS, the results show that customer satisfaction positively influences customer loyalty. Customer loyalty mediates between customer satisfaction, and price fairness affects the resilience of the coffee chain. In addition, the two factors, Flexibility, and Adoption, also positively affect service recovery performance. Therefore, for coffee chains, customers are an important factor, and they need to maintain customer loyalty. In addition, seek ways to increase flexibility and apply technology at stores so that the company has enough experience and capacity to respond promptly to difficult market conditions, natural disasters and epidemics. This study presents insights into how coffee chains can adapt to the dynamic business environment during the current difficult business environment.
Keywords:
Customer Satisfaction antecedents
; Flexibility
; Adoption Technology
; Service Recovery Performance
1. Introduction
In Vietnam, the coffee chain market is increasingly competitive, making it increasingly difficult to maintain coffee chains. First, many coffee chains from abroad are imported into Vietnam, which has had a big impact on other coffee chains. Many coffee chains are not successful because they do not understand the market in Vietnam, operating costs are too high but do not make a profit, causing many coffee chains to close their branches gradually (Nguyen, 2019). In addition, the COVID-19 epidemic has caused severe and unprecedented disruption in today's business environment. Coffee chain businesses have been affected by difficult conditions and are facing issues such as labor shortages, falling demand, limited supply, and dissatisfaction with customer satisfaction. Due to the complicated outbreak of the epidemic, Vietnam has worked more closely on imports, negatively affecting the production and transportation of goods (Ha & Quyen, 2021). In addition, the price of empty containers is increasing rapidly, making it more difficult for coffee to compete in the global market (Chi, 2021). For these reasons, the current coffee chain environment is significantly damaging to business operations, with resource constraints and an inability to meet customer needs having adverse effects has placed unprecedented stress on some businesses, forcing them to restructure operations to stay afloat and maintain product availability, demand, and customer loyalty (Flynn et al. events, 2021).
This study explores and understands the coffee chain and finds out what factors help businesses recover in today's difficult and competitive conditions. First, this study will examine the relationship between antecedents of customer satisfaction and factors that influence Service Recovery Performance. Second, evaluate the factors, and find out which factors affect Coffee Chain's ability to recover. Third, provide solutions for coffee chain companies to increase resilience in today's difficult market conditions.
Coffee is one of its most important exports for Vietnam, and the country is also the second-largest producer and exporter of coffee in the world (after Brazil) (Cekindo, 2022). According to the data provided by the Import-Export Department (2022), Vietnam exported 1.77 million tons of coffee in various forms, resulting in a total turnover of more than 4 billion USD. This represents an increase of 3.4% in volume and 35.6% in value compared to the same period in the previous year (2021) (Khoi, 2022). The convenience of coffee is one of its defining characteristics, and coffee chains compete with one another based on location, quality, and service. Because there are so many different types of individuals who drink coffee, entrepreneurs are allowed to be innovative (Openstax, 2019). According to the findings of a study on the F&B (food and beverage) business in Vietnam that iPOS carried out, the country will have 338,600 restaurants and cafes by the end of 2022. This represents seven straight years of development in the period 2016-2022 at a CAGR of almost 2% (VNA, 2023). Coffee chains in Vietnam are expanding, sustainable coffee chains have appeared for a long time in Vietnam, such as Highlands Coffee, Cong Cafe, Trung Nguyen Coffee, and foreign coffee chains like Starbucks. During the epidemic, most stores closed temporarily to comply with anti-epidemic regulations. The number of stores is large, and the fixed costs are very high. The retail market has seen many businesses close, pay ground, or downsize their business models. As of the second quarter of 2021, the occupancy rate of commercial centers and retail podiums reached 94%, down from the same quarter last year (Chi, 2021). Trung Nguyen coffee chain lost a third of its revenue, and The Coffee House was among the coffee chains that suffered the most during the current competitive environment.
Customer happiness can also have an impact on customer loyalty, according to Yieh, Chiao, and Chiu (2010). Consumer loyalty positively correlates with customer happiness, trust, and perceptions of justice regarding pricing and product quality. Consequently, this study aims to ascertain how client satisfaction premises affect quality and customer loyalty. And in terms of the ability to recover from difficult conditions, these elements have an impact on the chain's resilience.
This study contributes in many ways: first, it will systematize the theoretical basis of Customer Satisfaction and Service Recovery Performance. Second, it explores important aspects and investigates customer loyalty, attitudes, and product prices affecting resilience, to improve operational performance in terms of resilience. responsiveness, responsiveness, and quality; Third, complete a new study, help understand the business better, provide solutions, and help the companies have a new direction in the future. Fourth, help the company have more ideas to overcome difficulties, and increase the ability to recover quickly.
2. Literature review
2.1. Theoretical framework
2.1.1. Firm Performance Recovery
According to Walker et al. (2004), academics and business practitioners have become increasingly interested in business and organizational resilience. Resilience is the organizational capability required to deal with disruption while maintaining the same functions and structure as the business (Nikolopoulos, et al., 2021). This is in addition to the organization's capacity to adjust to new circumstances. The demands, requirements, and expectations of customers, the availability of supplies and people, and how to leverage the organization's capabilities to deal with difficult competitive conditions are all continuing consistency (Gereffi, 2020).
Effective service recovery is an important factor in the service sector to sustain client happiness. By ensuring efficient service recovery, service businesses may sustain positive long-term connections with clients and win their loyalty, dedication, and product approval. Because customer happiness is the foundation of customers' strong connections with businesses and brands (Javed et al., 2018).
To effectively solve operational and Supply Chain (SC) concerns, organizations should employ flexible procedures and practices that encourage innovation to increase their capacity for rapid reaction and resilience (Siagian, et al., 2021).
According to Srinivasan and Swink (2017), organizational flexibility is the capacity to function in an environment characterized by increased levels of uncertainty. At the same time, technology adoption has emerged as an essential component of organizational success and market competitiveness in today's internationalizing operations and globalization (Das, et al., 2020).
2.1.2. Customer Satisfaction Antecedents
The contentment of customers offers a solid foundation for those who work in marketing and consumer research. According to Oliver's (1980) model of expectation validation, the seeming (non-confirming) mismatch between expectations and the experienced performance of an item or service is what creates satisfaction. In preventing future difficulties, customer satisfaction is essential to promote financially resilient growth (Reichheld & Sasser, 1990). Attracting new consumers from rivals is costly because convincing customers to switch from competitors requires more significant service improvement (Anderson & Sullivan, 1993). Because of customer satisfaction's vital role in business, several studies have been conducted to understand how customers form views about their experiences with services. Examining the aspects that affect customer satisfaction is crucial since a firm sets such a high value on it.
Customer Retention Service quality, convenience, perceived value, personality traits, perceived brand, brand experience, employee satisfaction, adaptable selling, dominance, service workers' focus on the needs of the customer, equity, customer-based brand equity, customer experience, equity, marketing mix, delivery efficiency, and supplier expertise are just a few examples of the many variables that can be used to explain antecedents (Johnson & Fornell, 1991). These factors all play a role in determining customer satisfaction (Pugh, et al., 2002). Nonetheless, service quality, perceived price fairness, and consumer satisfaction are the focal points of most research efforts.
2.2. Hypothesis Development
2.2.1. The Relationship between Service Quality and Customer Loyalty
Service quality is how well a good or service meets the requirements or expectations of its intended audience (Lewis & Mitchell, 1990). Retaining existing customers is more likely to result in profitable business than acquiring new customers, making customer loyalty a crucial byproduct of providing services (Reichheld & Detrick, 2003). According to findings from a study that was carried out by Leninkumar (2016), the level of service quality has a considerable and favorable influence on customer loyalty. Oliver (1977; 1980) argued that the link between service quality and customer loyalty is mediated by the level of satisfaction experienced by consumers. In a similar manner, individuals experience negative disconfirmation when the services they receive fall short of their expectations, and as a consequence, their level of pleasure with the service is diminished (Budiastari, 2016).The research that has been done on the topic lends credence to the theory that the quality of the service provided might moderate the connection between satisfaction levels and customer loyalty. In addition, service quality has a strong relationship to customer satisfaction when using the service and the likelihood of returning to the store is high (Srivong, et al., 2021).
Hypothesis 1 (H1):
Service Quality will affect Customer Loyalty.
2.2.2. The Relationship between Perceived Price Fairness and Customer Loyalty
In the service industry, the way prices are perceived plays a crucial impact in the decision-making process. Perceived cost, price fairness perception, and price equity perception are some of the dimensions that have been analyzed in research on customers' perceptions of pricing (Bolton & Lemon, 1999). In the work of Bassey (2014), a conceptual model is developed to investigate the relationship between customers' perceptions of price justice, their levels of satisfaction, and their loyalty. In this model, it is observed that customers' perception of price fairness leads to an increase in satisfaction and loyalty. According to Martin et al. (2009), loyal consumers consider small price increases to be fairer than disloyal customers and such an impact will not be emphasized when significant price adjustments take place. Customers will have a positive experience with a product or service if the cost is reasonable relative to the value they receive (Hutagaol & Erdiansyah, 2020). Consuegra et al. (2007) found that perceived price fairness is positively related to consumer loyalty. According to Wijaya (2016), the price has a positive and significant effect on word of mouth, if the price is reasonable, customers will stick with the product and recommend it to others. Consuegra et al. (2007) found that perceived price fairness is positively related to consumer loyalty.
Hypothesis 2 (H2):
Perceived Price Fairness will affect Customer Loyalty
2.2.3. The Relationships between Customer Satisfaction and Customer Loyalty
According to studies done in the past, a company's degree of success is significantly dependent not only on the amount of satisfaction experienced by its clients but also on the caliber of the services it offers (Dawes, et al., 2020). Ganiyu (2017) investigated and showed the existence of a connection / interdependence between a company's level of customer satisfaction and the amount of loyalty that its customers feel toward the company. They were convinced that a positive link exists between the level of pleasure a consumer experiences and the level of loyalty they feel toward a brand. A customer's overall attitude or behavior toward a service provider can be characterized as satisfaction. Companies with loyal customers tend to have the highest profits because those customers are more likely to make repeat purchases, spend money testing new products and services, recommend those products and services to others, and provide those organizations with helpful feedback (Reichheld & Sasser, 1990).
Hypothesis 3 (H3):
Customer Satisfaction will affect Customer Loyalty
2.2.4. The Relationships between Customer loyalty and Service Recovery Performance
According to Souiden and Pons (2009), using organizational disaster management and planning processes is the most effective method for preventing a fall in customer loyalty a company obtains. Customers are more likely to exhibit behavioral commitment, such as an interest in making future purchases, when they are made aware of marketing acts such as corporate social responsibility (CSR) as a proactive approach and allowed to feel caring through these marketing acts. CSR is a form of marketing known as a proactive approach. Due to this growth in the frequency of traumatic events, which involves an expansion in the danger of both natural and anthropogenic catastrophes, the significance of these strategies has grown (Lee, et al., 2020). When consumers, for instance, are exposed to detrimental information about a business in which they have placed their faith, they are more likely to continue buying the brand, even when they are aware that the information is factual (Laverie & Arnett, 2000). Customers may find it easier to identify a connection with a company that demonstrates resilience, which also helps those consumers in overcoming whatever unpleasant information they have received about the company in the past. This is due to the fact that when customers have previous experience with a specific organization or brand and are then shown unfavorable information about that brand or company, they are more likely to counteract the negative information and preserve their preferences for the firm or brand. This is because customers with prior experience with a brand or business are likelier to maintain their intentions for the brand or business (Thesis, 2018). In other words, a company is more likely to rebound when it already has a specific number of devoted clients (Rew & Minor, 2018). Service recovery is thus essential in determining how customers feel about the products they purchase after they have experienced unpleasant situations.
Hypothesis 4 (H4):
Customer loyalty will affect Service Recovery Performance
2.2.5. The Relationships between Technology Adoption, Flexibility and Service Recovery Performance
The most important goals for a resilient business are to have a comprehensive understanding of the situation as a whole and to continually challenge oneself to improve one's goods or services, as well as one's overall organizational performance, one's level of organizational sustainability, and one's level of customer loyalty (Harcourt & Ateke, 2018). Operational flexibility, which refers to the organizational capacity to reorganize corporate resources to product offerings in a way products/services in the dynamic and fluctuating market environment, is one of the key factors enhancing organizational performance on an operational level (Sáenz, et al., 2018). Flexibility becomes a necessity for resilience and promotes organizational resilience; coping capacity is the ability of an organization to react swiftly and fairly to both anticipated and unanticipated occurrences (Karman, 2020).
Additionally, utilizing technology to establish a competitive advantage and ensure client connection has become crucial (Kabir, et al., 2018). Also, the Willocx, et al. (2016) study on technology adoption will cover a variety of strategies for business growth, but one of them will be mobile apps, which will be crucial for service recovery performance. People can now connect with businesses via mobile apps to get feedback, compare pricing, and make purchases. The need from clients to get finished goods or services at the time and location of their choice has steadily increased the appeal of mobile services.
Hypothesis 5a (H5a):
Technology Adoption will affect Service Recovery Performance
Hypothesis 5b (H5b):
Flexibility will affect Service Recovery Performance
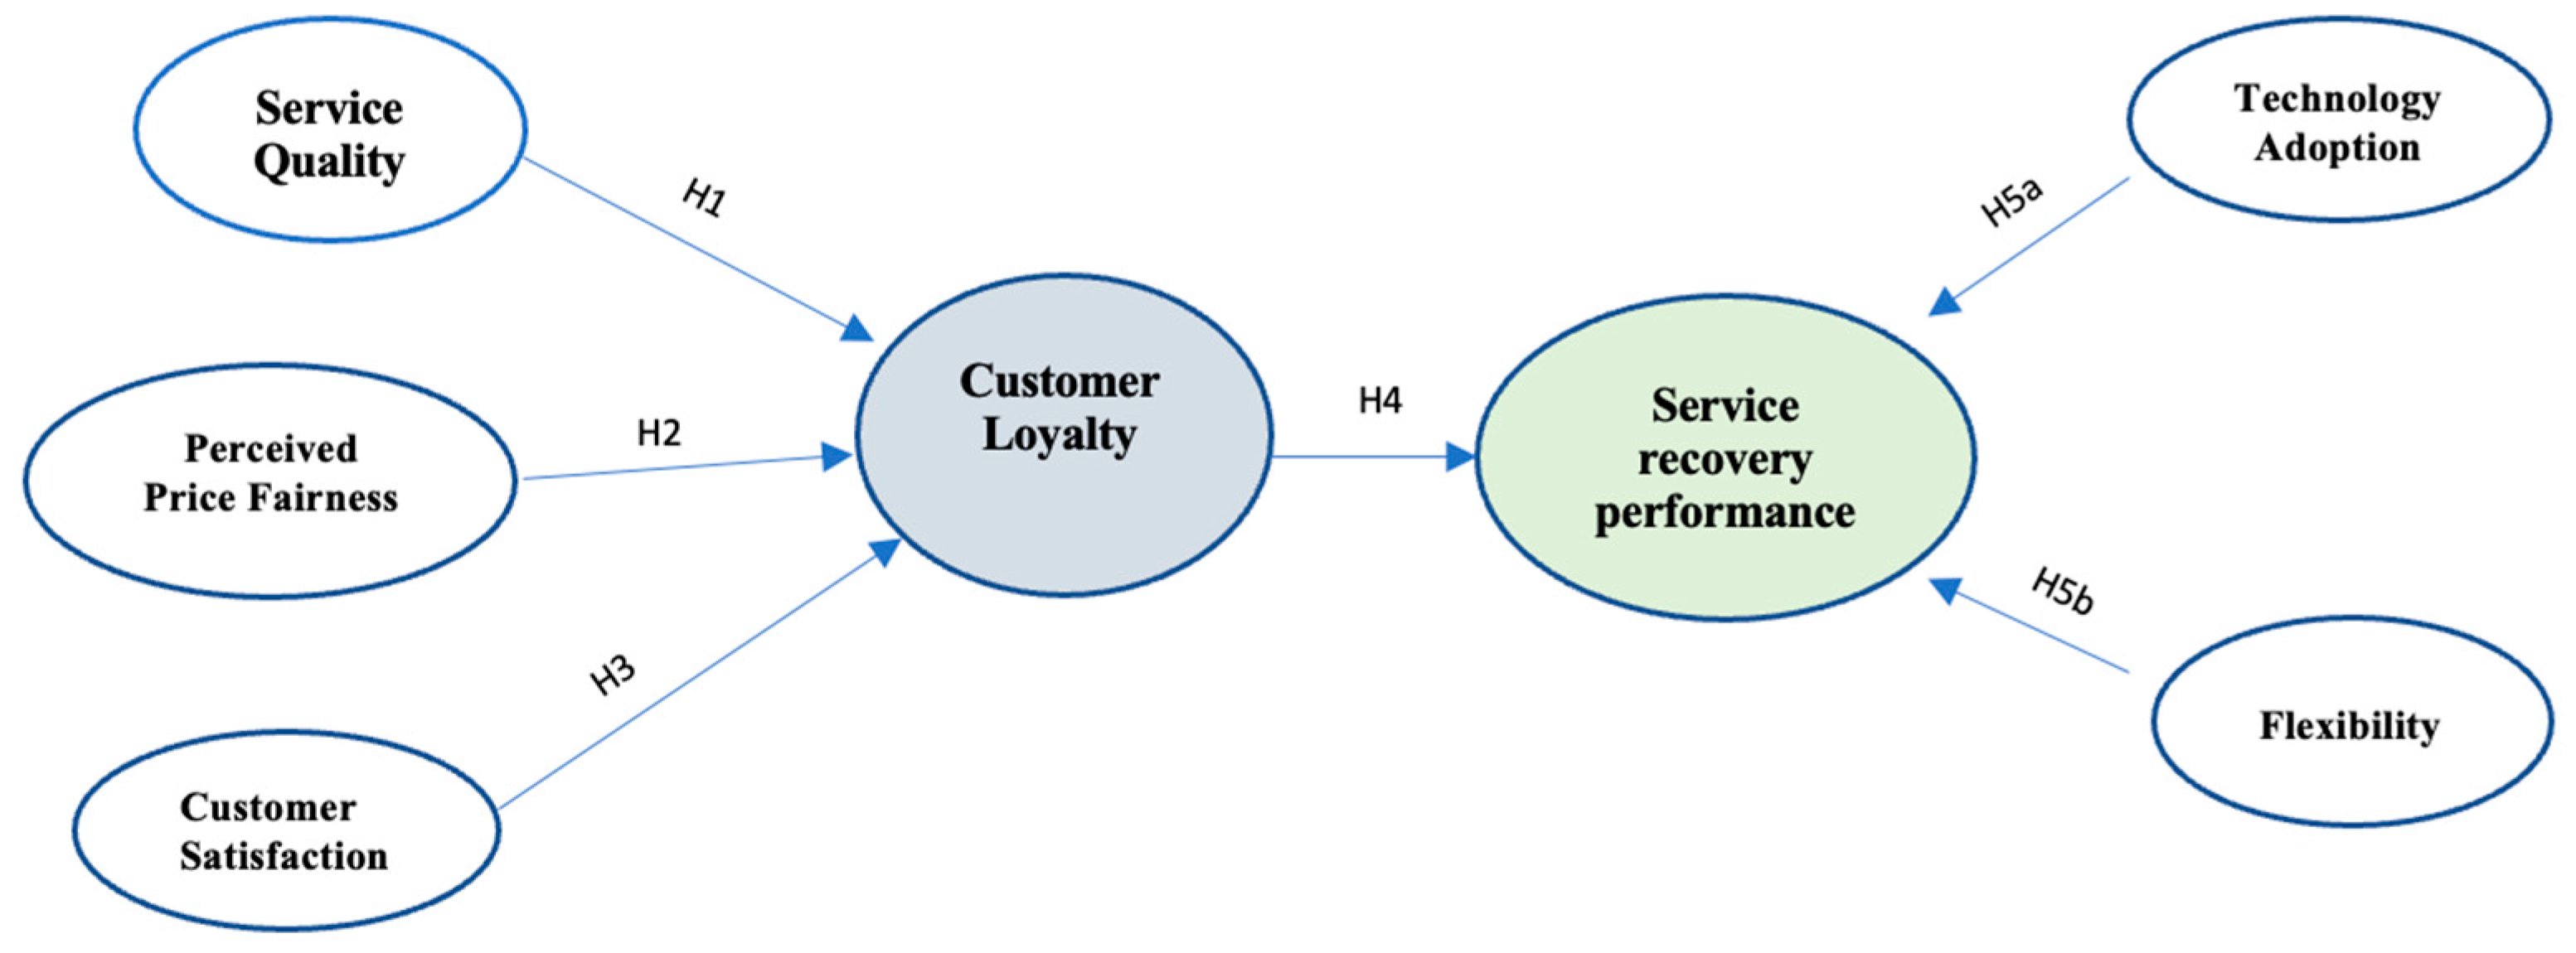
3. Research Model
Independent factors, psychological variables, dependent variables, and moderating variables are the four types of variables that make up the research model (Milin & Hadžić, 2014). Customer satisfaction antecedents are the independent variables, and the three primary ones are service quality, perceived price fairness, and customer satisfaction. Flexibility and technology use are two more independent factors that impact service recovey performance. Secondly, customer satisfaction antecedents and Service recovery performance will have an impact on the intermediate variable, customer loyalty. Ultimately, the dependent variable, service recovery performance, is influenced by customer loyalty, technology adoption, and flexibility. The suggested research model will be based on the analysis.
Figure 1.
Research Model.
4. Research Methodology
The author uses positivism throughout this paper to denote the idea that research can only be done objectively and cannot incorporate subjective viewpoints (Alamgeer, 2022). Automated data-gathering techniques, surveys, and questionnaires are simple to input into the database and may be modified further (Saunders, et al., 2019). In my study, I will use a deductive approach, which involves "forming a hypothesis (or hypotheses) based on a current theory and then developing a research plan to evaluate the hypothesis" (Wilson, 2023). In addition to gathering data from secondary sources, the researcher conducting this study will also use quantitative research methods such as polls, surveys, and questionnaires to collect the information necessary for the study component that is devoted to analysis (Walia & Chetty, 2020). To facilitate the collection of data and the subsequent investigation: The survey will be carried out with customers who have bought drinks at coffee chain, and the survey questions will feature Likert scales to analyze the overall mood of visitors about the many factors.
In this research project, I use a cross-sectional study, which is a research in which data is collected from samples only once during a certain time period. To be more specific, the period has been determined, and in order to carry out a cross-sectional research, the data will only be collected once (Alamgeer, 2022). Data was collected using Google Predefined Forms to allow the opportunity to answer specific research questions. Data collection will begin within a certain period and after reaching the set number of answers. This will eventually allow the testing of hypotheses and data evaluation. The sampling survey has its own limitations because only a part of customers at coffee chain establishments of Phuc Long, The Coffee House, Starbucks, Trung Nguyen in Vietnam were sampled. So the author randomly selected 300 customers at coffee chain stores in Vietnam.

Table 1.
Interpretation of variables in the research model.
| Variables | Source | ||
|---|---|---|---|
| Service Quality | SQ1 | Staff at the store are enthusiastic and friendly | Kumar and Dhisasmito (2020), Ge et al. (2021) |
| SQ2 | The space of the cafe is comfortable | ||
| SQ3 | Drinks are served quickly | ||
| SQ4 | The staff of the cafe is knowledgeable about the needs of customers | ||
| Perceived Price Fairness | PPF1 | The cost in the cafe is in line with what customers experience | Ge et al. (2021), San (2022) |
| PPF2 | The quality of raw materials used to manufacture products is suitable for the price | ||
| PPF3 | The coffee chain that offers the best price can meet the needs of customers with products | ||
| PPF4 | Overall, coffee chains offer low price options compared to single coffee shops | ||
| Customer Satisfaction | CS1 | The last time I went to the coffee chain, I was satisfied with the drinks and the service | San (2022), Kumar and Dhisasmito (2020) |
| CS2 | I will recommend my friends to the coffee chain | ||
| CS3 | The quality of the food and service of the cafe met my expectations | ||
| CS4 | Overall, I am satisfied with the facilities and service | ||
| Customer Loyalty | CL1 | You will continue to support new products from the coffee chain in the future | Hutagaol & Erdiansyah (2020) |
| CL2 | You will continue to come and have drinks at the coffee shop | ||
| CL3 | You will buy the product even if the price is higher than other brands | ||
| CL4 | You will buy products from this cafe even if it increases the service price | ||
| Flexibility | F1 | The coffee chain is always up to date and has a diverse list of drinks | Saad et al (2022), |
| F2 | Chain of stores constantly introducing new products/services | ||
| F3 | The store offers many promotions for customers | ||
| Technology Adoption | TA1 | The company should create/improve the mobile app | Saad et al (2022), |
| TA2 | Mobile applications help customers track promotional activities of the coffee chain | ||
| TA3 | Applying more technology will help the company operate more developed | ||
| Service Recovery Performance | RP1 | The coffee chain can quickly solve the shortage of input materials (For example, when a customer orders a product that is not available due to a shortage of raw materials, it will be quickly resolved) | Saad et al (2022), Liu and Lee (2018) |
| RP2 | The store adapts to disruptions (i.e. out of stock products and materials) in a way that adequately addresses customer needs | ||
| RP3 | Quick response to customer inquiries | ||
| RP4 | Quick complaint handling process |
5. Finding and discussion
5.1. Outer Loadings
PLS-SEM for the first time, the results I get have items below 0.4 and the results are good when the threshold is above 0.4, best when above 0.7 (Hair, et al., 2014). And I feel that items below 0.4 have no credibility nor affect key factors, so I remove those items from my model, the items I removed are CL4 (0.138), CS2 (0.087), PPF4 (0.081), SQ1(0,026), SQ4 (0.236) and TA2 (0.370). In addition, the variables above 0.7 will be important variables, achieving high confidence. However, I kept the variables below 0.7 because, for me, items above 0.4 and below 0.7 still had an effect on the factors so I kept the results. Finally, I have the Outer Loadings data below:
Figure 2.
Descriptive analytics.
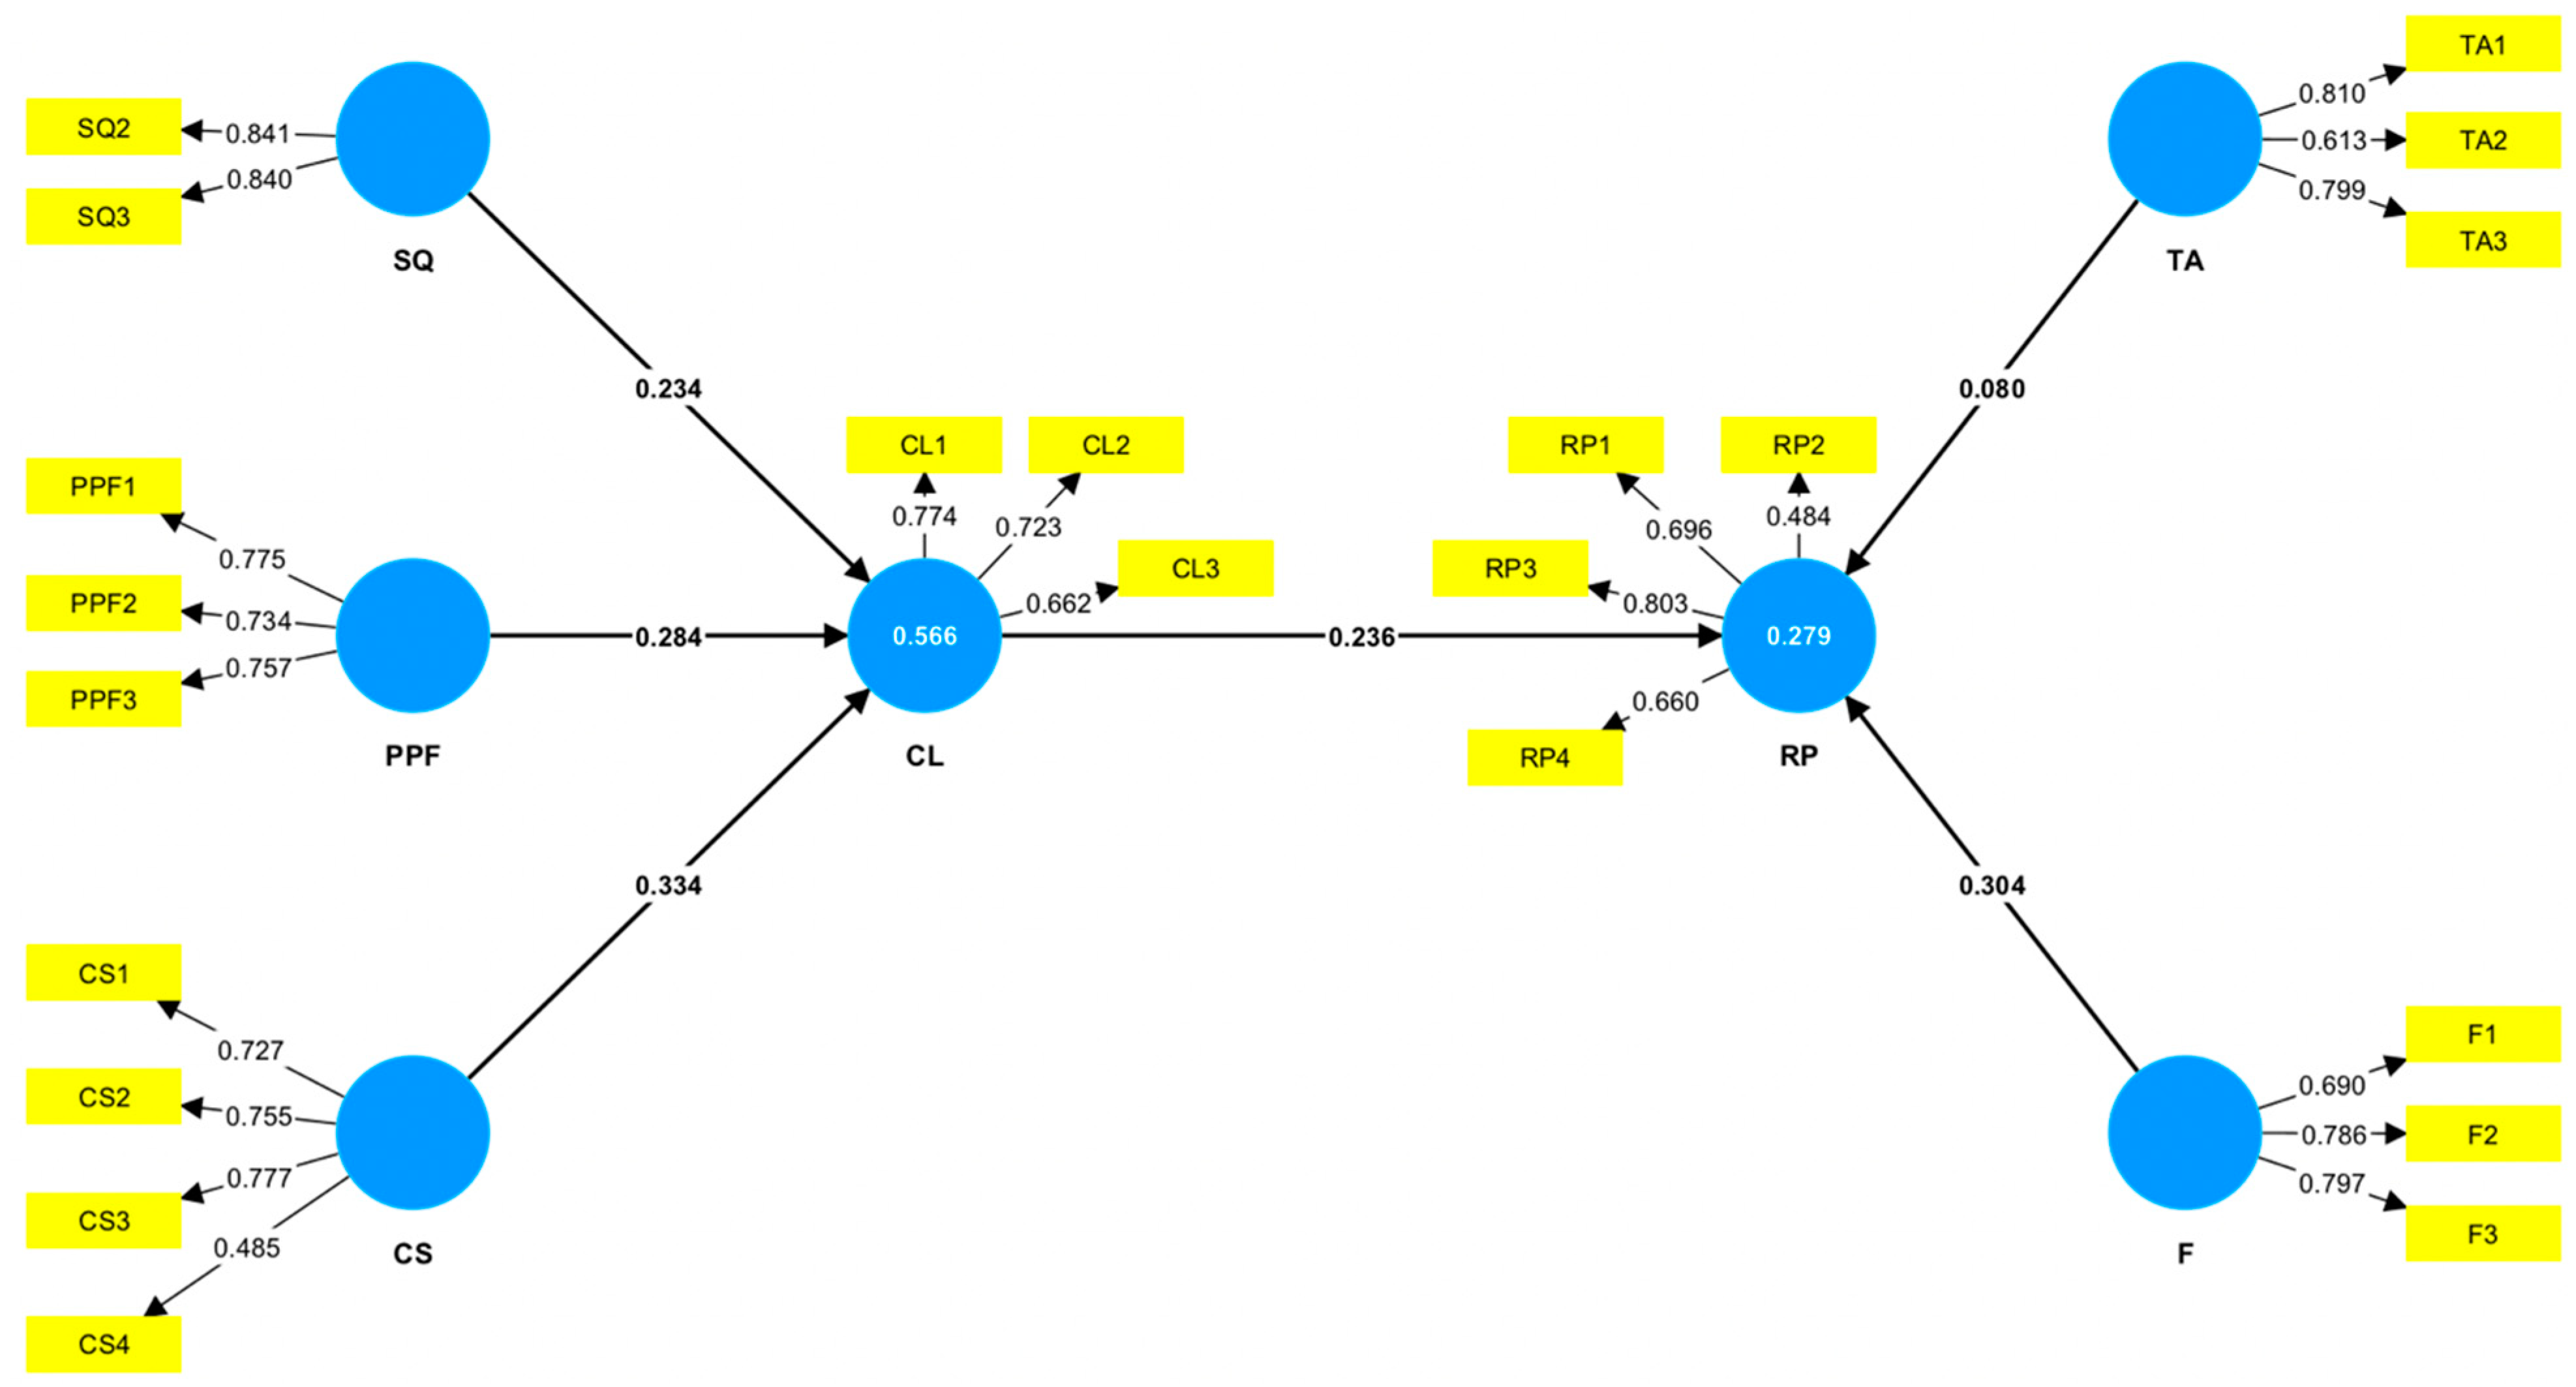
Table 2.
Outer Loading Results.
| Customer Loyalty | Customer Satisfaction | Flexibility | Perceived Price Fairness | Service Recovery Performance | Service Quality | Technology Adoption | |
|---|---|---|---|---|---|---|---|
| CL1 | 0.780 | ||||||
| CL2 | 0.698 | ||||||
| CL3 | 0.670 | ||||||
| CS1 | 0.850 | ||||||
| CS3 | 0.688 | ||||||
| CS4 | 0.595 | ||||||
| F1 | 0.663 | ||||||
| F2 | 0.721 | ||||||
| F3 | 0.770 | ||||||
| PPF1 | 0.774 | ||||||
| PPF2 | 0.702 | ||||||
| PPF3 | 0.780 | ||||||
| RP1 | 0.664 | ||||||
| RP2 | 0.471 | ||||||
| RP3 | 0.793 | ||||||
| RP4 | 0.629 | ||||||
| SQ2 | 0.753 | ||||||
| SQ3 | 0.803 | ||||||
| TA1 | 0.794 | ||||||
| TA3 | 0.842 |
5.2. Construct reliability and validity
Cronbach's Alpha is an index to measure internal consistency, a measure of the internal consistency of a group of variables of a factor, the scale on which the observed variables are positively correlated, the better that scale is high consistency. With the obtained Cronbach's alpha coefficient, the SQ coefficient is less than 0.5 (not acceptable), the rest has no coefficient below 0.5 (that is, the confidence level has no reliability) (Hair, et al., 2014), and the systems the numbers are from 0.5 to 0.6, i.e., the confidence level of the data . However, the data of Cronbach's Alpha often underestimate the intrinsically consistent reliability; the reliability must also be based on other data evaluation. Although Cronbach's alpha of SQ is low, the data is still retained for further research.
Table 3.
Construct reliability and validity.
| Cronbach's alpha | Composite reliability (rho_c) | Average variance extracted (AVE) | |
|---|---|---|---|
| CL | 0.531 | 0.760 | 0.515 |
| CS | 0.542 | 0.758 | 0.517 |
| F | 0.535 | 0.762 | 0.518 |
| PPF | 0.618 | 0.797 | 0.567 |
| RP | 0.528 | 0.739 | 0.422 |
| SQ | 0.352 | 0.755 | 0.606 |
| TA | 0.508 | 0.802 | 0.670 |
Composite reliability is an alternative to Cronbach's Alpha coefficient that is used to quantify the internal consistency of indicators on a scale. This coefficient is also known as the reliability composite. Utilizing a scale for the internal consistency of the indicators in a scale, using normalized coefficients, and taking into account the variation in the inaccuracy of the observable variables of a hidden variable are all instances of how this can be done (CR coefficient reaches the value from 0 to 1) (Hair, et al., 2014).
With Figure 15, the synthetic results obtained are wrong when running PLS-SEM, it can be seen that the obtained results are not less than 0.6 (lack of confidence) and not higher than 0.95 (problematic variable). In general, the variables all range from 0.7 to 0.9, at this level, the data can be considered the best and highly reliable. Besides, the data reliability index in Cronbach's Alpha is obtained at a low level, just enough to be reliable, but with Composite Reliability, the index is at a high level and can be completely trusted. With such an index, it is possible to use the results of Composite Reliability instead of Cronbach's Alpha because Composite reliability has higher credibility than Cronbach's Alpha.
AVE is an indicator that summarize convergence; as a general rule of thumb, AVE values of 0.5 and above indicate that there has been full convergence. With the runnable results, most of the variables are above 0.5, indicating that the items above 0.5 can be explained by structure or latent variables, which explain more than half of the variance of the observed variables of it, now the scale achieves good convergence. On the contrary, there are indicators below 0.5, namely RP, so there is still more error in the observed variables than the variance explained by the latent variable. However, a drawback in the calculation of the AVE index is the uniform assessment of the observed variables with each other, not considering the observed variables with low external load coefficients.
However, when analyzing variables, it depends not only on the significance between the variables, but also considers the strong or weak impact of the relationships. From there, it is possible to assess whether the relationships can affect each other (HairJr et al., 2021). According to Chin et al. (1996) when analyzing the impact of the independent variables on the dependent variable, the researcher not only considers the relationship as well as the significance or not between those relationships, but also considers the strong and weak impact of the dependent variable. relationships as a basis for whether the elements are related to each other. Therefore, the topic continues to perform bootstrapping calculations.
Table 4.
Hypotheses Result.
| Hypotheses | Relationships | Path coefficient | P Values | Results |
|---|---|---|---|---|
| H1 | Service Quality -> Customer Loyalty | 0.119 | 0.107 | Rejected |
| H2 |
Perceived Price Fairness -> Customer Loyalty |
0.366 | 0.000 | Accepted |
| H3 | Customer Satisfaction -> Customer Loyalty | 0.292 | 0.000 | Accepted |
| H4 | Customer Loyalty -> Service Recovery Performance | 0.247 | 0.012 | Accepted |
| H5a | Technology Adoption -> Service Recovery Performance | 0.186 | 0.009 | Accepted |
| H5b | Flexibility -> Service Recovery Performance | 0.216 | 0.006 | Accepted |
Hypothesis 1 (H1):
Service Quality will affect Customer loyalty -> Rejected
The first hypothesis examines the positive relationship between Service Quality and Customer Loyalty within the organization. P-value to test hypotheses and assess reliability, the higher the P-value, the lower the hypothesis reliability, the hypothesis will be significant if the P-value is lower than 0.05 (Hair, et al., 2014). Based on the obtained results, the P-Value of H1 is 0.107, greater than 0.05, so the path coefficient is not significant. This means that these two factors have no effect on each other and the result is negligible. Besides, the results show that the Path Coefficient is 0.119, which is a low coefficient and the two results analyzed according to customer response data have no positive effect on each other.
Although this study shows that these two factors do not affect each other, compared to previous studies, the study shows that the two values are related. Also, in a study in the same industry, the results are that service positively affects Customer loyalty, it can be said that when customers receive the service that meets their needs, customers will be satisfied and return to use the service in the future. The study also shows that service quality influences customer loyalty, service specificity, reliability, responsiveness to customer needs, peace of mind, and attention (Srivong, et al., 2021). In addition, with other findings, this study shows that service quality aspects (tangibles, reliability, and assurance) are the drivers of customer satisfaction rather than just one of the contributing factors (San, 2022). Research in other industries also shows that service quality affects customer loyalty, such as perceived value (Budiastari, 2016).
In general, the service of coffee chains is currently following the customer self-service process; staff are only in charge of cleaning, while most of the staff focus on beverage processing. This self-service type is popular with overseas models, such as the self-service customer model at Starbucks, Highland Coffee. Although the two factors of service quality and customer loyalty in the data of this study do not influence each other, factors such as the space of the cafe and the speed of the store's fast beverage preparation have a positive effect that can be overrated. The two excluded factors may interact because the SQ's Cronbach's alpha results have low reliability when running the data. However, the two factors are retained for the study, so the two factors are excluded.
Hypothesis 2 (H2):
Perceived Price Fairness will affect Customer loyalty -> Accepted
The P-value of H2 (Perceived Price Fairness and Customer Loyalty) is also a highly reliable result, less than 0.05 reaching the maximum level of 0.000, which means that Perceived Price Fairness and Customer Loyalty have a positive significance on customer loyalty. The results show that the path coefficient is 0.366, in the same positive direction (+) as the P-Value.
The findings of earlier studies also indicate the beneficial effects of two factors; more specifically, the results suggest that pricing fairness has a good impact on the loyalty of customers. This is in line with findings from earlier studies on service failure and recovery: the effects of relationship elements on customer satisfaction demonstrate the importance of consumers' perceptions of fairness as a factor. Price Fairness has been shown to correlate with Customer Loyalty in various contexts directly (Hutagaol & Erdiansyah, 2020). However, another study on the relationship between service excellence, brand equity, pricing fairness, and customer loyalty revealed that price equity had no direct or indirect relationship with customer satisfaction and loyalty when people buy health insurance (Wu, et al., 2011).
Currently, there are unique tea products and prices that are suitable for the pocket and taste of the majority of customers in Vietnam. The price of the product is in the middle range, not too high and not too expensive. Many customers who love branded goods and have a need to drink regularly, the prices of coffee chains are considered reasonable. Price changes can affect customer loyalty. As a coffee chain brand, prices include brand and product quality, so fairness and pricing can affect company loyalty.
Hypothesis 3 (H3):
Customer Satisfaction will affect Customer loyalty -> Accepted
With the results obtained in Hypothesis 3, it can be seen that P-Value reaches 0.000, reaching the lowest level, which means that the reliability of the hypothesis is high. The result of the path coefficient is 0.292, the relationship has a positive index with the variables, so it can be concluded that Customer Satisfaction positively affects Customer loyalty in the organization.
Based on previous research results, customer satisfaction has a positive impact on customer loyalty, which is consistent with previous research indicating that customer satisfaction has a significant impact on customer loyalty. Customer loyalty, attitude, or behavior towards a service provider can be described as satisfaction (Keiningham, et al., 2007). With other research, customer loyalty comes from satisfaction when using services. It has a positive relationship with each other and is also an organization's efforts to bring benefits to customers (Mohsan, et al., 2011).
Drinks of coffee chains are loved by many people, coffee chains have a stable service quality. Customer satisfaction is always something that businesses always focus on because this is indispensable if they want to have loyal customers. Product users love the store's products, which allows the coffee chain to satisfy customers among other factors.
Hypothesis 4 (H4):
Customer loyalty will affect Service Recovery Performance -> Accepted
Hypothesis describes the relationship between Customer Loyalty and Service Recovery Performance, resulting in two factors that positively impact each other. The P-Value of H4 reached 0.012, lower than 0.05, the relationship is significant between the two variables.
Compared with the previous research results, the majority of studies show a positive impact on Customer loyalty and Service Recovery Performance, and the results are similar to the results obtained in the study. In a study, Customer loyalty affects the resilience of the company, and this research shows that if the company is in trouble or has terrible news, customer loyalty will be a critical factor essential to help the company recover (Lee, et al., 2020). Other research says that a company has a high resilience when it has a loyal customer base for its company, so customer loyalty affects the ability and recovery plan of the business (Rew & Minor, 2018).
Difficult market conditions have left many losses to coffee shops in general and coffee chains in particular. The competitive market causes many coffee companies to close or reduce their branches. However, the number of customers who love the brand is the key to recovering coffee chains. The remedy also comes from coffee chains receiving and handling material problems and answering customers' questions. Maintain loyal customers and attract new loyal customers.
Hypothesis 5a (H5a):
Technology Adoption will affect Service Recovery Performance -> Accepted
Next, for the relationship between technology adoption and recovery performance, the P-value obtained was 0.009. This means that these two factors have meaning and influence on each other. The path coefficient is only 0.186, the two factors analyzed according to customer response data have a positive effect positively with each other.
The result of the study is Accepted, with some research papers, these two factors have an effect on each other. The application of technology to resilience is meaningful together, the applications of technology have a positive impact, helping the company to come up with many valuable strategies, making the company's recovery faster (Willocx, et al., 2016). In addition, another study has the effect of adopting technology to establish competition for more effective recovery (Kabir, et al., 2018). Some coffee chains do not have their own application, or the application is too sketchy to impress users; Create an application that can help the coffee chain for customers to track their points, order under pressure and have their own promotions for customers and capture promotions. In an increasingly developed society, other coffee chains are also applying technology to develop their companies. Based on the results obtained, the Technology of Adoption is weak affecting the resilience of the company.
Hypothesis 5b (H5b):
Flexibility will affect Service Recovery Performance -> Accepted
In this hypothesis on evaluating the relationship between Flexibility and Service Recovery Performance, the resulting P-Value is 0.006, reaching below 0.05. The result of the path coefficient is 0.216 path coefficient of the relationships. This shows that the two factors, Flexibility and Service Recovery Performance, positively impact each other.
The results obtained are similarly to some previous studies, the relationship of Flexibility and Service Recovery Performance has a positive impact on each other. In one author's research paper, the results obtained show that flexibility is a factor that has a positive meaning in enhancing the company's operations and minimizing losses and disruptions (Gkanatsas & Krikke, 2020). Besides another research result, organizational flexibility affects the ability of the organization to reorganize the company's resources to deliver the product in a way that the product/service in the market environment is one of the main factors (Karman, 2020). The flexibility of coffee chains is reflected in always researching and launching branded drinks, products, and souvenirs. There are drinks offered by the chain on a monthly or seasonal basis, offering programs to attract customers to use new products and buy souvenirs at the store.
6. Conclusion and Recommendation
With today's increasingly complex society, especially impacted by epidemics and increasingly competitive markets, causing many businesses to face difficulties, each business always needs to prepare a recovery plan for their business in the face of challenges. Challenges due to scarcity of goods, unexpected events and natural disasters. Learn and realize that to plan recovery factors for coffee chains, service quality is very important. Because coffee chains belong to the service industry, understanding the factors to develop company services is important. This study aims to understand the antecedents of customer satisfaction that influence customer loyalty and then examine what factors other than customer loyalty also influence customer loyalty. customer loyalty. After surveying the number of customers using services at major branded coffee shop chains, the PLS-SEM model was used to determine factors affecting the organization's recovery coefficient. First, the antecedents of customer satisfaction, including Perception of Fair Price and Customer Satisfaction, have a positive influence on customer loyalty, except for the Quality factor. Service quality has no impact. Second, from those effects, Customer Loyalty positively affects service resilience. In addition, Flexibility and technology adoption also positively affect service recovery performance.
7. Recommendations
Using quantitative research methods and PLS software. After running the data, it can be seen that most of the relationships are positive and mutually impactful. The Coffee chain has the quality of food and service that meet customers' expectations but it should still keep the current price because customers think that this is the right price for the value they receive, affecting loyalty of customer. Customers of the coffee chain will continue to support new products and trust the store's drinks and the company can launch many new products and will be supported by customers, but need to double check before roll out because sometimes customers will feel that the new product is less suitable than the old one. Coffee chains need to address issues such as the need for inputs and the ability to adapt to disruptions (no ingredients or products). Companies need to research on creating apps for coffee chains and find ways to drive customers to use the app. The application of technology will help increase the flexibility to enhance the resilience of the company.
Informed Consent Statement
Informed consent was obtained from all subjects involved in the study
Data Availability Statement
The data that support the findings of this study are available on request from author
Acknowledgement
The author gratefully acknowledges the financial support from the Banking Academy of Vietnam
Conflicts of Interest
The author declares no conflicts of interest
References
- Oliver, R.L. A cognitive model of the antecedents and consequences of satisfaction decisions. J. Mark. Res. 1980, 17, 460–469. [Google Scholar] [CrossRef]
- UNDERSTANDING SERVICE QUALITY AND PRICE FAIRNESS TO CUSTOMER LOYALTY IN THE COFFEE SHOP INDUSTRY IN THAILAND. ResearchGate. 31 March 2022. Available online: https://www.researchgate.net/publication/363485536_UNDERSTANDING_SERVICE_QUALITY_AND_PRICE_FAIRNESS_TO_CUSTOMER_LOYALTY_IN_THE_COFFEE_SHOP_INDUSTRY_IN_THAILAND.
- Available online: https://www.mdpi.com/2071-1050/12/10/4323.
- Available online: at: https://www.researchgate.net/publication/342573235_Technology_Adaptation_and_Survival_of_SMEs_A_Longitudinal_Study_of_Developing_Countries.
- Budiastari, S. THE INFLUENCE OF PRODUCT QUALITY, PRICE PERCEPTION AND BRAND IMAGE ON SATISFACTION AND CUSTOMER LOYALTY HOLCIM CONCRETE READYMIX IN JAKARTA. 2016. Available online: https://journal.unj.ac.id/unj/index.php/jrmsi/article/view/847.
- Cekindo. Vietnam’s Coffee Market, an Attractive Environment for new Investments. 2022.
- Chi, Q. Các hãng cà phê tên tuổi làm ăn ra sao sau “năm Covid-19 thứ nhất”? Danviet.vn. 14 July 2021. Available online: https://danviet.vn. https://danviet.vn/cac-hang-ca-phe-ten-tuoi-lam-an-ra-sao-sau-nam-covid-19-thu-nhat-5020211471192395.htm.
- Das, S.; Kundu, A.; Bhattacharya, A. Technology Adaptation and Survival of SMEs: A Longitudinal Study of Developing Countries. [Online]. 2020.
- Dawes, A.J.; Keogh, R.; Andrillon, T. A cognitive profile of multi-sensory imagery, memory and dreaming in aphantasia. 2020. Available online: https://www.nature.com/articles/s41598-020-65705-7.
- Duy, T. Coffee shop chains increase presence. 2021. Available online: https://vietnamnet.vn/en/coffee-shop-chains-increase-presence-738215.html.
- Enders, F.B. collinearity. 2023. Available online: https://www.britannica.com/topic/collinearity-statistics.
- Endicott. What is the Difference Between Anonymity and Confidentiality? 2023. Available online: https://www.endicott.edu/about/research-at-endicott/institutional-review-board-irb/what-is-the-difference-between-anonymity-and-confidentiality#:~:text=Anonymity%20cannot%20be%20guaranteed%20if,the%20responses%20of%20individual%20participants.
- Flynn, B.; Cantor, D.; Pagell, M.; Dooley, K.J.; Azadegan, A. From the Editors: Introduction to Managing Supply Chains Beyond Covid-19 - Preparing for the Next Global Mega-Disruption. 2020. Available online: https://onlinelibrary.wiley.com/doi/10.1111/jscm.12254.
- Ganguli, S.; Roy, S. Generic Technology-Based Service Quality Dimensions in Banking: Impact on Customer Satisfaction and Loyalty. Int. J. Bank Mark. 2011, 29, 168–189. [Google Scholar] [CrossRef]
- Garson, G.D. Partial Least Squares: Regression and Structural Equation Models. 2016. Available online: https://www.smartpls.com/resources/ebook_on_pls-sem.pdf.
- Ge, Y.; Qing, Y.; Wang, Y.; Park, K. The Structural Relationship among Perceived Service Quality, Perceived Value, and Customer Satisfaction-Focused on Starbucks Reserve Coffee Shops in Shanghai, China. Sustainability 2021, 13, 8633–8633. [Google Scholar] [CrossRef]
- Gereffi, G. What Does the COVID-19 Pandemic Teach Us about Global Value Chains? The CASE OF MEdical Supplies. 2020. Available online: https://link.springer.com/article/10.1057/s42214-020-00062-w.
- Gkanatsas, E.; Krikke, H. Towards a Pro-Silience Framework: A Literature Review on Quantitative Modelling of Resilient 3PL Supply Chain Network Designs. Sustainability 2020, 12, 4323. [Google Scholar] [CrossRef]
- Hair, J.F.H.; Sarstedt, M.; Hopkins, L.; Kuppelwieser, V.G. Partial Least Squares Structural Equation Modeling (PLS-SEM): An Emerging Tool in Business Research. 2014. https://www.emerald.com/insight/content/doi/10.1108/EBR-10-2013-0128/full/html.
- Hair, J.F., Jr.; Hult, T.M.; Ringle, C.M.; Sarstedt, M.; Danks, N.P.; Ray, S. An Introduction to Structural Equation Modeling. In Partial Least Squares Structural Equation Modeling (PLS-SEM) Using R. Classroom Companion: Business; Springer: Cham, Switzerland, 2021; pp. 1–29. [Google Scholar] [CrossRef]
- Hanaysha, J. Examining the Effects of Employee Empowerment, Teamwork, and Employee Training on Organizational Commitment. 2016. Available online: https://www.scirp.org/(S(351jmbntvnsjt1aadkposzje))/reference/ReferencesPapers.aspx?ReferenceID=2018219.
- Harcourt, H.; Ateke, B.W. CUSTOMER-CONTACT EMPLOYEE EMPOWERMENT AND RESILIENCE OF QUICK SERVICE RESTAURANTS. Eur. J. Hum. Resour. Manag. Stud. 2018, 1. [Google Scholar] [CrossRef]
- Available online: https://www.cekindo.vn/blog/vietnam-coffee-market-attractive-for-foreign-investments.
- Available online: https://zenodo.org/record/1147175#.ZC1m2-xBwq0.
- Hutagaol, D.C.; Erdiansyah, R. The Effect of Service Quality, Price, Customer Satisfaction on Customer Loyalty of AirAsia Customers. 2020. Available online: https://www.researchgate.net/publication/341694134_The_Effect_of_Service_Quality_Price_Customer_Satisfaction_on_Customer_Loyalty_of_AirAsia_Customers.
- Hutagaol, D.C.; Erdiansyah, R. The Effect of Service Quality, Price, Customer Satisfaction on Customer Loyalty of AirAsia Customers. [online] ResearchGate. 2020 Available online: https://www.researchgate.net/publication/341694134_The_Effect_of_Service_Quality_Price_Customer_Satisfaction_on_Customer_Loyalty_of_AirAsia_Customers.
- Johnson, M.D.; Fornell, C. A framework for comparing customer satisfaction across individuals and product categories. J. Econ. Psychol. 1991, 12, 267–286. [Google Scholar] [CrossRef]
- Kabir, K.A.; Tahmeem, S.; Sugandha, S.M. IMPACT OF CUSTOMER RELATIONSHIP MANAGEMENT ON CUSTOMER LOYALTY: EVIDENCE FROM BANGLADESH’S BANKING INDUSTRY. 2018. Available online: https://ijbel.com/wp-content/uploads/2018/06/ijbel-239.pdf.
- Karman, A. Flexibility, Coping Capacity and Resilience of Organizations: Between Synergy and Support. 2020. Available online: https://www.researchgate.net/publication/338038229_Flexibility_coping_capacity_and_resilience_of_organizations_between_synergy_and_support.
- Kaur, P.; Stoltzfus, J.; Yellapu, V. Descriptive statistics. 2018. Available online: https://www.semanticscholar.org/paper/Descriptive-statistics-Kaur-Stoltzfus/141e8c299294dce1ed230264564d950667300fe9.
- Keiningham, T.L.; Cooil, B.; Aksoy, L.; Andreassen, T.W. The Value of Different Customer Satisfaction and Loyalty Metrics in Predicting Customer Retention, Recommendation, and Share-of-Wallet. 2007. Available online: https://www.researchgate.net/publication/239630908_The_Value_of_Different_Customer_Satisfaction_and_Loyalty_Metrics_in_Predicting_Customer_Retention_Recommendation_and_Share-of-Wallet.
- Kenton, W. Analysis of Variance (ANOVA) Explanation, Formula, and Applications. 2022. Available online: https://www.investopedia.com/terms/a/anova.asp.
- Khan, M.M.H.; Rafii, M.Y.; Izan, S.; Jusoh, M. Path-coefficient and correlation analysis in Bambara groundnut (Vigna subterranea [L.] Verdc.) accessions over environments; Springer Nature. 2022. Available online: https://www.researchgate.net/publication/357664779_Path-coefficient_and_correlation_analysis_in_Bambara_groundnut_Vigna_subterranea_L_Verdc_accessions_over_environments.
- Khoi, C. Xuất khẩu cà phê hướng mốc kỷ lục 4 tỷ USD. 2022. Available online: https://vneconomy.vn/xuat-khau-ca-phe-huong-moc-ky-luc-4-ty-usd.htm.
- Laverie, D.A.; Arnett, D.B. Factors affecting fan attendance: The influence of identity salience and satisfaction. 2000. Available online: https://psycnet.apa.org/record/2000-16990-002.
- Lee, J.Y.; Kim, S.W.; Kim, J.M. The Impact of Community Disaster Trauma: A Focus on Emerging Research of PTSD and Other Mental Health Outcomes. 2020. Available online: https://www.ncbi.nlm.nih.gov/pmc/articles/PMC7250671/.
- Leninkumar, V. The Effect of Service Quality on Customer Loyalty. [online]. Eur. J. Bus. Manag. 2016, 8, 44–49, Available onlinw: https://core.ac.uk/download/pdf/234627612.pdf. [Google Scholar]
- Lewis, B.R.; Mitchell, V.W. Defining and Measuring the Quality of Customer Service. 1990. Available online: https://www.emerald.com/insight/content/doi/10.1108/EUM0000000001086/full/html.
- Manti, S.; Licari, A. How to obtain informed consent for research. 2018. [CrossRef]
- Miklian, J.; Hoelscher, K. SMEs and exogenous shocks: A conceptual literature review and forward research agenda. 2021. Available online: https://journals.sagepub.com/doi/10.1177/02662426211050796.
- Milin, P.; Hadžić, O. Moderating and Mediating Variables in Psychological Research. 2014. Available online: https://link.springer.com/referenceworkentry/10.1007/978-3-642-04898-2_631.
- Nikolopoulos, K.; Punia, S.; Schäfers, A.; Tsinopoulos, C.; Vasilakis, C. Forecasting and planning during a pandemic: COVID-19 growth rates, supply chain disruptions, and governmental decisions. Eur. J. Oper. Res. 2021, 290, 99–115. [Google Scholar] [CrossRef] [PubMed]
- Oliver, R.L. Effect of expectation and disconfirmation on post exposure product evaluation: An alternative interpretation. J. Appl. Psychol. 1977, 62, 480–486. [Google Scholar] [CrossRef]
- Openstax. Entrepreneurship Today. 2019. Available online: https://openstax.org/books/entrepreneurship/pages/1-1-entrepreneurship-today.
- VNA. Ngành thực phẩm và đồ uống sẽ làm tốt trong năm nay mặc dù nền kinh tế khiêm tốn. 2023. Available online: https://en.vietnamplus.vn/food-and-beverage-industry-to-do-well-this-year-despite-modest-economy/247774.vnp.
- Wijaya, N.S.; Syahnur, S.; Landra, N. The Influence of Academic Service Quality and Price (Education Costs) on Word of Mouth Through Student Satisfaction as an Intervening Variable (Study on Bali Hospitality School LPK). Sci. J. Hosp. Manag. 2016, 6. [Google Scholar]
- Nguyen, H. Nguyên nhân cho sự thất bại của nhiều chuỗi cà phê lớn tại Việt Nam - Thạc sĩ QTKD Đại học Andrews Hoa Kỳ. Thạc Sĩ QTKD Đại Học Andrews Hoa Kỳ; Andrews. 22 August 2019. Available online: https://andrews.edu.vn/nguyen-nhan-cho-su-that-bai-cua-nhieu-chuoi-ca-phe-lon-tai-viet-nam/.
- Javed, M.; Ahmad, M.J.; Zakaria, N. Service Recovery Performance: A Critical Review of Literature. ResearchGate; International Research Alliance for Sustainable Development. 10 December 2018. Available online: https://www.researchgate.net/publication/329542755_Service_Recovery_Performance_A_Critical_Review_of_Literature.
Disclaimer/Publisher’s Note: The statements, opinions and data contained in all publications are solely those of the individual author(s) and contributor(s) and not of MDPI and/or the editor(s). MDPI and/or the editor(s) disclaim responsibility for any injury to people or property resulting from any ideas, methods, instructions or products referred to in the content. |
© 2024 by the authors. Licensee MDPI, Basel, Switzerland. This article is an open access article distributed under the terms and conditions of the Creative Commons Attribution (CC BY) license (http://creativecommons.org/licenses/by/4.0/).
Copyright: This open access article is published under a Creative Commons CC BY 4.0 license, which permit the free download, distribution, and reuse, provided that the author and preprint are cited in any reuse.


