
Submitted:
09 September 2025
Posted:
10 September 2025
You are already at the latest version
Abstract
Most of the ruminant production in Brazil is based on the use of pastures, which are present in every Brazilian biome. The aim of this study was to extract patterns and knowledge from the stakeholders’ response database regarding the technological processes used for pasture conservation and management. Electronic questionnaires were used to perform the stakeholders’ survey, as they are more economical and agile. 712 people from all Brazilian regions and biomes were interviewed between July and August 2019. Four technologies were selected by pasture specialists from Embrapa Pecuária Sudeste to be analyzed as dependent variables. The techniques were classified as adopted (1) or not adopted (0). The generalized linear model (GLM) method was used to estimate statistical parameters, and the analysis was directed to the evaluation of the combination of statistically significant independent technological processes (P < 0.05). The database was then submitted to an artificial mining process, with the application of the decision tree induction method, which involves hierarchical models used for their predictive capacity. The combined use of parametric and non-parametric methodologies effectively facilitated the extraction of patterns, knowledge, and insights into stakeholders’ decision-making processes regarding the integration of technological practices in structuring pasture conservation and production systems.
Keywords:
livestock
; data mining
; decision tree
1. Introduction
In 2021, the beef cattle chain, one of the pillars of agribusiness in Brazil, generated US$ 178 billion, which represented around 11% of the country’s total GDP. Extensive systems account for around 80% of beef cattle production systems in Brazil. Its main characteristic is the use of pastures as the primary source of food. The animals’ nutrition is supplemented with minerals to cover deficiencies of both macro and micro elements. All the production phases in extensive systems take place in the field, from cow-calf to finishing. These production phases present a high variation in performance indices, which are directly dependent on pasture conservation and management technologies [1]. In Brazil, the pasture area, both natural and planted, occupies approximately 160 million hectares [2], which correspond to approximately 45% of the country's agricultural area [3].
Many Brazilian livestock producers raise more cattle than the pasture can sustain [4]. These findings help to clarify the overgrazing paradox by providing a foundation for understanding how producers’ objectives influence their perceptions and decisions. They believe in the economic gain provided by a greater number of animals per area, but some degree of pasture degradation is often a consequence [5].
Due to the large climatic differences between biomes, climate is the main factor that influences the production of tropical forage [6], underscoring its importance in the regional decision-making process carried out by farmers. Thus, producers serve as the primary agents responsible for adapting technologies and implement production systems in the real world [7]. Increasing the efficiency of beef production systems does not necessarily mean greater environmental impact. On the contrary, as in the case of degraded pastures, their recovery increases productivity and contributes significantly to carbon sequestration and fixation in the soil. Based on IBGE data, Martha et al. [8] reported that the stocking rate increased from 0.51 head per hectare in 1970 to 1.08 in 2006, reflecting the widespread adoption and a shift in livestock practices toward the important ”land-saving” effect.
Most of the ruminant production in Brazil is based on pastures, which are present in every Brazilian biome. This brings competitiveness to local production systems, as the use of grass-lands leads to lower costs. In addition, the productive potential of forage plants in Brazilian pastures and the possibility of intensification of production systems also favor the reduction of environmental impacts currently attributed to cattle raising [9].
Farm monitoring encompasses: (1) climate and weather conditions, such as temperature, humidity, and wind; (2) resilience to external factors that impact farm operations; (3) productivity, focusing on controlling outputs and related processes; (4) human involvement, aimed at adjusting and enhancing the efficiency of production systems; and (5) sustainability, with an emphasis on producing high-quality food. The collected data encompass all these aspects and provide insights for adopting technologies aligned with producers’ objectives. This accumulated knowledge has great value for end users in supporting informed decision-making [10]. In conventional analysis workflows, data often lose value over time, eventually being aggregated or discarded after a specific period. To address this issue, data should be periodically reassessed to generate new insights [11].
Knowledge discovery in database (KDD) is an important analytical method for identifying relationships among the various elements of the collected data. It aims to uncover actionable insights and to support strategic decision-making to promote sustainable systems and advance animal production, the food industry, and public health [12].
KDD follows a series of structured steps: (1) Selection - identifying relevant data aligned with the project objectives; (2) Pre-processing - improving data quality by addressing inconsistencies or missing values; (3) Transformation - applying appropriate methods based on the selected models; (4) Data mining – the core of the process, where algorithms are used for sorting, clustering, or statistical analysis to extract patterns, rules, or insights from the transformed data; and (5) Evaluation/Interpretation –analyzing and interpreting the results. As KDD is both iterative and incremental, the entire process or specific stages may be repeated multiple times [13].
The objective of this study was to extract knowledge about the technological demands and decision-making processes of livestock producers (stakeholders) operating within pasture-based production systems.
2. Materials and Methods
A nationwide survey was conducted electronically between July and August 2019, receiving responses from 712 participants across all Brazilian regions and biomes. Data were collected using a structured online questionnaire and included responses from various stakeholders (producers, researchers, administrators etc.) engaged in livestock systems where pasture serves as the primary source of animal feed. Four techniques commonly used in pasture planning and management were selected by the pasture specialists at Embrapa Pecuária Sudeste (São Carlos, SP) to serve as dependent variables in the analysis:
a) Soil analysis (PAnlSolo);
b) Monitoring and control of pasture stocking rate (PTxLot);
c) Soil correction with limestone (PCorrection); and
d) Rotation grazing (PRotacio).
The interviews provided information about the techniques used on each property based on the forage production system adopted. These techniques were classified as either adopted (1) or not adopted (0), resulting in dichotomous responses.
Using the estimation method of Generalized Linear Models (GLM), the probability (π) of a practice being classified as implemented (1) was modeled in relation to the independent (or contextual) variables associated with different forage production systems in Brazil, similarly to the methodology employed by [14].
The analysis of significant combinations of technological practices enabled a deeper understanding of the factors influencing the adoption of specific forage production systems. GLMs were employed using a logistic link function and binomial distribution, with the stepwise procedure applied to identify significant contextual variables (p>0.05). It is important to note that the estimated regression coefficients do not directly represent the effect of changes in the explanatory variables on the resulting probability (Pi). Instead, they indicate the effect of individual explanatory variables on the logarithm of the odds ratio (ln [Pi / (1-Pi)]).
For each set of significant contextual variables associated with a given dependent production technique, dedicated databases were developed and submitted to a data mining process. The objective was to extract knowledge on pasture production systems, which are composed of several interacting practices.
The quality of the binomial logistic model fit was evaluated using the Hosmer-Lemeshow test, which compares observed and expected outcomes by dividing the data into 10 groups. The test evaluates whether there are significant differences between the observed and expected frequencies within each group [15]. If such differences are not statistically significant at a certain significance level, the model is considered to have an adequate fit.
Another method used to evaluate model performance was the Receiver Operating Characteristic (ROC) curve. This technique visualizes and assesses the model’s ability to distinguish between classes by plotting sensitivity (true positive rate) on the Y-axis and specificity (false positive rate) on the X-axis. Originally developed in signal detection theory, ROC analysis is widely used to evaluate diagnostic systems. A key metric is the Area Under the Curve (AUC), which ranges between 0 and 1 and represents the model’s probability of correctly ranking a randomly selected positive observation higher than a randomly selected negative one [16].
The decision tree induction technique employed in this study utilizes hierarchical models widely applied areas across various fields due to their predictive accuracy and problem-solving capabilities, offering a straightforward and intuitive approach to knowledge discovery and decision-making from large datasets [17]. One key advantage of this method is its suitability to handle both continuous and discrete qualitative variables, enabling the construction of decision trees that classify data and highlight the most relevant attributes within their branches [18]. Decision trees apply multiple algorithms to determine optimal node splits, creating sub-nodes that increase homogeneity (node purity) with respect to the target attribute. The evaluates all available variables for potential splits and selects the one that yields the most homogeneous sub-nodes. Details about the methodology can be found in [19].
3. Results
Table 1 shows that most respondents to the electronic questionnaire were from the Cerrado (35.11%) and Atlantic Forest (34.27%) biomes, followed by the Caatinga (13.06%), Amazon (9.27%), Pampa (7.16%) and Pantanal (1.12%). Respondents indicated whether the analyzed technological practices were used on their properties.
Approximately 49.44% of participants identified as rural producers. The remaining respondents included technical assistance and rural extension agents (20.00%), private consultants (12.92%), and technicians from private companies related to agriculture (10.95%).
Table 2 lists the significant technological and contextual variables (p>0.05) identified using the stepwise method, for each technology deemed important by the pasture specialists.
3.1. Soil Analysis (PAnlSolo)
Table 3 presents the estimates and standard errors for the intercept and the parameters of the contextual variables: Fanalsolo (performs soil analysis for pasture formation); PCorrection (soil correction with limestone); and PMacro (fertilization with nitrogen, phosphorus, potassium, or sulfur).
When producers perform soil analysis during pasture formation, they likely also apply limestone and fertilization. Under these conditions, the average probability of conducting soil analysis in already established pastures is 97.28%. In contrast, when these technological practices are not adopted, the probability drops to 2.81%.
In the Hosmer-Lemeshow test, performed with 4 degrees of freedom, the test statistic was 2.76 (P = 0.59), indicating no significant difference between observed and expected values and, therefore, a good model fit. This result is consistent with the area under the ROC curve.
Figure 1 shows the ROC curve for the model analyzing the dependent variable PAnlSolo, with an AUC estimate of approximately 95%., which can be considered excellent.
To asses knowledge acquisition, a decision tree (DT) was constructed using the dataset to guide the decision-making process through a tree-like structure. Decision tree models enhance interpretability and rule transparency, which can increase users' confidence in employing them as decision-support tools for systematizing the adoption of technologies [22]. The trees were generated using Weka 3.8 software and the J48 classifier, an implementation of the C4.5 algorithm [23].
Each survey response constituted a data instance, and a response variable (PAnlSolo) was defined as the target attribute. For this binary variable, the model recorded either occurrence (Y) or non-occurrence (N) of soil analysis in established pastures. The decision tree was built using the four attributes identified by the binary logistic regression: the target attribute (PAnlSolo) and the predictors Fanalsolo (performs soil analysis during pasture formation); PCorrection (soil correction with limestone); and PMacro (fertilization with N, P, K, or S).
Figure 2 presents the decision tree constructed using the information gain criterion, based on Shannon Entropy estimates [24]. Of the 712 instances, 80% were used to train the algorithm. The model’s performance is summarized as follows: (a) accuracy rate of 89.44%; (b) six leaves (rules), indicating a relatively simple and interpretable model structure; (c) Kappa statistic of 0.78, which reflects substantial agreement between predicted and observed classes. The Kappa coefficient accounts for the agreement expected by chance and provides a more robust measure of classification performance. This value represents a substantial level of agreement [25].
Table 4 presents the decision rules and their respective confidence levels obtained through decision tree induction using the J48 algorithm. As expected, there was a strong connection between the technological attributes identified as significant in the logistic regression analysis and the target attribute (PAnlSolo). The model achieved an accuracy rate of 85.67%, indicating that the adoption of the PAnlSolo process is closely linked to the use of PCorrection, FAnalSolo and PMacro, supporting producer’s decision-making regarding soil analysis. The result of the soil analysis, whether conducted during pasture formation or in established pastures, provide essential parameters for calculating the need for soil amendments and fertilizers.
3.2. Monitoring and Control of the Pasture Stocking Rate (PTxLot)
Stocking rate is a complex variable influenced by a wide range of environmental and zootechnical factors. Defined as the number of animals per unit area, it reflects the concept of carrying capacity, that is, the level of grazing pressure that maintains a dynamic balance between animal gain and forage availability. Forage supply regulates the stocking rate and directly affects pasture quality and quantity. Thus, decision-making around stocking rate adjustment must consider the interaction between forage availability and livestock productivity [26].
Optimal grazing intensity refers to the ideal level of pasture utilization that maximizes livestock production without disrupting the ecological balance among plant species. There is a critical threshold of forage availability, which is the minimum amount required to maintain maximum animal intake and performance [27]. Below this point, gain per animal remains steady as stocking increase, potentially triggering pasture degradation and a decline in cattle body condition.
Table 5 presents the estimates and the standard errors for the intercept and parameters of nine contextual variables: areapec (livestock area), FContInv (weed control during pasture establishment); PCurvaNivel (use of contour terraces); PPlan (planning of forage production sectors); PAnlSolo (soil analysis); Fanalsolo (performs soil analysis in the formation); PMicro (micronutrient fertilization); PInvHerb (herbicide-based weed control); PManagement (monitoring and control of grazing frequency and intensity).
Figure 3 presents the ROC curve for the model analyzing the dependent variable PTxLot, with an AUC estimate of 87%, indicating a very good model fit. Although the Hosmer-Lemeshow test result was not statistically significant (p > 0.05), it was near the threshold. The test, performed with 8 degrees of freedom, yielded a value of 14.49 (p = 0.0698), suggesting the model is adequately specified.
Producers with livestock areas between 1,001 and 2,500 hectares and who adopt the associated technological practices have a 97.54% probability of also implementing pasture stocking rate monitoring and control. In contrast, producers with the same land area who do not adopt these technologies have only a 13.89% probability of using stocking rate control as a management tool. Figure 4 illustrates that as the livestock area increases and technological practices related to stocking rate monitoring are adopted, the likelihood of implementing stocking rate also increases.
Figure 5 illustrates the decision tree induced using the J48 algorithm, with 70% of the instances allocated for training and PTxLot as the target attribute. Due to the large number of leaves (over 30), interpreting the resulting rules became complex. To address this, a tree pruning strategy was applied based on a calculated error estimate. The J48 algorithm was used to compute this estimate using the training dataset [28].
The Kappa statistics and accuracy were estimated at 0.47 and 76.63%, respectively. The Kappa value indicates a moderate level of agreement. To improve the interpretability of the decision rules, the pruning parameter was adjusted from the default 25% to 15%. This modification reduced the number leaves from 30 to 8, thereby facilitating a clearer understanding of the target attribute. However, two variables (Areapec and PCurvaNivel) were deemed non-informative in the final model.
Table 6 presents the decision rules associated with the adoption of the stocking rate control technology, generated through the J48 decision tree algorithm. The results highlight the complexity of stocking rate management, which is influenced by numerous factors, some of which are beyond direct control. Stocking rate is a fundamental concept in pasture management [29]. A proper understanding of related terms such as stocking rate, grazing pressure, and carrying capacity, is essential. This aligns with the first attribute, PManagement (monitoring and control of plant grazing frequency and intensity), which serves as the root node of the decision tree.
3.3. Soil Correction with Limestone (PCorrection)
The use of limestone and fertilizers is essential for the intensification of pasture management [30]. Limestone plays a key role in correcting soil acidity, as the neutralization process requires direct contact between soil particles and either the limestone itself or its by-products. Consequently, effective incorporation of limestone into the soil is necessary, although this is not always feasible, depending on field conditions [31]. According to [32], the availability of soil moisture required for the chemical reaction of limestone is more critical than the time interval between liming and sowing.
Table 7 presents the estimated coefficients and standard errors for the intercept and four independent variables: PCorrection (soil correction with limestone); PAnlSolo (soil analysis); FCorSolo (performs soil correction during formation); PMacro (fertilization with N, P, K, or S); FAnalSolo (performs soil analysis in the formation).
Producers who adopt all four technological processes have a 94.18% probability of also performing soil acidity correction using limestone. The Hosmer-Lemeshow test yielded a statistic of 6.5306 with five degrees of freedom, which was not statistically significant (P=0.2580), indicating a good model fit. This result is consistent with the model’s performance shown in the ROC Curve (Figure 5), which presented an AUC value of 93.12%, indicating a very good level of discrimination. The overall model fit is further illustrated in Figure 6.
Figure 7 presents the induced decision tree, generated using 70% of the instances for training. The target attribute was PCorrection, and, as expected, PAnalSolo was selected as the root node, indicating it as the most important predictor. Since nutrient availability is influenced by soil pH, correcting soil acidity enhancing fertilizer use efficiency, which supports the observed association between PCorrection and PMacro (macronutrient fertilization). Interestingly, although PMacro was statistically significant in the binary logistic regression model, it was excluded from the J48 decision tree due to its low information gain. Information gain quantifies an attribute’s ability to partition the data into distinct categories. The attribute with the highest gain is selected for each node, with the root node representing the most informative variable [33].
The Kappa index and accuracy were calculated at 0.6971 and 85.05%, respectively. The Kappa value indicates a substantial level of agreement. The decision tree generated six classification rules (i.e. leaves). Table 8 presents the analysis of these six rules, highlighting the importance of alignment between the target attribute (PCorrection) and the strategies of conducting soil analysis (PAnlSolo) and implementing soil correction during pasture formation (FCorSolo). The rules exhibited high confidence levels (over 90%), which indicates strong consistency among the technological practices. This alignment is to some extent expected, considering that rural producers increasingly have access to technical information from diverse sources. Moreover, due to the high cost of soil correction with limestone, producers tend to adopt more precise and efficient practices to ensure the effectiveness of this input.
3.4. Rotation Grazing (PRotacio).
Over time, pasture specialists have analyzed grass defoliation patterns to better understand how the frequency, intensity, and uniformity of grazing affect the development of forage plants and grazing animals. Research in this area has documented the physiological responses of grasses to grazing, demonstrating that increased defoliation intensity or frequency generally leads to reductions in biomass and plant productivity, though the magnitude of these effects varies accross species.
According to [34], who conducted experiments within real production systems, the adoption of rotational grazing using multiple paddocks increased spatial and temporal heterogeneity of the grass, as well as the variation in defoliation frequency among paddocks. This approach enabled producers to improve grazing management in temperate pastures. In contrast, in a scenario and risk analysis of a rotational beef cattle system, [35] found that although profitability increased, the system was characterized by low attractiveness and a high probability of economic losses. These findings underscore that the effectiveness of rotational grazing depends on a correct understanding of the mechanisms of biomass production under a wide range of environmental conditions [36].
Table 9 presents the estimated coefficients and standard errors for the intercept and three contextual variables: Biome; PAnlSolo (soil analysis); and FMacro (fertilization during pasture formation).
The results presented in the table suggest that a producer whose property is located in the Atlantic Forest biome and who conducts both soil analysis and fertilization during pasture formation has a 78.74% probability of adopting rotational grazing as a herd management strategy. Conversely, a producer in the same biome who does not implement these practices has only a 35.78% likelihood of adopting rotational grazing. Figure 8 illustrates the probabilities of rotational grazing adoption across different biomes, according to whether or not other technological processes are employed.
It is noteworthy that the probability of adopting the rotational grazing technological process is particularly high in the Amazon and Atlantic Forest biomes (over 80% among producers who also adopt other technological practices). Even among producers who do not implement the related technologies, the probability remains above 40%. Pastures possess significant potential for atmospheric carbon sequestration, with efficient storage occurring in the soil through the development of grass root systems. Additionally, well-managed grazing can reduce the age at slaughter, thereby contributing to the mitigation of methane emissions. Furthermore, ongoing research aimed at enhancing technological efficiency in fire and deforestation prevention, as well as pasture restoration, is expected to generate substantial positive impacts. Such advances will further optimize and strengthen the role of rotational grazing systems in sustainable livestock production [37].
Figure 9 presents the ROC curve for the model analyzing the dependent variable Protacio (adoption of rotational grazing), with an estimated AUC of 73%, which indicates a good level of model discrimination. The Hosmer–Lemeshow test yielded a statistic of 4.797 with seven degrees of freedom and was not statistically significant (P = 0.6929), suggesting a good fit of the model to the data.
Figure 10 presents the induced decision tree, generated using 80% of the instances for training. The target attribute was PRotacio, with PAnlSolo selected as the root node, indicating it as the most important predictor. Although the Biome attribute was statistically significant in the logistic regression analysis, it was excluded from the decision tree by the J48 algorithm due to its low information gain, that is, it did not contribute meaningfully to partitioning the data into distinct categories. The Kappa index was estimated at 0.5015, indicating a moderate level of agreement. Overall, 77.46% of the instances were correctly classified.
Three leaves (rules) were determined, as presented in Table 10.
The adoption of PAnlSolo guides the entire decision-making process related to the adoption of rotational grazing. These findings are consistent with [37], who emphasizes the need for further research to better understand and harness the interactions between soil analysis, nitrogen fertilization, and defoliation intensity, particularly in tropical species. Such studies are essential for identifying the most efficient grazing system strategies, with the dual goals of maximizing productivity per area and minimizing negative environmental impacts.
4. Discussion
Soil analysis is essential for understanding soil health and its nutrient composition, which directly influences pasture productivity. Tecniques for soil evaluation help identify nutrient deficiencies and excesses, allowing for informed decisions regarding fertilization and soil amendments. Furthermore, soil carbon dynamics indicate that improved pasture management, originating from thorough soil assessment, can augment soil carbon stocks, thereby contributing to environmental sustainability [38]. Effective soil management practices, including liming, lead to increased soil fertility and, consequently, higher forage yield and quality, thereby supporting improved stocking rates [39]. Thus, soil analysis serves as the foundation for all subsequent pasture management practices. Effective stocking rate management helps maintain a balance between animal demand and pasture supply, thereby preventing overgrazing and pasture degradation.
The adverse effects of excessive stocking rates, which can lead to reduced biomass and biodiversity in pastures, while optimal rates can enhance overall productivity and sustainability [40]. Findings support that lower stocking rates generally yield better pasture variability and productivity, reinforcing the need for careful management [41].
Soil correction with lime is a necessary practice for addressing soil acidity, commonly prevalent in many pasturelands. The applying lime significantly elevated pasture production, emphasizing that soil pH plays a crucial role in nutrient availability and, consequently, plant growth [42]. Therefore, limestone application not only aids in ameliorating soil chemistry but also enhances ecological conditions needed for robust pasture growth.Rotational grazing can optimize pasture utilization and animal weight gain compared to continuous grazing systems [43]. The adjusting grazing intervals in rotational systems allows for greater forage accumulation, positively impacting animal growth rates and pasture health [44].
This practice aligns with point towards optimal animal gain being achievable at suitable stocking rates, further strengthened by the integration of rotational grazing methods. Implementing these strategies ensures not only the health of the pasture but also optimizes livestock performance and contributes to long-term agricultural resilience.
5. Conclusions
The combination of parametric (inferential) and non-parametric (non-inferential) methodologies represents a promising and practical analytical strategy. In this article, the integration of binary logistic regression and decision tree induction proved to be a potentially effective strategy. Nevertheless, further applications across different areas of agribusiness are needed to consolidate this strategy as a robust framework for knowledge discovery and extraction.
Supplementary Materials
The following supporting information can be downloaded at the website of this paper posted on Preprints.org.
Author Contributions
Conceptualization, U.G.P.A, P.M.S., H.P.L. and P.B.F.; methodology, U.G.P.A, P.M.S., H.P.L. and P.B.F.; software, U.G.P.A. and H.P.L.; validation, U.G.P.A. and P.M.S.; formal analysis, U.G.P.A, P.M.S., H.P.L. and P.B.F.; data curation, U.G.P.A and P.M.S.; writing—original draft preparation, U.G.P.A, P.M.S., H.P.L., J.G.A.B. and P.B.F; writing—review and editing, U.G.P.A, P.M.S., H.P.L., P.B.F., and J.G.A.B.; supervision, P.M.S. and P.B.F. ;funding acquisition, J.G.A.B. All authors have read and agreed to the published version of the manuscript.
Funding
This research received external funding from Fapesp (Proc. 2022/09319-9).
Conflicts of Interest
The authors declare no conflicts of interest.
References
- Malafaia, G. C.; Contini, E.; Dias, F. R. T.; Gomes, R. da C.; Moraes, A. E. L. de. Cadeia produtiva da carne bovina: contexto e desafios futuros. Campo Grande, MS: Embrapa Gado de Corte, 2021. (Embrapa Gado de Corte / Documentos, 291).
- Parente, L.; Ferreira, L. Assessing the spatial and occupation dynamics of the Brazilian pasturelands based on the automated classification of MODIS Images from 2000 to 2016. Remote Sensing. 2018. 10, 1-14. [CrossRef]
- INSTITUTO BRASILEIRO DE GEOGRAFIA E ESTATíSTICA. Censo Agropecuário. Disponível em: https://www.ibge.gov.br/estatisticasnovoportal/economicas/agricultura-e-pecuaria/9827-censoagropecuario. html?=&t=downloads. Acesso em: 01 março de 2019.
- Costa, F. P.; Rehman, T. Exploring the link between farmers' objectives and the phenomenon of pasture degradation in the beef production systems of Central Brazil. Agricultural Systems,., v. 61, p. 134-146, 1999. [CrossRef]
- Da Cunha, R. A. R., Wander, A. E., Ferreira, M. E., & Bettiol, G. M. (2021). Definição de áreas prioritárias para recuperação de pastagens degradadas e seu impacto econômico no vale do Araguaia, estado Goiás, Revista Agroecossistemas, 12(2), 34-50.
- Pezzopane, J.R.M., Santos, P.M., Evangelista, S.R.M., Bosi, C., Cavalcante, A. C. R., Bettiol, G.M., Gomide, C.A. de M., Pellegrino, G.Q. 2016. Panicum maximum cv. Tanzânia: climate trends and regional pasture production in Brazil. Grass and Forage Science, 72, 104-117. [CrossRef]
- Santos, P. M.; Telles, M. A.; Fragalle, C.V.P. 2019. Encontro de inovação em pastagens: relatório final / Edição Técnica. — São Carlos, SP: Embrapa Pecuária Sudeste. 30 p. – Embrapa Pecuária Sudeste. Documentos, 133.
- Martha Jr, G. B., Alves, E., Contini, E. 2012. Land-saving approaches and beef production growth in Brazil. Agricultural Systems, 110, 173-177. [CrossRef]
- Latawiec, A. E., Strassburg, B. B. N., Valetim, J. F.; Ramos, F., Alves-Pinto, H. N. 2014. Intensification of cattle ranching production systems: socioeconomic and environmental synergies and risks in Brazil. Animal, 8, 1255-1263. [CrossRef]
- Lopes, M. A. 2017. O futuro da gestão de riscos na agropecuária. Revista de Política Agrícola, 26, 3-7. Disponível em: https://seer.sede.embrapa.br/index.php/RPA /article/view/1292 Acesso em: 06 jul. 2022.
- Landau, E., Silva, G.A., Moura, L., Hirsch, A., Guimarães D., 2020. Dinâmica da produção agropecuária e da paisagem natural no Brasil nas últimas décadas: cenário histórico, divisão política, características demográficas, socioeconômicas e ambientais. Brasília: Embrapa Milho e Sorgo.
- Garcia, A. B. 2013. The use of data mining techniques to discover knowledge from animal and food data: Examples related to the cattle industry. Trends in food science & technology, 29, 151-157. [CrossRef]
- Fote, F. N., Roukh, A., Mahmoudi, S., Mahmoudi, S. A., & Debauche, O. 2020. Toward a big data knowledge-base management system for precision livestock farming. Procedia Computer Science, 177, 136-142. [CrossRef]
- De Abreu, U.G.P.; Lopes, P.S.; Torres, R.d.A.; Santos, H.d.N. Evaluation of new management technologies on the performance and culling rate of Pantanal beef cows. Rev. Bras. De Zoot. 2006, 35, 2496–2503. [Google Scholar] [CrossRef] [Green Version].
- Fávero, L. P., Belfiore, P., Silva, F. L. da, Chan, B. L. 2009. Análise de dados – Modelagem multivariada para tomada de decisões. Rio de Janeiro: Elsevier. 646p.
- Bissacot, A.C.G., Salgado, S.A.B., Balestrassi, P.P., Paiva, A.P., Zambroni Souza, A.C., Wazen, R. 2016. Comparison of neural networks and logistic regression in assessing the occurrence of failures in steel structures of transmission lines. The Open Electrical & Electronic Engineering Journal, 10, 11-26. [CrossRef]
- Bhargava, N., Sharma, G., Bhargava, R., & Mathuria, M. (2013). Decision tree analysis on j48 algorithm for data mining. Proceedings of international journal of advanced research in computer science and software engineering, 3(6).
- Vieira, E. M. de A; Neves, N. T. de A. T.; Oliveira, A. C. C, de O; Moraes, R. M de; Nascimento, J. A do. 2018. Avaliação da performance do algoritmo J48 para construção de modelos baseados em árvores de decisão. Revista Brasileira de Computação Aplicada. 10, 80–90.
- Izenman, A. 2008. Modern Multivariate Statistical Techniques. Springer Texts in Statistics, Springer, New York .731 p.
- Cardoso, E. L., Fernandes, A. H. B. M.; Fernandes, F. A. 2009. Análise de solos: finalidade e procedimentos de amostragem. Corumbá: Embrapa Pantanal. 5p. Embrapa Pantanal. Comunicado Técnico, 79.
- Coelho, A. M., de França, G. E., Pitta, G. V., Alves, V. M. C. 2002. Amostragem de solos: a base para a aplicação de corretivos e fertilizantes. Sete Lagoas: Embrapa Milho e Sorgo. 4p Embrapa Milho e Sorgo. Comunicado Técnico 42.
- Megeto, G. A. S., Oliveira, S. R. de M., Del Ponte, E. M., Meira, C. A. A. 2014. Árvore de decisão para classificação de ocorrências de ferrugem asiática em lavouras comerciais com ase em variáveis meteorológicas. Revista Engenharia Agrícola, 34, 590-599.
- Quinlan, J.R. C4.5: Programs for Machine Learning. 1993. Morgan Kaufmann, San Francisco, CA, USA.
- Witten, I.H.; Frank, E.; Hall, M.A. 2011. Data mining: practical machine learning tools and techniques. 3rd ed. San Francisco: Morgan Kaufmann.
- Landis, J. R., Koch, G. G. 1977. The measurement of observer agreement for categorical data. Biometrics, 33, 159-174. [CrossRef]
- Euclides, V. P. B. 2001 Produção intensiva de carne bovina em pasto, in: II Simpósio de Produção de Gado de Corte, Bittencourt, A., Ferreira, C.C.B., Figueiredo, F.C., Magalhães, K.A., Guimarães, J.D., Paulino, M.F., Valadares Filho, S.C. Eds, Suprema, 2 55-82.
- Mott, G. O. 1960 Grazing pressure and the measure of pasture production, In: International Grassland Congress, 8, Reading, Proceedings..., p. 606-611.
- Han, J., Kamber, M. 2001. Data Mining: Concepts and Techniques. 3rd. ed. San Francisco,CA: Morgan Kaufmann.
- Salman, A. K. D. Conceitos de manejo de pastagem ecológica. 2007. Porto Velho: Embrapa Rondônia. 19 p. Embrapa Rondônia. Documentos, 121.
- Bernardi, A. C. de C., Bueno, J. O. de A., Laurenti, N., Santos, K. E. L., Alves, T. C. 2018. Efeito da calagem e fertilizantes aplicados à taxa variável nos atributos químicos do solo e custos de produção de pastagem de capim Tanzânia manejadas intensivamente. Brazilian Journal of Biosystems Engineering, 12, 368-382.
- Weirich Neto, P. H., Caires, E. F., Justino, A., Dias, J. 2000. Correção da acidez do solo em função de modos de incorporação de calcário. Ciência Rural, 30, 257-261.
- Cabral, A. C. E., Cabral, C. H. A., Santos, A. R. M. , Motta, A. M., Mota, L. G. 2021. Impactos técnicos-econômicos da adubação de pastos. Nativa, 9, 173-181.
- Okada, H. K. R.; das Neves, A. R. N.; Shitsuka, R. 2019. Análise de algoritmos de indução de árvores de decisão. Research, Society and Development, 8, e298111473-e298111473. [CrossRef]
- Porensky, L. M., Augustine, D. J., Derner, J. D., Wilmer, H., Lipke, M. N., Fernández-Giménez, M. E., Briske, D. D. 2021. Collaborative adaptive rangeland management, multipaddock rotational grazing, and the story of the regrazed grass plant. Rangeland Ecology & Management, 78, 127-141.
- Simões, A. R. P., Moura, A.D., Rocha, D. T. 2006. Análise de risco do desempenho econômico de um sistema de recria de gado de corte em regime de pastejo rotacionado. Revista de Economia e Agronegócio. 5, 51-72.
- Nabinger, C. 1997. Eficiência do uso de pastagens: disponibilidade e perdas de forragem. In: Peixoto, A.M.; Moura, J.C.; Faria, V.P. Orgs. Fundamentos do pastoreio rotacionado. Piracicaba: FEALQ, p.213-251.
- Falesi, I. C., Barbosa, F. B. C., Lau, H. D., Dias-Filho, M. B., Baena, A. R. C., Bittencourt, I. C. F. P. M. 2009. Modernização da pecuária como fator de desenvolvimento econômico e proteção ambiental no Estado do Pará. Belém: IPADES. 46. 64 p.
- Orgill, S., Spoljaric, N., & Kelly, G. (2015). Soil carbon under perennial pastures; benchmarking the influence of pasture age and management. IOP Conference Series: Earth and Environmental Science, 25, 012018. [CrossRef]
- Purcell, M. M., DuPont, J. I., Somenahally, A., McLawrence, J., Case, C. L., Gowda, P. H., … & Yu, R. (2024). Long-term grazing and nitrogen management impacted methane emission potential and soil microbial community in grazing pastures. Environment &Amp; Health, 3(1), 68-78. [CrossRef]
- Galdino, S., Sano, E. E., Andrade, R. G., Grego, C. R., Nogueira, S. F., Bragantini, C., … & Flosi, A. H. G. (2015). Large-scale modeling of soil erosion with rusle for conservationist planning of degraded cultivated brazilian pastures. Land Degradation &Amp; Development, 27(3), 773-784. [CrossRef]
- Watson, S. E. and Whiteman, P. C. (1981). Grazing studies on the guadalcanal plains, solomon islands. 2. effects of pasture mixtures and stocking rate on animal production and pasture components. The Journal of Agricultural Science, 97(2), 353-364. [CrossRef]
- Bircham, J. S. and Crouchley, G. (1976). I. pasture production and botanical composition. New Zealand Journal of Experimental Agriculture, 4(1), 57-63. [CrossRef]
- Mccall, D., Pleasants, A. B., & Marshall, P. R. (1993). Plan conservatively when setting forward contracts for beef production from pasture. Proceedings of the New Zealand Grassland Association, 87-91. [CrossRef]
- Ates, S. & Louhaichi, M. (2012). Reflexions on agro-pastoralists in the WANA region: challenges and future priorities. Options Méditerranéennes 102, 511–516.
Figure 1.
- ROC curve of the binary logistic modeling, with the dependent variable Soil analysis (PAnlSolo) and the independent variables Fanalsolo; PCorrection; and PMacro. Source: Own elaboration.
Figure 1.
- ROC curve of the binary logistic modeling, with the dependent variable Soil analysis (PAnlSolo) and the independent variables Fanalsolo; PCorrection; and PMacro. Source: Own elaboration.
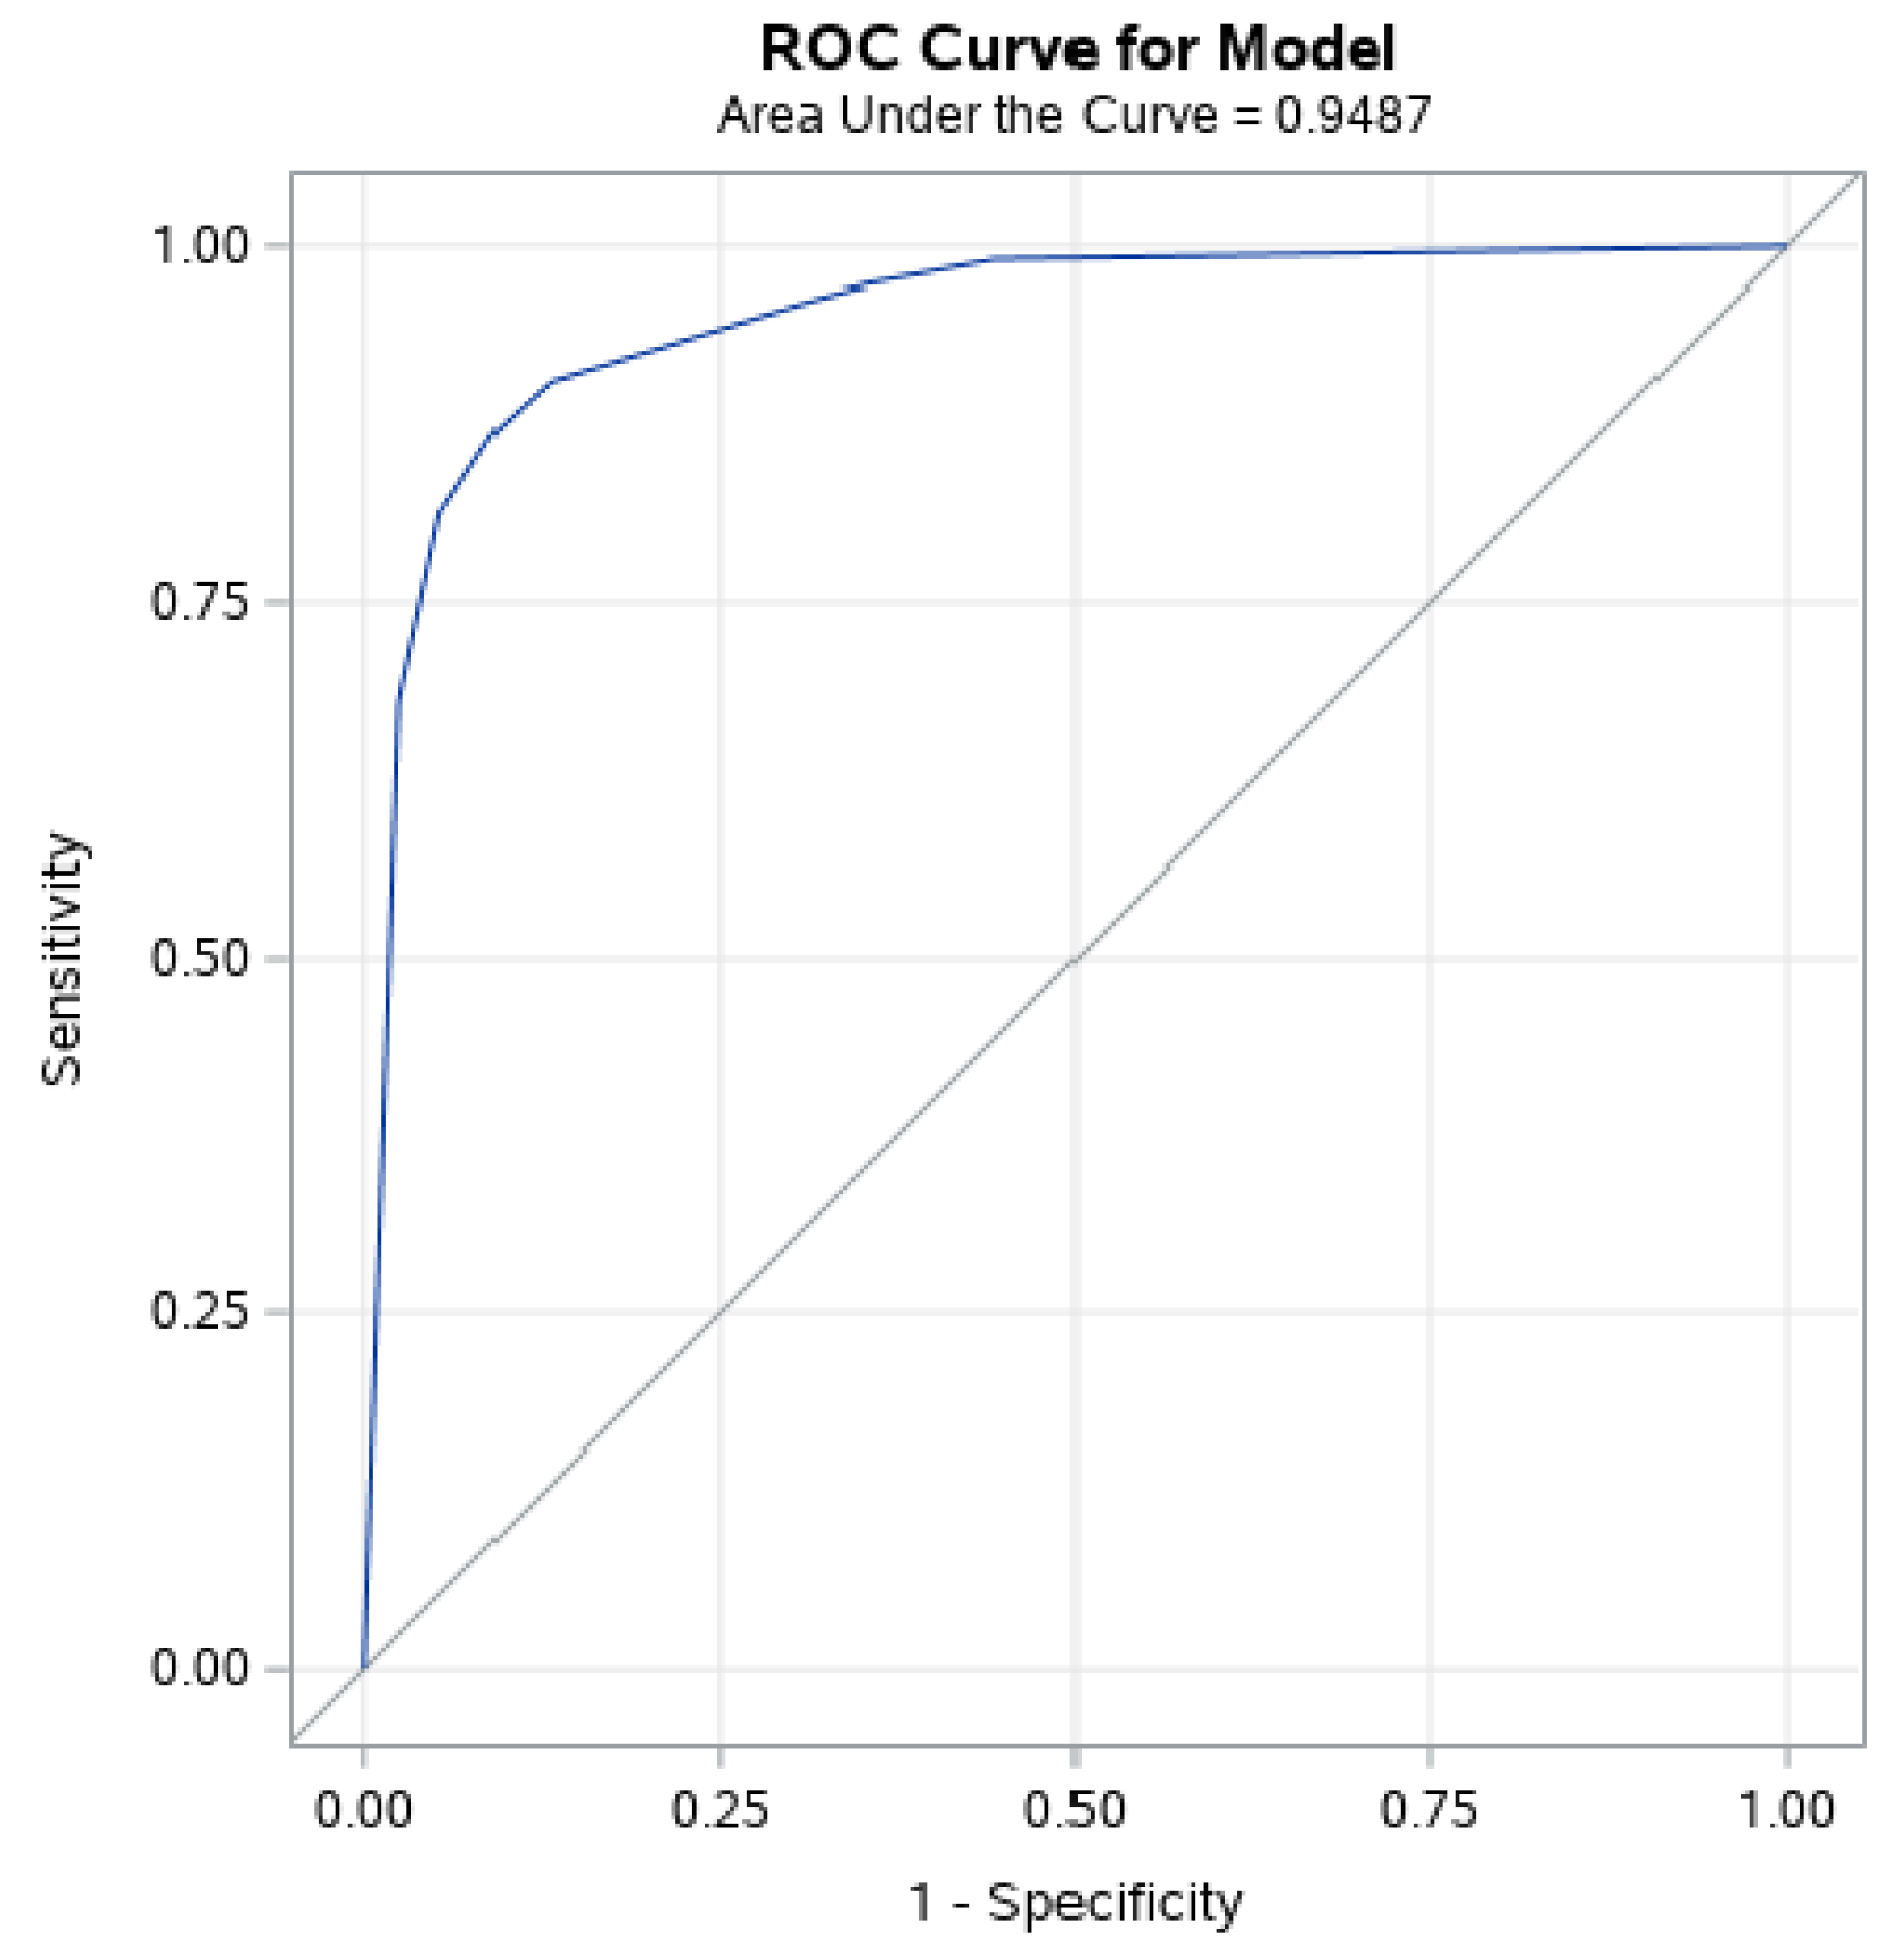
Figure 2.
- Decision tree for classifying individuals based on whether they use or do not use the soil analysis technological process. Source: Own elaboration.
Figure 2.
- Decision tree for classifying individuals based on whether they use or do not use the soil analysis technological process. Source: Own elaboration.
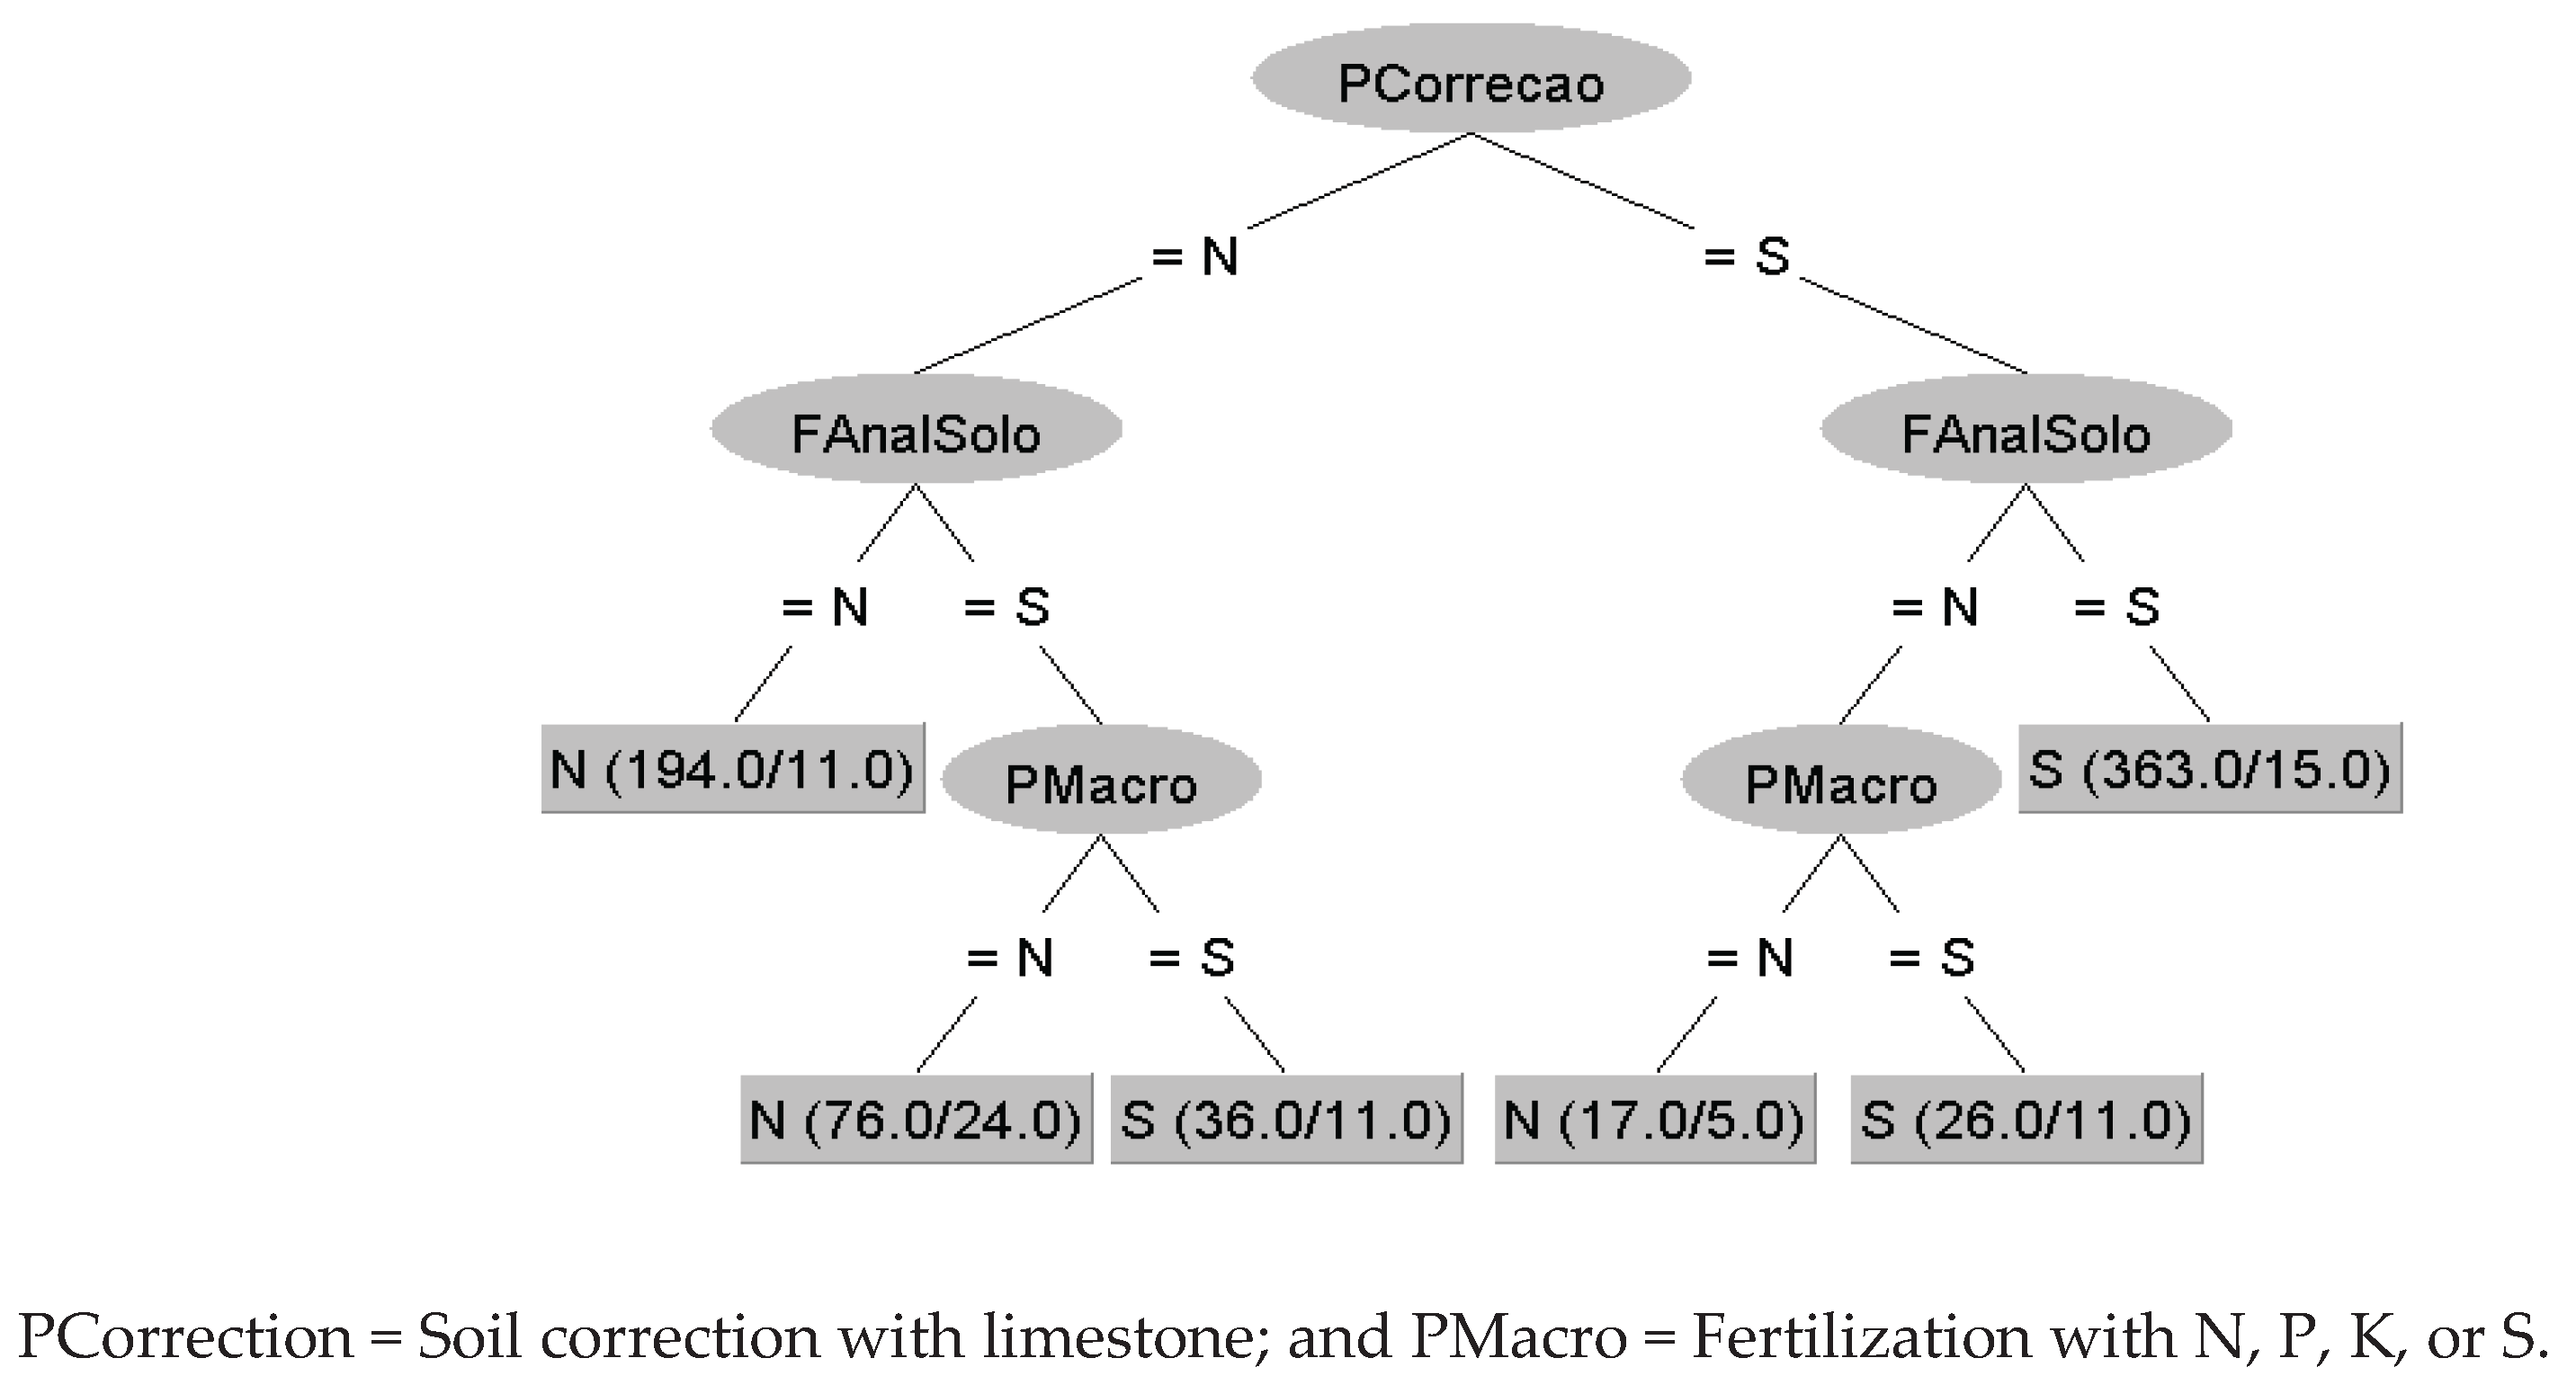
Figure 3.
ROC curve of the binary logistic regression model with the dependent variable Monitoring and control of pasture stocking rate (PTxLot), and the following independent variables: araepec (livestock area); FContInv (weed control during pasture establishment); PCurvaNivel (use of the contour terraces); PPlan (planning of forage production sectors on the property); PAnlSolo (soil analysis); PMicro (fertilization with micronutrients); PInvHerb (weed control using herbicides); PManagement (monitoring and control of grazing frequency and intensity). Source: Own elaboration.
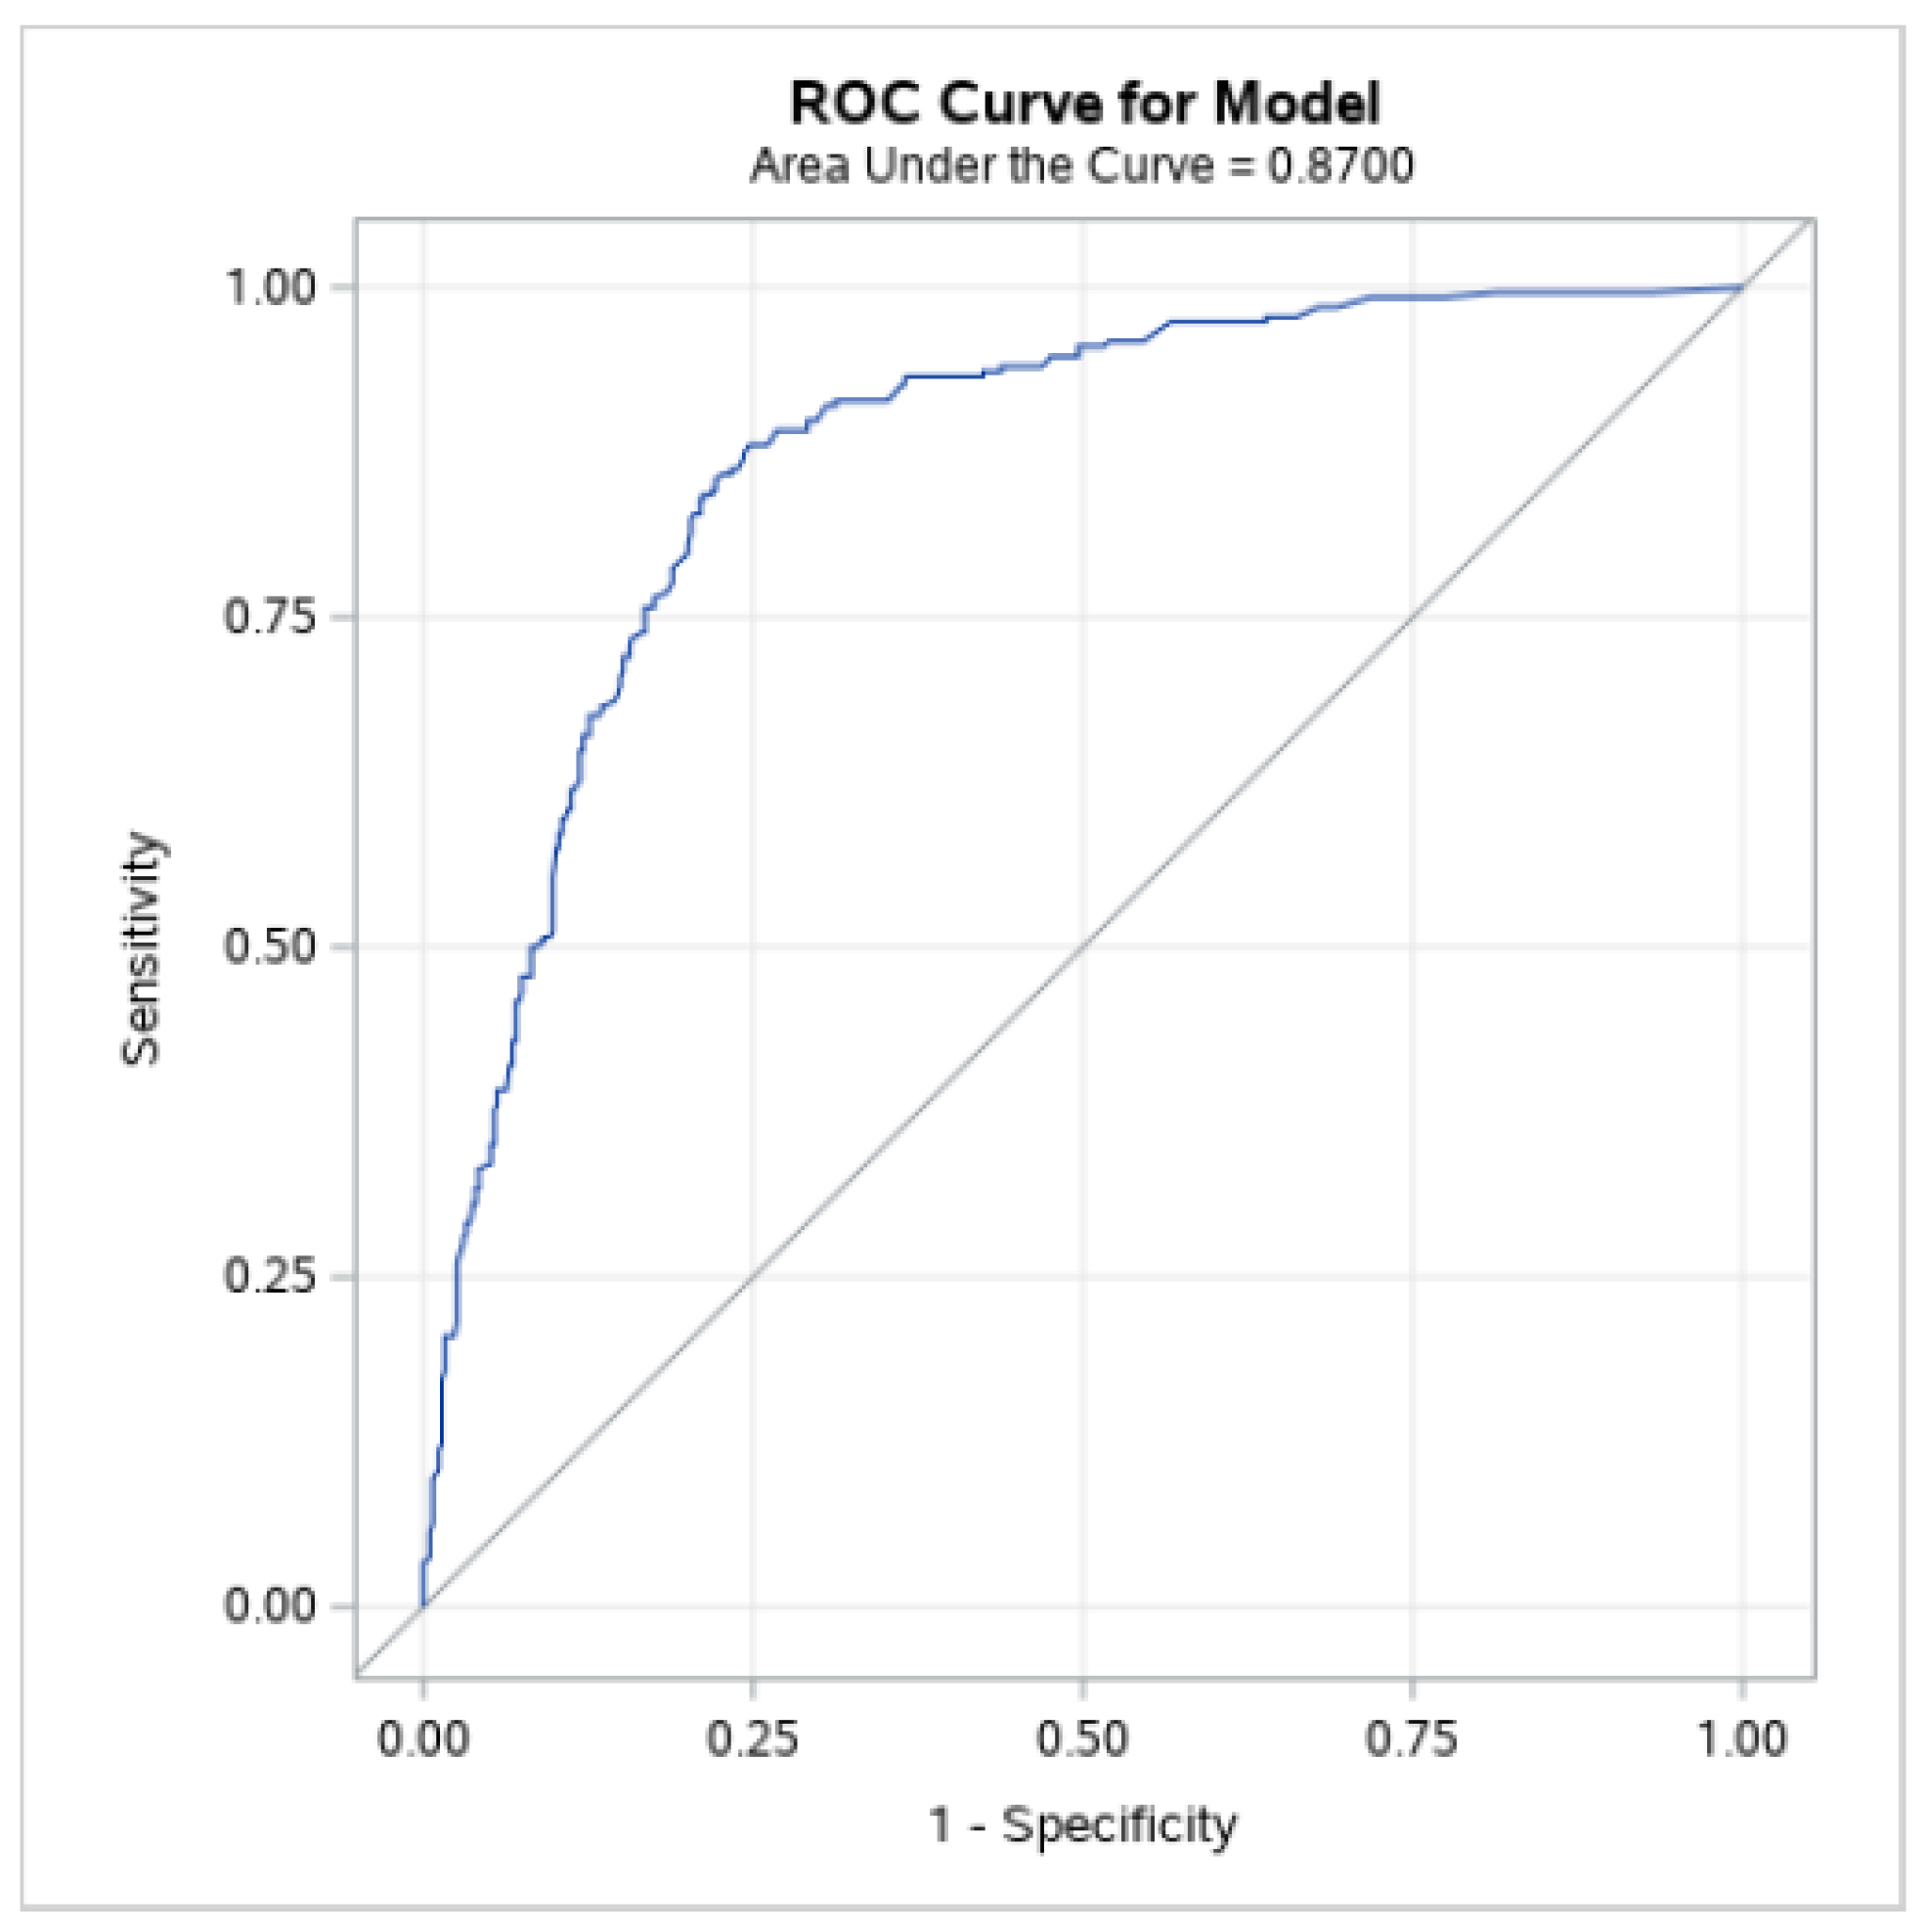
Figure 4.
- Estimated probabilities for the adoption of stocking rate adjustment technology by producers with different property sizes, based on whether other technological practices are adopted (PTxLot probability with other technologies) or not (PTxLot probability without other technologies). Source: Own elaboration.
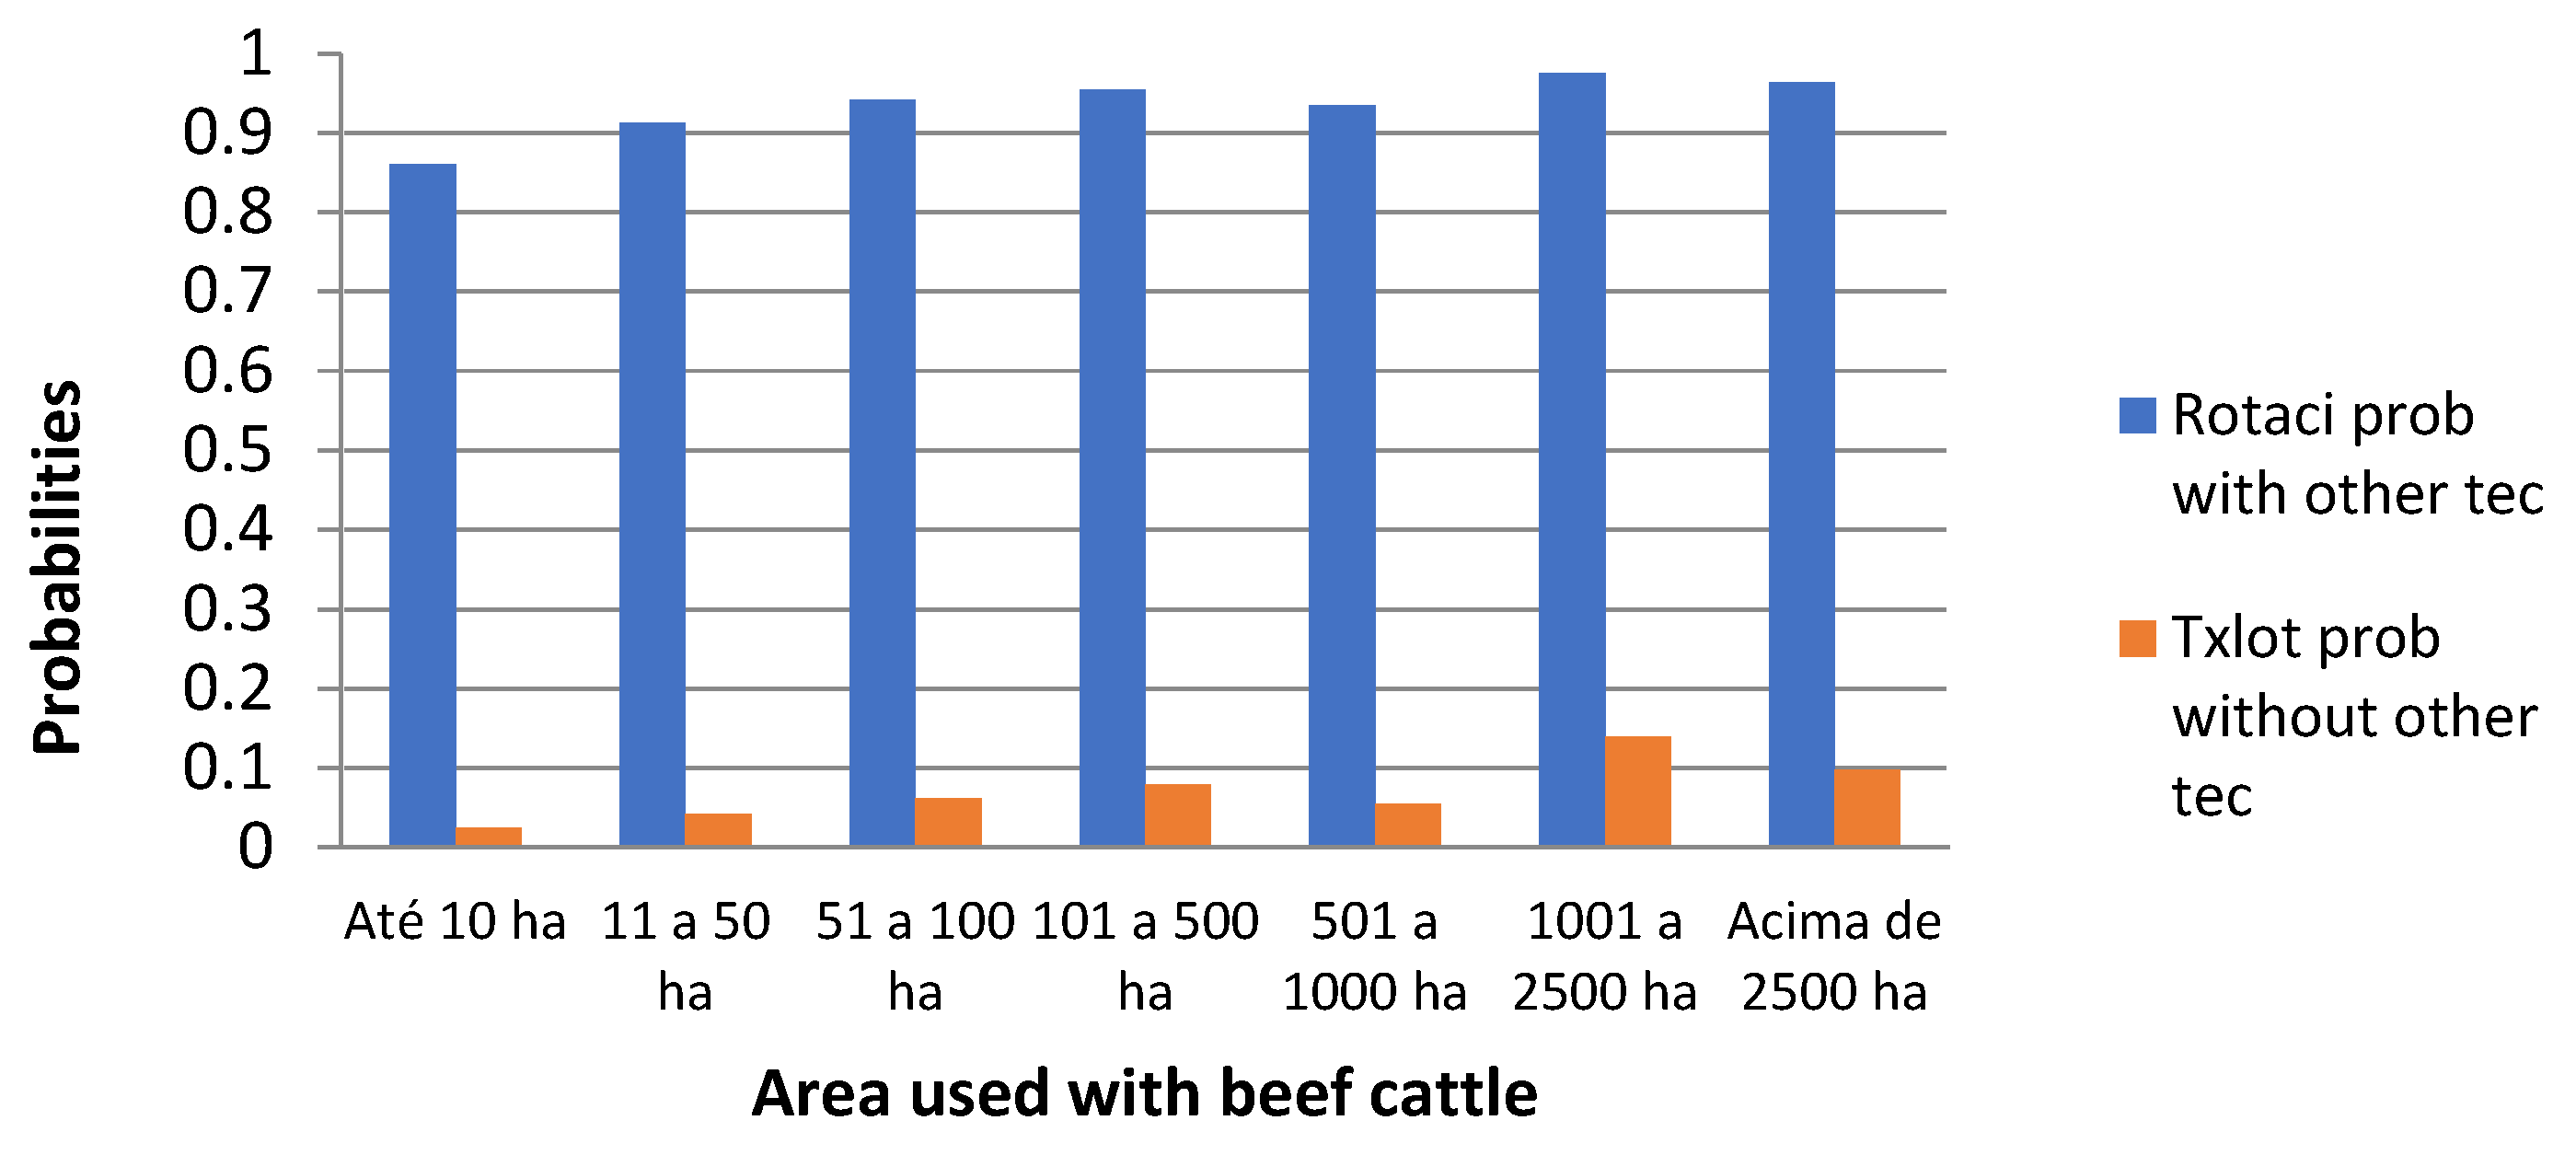
Figure 5.
- Decision tree for classifying individuals based on whether they use or do not use the technological process of pasture stocking rate control. F = Leaves; PManagement = Monitoring and control of plant grazing frequency and intensity; PAnlSolo = Soil analysis; PInvHerb = Control of invaders with the use of herbicides; PPlan = Planning of forage production sectors on the property; PMicro = Fertilization with micronutrients; FContInv = Control of invaders in the formation. Source: Own elaboration.

Figure 6.
- ROC curve of the binary logistic modeling, taking soil correction with limestone (PCorrection) as the dependent variable and ; PAnlSolo (soil analysis); FCorSolo (fertilization with N, P, K, or S); PMacro (fertilization with N, P, K, or S); FAnalSolo (performs soil analysis during formation). Source: Own elaboration.

Figure 7.
- Decision tree to classifying individuals according to the use or non-use of the technological process of soil correction with limestone (PCorrtion). PAnlSolo = soil analysis; FCorSolo = fertilization with N, P, K, or S; PMacro = fertilization with N, P, K, or S; FAnalSolo = performs soil analysis during formation. Source: Own elaboration
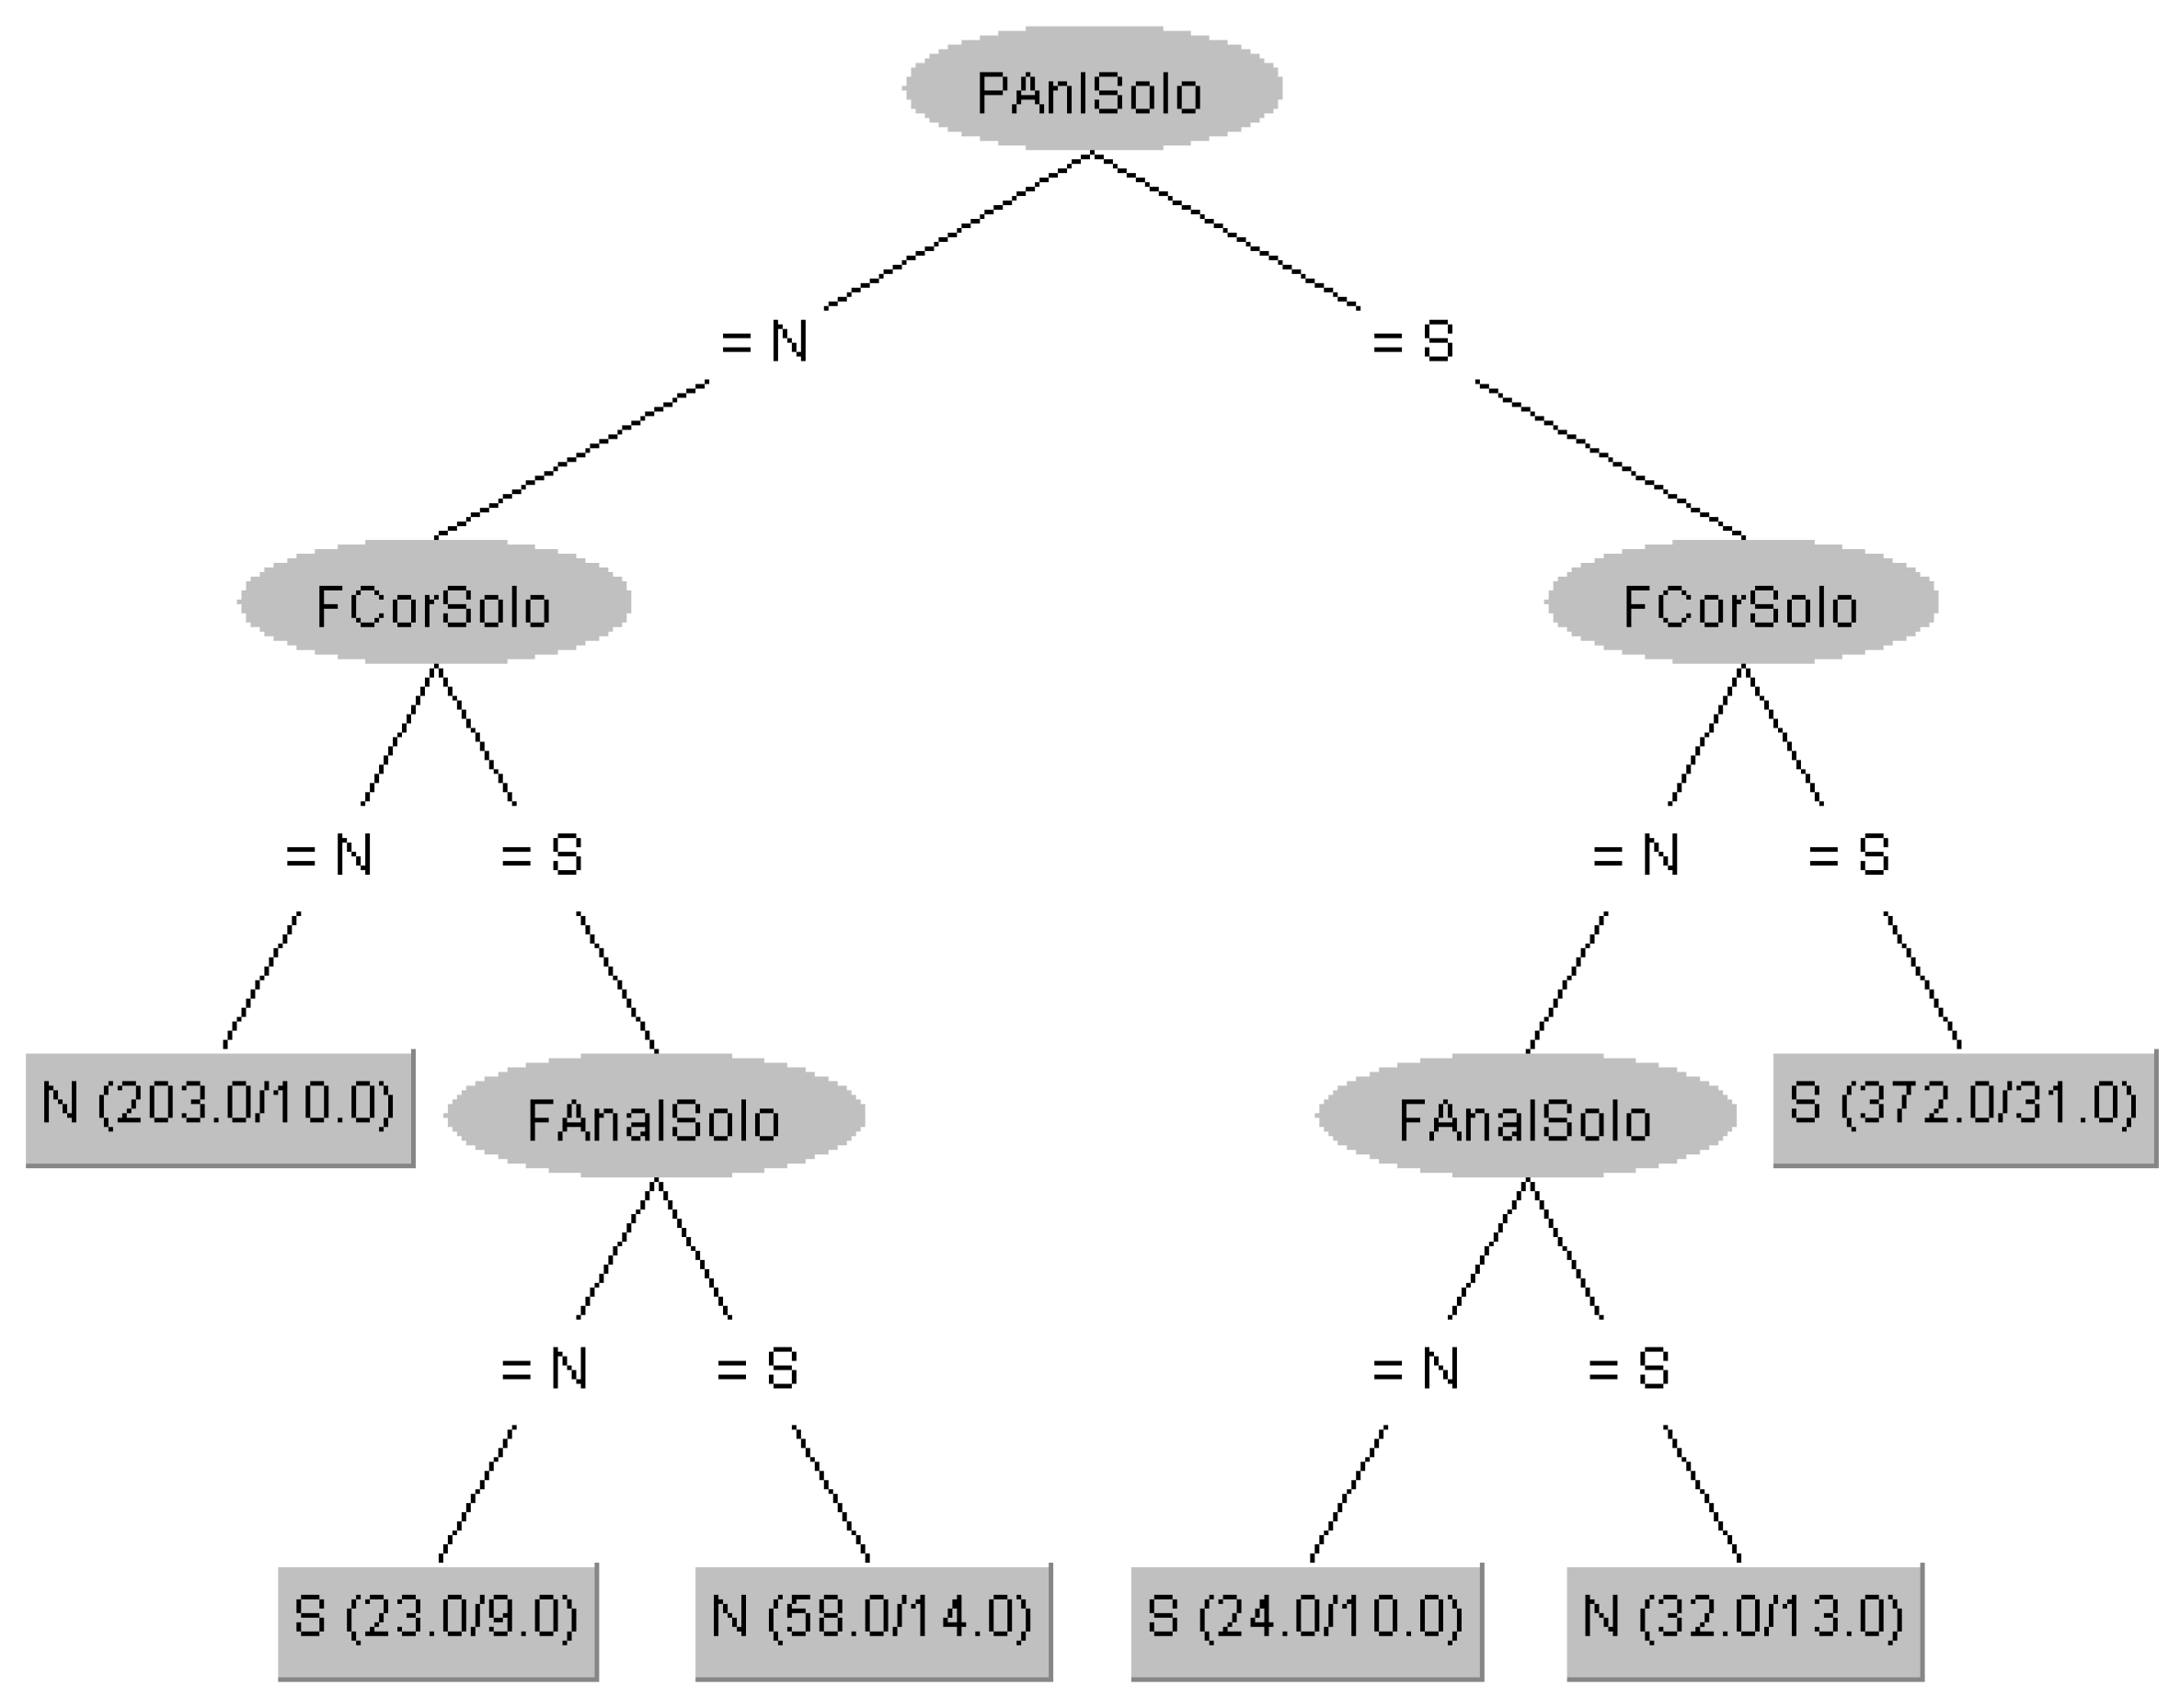
Figure 8.
- Estimated probabilities of rotational grazing technology adoption by producers across different biomes, based on the selection (Rotaci prob with other tec) or non-selection (Txlot prob without other tec) of other associated technological processes. Source: Own elaboration.
Figure 8.
- Estimated probabilities of rotational grazing technology adoption by producers across different biomes, based on the selection (Rotaci prob with other tec) or non-selection (Txlot prob without other tec) of other associated technological processes. Source: Own elaboration.
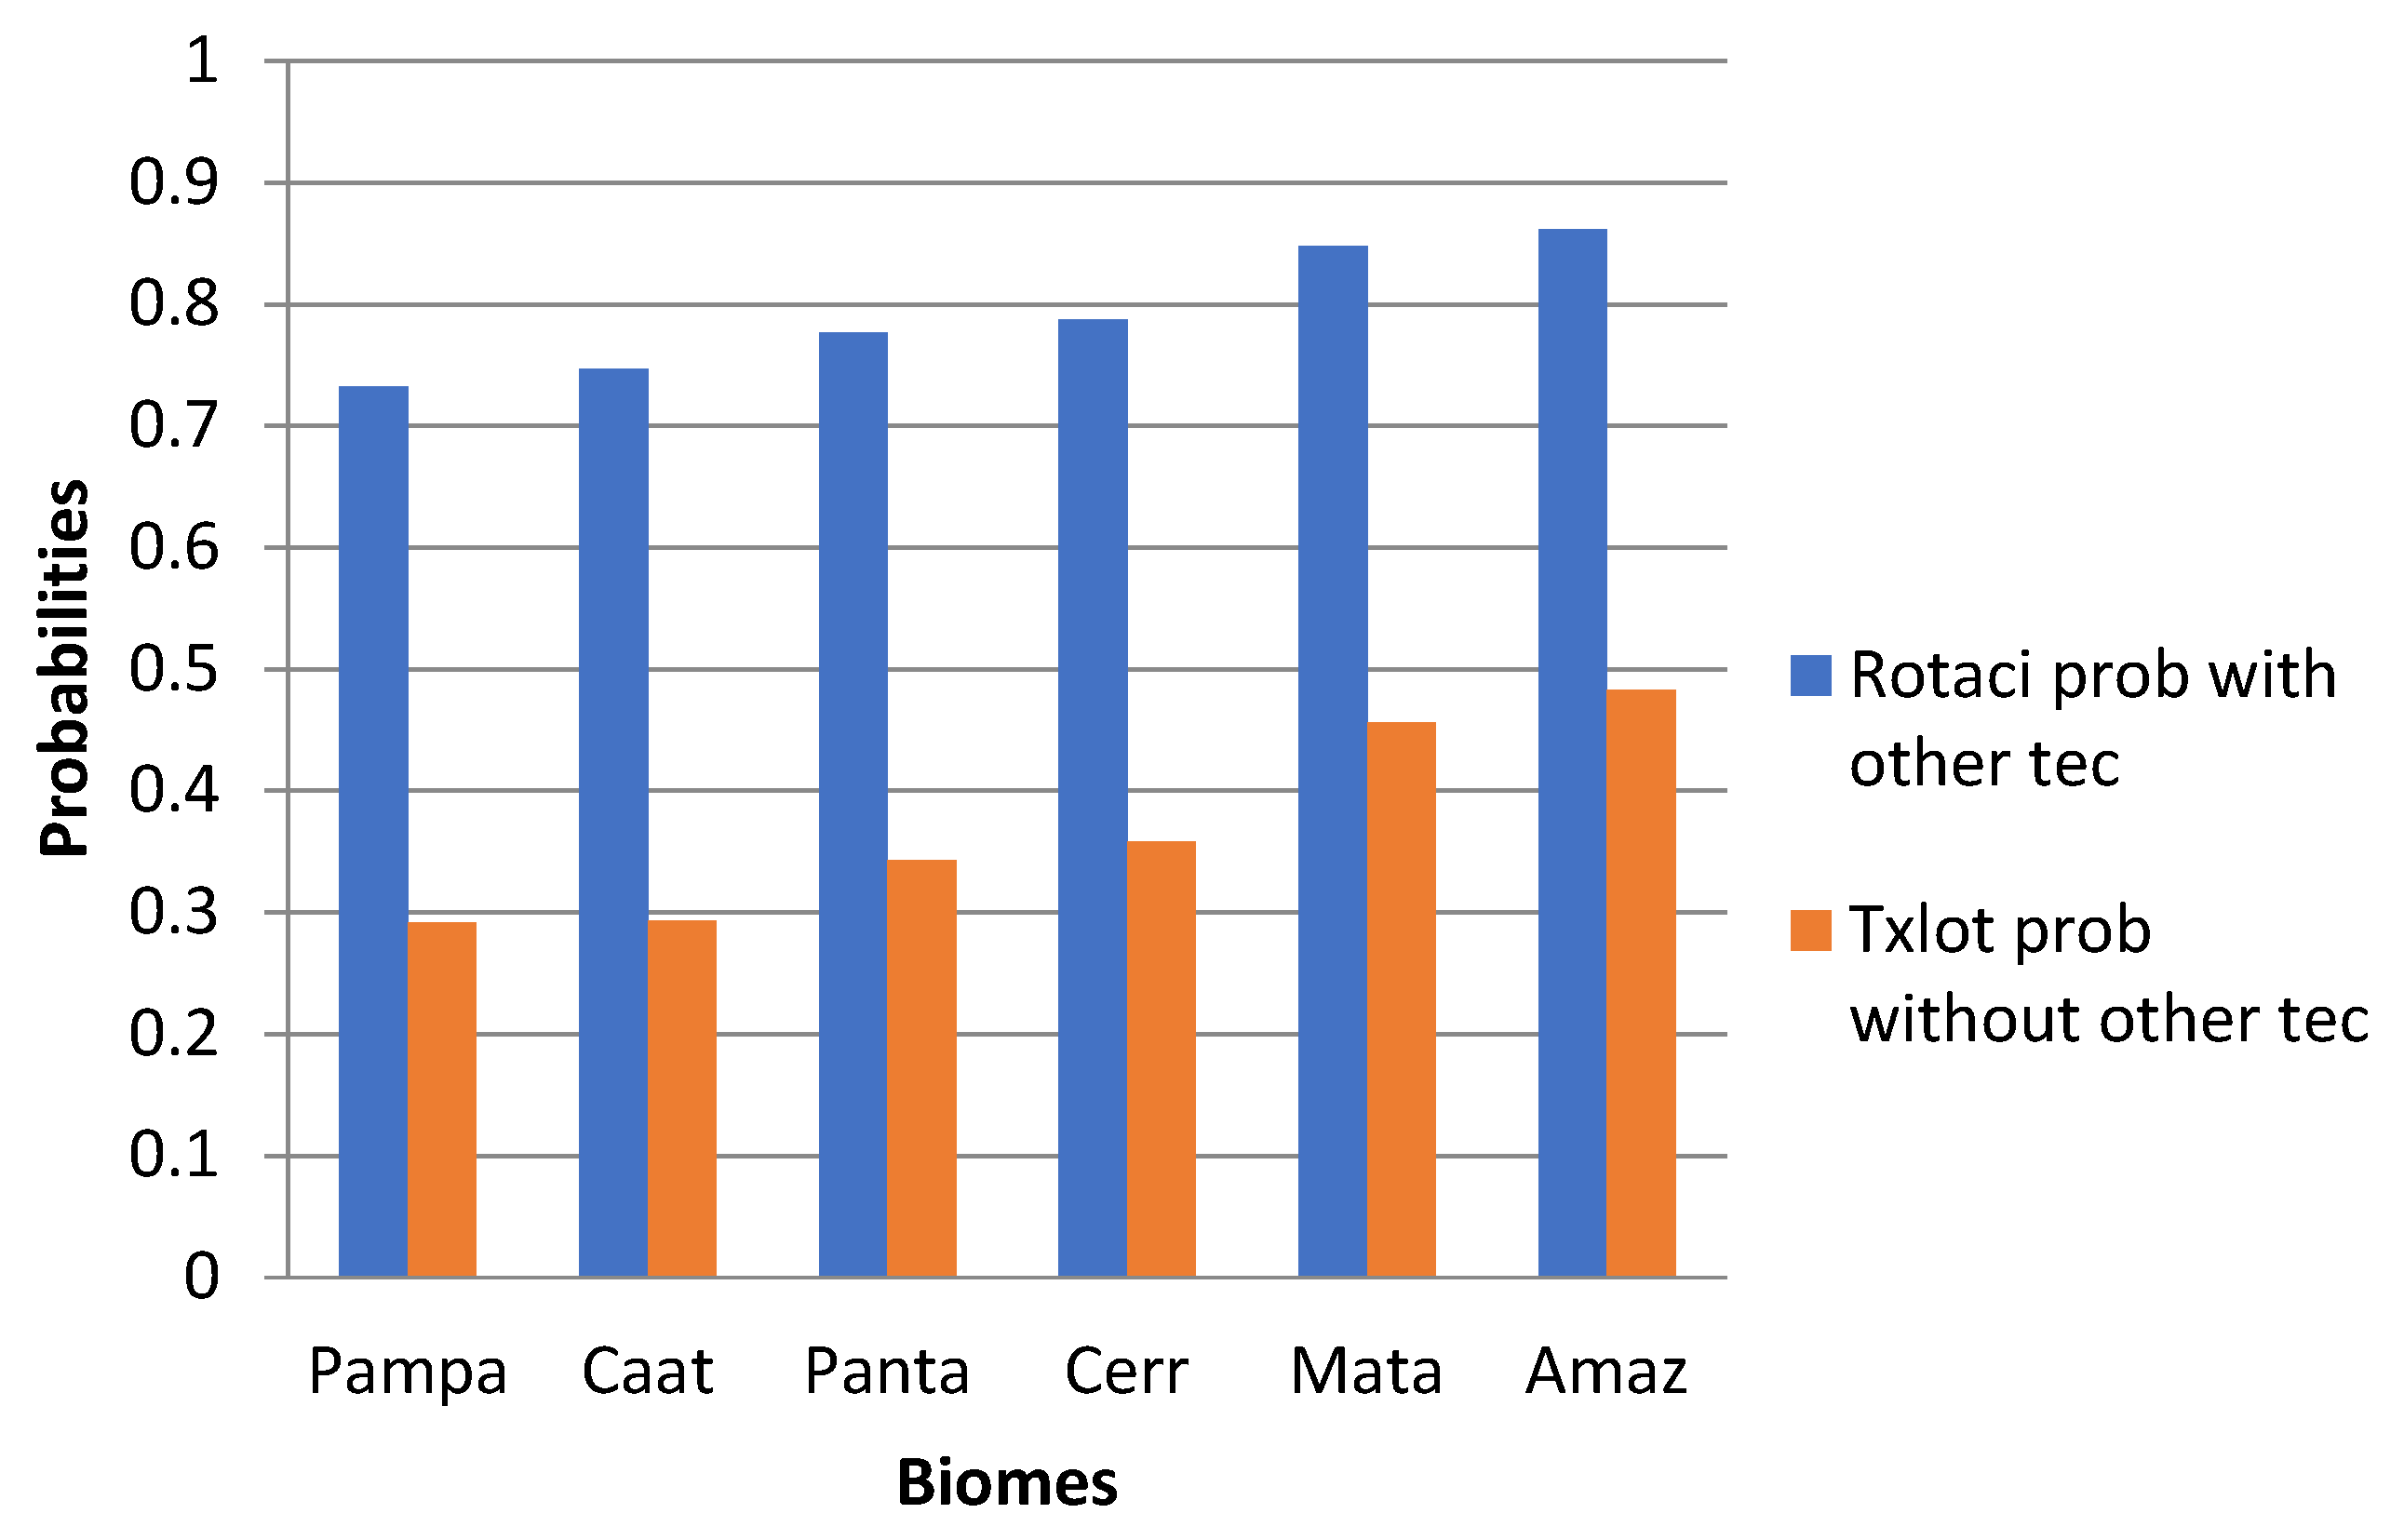
Figure 9.
- ROC curve of the binary logistic regression model with the dependent variable PRotacio (adoption of rotational grazing) and the independent variables: Biome; PAnlSolo (soil analysis); FMacro (fertilization with N, P, K, or S during pasture formation). Source: Own elaboration.
Figure 9.
- ROC curve of the binary logistic regression model with the dependent variable PRotacio (adoption of rotational grazing) and the independent variables: Biome; PAnlSolo (soil analysis); FMacro (fertilization with N, P, K, or S during pasture formation). Source: Own elaboration.

Figure 10.
- Decision tree for classifying individuals according to the use or non-use of the rotational grazing technological process (PRotacio). PAnlSolo = soil analysis; FMacro = fertilization with N, P, K, or S during pasture formation. Source: Own elaboration.
Figure 10.
- Decision tree for classifying individuals according to the use or non-use of the rotational grazing technological process (PRotacio). PAnlSolo = soil analysis; FMacro = fertilization with N, P, K, or S during pasture formation. Source: Own elaboration.
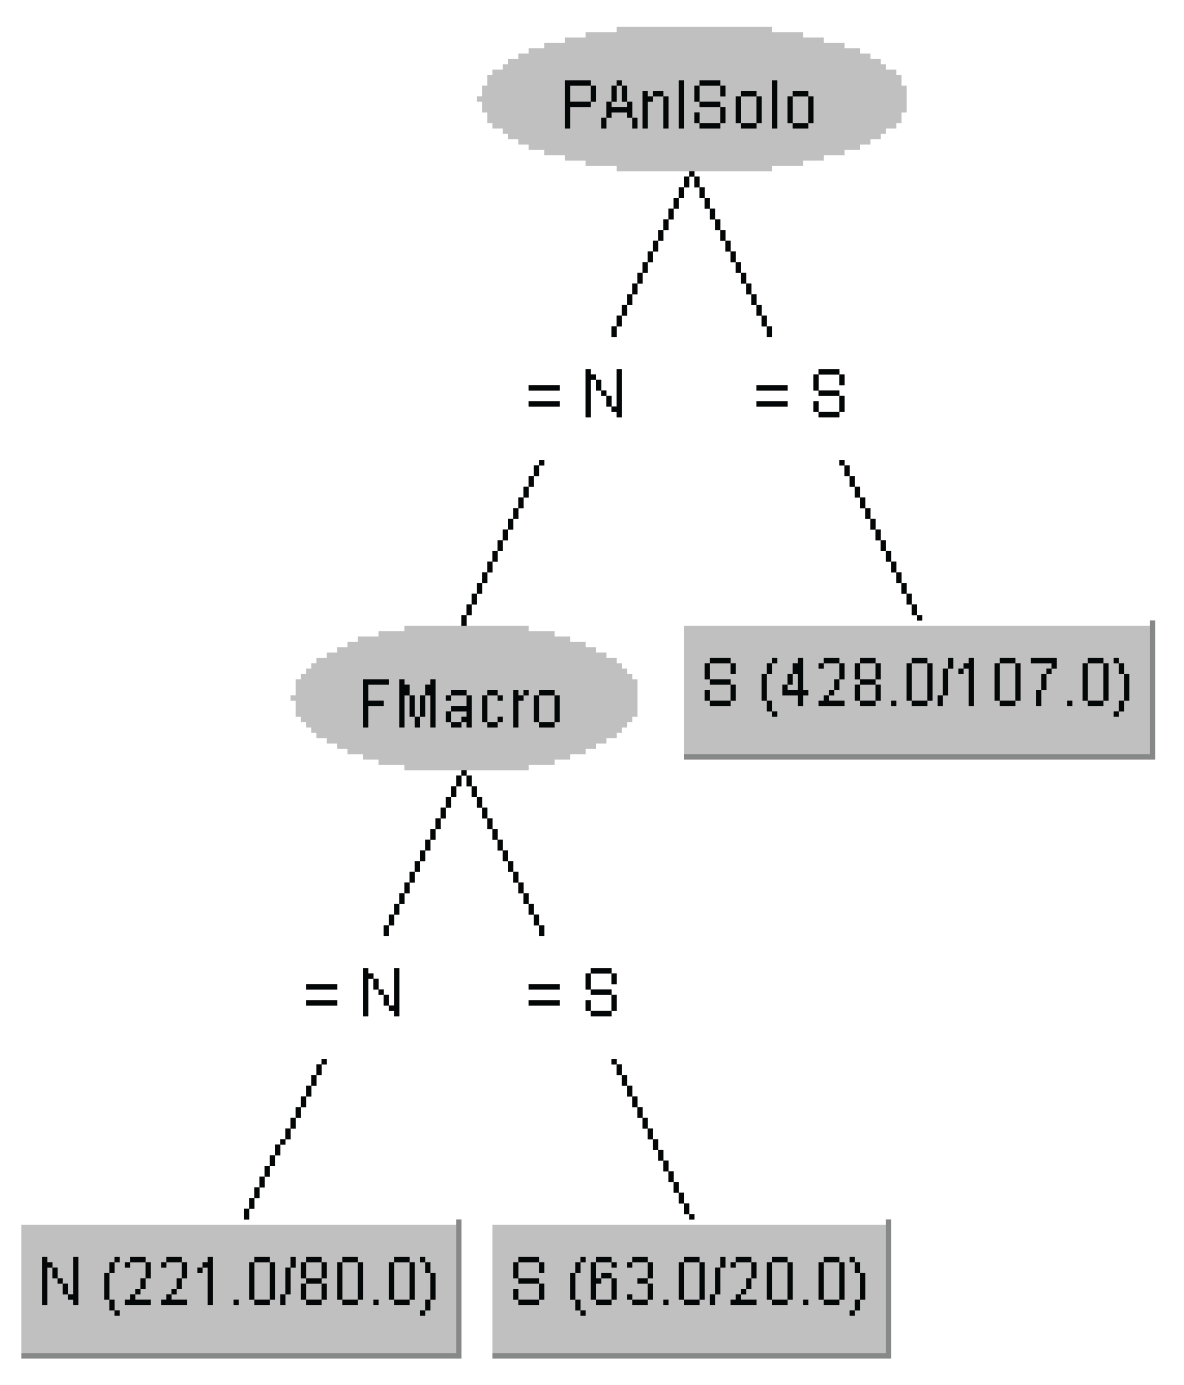

Table 1.
Number of respondents in each biome, along with information on whether they adopt the technological processes analyzed.
Table 1.
Number of respondents in each biome, along with information on whether they adopt the technological processes analyzed.
| PAnSolo | PTxLot | PCorrection | PRotacio | |||||
| No | Yes | No | Yes | No | Yes | No | Yes | |
| Amazonas | 32 | 34 | 35 | 31 | 34 | 32 | 22 | 44 |
| Caatinga | 60 | 33 | 72 | 21 | 71 | 22 | 54 | 39 |
| Cerrado | 78 | 172 | 135 | 115 | 81 | 169 | 90 | 160 |
| Mata Atlântica | 89 | 155 | 168 | 76 | 90 | 154 | 75 | 169 |
| Pampa | 20 | 31 | 29 | 22 | 23 | 28 | 22 | 29 |
| Pantanal | 5 | 3 | 3 | 5 | 7 | 1 | 5 | 3 |
| Total | 284 | 428 | 442 | 270 | 306 | 406 | 268 | 444 |
PAnlSolo = Soil analysis; PTxLot = Monitoring and control of pasture stocking rate; PCorrection = Soil correction with limestone; PRotacio = Rotation Grazing. Source: Own elaboration.
Table 2.
Technological and contextual variables with significant effect (p<0.05) on the selected technologies (marked).
Table 2.
Technological and contextual variables with significant effect (p<0.05) on the selected technologies (marked).
| Tec.Selec | PAnlSolo | PTxLot | PCorrection | Protacio |
|---|---|---|---|---|
| PCorrection | X | |||
| FAnalSolo | X | X | ||
| PMacro | X | X | ||
| FCorSolo | X | |||
| PAnalSolo | X | X | X | |
| Bioma | X | |||
| FMacro | X | |||
| PPlanej | X | |||
| PManejo | X | |||
| PMicro | X | |||
| PInvHerb | X | |||
| PCurvaNivel | X | |||
| FContInv | X | |||
| Areapec | X |
Var tec = Technological variables; Tec.Selec = selected technologies; PAnlSolo = Soil analysis, PTxLot = Monitoring and control of pasture stocking rate; PCorrection = Soil correction with limestone; PRotacio = Rotation Grazing. Source: Own elaboration.
Table 3.
- Parameter estimates and standard errors for the technological and contextual variables (Vartec). .
Table 3.
- Parameter estimates and standard errors for the technological and contextual variables (Vartec). .
| Selected Technology | PAnlSolo |
|---|---|
| Intercepto | 0,0175 ± 0,1464 |
| FAnalSolo | -1,4176 ± 0,1484 |
| PCorrection | -1,2824 ± 0,1401 |
| PMacro | -0,8605 ± 0,1410 |
PAnlSolo = Soil analysis; Fanalsolo = Does/Conducts/Performs soil analysis in the formation); PCorrection (Soil correction with limestone); and PMacro (Fertilization with N, P, K, or S). Source: Own elaboration.
Table 4.
Rules for the PAnlSolo technological process.
| Leaves | PCorrection | FAnalSolo | PMacro | Cases | Correct Classification |
Confidence of the Rule |
|---|---|---|---|---|---|---|
| F 1 | No | No | - | No (194) | 183 | 94,32% |
| F 2 | Yes | Yes | - | Yes (363) | 348 | 95,87% |
| F 3 | No | Yes | No | No (76) | 52 | 68,42% |
| F 4 | No | Yes | Yes | Yes (36) | 25 | 69,44% |
| F 5 | Yes | No | No | No (17) | 12 | 70,59% |
| F 6 | Yes | No | Yes | Yes (26) | 15 | 57,69% |
| Total | 712 | 610 (85,67%) |
Source: Own elaboration.
Table 5.
Parameter estimates and standard errors for the technological variables (Vartec).
|
Selected Technology Vartec / contextual |
PTxLot |
| Intercept | 0,0291± 0,1760 |
|
Areapec Up to 10 ha 11 to 50 ha 51 to 100 ha 101 to 500 ha 501 to 1000 ha 1001 to 2500 ha Over 2500 ha |
-0,9640±0,2607 -0,4314±0,2081 0 0,2670±0,2253 -0,1302±0,2736 0,8992±0,3676 0,4985±0,3324 |
| FContInv | -0,2133±0,1066 |
| PCurvaNivel | -0,3940±0,1108 |
| PPlanej | -0,3026±0,1120 |
| PAnalSolo | -0,5670±0,1194 |
| PMicro | -0,3544±0,1498 |
| PInvHerb | -0,2457±0,1129 |
| PManejo | -0,6751±0,1044 |
PTxLot = monitoring and control of pasture stocking rate; araepec = livestock area; FContInv = weed control during pasture establishment; PCurvaNivel = use of the contour terraces; PPlan = planning of forage production sectors on the property; PAnlSolo = soil analysis; Fanalsolo = performs soil analysis during pasture formation; PMicro = fertilization with micronutrients; PInvHerb = weed control using herbicides; PManagement = monitoring and control of grazing frequency and intensity. Source: Own elaboration.
Table 6.
- Rules for the PTxLot technological process.
| F | PManejo | PAnalSolo | PInvHerb | PPlanej | PMicro | FCont | Cases | Correct Classification | Confidence of the Rule |
|---|---|---|---|---|---|---|---|---|---|
| F 1 | No | No | - | - | - | - | No (234) |
218 | 93,16 % |
| F 2 | Yes | Yes | - | - | - | - | Yes (223) |
160 | 71,75% |
| F 3 | Yes | No | - | No | - | - | No (37) |
24 | 64,86% |
| F 4 | Yes | Yes | - | Yes | - | - | Yes (13) |
9 | 69,23% |
| F 5 | No | Yes | No | - | No | - | No (83) |
70 | 84,33% |
| F 6 | No | Yes | No | - | Yes | - | Yes (8) | 6 | 75,00% |
| F 7 | No | Yes | Yes | - | - | No | No (50) | 35 | 70,00% |
| F 8 | No | Yes | Yes | - | - | Yes | Yes (64) | 38 | 59,37% |
| Total | 712 | 560 (78,65%) |
F = Leaves; PManagement = Monitoring and control of plant grazing frequency and intensity; PAnlSolo = Soil analysis; PInvHerb = Control of invaders with the use of herbicides; PPlan = Planning of forage production sectors on the property; PMicro = Fertilization with micronutrients; FContInv = Control of invaders in the formation. Source: Own elaboration.
Table 7.
- Estimation of parameters and standard errors of technological/contextual variables (Vartec).
Table 7.
- Estimation of parameters and standard errors of technological/contextual variables (Vartec).
| Selected Technology Vartec / contextual |
PCorrection |
|---|---|
| Intercept | -0,1961± 0,1361 |
| PAnalSolo | -1,3830 ± 0,1512 |
| PCorSolo | -1,3735±0,1624 |
| PMacro | -0,6778 ± 0,1300 |
| FAnalSolo | 0,4535 ± 0,1855 |
PCorrection = soil correction with limestone; PAnlSolo = soil analysis; FCorSolo = fertilization with N, P, K, or S; PMacro = fertilization with N, P, K, or S; FAnalSolo = performs soil analysis during formation. Source: Own elaboration.
Table 8.
- Rules for the technological process PCorrection.
| Leaves | PAnlSolo | FCorSolo | FAnlSolo | Cases | Correct Classification | Confidence of the Rule |
|---|---|---|---|---|---|---|
| F 1 | No | No | - | No (203) | 193 | 95,07% |
| F 2 | Yes | Yes | - | Yes (372) | 341 | 91,66% |
| F 3 | No | Yes | No | Yes (23) | 14 | 60,86% |
| F 4 | No | Yes | Yes | No (58) | 44 | 75,86% |
| F 5 | Yes | No | No | Yes (24) | 14 | 70,59% |
| F 6 | Yes | No | Yes | No (32) | 19 | 59,37% |
| Total | 712 | 625 (87,78%) |
PAnalSolo = soil analysis; FCorSolo = performs soil correction in the formation; FAnalSolo = performs soil analysis in the formation. Source: Own elaboration.
Table 9.
- Estimation of parameters and standard errors of technological/contextual variables (Vartec).
Table 9.
- Estimation of parameters and standard errors of technological/contextual variables (Vartec).
|
Selected Technology Vartec / contextual |
PRotacio |
| Intercept | 0,2974± 0,1603 |
|
Bioma Amazônia Caatinga Cerrado Mata Atlântica Pampa Pantanal |
0,5827 ± 0,2790 -0,2288 ± 0,2460 0,4726± 0,2003 0,0652 ± 0,1987 -0,2389 ± 0,2989 0 |
| PAnalSolo | -0,4681± 0,0923 |
| FMacro | -0,4790 ± 0,0943 |
PRotacio = rotation grazing; PAnlSolo = soil analysis; FMacro = fertilization with N, P, K, or S during formation. Source: Own elaboration.
Table 10.
- Rules for the PRotacio technological process.
| Leaves | PAnlSolo | FMacro | Cases | Correct Classification | Confidence of the Rule |
|---|---|---|---|---|---|
| F 1 | Yes | - | Yes (428) | 321 | 75,00% |
| F 2 | No | No | No (221) | 141 | 63,80% |
| F 3 | No | Yes | Yes (63) | 43 | 68,25% |
| Total | 712 | 505 (70,92%) |
PRotacio = Rotation grazing; PAnlSolo = Soil analysis; FMacro = Fertilization with N, P, K, or S during pasture formation. Source: Own elaboration.
Disclaimer/Publisher’s Note: The statements, opinions and data contained in all publications are solely those of the individual author(s) and contributor(s) and not of MDPI and/or the editor(s). MDPI and/or the editor(s) disclaim responsibility for any injury to people or property resulting from any ideas, methods, instructions or products referred to in the content. |
© 2025 by the authors. Licensee MDPI, Basel, Switzerland. This article is an open access article distributed under the terms and conditions of the Creative Commons Attribution (CC BY) license (http://creativecommons.org/licenses/by/4.0/).
Copyright: This open access article is published under a Creative Commons CC BY 4.0 license, which permit the free download, distribution, and reuse, provided that the author and preprint are cited in any reuse.


