
Submitted:
08 September 2025
Posted:
09 September 2025
You are already at the latest version
Abstract
Bimorphic monoclinic minerals exhibiting group-subgroup parings among their space groups are visualized using edge weighted directional graphs, an approach that facilitates enhanced understanding of patterns and distributions of bimorphism. Initial consideration is limited to the 59 known monoclinic mineral species exhibiting bimorphic crystallographic pairings. Minerals of the monoclinic system were chosen because of the relative simplicity of the symmetries and structures present in the group-subgroup relationships as well as the frequency of occurrence and proportional distribution of bimorphic species among the system’s 13 space groups relative to that exhibited by the more common monomorphic monoclinic species. All of the 59 known bimorphic pairings exhibit super-groups drawn from the 2/m point group. Maximal subgroups of the klassengleiche type within the 2/m point group are found to be the most commonly occurring bimorphic pairing such that 8 of the 13 possible pairs are represented by 31 of the 59 known bimoprhic monoclinic minerals. Conversely, frequencies of pair occurrence and the number of minerals exhibiting those pairings are found to decrease with increasing magnitudes of difference in symmetry between the supergroup and paired subgroup such that translationengleiche and general subgroup pairing are progressively less common. The prevalence of bimorphism in pairings involving high-symmetry structures is a novel observation and suggests similarities in and differences between the crystallographic symmetry of space group pairings of bimorphic species is a factor influencing the occurrence of polymorphism and thus offers directions for future inquiry into causes and controls of mineral polymorphism.
Keywords:
crystallography
; space groups
; polymorphic minerals
; bimorphic minerals
1. Introduction
The crystal structures of minerals possess symmetries that define seven crystal systems consisting of 32 point groups containing 230 space groups that are formed by combining the 13 Bravais lattices with space-filling translations, rotations, and screw axes. Of the over 6000 minerals species currently recognized by the International Mineralogical Association, the majority are known to exhibit only a single space group structure. However, a subset of all minerals has been recognized to exhibit two or more space group symmetries. Polymorphic minerals are often given unique species names when crystal structures and physical properties are significantly different – as in the case of diamond (cubic system, m3m point group, Fd3m space group) and graphite (hexagonal system, 6mm point group, P63mc space group). In other instances, species-level differentiation has occurred for polymorphs exhibiting geometries of a single crystal system and point group, but different space groups such as the orthorhombic minerals of the 2/m 2/m 2/m point group andalusite (Pnnm) and sillimanite (Pbnm). Beyond these well-known polymorphs, the RRUFF database of approved minerals provides data on individual minerals that exhibit multiple space group symmetries [1,2]. This database has been used as an authoritative source of mineralogical data by a variety of studies [3,4,5,6,7,8,9,10]. The purpose of the following is not to reconsider the definition of a “mineral species” or the processes of nomenclature that have been applied to that evolving definition [11,12,13,14,15], nor to attempt to clarify when polymorphic pairs should, or should not, be recognized as unique species [13,16]. Rather, the frequencies and distributions of group-subgroup relationships among bimoprhic monoclinic minerals are tabulated and then recast utilizing visualization techniques in order to better understand patterns of crystallographic control on the occurrence of polymorphism within the monoclinic minerals. Directed graphs have been successfully utilized in mathematics to illustrate group-subgroup structures among symmetries in lattices [17].
Polymorphism in minerals can originate from a wide range of causes, the most common of which include temperature and pressure induced phase transitions and structural alteration due to kinetic effects during crystallization [18]. Detailed consideration of the causes of bimorphism within the various specific monoclinic minerals is beyond the scope of this contribution. Therefore, interested readers are encouraged to utilize the Mindat.org database’s extensive citations of the scientific literature to review additional structural data associated with each of the minerals considered herein.
The present study focuses on a group of 59 bimorphic minerals of the monoclinic system. (Figure 1). Importantly, the decision to limit consideration to bimorphic monoclinic minerals is based on several factors. First, monoclinic geometries are common among the mineral species with more than 1600 currently recognized monoclinic minerals comprising 35% of all known mineral species [19,20]. Second, a sufficient number of bimorphic species have been identified that exhibit abundances among the 13 monoclinic space groups that are generally proportional to those known for the large number of monomorphic monoclinic species (Figure 2). By limiting consideration to the bimorphic pairs of monoclinic species it is recognized that several well-known polymorphic monoclinic minerals are excluded. However, consideration of the complexity of the polymorphism exhibited by those minerals, frequently extending to other crystal systems as well as multiple monoclinic polymorphs, is beyond the scope of this analysis.
Among the 59 monoclinic mineral species known to exhibit bimorphic pairings, several are members of recognized structural groups. For instance, three members of the vivianite group (vivianite, arupite, bobierrite), two minerals of the neptunite group (neptunite, manganoneptunite), and two members of the amphibole supergroup (tremolite, cummingtonite) exhibit bimorphic pairs. The presence of multiple members of structural groups could be seen as a bias within the data in that some pairings might be overrepresented. However, it is important to note that the minerals considered here were not selectively chosen for this study, rather they represent all known monoclinic minerals exhibiting bimorphism. As such, the presence of multiple members of structural groups exhibiting bimorphism is both reasonable, and can be taken as supportive of the viability of the following analysis.
Minerals of the monoclinic system exhibit two Bravais lattice structures, the primitive P structure and the end-centered C structure, as well as three point group symmetries (2, m, 2/m) and therefore the relative simplicity of the geometries involved make the monoclinic system a logical starting point for an analysis of this type. The 13 space groups of the monoclinic system are composed of six symmorphic space groups containing symmetry elements that correspond to their point groups (P2, C2, Pm, Cm, P2/m, C2/m), four hemisymmorphic space groups containing only axial combinations of symmetry elements of their corresponding point groups, comprising glide translations along the c axis (Pc, Cc, P2/c, C2/c), and three asymmorphic space groups containing a twofold rotation coupled with a translation of ½ the lattice vector (P21, P21/m, P21/c). These 13 monoclinic space groups possess three Wyckoff multiplicities (2, 4, 8) representing the maximum number of unique positions generated by a particular symmetry [21]. In order to provide a framework for further analysis, the monoclinic space groups can be organized in a tabular format derived from the graphical representation of the symmorphic space groups [22], wherein the three point groups define the horizontal axis and the three Wyckoff multiplicities define the vertical (Figure 3). This approach to representing space groups has proven useful in the analysis of mineral species distributions among the 230 space groups [10].
2. Subgroups of Monoclinic Space Groups
Relationships exist between space groups such that a group with lower symmetry can be described as a subgroup of a group with greater symmetry. Visualizing the group-subgroup relationship within the three-dimensional space groups can be challenging, therefore it is useful to consider analogous group-subgroup relationships in two-dimensions (Figure 4). A square contains a fourfold rotational axis (ρ) as well as two sets of orthogonal mirror planes (m), with two planes bisecting the center of opposite edges and the other two forming bisecting diagonals spanning opposite corners. The symmetries of a rectangle consist of a twofold rotational axis (180°) and one set of orthogonal mirror planes bisecting opposite edges. Finally, the symmetries of a rhomboid consist of a twofold rotational axis and no mirror planes. As such, the symmetry elements of a rectangle are a subset of the symmetry elements of a square and the symmetry elements of a rhomboid are a subset of symmetry elements of both the rectangle and square. Crystallographic convention designates a supergroup as G and its subgroup as H. Thus the group-subgroup relationship between the square and the rectangle can be expressed as G(ρ90, ρ180, ρ270, ρ360, m1, m2, m3, m4) > H( ρ180, ρ360, m1, m2). Analogous group-subgroup relationships have been defined for all space groups [23]. The relative simplicity of group-subgroup relationships among the monoclinic space groups provides further justification for selecting the bimorphic minerals of that crystal system for preliminary analysis.
The group-subgroup relationship between any two space groups can be described as either maximal, meaning there exists no group Z such that G > Z > H, or general when such a group Z exists. The symmetries of a rectangle form a maximal subgroup of the symmetries of a square while the symmetries of a rhomboid are a general subgroup of the symmetries of the square with those of a rectangle an intermediate group Z exhibiting a set of symmetries that fall between those of a rhomboid and square. Among the crystallographic space groups there are two types of maximal subgroups, the klassengleiche or k-subgroups and the translationengleiche or t-subgroups [24,25,26]. K-subgroups are formed when the set of translations are reduced from G to H while maintaining the linear parts of G in H. As such, k-subgroups must reside within the same point group as G and are found to be the most common of the various possible maximal group-subgroup relationship within the monoclinic system. Conversely, the maximal t-subgroups maintain the set of translations from G to H while reducing point group order. Translationengleiche and general group-subgroup pairings can only exist within the monoclinic system when one of the space groups of the 2/m point group is the supergroup of the pairing [23]. As will be shown, bimorphic monoclinic minerals are found to exhibit all three types of group-subgroup relationships.
2.1. Edge Weighted Directed Graphs as Representations of Bimorphic Mineral Pairings
Bimorphic minerals define ordered pairs of space groups such that the space group with the higher symmetry G is a supergroup of the space groups of lower symmetry H. When presented in tabular form (Figure 1), relationships between specific bimorphic pairs as well as broader trends in the frequency of occurrence of particular pairings can be difficult to evaluate. Therefore, a novel graphical approach to representing bimorphic pairings within the monoclinic minerals has been developed. Collections of polymorphic minerals, such as the 59 bimorphic minerals known from the monoclinic series (Figure 1) can be thought of as a network of ordered pairs. The mathematical study of networks of pairwise relationships between discrete objects is known as graph theory, which has found wide application in mathematics and the physical sciences, computer science, linguistics, and the social sciences [27]. In this sense, a graph is a mathematical structure describing a set of objects, known as vertices, linked by pairwise relationships known as edges. In the following analysis of bimorphic monoclinic pairs, graph vertices are the space groups of the monoclinic system while edges represent the structurally possible group-subgroup relationships among the space groups. Because group-subgroup relationships exist within the space groups of the monoclinic system, a graph illustrating such ordering is known as a directed graph, wherein directional relationships are noted by an arrow connecting the two pairwise vertices pointing from the supergroup to the subgroup. For a directed graph of N vertices, each vertex could be connected to at most N-1 other vertices such that the maximum number of expected edges for the 13 monoclinic space groups would be 156. Thus, even for a relatively small number of vertices, a directed graph can be very complex. Group-subgroup relationships within higher symmetry crystal systems become increasingly complex, further justifying limitation of consideration to the bimorphic monoclinic minerals. Because a space group that is a subgroup of another space group typically is not also a supergroup of that same space group, the edge connecting two vertices in a graph of the bimorphic monoclinic minerals generally points in one direction. However, exceptions occur among some k-subgroup pairs that exhibit only changes in Bravais structure (Figure 2 and Figure 5) such that either member of a space group pair can be defined as the supergroup or the subgroup [26]. Crystallographic controls among the monoclinic space groups offer a further simplification in that only some space groups can be linked by a symmetry transformation to other space groups. Review of crystallographic tables reveals the total number of possible group-subgroup relationships between the monoclinic space groups is 62 (Figure 2), a number that is significantly smaller than the 156 mathematically possible combinations for a directed pairwise network of 13 vertices [26]. Lastly, since any pair of space groups linked by a group-subgroup relationship does not have to be unique to only a single mineral, the edge of a directed graph can also be used to represent multiple species exhibiting the same bimorphic pair of space groups. Therefore, a graph reflecting the presence of multiple mineral species exhibiting a single space group pairing is known as an edge weighted directed graph. It is this novel approach to visualization based on the use of edge weighted graphs to organize, display, and evaluate space group pairs of the bimorphic monoclinic minerals that will be applied in the following analyses.
2.2. Klassengleiche Subgroups Within the 2/m Point Group
Maximal subgroups of the klassengleiche type are common among the bimorphic monoclinic minerals of the 2/m point group, with 31 of the 59 known bimorphic species exhibiting space group pairs linked by k-subgroup relationships. An edge weighted directed graph of the k-subgroups of the 2/m point group illustrates the relationships among those pairs (Figure 5). From this graph several important observations are derived. First, while k-subgroup relationships could exist within all three point groups of the monoclinic system (Figure 2), bimorphic mineral examples are only known among space groups of the high symmetry 2/m point group. Second, the symmorphic space group C2/m is the most frequently occurring supergroup, found in 21 of the 31 k-subgroup pairs. The hemisymmorphic P2/c space group also only acts as a supergroup while the hemisymmorphic C2/c space group is the most commonly occurring subgroup, found in 18 of the 31 pairs. Along with C2/c, the symmoprhic P2/m and asymmorphic P21/m space groups occur as either the supergroup or subgroup in all but 5 of the klassengleiche pairs. The asymmorphic P21/c space group is only found to occur as a subgroup in 11 of the 31 pairs. While the graph of the k-subgroup relationships exhibited by the bimorphic monoclinic minerals is complex, it is interesting to note that only 8 of the possible 12 k-subgroups have mineral exemplars (Figure 2 and Figure 5), with G(C2/m):H(C2/c) the most frequent pairing. Finally, all possible group-subgroup relationships among the 2/m space groups of the same morphologic type are represented by mineral exemplars as illustrated by numerals along the hexagonal boarder of Figure 5 where edge weighting illustrates the abundances of mineral examples of the known bimorphic pairings. As such, construction of the edge weighted directional graphs of the klassengleiche pairings provides a readily understood visual summary of bimorphic relationships.
2.3. Translationengleiche Subgroups Within Bimorphic Monoclinic Minerals
Maximal translationengleiche subgroups are less common among the bimorphic monoclinic minerals than are the k-subgroups, with 16 of the 59 species exhibiting t-subgroup pairings. Because t-subgroups preserve Bravais lattice structures within the monoclinic system, it is useful to employ two different graphs in order to illustrate relationships between 2/m supergroups and subgroups from the m and 2 point groups (Figure 6). The end centered high symmetry C2/m space groups contains two t-subgroup pairings, the Cm (having lost the 2-fold rotation axis) and the C2 (having lost the mirror plane). Similar lattice preserving translations are known for t-subgroups of the six 2/m space groups (Figure 6). Of the 12 possible t-subgroup relationships only 6 have known mineral exemplars, with the G(C2/c):H(Cc) occurring within 10 mineral species. Interestingly, unlike the k-subgroups observed among the 2/m point group, bimorphic monoclinic minerals not only preserve Bravais lattice structure but also frequently preserve space group type. That is, excepting the G(C2/c):H(C2) pair, all other known t-subgroup pairs consist of morphological pairs (symmorphic to symmorphic, hemisymmorphic to hemisymmorphic, or asymmorphic to asymmorphic) suggesting such linked organizations are preferred for bimorphic minerals exhibiting translationengleiche group-subgroup realtionships. Identification of these pair-wise trends is greatly facilitated by the use of edge weighted directional graphs as visualization aids.
2.4. General Subgroups Within Bimorphic Monoclinic Minerals
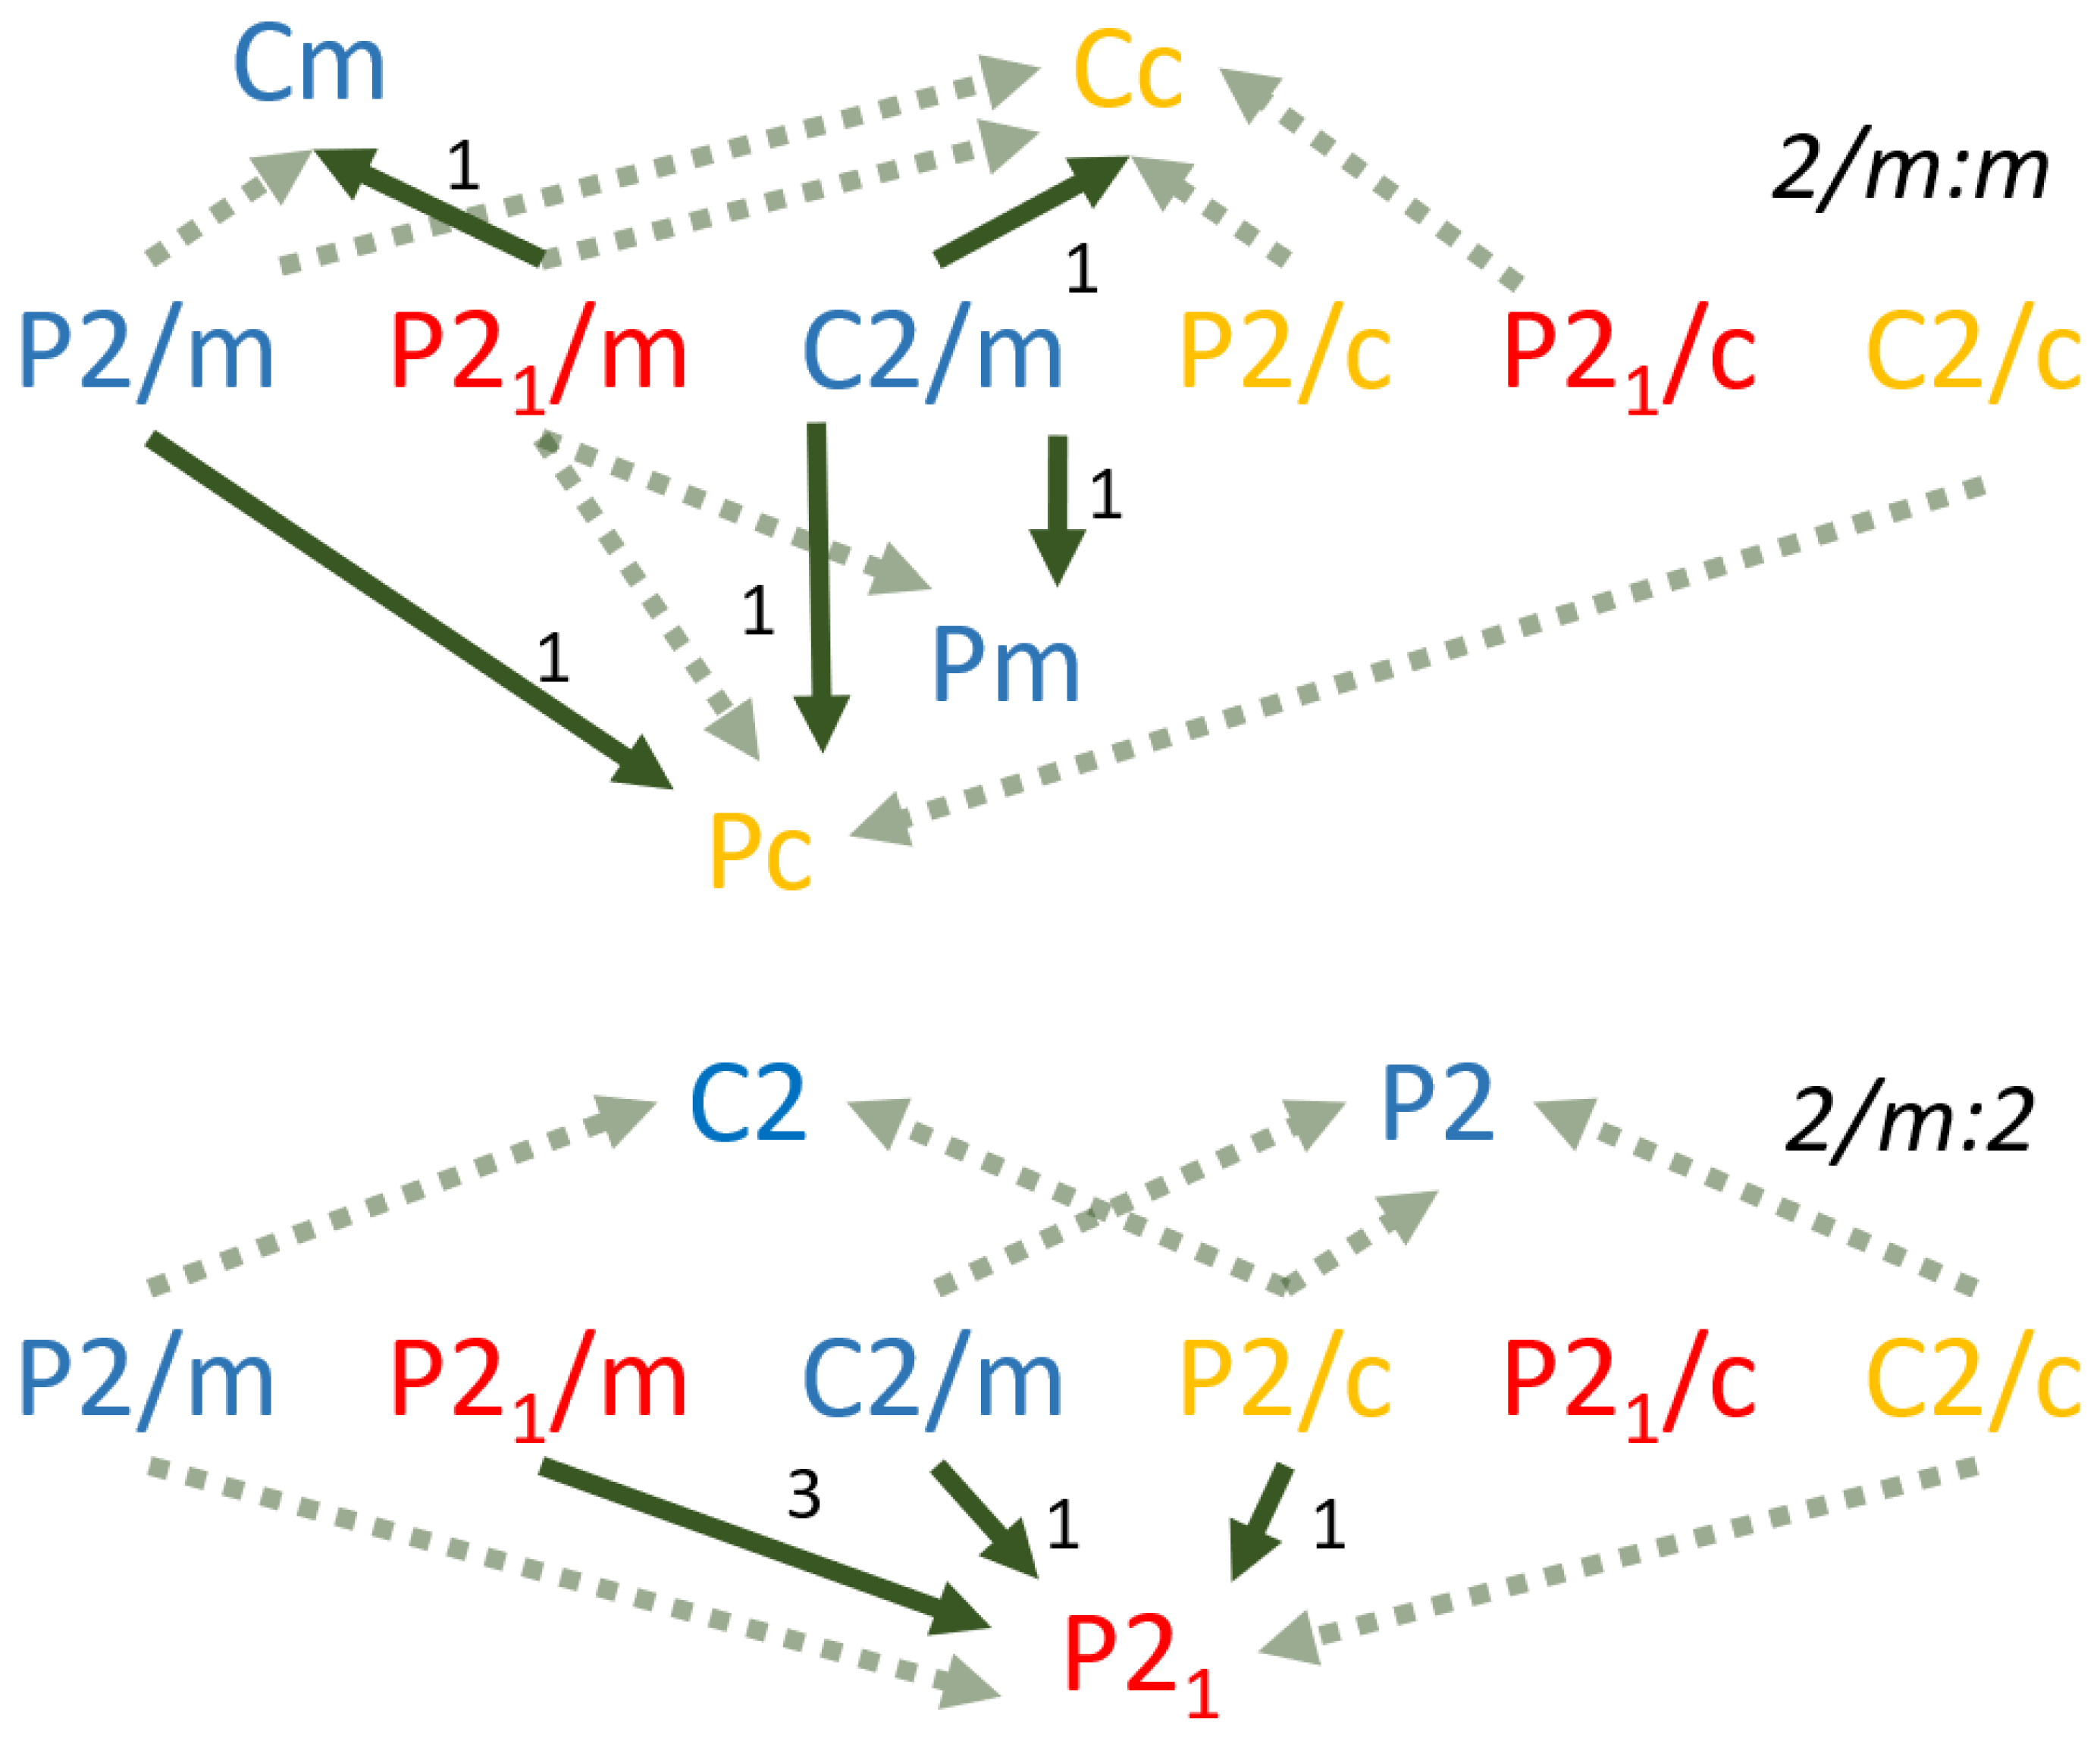
The least commonly occurring form of bimorphic monoclinic pairings are those of the general type. That is, bimorphic pairs linking space groups that are not maximally related by symmetry transformations, but rather that possess intermediate symmetry groups Z. As such, the difference in symmetry between the group G and its subgroup H in the general pairings is typically greater than in a k- or t-subgroup pair. Similar to the t-subgroups, two graphs are useful to illustrate potential and observed general subgroups pairings (Figure 7). Pairings between space groups of the G(2/m):H(m) point group pair are known to occur in 5 of the 13 possible relationships, with each having only one known example. Among the 10 possible pairings of G(2/m):H(2) space groups, only 3 are known to occur within the bimorphic monoclinic minerals, with G(P21/m):H(P21) the only general subgroup pairing known to occur in more than one mineral. The asymmorphic P21 space group is the only occurring subgroup among the 5 species within general subgroup pairings of the G(2/m):H(2) point groups (Figure 7). In total 8 of the 23 possible general subgroup pairings have known bimorphic monoclinic mineral exemplars. Visualizations of the relative scarcity of minerals exhibiting general subgroup pairings is greatly facilitated by the use of edge weighted directional graphs.
3. Summary and Conclusions
Just as mineral abundance is known to have a exhibit non-uniform distribution among the point groups [19,20] and space groups [10,28], bimorphic minerals have here been shown to be non-uniformly distributed among the point groups and space groups of the monoclinic system. This non-uniformity has several expressions. First, the 59 bimorphic monoclinic minerals are known to exhibit only 21 of the 62 crystallographically possible group-subgroup pairs. Frequency of pair representation by known bimorphic minerals decreases with increasing difference in symmetry such that 8 of the 12 k-subgroups within the 2/m point group have mineral exemplars, while 6 of the 12 possible t-subgroups, and only 8 of the 23 possible general space group relationships are represented by known bimorphic monoclinic minerals. The propensity for bimorphic monoclinic minerals to preferentially exhibit pairs of space groups of separated by small differences in symmetry is further supported by the total number of known pairings, which decreases with increasing magnitude of difference in symmetry between the point groups, from 31 for G(2/m):H(2/m) to 16 for G(2/m):H(m) to 10 for the G(2/m):H(2) pairings. Finally, there are strong tendencies for some space groups to form the supergroup of a bimorphic pair (C2/m, C2/c), while others tend to only occur as subgroups (P2/c, P21/c, Cc). Excepting the t-subgroup pair G(C2/c):H(Cc), space groups of the m and 2 point groups infrequently occur in bimorphic monoclinic pairs, and never as a supergroup. Therefore, due to some combination of paragenetic, kinetic, and thermodynamic complexities, bimorphism within the monoclinic minerals is expressed primarily among space groups of the 2/m point group, with decreasing frequency of occurrence and abundance when pairings involve subgroups of lower symmetry. These trends are clearly illustrated through the novel use of edge weighted directional graphs.
Elucidation of group-subgroup relationships among the bimorphic monoclinic minerals through the use of edge weighted directional graphs could be extended to polymorphs of other crystal systems as well as to the more complex symmetry relationships that exist for polymorphic pairs spanning different crystal systems. Many well-known polymorphic monoclinic minerals (arsenopyrite, clinochlore, muscovite, phlogopite, pyrrhotite, vaterite) exhibit multiple pairings that extend beyond the monoclinic system and the more complex group-subgroup relationships of these pairing types present interesting opportunities for expansion and refinement of the methodologies presented here. While it is reasonable to anticipate that polymorphic relationships within crystal systems with higher symmetry may not be as tractable to analysis as the monoclinic bimorphs, preliminary success in utilization of edge weighted directional graphs to organize, display, and evaluate patterns of bimorphic mineral pairings suggests further application of this technique to more complex structural relationships is appropriate.
Author Contributions
Conceptualization, C.D.; methodology, C.D. P.S.; investigation, C.D. P.S. and P.D; data curation, P.S.; writing—original draft preparation, C.D.; writing—review and editing, P.S. and P.D.; supervision, P.D.; project administration, C.D. and P.D; funding acquisition, C.D. and P.D. All authors have read and agreed to the published version of the manuscript.
Funding
This research was funded by THE LILLY FOUNDATION grant to the INDIANA DATA MINE.
Data Availability Statement
Data were downloaded from the RRUFF database of approved minerals at https://rruff.info.
Acknowledgments
We acknowledge our long-time friend and colleague Lowell Beinike, a luminary in the field of graph theory, for inspiring this novel approach to the analysis of trends in polymorphism. Early drafts of the manuscript were enhanced by the comments and criticisms of Dexter Perkins, Bart Kahr.
Conflicts of Interest
The authors declare no conflicts of interest.
References
- Downs, R.T. The RRUFF Project: An integrated study of the chemistry, crystallography, Raman and infrared spectroscopy of minerals. In Proceedings of the Program and Abstracts of the 19th General Meeting of the International Mineralogical Association, Kobe, Japan, 2006. [Google Scholar]
- Lafuente, B.; Downs, R.T.; Yang, H.; Stone, N.; Armbruster, T.; Danisi, R.M. The power of databases: the RRUFF project. Highlights Min. Cryst., 2015, 1, 25. [Google Scholar] [CrossRef]
- Grew, E.S.; Hazen, R.M. Beryllium mineral evolution. Am. Min., 2014, 99, 999–1021. [Google Scholar] [CrossRef]
- Hazen, R.M.; Grew, E.S.; Downs, R.T.; Golden, J.; Hystad, G. Mineral ecology: Chance and necessity in the mineral diversity of terrestrial planets. Can. Min., 2015, 53, 295–324. [Google Scholar] [CrossRef]
- Hystad, G.; Downs, R.T.; Grew, E.S.; Hazen, R.M. Statistical analysis of mineral diversity and distribution: Earth’s mineralogy is unique. Earth Plan. Sci. Let., 2015, 426, 154–157. [Google Scholar] [CrossRef]
- Grew, E.S.; Hystad, G.; Hazen, R.M.; Krivovichev, S.V.; Gorelova, L.A. How many boron minerals occur in Earth’s upper crust? Am. Min., 2017, 102, 1573–1587. [Google Scholar] [CrossRef]
- Bermanec, M.; Vidović, N.; Gavryliv, L.; Morrison, S.M.; Hazen, R.M. Evolution of symmetry index in minerals. Geo. Data J., 2024, 11, 69–85. [Google Scholar] [CrossRef]
- Drummond, C.N. Some characteristics and causes of changes in the rate of discovery of new minerals since 1800. Earth Sci. Hist., 2024, 43, 118–139. [Google Scholar] [CrossRef]
- Drummond, C.N. Abundances, distributions, and patterns of discovery of new minerals. Min. Mag., 2024, 88, 4–421. [Google Scholar] [CrossRef]
- Drummond, C.N.; Sarpong, P.N. Characteristics of the distribution of minerals among the space groups, Am. Min. 2025, 110, 2, 232-240. [Google Scholar]
- Nickel, E.H. The definition of a mineral. Can. Min., 1995, 33, 689–690. [Google Scholar] [CrossRef]
- Mills, S.J.; Hatert, F.; Nickel, E.H.; Ferraris, G. The standardisation of mineral group hierarchies: application to recent nomenclature proposals. Euro. J. Min., 2009, 21, 1073–1080. [Google Scholar] [CrossRef]
- Hawthorne, F.C.; Oberti, R.; Harlow, G.E.; Maresch, W.V.; Martin, R.F.; Schumacher, J.C.; Welch, M.D. Nomenclature of the amphibole supergroup. Am. Min., 2012, 97, 2031–2048. [Google Scholar] [CrossRef]
- Hatert, F.; Mills, S.J.; Pasero, M.; Williams, P.A. CNMNC guidelines for the use of suffixes and prefixes in mineral nomenclature, and for the preservation of historical names. Euro. J. Min., 2013, 25, 113–115. [Google Scholar] [CrossRef]
- Hålenius, U.; Hatert, F.; Pasero, M.; Mills, S.J. New minerals and nomenclature modifications approved in 2017. Min. Mag., 2017, 81, 1279–1286. [Google Scholar] [CrossRef]
- Simpson, G.G. The principles of classification and a classification of mammals. Bul. Am. Mus. Nat. His., 1945, 85, 1–350. [Google Scholar]
- Conway, J.H.; Sloane, N.J.A. Sphere Packings, Lattices and Groups; Springer Verlag, New York, United States, 1999. [Google Scholar]
- Perkins, D. Mineralogy; University of North Dakota, 2020. [Google Scholar] [CrossRef]
- Urusov, V.S.; Nadezhina, T.N. Empty and sparse spatial groups in structural mineralogy. Vestnik Moskovski Gosudarstvennyi Universitet, Seriya Geologiya, 2009, 6, 52–59. [Google Scholar]
- Hummer, D.R. Fractal distribution of mineral species among the crystallographic point groups. Am. Min., 2021, 106, 1574–1579. [Google Scholar] [CrossRef]
- IUCr News. 28. Available online: https://www.iucr.org/news/newsletter/volume-28/number-1/not-so-elementary,-my-dear-wyckoff (accessed on 28 August, 2025).
- Kahr, B. A periodic-like table of space groups. Acta Crystal. 2023, E79, 124–128. [Google Scholar] [CrossRef]
- Aroyo, M.I.; Kirov, A.; Capillas, C.; Perez-Mato, J.M.; Wondratschek, H. Bilbao Crystallographic Server. II. Representations of crystallographic point groups and space groups. Acta Crystal. A, 2006, 62, 115–128. [Google Scholar] [CrossRef]
- Boyle, L.L.; Lawrenson, J.E. Klassengleichen supergroup–subgroup relationships between the space groups. Acta Crystal., 1972, 28, 489–493. [Google Scholar] [CrossRef]
- Hatch, D.M.; Stokes, H.T. Practical algorithm for identifying subgroups of space groups. Phy. Rev. B, 1985, 31, 2908. [Google Scholar] [CrossRef] [PubMed]
- Wondratschek, H. General introduction to the subgroups of space groups. In International Tables for Crystallography Volume A1: Symmetry relations between space groups; Wondratschek, H., Müller, U., Eds.; Springer, Dordrecht, Germany, 2006. [Google Scholar] [CrossRef]
- Biggs, N.; Lloyd, E.; Wilson, R. Graph Theory, 1736–1936; Oxford University Press, New York, United States, 1986. [Google Scholar]
- Mackay, A.L. The statistics of the distribution of crystalline substances among the space groups. Acta Crystal., 1967, 22, 329–330. [Google Scholar] [CrossRef]
Figure 1.
(previous page) List of the 59 known bimorphic monoclinic minerals considered in this study. The point group and space group of each supergroup and subgroup pairing is noted, along with the crystallographic morphologies: symmorphic (S), hemisymmorphic (H), and asymmorphic (A). The far-right column lists the type of subgroups relationship exhibited by each pair of symmetries. Minerals shaded blue are klassengleiche group-subgroup pairings (k), those shaded yellow are translationengleiche group-subgroup pairings (t), and those shaded green are general group-subgroup pairings (g).
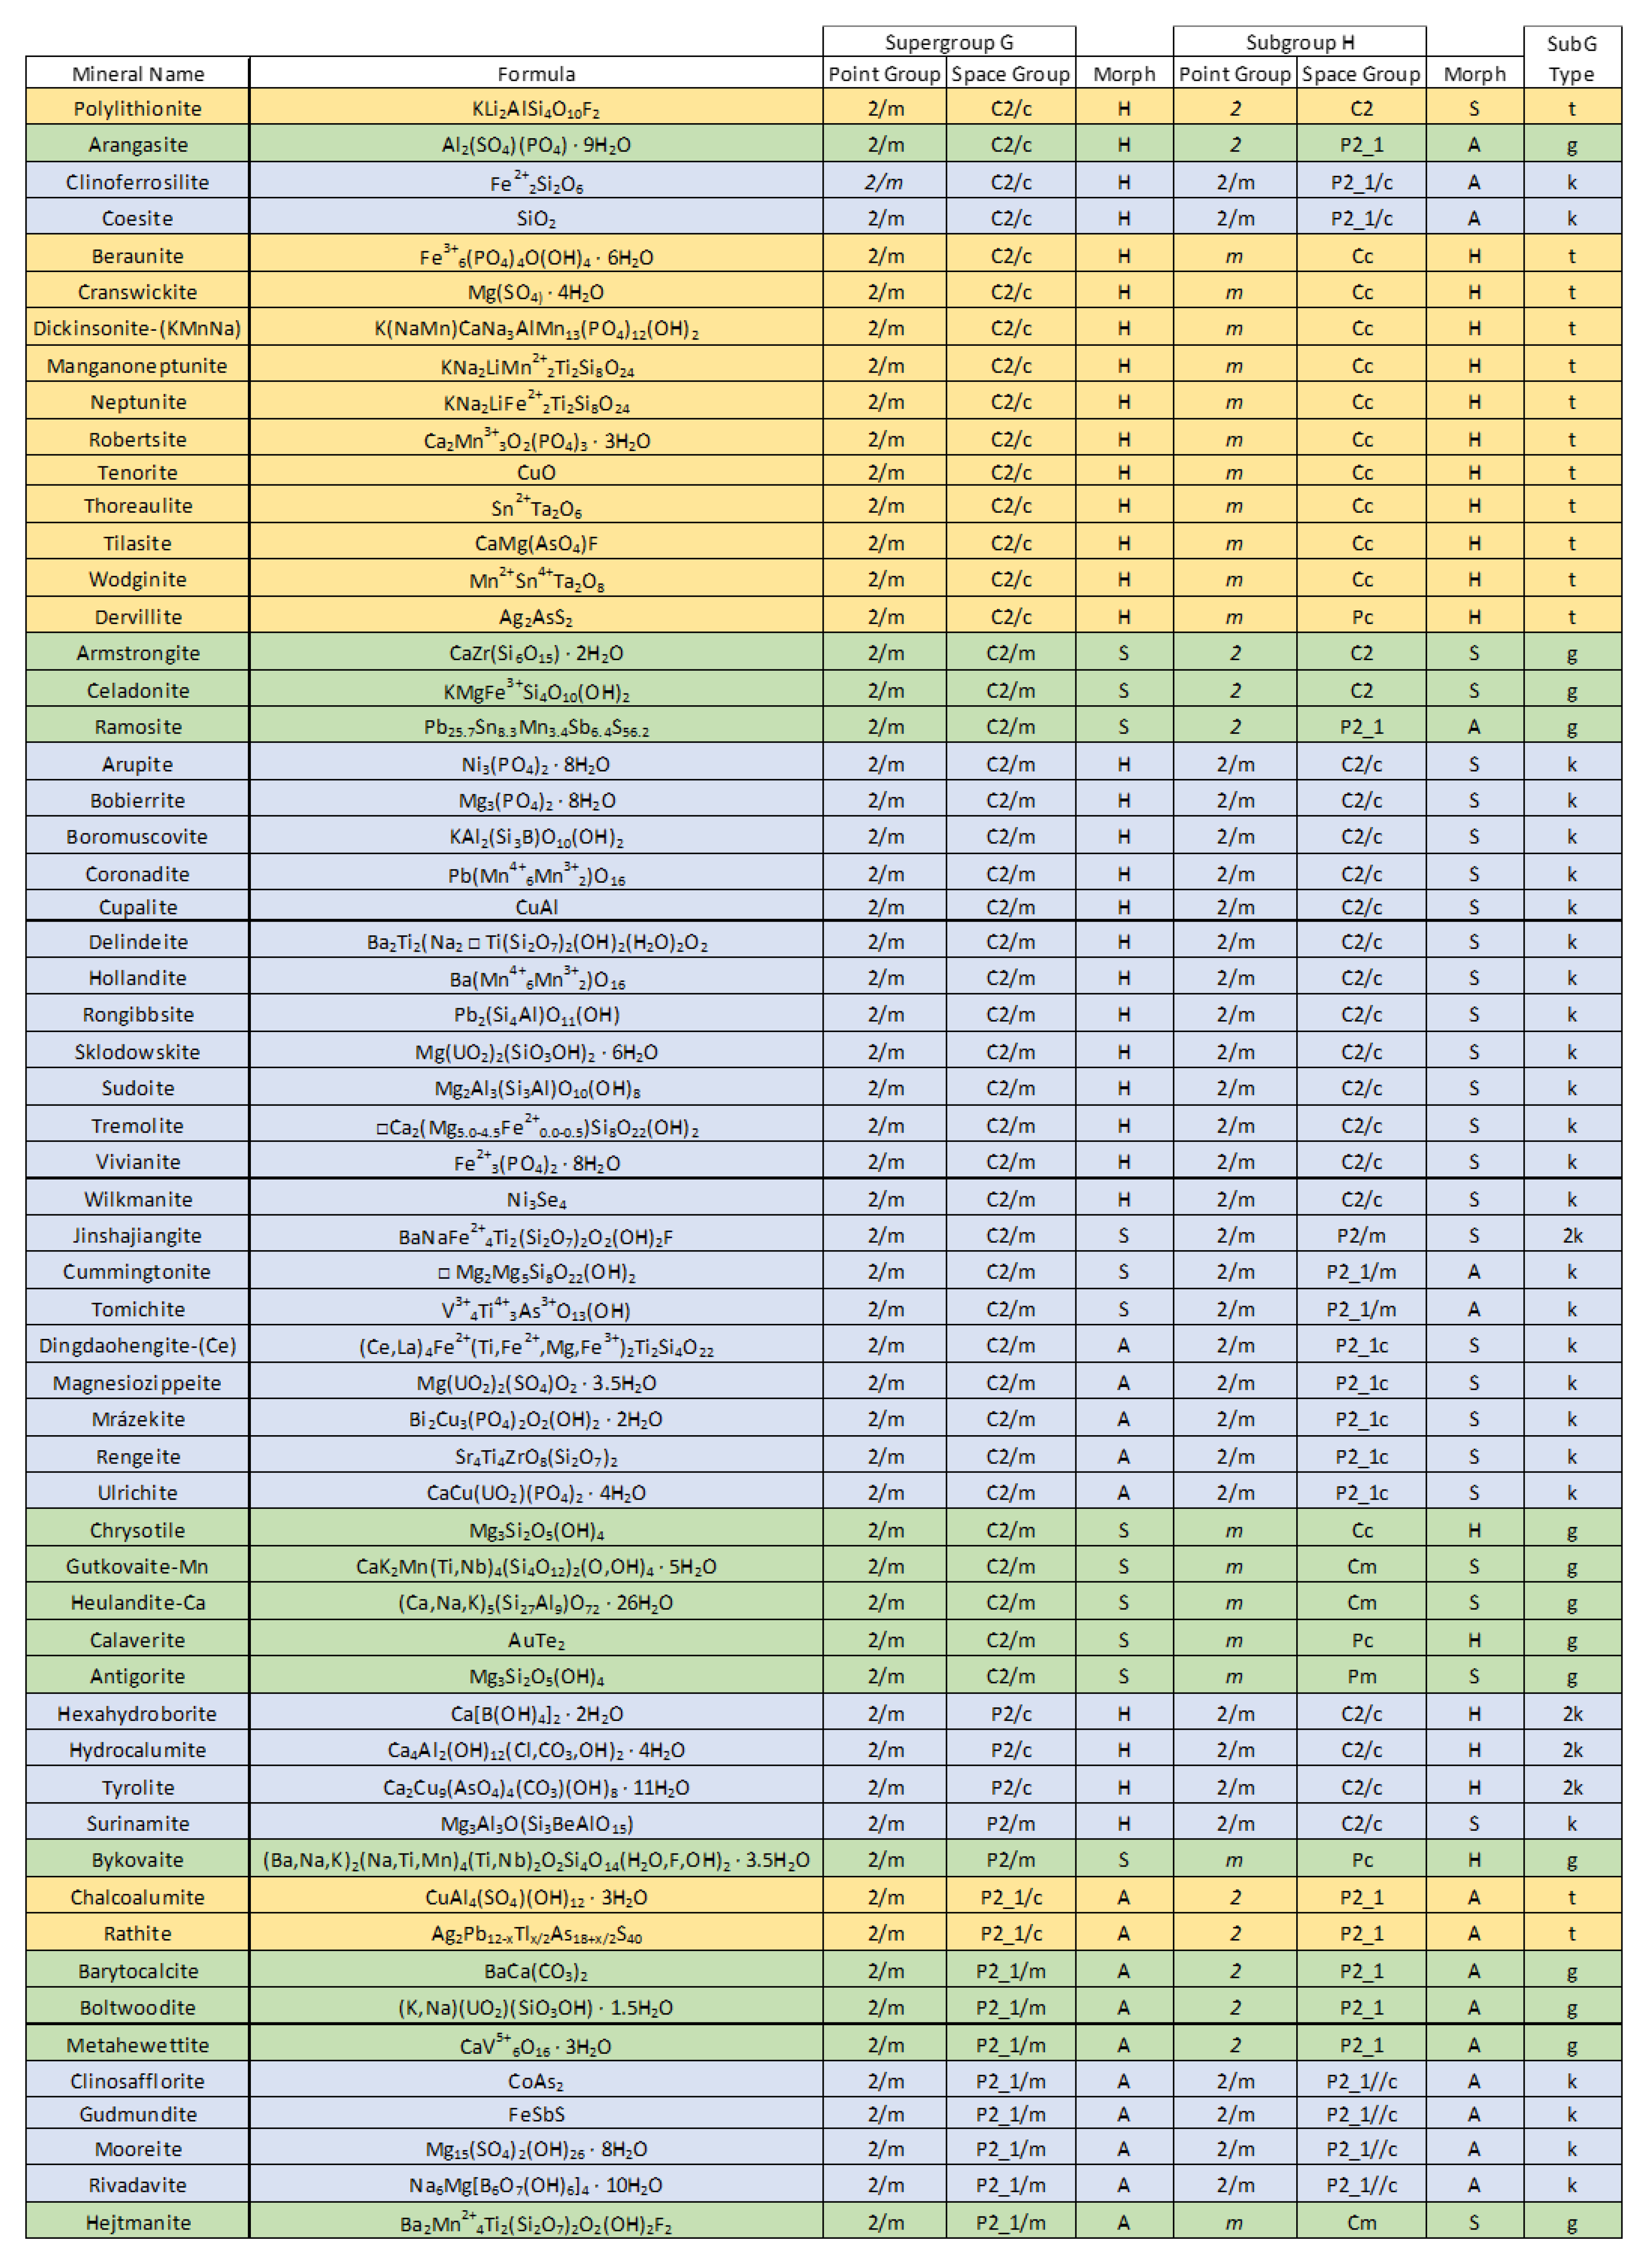
Figure 2.
Distributions of the monomorphic and bimorphic minerals among the 13 space groups of the 3 point groups of the monoclinic system.
Figure 2.
Distributions of the monomorphic and bimorphic minerals among the 13 space groups of the 3 point groups of the monoclinic system.
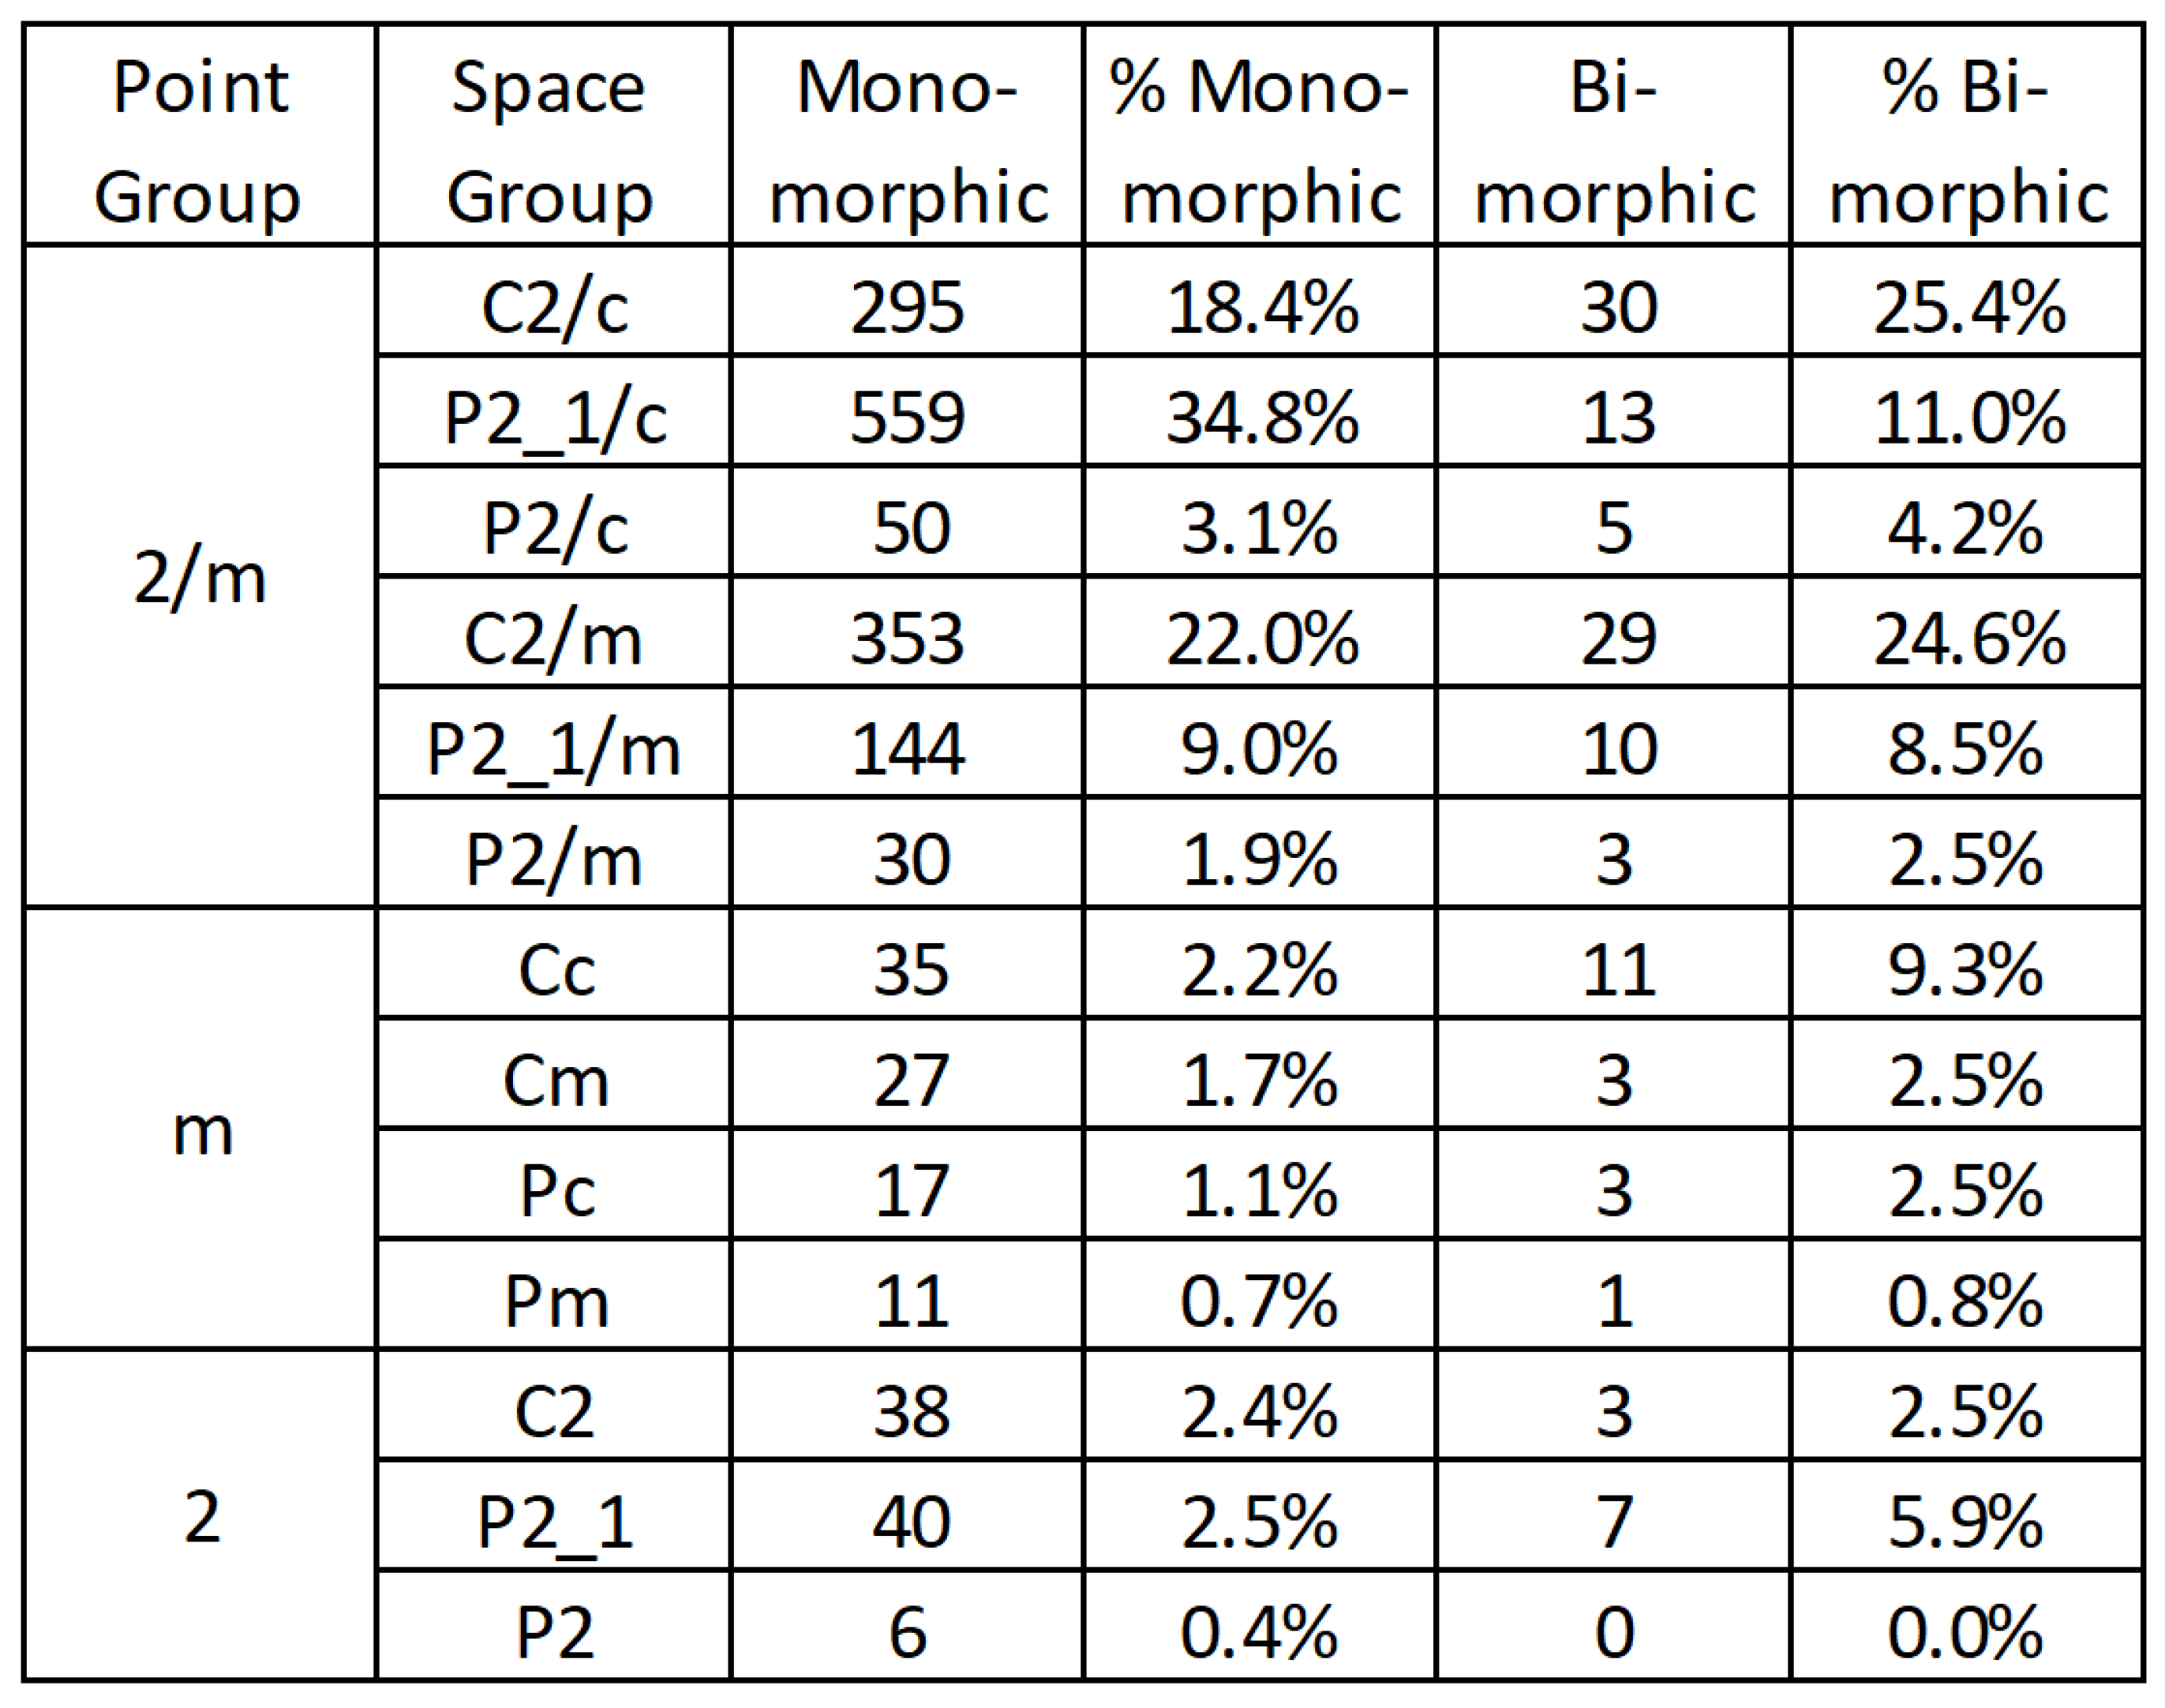
Figure 3.
Graphical representation of the space groups of the monoclinic system. The three monoclinic point groups define columns while Wyckoff multiplicity values define rows. Six symmorphic space groups contain symmetry elements that correspond to their point groups (blue). Four hemisymmorphic space groups contain only axial combinations of their point groups (yellow). Three asymmoprhic space groups contain a twofold rotation and a translation of ½ the lattice vector (red).
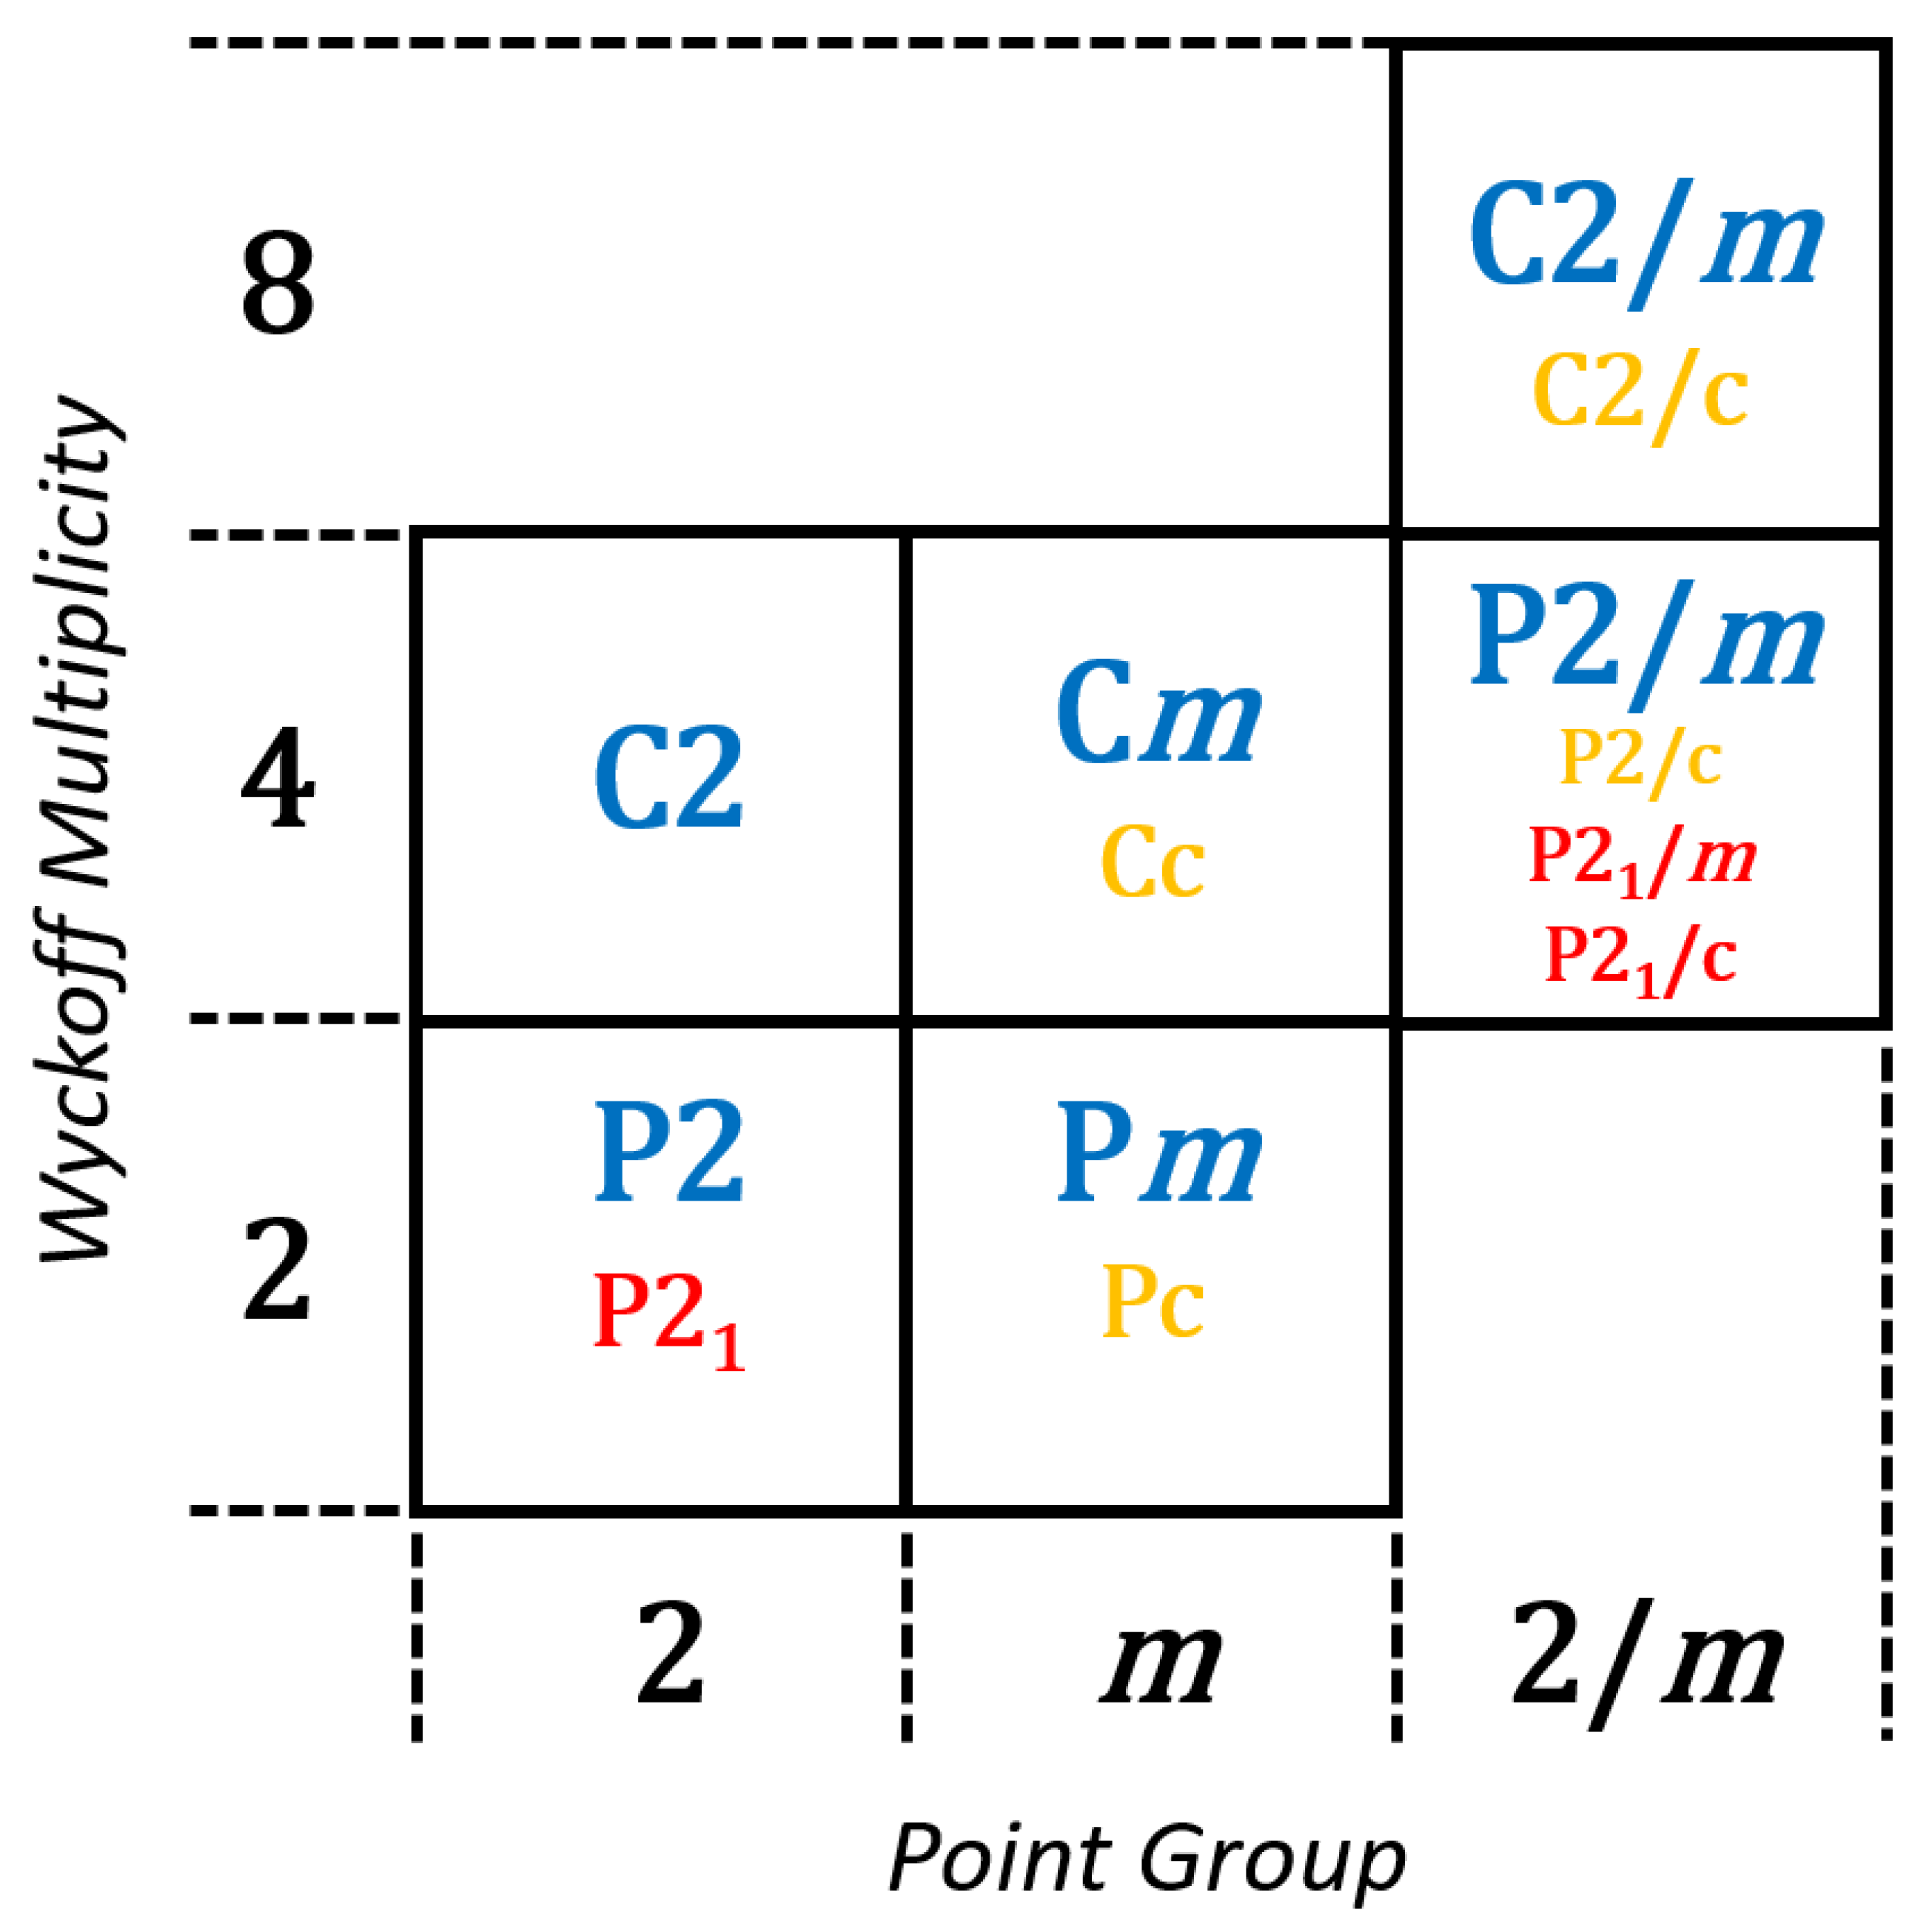
Figure 4.
Illustration of group-subgroup relationships exhibited in two-dimensions by the symmetry elements of the square, rectangle, and rhomboid. The symmetry elements of the rectangle are a maximal subgroup of the square while those of the rhomboid are a general subgroup of the square.
Figure 4.
Illustration of group-subgroup relationships exhibited in two-dimensions by the symmetry elements of the square, rectangle, and rhomboid. The symmetry elements of the rectangle are a maximal subgroup of the square while those of the rhomboid are a general subgroup of the square.
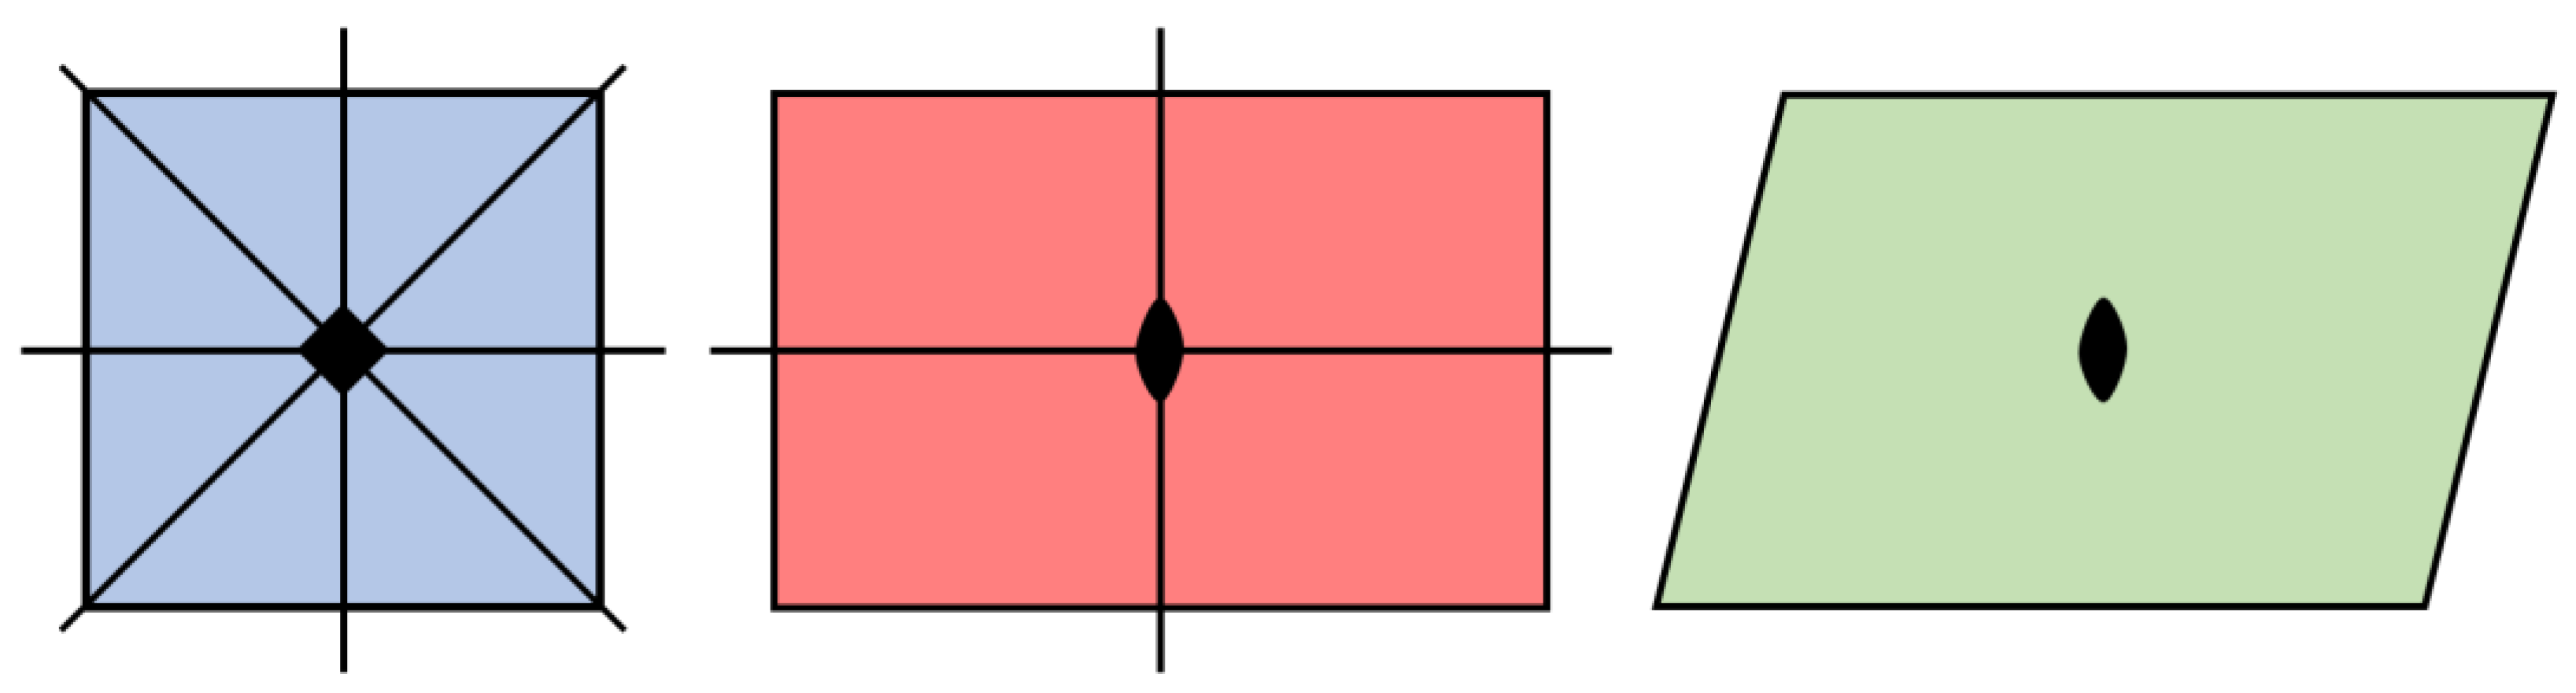
Figure 5.
Edge weighted directed graph illustrating klassengleiche group-subgroup pairings among the space groups of the 2/m point group denoted by arrows pointing from the supergroup to the subgroup. Pairs with known mineral exemplars are illustrated by solid arrows, those without by lighter dashed arrows, this convention is carried forward in Figure 3 and Figure 4 with the minerals exhibiting a particular pair of space groups noted by the numeral adjacent to the solid arrows such that 31 of the 59 bimorphic monoclinic minerals considered in this study show k-subgroup relationships.
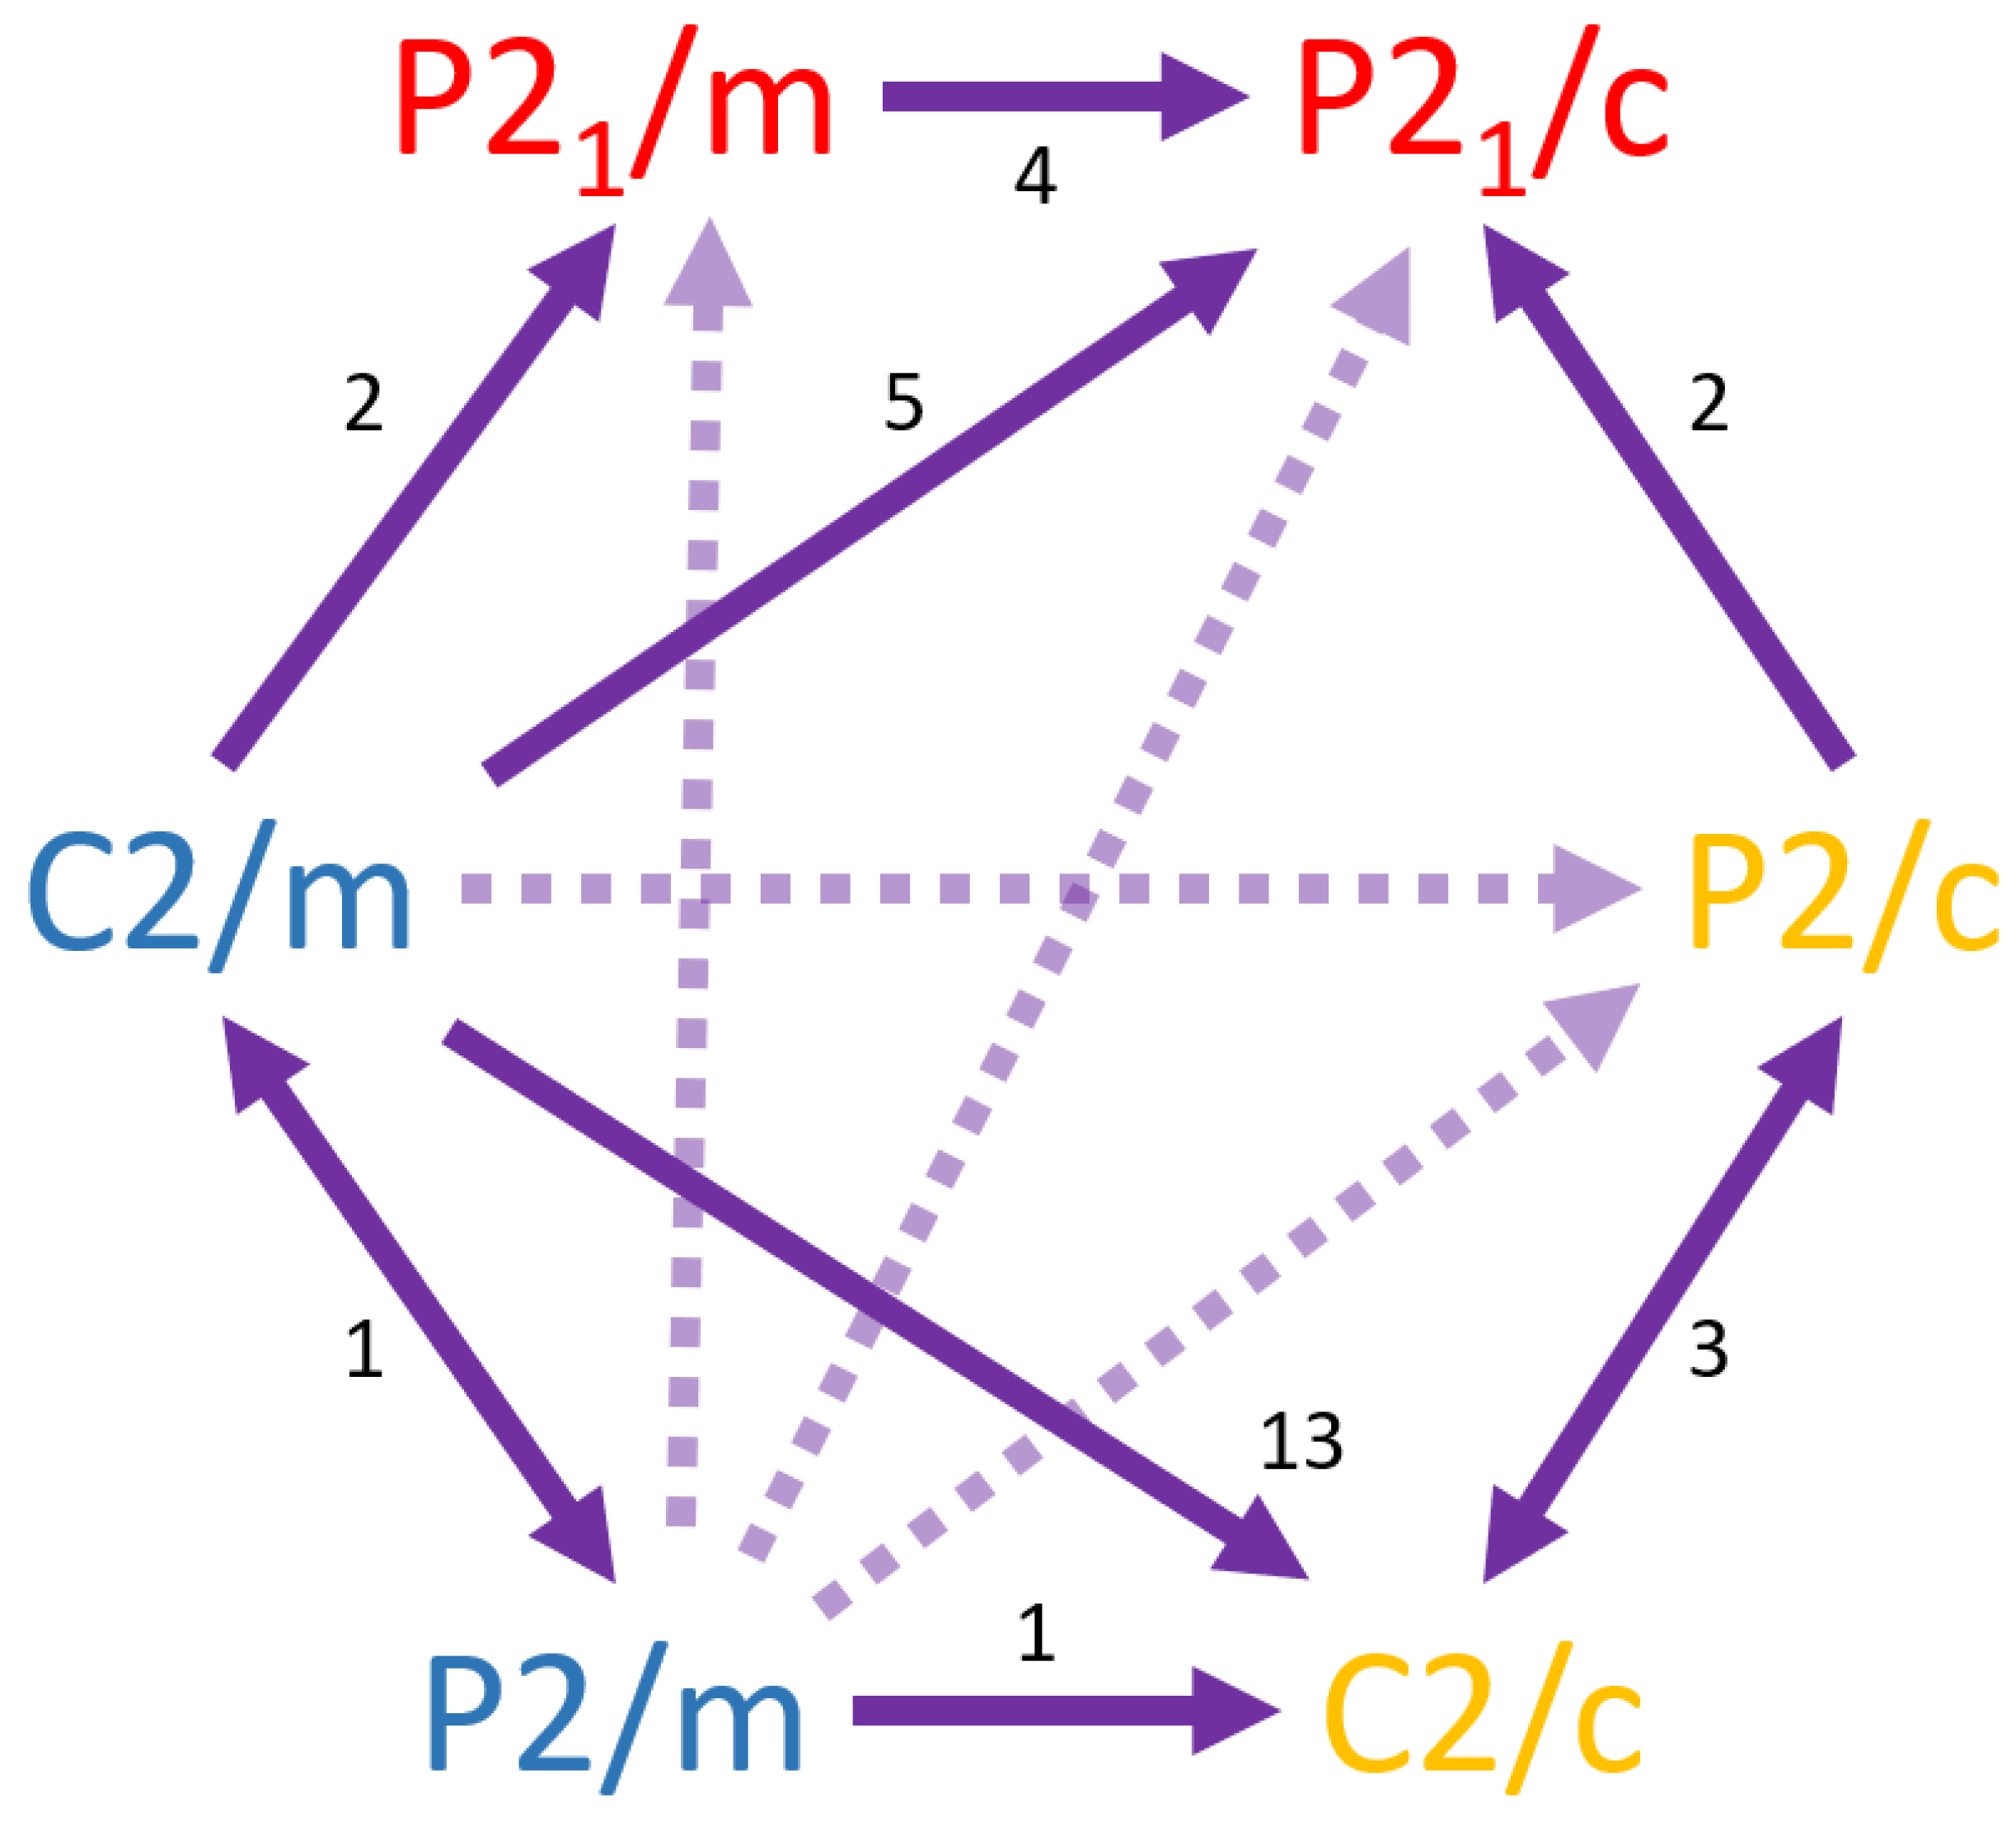
Figure 6.
Edge weighted directed graph illustrating translationengleiche group-subgroup pairings linking space groups of the 2/m point group with those of the m and 2 point groups. Note that pairings preserve the Bravais lattice structure from the supergroup to the subgroup. Of the 12 possible t-subgroup pairings, 6 are known to have mineral examples, with G(C2/c):H(Cc) the most frequently occurring.
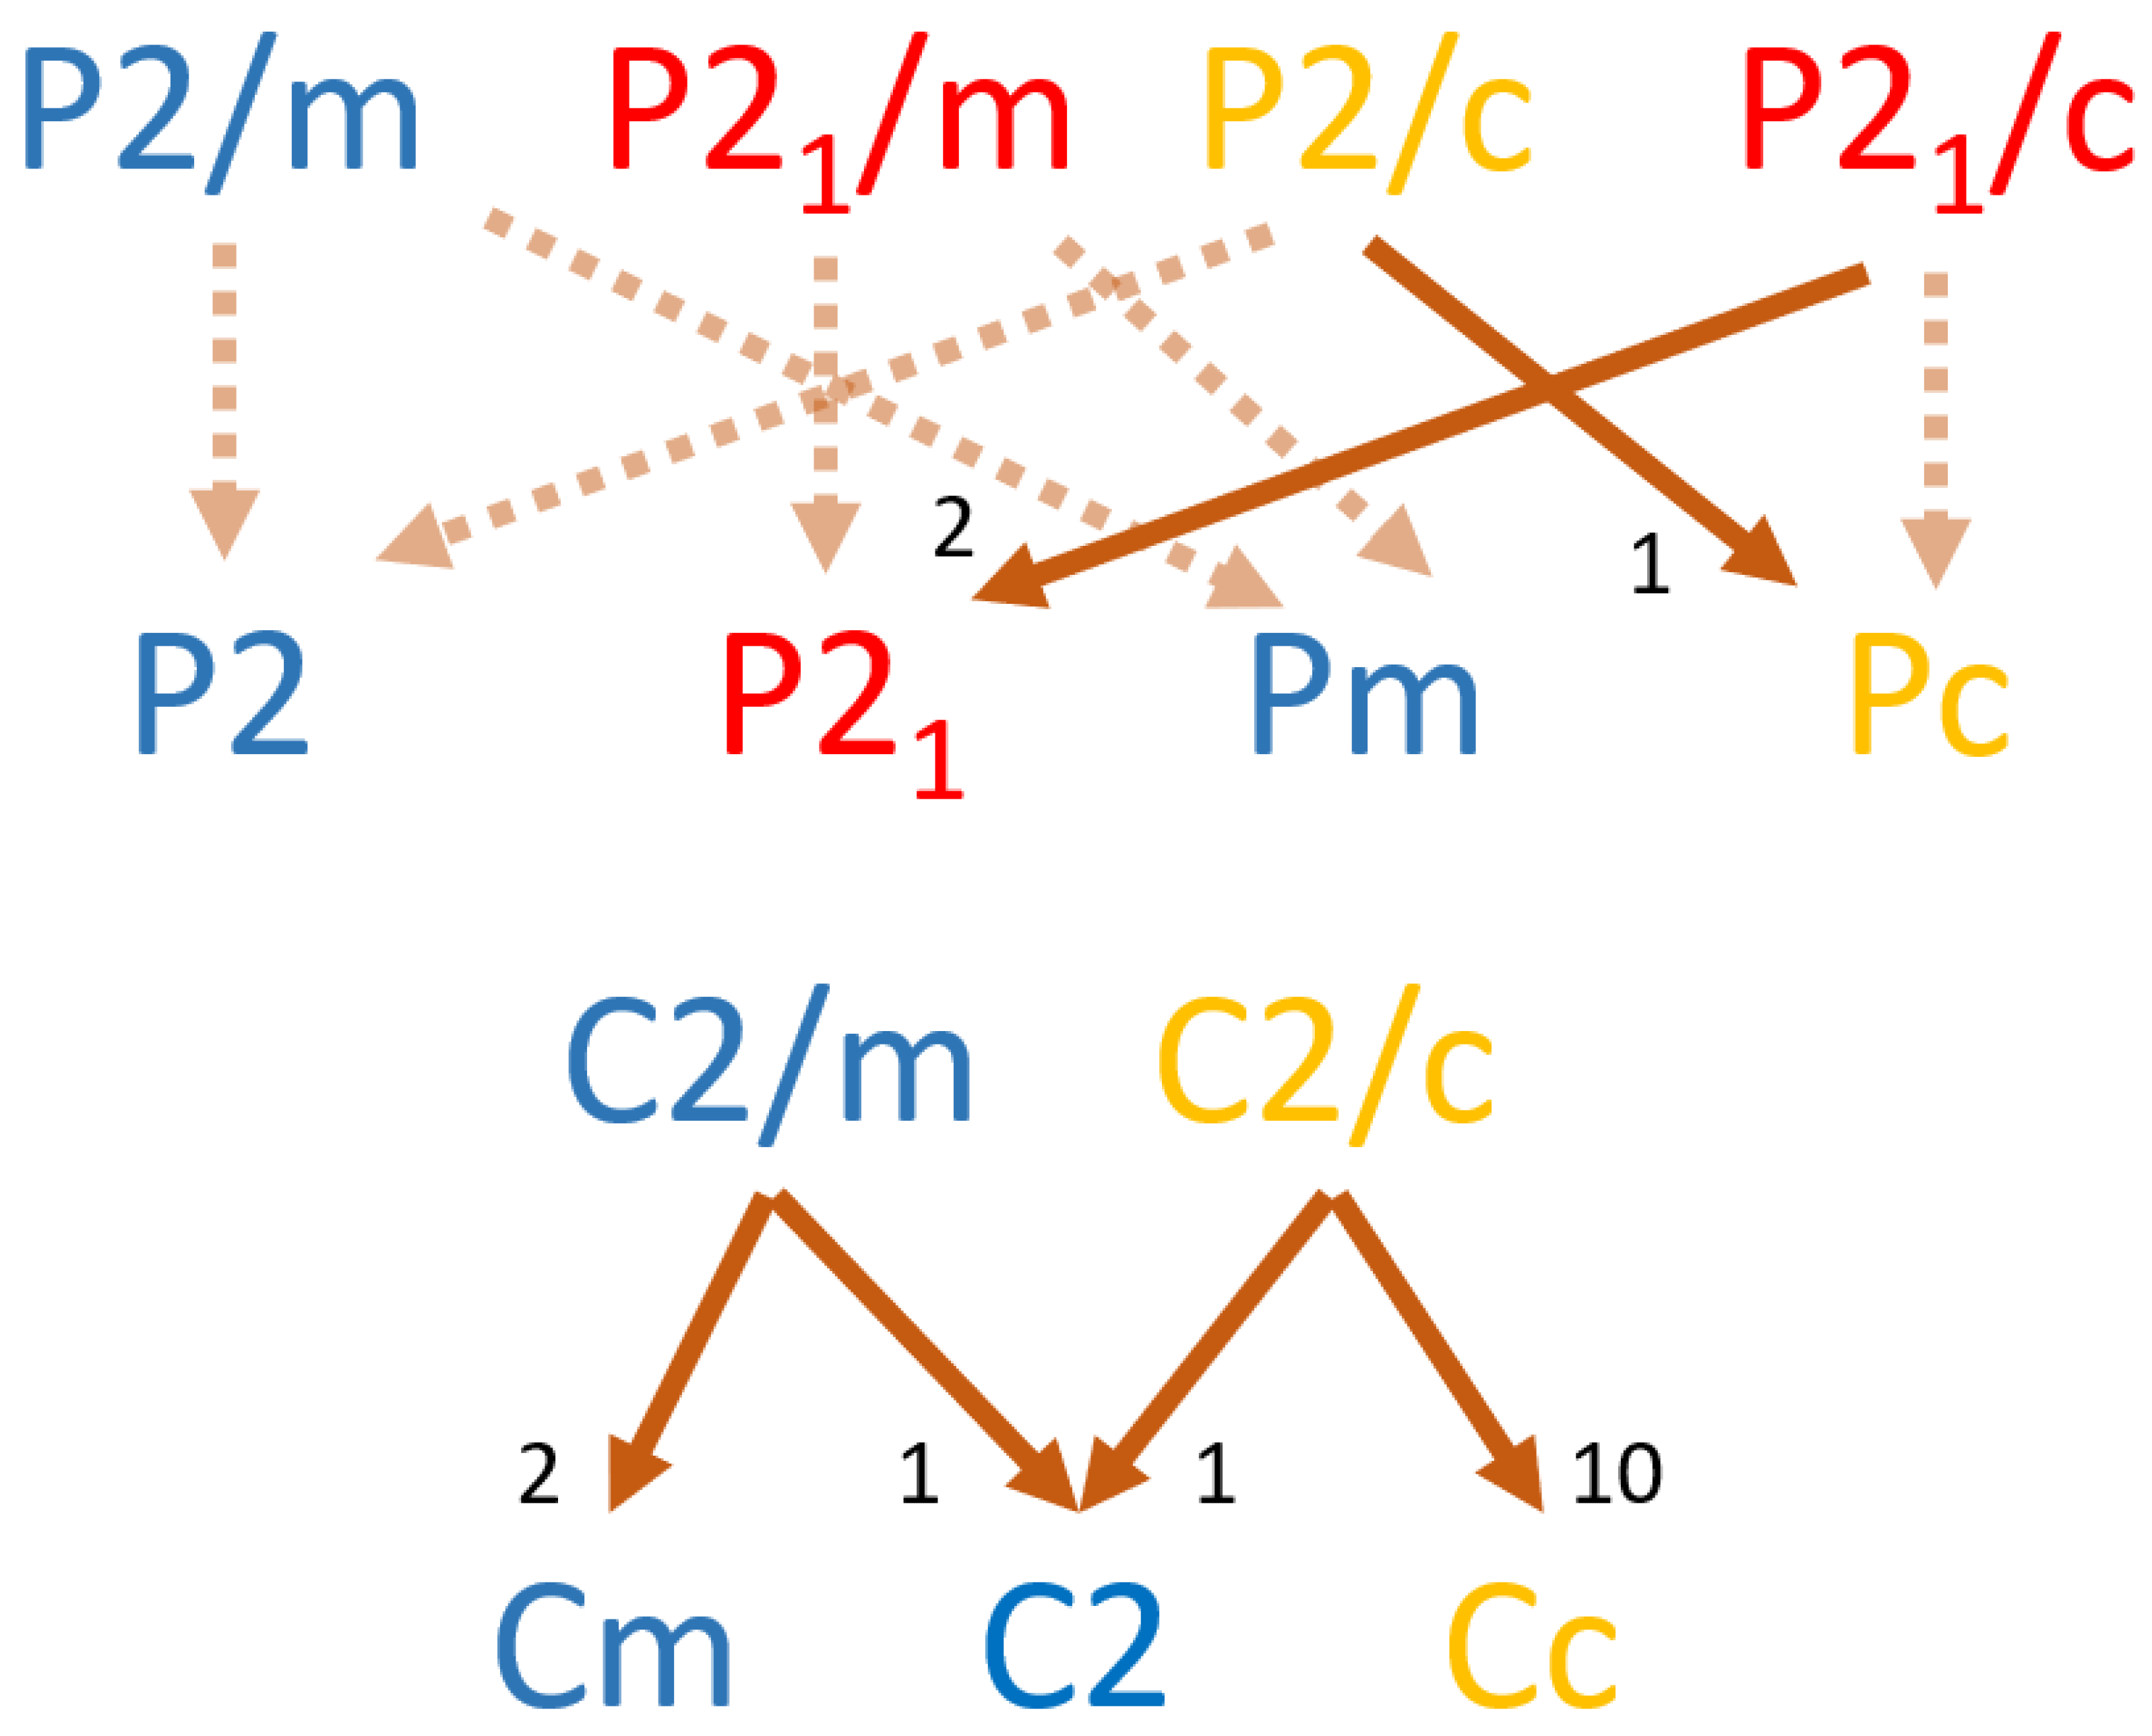
Figure 7.
Edge weighted directed graph illustrating general group-subgroup pairings linking space groups of the 2/m point group with those of the m and 2 point groups. With increasing magnitudes of symmetry difference between the supergroup and paired subgroup, the frequency of occurrence and number of minerals exhibiting those pairings decrease. As such, only 8 of the possible 23 pairings have mineral exemplars and all but the G(P21/m):H(P21) pairing occur in only one known mineral.
Disclaimer/Publisher’s Note: The statements, opinions and data contained in all publications are solely those of the individual author(s) and contributor(s) and not of MDPI and/or the editor(s). MDPI and/or the editor(s) disclaim responsibility for any injury to people or property resulting from any ideas, methods, instructions or products referred to in the content. |
© 2025 by the authors. Licensee MDPI, Basel, Switzerland. This article is an open access article distributed under the terms and conditions of the Creative Commons Attribution (CC BY) license (http://creativecommons.org/licenses/by/4.0/).
Copyright: This open access article is published under a Creative Commons CC BY 4.0 license, which permit the free download, distribution, and reuse, provided that the author and preprint are cited in any reuse.


