
Submitted:
26 December 2024
Posted:
30 December 2024
You are already at the latest version
Abstract
To study uranium transport by surface water from Sierra Peña Blanca to Laguna del Cuervo in the Chihuahuan Desert, sediments from intermittent streams and the lagoon have been extracted and studied. Two samples are sediments from the high area of the Sierra, close to the uranium deposit “El Nopal.” Moreover, 23 segments of a sedimentary core were analyzed to study changes in the fine component concentrations. The techniques of scanning electron microscopy-energy dispersive X-ray spectroscopy, XRD in a conventional diffractometer, and high-resolution synchrotron XRD analysis were applied. The crystallographic objective has been to evaluate the functionality of various methodologies when applied to cases of detailed analysis of many polyphase samples with cryptocrystals. The methods for processing the experimental data have been the Rietveld method, in the current multi-pattern variant of the Fullprof program, and the Degree of Crystallinity method for rapid estimation of the proportion of cryptocrystals in a mixture. This last technique has been developed with an Ad-Hoc software package, which has been deposited in the public repository GitLab.
Keywords:
fine sediments
; degree of crystallinity analysis
; Rietveld method
; synchrotron XRD
; XRD phase analysis
1. Introduction
Sierra Peña Blanca (SPB), in the center of the state of Chihuahua, is part of the Chihuahuan Desert. The Chihuahuan Desert [1] is the largest in North America, covering about 450,000 km2. The SPB site has about 50% of Mexico's uranium reserves. The mineralogical characterization of SPB was reported in the 80s by Goodell [2], and Reyes Cortes [3].
The Peña Blanca uraniferous district contains 104 prospects, of which many have superficial manifestations. The uranium of SPB was explored - exploited in the 80s. After the closure of operations, hundreds of tons of unprocessed U ore were confined to rocky stacks and exposed to weathering. Subject to leaching by the scarce but torrential desert rains, this uranium is transported from the mountains to Laguna del Cuervo. Stream sediments carry debris from igneous rocks and uranium minerals from SPB and constitute archives of the processes that these minerals have undergone [4].
The granulometry and mineral phases of the sediments reflect their mineral origin and location in the mountain range, from the top of the mountain range to the alluvial plain. Uranyl adsorption strongly depends on this grain size [5,6], with the smaller fractions (particle size < 2 μm) accounting for the largest proportion [7]. The content of the fine fractions is related to the climate and the minerals that gave rise to them. In this context, it is important to characterize the content of very fine or cryptocrystalline phases, because these are the particles that are transported by the wind [5]. These fine and cryptocrystalline phases are also responsible for the transport of the long-lived radon-progeny isotopes 210Pb, 210Bi and 210Po [8].
X-ray diffraction (XRD) is one of the most widely used techniques in mineralogy. The method allows determination of crystal structure and qualitative and quantitative phase analysis [9]. The Rietveld method (RM) [10] is frequently used. It consists of fitting the structural parameters of the phases present and of the experiment to the complete profile of the powder diffractogram. Quantitative phase analysis by the RM requires the crystal structures of all phases within the sample to be known [11]. Phases’ identification is performed with the help of crystallographic and diffraction databases [12,13,14,15] and by application of search-match programs [16]. The introduction of artificial intelligence tools in this field is a tendency nowadays [17,18,19]. Widely used RM programs are, among others: Fullprof [20], MAUD [21], TOPAS [22], BGMN [23], GSAS [24].
Some possible sample characteristics that make quantification difficult are texture, mixture of crystalline and amorphous or cryptocrystalline phases, and unknown or variable crystal structure. Results from XRD, scanning electron microscopy-energy dispersive X-ray spectroscopy (SEM-EDS), elemental analysis by X-ray fluorescence or ICP are often combined to validate the chemical composition of the samples.
Madsen et al. (2011) [25] review different XRD methods applicable to a mixture of crystalline polymorphs and amorphous material with equal or similar chemical composition. They mention the following techniques:
The PONKCS method [32] allows the quantification of the crystalline phases and the amorphous contribution. In the study of minerals with a large contribution of cryptocrystalline phases, such as bentonites [33], XRD and RM are successfully used. Geochemical studies involving fine mineral fractions [34,35], with their cryptocrystalline components, address a complex mixture of clays, feldspars, quartz, and calcite.
The present investigation has had a geological and a crystallographic objective.
The geological objective has been to characterize representative uranium-free samples of an ongoing research about uranium transport by surface water to Laguna del Cuervo. Two samples (“Nopal” and “Tigre”) are sediments from the high area of the Sierra, close to the uranium deposit. 23 segments of a sedimentary core were analyzed, to study 150 years’ history of the eventual uranium contamination of sediments. The crystallographic objective has been to fine-tune and evaluate the functionality of various methodologies, when applied to cases of detailed analysis and rapid characterization of a large number of polyphase samples with cryptocrystals. The experiments performed have been conventional diffraction in a laboratory diffractometer and high-resolution diffraction in a synchrotron. The methods for processing the experimental data have been the Rietveld method, in the current multi-pattern variant of the Fullprof program, and the Degree of Crystallinity method for rapid estimation of the proportion of cryptocrystals in a mixture. This last technique has been developed with an Ad-Hoc software package, which has been deposited in the public repository GitLab.
2. Materials and Methods
2.1. Sampling
Sediment samples Nopal and Tigre were gathered at streams close to Nopal 1 uranium deposits at SPB. Sampling followed regulations [36], using a 50 cm square frame, avoiding large stones, and collecting about 5 kg per sample in labeled polypropylene bags. The sediments were classified by granulometry into coarse sand, fine sand, silt, and clay, respectively [37]. Vibrational meshing was used at 15-minute intervals. Sediments passing the mesh 200 (0.074 mm) were classified as fine silt + clay.
The sedimentary core was obtained by manual extraction using a 4-inch diameter thick-walled PVC pipe with a steel top guard to a depth of 60 cm from the surface. The sampling recommendations of [38] were followed. The core was divided into 2.5 cm fractions, resulting in 23 core segments. Each fraction was classified in descending order. The part of each segment subjected to elemental analysis, electron microscopy, and XRD phase analysis was dried and manually ground in an agate mortar.
2.2. General Characterization of Samples
Inductively coupled plasma atomic emission spectroscopy (ICP-OES) elemental chemical analysis was used to determine the presence of several elements common in the SPB rocks (Al, Ca, Fe, K, Mg, Mn, Na, Si, and Ti). It was applied to the 23 segment samples of the sediment core collected at the flood plain. The samples were chemically digested, and the analysis was run on an ICP-OES Thermo Jarrell Ash, IRIS AP/Duo.
Secondary and backscattering electron images of sedimentary core samples were obtained using a scanning electron microscope Hitachi SU3500, with 15 kV and 20 kV operation voltages, respectively. In EDS mode, the qualitative and semi-quantitative elemental analysis were performed with an OXFORD Model X-MAX spectrometer. Backscattering electron images of samples Nopal and Tigre were obtained at the SEM field emission JEOL JSM7401F.
2.3. XRD Characterization of Samples
Samples from the Nopal and Tigre sites were measured using conventional (Lab) and high resolution (Sync) diffraction. The 23 samples from Laguna del Cuervo were examined using Lab diffraction. Conventional patterns were measured in a PANalytical X'Pert Pro diffractometer in Bragg-Brentano geometry, with a PIXcel3D detector using filtered CuKα radiation, measuring interval 2θ = [2.5, 60°], step Δ(2θ) = 0.0130°. High resolution XRD was observed at MCX beamline of Sincrotrone Elettra Trieste, with flat sample geometry, wavelength λ = 0.8265616 Å, measuring interval 2θ = [2.0, 40°], step Δ(2θ) = 0.01°. The instrumental resolution data for both groups of experiments were measured with LaB6 standards. To facilitate diverse comparisons, Sync diffraction patterns were converted to CuKα wavelength (script deposited in GitLab).
Diffraction data of the Nopal and Tigre samples were interpreted via Rietveld refinement. Qualitative phase identification was performed with the Match program. Crystal structures were found in the Crystal Open Database [12]. Quantification of phases’ concentration, small variations of lattice parameters and deviations from crystal perfection (nanometric crystal sizes, heterogeneity of cells dimensions) were obtained by application of the Rietveld program Fullprof.
The study of the 23 samples from Laguna del Cuervo was carried out in two parallel ways.
• Rietveld formal analysis: The multi-pattern variant of Fullprof was applied. This method allows to reinforce the systematic nature of the scan through the set of considered samples, keeping certain parameters constant and refining selectively in each sample. The method leads to detailed characterizations of each sample, including the quantitative analysis of all the phases present. The time required to complete this type of analysis is in the order of hours; in complicated cases it can take days.
• Rapid estimation of the concentration of cryptocrystals in clays: The determination of this % is an important claim of the geological component of the investigation. To satisfy this, a rapid, computerized procedure was developed. The technique is a variant of the above-mentioned method for the determination of the DoC. It is based on approximating the concentration of cryptocrystalline material to the ratio between the respective areas, above the background, in the XRD pattern. Symbolically:
In our laboratory, a combined [Rietveld + DoC] system for sediment analysis has been developed. Program ANALIA (ANALytical Integration Application), written in mixed programming [Python + renowned program FullProf], performs the data processing. ANALIA is an open-source code, it has been deposited in the public repository GitLab and is described in the Results section.
3. Results
3.1. General Characterization of Study Samples
The Nopal and Tigre fine silt + clay samples were characterized by scanning electron microscopy. Backscattered electron images, together with energy-dispersive X-ray spectroscopy analysis concentrations, are presented in Figure 1 and Figure 2.
The EDS of samples from Nopal and Tigre reflect a high content of Si and O, typical of quartz, as well as lower proportions of other elements of the minerals that form igneous rocks, such as Al, Ca, Na, Mg and K, typical of calcite and feldspars (orthoclase and albite), and of their alteration products, such as clays (kaolinite and montmorillonite).
Samples from the 23 core segments were characterized by scanning electron microscopy, and major element analysis was performed using ICP-OES. Results for each ICP-OES segment are shown in Appendix A. Backscattered electron images and EDS elemental concentrations for segment # 22, are presented in Figure 3.
As expected from the origin of the sediments of the 23 segments, the elemental composition is very similar to each other and similar to that of the Nopal and Tigre samples. The sample's EDS reflects concentrations of the same order of the averages, within the dispersions of Table A1. These averages are presented in Table 1.
Looking closely at Figure 3b, it can be seen that around and on the coarse grains appear grains of dimensions ~ 1 μm. Apparently, these grains have an average atomic number slightly larger than the coarse grains, which could correspond to clays that contain solid solutions of elements heavier than Si, Al, and Na.
3.2. XRD Results
Results from samples Nopal and Tigre are summarized in Table 2 and in Figure 4 and Figure 5. Some key results are mentioned below. The phase compositions are consistent with the elemental analysis results. The calcite concentration is almost double in Tigre. The concentration differences between members of the kaolin group and between feldspars are not overwhelming, if the sums [kaolinite + halloysite] and [orthoclase + albite] are considered. The presence of magnetite is at the detection limit, due to strong peaks’ overlapping. The concentration of montmorillonite is to some extent larger in Nopal. From the point of view of the study of fine sediments, the broadening of the Mnt 001 peak (2θ ≈ 6°), especially in the Tigre sample, is striking. The crystallites of montmorillonite are very poorly crystallized in Tigre.
The second part of the diffraction work focuses on establishing a rapid DoC-type method to characterize the cryptocrystal content in sediments and comparing its results with those of a complete Rietveld analysis. A useful product obtained in this component of the research is the freely available ANALIA program, deposited in GitLab. The link to access this program, with application examples, is the following:
https://luisolafg@gitlab.com/luisolafg/fullp-py.git
A run of ANALIA scans a series of measured diffractograms and automatically performs the following asks:
- Smooth and represent a suitable background.
- Calculate the net areas corresponding to poorly- and well crystallized phases.
- Estimate de cryptocrystalline concentration rapid via DoC
- Present diffraction and analytical results.
- Apply Rietveld multi-pattern refinement with program Fullprof.
- Compare DoC and Rietveld results.
The system of procedures described here has been applied to the aforementioned series of 23 samples from Laguna del Cuervo. All diffractograms, data and the Python codes necessary to reproduce the results to be described, are accessible at the GitLab link shown above.
Figure 6, Figure 7 and Figure 8 are representative examples of the study carried out on the Laguna del Cuervo series. Figures 6a and 7 show the XRD of sample 2, which contains little cryptocrystalline montmorillonite. Figures 6b and 8 refer to sample 22, in which the montmorillonite content is higher. The considered diffractograms appear in Figure 6 the way they are treated by ANALIA. Figure 7 and Figure 8 show the experimental XRD patterns superposed with the corresponding Rietveld-modelled ones.
The final results of the cryptocrystalline montmorillonite concentrations obtained by the two methods considered are shown in Figure 9. The trends coincide, although the values the values are different to some extent. Table A2 in the Appendix A presents the numerical outputs of the two analyses in detail. Fullprof gives all the detected phases and DoC only the cryptocrystalline fraction.
4. Discussion
How much is gained in synchrotron XRD phase analysis compared to laboratory measurements? Quite a lot, in terms of detecting minor phases and characterizing well-crystallized phases. This point is interesting in the comparison of Figure 4 and Figure 5. A curious contrast can be seen between the experimental resolution gains in the feldspar groups of peaks (Or 040 + Ab 040) near 2θ ≈ 27°. In the Tigre sample the resolution gain is visible, but in the Nopal sample it is not noticeable. The feldspars from Nopal present a lower degree of crystallinity than those from Tigre. It is striking that the opposite occurs with montmorillonite: the broader 001 peak (lower crystallinity) is observed in Tigre, not in Nopal.
The Sierra de Peña Blanca presents a general uniformity in its felsic composition, with its characteristic rhyolitic tuffs. However, a subtle difference was found in the less abundant chemical species in two different localities. The source of the El Tigre stream is in the vicinity of the Puerto III and Margaritas mines. In contrast, the sample collected near the Nopal mine presents a slightly greater abundance of the montmorillonite species than that collected in the El Tigre stream. Very significant is the much higher content of kaolinite in the Nopal sample than in the Tigre sample. Both differences are evidence that the geochemical processes associated with uranium mineralization in Nopal I are linked to the presence of the two clay species [40,41]. These are consequently dispersed as fine sediments from the mineralized zone, through erosive processes. In contrast, the broadening of the Mnt 001 peaks is associated with the sampling points of the two samples: The Nopal sample was extracted from a point higher in the Sierra than the Tigre sample, and therefore the degradation of montmorillonite is greater in the lower altitude sample.
An important detail that differentiates the XRD of the samples from Laguna del Cuervo from those from Nopal and Tigre: The Mnt 001 peaks in Nopal and Tigre are approximately symmetrical bell-shaped and those from Laguna del Cuervo are noticeably asymmetrical, with a tendency to plateau-shaped. This is common in clay samples, formed by particles with different amounts of water and various atoms in solution. In the literature [42] the Mnt 001 peak is modeled as a superposition of three (or more) contributions (illite, smectite, montmorillonite). In the present work, for Rietveld, Mnt1, Mnt2 and Mnt3 (with suitable lattice parameters) are modeled and satisfactory results are obtained. For DoC, a relatively wide range of the dispersion angle corresponding to the cryptocrystalline contribution is selected, so that the complete plateau is considered in the calculation.
The sedimentary column studied spans at least 150 years [43]. Due to the annual aeolian transport of the finest sediments [44,45], the quantities of montmorillonite deposited at the sampling site are constant. However, when the intense rains characteristic of deserts occur [46,47], they carry with them sediments of larger diameter and modify the relative concentration of the sediments carried by the wind. The dates of the segments of the sedimentary column with maximum and minimum montmorillonite concentrations agree approximately with the recent history of droughts and rainy periods, on direct data on precipitation [48,49] and the streamflow of neighboring dams [50,51]. Therefore, the differences between the segments in the montmorillonite content could be attributed to the droughts and rainy periods to which each segment corresponds.
The present study illustrates the scope and costs (in time and resources) of the different methods applied. Rietveld is the current king, solving almost everything from quantitative phase analysis to structural and microstructural characterization. Rietveld requires time, expertise and patience. For the particular problem of estimating the proportion of amorphous or cryptocrystalline material, the computerized DoC-type procedure described in this work may be sufficient. It is fast and leads to technically satisfactory results.
Author Contributions
Conceptualization, L.E.F.-C. and M.E.M.-C.; methodology, C.d.R.C.-C., Y.R.-G. and L.E.F.-C.; software, L.F.-M.; validation, L.F.-M.; formal analysis, C.d.R.C.-C. and L.E.F.-C.; investigation, C.d.R.C.-C., Y.R.-G. and L.E.F.-C.; writing—original draft preparation, C.d.R.C.-C., Y.R.-G., L.E.F.-C. and M.E.M.-C.; writing—review and editing, L.E.F.-C. and M.E.M.-C.; project administration, M.E.M.-C.; funding acquisition, M.E.M.-C. All authors have read and agreed to the published version of the manuscript.
Funding
This research was funded by the CONAHCYT research project CF/2019 10853.
Institutional Review Board Statement
Not applicable.
Informed Consent Statement
Not applicable.
Data Availability Statement
Data are contained within the article and associated materials in the Appendix A, GitLab.
Acknowledgments
The authors would like to express their gratitude to CONAHCYT for funding the CF/2019 10853 project. We extend our thanks to Andrés Isaak González Jáquez from CIMAV, for his technical support. Finally, the high resolution XRD measurements were conducted as part of proposal 20215805 at Elettra Sincrotrone Trieste. We sincerely appreciate their assistance.
Conflicts of Interest
The authors declare no conflicts of interest.
Abbreviations
The following abbreviations are used in this manuscript:
| SPB | Sierra Peña Blanca |
| XRD | X-ray diffraction |
| ICP-OES | Inductively coupled plasma atomic emission spectroscopy |
| CIMAV | Centro de Investigación en Materiales Avanzados |
| DoC | Degree of Crystallinity |
| PONKCS | Partial or No Known Crystal Structure |
| SEM | Scanning electron microscopy |
| EDS | Energy dispersive X-ray spectroscopy |
| RM | Rietveld method |
| Ab | Albite |
| An | Anorthite |
| Cal | Calcite |
| Hly | Halloysite |
| Kln | Kaolinite |
| Mag | Magnetite |
| Mnt | Montmorillonite |
| Ms | Muscovite |
| Or | Orthoclase |
| Qz | Quartz |
| Sa | Sanidine |
Appendix A

Table A1.
Concentrations (%) of major elements, analyzed by ICP-OES.
| Sample | Al | Ca | Fe | K | Mg | Na | Si | Ti |
| 1 | 7.39 | 3.94 | 2.44 | 2.96 | 1.15 | 1.18 | 20.72 | 0.16 |
| 2 | 6.91 | 3.65 | 2.23 | 2.86 | 1.03 | 1.14 | 20.48 | 0.15 |
| 3 | 7.07 | 3.73 | 2.30 | 2.91 | 1.08 | 1.20 | 19.74 | 0.15 |
| 4 | 7.14 | 3.83 | 2.34 | 2.98 | 1.06 | 1.24 | 20.97 | 0.16 |
| 5 | 6.90 | 3.77 | 2.37 | 2.83 | 1.03 | 1.28 | 18.93 | 0.16 |
| 6 | 5.07 | 2.82 | 2.18 | 2.72 | 0.66 | 1.07 | 23.34 | 0.21 |
| 7 | 6.23 | 3.71 | 2.33 | 2.93 | 0.88 | 1.49 | 23.26 | 0.18 |
| 8 | 6.45 | 3.74 | 2.37 | 2.96 | 0.93 | 1.37 | 23.50 | 0.18 |
| 9 | 5.54 | 6.33 | 2.63 | 2.49 | 1.29 | 1.48 | 18.92 | 0.19 |
| 10 | 6.32 | 3.77 | 2.38 | 2.96 | 0.86 | 1.34 | 23.22 | 0.18 |
| 11 | 6.34 | 3.93 | 2.28 | 2.96 | 0.86 | 1.41 | 22.89 | 0.18 |
| 12 | 4.65 | 2.74 | 2.27 | 2.92 | 0.63 | 1.21 | 23.51 | 0.21 |
| 13 | 6.22 | 3.60 | 2.18 | 2.93 | 0.88 | 1.40 | 23.39 | 0.17 |
| 14 | 6.62 | 4.17 | 2.26 | 2.89 | 0.86 | 1.37 | 23.79 | 0.17 |
| 15 | 5.95 | 3.68 | 2.16 | 2.88 | 0.79 | 1.38 | 23.43 | 0.15 |
| 16 | 6.72 | 4.23 | 2.21 | 2.93 | 0.96 | 1.48 | 23.01 | 0.14 |
| 17 | 7.14 | 4.37 | 2.30 | 3.06 | 0.96 | 1.53 | 24.05 | 0.16 |
| 18 | 5.15 | 2.74 | 2.12 | 2.83 | 0.88 | 1.36 | 22.96 | 0.15 |
| 19 | 4.92 | 2.78 | 2.16 | 2.80 | 0.85 | 1.29 | 23.30 | 0.16 |
| 20 | 6.58 | 4.30 | 2.25 | 2.94 | 0.91 | 1.46 | 24.11 | 0.15 |
| 21 | 6.57 | 4.37 | 2.18 | 2.85 | 0.86 | 1.45 | 24.45 | 0.16 |
| 22 | 6.25 | 3.90 | 2.07 | 2.84 | 0.81 | 1.47 | 23.64 | 0.16 |
| 23 | 6.32 | 3.83 | 2.11 | 2.85 | 0.85 | 1.51 | 24.12 | 0.17 |
Table A2.
Phase concentrations in % of the 23 segments from the sedimentary core sample. Mineral are denoted by IMA symbols [39]..
Table A2.
Phase concentrations in % of the 23 segments from the sedimentary core sample. Mineral are denoted by IMA symbols [39]..
| Sample | Mnt-DoC | Qz | Cal | Mag | Mnt-1 | Mnt-2 | Mnt-3 | Mnt-total | An | Kln | Sa |
| 1 | 9.0 | 33.42 | 10.35 | 0.59 | 1.51 | 7.77 | 1.22 | 10.5 | 41.49 | 3.12 | 0.53 |
| 2 | 5.9 | 31.91 | 11.46 | 0.67 | 2.67 | 5 | 0.68 | 8.35 | 42.61 | 4.43 | 0.57 |
| 3 | 6.0 | 32.01 | 10.92 | 0.61 | 4.26 | 1.26 | 3.33 | 8.85 | 42.31 | 4.76 | 0.54 |
| 4 | 8.7 | 31.1 | 11.16 | 0.63 | 2.39 | 6.34 | 2.28 | 11.01 | 40.63 | 4.93 | 0.55 |
| 5 | 8.4 | 32.59 | 10.62 | 0.63 | 1.76 | 6.26 | 2.34 | 10.36 | 41.78 | 3.37 | 0.66 |
| 6 | 8.3 | 32.15 | 11.24 | 0.7 | 1.86 | 6.28 | 1.41 | 9.55 | 41.55 | 4.21 | 0.6 |
| 7 | 8.7 | 30.63 | 10.22 | 0.94 | 1.92 | 6.7 | 0.99 | 9.61 | 44.5 | 3.69 | 0.42 |
| 8 | 8.8 | 30.14 | 10.79 | 0.77 | 1.63 | 7.36 | 0.88 | 9.87 | 44.34 | 3.66 | 0.43 |
| 9 | 8.8 | 30.12 | 11.41 | 0.65 | 1.43 | 9.15 | 0 | 10.58 | 42.96 | 3.8 | 0.49 |
| 10 | 8.9 | 29.18 | 11.28 | 0.43 | 0.74 | 9.13 | 0.58 | 10.45 | 44.91 | 3.28 | 0.46 |
| 11 | 13.9 | 27.24 | 9.87 | 0.71 | 1.37 | 11.95 | 2.78 | 16.1 | 41.85 | 3.77 | 0.45 |
| 12 | 11.3 | 27.96 | 11.79 | 0.64 | 1.36 | 9.85 | 1.16 | 12.37 | 43.05 | 3.6 | 0.59 |
| 13 | 9.8 | 34.4 | 12.3 | 0.5 | 1.09 | 9.08 | 0.71 | 10.88 | 37.94 | 3.4 | 0.58 |
| 14 | 14.2 | 32.65 | 12.56 | 0.73 | 1.7 | 11.07 | 1.32 | 14.09 | 35.88 | 3.64 | 0.45 |
| 15 | 13.6 | 28.81 | 12.37 | 0.57 | 1.48 | 10.39 | 2.07 | 13.94 | 40.23 | 3.6 | 0.48 |
| 16 | 9.9 | 28.23 | 12.5 | 0.5 | 1.24 | 9.98 | 0.71 | 11.93 | 42.39 | 3.86 | 0.59 |
| 17 | 9.7 | 30.41 | 11.58 | 0.42 | 1.02 | 9.13 | 0.39 | 10.54 | 43.05 | 3.46 | 0.54 |
| 18 | 8.3 | 29.05 | 12.67 | 0.49 | 1.5 | 9.13 | 0.27 | 10.9 | 42.26 | 4.17 | 0.47 |
| 19 | 9.6 | 29.7 | 12.81 | 0.48 | 1.27 | 9.04 | 0.93 | 11.24 | 41.21 | 4.08 | 0.49 |
| 20 | 9.0 | 27.09 | 13.4 | 0.52 | 1.88 | 8.95 | 0.14 | 10.97 | 43.56 | 3.91 | 0.54 |
| 21 | 10.9 | 27.22 | 13.36 | 0.48 | 1.28 | 9.88 | 0.22 | 11.38 | 43.77 | 3.24 | 0.56 |
| 22 | 10.7 | 27.93 | 11.91 | 0.48 | 1.53 | 9.3 | 0.28 | 11.11 | 45.02 | 3.14 | 0.42 |
| 23 | 10.5 | 29.37 | 11.61 | 0.35 | 1.06 | 9.1 | 0.38 | 10.54 | 45.12 | 2.58 | 0.44 |
References
- Schmidt, R.H. A climatic delineation of the ‘real’ Chihuahuan Desert. 0140-1963 1979, 2, 243–250. [Google Scholar] [CrossRef]
- Goodell, P.C. In Chihuahua city uranium province, Chihuahua Mex, Proc. IAEA Vienna, Symp. Uranium deposits in volcanic rocks El Paso, Texas 2 - 5 April, 1984; IAEA El Paso, Texas 1985; pp 97–124.
- Reyes Cortes, M. in Deposito de molibdeno asociado con uranio en Peña Blanca, Mexico, Proc. IAEA Vienna, Symp. Uranium Deposits in Volcanic Rocks El Paso, Texas, 2 - 5 April, 1984; IAEA: El Paso, Texas, 1985; pp. 161–174. [Google Scholar]
- Allen, P.A. From landscapes into geological history. 0028-0836 2008, 451, 274–276. [Google Scholar] [CrossRef] [PubMed]
- Shang, J.; Liu, C.; Wang, Z.; Zachara, J.M. Effect of Grain Size on Uranium(VI) Surface Complexation Kinetics and Adsorption Additivity. 0013-936X 2011, 45, 6025–6031. [Google Scholar] [CrossRef]
- Baqer, Y.; Thornton, S.; Stewart, D.I.; Norris, S.; Chen, X. Analysis of Uranium Sorption in a Laboratory Column Experiment Using a Reactive Transport and Surface Complexation Model. Transport in Porous Media 2023, 149, 423–452. [Google Scholar] [CrossRef]
- McKinley, J.P.; Zachara, J.M.; Smith, S.C.; Turner, G.D. The influence of uranyl hydrolysis and multiple site-binding reactions on adsorption of U (VI) to montmorillonite. Clays and Clay Minerals 1995, 43, 586–598. [Google Scholar] [CrossRef]
- Baskaran, M. Applications of Radon Progeny in Atmospheric Studies. In Radon: A Tracer for Geological, Geophysical and Geochemical Studies, Springer International Publishing: Cham, 2016; pp 85-117.
- Cullity, B.D.; Stock, S.R. Elements of X-ray Diffraction. Prentice Hall: Upper Saddle River, NJ, 2001; p 664.
- Rietveld, H. A profile refinement method for nuclear and magnetic structures. Journal of Applied Crystallography 1969, 2, 65–71. [Google Scholar] [CrossRef]
- McCusker, L.; Von Dreele, R.; Cox, D.; Louër, D.; Scardi, P. Rietveld refinement guidelines. Journal of Applied Crystallography 1999, 32, 36–50. [Google Scholar] [CrossRef]
- Gražulis, S.; Merkys, A.; Vaitkus, A. Crystallography Open Database (COD). In Handbook of Materials Modeling: Methods: Theory and Modeling, Andreoni, W.; Yip, S., Eds. Springer International Publishing: Cham, 2020; pp. 1863–1881. [Google Scholar]
- Kabekkodu, S.N.; Dosen, A.; Blanton, T.N. PDF-5+: a comprehensive powder diffraction file™ for materials characterization. Powder Diffraction 2024, 1–13. [Google Scholar] [CrossRef]
- Zagorac, D.; Müller, H.; Ruehl, S.; Zagorac, J.; Rehme, S. Recent developments in the Inorganic Crystal Structure Database: theoretical crystal structure data and related features. Journal of applied crystallography 2019, 52, 918–925. [Google Scholar] [CrossRef]
- Downs, R.T.; Hall-Wallace, M. The American Mineralogist crystal structure database. American Mineralogist 2003, 88, 247–250. [Google Scholar]
- Putz, H.; Brandenburg, K. Match! - Phase Analysis using Powder Diffraction GbR, C.I., Ed. Kreuzherrenstr. 102, 53227 Bonn, Germany, 2024.
- Suzuki, Y. Automated Data Analysis for Powder X-Ray Diffraction Using Machine Learning. Synchrotron Radiation News 2022, 35, 9–15. [Google Scholar] [CrossRef]
- Lee, J.-W.; Park, W.B.; Lee, J.H.; Singh, S.P.; Sohn, K.-S. A deep-learning technique for phase identification in multiphase inorganic compounds using synthetic XRD powder patterns. Nature Communications 2020, 11, 86. [Google Scholar] [CrossRef] [PubMed]
- Surdu, V.-A.; Győrgy, R. X-ray Diffraction Data Analysis by Machine Learning Methods—A Review. Applied Sciences 2023, 13, 9992. [Google Scholar] [CrossRef]
- Rodríguez-Carvajal, J. Recent developments of the program FULLPROF. Commission on Powder Diffraction Newsletter 2001, 26, 12–19. [Google Scholar]
- Lutterotti, L.; Pilliere, H.; Fontugne, C.; Boullay, P.; Chateigner, D. Full-profile search-match by the Rietveld method. Journal of Applied Crystallography 2019, 52, 587–598. [Google Scholar] [CrossRef] [PubMed]
- Coelho, A. TOPAS and TOPAS-Academic: an optimization program integrating computer algebra and crystallographic objects written in C++. Journal of Applied Crystallography 2018, 51, 210–218. [Google Scholar] [CrossRef]
- Bergmann, J.; Friedel, P.; Kleeberg, R. BGMN - a New Fundamental Parameters Based Rietveld Program for Laboratory X-ray Sources, it’s Use in Quantitative Analysis and Structure Investigations. IUCr Commission on powder diffraction newsletter 1998, 20, 5–8. [Google Scholar]
- Toby, B.H.; Von Dreele, R.B. GSAS-II: the genesis of a modern open-source all purpose crystallography software package. Journal of Applied Crystallography 2013, 46, 544–549. [Google Scholar] [CrossRef]
- Madsen, I.C.; Scarlett, N.V.; Kern, A. Description and survey of methodologies for the determination of amorphous content via X-ray powder diffraction. Zeitschrift für Kristallographie 2011, 226, 944–955. [Google Scholar] [CrossRef]
- Clark, G.L.; Reynolds, D.H. Quantitative analysis of mine dusts: an X-Ray diffraction method. Industrial & Engineering Chemistry Analytical Edition 1936, 8, 36–40. [Google Scholar]
- M. Butler, B.; Hillier, S. Automated Full-Pattern Summation of X-Ray Powder Diffraction Data for High-Throughput Quantification of Clay-Bearing Mixtures. Clays and Clay Minerals 2021, 69, 38–51. [Google Scholar] [CrossRef]
- O'Connor, B.H.; Raven, M.D. Application of the Rietveld refinement procedure in assaying powdered mixtures. Powder diffraction 1988, 3, 2–6. [Google Scholar] [CrossRef]
- Klug, H.P.; Alexander, L.E. X-ray diffraction procedures: for polycrystalline and amorphous materials. Wiley: New York, 1974; p 966.
- Scarlett, N.V.; Madsen, I.C. Quantification of phases with partial or no known crystal structures. Powder Diffraction 2006, 21, 278–284. [Google Scholar] [CrossRef]
- Riello, P. Quantitative analysis of amorphous fraction in the study of the microstructure of semi-crystalline materials. In Diffraction analysis of the microstructure of materials, Springer: 2004; pp 167-184.
- Mejdi, M.; Wilson, W.; Saillio, M.; Chaussadent, T.; Divet, L.; Tagnit-Hamou, A. Quantifying glass powder reaction in blended-cement pastes with the Rietveld-PONKCS method. Cement and Concrete Research 2020, 130, 105999. [Google Scholar] [CrossRef]
- Cuevas, J.; Cabrera, M.Á.; Fernández, C.; Mota-Heredia, C.; Fernández, R.; Torres, E.; Turrero, M.J.; Ruiz, A.I. Bentonite Powder XRD Quantitative Analysis Using Rietveld Refinement: Revisiting and Updating Bulk Semiquantitative Mineralogical Compositions. Minerals 2022, 12, 772. [Google Scholar] [CrossRef]
- Kanzari, A.; Gérard, M.; Boekhout, F.; Galoisy, L.; Calas, G.; Descostes, M. Impact of incipient weathering on uranium migration in granitic waste rock piles from former U mines (Limousin, France). Journal of Geochemical Exploration 2017, 183, 114–126. [Google Scholar] [CrossRef]
- Maestracci, B.; Delchini, S.; Chateigner, D.; Pilliere, H.; Lutterotti, L.; Borovin, E. Simultaneous combined XRF-XRD analysis of geological sample: New methodological approach for on-site analysis on New-Caledonian Ni-rich harzburgite. Journal of Geochemical Exploration 2023, 252, 107250. [Google Scholar] [CrossRef]
- ISO-18400-102. Soil Quality- Sampling-Part 102: Selection and Application of Sampling Techniques. International Organization for Standardization: 2017; p 71.
- Switzer, A.D. Measuring and Analyzing Particle Size in a Geomorphic Context. In Treatise on Geomorphology, Elsevier: 2013; Vol. 14.
- Sanchez-Cabeza, J.-A.; Díaz-Asencio, M.; Ruiz-Fernández, A.C. Radiocronología de Sedimentos Costeros Utilizando 210Pb: Modelos, Validación y Aplicaciones. IAEA: Vienna, Austria, 2012; p 105.
- Warr, L.N. IMA–CNMNC approved mineral symbols. Mineralogical Magazine 2021, 85, 291–320. [Google Scholar] [CrossRef]
- Aniel, B.; Leroy, J.M. The reduced uraniferous mineralizations associated with the volcanic rocks of the Sierra Pena Blanca (Chihuahua, Mexico). American Mineralogist 1985, 70, 1290–1297. [Google Scholar]
- George-Aniel, B.; Poty, B.; Leroy, J. in Uranium deposits of the Sierra Peña Blanca: Three examples of mechanisms of ore deposit formation in a volcanic environment, Proc. IAEA Vienna, Symp. Uranium deposits in volcanic rocks, El Paso, Texas, 2 - 5 April, 1984; IAEA: El Paso, Texas, 1985; pp. 490 –498. [Google Scholar]
- Barré, P.; Montagnier, C.; Chenu, C.; Abbadie, L.; Velde, B. Clay minerals as a soil potassium reservoir: observation and quantification through X-ray diffraction. 0032-079X 2008, 302, 213–220. [Google Scholar] [CrossRef]
- Caraveo-Castro, C.d.R.; Montero-Cabrera, M.E.; Méndez-García, C.G.; Cabral-Lares, R.M.; Castillo-Sandoval, I. Mineralogical characterization and uranium radioactivity of recent sediments from the Laguna del Cuervo, Chihuahua. In 1st National Congress of the Mexican Society of Synchrotron Light & 1st International Congress of Synchrotron Light Techniques., Cuéllar-Cruz, M., Ed. Sociedad Mexicana de Luz Sincrotrón: Leon, Guanajuato, Mexico, 2021.
- Ma, L.; Wu, J.; Abuduwaili, J.; Liu, W. Aeolian particle transport inferred using a ~150-year sediment record from Sayram Lake, arid northwest China. Journal of Limnology 2015, 74. [Google Scholar] [CrossRef]
- Vandenberghe, J.; Sun, Y.; Wang, X.; Abels, H.A.; Liu, X. Grain-size characterization of reworked fine-grained aeolian deposits. 0012-8252 2018, 177, 43–52. [Google Scholar] [CrossRef]
- Shi, H.; Yue, D.; Zhao, J.; Wang, X. Research on flood sediments and rainstorm events in Huangtuwa, Northern Shaanxi. Frontiers in Environmental Science 2023, 11. [Google Scholar] [CrossRef]
- Wennrich, V.; Böhm, C.; Brill, D.; Carballeira, R.; Hoffmeister, D.; Jaeschke, A.; Kerber, F.; Maldonado, A.; May, S.M.; Olivares, L. , et al. Late Pleistocene to modern precipitation changes at the Paranal clay pan, central Atacama Desert. Global and Planetary Change 2024, 233, 104349. [Google Scholar] [CrossRef]
- Núñez-López, D.; Muñoz-Robles, C.A.; Reyes-Gómez, V.M.; Velasco-Velasco, I.; Gadsden-Esparza, H. Characterization of drought at different time scales in Chihuahua, México. Agrociencia 2007, 41, 253–262. [Google Scholar]
- Esquivel, E. Lluvia y sequía en el norte de México. Un análisis de la precipitación histórica en Chihuahua. Gaceta ecológica, 2002; 43–52. [Google Scholar]
- Renteria-Villalobos, M.; Hanson, R.T.; Eastoe, C. Evaluation of climate variability on sustainability for transboundary water supply in Chihuahua, Mexico. Journal of Hydrology: Regional Studies 2022, 44, 101207. [Google Scholar] [CrossRef]
- Ortega-Gaucin, D. Hydrological drought characterization in the Rio Grande basin, Mexico. Terra Latinoamericana 2013, 31, 167–180. [Google Scholar]
Figure 1.
SEM analysis of the Nopal sample. (a) Backscattered electron image; (b) EDS analysis.
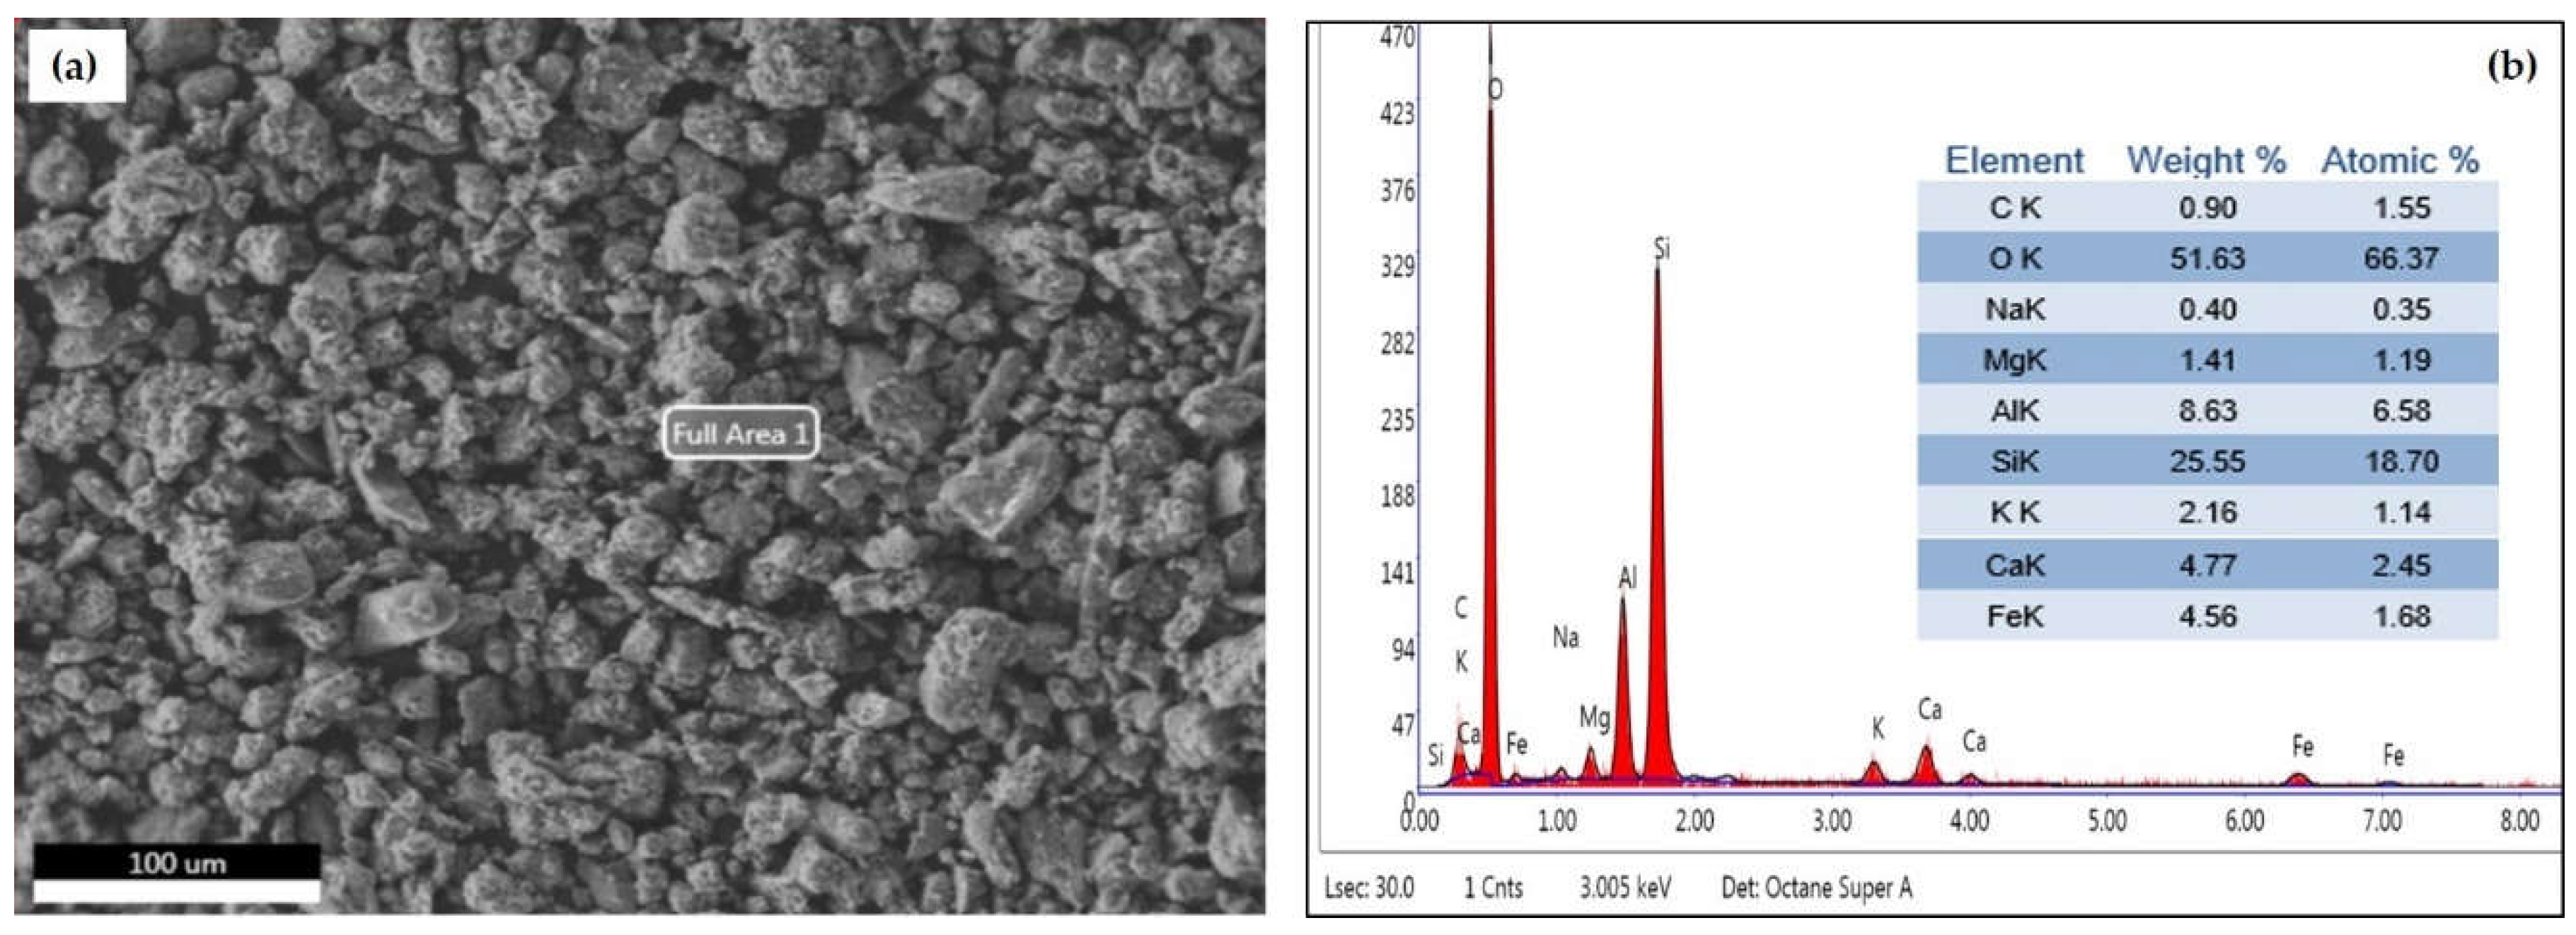
Figure 2.
SEM analysis of the Tigre sample. (a) Backscattered electron image; (b) EDS analysis.
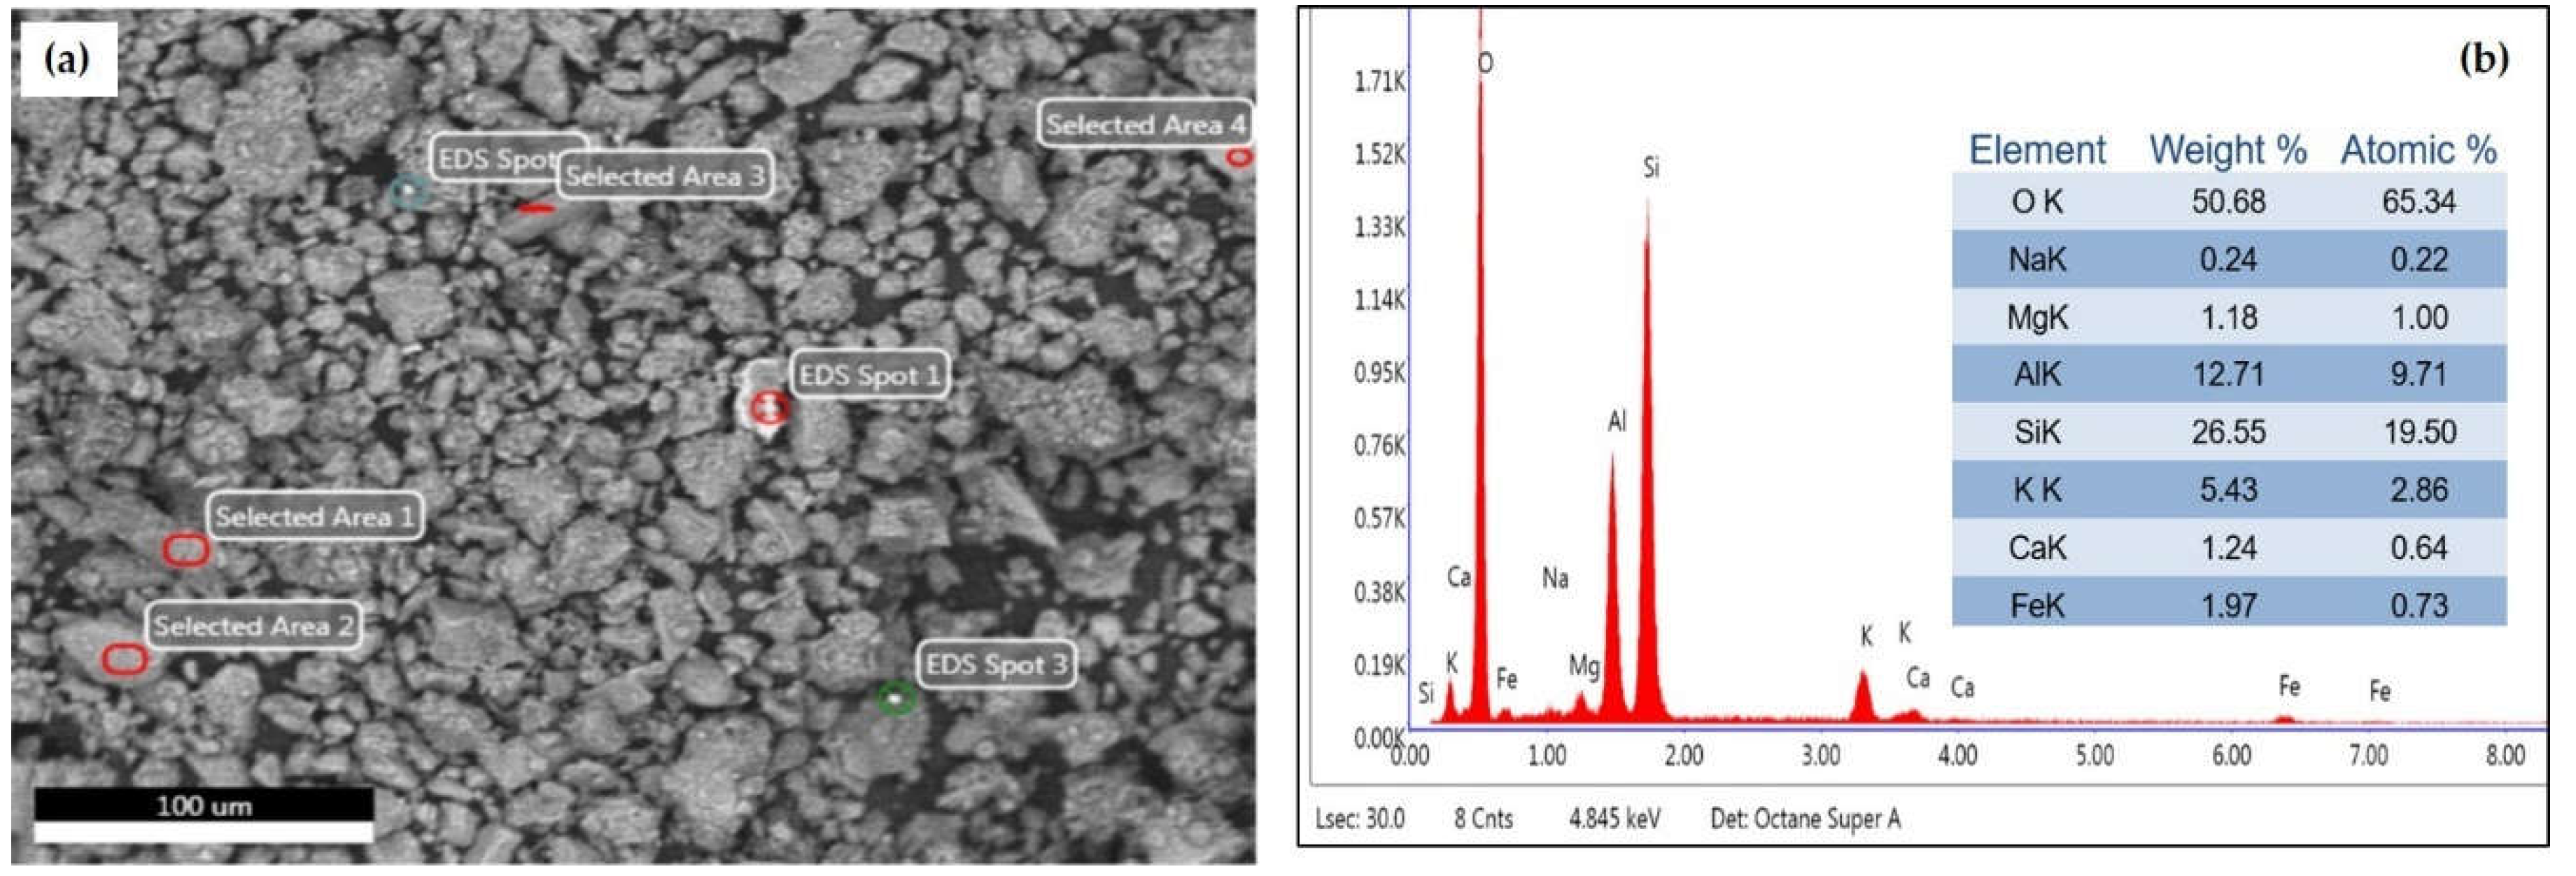
Figure 3.
SEM analysis of segment # 22 from the core sedimentary sample. (a) EDS analysis; (b) Backscattered electron image with compositional difference; (c) Low magnification backscattered electron image.
Figure 3.
SEM analysis of segment # 22 from the core sedimentary sample. (a) EDS analysis; (b) Backscattered electron image with compositional difference; (c) Low magnification backscattered electron image.
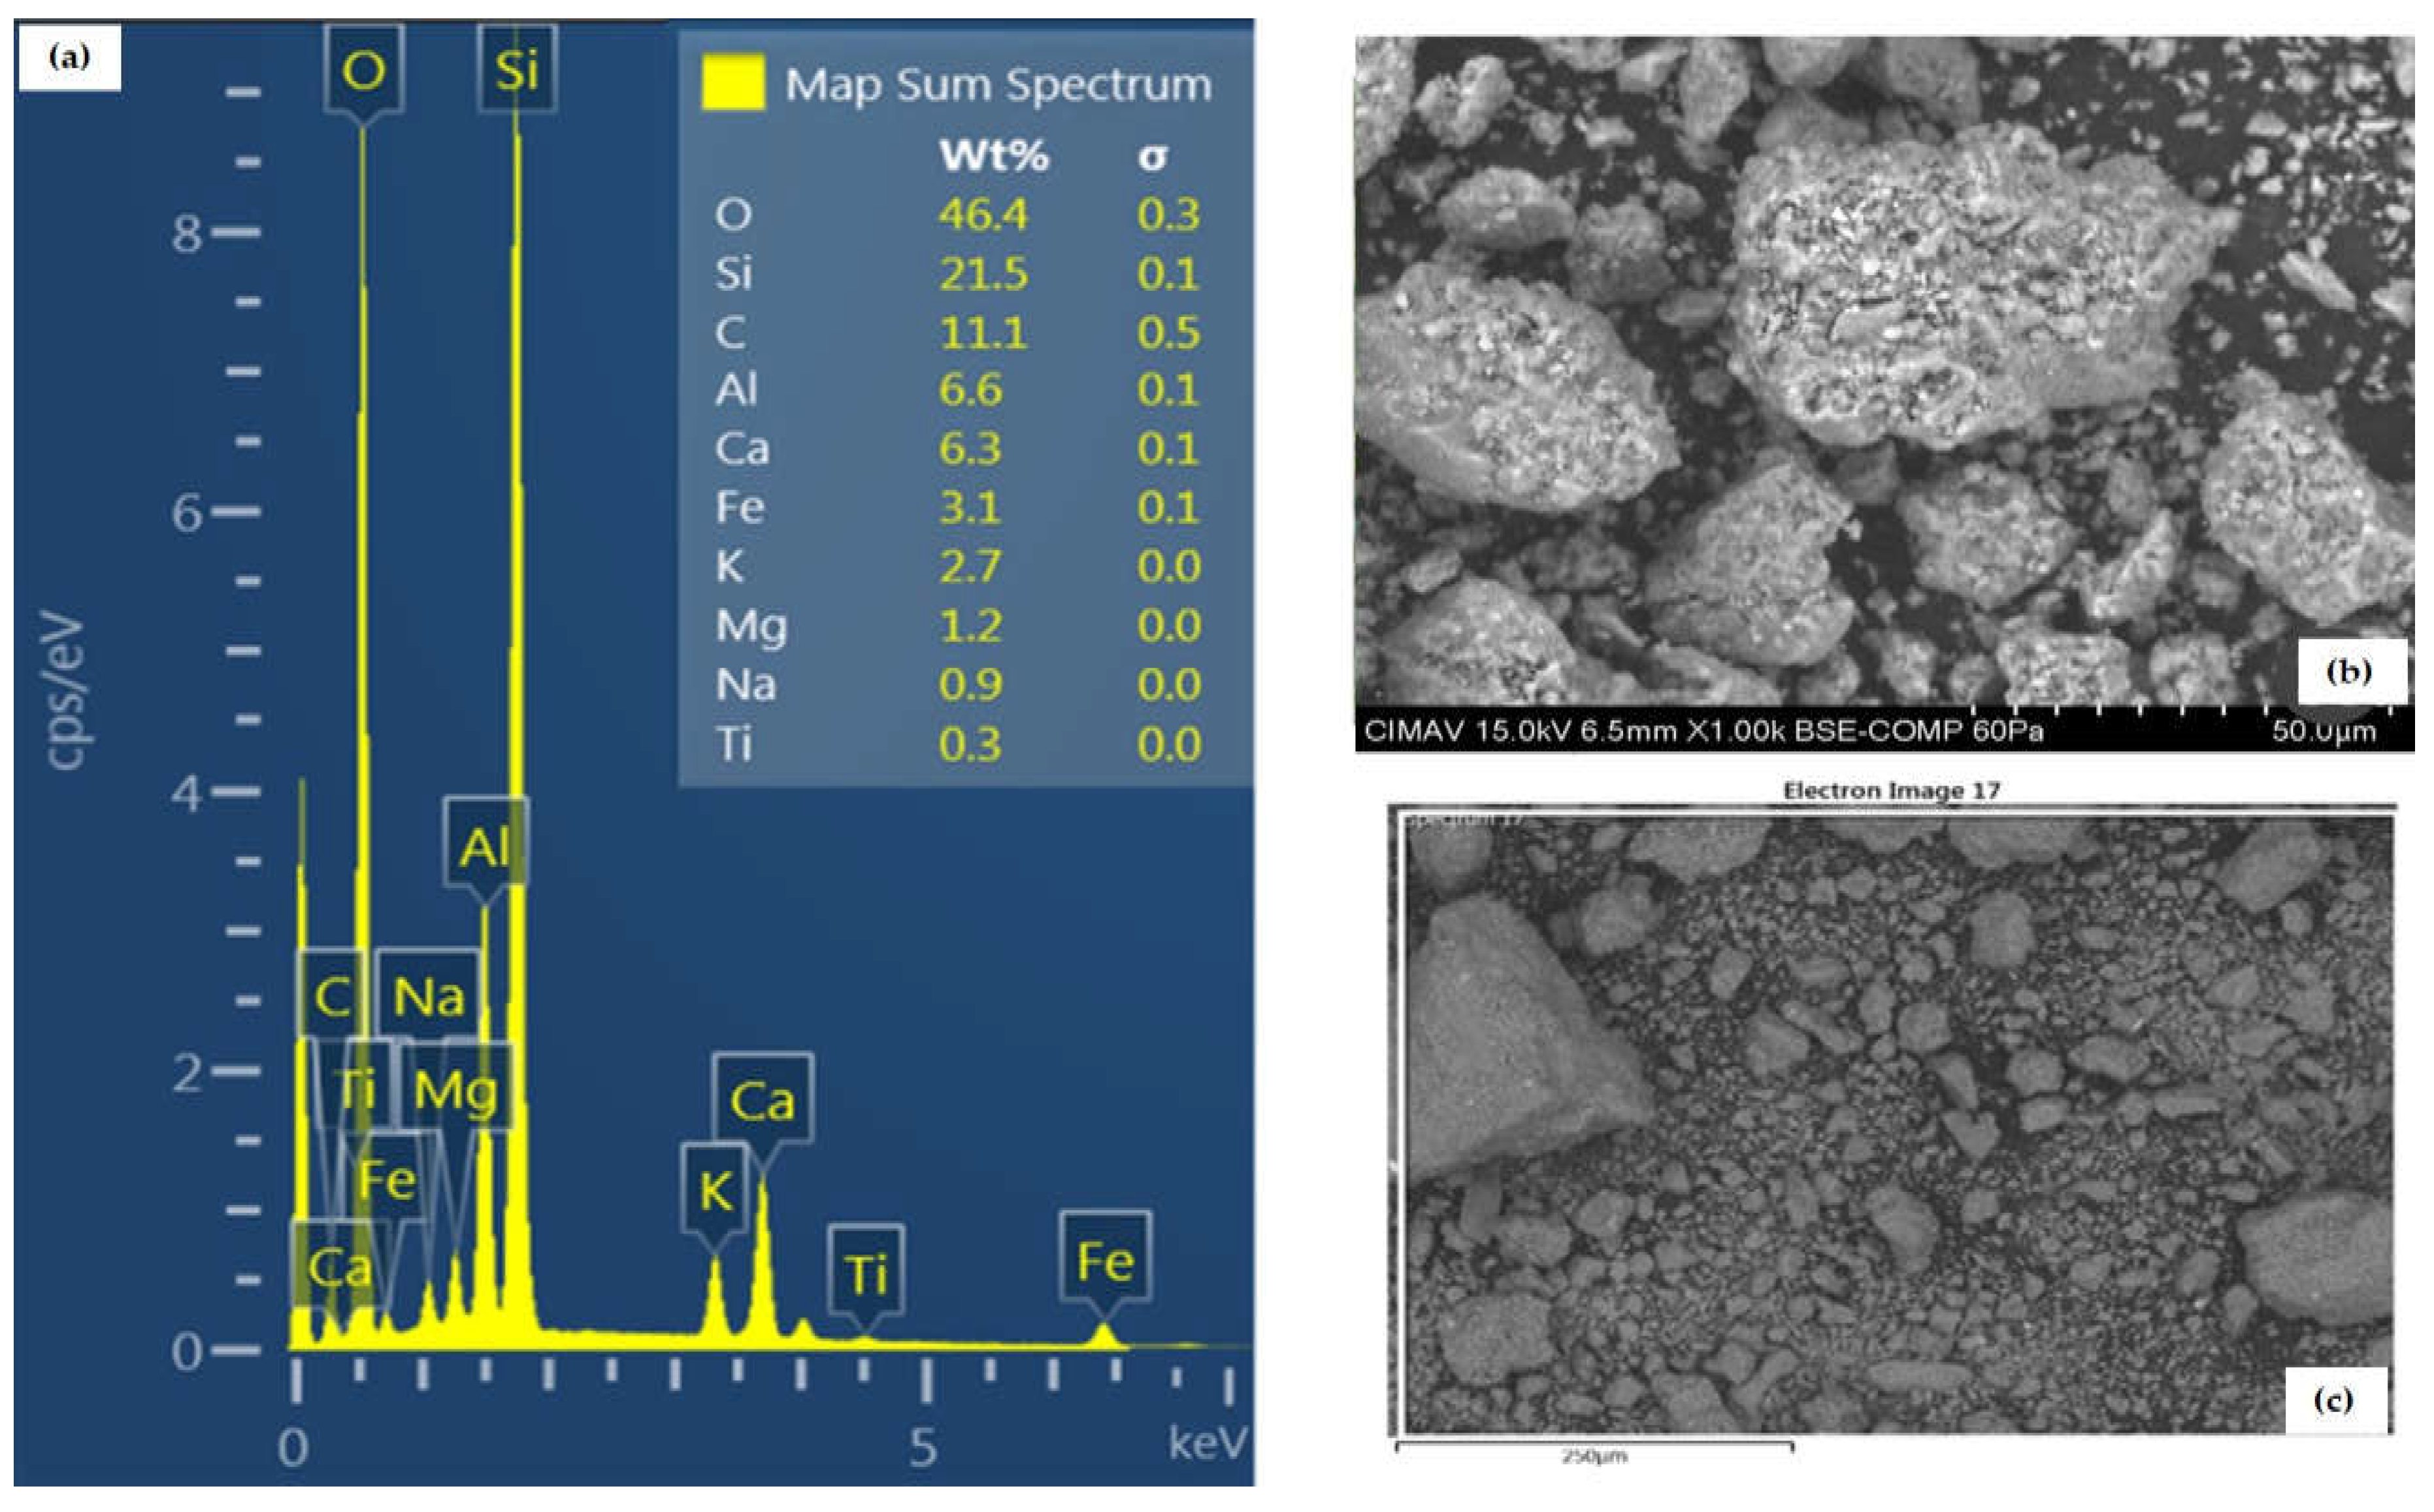
Figure 4.
XRD of the Nopal sample. The main plot describes the pattern measured at the synchrotron, converted to CuKα wavelength. The inset is a zoom of the interval associated primarily with feldspars. It includes, in blue, a segment of the conventional XRD experiment.
Figure 4.
XRD of the Nopal sample. The main plot describes the pattern measured at the synchrotron, converted to CuKα wavelength. The inset is a zoom of the interval associated primarily with feldspars. It includes, in blue, a segment of the conventional XRD experiment.
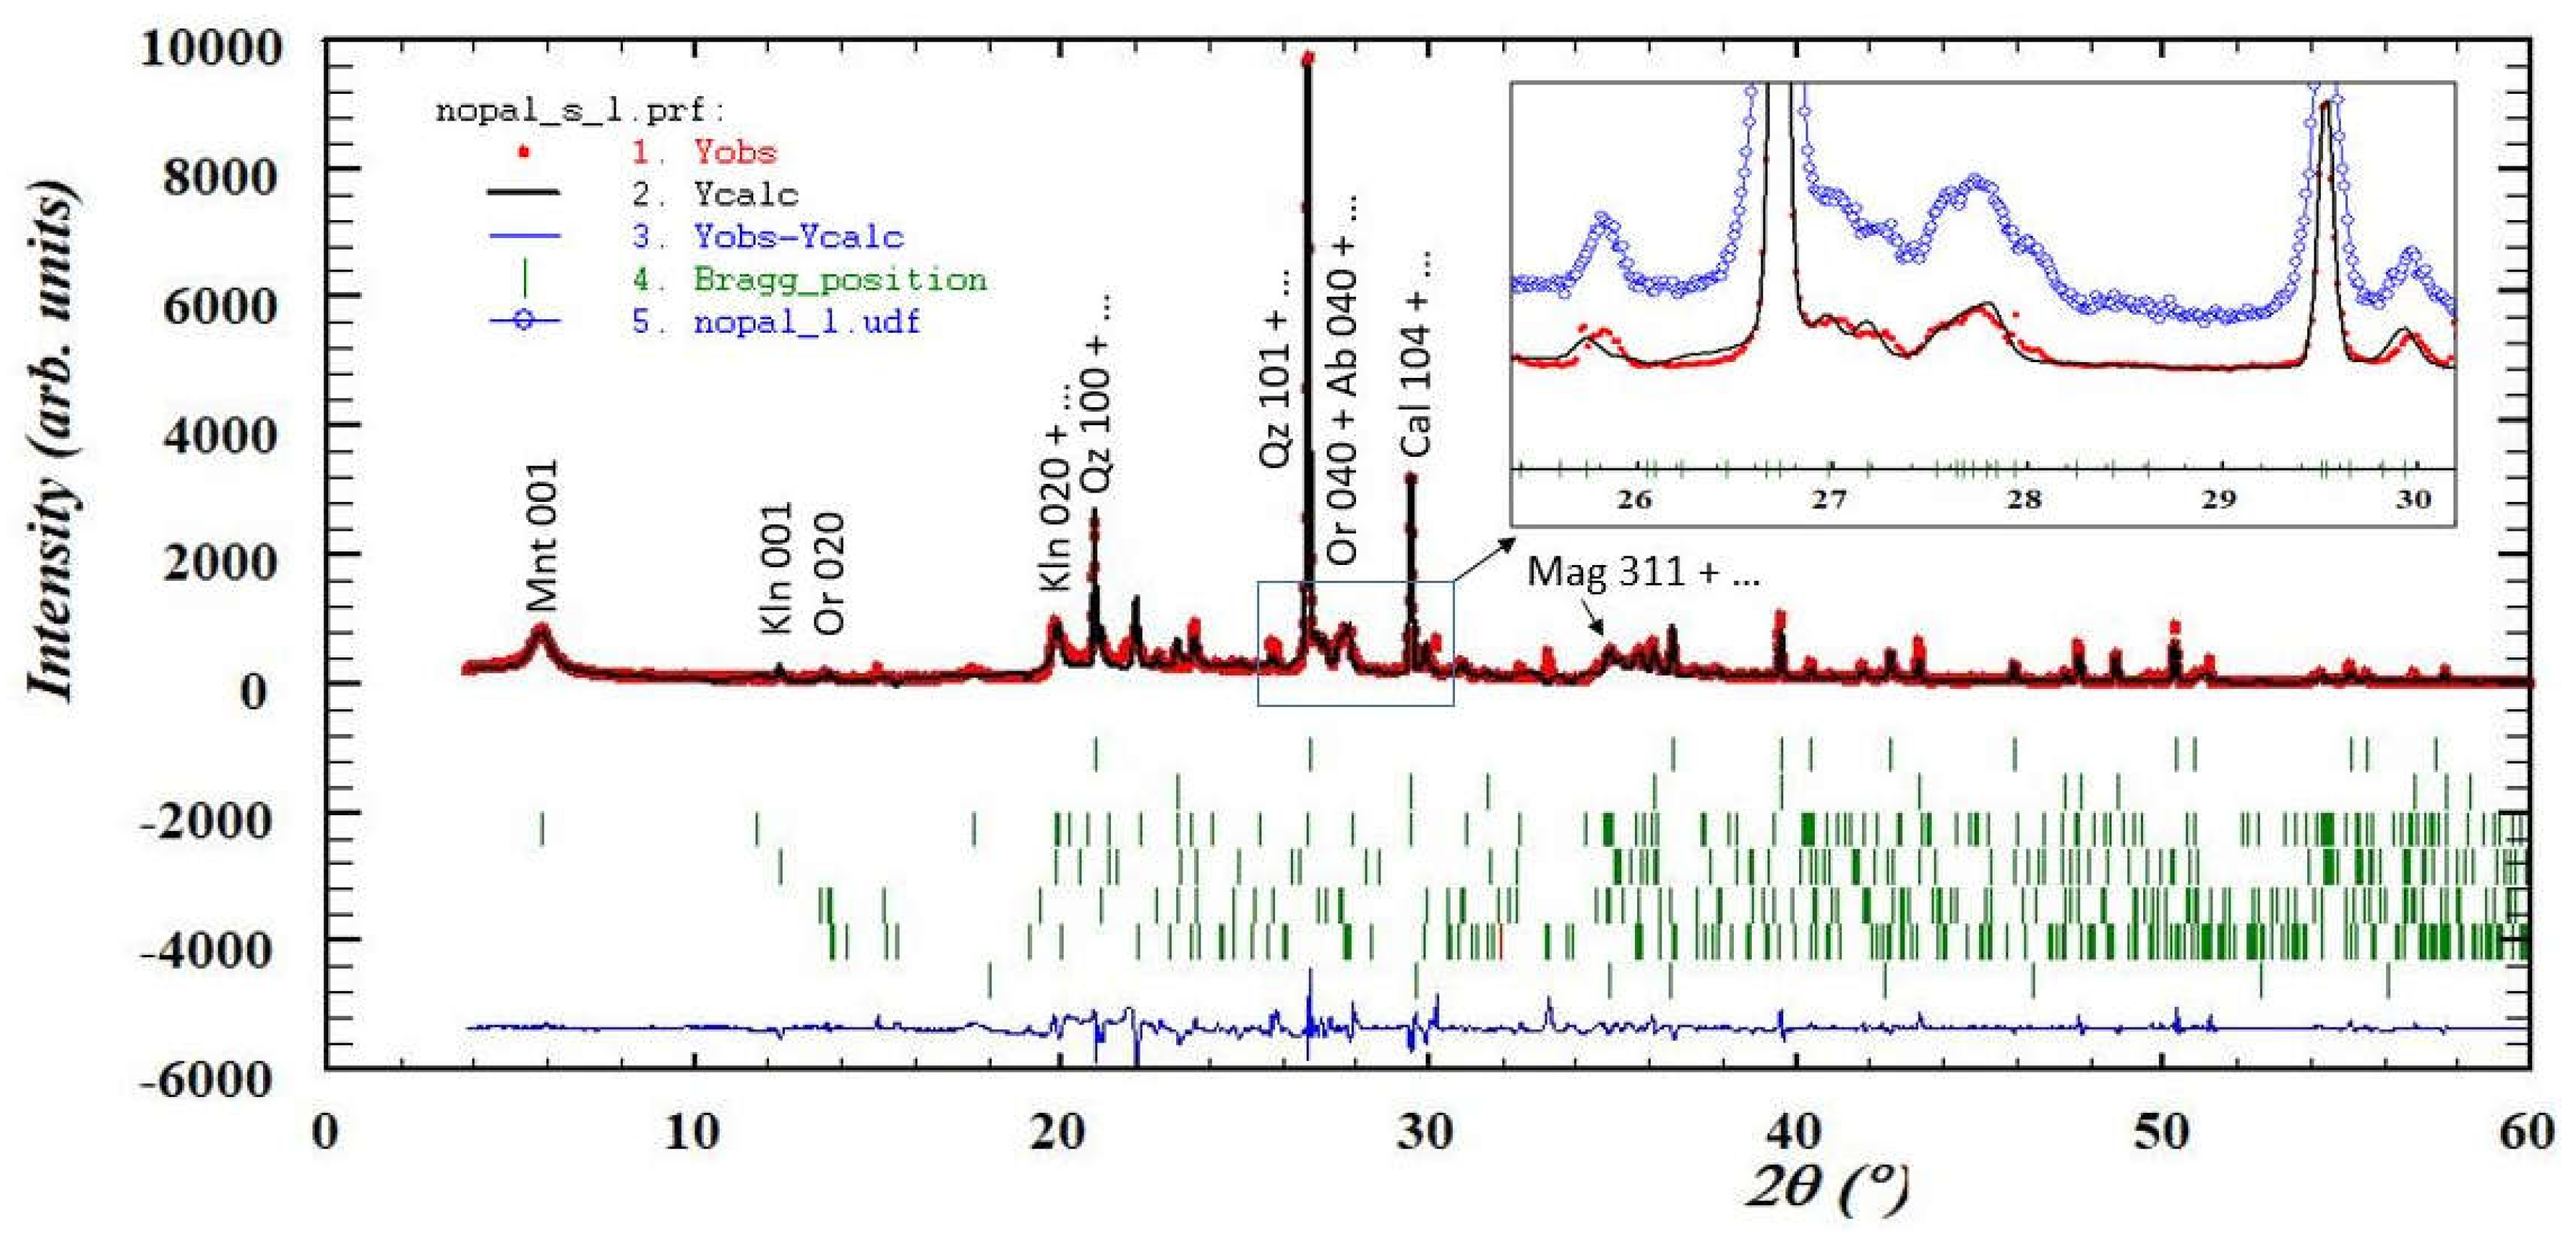
Figure 5.
High resolution XRD of the Tigre sample. Zoom in the inset plays a role equivalent to the one in Figure 4. Some interesting details to be noticed: good detection of minor phases (2θ ≈ 10°), better separation of peaks from feldspars (2θ ≈ 27°) in the synchrotron experiment.
Figure 5.
High resolution XRD of the Tigre sample. Zoom in the inset plays a role equivalent to the one in Figure 4. Some interesting details to be noticed: good detection of minor phases (2θ ≈ 10°), better separation of peaks from feldspars (2θ ≈ 27°) in the synchrotron experiment.
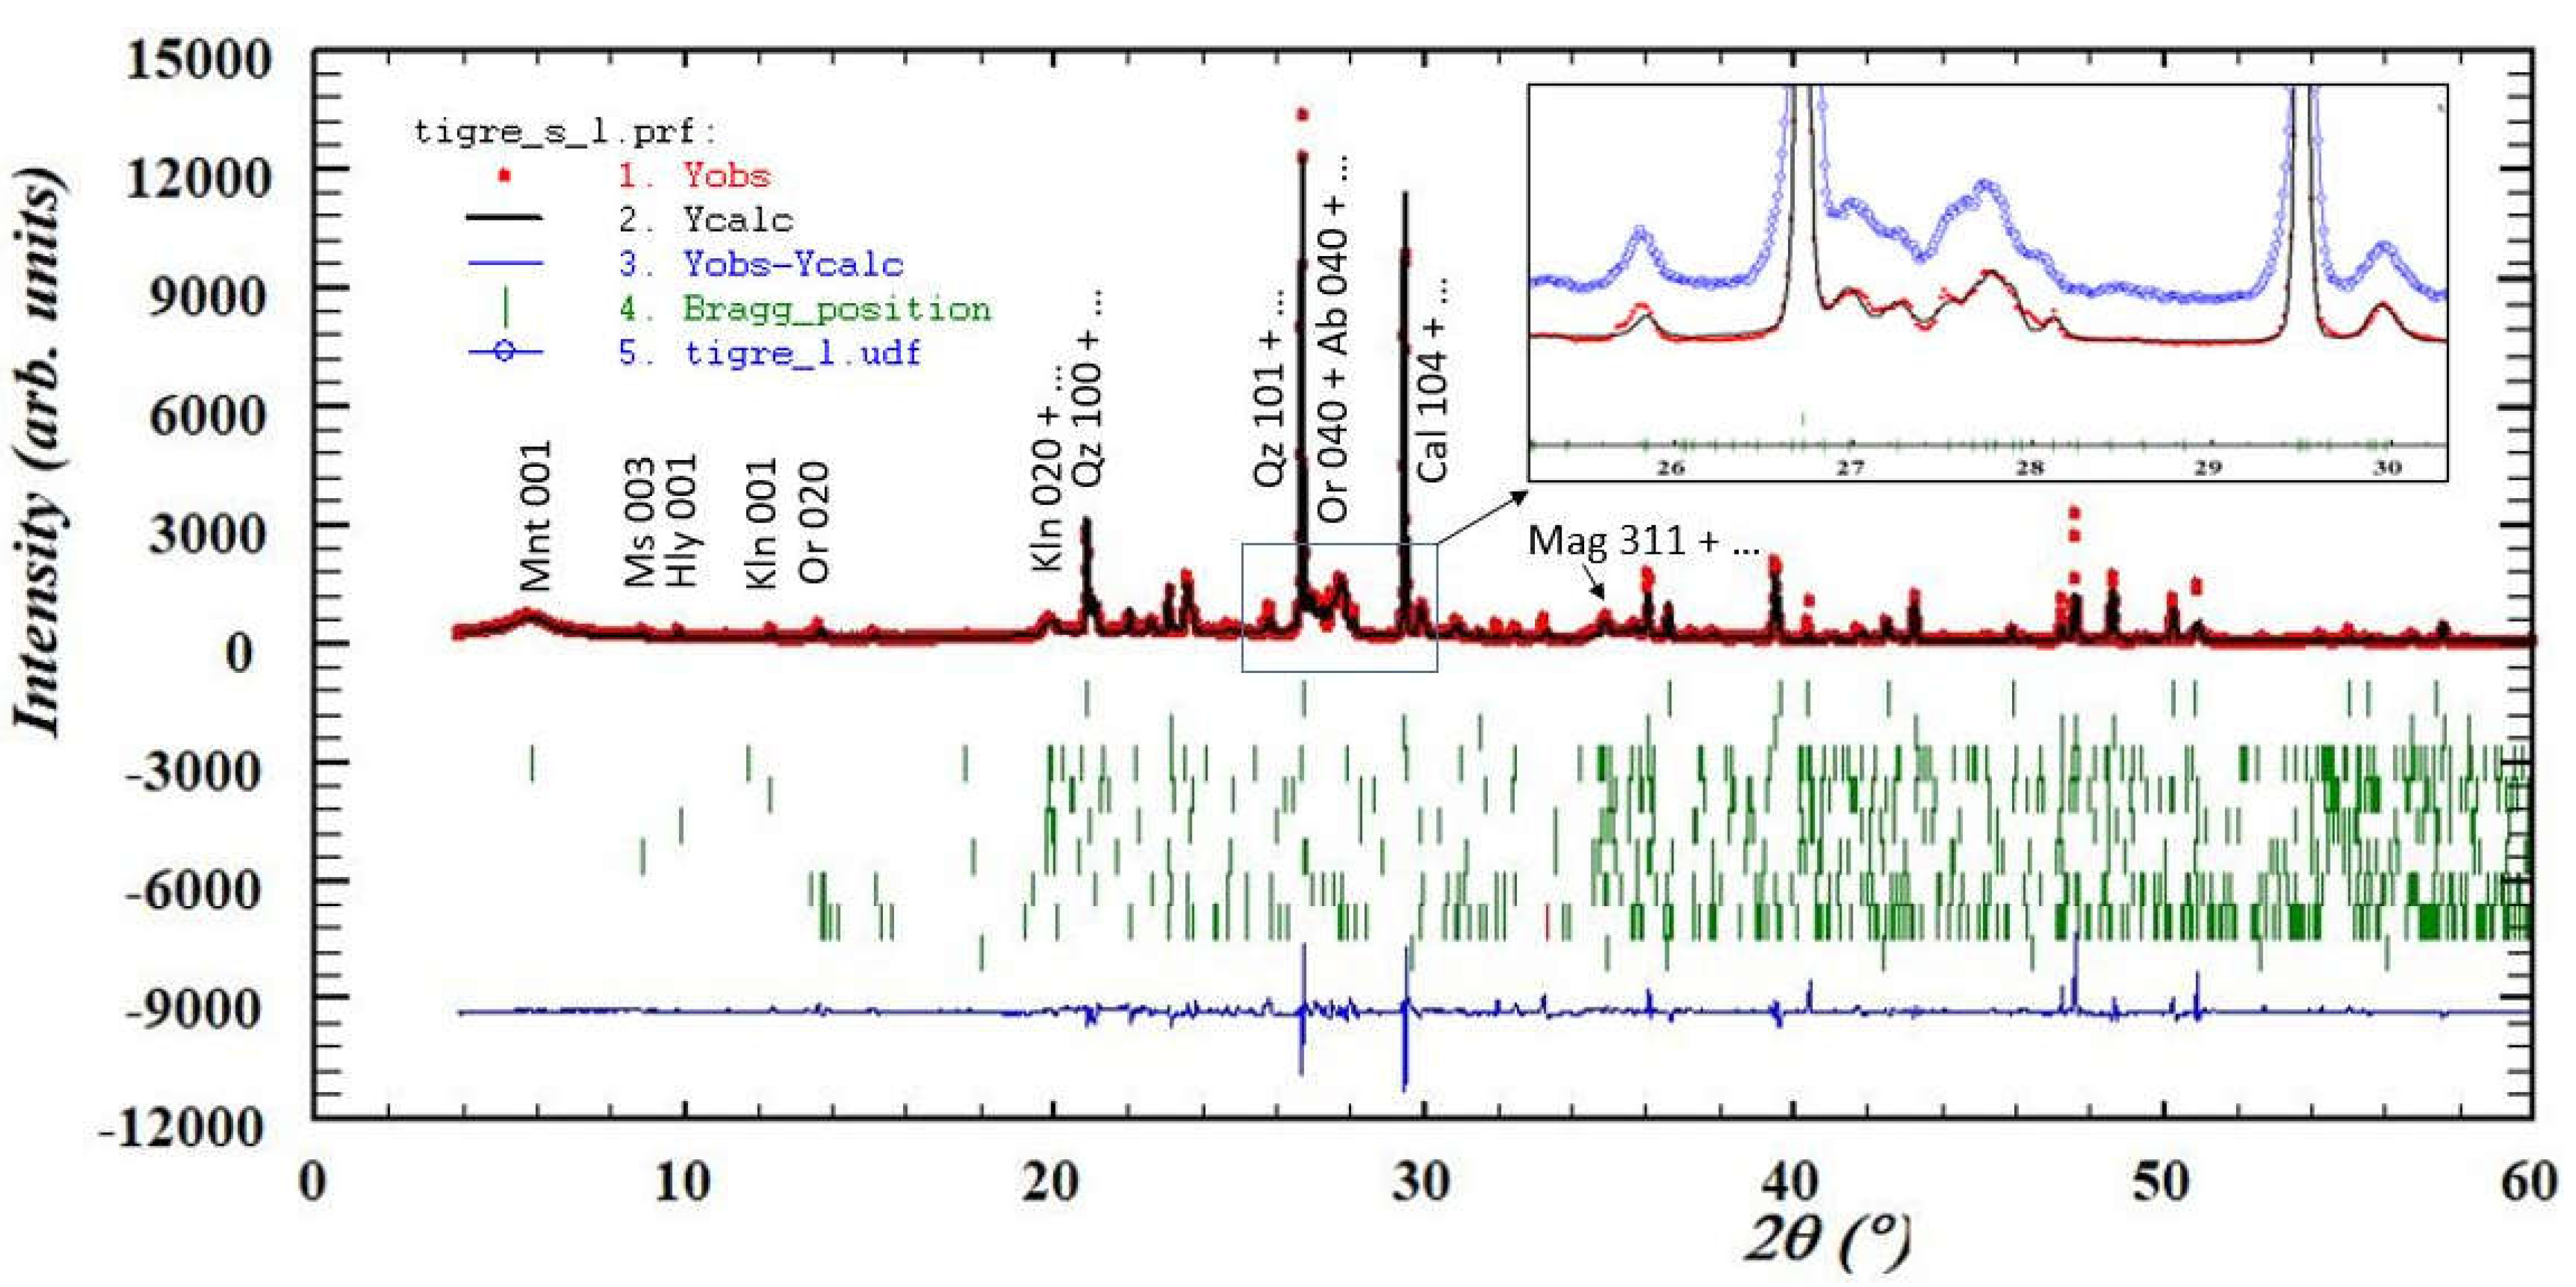
Figure 6.
XRD patterns of samples 2 (low montmorillonite) and 22 (relatively rich in montmorillonite). The red dashed vertical lines indicate the integration limits for the cryptocrystalline fraction. The blue ones indicate the respective limits for the well crystallized fraction.
Figure 6.
XRD patterns of samples 2 (low montmorillonite) and 22 (relatively rich in montmorillonite). The red dashed vertical lines indicate the integration limits for the cryptocrystalline fraction. The blue ones indicate the respective limits for the well crystallized fraction.
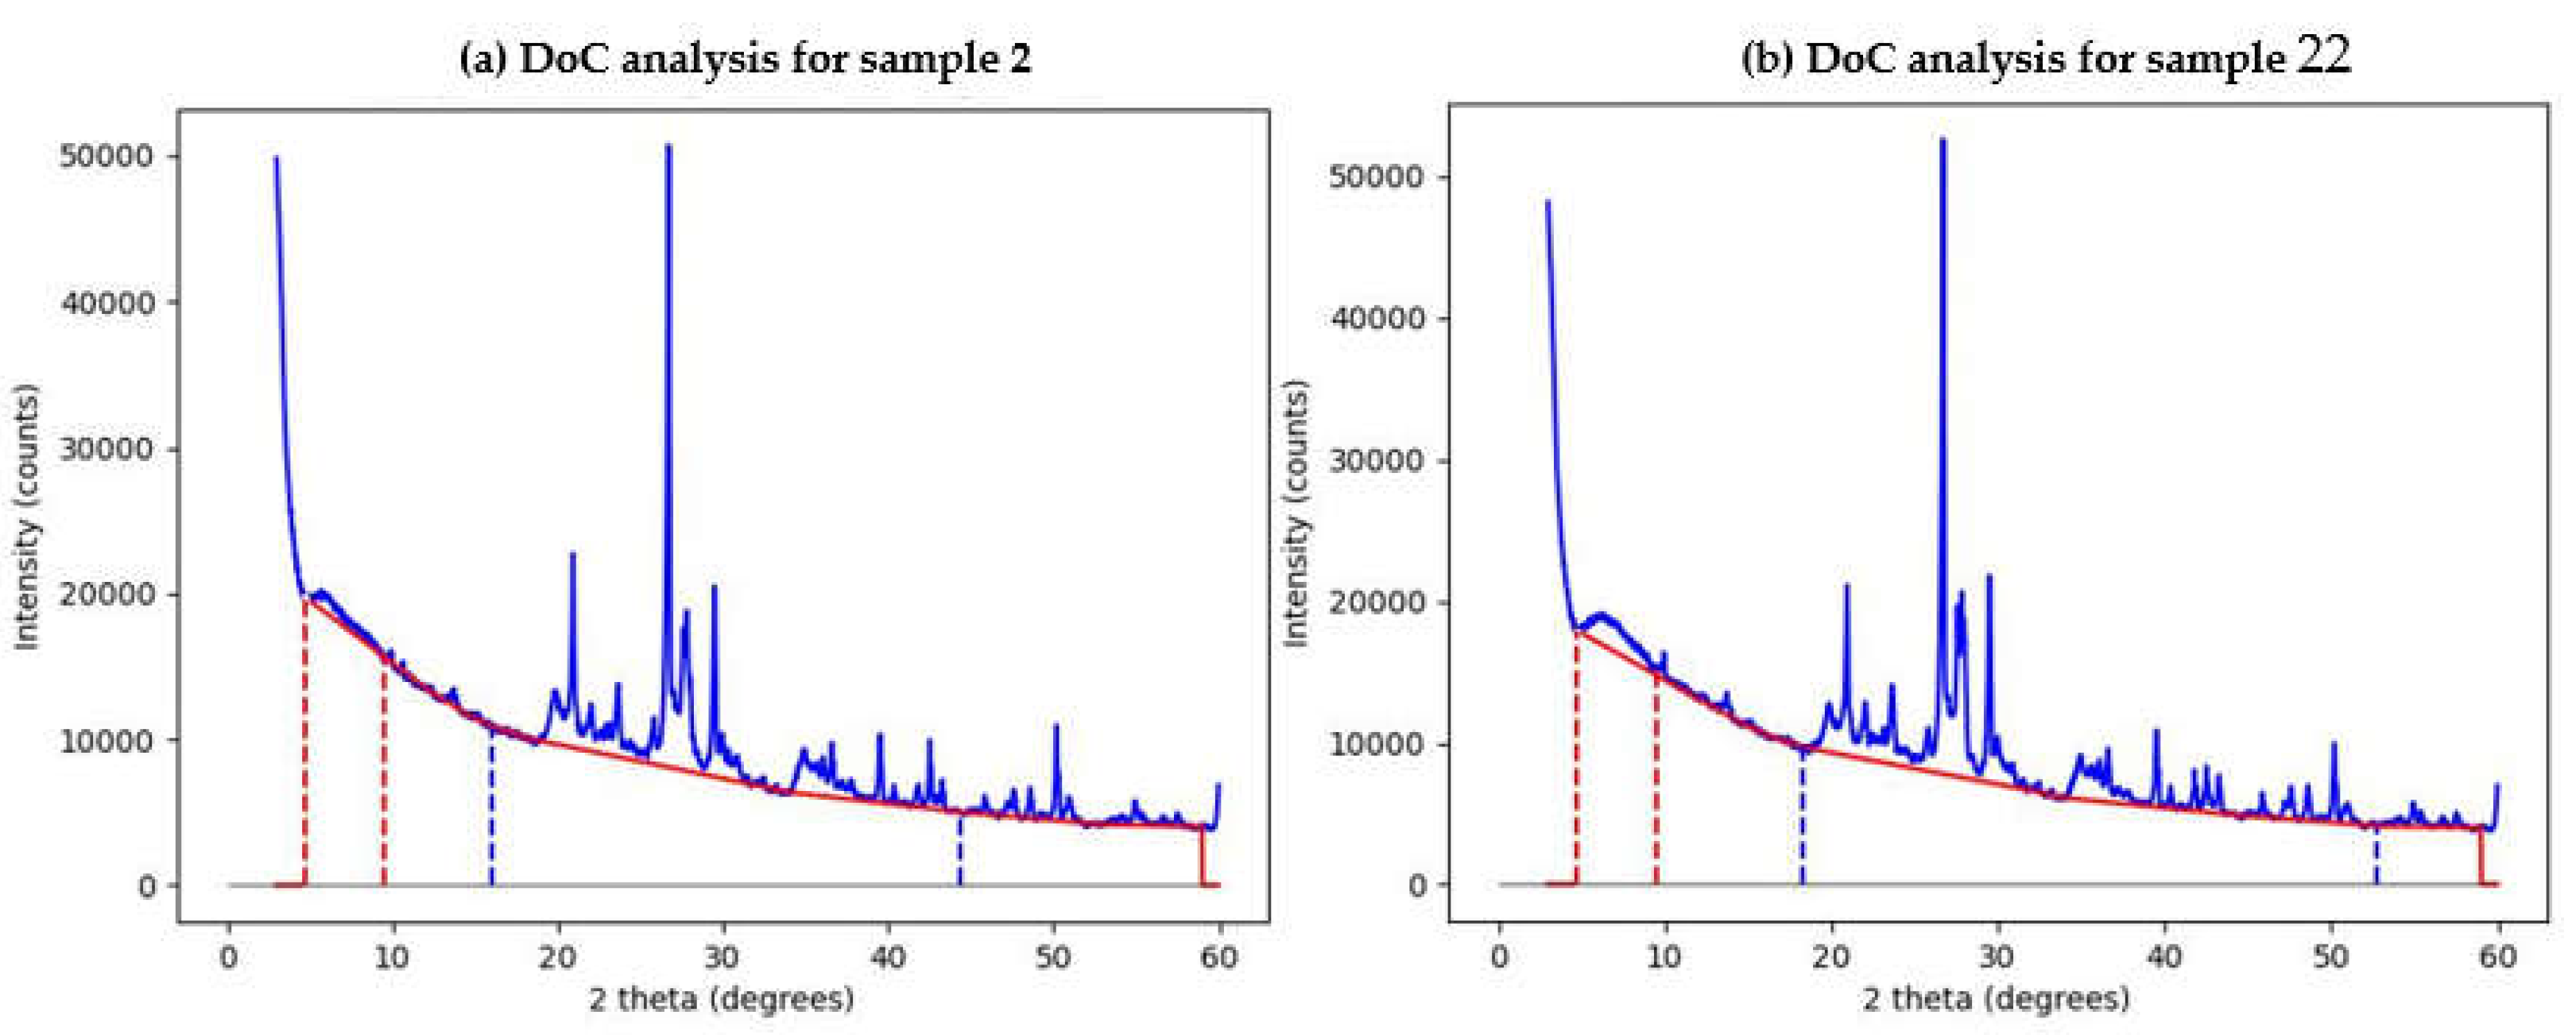
Figure 7.
Rietveld analysis of sample 2, obtained with the Fullprof multi-pattern program, called from the ANALIA code.
Figure 7.
Rietveld analysis of sample 2, obtained with the Fullprof multi-pattern program, called from the ANALIA code.
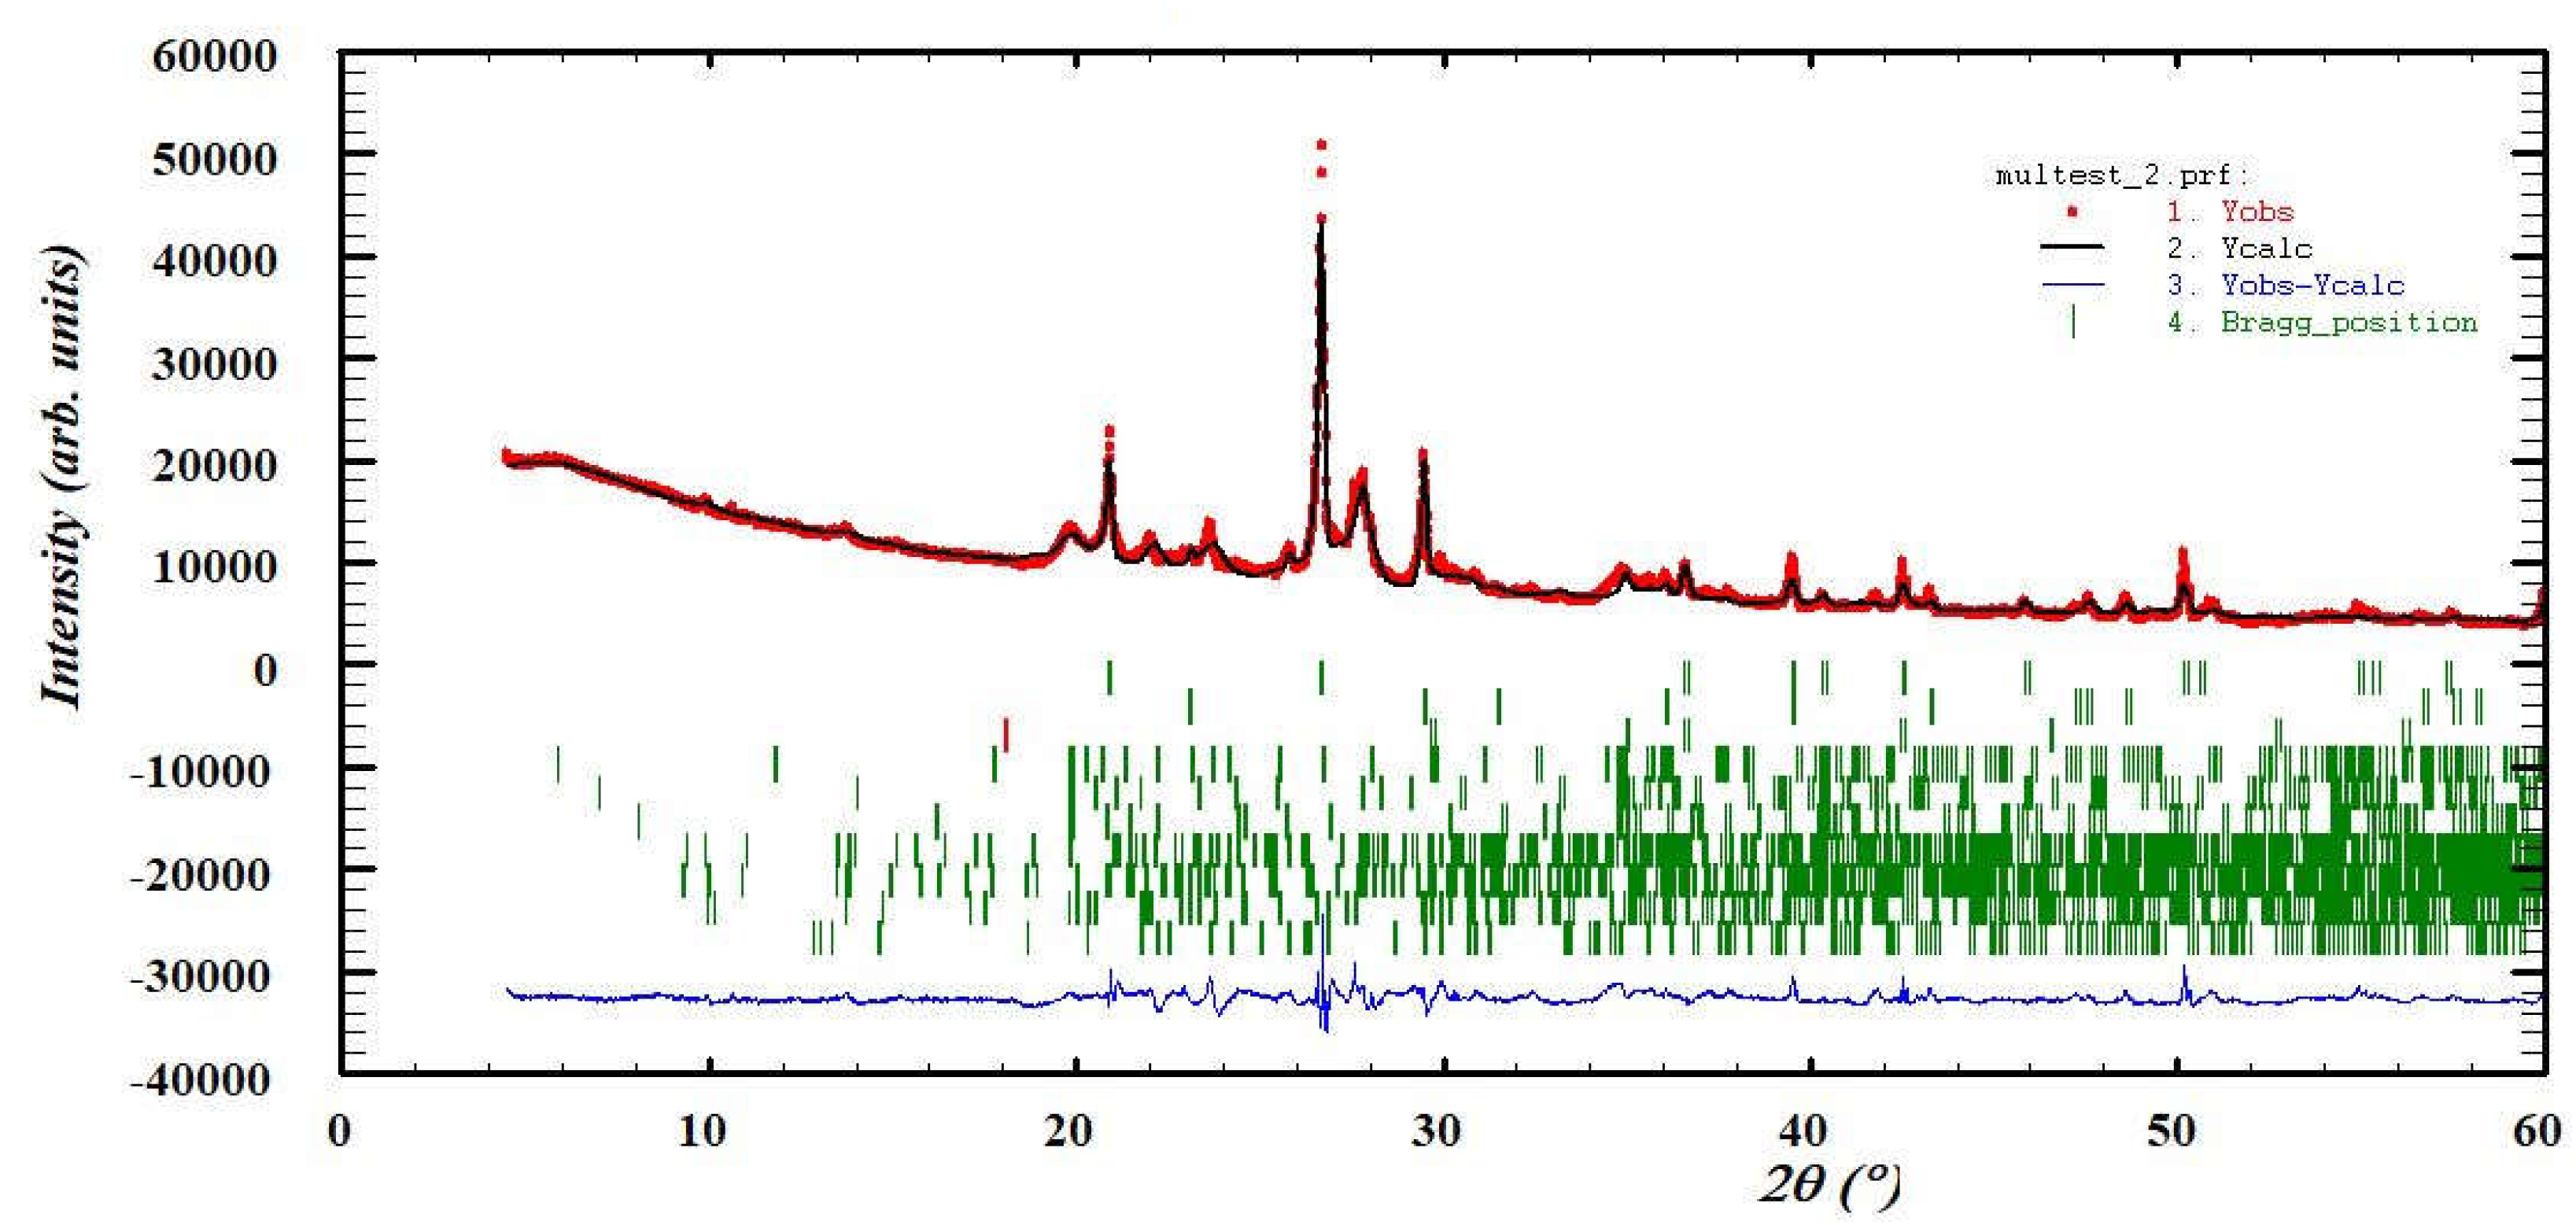
Figure 8.
Rietveld analysis of sample 22, obtained with the Fullprof multi-pattern program, called from the ANALIA code. A higher proportion of cryptocrystalline montmorillonite is detected.
Figure 8.
Rietveld analysis of sample 22, obtained with the Fullprof multi-pattern program, called from the ANALIA code. A higher proportion of cryptocrystalline montmorillonite is detected.

Figure 9.
Comparison between the results obtained by Rietveld refinement and those given by DoC for the concentration of cryptocrystalline montmorillonite in the 23 samples from Laguna del Cuervo.
Figure 9.
Comparison between the results obtained by Rietveld refinement and those given by DoC for the concentration of cryptocrystalline montmorillonite in the 23 samples from Laguna del Cuervo.
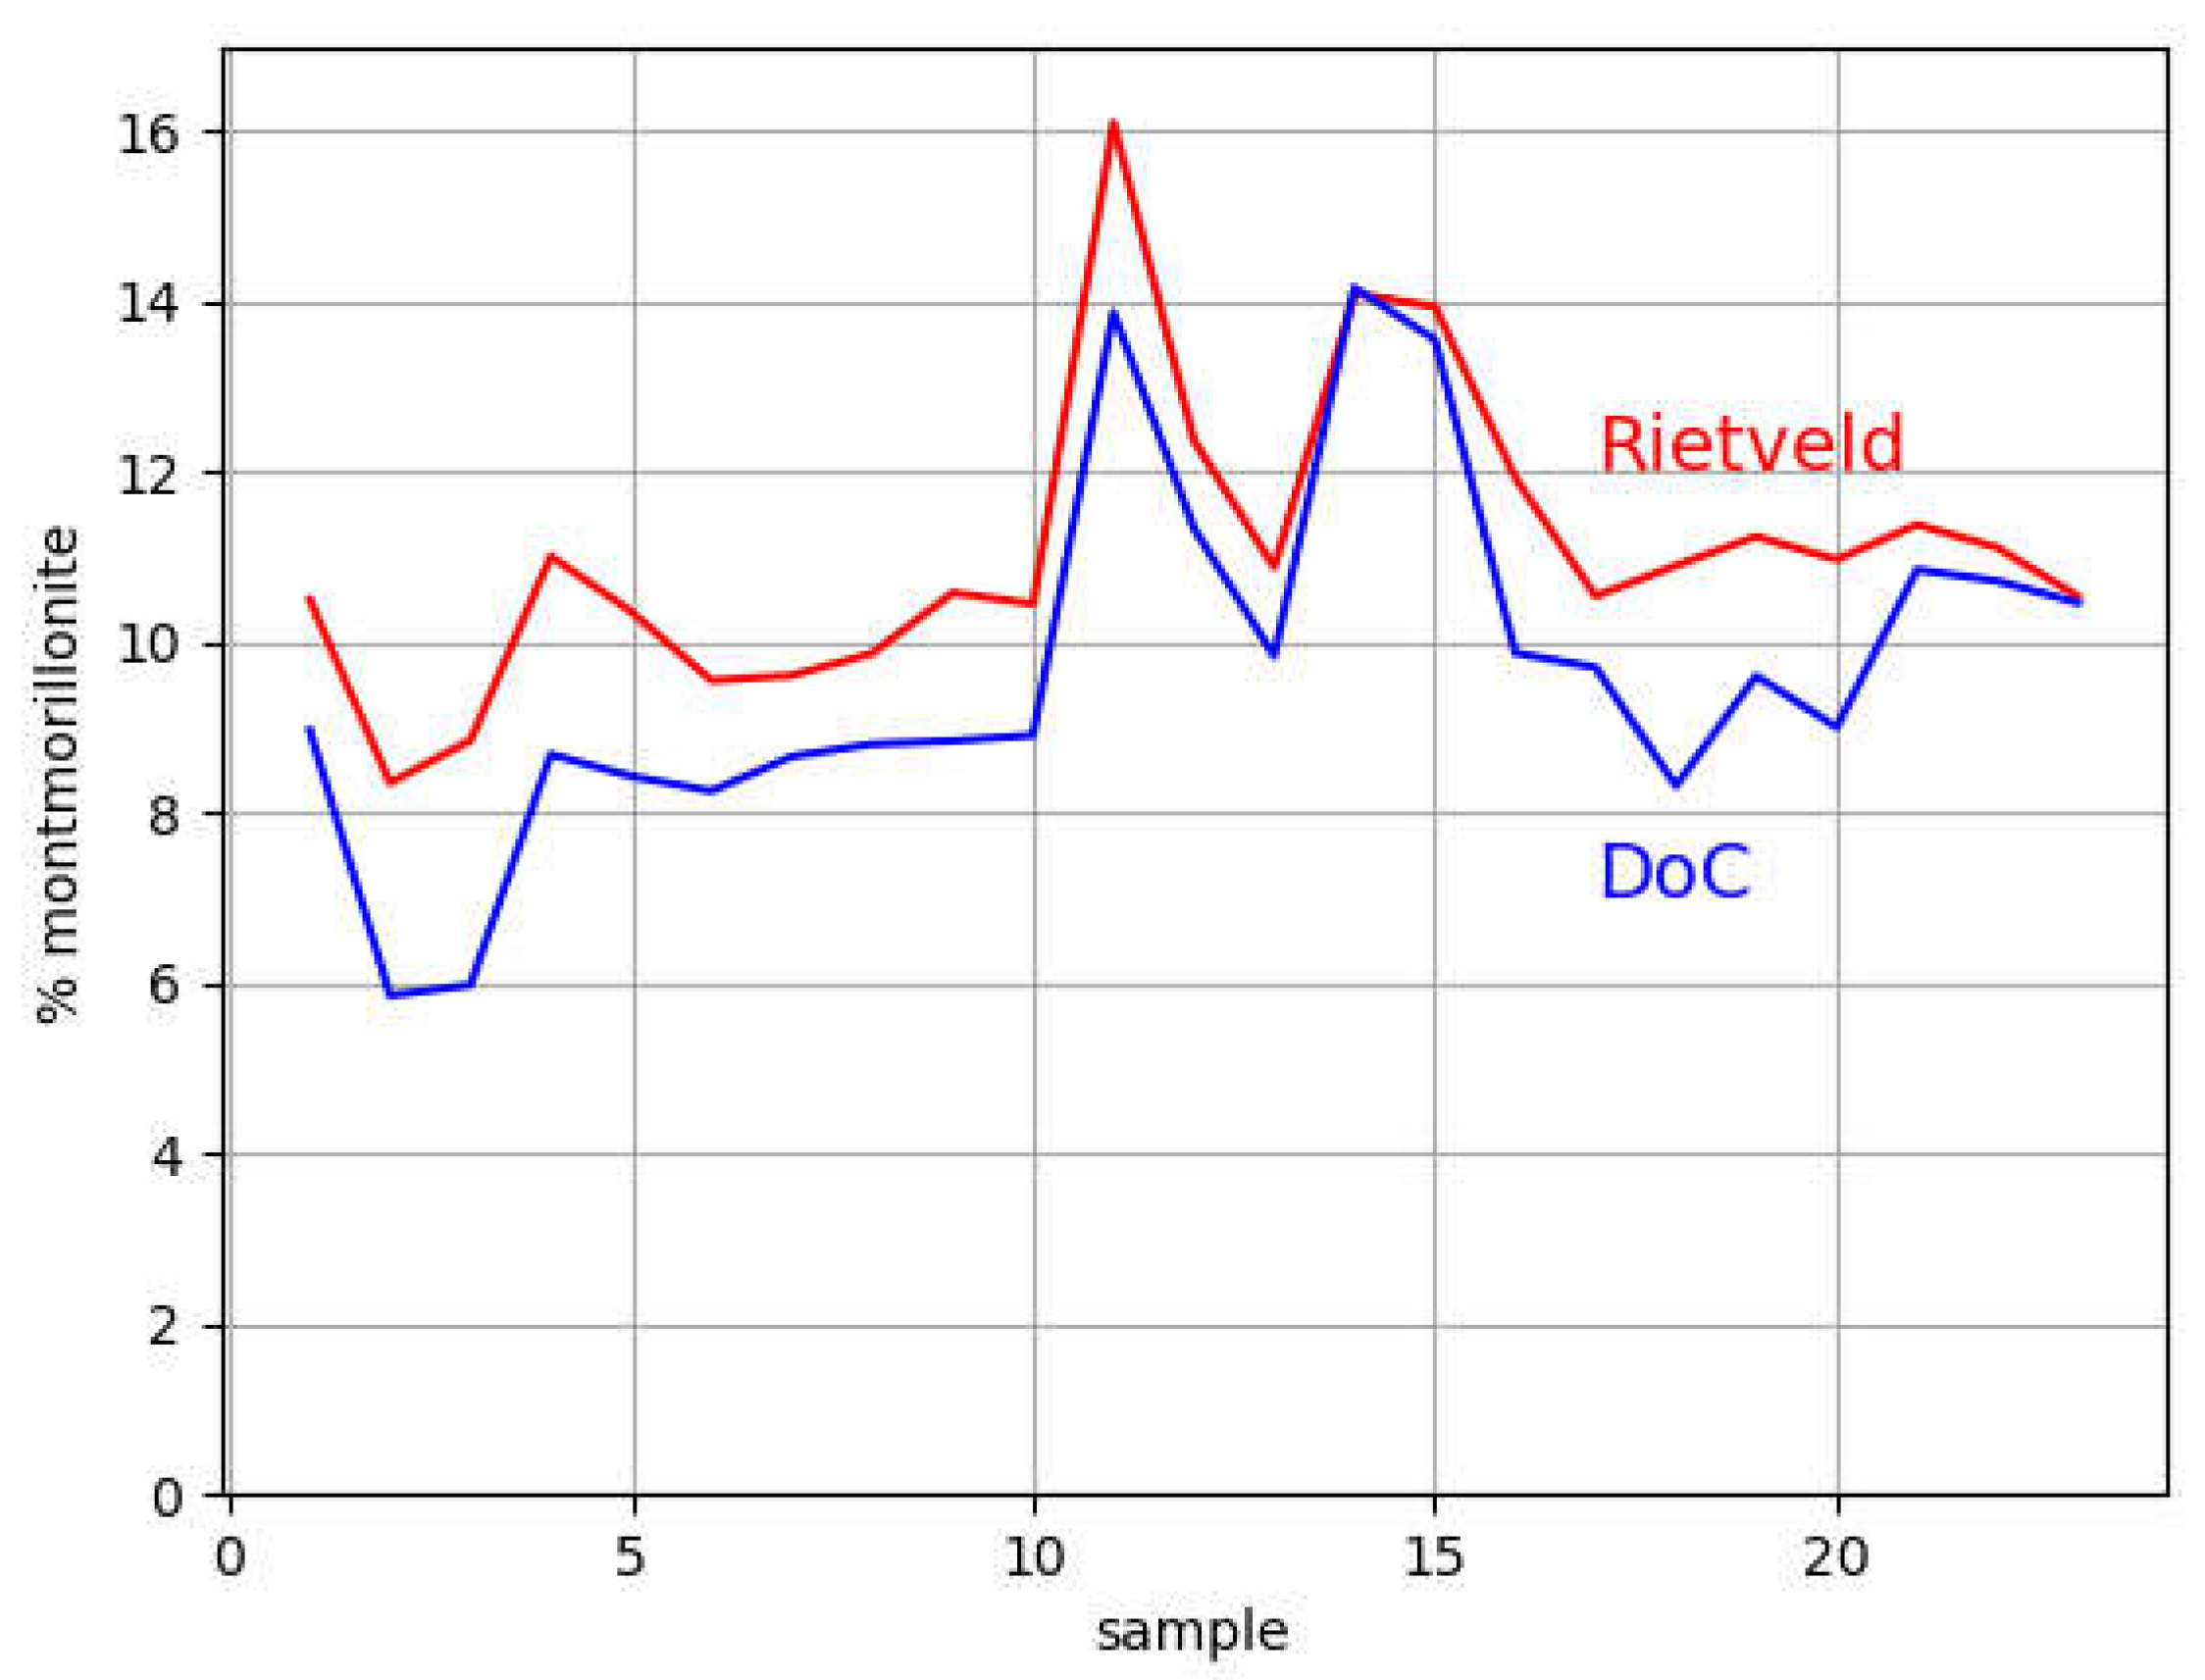
Table 1.
Average major elemental concentrations in % of the sedimentary core samples. Dispersions are shown in parentheses.
Table 1.
Average major elemental concentrations in % of the sedimentary core samples. Dispersions are shown in parentheses.
| Al | Ca | Fe | K | Mg | Na | Si | Ti |
| 6.3(0.8) | 3.9(0.7) | 2.27(0.12) | 2.88(0.11) | 0.9(0.1) | 1.35(0.13) | 23(2) | 0.17(0.02) |
Table 2.
Phase concentrations in % of the samples Nopal and Tigre. Standard deviations are shown in parentheses. IMA mineral symbols [39] are also given in parentheses.
Table 2.
Phase concentrations in % of the samples Nopal and Tigre. Standard deviations are shown in parentheses. IMA mineral symbols [39] are also given in parentheses.
| Phase | Nopal | Tigre |
| Quartz (Qz) | 35.13 (1.74) | 24.87 (1.32) |
| Calcite (Cal) | 14.81 (1.24) | 25.56 (1.63) |
| Montmorillonite (Mnt) | 10.89 (0.55) | 9.37 (0.42) |
| Kaolinite (Kln) | 13.88 (0.83) | 2.92 (0.55) |
| Halloysite (Hly) | - | 4.57 (0.54) |
| Muscovite (Ms) | - | 2.6 (0.1) |
| Orthoclase (Or) | 13.76 (0.83) | 24.89 (0.88) |
| Albite (Ab) | 10.45 (0.78) | 4.81 (0.46) |
| Magnetite (Mag) | ~1 (DL) | ~1 (DL) |
Disclaimer/Publisher’s Note: The statements, opinions and data contained in all publications are solely those of the individual author(s) and contributor(s) and not of MDPI and/or the editor(s). MDPI and/or the editor(s) disclaim responsibility for any injury to people or property resulting from any ideas, methods, instructions or products referred to in the content. |
© 2024 by the authors. Licensee MDPI, Basel, Switzerland. This article is an open access article distributed under the terms and conditions of the Creative Commons Attribution (CC BY) license (http://creativecommons.org/licenses/by/4.0/).
Copyright: This open access article is published under a Creative Commons CC BY 4.0 license, which permit the free download, distribution, and reuse, provided that the author and preprint are cited in any reuse.


