
Submitted:
06 September 2025
Posted:
08 September 2025
You are already at the latest version
Abstract
Neurogenesis plays a fundamental role in the development of a functional nervous system. Seeking to uncover molecules and signalling pathways involved in spinal cord neurogenesis, we recently designed a drug screening protocol in developing zebrafish (González-Llera et al., 2024). Here, we have expanded this drug screen and discovered a previously unknown role of the deacetylase sirtuin 2 (SIRT2) in promoting the generation of serotonergic interneurons in the spinal cord. Treatments with specific SIRT2 inhibitors reduced the generation of serotonergic neurons in the spinal cord, which led to locomotor deficits. Our data suggest that SIRT2 regulates mitotic activity in progenitor cells to promote the generation of serotonergic neurons in developing animals. Together, our results uncover SIRT2 as a key regulator of spinal cord neurogenesis and position it as a promising target for strategies aimed at neural repair in spinal cord disorders.
Keywords:
spinal cord
; drug screen
; neurogenesis
; sirtuin 2
; serotonin
; zebrafish
; mitosis
; acetylated alpha-tubulin
1. Introduction
The neural circuits located in the spinal cord play a key role in modulating and generating locomotor movements in vertebrates (see [1]). Therefore, finding the molecules and signalling pathways that regulate spinal cord neurogenesis during early development is of significant interest. Additionally, this knowledge could help identifying new molecular targets to enhance neuronal regeneration or survival following traumatic spinal cord injuries or in neurodegenerative disorders affecting the spinal cord.
The transparency and rapid development of zebrafish embryos and larvae make them a valuable animal model for the study of the molecular pathways regulating neurogenesis in the vertebrate spinal cord (e.g., [2,3,4,5,6,7,8]). Moreover, their small size and ability to absorb drugs through the skin and into the central nervous system (CNS) also offers an excellent model system to perform high-throughput and high-content phenotypic drug screening in vivo. We have recently developed a drug screening protocol to identify small molecules and signalling pathways regulating neurogenesis in the developing zebrafish spinal cord [8]. For this, we used as a cellular model the population of serotonergic interneurons of the ventral spinal cord [8]. This neuronal population offers a good model for drug screens because, in the zebrafish spinal cord, serotonergic neurons originate from lateral floor plate progenitor cells [6] between 48 to 60 hours postfertilization (hpf) [9], a period that follows the main embryonic morphogenic events. Thus, drugs can be applied in 2 days postfertilization (dpf) animals, ensuring that any observed effects are more likely to be cell specific rather than due to interference with major morphogenic processes. By using this protocol, we initially screened 160 small molecules of the LOPAC® Library (Sigma), which led us to discover a role for prostaglandin D2 in promoting neurogenesis in the ventral spinal cord [8]. Here, we have expanded this drug screen (analysis of 80 new drugs), which revealed a possible role for the deacetylase sirtuin 2 (SIRT2; also known as silent information regulation proteins) in promoting neurogenesis in the spinal cord (see below).
SIRT2 is a member of the sirtuin family of proteins, which includes 7 mammalian members. Sirtuins are protein deacetylases that share highly conserved central NAD+ binding and catalytic domains [10]. SIRT2 is mainly found in the cytoplasm but can also be found in the cell nucleus [10]. SIRT2 can deacetylate many substrates like histones 3 and 4 or alpha-tubulin (for a review see [11]). Interestingly, SIRT2 is highly expressed in the mammalian CNS, particularly in the cortex, striatum, hippocampus and spinal cord, suggesting that it may play important roles in these CNS regions [11,12]. Regarding its role in neurogenic processes, SIRT2 has been implicated in the differentiation of dopaminergic neurons in the substantia nigra of mice [13] and recent work has revealed a link between decreased levels of SIRT2 in animal models of depression and reduced hippocampal neurogenesis [14,15]. However, there is no prior knowledge on the role of SIRT2 in the regulation of spinal cord neurogenesis in developing animals. Here, we provide compelling pharmacological data showing that Sirt2 activity in the developing zebrafish spinal cord promotes the generation of serotonergic neurons by regulating the mitotic activity of progenitor cells.
2. Materials and Methods
2.1. Animals
Wild type zebrafish were kept and raised under standard conditions [16] in the fish facilities of the Department of Genetics of the University of Santiago de Compostela (codes of the facility: AE-LU-003, ES270280346401). All experiments were approved by the Bioethics committee of the University of Santiago de Compostela and the Xunta de Galicia (project license no.: 01/20/LU-003) and were carried out in accordance with EU Directive 2010/63/EU for animal experiments. For experimental analyses, we used wild type larvae (between 2 and 4 dpf). Embryos were collected from the breeding tanks and were divided into Petri dishes at a density of 80 to 100 embryos per dish until they were 2 dpf (when they were used for drug treatments, see below), but no formal randomization method was used. The specific number of animals used for each experiment is indicated in the figures or in the supplementary files.
2.2. Drug Screen
We carried out an unbiased drug screen of the LOPAC® 1280 – Small Scale library (Sigma; Cat# LO4200-1EA; International Version). We screened drugs (at 10 µM) from rack 1 of the library (80 drugs in total; stocks at 10 mM in DMSO) following the 2-step in vivo drug screen protocol developed by González-Llera et al. [8]. Zebrafish larvae were incubated with each drug from 2 dpf to 4 dpf in groups of 5 animals per well in 24 well-plates. Control animals were treated with DMSO.
2.3. Treatments with Specific Drugs in Whole Larvae
Specific drugs (SirReal2: Sigma, Cat# SML1514; AGK2: Sigma, Cat# A8231) were diluted in DMSO at stock concentration of 10 mM. For treatments, 2 µl of the stock solution were diluted in 2 ml of fish water (reverse osmosis-purified water; working dilution of 10 µM). Larvae were incubated with each drug from 2 dpf until 3 or 4 dpf in groups of 5 animals per well in 24 well-plates. Control animals were treated with 2 µL of DMSO in the 2 ml of fish water.
2.4. Behavioural Analyses
For behavioural (swimming) analyses, 4 dpf larvae were transferred to 24 well-plates (1 animal per well). Before measuring locomotor activity, the larvae were left in clean water without SirReal2 or DMSO (control group) for 1 hour. Locomotor activity was assessed in a Zebrabox (Viewpoint Life Sciences) using a dark-light test consisting of three alternating light and dark cycles, each lasting 6 minutes (36 minutes in total). Tracking data were obtained using Zebralab (Viewpoint Life Sciences), which provided the individual parameters of total swimming distance, number of locomotor events, and duration of activity. The scale factors provided by the system were x scale = 1.14094, y scale = 1.14094, and scale unit = mm, allowing spatial data to be expressed in millimetres.
2.5. Whole-Mount Anti-Serotonin Immunofluorescence
After drug treatments, 4 dpf larvae were euthanized by tricaine methanesulfonate (Sigma) overdose and then fixed with 4% paraformaldehyde (PFA) in phosphate-buffered saline (PBS; pH 7.4) for 2 hours at 4ºC. After washes in PBS, 4 dpf larvae were incubated in Proteinase K from Tritirachium album (Sigma; Cat#: P4850; ≥800U/mL; 1 µL per ml of PBS) for 35 minutes at room temperature and then in glycine [50 mM in PBS with 0,2% Triton X-100 (PBST)] for 10 minutes at room temperature. Then, the larvae were incubated with a rabbit anti-serotonin antibody (dilution 1:2500; Immunostar; Cat#: 20080; RRID: AB_572263) overnight at 4ºC. Then, they were rinsed in PBST and incubated overnight at 4ºC with a Cy3-conjugated goat anti-rabbit antibody (dilution 1:500; Jackson ImmunoResearch; Cat#: 111-165-144; RRID: AB_2338006). Antibodies were diluted in PBST with 1% DMSO, 1% normal goat serum and 1% bovine serum albumin. Larvae were mounted with 70% glycerol in PBS. Control and treated animals were always processed in parallel and the same antibody solutions were used for both control and treated animals in each experiment.
2.6. Cryostat Sections
2 or 3 dpf larvae were euthanized by tricaine methanesulfonate (Sigma) overdose and then fixed with 4% PFA in PBS (pH 7.4) for 2 hours at 4ºC. After rinsing in PBS, larvae were cryoprotected overnight with 30% sucrose in PBS, embedded in Neg-50TM (Thermo Scientific), and frozen with liquid nitrogen-cooled isopentane. Transverse sections of the body starting from the caudal fin (16 μm thickness) and moving rostrally were obtained on a cryostat and mounted on Superfrost Plus slides (Epredia).
2.7. TUNEL Labelling on Cryostat Sections
TUNEL staining was performed according to the manufacturer’s protocol with minor modifications (In Situ Cell Death Detection Kit, TMR red; catalogue number 12156792910; Roche). Briefly, the sections were incubated in methanol for 15 minutes at -20ºC to permeabilize the lipid membranes, followed by brief washes in PBS and another incubation in 0.01 M citrate buffer pH 6.0 for 30 minutes at 70ºC. After several washes in PBS, sections were incubated in the TUNEL reaction mix, containing the Labelling Solution (TMR red labelled nucleotides) and the Enzyme Solution (terminal deoxynucleotidyl transferase), for 90 minutes at 37ºC. Slides were washed in PBS and distilled water, allowed to dry for 30 minutes at 37ºC, and mounted with MOWIOL® 4-88 (Calbiochem). Sections from control and treated animals were processed in parallel and the same TUNEL labelling solution was used for sections from control and treated animals.
2.8. Immunofluorescence on Cryostat Sections
Sections were first treated with 0.01 M citrate buffer pH 6.0 for 30 minutes at 90ºC for heat-induced epitope retrieval, allowed to cool for 10 minutes at room temperature in distilled water, and then rinsed in 0.05 M Tris-buffered saline (TBS) pH 7.4 for 20 minutes. Then, the sections were incubated overnight at room temperature with a rabbit polyclonal anti-pH3 antibody (1:500; Sigma, Cat#: H0412; RRID: AB_477043), a mouse monoclonal anti-acetylated alpha-tubulin antibody (1:500; Sigma, Cat#: T6793; RRID: AB_477585) or a rabbit polyclonal anti-SIRT2 antibody (1:100; Sigma, Cat#: S8477; RRID: AB_1079981). Sections were then rinsed 3 times in TBS for 15 min each and incubated for 1 hour at room temperature with a Cy3-conjugated goat anti-rabbit IgG antibody (1:500; Jackson ImmunoResearch, Cat#: 111-165-144; RRID:AB_2338006) or a FITC-conjugated goat anti-mouse antibody (1:200; Invitrogen, Cat# F2761; RRID: AB_2536524). All antibody dilutions were made in TBS containing 15% normal goat serum (Millipore) and 0.2% Triton X-100 (Sigma). Finally, sections were rinsed 3 times in TBS for 15 minutes each and in distilled water for 20 minutes, allowed to dry for 30 minutes at 37 ºC, and mounted in MOWIOL® 4-88 (Calbiochem). Sections from control and treated animals were always processed in parallel for each antibody staining and the same antibody solutions were used for sections of control and treated animals in each experiment.
2.9. Imaging and Cell Counting in Whole-Mounted Larvae and Spinal Cord Sections
After anti-serotonin immunofluorescence experiments in whole-mounted 4 dpf larvae, confocal photomicrographs were taken at the level of the caudal fin with a Stellaris 8 confocal laser microscope (Leica Microsystems) with a 20x objective. For the quantification of serotonergic neurons, the total number of serotonin-immunoreactive interneurons located at the level of the caudal fin (4 spinal cord segments) was quantified manually going through the stack of confocal optical sections. The experimenter was blinded during quantifications.
After pH3 or acetylated alpha-tubulin immunofluorescence experiments or TUNEL labelling in cryostat transverse sections, confocal photomicrographs were taken with the Leica Stellaris 8 confocal laser microscope (Leica Microsystems). We quantified the number of pH3+ cells, TUNEL+ nuclei or the intensity of anti-acetylated tubulin fluorescence (mean grey value) in 1 out of each 3 consecutive spinal cord transverse sections starting from the caudal end of the spinal cord and moving rostrally by using the Fiji software [17]. 9 sections were quantified in each animal and then the mean number of labelled cells per section or the mean fluorescence intensity of the spinal cord per section was calculated for each animal. For the calculation of fluorescence intensity of each spinal cord section the mean intensity of 3 background readings of each image was subtracted to the mean grey value of fluorescence labelling of the spinal cord.
After cell quantifications, figures were prepared with Adobe Photoshop 2025 (Adobe) with minor adjustments of brightness and contrast of the confocal images.
2.10. Statistical Analysis
Each experiment with locomotor analyses or cell/fluorescence quantifications was carried out in a minimum of 2 different clutches of animals (biological replicates) for each different drug treatment, and a minimum of 10 animals were included in each experimental group. Each dot in the graphs represents one animal and n numbers for each experimental group are indicated in the figures or in the supplementary files. Statistical analyses were performed with Prism 9 (GraphPad software, La Jolla, CA, USA). Normality of the data was determined with the D’Agostino & Pearson test. For groups with low n number in the first step of the drug screen we used a Shapiro-Wilk normality test. To determine statistically significant differences (p ≤ 0.05) between two groups of normally distributed data we used an unpaired (Student’s) t-test (two-tailed). To determine statistically significant differences between two groups of non-normally distributed data we used a Mann Whitney U test (two-tailed). Exact p-values are given in the supplementary files or in the graphs in the figures.
3. Results and Discussion
3.1. An Unbiased Drug Screen Reveals That a SIRT2 Inhibitor Reduces the Number of Serotonergic Cells in the Developing Spinal Cord
As indicated above (see introduction), we first expand the screen of the LOPAC® library following the 2-step drug screen protocol developed by González-Llera et al. [8]. In the primary screen, the effect of each drug from the LOPAC® library was tested (at 10 µM) in 10 larvae. In the secondary screen, hits from the primary screen (drugs that significantly changed the number of serotonergic spinal cord interneurons as compared to DMSO controls) were further tested in groups of 20 larvae.
We screened 80 compounds of the LOPAC® library (rack 1) in the primary screen (Supplementary File 1). 5 of these drugs killed all larvae (Supplementary File 1). Of the remaining 75 drugs, 1 molecule (4-Aminobenzamidine dihydrochloride) led to a minor increase in the number of serotonergic cells, and 30 drugs reduced the number of serotonin-immunoreactive neurons at 4 dpf as compared to DMSO controls (Supplementary File 1). In the secondary screen, with larger groups of animals (n = 20), we confirmed that 10 of the 30 compounds significantly reduced the number of spinal cord serotonergic cells (Table 1; Supplementary File 2). We did not observe a significant change in the number of serotonergic neurons in animals treated with 4-Aminobenzamidine dihydrochloride in the secondary screen (Supplementary File 2).
Of the 10 hits identified after the 2-step drug screen, 2 drugs caused a highly significant (p < 0.0001) reduction in the number of serotonergic neurons (Table 1): SirReal2 (Figure 1a-b; Supplementary File 2) and reserpine (Supplementary File 2). SirReal2 is a potent and selective inhibitor of SIRT2 that has an IC50 value of 140 nM and is >1000-fold selective for SIRT2 over SIRT1 and SIRT3. Reserpine is a drug known to inhibit the vesicular uptake of catecholamines and serotonin [18], which could suggest that the drastic reduction in serotonergic neurons in these animals could be related to a loss of serotonin immunoreactivity and not to a true loss of serotonergic neurons in reserpine treated animals. Thus, for subsequent analyses we focused on the analysis of the role of SIRT2 in promoting spinal cord neurogenesis.
3.2. Pharmacological Experiments Confirm That SIRT2 Activity Regulates Spinal Cord Neurogenesis
To validate the drugs screen results, we first repeated the SirReal2 treatment (newly purchased, not from the library) in 2 dpf zebrafish. At 4 dpf, larvae treated with SirReal2 (at 10 µM) showed a significant reduction in the generation of spinal cord serotonergic neurons (Figure 1c). Then, to further confirm that SIRT2 activity promotes the generation of serotonergic neurons in the developing spinal cord we used a second SIRT2 inhibitor, AGK2. AGK2 is a cell-permeable quinoline compound that targets the nicotinamide-binding site of SIRT2 acting as a reversible selective inhibitor (IC50 = 3.5 µM) with little activity against SIRT1 or SIRT3 (IC50 > 50 µM). As expected, the AGK2 treatment from 2 to 4 dpf also caused a significant reduction in the generation of spinal cord serotonergic neurons (Figure 1a, d).
Previous work showed that sirt2-/- zebrafish adult mutants present elevated levels of tubulin acetylation [19]. To confirm that the SIRT2 inhibitor affects its deacetylase activity in the larval CNS, we analysed the intensity of acetylated alpha-tubulin immunofluorescence in the spinal cord of control and treated larvae. SirReal2 treated 3 dpf animals showed a significant increase in acetylated alpha-tubulin immunofluorescence in the spinal cord as compared to DMSO controls (Figure 1e). Thus, SIRT2 inhibitors applied in the water can reach the larval CNS and reduce the deacetylase activity of SIRT2 in the spinal cord.
These findings support the drug screen results and highlight the role of the deacetylase activity of SIRT2 in promoting the generation of serotonergic neurons in the developing spinal cord. As indicated, only a few previous in vivo studies revealed a role for SIRT2 in regulating neurogenesis in the brain [13,14,15]. Szego et al. [13] showed that SIRT2 knock-out 2-month-old mice present reduced numbers of dopaminergic neurons in the substantia nigra. More recently, decreased levels of SIRT2 in mice models of depression have been linked to reduced neurogenesis [14,15]. Interestingly, SIRT2 overexpression by using oligodendrocyte-derived exosomes was able to enhance neurogenesis in mice with chronic unpredictable mild stress-induced depression [15]. Thus, our study reveals an evolutionary conserved role of SIRT2 in promoting neurogenesis in vertebrates and reveals for the first time that its deacetylase activity promotes neurogenesis in the spinal cord.
3.3. Inhibition of Neurogenesis with SirReal2 Leads to Locomotor Deficits in 4 dpf Larvae
Serotonergic signalling from intrinsic serotonergic spinal cord neurons regulates locomotion by reducing spinally produced motor-bursting in zebrafish [20]. Consequently, previous use of non-steroidal anti-inflammatory drugs, which also reduced the generation of serotonergic neurons in the developing zebrafish spinal cord, led to locomotor deficits in 4 dpf larvae [8]. Thus, it is of interest to test whether the reduction in serotonergic neurons in SirReal2 treated animals is also associated with locomotor deficits.
Indeed, locomotor activity was significantly reduced in the SirReal2 treated animals as compared to the DMSO controls (Figure 2). This reduction was evident across all behavioural metrics evaluated: total swimming distance, number of locomotor events and total duration of activity (Figure 2). The decrease in swimming distance suggests a lower overall displacement, while the reduction in both event count and duration of the swimming events indicates fewer and shorter activity bouts. Taken together, these results reflect a global attenuation of spontaneous motor behaviour associated to the reduction in serotonergic spinal cord neurons. Whether the generation of other cell types is affected by the SirReal2 treatment should be assessed in future studies. For example, in 2 to 4 dpf larvae pMN progenitors switch from motor neuron generation to oligodendrocyte generation [21,22,23]. Interestingly, in mammals, SIRT2 is known to be crucial for myelination and is expressed in oligodendrocytes, where its expression is upregulated during oligodendrocyte differentiation [24,25,26,27] (see [11]). Thus, future studies should analyse the possible role of SIRT2 in the generation/differentiation of other neuronal or glial (e.g. oligodendrocytes) cells in the developing spinal cord, which could also contribute to the observed locomotor deficits.
3.4. SIRT2 Promotes Spinal Cord Neurogenesis by Regulating the Mitotic Activity of Progenitor Cells
Analysis of publicly available single cell RNAseq data reveals sirt2 transcript expression (ZFIN gene: ZDB-GENE-030131-1028; Ensembl gene: ENSDARG00000011488) in the developing zebrafish spinal cord (“spinal cord/glia” cluster of the Daniocell atlas; see Supplementary Figure 1a; https://daniocell.nichd.nih.gov; [28,29]), including the “radial glia”, “medial floor plate”, “lateral floor plate” and “spinal cord precursor” subclusters within the major “spinal cord/glia” cluster (see Supplementary Figure 1a). Interestingly, the expression of sirt2 shows one of the highest correlations of gene expression in this cluster with the fabp7a (Supplementary Figure 1b; positive correlation with r = 0.122; top 9 of genes with positive correlation with sirt2), which is a marker of radial glial progenitor cells in the zebrafish CNS [30]. Moreover, anti-SIRT2 immunofluorescence experiments in transverse sections confirmed widespread Sirt2 protein expression in the spinal cord of 2 dpf animals, including the ependymal region, where radial glia progenitors are located (Supplementary Figure 1c). Thus, expression data suggest that SIRT2 could be acting in spinal cord progenitor/precursor cells to promote the generation of serotonergic interneurons in developing animals.
To determine the cellular mechanisms by which SIRT2 promotes neurogenesis we analysed the effect of the SirReal2 treatment on apoptotic cell death and mitotic activity in the spinal cord of 3 dpf zebrafish. We did not observe a significant difference in the (very low) number of TUNEL+ (apoptotic) cells in the spinal cord between DMSO controls and SirReal2 treated 3 dpf zebrafish (Figure 3a). This indicates that: (1) SIRT2 inhibition does not reduce neurogenesis by causing an increase in apoptotic cell death, and that (2) SIRT2 does not promote neurogenesis by promoting the survival of progenitor cells or differentiating/differentiated neurons. However, we did find a significant decrease in mitotic activity (reduced numbers of pH3+ cells) in the spinal cord of SirReal2 treated animals as compared to DMSO controls (Figure 3b). These results indicate that SIRT2 promotes neurogenesis, at least in part, by promoting mitotic activity in spinal cord progenitor cells.
The role of SIRT2 in regulating mitotic activity was one of the earliest SIRT2 functional discoveries. SIRT2 accumulates in the nucleus during mitosis to maintain normal mitotic activity (see [11]). In the nervous system, olfactory bulbectomized mice show reduced SIRT2 expression, which is associated with reduced cell proliferation as revealed by decreased BrdU labelling in the hippocampus [14]. Here, expression data and pharmacological manipulations suggests that SIRT2 promotes mitotic activity in progenitor cells of the developing spinal cord in zebrafish.
Regarding the molecular mechanisms through which SIRT2 regulates mitotic activity, we observed that SIRT2 inhibition in the zebrafish spinal cord led to increased levels of alpha-tubulin acetylation (see above). Alpha-tubulin is a well-established deacetylation substrate of SIRT2 [31], and its mitotic acetylation is crucial for proper mitotic spindle microtubule function [32,33,34,35]. Notably, disruption of several regulators of the microtubule deacetylase HDAC6 also results in mitotic defects associated with aberrant microtubule acetylation [34,36,37,38]. Our observations suggest that SIRT2 may control mitosis in spinal cord progenitor cells through its deacetylase activity on alpha-tubulin. Future studies should aim to test this hypothesis and to delineate the molecular pathways by which SIRT2 governs the mitotic activity of neuronal progenitors in the spinal cord. Such mechanisms could involve alpha-tubulin deacetylation, as suggested by our data, and/or the deacetylation of other mitosis-related substrates, including the histone methyltransferase SMC1A, PR-Set7, CDH1, GRASP55 or CDC20 [39,40] (see [11]).
5. Conclusions
Using our unbiased drug screen protocol in zebrafish, we identified a role for the deacetylase SIRT2 in promoting neurogenesis in the developing spinal cord. Expression data and pharmacological manipulations indicate that SIRT2 enhances neurogenesis, at least in part, by regulating the mitotic activity of progenitor cells, likely through its deacetylation of alpha-tubulin.
Our findings not only pinpoint a previously underappreciated regulator of vertebrate neurogenesis but could also highlight SIRT2 as a potential therapeutic target to stimulate cell proliferation and neurogenesis following traumatic or degenerative damage to the CNS. For example, recent work has implicated SIRT1 in promoting neural progenitor cell proliferation and glial bridging during spontaneous regeneration after spinal cord injury in zebrafish [41]. Thus, SIRT2 could play similar roles in the diseased CNS.
Supplementary Materials
The following supporting information can be downloaded at the website of this paper posted on Preprints.org, Supplementary figure 1: a. Spinal cord/glia cluster of the Daniocell scRNAseq atlas showing expression of sirt2 in radial glia, medial floor plate, lateral floor plate and spinal cord precursors subcluster. b. Table from the Daniocell atlas showing the top 9 genes showing positive correlated gene expression with sirt2. Note that the radial glia marker fabp7a is in the top 9 of genes with positive correlation (highlighted in yellow). c. Photomicrograph of a spinal cord section of a 2 dpf larva showing widespread expression of SIRT2, including the ependymal region. Scale bar: 10 µm.; Supplementary file 1: Data from the first step of the drug screen; Supplementary file 2: Data from the second step of the drug screen.
Author Contributions
Conceptualization, A.B.-I; methodology, L.G.-Ll., Á.J.A.; formal analysis, L.G.-Ll., Á.J.A.; A.B.-I; investigation, L.G.-Ll., Á.J.A., L.S., A.B.-I.; resources, L.S., A.B.-I.; writing—original draft preparation, L.G-Ll, A.B.-I.; writing—review and editing, Á.J.A., L.S.; supervision, A.B.-I.; project administration, L.S., A.B.-I.; funding acquisition, L.S., A.B.-I. All authors have read and agreed to the published version of the manuscript.
Funding
Grant PID2023-147266NB-I00 funded by MICIU/AEI/10.13039/501100011033 and by ERDF/EU to L.S. and A.B.-I.
Institutional Review Board Statement
The animal study protocol was approved by the Bioethics Committee of the University of Santiago de Compostela and the Xunta de Galicia (reference 01/20/LU-003). The study was conducted in accordance with the regulations and laws established by the European Union (Directive 2010/63/EU) and the Spanish Royal Decree 1386/2018 for the care and handling of animals in research.
Data Availability Statement
Raw imaging data is available from the authors upon reasonable request.
Acknowledgments
We would like to thank the Servizo de Microscopía of the University of Santiago de Compostela and Dr. Mercedes Rivas Cascallar for confocal microscope facilities and technical help.
Conflicts of Interest
The authors declare no conflicts of interest.
References
- Gosgnach, S. The mammalian locomotor CPG: revealing the contents of the black box. J Neurophysiol. 2025 Feb 1;133(2):472-478.
- Hilinski WC, Bostrom JR, England SJ, Juárez-Morales JL, de Jager S, Armant O, Legradi J, Strähle U, Link BA, Lewis KE. Lmx1b is required for the glutamatergic fates of a subset of spinal cord neurons. Neural Dev. 2016 Aug 23;11(1):16.
- Gerber V, Yang L, Takamiya M, Ribes V, Gourain V, Peravali R, Stegmaier J, Mikut R, Reischl M, Ferg M, Rastegar S, Strähle U. The HMG box transcription factors Sox1a and Sox1b specify a new class of glycinergic interneuron in the spinal cord of zebrafish embryos. Development. 2019 Feb 20;146(4):dev172510.
- Gao T, Li J, Li N, Gao Y, Yu L, Zhuang S, Zhao Y, Dong X. lncrps25 play an essential role in motor neuron development through controlling the expression of olig2 in zebrafish. J Cell Physiol. 2020 Apr;235(4):3485-3496.
- Gong J, Hu S, Huang Z, Hu Y, Wang X, Zhao J, Qian P, Wang C, Sheng J, Lu X, Wei G, Liu D. The Requirement of Sox2 for the Spinal Cord Motor Neuron Development of Zebrafish. Front Mol Neurosci. 2020 Mar 27;13:34.
- Chen F, Köhler M, Cucun G, Takamiya M, Kizil C, Cosacak MI, Rastegar S. sox1a:eGFPtransgenic line and single-cell transcriptomics reveal the origin of zebrafish intraspinal serotonergic neurons. iScience. 2023 Jul 11;26(8):107342.
- Cucun G, Köhler M, Pfitsch S, Rastegar S. Insights into the mechanisms of neuron generation and specification in the zebrafish ventral spinal cord. FEBS J. 2024 Feb;291(4):646-662.
- González-Llera L, Sobrido-Cameán D, Quelle-Regaldie A, Sánchez L, Barreiro-Iglesias A. An in vivo drug screen in zebrafish reveals that cyclooxygenase 2-derived prostaglandin D2promotes spinal cord neurogenesis. Cell Prolif. 2024 May;57(5):e13594.
- Montgomery JE, Wiggin TD, Rivera-Perez LM, Lillesaar C, Masino MA. Intraspinal serotonergic neurons consist of two, temporally distinct populations in developing zebrafish. Dev Neurobiol. 2016 Jun;76(6):673-87.
- Vaquero A, Scher MB, Lee DH, Sutton A, Cheng HL, Alt FW, Serrano L, Sternglanz R, Reinberg D. SirT2 is a histone deacetylase with preference for histone H4 Lys 16 during mitosis. Genes Dev. 2006 May 15;20(10):1256-61.
- Wang Y, Yang J, Hong T, Chen X, Cui L. SIRT2: Controversy and multiple roles in disease and physiology. Ageing Res Rev. 2019 Nov;55:100961.
- Maxwell MM, Tomkinson EM, Nobles J, Wizeman JW, Amore AM, Quinti L, Chopra V, Hersch SM, Kazantsev AG. The Sirtuin 2 microtubule deacetylase is an abundant neuronal protein that accumulates in the aging CNS. Hum Mol Genet. 2011 Oct 15;20(20):3986-96.
- Szegő ÉM, Gerhardt E, Outeiro TF. Sirtuin 2 enhances dopaminergic differentiation via the AKT/GSK-3β/β-catenin pathway. Neurobiol Aging. 2017 Aug;56:7-16.
- Takahashi K, Kurokawa K, Hong L, Miyagawa K, Mochida-Saito A, Takeda H, Tsuji M. Correlation between the reduction in hippocampal SirT2 expression and depressive-like behaviors and neurological abnormalities in olfactory bulbectomized mice. Neurosci Res. 2022 Sep;182:76-80.
- Zhang H, Xie XH, Xu SX, Wang C, Sun S, Song X, Li R, Li N, Feng Y, Duan H, Li D, Liu Z. Oligodendrocyte-derived exosomes-containing SIRT2 ameliorates depressive-like behaviors and restores hippocampal neurogenesis and synaptic plasticity via the AKT/GSK-3β pathway in depressed mice. CNS Neurosci Ther. 2024 Mar;30(3):e14661.
- Westerfield, M. The Zebrafish Book. A Guide for the Laboratory Use of Zebrafish (Danio Rerio). 4th ed. Univ. of Oregon Press; 2000.
- Schindelin J, Arganda-Carreras I, Frise E, Kaynig V, Longair M, Pietzsch T, Preibisch S, Rueden C, Saalfeld S, Schmid B, Tinevez JY, White DJ, Hartenstein V, Eliceiri K, Tomancak P, Cardona A. Fiji: an open-source platform for biological-image analysis. Nat Methods. 2012 Jun 28;9(7):676-82.
- Nur S, Adams CE. Chlorpromazine versus reserpine for schizophrenia. Cochrane Database Syst Rev. 2016 Apr 28;4(4):CD012122.
- Łysyganicz PK, Pooranachandran N, Liu X, Adamson KI, Zielonka K, Elworthy S, van Eeden FJ, Grierson AJ, Malicki JJ. Loss of Deacetylation Enzymes Hdac6 and Sirt2 Promotes Acetylation of Cytoplasmic Tubulin, but Suppresses Axonemal Acetylation in Zebrafish Cilia. Front Cell Dev Biol. 2021 Jun 28;9:676214.
- Montgomery JE, Wahlstrom-Helgren S, Wiggin TD, Corwin BM, Lillesaar C, Masino MA. Intraspinal serotonergic signaling suppresses locomotor activity in larval zebrafish. Dev Neurobiol. 2018 Jun 19:10.1002/dneu.22606.
- Czopka T, Ffrench-Constant C, Lyons DA. Individual oligodendrocytes have only a few hours in which to generate new myelin sheaths in vivo. Dev Cell. 2013;25(6):599-609.
- Park HC, Boyce J, Shin J, Appel B. Oligodendrocyte specification in zebrafish requires notch-regulated cyclin-dependent kinase inhibitor function. J Neurosci. 2005;25(29):6836-6844.
- Ravanelli AM, Appel B. Motor neurons and oligodendrocytes arise from distinct cell lineages by progenitor recruitment. Genes Dev. 2015. Dec 1;29(23):2504-2515.
- Dugas JC, Tai YC, Speed TP, Ngai J, Barres BA. Functional genomic analysis of oligodendrocyte differentiation. J Neurosci. 2006 Oct 25;26(43):10967-83.
- Li W, Zhang B, Tang J, Cao Q, Wu Y, Wu C, Guo J, Ling EA, Liang F. Sirtuin 2, a mammalian homolog of yeast silent information regulator-2 longevity regulator, is an oligodendroglial protein that decelerates cell differentiation through deacetylating alpha-tubulin. J Neurosci. 2007 Mar 7;27(10):2606-16.
- Werner HB, Kuhlmann K, Shen S, Uecker M, Schardt A, Dimova K, Orfaniotou F, Dhaunchak A, Brinkmann BG, Möbius W, Guarente L, Casaccia-Bonnefil P, Jahn O, Nave KA. Proteolipid protein is required for transport of sirtuin 2 into CNS myelin. J Neurosci. 2007 Jul 18;27(29):7717-30.
- Ji S, Doucette JR, Nazarali AJ. Sirt2 is a novel in vivo downstream target of Nkx2.2 and enhances oligodendroglial cell differentiation. J Mol Cell Biol. 2011 Dec;3(6):351-9.
- Farrell JA, Wang Y, Riesenfeld SJ, Shekhar K, Regev A, Schier AF. Single-cell reconstruction of developmental trajectories during zebrafish embryogenesis. Science. 2018 Jun 1;360(6392):eaar3131.
- Sur A, Wang Y, Capar P, Margolin G, Prochaska MK, Farrell JA. Single-cell analysis of shared signatures and transcriptional diversity during zebrafish development. Dev Cell. 2023 Dec 18;58(24):3028-3047.e12.
- Pose-Méndez S, Rehbock M, Wolf-Asseburg A, Köster RW. In Vivo Monitoring of Fabp7Expression in Transgenic Zebrafish. Cells. 2024 Jul 2;13(13):1138.
- North BJ, Marshall BL, Borra MT, Denu JM, Verdin E. The human Sir2 ortholog, SIRT2, is an NAD+-dependent tubulin deacetylase. Mol Cell. 2003 Feb;11(2):437-44.
- Piperno G, LeDizet M, Chang XJ. Microtubules containing acetylated alpha-tubulin in mammalian cells in culture. J Cell Biol. 1987 Feb;104(2):289-302.
- Rasamizafy SF, Delsert C, Rabeharivelo G, Cau J, Morin N, van Dijk J. Mitotic Acetylation of Microtubules Promotes Centrosomal PLK1Recruitment and Is Required to Maintain Bipolar Spindle Homeostasis. Cells. 2021 Jul 22;10(8):1859.
- Wang YL, Chen H, Zhan YQ, Yin RH, Li CY, Ge CH, Yu M, Yang XM. EWSR1 regulates mitosis by dynamically influencing microtubule acetylation. Cell Cycle. 2016 Aug 17;15(16):2202-2215.
- Zou YJ, Shan MM, Wan X, Liu JC, Zhang KH, Ju JQ, Xing CH, Sun SC. Kinesin KIF15 regulates tubulin acetylation and spindle assembly checkpoint in mouse oocyte meiosis. Cell Mol Life Sci. 2022 Jul 14;79(8):422.
- Tan, H.-F. , Tan S.-M. The focal adhesion protein kindlin-2 controls mitotic spindle assembly by inhibiting histone deacetylase 6 and maintaining α-tubulin acetylation. J. Biol. Chem. 2020;295:5928–5943.
- Patel, H. , Stavrou I., Shrestha R.L., Draviam V., Frame M.C., Brunton V.G. Kindlin1 regulates microtubule function to ensure normal mitosis. J. Mol. Cell Biol. 2016;8:338–348.
- Steinhäuser, K. , Klöble P., Kreis N.-N., Ritter A., Friemel A., Roth S., Reichel J.M., Michaelis J., Rieger M., Louwen F., et al. Deficiency of RITA results in multiple mitotic defects by affecting microtubule dynamics. Oncogene. 2016;36:2146–2159.
- Zhang X, Brachner A, Kukolj E, Slade D, Wang Y. SIRT2 deacetylates GRASP55 to facilitate post-mitotic Golgi assembly. J Cell Sci. 2019 Nov 1;132(21):jcs232389.
- Yi F, Zhang Y, Wang Z, Wang Z, Li Z, Zhou T, Xu H, Liu J, Jiang B, Li X, Wang L, Bai N, Guo Q, Guan Y, Feng Y, Mao Z, Fan G, Zhang S, Wang C, Cao L, O'Rourke BP, Wang Y, Wu Y, Wu B, You S, Zhang N, Guan J, Song X, Sun Y, Wei S, Cao L. The deacetylation-phosphorylation regulation of SIRT2-SMC1A axis as a mechanism of antimitotic catastrophe in early tumorigenesis. Sci Adv. 2021 Feb 24;7(9):eabe5518.
- Gupta S, Hui SP. Epigenetic Cross-Talk Between Sirt1 and Dnmt1 Promotes Axonal Regeneration After Spinal Cord Injury in Zebrafish. Mol Neurobiol. 2025 Feb;62(2):2396-2419.
Figure 1.
Inhibition of SIRT2 reduces the generation of serotonergic cells in the developing spinal cord. a. Representative photomicrographs of 4 dpf zebrafish showing the reduction in serotonin-immunoreactive cells (arrows) in the caudal spinal cord of SirReal2 or AGK2 treated animals as compared to DMSO controls. b. Graph showing the reduction in the number of serotonin-immunoreactive cells observed in SirReal2 treated animals in the secondary drug screen. c. Graph showing the reduction in the number of serotonin-immunoreactive cells observed in SirReal2 (newly purchased; not from the drug library) treated animals as compared to DMSO controls. d. Graph showing the reduction in the number of serotonin-immunoreactive cells observed in AGK2 treated animals as compared to DMSO controls. e. The SirReal2 treatment increases the intensity of acetylated alpha-tubulin immunofluorescence in the spinal cord of 3 dpf zebrafish. Photomicrographs show acetylated alpha-tubulin immunofluorescence in cryostat spinal cord sections (dotted lines) of DMSO controls and SirReal2 treated 3 pdf larvae. Dorsal is at the top in all photomicrographs Scale bars: a, 25 µm; e, 15 µm.
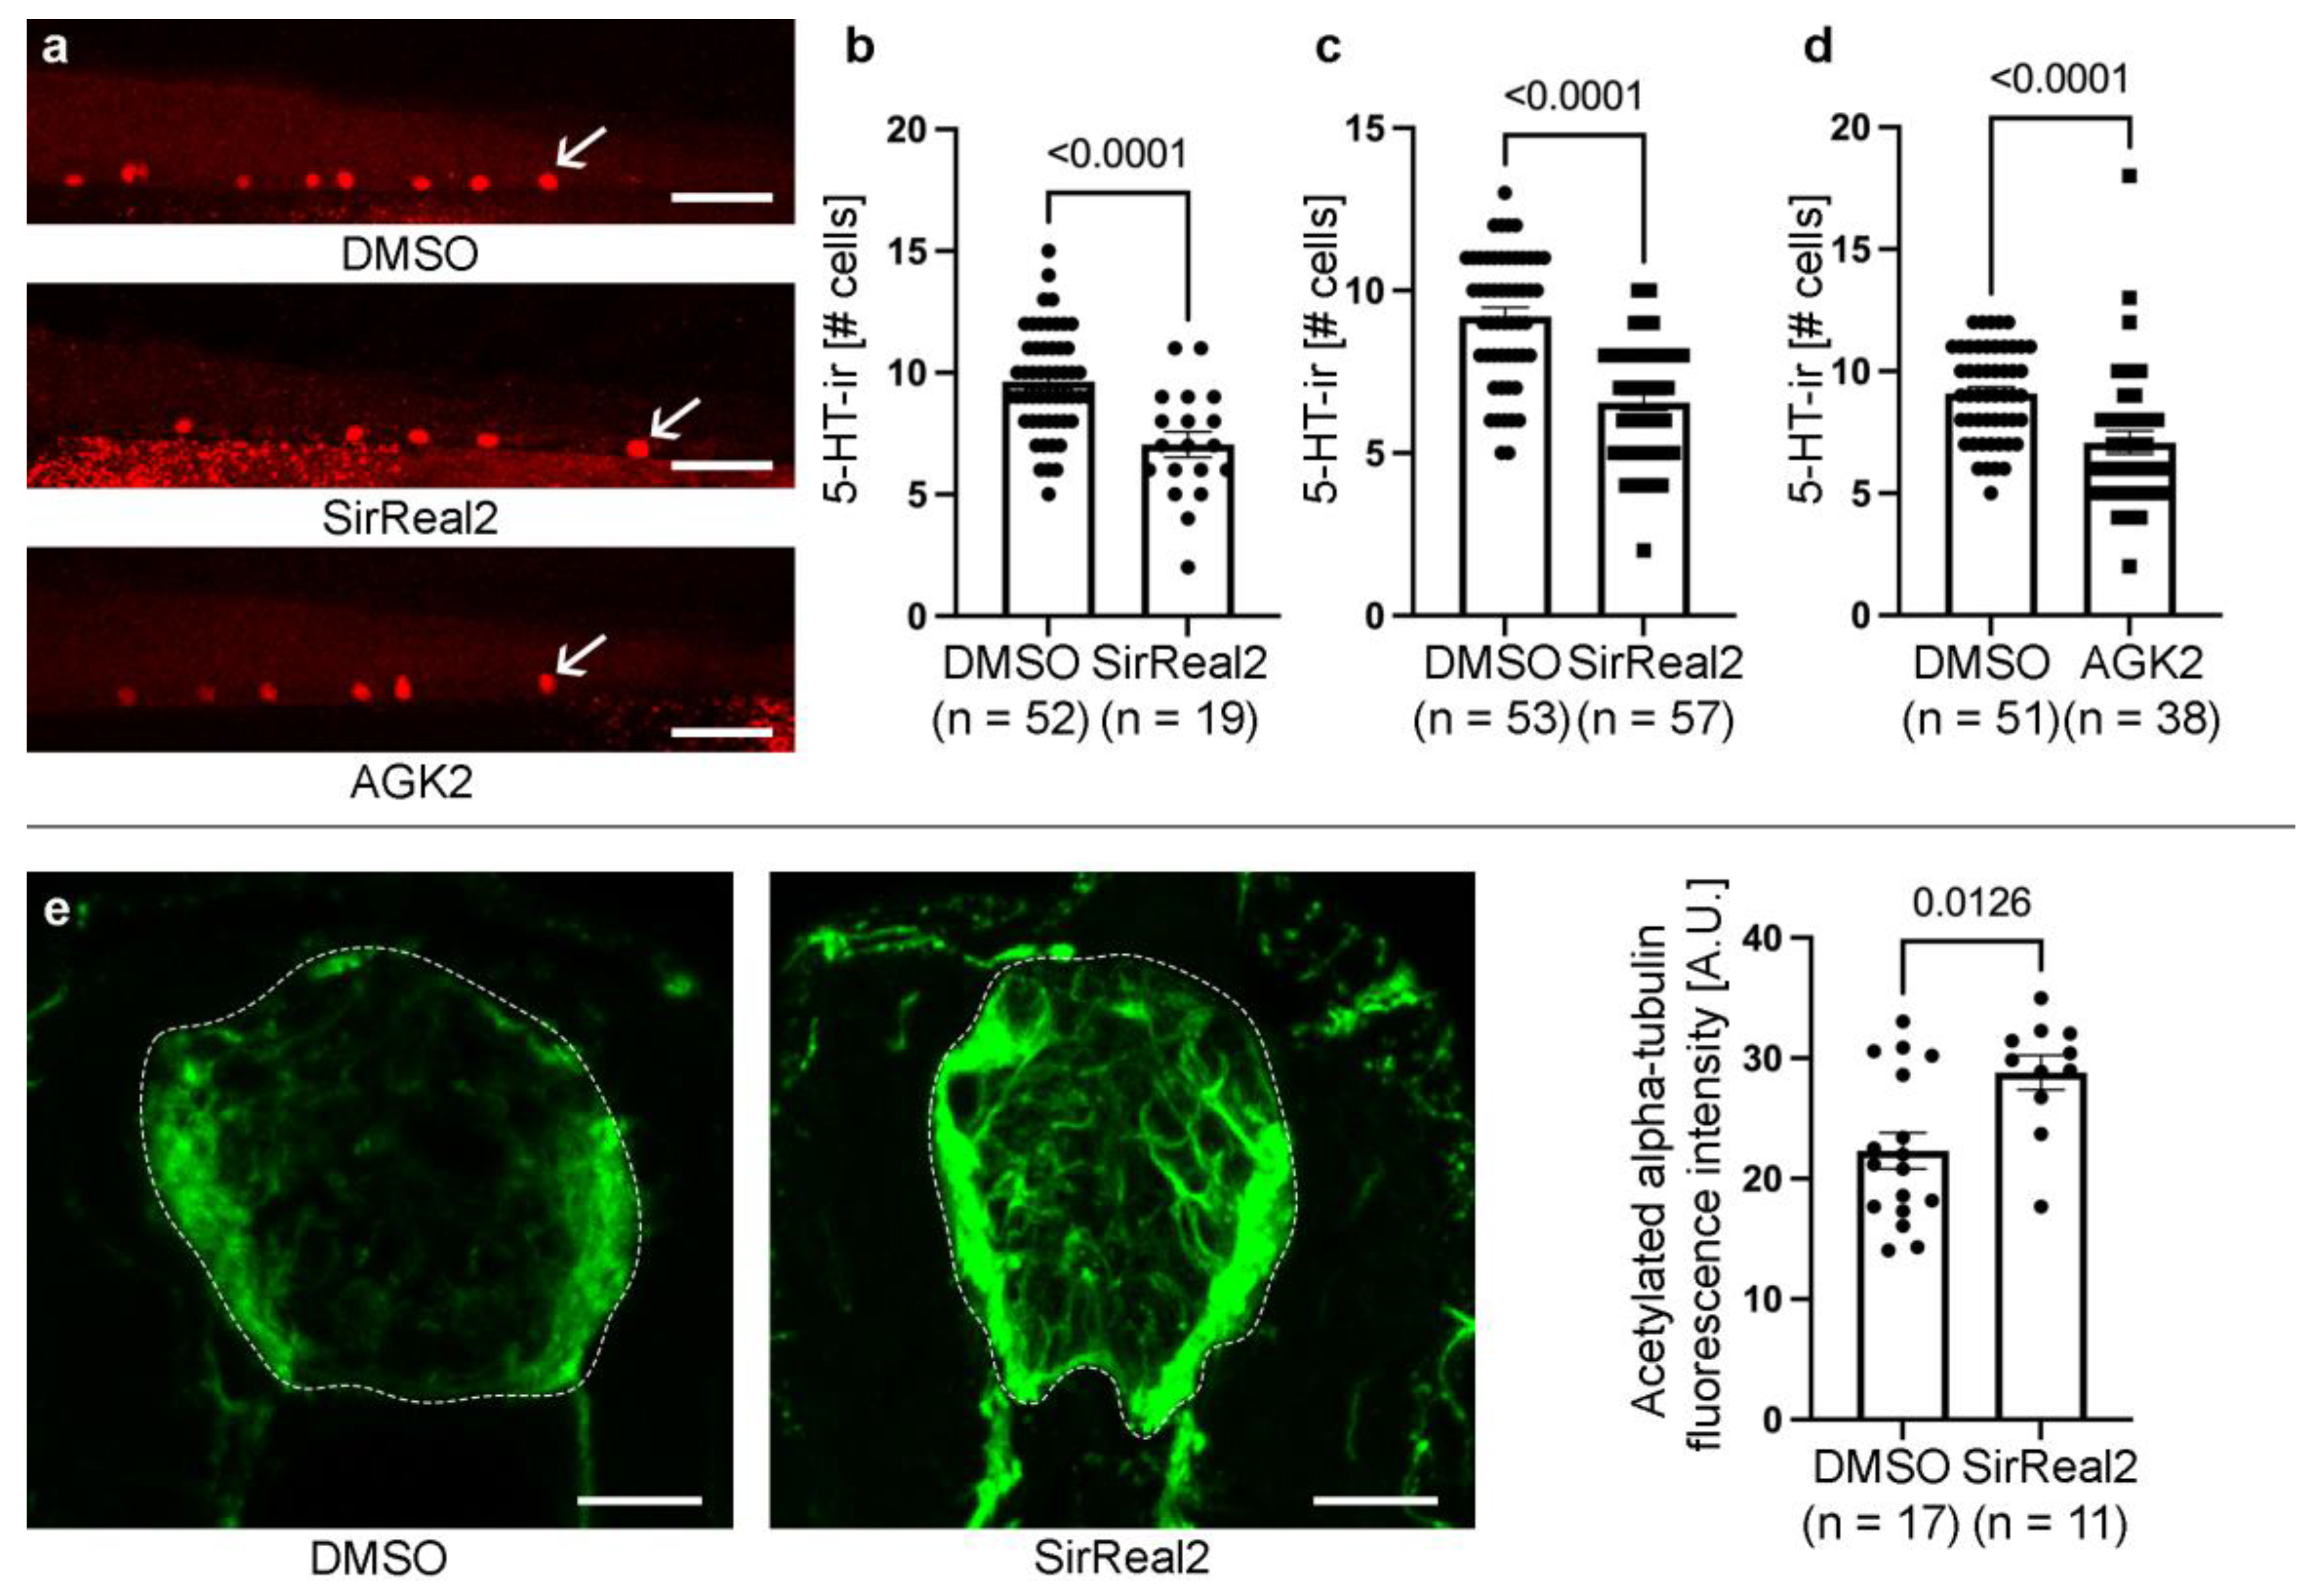
Figure 2.
Inhibition of SIRT2 reduces locomotor activity in 4 dpf zebrafish larvae. Images show representative swimming tracks of 6 DMSO controls and 6 SirReal2 treated larvae (red lines indicate long swimming events and green lines indicates short swimming events). Graphs show significant differences in swimming distance, number of swimming events and duration of swimming in DMSO controls vs SirReal2 treated animals.
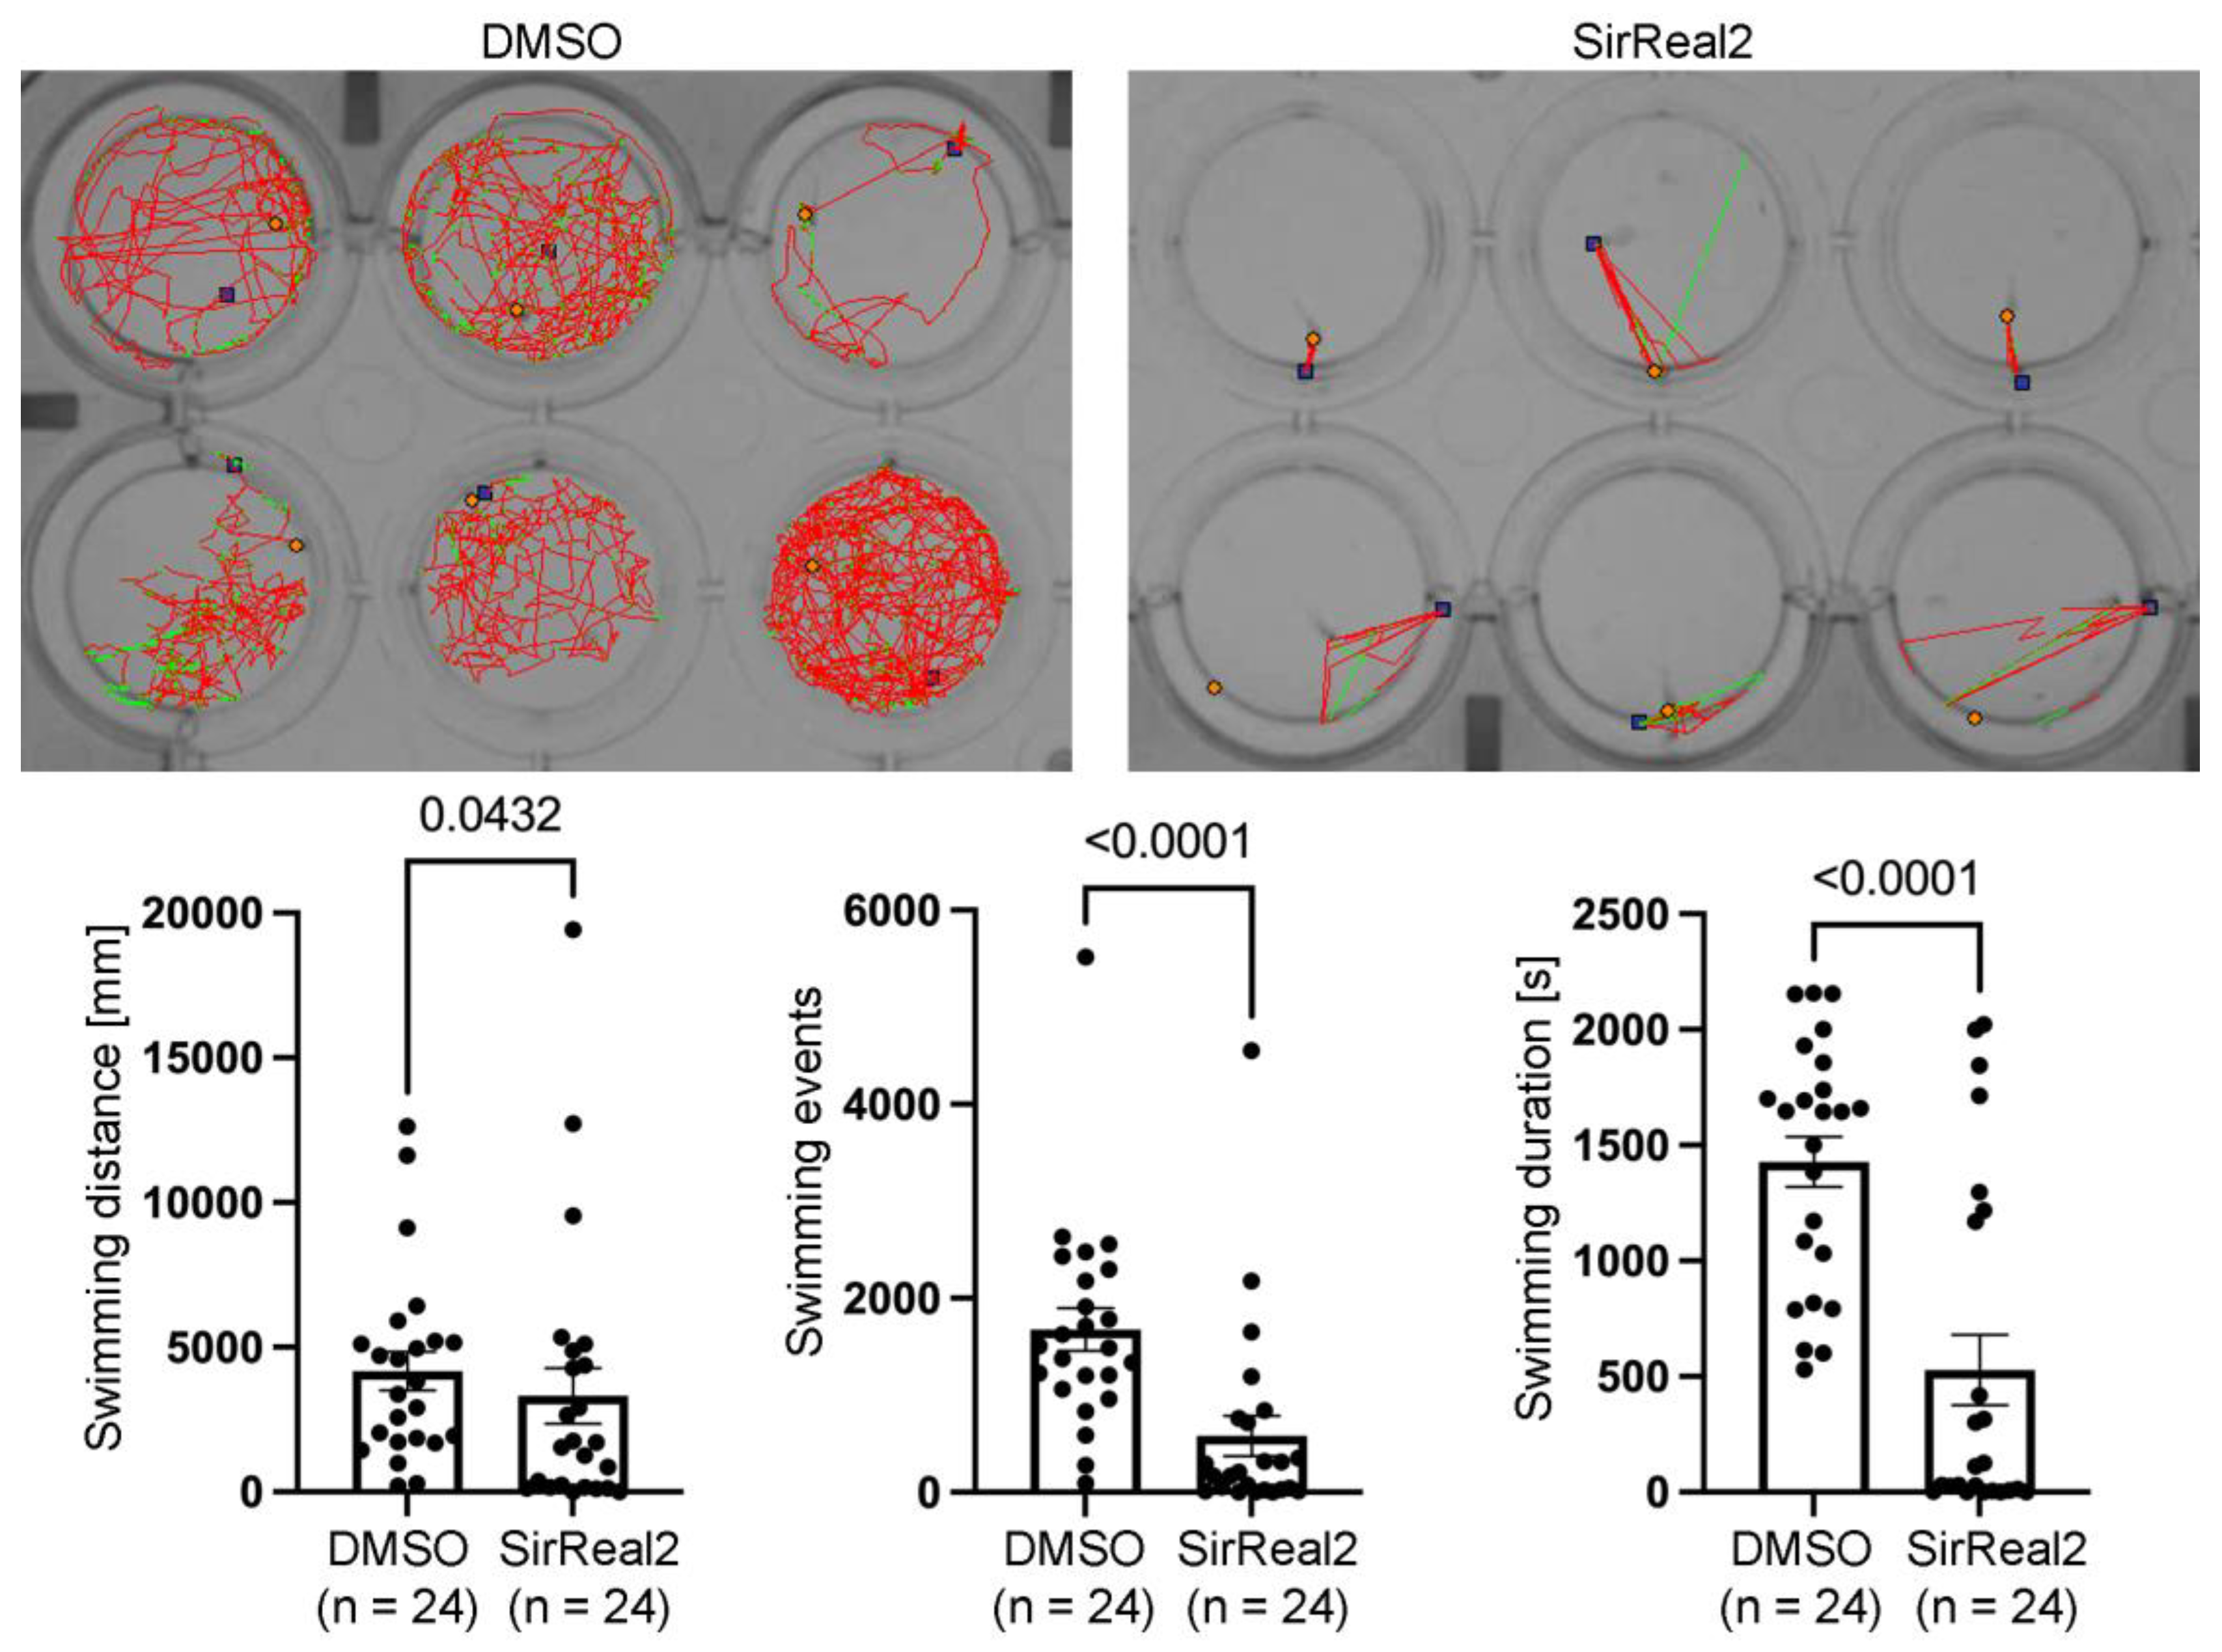
Figure 3.
Inhibition of SIRT2 decreases cell proliferation in the spinal cord (dotted lines) of 3 dpf animals. a. Representative photomicrographs of TUNEL labelling in spinal cord sections and graph showing that SirReal2 treated animals do not present changes in the number of apoptotic spinal cord cells (TUNEL+). Note the presence of TUNEL+ cells in neighbouring tissues (arrows) that serve as a positive control for the TUNEL labelling. b. Representative photomicrographs of pH3 immunofluorescence in spinal cord sections and graph showing a reduction in pH3+ (mitotic) cells (arrows) in SirReal2 treated animals. Dorsal is at the top in all photomicrographs. Scale bars: a-b, 10 µm.
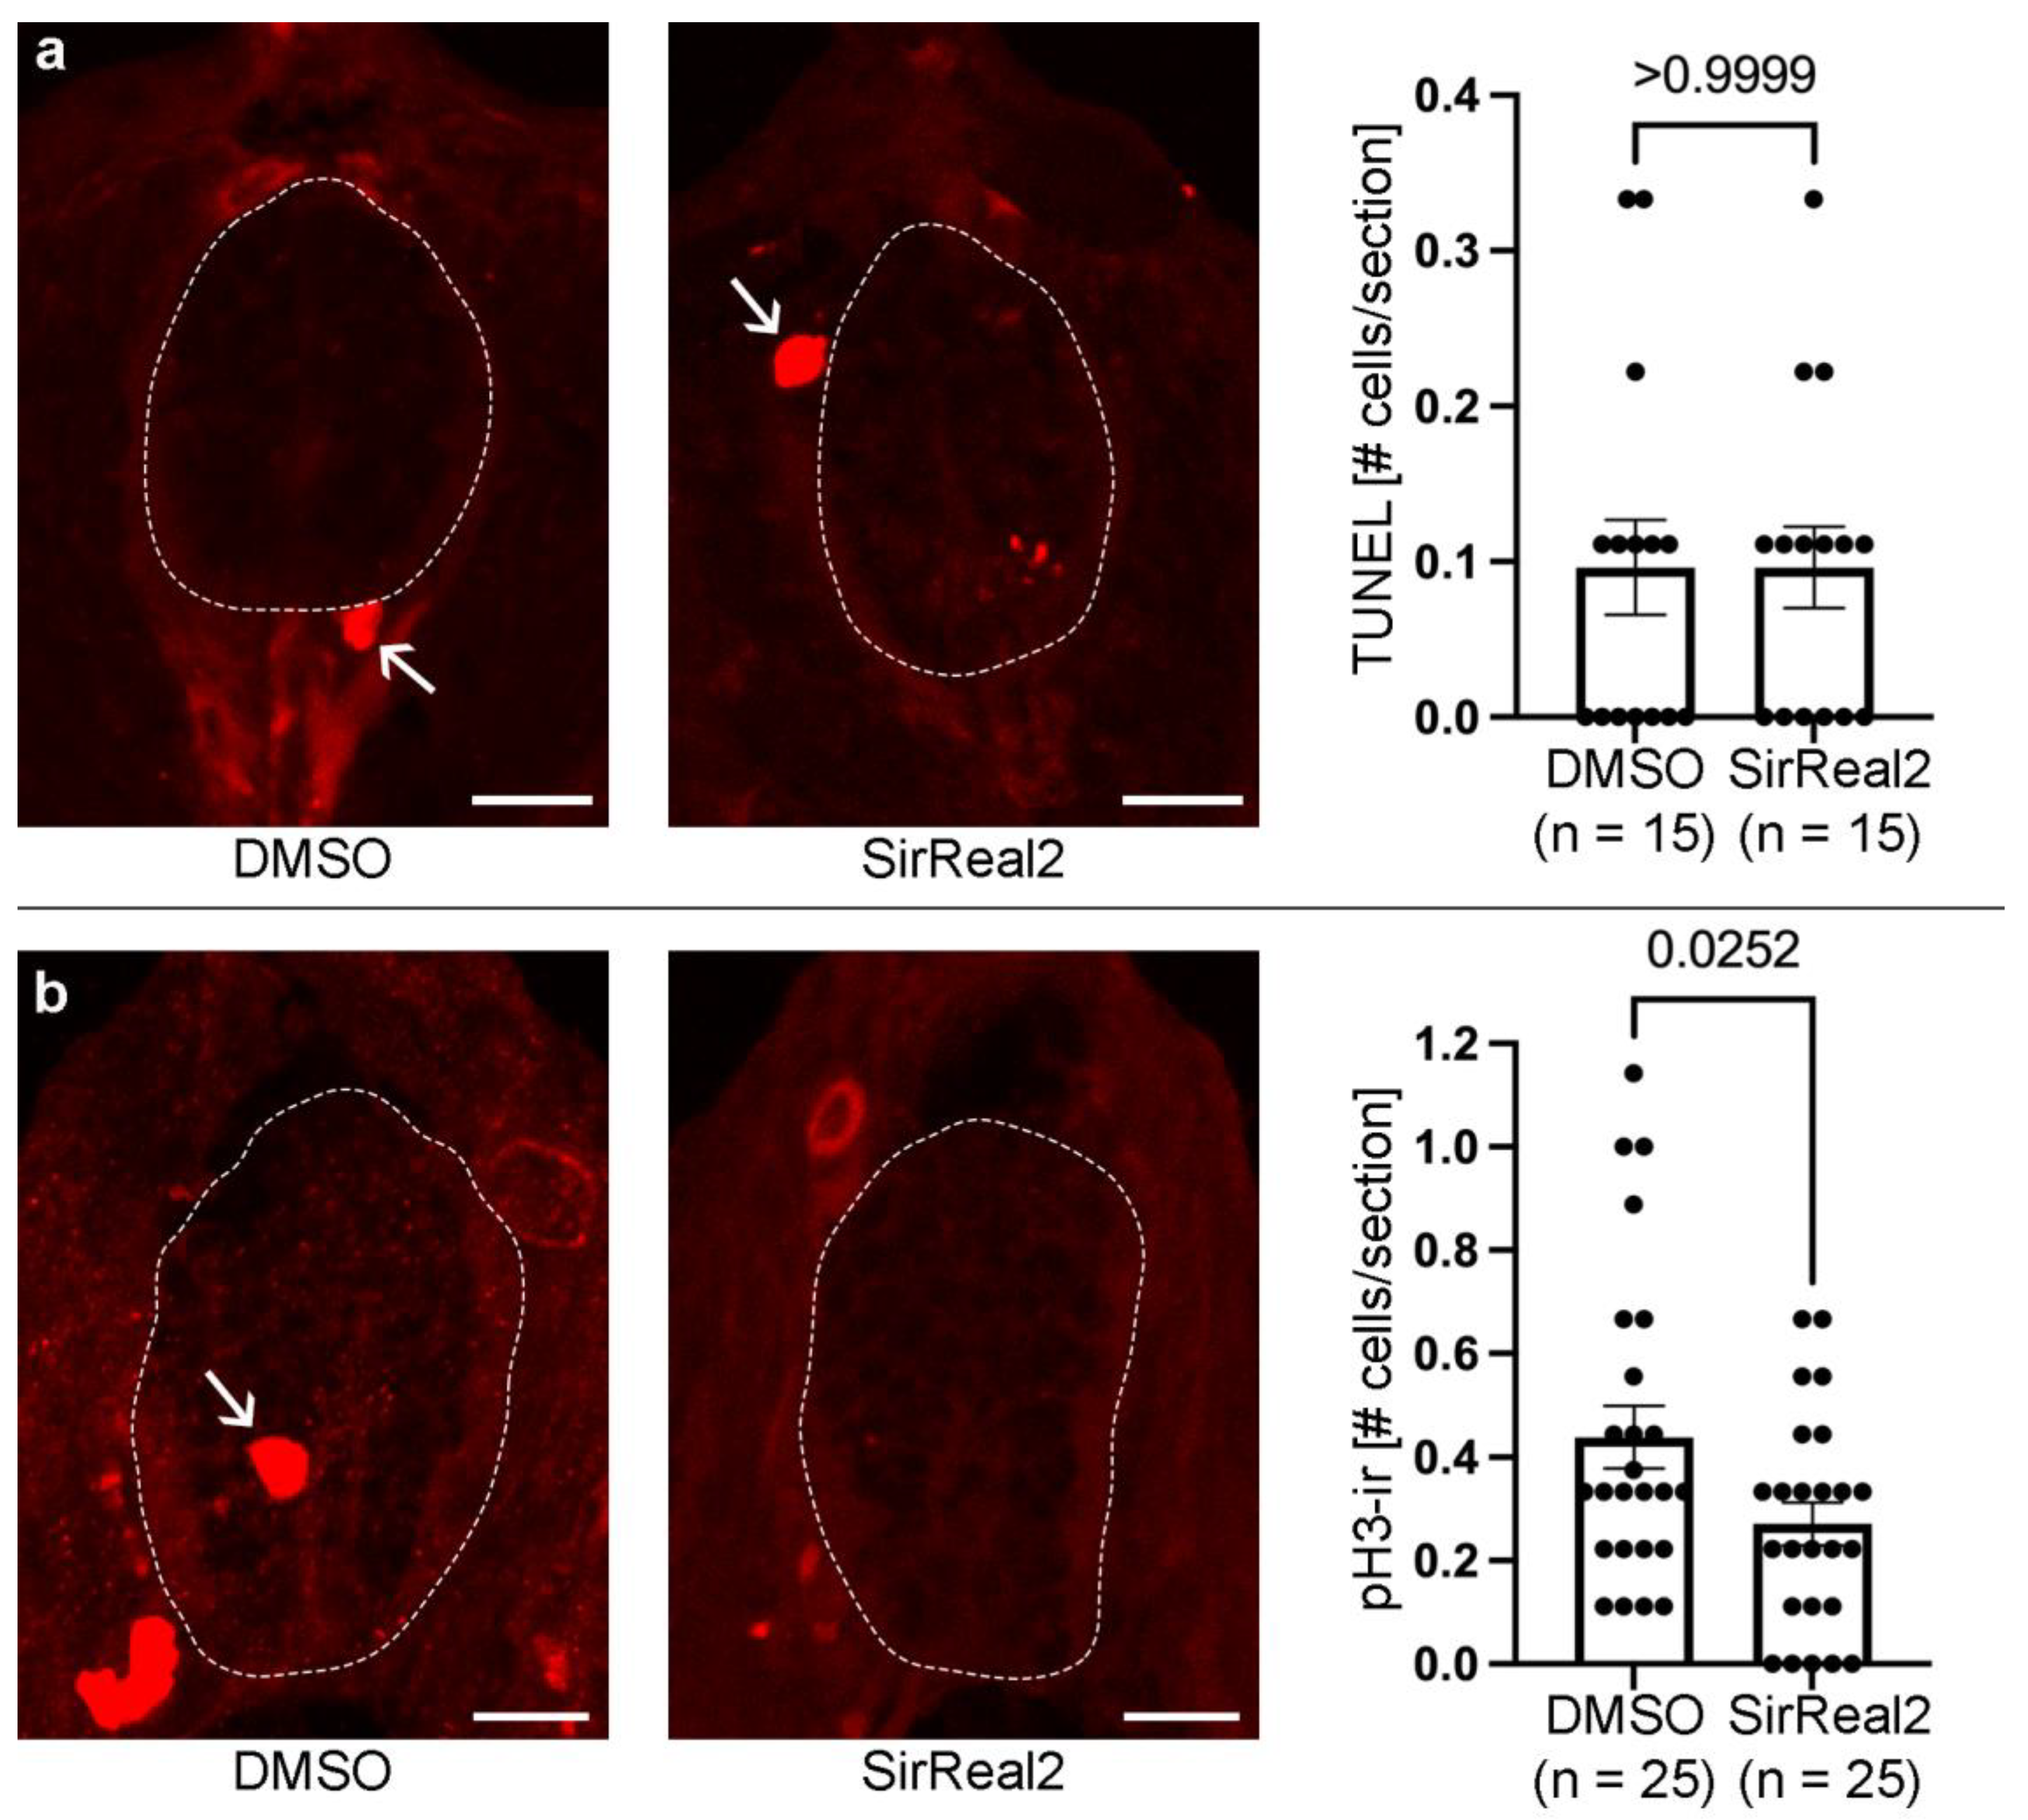

Table 1.
Hits reducing the generation of serotonergic neurons in the spinal cord identified after the 2-step drug screen protocol.
Table 1.
Hits reducing the generation of serotonergic neurons in the spinal cord identified after the 2-step drug screen protocol.
| Drug | P-value | Application |
| SirReal2 | <0.0001 | Potent and selective inhibitor of SIRT2 |
| Reserpine | <0.0001 | Inhibits vesicular uptake of catecholamines and serotonin |
| YM 976 | 0.0001 | Phosphodiesterase type IV inhibitor |
| Atreleuton | 0.0002 | Reversible 5-lipoxygenase inhibitor |
| Arcaine sulfate | 0.0011 | N-methyl-d-aspartate receptor effector/antagonist |
| L-732,138 | 0.0029 | Competitive substance P receptor antagonist |
| Acetylthiocholine chloride | 0.0029 | Acetylcholinesterase substrate and nicotinic acetylcholine receptor agonist |
| Actinonin | 0.0135 | Inhibitory action against peptide deformylase |
| UNC0379 trifluoroacetate salt | 0.0156 | First substrate-competitive inhibitor of the lysine methyltransferase SETD8 |
| Azelaic acid | 0.0215 | Antibacterial, anti-keratinizing, antimelanogenic, antioxidant and anti-inflammatory agent |
Disclaimer/Publisher’s Note: The statements, opinions and data contained in all publications are solely those of the individual author(s) and contributor(s) and not of MDPI and/or the editor(s). MDPI and/or the editor(s) disclaim responsibility for any injury to people or property resulting from any ideas, methods, instructions or products referred to in the content. |
© 2025 by the authors. Licensee MDPI, Basel, Switzerland. This article is an open access article distributed under the terms and conditions of the Creative Commons Attribution (CC BY) license (http://creativecommons.org/licenses/by/4.0/).
Copyright: This open access article is published under a Creative Commons CC BY 4.0 license, which permit the free download, distribution, and reuse, provided that the author and preprint are cited in any reuse.


