
Submitted:
04 September 2025
Posted:
08 September 2025
You are already at the latest version
Abstract
Barley (Hordeum vulgare L.) is a key cereal crop for malting and brewing, where grain plumpness and optimal grain protein concentration (GPC) are essential quality traits. This study investigated the combined effects of nitrogen fertilization strategies and a seaweed-based biostimulant (Ascophyllum nodosum extract) on malting barley produc-tion across four environments in Thessaly, Greece, over two growing seasons. Treat-ments included urea (U), urea with biostimulant (U+B), urea with urease inhibitor (UI), urea with urease inhibitor and biostimulant (UI+B), and a control (no fertilization). Applications were tested on genotype G20 at mid-development (Z30–33) and genotype G45 at an earlier stage (Z24–30). UI+B treatment consistently enhanced yield by up to 71%, thousand grain weight by 27%, and spikelets per square meter by 75% relative to the control, with responses influenced by genotype and environment. Grain fractions >2.8 mm increased by up to 22% under UI+B, while GPC remained within the optimal malting range (9.5–11.5%). Early-stage applications produced stronger benefits overall. Principal component analysis distinguished treatment effects, with UI+B samples clustering consistently apart from controls. These results demonstrate that combining biostimulants with urease inhibitors can simultaneously improve yield, quality, and sustainability in malting barley, supporting reduced nitrogen input in Mediterranean systems.
Keywords:
Malting barley
; Biostimulants
; Ascophyllum nodosum extract
; Nitrogen fertilization
; Grain Plumpness
; Grain protein concentration
; Mediterranean Conditions
1. Introduction
Barley (Hordeum vulgare L.) stands as one of the most important cereal crops globally, serving both food and feed sectors and occupying a particularly crucial role in the malting and brewing industries [1,2]. The economic value of barley for malting purposes depend on key quality attributes, notably mean grain size, grain size distribution, and grain protein concentration [3,4]. Among these, grain plumpness holds particular significance, with larger kernels positively correlated with malt extract yield—directly impacting beer production volume and profitability [3,4,5,6]. However, achieving consistently high kernel size remains challenging, particularly under Mediterranean and other stress-prone environments where thin grains are often produced.
Grain protein concentration (GPC) is another decisive quality parameter. Optimal GPC, typically ranging between 9% and 12%, is required to ensure proper enzymatic activity during malting, efficient yeast nutrition, and high extract yield [7,8,9]. Both deficient and excessive protein levels compromise malting quality, emphasizing the necessity of precise agronomic and genetic control. Moreover, grain size is a critical quality criterion, with acceptable standards typically requiring more than 90% of kernels to be retained above a 2.2 mm sieve [10]. Grain plumpness ensures higher malt extract yield and is closely linked to overall brewing performance [3,11].
The yield and quality performance of barley is significantly affected by the interactions among genotype, environment, and treatment [5,12,13]. Phenotypic plasticity, defined as the environmentally responsive generation of various phenotypes from a single genotype [14], is crucial for the adaptation of barley to a range of environmental conditions. Genotypes exhibiting high stability are valuable for securing predictable yields under stress-prone environments, while those with pronounced plasticity may exploit favorable conditions to achieve superior performance [5,15].
Nevertheless, efforts to simultaneously improve grain yield and quality face significant biological constraints. Compensatory relationships between yield components, such as the negative association between grain size and protein concentration, often impede progress [5,16]. Abiotic stresses, including drought, extreme temperatures, and nutrient deficiencies, further exacerbate these challenges, particularly under rainfed and marginal agricultural systems [17,18].
Among agronomic factors, nitrogen (N) management is particularly influential. Nitrogen is crucial for the growth of plants; however, the nitrogen use efficiency (NUE) in cereal crops remains relatively low, with recovery rates of applied nitrogen varying between 26% and 68% [19]. Low NUE not only limits yield potential but also leads to environmental degradation through nitrate leaching, ammonia volatilization, and nitrous oxide (N₂O) emissions [20,21]. It is essential to implement management strategies to mitigate N2O emissions in agriculture [21], a potent greenhouse gas with a global warming potential 265 times that of carbon dioxide [19].
Effective nitrogen management aims to optimize yield and quality while minimizing environmental impacts. Excessive application of Ν increases GPC beyond acceptable limits for malting, thereby reducing extract yields and product quality [7]. On the other hand, insufficient application may compromise yield and soil health, particularly in intensive cropping systems [19]. Moreover, climatic variability, particularly rainfall patterns following fertilizer application, exerts a strong influence on nitrogen dynamics, uptake efficiency, and final grain attributes [9,22].
The "4R" nutrient stewardship framework—applying the right fertilizer source at the right rate, time, and place—has been advocated to enhance NUE and environmental sustainability [19,23]. However, the practical application remains challenging, particularly due to the growing unpredictability of weather patterns influenced by climate change.
Urea, representing about 80% of the straight nitrogen fertilizer market, remains the most widely applied nitrogen form due to its high nitrogen content and affordability [24,25]. However, urea is prone to rapid hydrolysis into ammonium, resulting in substantial ammonia (NH₃) volatilization losses. The application of urease inhibitors (UIs) presents an effective strategy to slow hydrolysis, enhancing nitrogen retention and reducing emissions [24,25,26]. Literature suggest that UIs can decrease NH₃ losses by up to 94%, although their impact on grain yield remains modest and context-dependent [25,27,28,29].
Subsequent progress involves breeding techniques and genetic engineering approaches designed to enhance intrinsic NUE characteristics. Selective breeding has focused on traits such as greater root length or surface area, increased above-ground biomass, higher harvest index, and enhanced photosynthetic capacity [30,31,32,33,34,35]. Genetic modification strategies have also been employed to manipulate genes associated with nitrogen uptake, assimilation and remobilization [36,37,38,39,40]. Nonetheless, the majority of these genetically modified plants have primarily been tested in controlled or hydroponic settings, leaving their efficacy in diverse field conditions unverified [38,41,42].
An additional avenue for improving crop performance under reduced nitrogen inputs involves the application of biostimulants, which in most cases are plant-derived products. Biostimulants are defined as biological substances or microorganisms applied to plants to enhance nutrient efficiency, stress tolerance, and/or crop quality traits [43,44,45]. Seaweed extracts, particularly from Ascophyllum nodosum, have emerged as leading products in the biostimulant market due to their wide range of beneficial effects on plant physiology [46,47,48,49,50].
Seaweed extracts contain complex mixtures of bioactive compounds, including phytohormones (cytokinins, auxins, abscisic acid), polysaccharides, amino acids, vitamins, and phenolic compounds [47,51,52]. These compounds are reported to improve plant vigor, promote root development, enhance photosynthetic activity, delay senescence, and increase tolerance to abiotic stresses such as drought, salinity, and temperature extremes [50,53,54,55]. In cereals such as barley, the application of seaweed extracts has been associated with increases in grain yield and reductions in grain nitrogen content, suggesting a potential dual benefit for both yield and malting quality optimization [7].
Despite the promising results, the adoption of seaweed-based biostimulants in cereal production faces challenges. Variability in product composition, inconsistency in crop responses, and limited large-scale field data hinder broader commercial uptake (48,50]. Standardization of biostimulant formulations and rigorous agronomic validation under diverse field conditions are necessary to fully realize their potential benefits.
Building on the promising outcomes observed with the use of urease inhibitors and biostimulants in enhancing NUE, we hypothesize that further optimization of barley production sustainability can be achieved by integrating biostimulant applications with advanced nitrogen fertilization strategies. This hypothesis is grounded in evidence suggesting that biostimulants, particularly seaweed-based extracts, not only improve plant nutrient uptake and stress resilience but may also modulate grain protein concentration and increase grain yield under reduced nitrogen regimes [7,48,50]. Furthermore, combining biostimulants with enhanced efficiency fertilizers, such as those incorporating urease inhibitors, could synergistically reduce nitrogen losses while maintaining or even improving crop performance [24,25]. Therefore, the aim of this study was to evaluate the combined effects of applying a biostimulant (seaweed extract) and different nitrogen fertilization approaches (i.e., common urea, urea with a urease inhibitor) at different distinct growth stages of malting barley cultivation, under varying climatic conditions, focusing on both quantitative and qualitative characteristics.
2. Materials and Methods
2.1. Site Description
The experiments were carried out for two growing seasons (2022- 2023 and 2023-2024) in two areas of Thessaly with different climatic conditions, namely Farsala and Almyros, in commercial fields. Due to the different climatic conditions encountered in the two areas, the area of Farsala will be referred to as Environment 1 (E1) (39°15'44"N 22°28'34"E) and Environment 2 (E2) (39°14'57"N 22°29'34"E) for the growing seasons 2022- 2023 and 2023-2024, respectively. Similarly, for the Almyros area, Environment 3 (E3) (39°09'22"N 22°47'02"E) and Environment 4 (E4) (39°12'22"N 22°42'49"E) for the 2022- 2023 and 2023-2024 growing seasons, respectively. Sowing took place on 19 November, 20 November, 1 December and 2 December for E1, E2, E3 and E4, respectively. Seeding rate was 180 kg per hectare, with row spacing of 12 cm. Two malting barley genotypes were evaluated: G20 as early-maturing and G45 (Ackermann Saatzucht GmbH & Co. KG, Irlbach, Germany) as late-maturing. The previous cultivations were malting barley for E1 and E3, vetch and watermelon for E2 and E4, respectively. Soil properties are presented on Table 1. A total of 40 kg N/ha and 40 kg P2O5/ha were applied in basic fertilization (20-20-0 +22SO3), in all environments. Finally, harvest took place on 10 June 2023, 2 June 2024, 25 May 2023 and 25 May 2024 for E1, E2, E3 and E4, respectively, at seed moisture of 9% to 11.5%.
2.2. Treatments and Experimental Design
The experiments were arranged in a randomized complete block design (RCB), with three replicates in each treatment. The plot size for each treatment was 40 m2 in E1 and E2, and 39 meters in E3 and E4. The treatments applied as surface fertilization, were as follow: i) common sulfur urea (U), ii) common sulfur urea with addition of biostimulant (U + B), iii) urea with urease inhibitor (UI), iv) urea with urease inhibitor with addition of biostimulant (UI + B) and v) without surface fertilization as control. For the treatments using common sulfur urea 90kg N/ha was applied (40-0-0 +14SO3). For the treatments with urea with urease inhibitor, 7.5 kg N/ha were (40-0-0 + 5.7S) The biostimulant that was used came from Ascophyllum nodosum Extracts (ANE) from marine algae Goëmar GA142 (0-31-5). The dosage applied was 1L/ha with a 1:50 dilution.
The application of the biostimulant and surface fertilizer was conducted at the end of tillering (Z24) and at the beginning of stem elongation (Z30), respectively G45, and these will be considered as early stages of application. For G20, applications of biostimulant were performed at the beginning of stem elongation (Z30) and surface fertilization at mid-stem elongation (Z32), and these applications are considered to have been applied at mid-stages.
2.3. Measurements
2.3.1. Growth Rate
To determine the Growth Rate, phenology of two genotypes was monitored every 10 days for the beginning of tillering to the stage of anthesis and every 5 days from anthesis to harvesting, utilizing the scale of Zadoks et al., [56], following the average phenology in each plot.
2.3.2. Yield and Yield Components
To determine yield and its components, 6 quadrats of 0.25 m2 were manually sampled from its plot following a “Z” pattern. The data regarding aboveground biomass, Yield and Harvest Index (HI) were derived from these samples, subsequently converted to tn/ha. Spikes/m2 were determined from the samples in each plot. To determine the number of grains per spike, ten spikes were randomly chosen from each sample. The thousand grains weight (TGW) was determined from three samples per plot, consisting of 100 clean grains, which were counted, and their weigh was raised to 1000 grains. For the determination of yields and TGW the humidity of the grains was deduced to 11% in all samples.
2.3.3. Grain Size
Analytica EBC “Sieving test for Barley” method was used for the determination of grain size fraction using a screening machine equipped with three slotted sieves with different diameter (2.8mm, 2.5mm and 2.2mm). Three samples of 100g of grains per plot were placed on the top sieve (2.8mm) and shaken for 5 minutes. Then the grants that remained in each sieve were weighted in a presession scale (0.01g). Each sample followed a classification into three grain fractions: >2.8mm, >2.5mm (retention fraction) and >2.2mm (maltable fraction).
2.3.4. Grain Protein Content
Grain Protein Content (GPC) was determined, from 3 samples per plot and from measuring the nitrogen content using the Kjeldahl method and multiplying the results with factor 6.25.
2.4. Statistical Analysis
Prior to conducting ANOVA, standardised residuals were examined with the Shapiro-Wilk test to check whether the data follows normal distribution. This was followed by a general ANOVA on pooled data to determine the effects of Environments, Genotypes, Treatments and their interactions on the yield and qualitative traits, using Tukey's multiple range test. After Environment was identified as having a statistically significant effect on the traits examined, further ANOVA was conducted on the effect of the interaction in each environment. All statistical analyses were performed using STATA now 18 MP (StataCorp LLC, 2023). In addition, Principal Component Analysis (PCA) was performed to explore the multivariate structure of treatment responses across different environments and application stages in malting barley. The analysis included 10 agronomic and quality-related traits: aboveground biomass, grain yield, spikelets per square meter, thousand grain weight (TGW), harvest index (HI), grains per spike, grain protein content (GPC), maltable fraction, retention fraction, and grain size fraction >2.8 mm. Two separate Principal Component Analysis (PCA) were conducted corresponding to the two application stages of treatment: early stages and mid-stages. Each analysis included 80 observations, derived from factorial combinations of treatments, genotypes, and environments. Data visualization and modeling for PCA were performed using JMP Pro, version 18 (SAS Institute, 2023). Significant differences between treatment means were compared using the protected least significant difference (LSD) procedure at P<0,05.
3. Results
3.1. Meteorological Data
Regarding the climatic conditions, significant differences were observed between the regions and growing seasons. In the 2022-2023 growing season, E1 exhibited ideal conditions for malting barley cultivation, while at E3, the conditions were considered unfavorable for the Thessaly region (Figure 1A). E3, the average temperature was higher by 2.13°C to 5.32°C throughout the growing season compared to E1 (Figure 1A,C). Maximum temperature (Tmax) did not show significant differences between the two regions, with temperatures ranging from 9.21°C to 26.78°C at Environment 1 and from 10.2°C to 25.5°C at E3 (Figure 1A,C). In the second growing season, E4 presented more favorable conditions for the cultivation of barley. Regarding average air temperature (Tmean), no differences were found between the two regions, with temperatures ranging from 3.68°C to 24.3°C at E2 and from 4.13°C to 20.1°C at E4 (Figure 1D). The recorded total precipitation was 291,4mm, 258,7mm, 276mm and 334,4mm at E1,E2,E3 and E4, respectively (Figure 1A–D).
3.2. Impact of Treatments on Quantitative Traits
The statistical analysis revealed a significant effect of the environment on aboveground biomass, yield, harvest index (HI), number of spikelets per square meter, and the weight of thousand grains (TGW), but no significant effect on grains per spike (Table 2). Both genotypes and treatments had a significant impact on all quantitative traits (p-value < 0.01). Furthermore, interactions between the factors Environment*Genotype (G*E) significantly influenced all yield components (Table 2). The interactions of the factors Environment*Treatment (E*T) and Genotype*Treatment (G*T) did not affect aboveground biomass, HI, spikelets per square meter, and TGW (Table 2). The interaction of all three factors (E*G*T) played a significant role in aboveground biomass, yield, spikelets per square meter, and grains per spike.
Among the environments, E1 exhibited higher values for aboveground biomass, yield, spikelets per square meter, and TGW in G20 and G45. The lowest values for quantitative traits were observed in E4 for G45, and in E2 for G20 (Table 3). ANOVA conducted across environments revealed differences in the effects of genotypes and treatments on quantitative traits, with statistically significant differences in all cases (Table 3 and Table 4). HI in E1 was the trait that did not show significant differences in the G*T interaction (Table 3).
3.2.1. Effects of Biostimulant and Fertilization at Early Stages on Quantitative Traits
The biostimulant ANE and surface fertilization treatments were applied at the mid-tillering stage (Z24) and at the beginning of stem elongation (Z30), respectively, on G45. The UI+B treatment was the most effective across all environments. Specifically, in favorable conditions (E1), G45 showed increases compared to the control in aboveground biomass (53.88%), yield (64.94%), spikelets per square meter (47.4%), TGW (22.37%), and grains per spike (15.22%) (Table 3 and Table 4). In E4, which presented the lowest overall values, UI+B led to increases in G45 of 76.82% for aboveground biomass, 78.51% for yield, 50.37% for spikelets per square meter, 16.89% for TGW, and 9.61% for grains per spike.
Among the treatments U, U+B, and UI, no significant differences were observed for most quantitative traits across all environments. However, TGW exhibited statistically significant differences between UI and U in Environments 1 and 2 for G45. Additionally, a significant difference in yield between U and UI was observed for G45 in E4. Despite the limited statistical significance in many cases, there was a clear tendency for increases under the UI treatment, particularly in yield (up to 53.05%) and TGW (16.94%) in E1, and spikelets per square meter (up to 42.54%) in E4 (Table 3 and Table 4).
3.2.2. Effects of Biostimulant and Fertilization at Mid-Stages on Quantitative Traits
The biostimulant ANE was applied at the beginning of stem elongation (Z30-31), and surface fertilization at mid-stem elongation (Z32-33), on G20. In most cases, no significant differences were observed between treatments, with the exception of the control group. However, the UI+B and U+B treatments demonstrated the highest effectiveness for G20 across all environments.
Statistically significant differences were observed only for grains per spike in E1 and TGW in Environment 2, with UI+B showing the highest values for G20. Additionally, aboveground biomass and spikelets per square meter were consistently enhanced by the U+B treatment across all environments. The highest percentage increases for G20 were recorded in Environment 2, with aboveground biomass increasing by 89.82% and spikelets per square meter by 62.28% compared to the control. Under favorable conditions in E1, aboveground biomass and spikelets per square meter increased by 53.23% and 27.77%, respectively.
In contrast, yield, TGW, and grains per spike were most effectively enhanced by the UI+B treatment for G20. Specifically, in E1, UI+B led to increases of up to 45.06% in yield, 17.26% in TGW, and 12.24% in grains per spike compared to the control. In Environment 2, the same treatment significantly improved yield (92.22%), harvest index (HI) (17.78%), TGW (16.57%), and grains per spike (10.37%) for G20. In Environments 3 and 4, the UI+B treatment remained the most effective for G20. However, in E4, the control treatment exhibited the highest HI value for G20.
3.3. Impact of Treatments on Qualitative Traits
Ensuring the quality characteristics of malting barley cultivation is a primary objective for the brewing industry. Aiming to more precise investigation of the optimal fertilization scheme on the key qualitative traits (GPC and maltable fraction). Aiming to more precise investigation of the optimal fertilization scheme on the key qualitative traits (GPC and maltable fraction), there was evaluated beyond the desired criterion for malting ( > 2.2 mm), two advance criteria in terms the grain size. Specifically, grain sizes higher than 2.5 mm and 2.8 mm were considered. Statistical analysis revealed that all three factors (environment, genotype, and treatment) had a significant effect on all quality traits examined (p-value < 0.0001) (Table 5). Significant two-factor interactions (E*G, E*T, and G*T) were observed. Furthermore, three-factor interactions, as well as the interaction involving all factors, also showed significant effects on all quality traits (p-value < 0.0001) (Table 5).
An ANOVA was performed to evaluate the impact of genotypes and treatments on the qualitative traits in each environment. Both factors had a noticeable influence on GPC and grain size, with p-values < 0.0001 for both genotypes and treatments, except for genotype effects on maltable in E3 (p-values < 0.01). Statistically significant differences were observed for the interaction between genotypes and treatments (G*T), affecting all qualitative traits, except for maltable fraction in E3 (Table 6). Maltable fraction, retention fraction, and grain sizes larger than 2.8 mm were favored in Environments 1 and 3, while the lowest values were observed in E4 (Table 6). For GPC, E1 exhibited the highest values within the acceptable limits. In Environments 2, 3, and 4, there was no consistency observed for this characteristic. However, the UI+B treatment appeared to push GPC to the desired levels (Table 6).
Effects of Biostimulant and Fertilization at Mid-Stages on Qualitative Traits
The UI+B and U+B treatments had a more pronounced effect on the qualitative traits of the very early genotype G20, as the biostimulant ANE was applied at the beginning of stem elongation (Z30–31) and surface fertilization at mid-stem elongation (Z32–33). A differential response was observed between treatments, with G20 responding more favorably to UI+B. No statistically significant differences were observed between U, U+B, UI, and UI+B treatments for maltable grain content in G20, as all treatments met the industry-accepted limits across all environments. Under favorable conditions (E1), the UI+B treatment led to a 19.31% increase in grain size >2.8 mm and a 6.06% increase in retention fraction compared to the control (Table 6). The highest values for both traits were observed in E3. Although the lowest values for all grain size categories were recorded in E4, UI+B treatment still increased these values in G20 by 9.61% for maltable grain, 9.43% for retention fraction, and 9.28% for grain size >2.8 mm, relative to the control. Regarding grain protein content (GPC), G20 showed relative stability across all treatments (U, U+B, UI, UI+B), but only the UI+B treatment consistently met the acceptable GPC limits across all environments (Table 6).
Among the other treatments, U+B and UI had similar effects on grain quality traits in G20. Statistically significant differences were observed for grain size greater than 2.8 mm in E2 and E4, and for GPC in E2 and E3 (Table 6).
3.4. Principal Component Analysis
Principal Component Analysis (PCA) was conducted to assess the multivariate response of treatment effects on quantitative and qualitative traits when applied at early and mid-stages. The analysis was based on 10 quantitative traits, including: aboveground biomass, grain yield, spikelets per square meter, thousand grain weight (TGW), harvest index (HI), grains per spike, grain protein content (GPC), maltable fraction, retention fraction, and grain size fractions >2.8 mm. total of 80 observations were included in each analysis.
At the first application stage (Z30–31), the first two principal components explained 73.3% of the total variance (PC1: 55.5%, PC2: 17.8%) (Figure 2A). In the second stage (Z32–33), the total variance explained was 64.1% (PC1: 45.8%, PC2: 18.3%) (Figure 2B). In both PCAs, the control treatment (C) was clearly separated along PC1 from the other treatments, suggesting a consistently distinct performance pattern across multiple traits. Treatments including surface fertilization and/or biostimulants (U, UI, U+B, UI+B) clustered on the positive side of PC1, indicating a shared and favorable effect on early plant development.
At early stages, treatments formed a more compact cluster, indicating a uniform multivariate response to early application. In contrast, the PCA at mid-stages showed greater dispersion among treatments, particularly along PC2, suggesting the emergence of additional variation, possibly due to environment-dependent responses or genotype-by-treatment interactions (Figure 2B).
Overall, the PCA results suggest that biostimulant and fertilization treatments, particularly UI+B, consistently enhanced early plant performance regardless of application timing. However, application at earlier stages appeared to produce a more cohesive and pronounced multivariate response, underscoring the importance of timing in optimizing early crop vigor.
The results of the present study provide a detailed investigation of the impact of climatic conditions, treatment’s stage (represented by the different genotypes), and fertilization treatments, on both yield and quality traits of malting barley. Five treatments were applied: simple urea (U), U with biostimulant Ascophyllum nodosum extract (ANE) (U+B), urea with urease inhibitor (UI), UI combined with biostimulant ANE (UI+B), and control, without surface fertilization and ANE, across four environments, on two genotypes (G20 and G45). The findings underscore the complex interplay between environmental factors, genotypic characteristics, and agronomic practices in determining barley productivity and quality.
3.4.1. Impact of Environmental and Treatment Factors at Early Stages
Grain yield, in combination with key yield components such as aboveground biomass, harvest index (HI), spikelets m², and grains per spike, were used to measure and interpret the results [57]. In malting barley, aside from achieving high yields, specific quality criteria must be met regarding grain protein content (GPC) and grain size to satisfy industrial requirements. In terms of quality traits, the results of this study emphasize the importance of selecting the right genotype and fertilization strategy to meet the specific needs of the malting industry. Grain protein content (GPC) in malting barley is a critical quality trait, with an optimal range between 9.5% and 11.5%, while the retention fraction (proportion of grains larger than 2.5 mm) must exceed 90% [9].
In E1, more favorable climatic conditions were observed for G45, which exhibited the highest values for both quantitative and qualitative traits. The amount of rainfall (291.4 mm) and its distribution, combined with milder temperatures (Tmean = 11.17°C) during the growing season, and the low temperatures during the grain filling stage, made E1 the most ideal for malting barley cultivation, findings that align with existing literature [58,59].
Less favorable conditions prevailed in E4, where G45 had the lowest values for productive and quality traits. Although temperatures during the critical stages of growth were mild and rainfall (334.4 mm) was adequate, it is likely that the genotypes suffered from lodging after the rainfall (33.9 mm) that occurred in the first ten days of May (Figure 1D). The high-water availability during the vegetative stages of the crop led to an increase of the plants’ height due to the rate of cell division [60]. In contrast, in Environment 2, the lower rainfall during the vegetative stages, resulted shorter plants more resistant to lodging, especially during the greater rainfall in May in this environment. However, in E2 reduction in grain size was observed which may be attributed to drought stress during late grain filling, factor which restricts carbohydrate incorporation in the grain, leading to a decrease in grain size despite consistent total nitrogen content [19]. The sensitivity of barley cultivars to both temperature extremes and the timing of precipitation with impact on yield components and quality characteristics have also been stated from other researchers [61,62,63].
The application of the biostimulant ANE and surface fertilization at early stages, had a pronounced effect on both quantitative and qualitative traits, particularly on G45. Among the different treatments, UI+B showed the most consistent and significant improvements on traits like aboveground biomass, yield, and thousand-grain weight (TGW) across all environments. This occurred, even though the UI+B treated at the lower dose (15 kg N/ha), compared the simple urea treatments (U and U+B). The combination of urea with urease inhibitors (NBPT) and the biostimulant ANE has been extensively studied, with positive effects observed in crops [64,65,66,67]. However, little is known about how ANEs influence nitrogen (N) uptake and assimilation mechanisms under reduced N conditions [65,68]. The integration of biostimulants with current farming practices to enhance NUE may present challenges (e.g., method of application, timing, rates) in some production systems [65,69,70]. Nevertheless, the addition of ANE played a significant role in positively influencing plant growth, particularly by stimulating root development and nutrient uptake, likely facilitating the observed improvements in yield. Specifically, field experiments showed that foliar application of engineered ANE biostimulants maintained or increased grain yield in barley grown with 25% less N fertilizer [65]. Maignan et al., [71], report that ANE significantly improved grain yield (+3.59 tn/ha), total grain N, and NUE. ANE application improved growth during tillering and stem elongation increased the number of fertile tillers, grain number per m², and TGW [69,71,72].
Τhe positive effects of UI+B sign that this treatment can lead to reducing excessive N fertilizer application, by increasing the nutrient use efficiency (NUE), with ecological and economic benefits for the environment and the farmers respectively [73,74]. Similarly, Maignan et al., [71] and Abalos et al. [26], report that NBPT had a significantly positive effect on grain yield in barley and wheat, respectively. This may be due to the alkaline pH of the soil in all four areas, where the urease inhibitor NBPT had the most significant effect (Table 1) option which in in accordance with Abalos et al., [26]. Other studies show that the urease inhibitor (NBPT) in temperate grasslands reduce NH3 losses from surface-applied urea [18,75,76] and increase yield and N uptake [75,77]. Adding urease inhibitor NBPT to urea significantly increased yields and N uptake compared to standard urea, confirming the findings of previous studies [75,76,78,79].
Regarding qualitative traits such as grain protein content (GPC) and grain size, the application of treatments played a significant role in meeting malting industry standards. Specifically, the UI+B treatment resulted in notable improvements in grain size (greater than 2.8 mm) and retention fraction, which are critical for the malting process. In particular, E1 demonstrated the highest quality traits, with UI+B achieving significant increases in grain size and retention fraction. Similarly, in the less favorable E4, where lower values were observed for these traits, the combination of urease inhibitor and biostimulant (UI+B) treatment helped stabilize and elevate GPC to the desired levels. These findings demonstrate that the UI+B treatment has the potential to improve quality traits, even under less-than-ideal growing conditions. Additionally, the biostimulant, regardless of fertilizer type, led to increased grain size, with UI+B showing the most noteworthy improvements across all treatments. This suggests that the combination of urease inhibitor and biostimulant not only improves efficiency traits but also enhances malting quality by increasing grain plumpness. Furthermore, GPC remained stable across most treatments, with UI+B proving to be the most effective in maintaining GPC within the desired limits. This is particularly important for the brewing industry, as maintaining high-quality malting barley is essential for optimal beer production [80,81].
The aforementioned results are likely a consequence of ANE’s ability to generally stimulate root growth and increase the efficiency of soil nutrient absorption and utilization [82,83]. An increase in nutrient uptake efficiency was also observed in cereals (H. vulgare, Triticum aestivum/durum, Zea mays). In malting barley, a larger root system increases starch content and malt extract during the dry season [82,84]. In contrast, a weak root system under dry conditions leads to low grain yield and a significant deterioration in quality [82,84]. Moreover, Goettl et al. [85] report that N plays a role in grain size. However, the literature supports the notion that GPC is inversely associated with grain size [16,19]. This is because starch accumulation appears to be more sensitive to post-anthesis stress than nitrogen accumulation [19,86]. In this study, this claim was not confirmed, as climate conditions and genotype played a more important role [87,88,89]. It is worth noting that the addition of ANE improved plant tolerance in environments where stressful growing conditions prevailed, something which have been stated by other researchers [66,82,83,90]. The effects of biostimulants on plant defense and adaptation to abiotic stresses include, initially, the absorption (roots, foliage) and movement of biostimulant components to the action sites (cytoplasm, chloroplasts, mitochondria, nucleus), followed by the regulation of plant hormones. These hormones act as primary signaling molecules that trigger the expression of antioxidant defense genes, activation of secondary metabolism, osmotic regulation, hormonal signaling, as well as other physiological and morphological changes in plants [91].
3.4.2. Impact of Environmental and Treatment Factors at Mid-Stages
Similar to early stages, E1 had the most favorable conditions for G20. This genotype was at an earlier developmental stage compared to the others when surface fertilization occurred, with nitrogen (N) needs being high and the need for N uptake being immediate. Although nutrient and water uptake are independent processes, the connections between nutrients and water are adjacent and complex, as soil water availability affects the migration, transformation, and accumulation processes of crops [92,93,94].
Environment 2 and E4 were the most challenging for both genotypes in terms of yield and quality traits, respectively. Regarding quantitative traits, they were likely affected by the high temperatures that prevailed during the anthesis stages (Figure 1B,D), when pollination of the grains occurs. As a result, this stage may have lasted for a shorter duration, leading to a reduction in the number of grains per spike and lower yields (Table 4) [95,96,97]. In E4, the genotypes lodged (Lodging) due to intense rainfall in the first decade of May (33.9 mm), just before harvest. This contributed both to a drop in yields and, primarily, to a reduction in grain size (Table 5) [98].
At mid-stages, the results of this study highlight the impact of biostimulant treatments (UI+B and U+B) on the improvement of traits in G20, during their growth. The application of biostimulants at the beginning of stem elongation (Z30) and surface fertilization at mid-stem elongation (Z32) appears to have a significant positive effect on both quantitative and qualitative characteristics. This genotype-treatment interaction emphasizes the need to tailor treatment strategies to specific stages of application [99,100]. The UI+B treatment was more effective in improving yield and TGW for G20, but in a few cases, it showed statistically significant differences from U+B. The impact of urease inhibitors on yield is not always detectable, with Murray et al. [101] finding no differences in yield quantity and quality between fertilizer formulations. Qianqian Li et al. [73], report that NBPT decreased NH3 volatilization but did not significantly increase wheat grain yields. No specific study has determined the most efficient stages for applying urease inhibitor fertilizers to cereals. However, in barley, the ‘critical period’ for N concentration occurs immediately before heading, when the most relevant yield components are determined [102]. By this stage, N uptake by plants may be similar between the two forms of fertilizer applied in surface fertilization. The absence of major changes in these traits suggests that, while surface fertilization and biostimulants can influence specific aspects of plant development, other factors such as timing of fertilization [26] and environmental conditions [25,94] may have played a more dominant role in determining these characteristics.
Moreover, fast-developing genotypes like G20, later application of treatments may not provide as much benefit in terms of yield enhancement compared to slower-developing varieties. Sun et al. [103] note that fertilization timing significantly affected plant height, aboveground biomass, grain yield, and leaf area index in wheat in China. The same results were observed by Kostić et al. [104], who concluded that the timing of N application had a highly significant effect on grain yield, biomass, and NUE traits. The type of fertilizer also plays a significant role in the effectiveness of surface fertilization. Fertilizers with urease inhibitors release N at a lower rate than those with plain urea [105,106], and thus, applying them at late stages of malting barley cultivation does not have a positive effect due to the lack of available N for crops. Resources that limit crop growth during stem elongation are allocated to the survival of tillers (improving spikelets per square meter), meaning there will be fewer resources available per spike, leading to a trade-off in grains/spike and vice versa [107].
In these experiments, the application of Ascophyllum nodosum extract between tillering and stem elongation showed positive effects on quantitative traits. Similarly, Hřivna et al. [82], report that the best phases of vegetation growth for biostimulant applications were during barley tillering and elongation. This application improved crop growth while reducing the amount of N required to achieve similar or higher yields of barley yield components compared to high-N treatments. The positive effects are linked to phytohormones such as auxins, cytokinins, abscisic acid, and substances with similar effects [66,82,83,90]. Cytokinins play a critical role in promoting cell division and modifying apical dominance [55], while auxins improve cell elongation and promote stem growth [108]. However, to date, no research has been published that examines the differences in the effects of ANE between stages with such high precision across stages in cereals.
The results for maltable fraction showed no statistically significant differences between the treatments (U, U+B, UI, UI+B) for G20, with all treatments meeting the industry-accepted limits across all environments. This suggests that while different treatments may enhance other parameters, they do not negatively affect maltable grain quality. This finding is likely due to the fact that the genotypes tested in this study have been evaluated over several years and selected among many others, often meeting the desired brewing quality characteristics [109].
For the G20, the UI+B treatment was particularly effective under favorable conditions (E1), leading to a 19.31% increase in grain size greater than 2.8 mm and a 6.06% increase in retention fraction compared to the control. The effects of biostimulants on plant nutrition and defense under stress, according to Akhter et al. [110], Lephatsi et al. [111], and Nephali et al. [91], are the result of their ability to activate signaling mechanisms for external danger detection, which were integrated into the plant genome during evolution as memory genes for responding to environmental stress signals.
Regarding GPC, G20 showed relative stability across all treatments (U, U+B, UI, UI+B). However, only the UI+B treatment met the acceptable GPC limits across all environments. This indicates that UI+B not only improves quality traits related to grain plumpness but also ensures stability in protein content, which is crucial for both quality assurance and market acceptance. This genotype may be more resilient to climatic variations, making it a suitable candidate for stable malting barley production. In recent studies, genotypes with heavier and plumper grains under high temperatures exhibited a higher grain filling rate, longer grain-filling duration, extended retention of green leaf area, increased water-soluble carbohydrate content, taller stature, smaller leaf size, greater grain weight/plumpness potential, and earlier flowering [112,113].
The PCA results highlight the consistent influence of combined biostimulant and fertilization treatments, particularly UI+B, on early plant performance. The distinct separation of the control treatment along PC1 in both application stages suggests that PCA successfully captured the impact of inputs on multiple early growth traits. Interestingly, treatment effects were more cohesive at the earlier application, supporting the hypothesis that early intervention can have a stronger and more uniform impact on plant vigor. This aligns with findings from previous studies, which demonstrated that early-stage application of seaweed extracts or humic substances can promote tillering, improve early biomass accumulation, and enhance root development [44,114].
The increased dispersion among treatments in the second application stage may indicate greater interaction between treatment effects and the physiological status of the plants or environmental variation, which often becomes more pronounced as development progresses. PCA thus proved to be a valuable exploratory tool for assessing the overall structure of treatment effects on early development, revealing both shared and stage-specific responses. These insights may guide future decisions on the optimal timing and combination of biostimulant inputs in cereal production systems.
4. Discussion
The results of the present study provide a detailed investigation of the impact of climatic conditions, treatment’s stage (represented by the different genotypes), and fertilization treatments, on both yield and quality traits of malting barley. Five treatments were applied: simple urea (U), U with biostimulant Ascophyllum nodosum extract (ANE) (U+B), urea with urease inhibitor (UI), UI combined with biostimulant ANE (UI+B), and control, without surface fertilization and ANE, across four environments, on two genotypes (G20 and G45). The findings underscore the complex interplay between environmental factors, genotypic characteristics, and agronomic practices in determining barley productivity and quality.
4.1. Impact of Environmental and Treatment Factors at Early Stages
Grain yield, in combination with key yield components such as aboveground biomass, harvest index (HI), spikelets m², and grains per spike, were used to measure and interpret the results [57]. In malting barley, aside from achieving high yields, specific quality criteria must be met regarding grain protein content (GPC) and grain size to satisfy industrial requirements. In terms of quality traits, the results of this study emphasize the importance of selecting the right genotype and fertilization strategy to meet the specific needs of the malting industry. Grain protein content (GPC) in malting barley is a critical quality trait, with an optimal range between 9.5% and 11.5%, while the retention fraction (proportion of grains larger than 2.5 mm) must exceed 90% [9].
In E1, more favorable climatic conditions were observed for G45, which exhibited the highest values for both quantitative and qualitative traits. The amount of rainfall (291.4 mm) and its distribution, combined with milder temperatures (Tmean = 11.17°C) during the growing season, and the low temperatures during the grain filling stage, made E1 the most ideal for malting barley cultivation, findings that align with existing literature [58,59].
Less favorable conditions prevailed in E4, where G45 had the lowest values for productive and quality traits. Although temperatures during the critical stages of growth were mild and rainfall (334.4 mm) was adequate, it is likely that the genotypes suffered from lodging after the rainfall (33.9 mm) that occurred in the first ten days of May (Figure 1D). The high-water availability during the vegetative stages of the crop led to an increase of the plants’ height due to the rate of cell division [60]. In contrast, in Environment 2, the lower rainfall during the vegetative stages, resulted shorter plants more resistant to lodging, especially during the greater rainfall in May in this environment. However, in E2 reduction in grain size was observed which may be attributed to drought stress during late grain filling, factor which restricts carbohydrate incorporation in the grain, leading to a decrease in grain size despite consistent total nitrogen content [19]. The sensitivity of barley cultivars to both temperature extremes and the timing of precipitation with impact on yield components and quality characteristics have also been stated from other researchers [61,62,63].
The application of the biostimulant ANE and surface fertilization at early stages, had a pronounced effect on both quantitative and qualitative traits, particularly on G45. Among the different treatments, UI+B showed the most consistent and significant improvements on traits like aboveground biomass, yield, and thousand-grain weight (TGW) across all environments. This occurred, even though the UI+B treated at the lower dose (15 kg N/ha), compared the simple urea treatments (U and U+B). The combination of urea with urease inhibitors (NBPT) and the biostimulant ANE has been extensively studied, with positive effects observed in crops [64,65,66,67]. However, little is known about how ANEs influence nitrogen (N) uptake and assimilation mechanisms under reduced N conditions [65,68]. The integration of biostimulants with current farming practices to enhance NUE may present challenges (e.g., method of application, timing, rates) in some production systems [65,69,70]. Nevertheless, the addition of ANE played a significant role in positively influencing plant growth, particularly by stimulating root development and nutrient uptake, likely facilitating the observed improvements in yield. Specifically, field experiments showed that foliar application of engineered ANE biostimulants maintained or increased grain yield in barley grown with 25% less N fertilizer [65]. Maignan et al., [71], report that ANE significantly improved grain yield (+3.59 tn/ha), total grain N, and NUE. ANE application improved growth during tillering and stem elongation increased the number of fertile tillers, grain number per m², and TGW [69,71,72].
Τhe positive effects of UI+B sign that this treatment can lead to reducing excessive N fertilizer application, by increasing the nutrient use efficiency (NUE), with ecological and economic benefits for the environment and the farmers respectively [73,74]. Similarly, Maignan et al., [71] and Abalos et al. [26], report that NBPT had a significantly positive effect on grain yield in barley and wheat, respectively. This may be due to the alkaline pH of the soil in all four areas, where the urease inhibitor NBPT had the most significant effect (Table 1) option which in in accordance with Abalos et al., [26]. Other studies show that the urease inhibitor (NBPT) in temperate grasslands reduce NH3 losses from surface-applied urea [18,75,76] and increase yield and N uptake [75,77]. Adding urease inhibitor NBPT to urea significantly increased yields and N uptake compared to standard urea, confirming the findings of previous studies [75,76,78,79].
Regarding qualitative traits such as grain protein content (GPC) and grain size, the application of treatments played a significant role in meeting malting industry standards. Specifically, the UI+B treatment resulted in notable improvements in grain size (greater than 2.8 mm) and retention fraction, which are critical for the malting process. In particular, E1 demonstrated the highest quality traits, with UI+B achieving significant increases in grain size and retention fraction. Similarly, in the less favorable E4, where lower values were observed for these traits, the combination of urease inhibitor and biostimulant (UI+B) treatment helped stabilize and elevate GPC to the desired levels. These findings demonstrate that the UI+B treatment has the potential to improve quality traits, even under less-than-ideal growing conditions. Additionally, the biostimulant, regardless of fertilizer type, led to increased grain size, with UI+B showing the most noteworthy improvements across all treatments. This suggests that the combination of urease inhibitor and biostimulant not only improves efficiency traits but also enhances malting quality by increasing grain plumpness. Furthermore, GPC remained stable across most treatments, with UI+B proving to be the most effective in maintaining GPC within the desired limits. This is particularly important for the brewing industry, as maintaining high-quality malting barley is essential for optimal beer production [80,81].
The aforementioned results are likely a consequence of ANE’s ability to generally stimulate root growth and increase the efficiency of soil nutrient absorption and utilization [82,83]. An increase in nutrient uptake efficiency was also observed in cereals (H. vulgare, Triticum aestivum/durum, Zea mays). In malting barley, a larger root system increases starch content and malt extract during the dry season [82,84]. In contrast, a weak root system under dry conditions leads to low grain yield and a significant deterioration in quality [82,84]. Moreover, Goettl et al. [85] report that N plays a role in grain size. However, the literature supports the notion that GPC is inversely associated with grain size [16,19]. This is because starch accumulation appears to be more sensitive to post-anthesis stress than nitrogen accumulation [19,86]. In this study, this claim was not confirmed, as climate conditions and genotype played a more important role [87,88,89]. It is worth noting that the addition of ANE improved plant tolerance in environments where stressful growing conditions prevailed, something which have been stated by other researchers [66,82,83,90]. The effects of biostimulants on plant defense and adaptation to abiotic stresses include, initially, the absorption (roots, foliage) and movement of biostimulant components to the action sites (cytoplasm, chloroplasts, mitochondria, nucleus), followed by the regulation of plant hormones. These hormones act as primary signaling molecules that trigger the expression of antioxidant defense genes, activation of secondary metabolism, osmotic regulation, hormonal signaling, as well as other physiological and morphological changes in plants [91].
4.2. Impact of Environmental and Treatment Factors at Mid-Stages
Similar to early stages, E1 had the most favorable conditions for G20. This genotype was at an earlier developmental stage compared to the others when surface fertilization occurred, with nitrogen (N) needs being high and the need for N uptake being immediate. Although nutrient and water uptake are independent processes, the connections between nutrients and water are adjacent and complex, as soil water availability affects the migration, transformation, and accumulation processes of crops [92,93,94].
Environment 2 and E4 were the most challenging for both genotypes in terms of yield and quality traits, respectively. Regarding quantitative traits, they were likely affected by the high temperatures that prevailed during the anthesis stages (Figure 1B,D), when pollination of the grains occurs. As a result, this stage may have lasted for a shorter duration, leading to a reduction in the number of grains per spike and lower yields (Table 4) [95,96,97]. In E4, the genotypes lodged (Lodging) due to intense rainfall in the first decade of May (33.9 mm), just before harvest. This contributed both to a drop in yields and, primarily, to a reduction in grain size (Table 5) [98].
At mid-stages, the results of this study highlight the impact of biostimulant treatments (UI+B and U+B) on the improvement of traits in G20, during their growth. The application of biostimulants at the beginning of stem elongation (Z30) and surface fertilization at mid-stem elongation (Z32) appears to have a significant positive effect on both quantitative and qualitative characteristics. This genotype-treatment interaction emphasizes the need to tailor treatment strategies to specific stages of application [99,100]. The UI+B treatment was more effective in improving yield and TGW for G20, but in a few cases, it showed statistically significant differences from U+B. The impact of urease inhibitors on yield is not always detectable, with Murray et al. [101] finding no differences in yield quantity and quality between fertilizer formulations. Qianqian Li et al. [73], report that NBPT decreased NH3 volatilization but did not significantly increase wheat grain yields. No specific study has determined the most efficient stages for applying urease inhibitor fertilizers to cereals. However, in barley, the ‘critical period’ for N concentration occurs immediately before heading, when the most relevant yield components are determined [102]. By this stage, N uptake by plants may be similar between the two forms of fertilizer applied in surface fertilization. The absence of major changes in these traits suggests that, while surface fertilization and biostimulants can influence specific aspects of plant development, other factors such as timing of fertilization [26] and environmental conditions [25,94] may have played a more dominant role in determining these characteristics.
Moreover, fast-developing genotypes like G20, later application of treatments may not provide as much benefit in terms of yield enhancement compared to slower-developing varieties. Sun et al. [103] note that fertilization timing significantly affected plant height, aboveground biomass, grain yield, and leaf area index in wheat in China. The same results were observed by Kostić et al. [104], who concluded that the timing of N application had a highly significant effect on grain yield, biomass, and NUE traits. The type of fertilizer also plays a significant role in the effectiveness of surface fertilization. Fertilizers with urease inhibitors release N at a lower rate than those with plain urea [105,106], and thus, applying them at late stages of malting barley cultivation does not have a positive effect due to the lack of available N for crops. Resources that limit crop growth during stem elongation are allocated to the survival of tillers (improving spikelets per square meter), meaning there will be fewer resources available per spike, leading to a trade-off in grains/spike and vice versa [107].
In these experiments, the application of Ascophyllum nodosum extract between tillering and stem elongation showed positive effects on quantitative traits. Similarly, Hřivna et al. [82], report that the best phases of vegetation growth for biostimulant applications were during barley tillering and elongation. This application improved crop growth while reducing the amount of N required to achieve similar or higher yields of barley yield components compared to high-N treatments. The positive effects are linked to phytohormones such as auxins, cytokinins, abscisic acid, and substances with similar effects [66,82,83,90]. Cytokinins play a critical role in promoting cell division and modifying apical dominance [55], while auxins improve cell elongation and promote stem growth [108]. However, to date, no research has been published that examines the differences in the effects of ANE between stages with such high precision across stages in cereals.
The results for maltable fraction showed no statistically significant differences between the treatments (U, U+B, UI, UI+B) for G20, with all treatments meeting the industry-accepted limits across all environments. This suggests that while different treatments may enhance other parameters, they do not negatively affect maltable grain quality. This finding is likely due to the fact that the genotypes tested in this study have been evaluated over several years and selected among many others, often meeting the desired brewing quality characteristics [109].
For the G20, the UI+B treatment was particularly effective under favorable conditions (E1), leading to a 19.31% increase in grain size greater than 2.8 mm and a 6.06% increase in retention fraction compared to the control. The effects of biostimulants on plant nutrition and defense under stress, according to Akhter et al. [110], Lephatsi et al. [111], and Nephali et al. [91], are the result of their ability to activate signaling mechanisms for external danger detection, which were integrated into the plant genome during evolution as memory genes for responding to environmental stress signals.
Regarding GPC, G20 showed relative stability across all treatments (U, U+B, UI, UI+B). However, only the UI+B treatment met the acceptable GPC limits across all environments. This indicates that UI+B not only improves quality traits related to grain plumpness but also ensures stability in protein content, which is crucial for both quality assurance and market acceptance. This genotype may be more resilient to climatic variations, making it a suitable candidate for stable malting barley production. In recent studies, genotypes with heavier and plumper grains under high temperatures exhibited a higher grain filling rate, longer grain-filling duration, extended retention of green leaf area, increased water-soluble carbohydrate content, taller stature, smaller leaf size, greater grain weight/plumpness potential, and earlier flowering [112,113].
The PCA results highlight the consistent influence of combined biostimulant and fertilization treatments, particularly UI+B, on early plant performance. The distinct separation of the control treatment along PC1 in both application stages suggests that PCA successfully captured the impact of inputs on multiple early growth traits. Interestingly, treatment effects were more cohesive at the earlier application, supporting the hypothesis that early intervention can have a stronger and more uniform impact on plant vigor. This aligns with findings from previous studies, which demonstrated that early-stage application of seaweed extracts or humic substances can promote tillering, improve early biomass accumulation, and enhance root development [44,114].
The increased dispersion among treatments in the second application stage may indicate greater interaction between treatment effects and the physiological status of the plants or environmental variation, which often becomes more pronounced as development progresses. PCA thus proved to be a valuable exploratory tool for assessing the overall structure of treatment effects on early development, revealing both shared and stage-specific responses. These insights may guide future decisions on the optimal timing and combination of biostimulant inputs in cereal production systems.
5. Conclusions
This study highlights the critical influence of environmental conditions, genotype characteristics, and nitrogen management strategies on the productivity and quality of malting barley. The combination of urease inhibitor-treated urea and a seaweed-based biostimulant (UI+B) consistently improved grain yield and grain size, while maintaining grain protein concentration (GPC) within industry-acceptable limits across diverse environments. At early application stages (Z24–Z30), the UI+B treatment was particularly effective for G45, significantly enhancing both yield and qualitative traits even under challenging climatic conditions. Conversely, mid-stage applications (Z30–33) demonstrated a genotype-dependent effect, with UI+B benefiting G20. Principal Component Analysis (PCA) underscored the importance of treatment timing and genotype adaptability in differentiating multivariate performance patterns. The PCA effectively revealed distinct separation between the control and treated samples, with UI+B-treated plots consistently clustering based on favorable agronomic and quality traits. While biostimulant application consistently improved grain plumpness, treatment efficacy varied depending on the phenological stage and environmental stress conditions. Overall, the integration of biostimulants with enhanced-efficiency fertilizers offers a promising agronomic strategy for improving barley yield and malting quality, while also supporting more sustainable nitrogen management. Future research should aim to refine biostimulant application protocols, deepen understanding of genotype-specific responses, and validate these findings under a broader range of environmental conditions to further optimize malting barley production systems.
Author Contributions
Conceptualization, L.O.L.; methodology, K.G. and P.P.; validation, L.O.L. and K.G.; formal analysis, L.O.L. and K.S.; investigation, L.O.L.; data curation, L.O.L. and E.G.; writing—original draft preparation, L.O.L.; writing—review and editing, L.O.L. and K.G.; visualization, T.K.; supervision, G.E. and P.P.; project administration, G.E.; funding acquisition, V.K. All authors have read and agreed to the published version of the manuscript.
Funding
This research was funded by Athenian Brewery S.A. and CLIMPACT (support for enhancing the operation of the National Network for Climate Change), financed by the National Development Program, General Secretariat of Research and Innovation, Greece (2023NA11900001). The APC was funded by Athenian Brewery S.A and CLIMPACT.
Data Availability Statement
The data presented in this study are available upon request from the corresponding author.
Conflicts of Interest
Author V.K. was employed by the company Athenian Brewery S.A. The remaining authors declare that the research was conducted in the absence of any commercial or financial relationships that could be construed as a potential conflict of interest. The authors declare that this study received funding from Athenian Brewery S.A. and CLIMPACT. The funder was not involved in the study design, collection, analysis, interpretation of data, the writing of this article, or the decision to submit it for publication.
Abbreviations
The following abbreviations are used in this manuscript:
| GPC | Grain Protein Content |
| UI | Urease Inhibitor |
| UI+B | Urea with Urease Inhibitor and Biostimulan |
| U | Urea |
| U+B | Urea with Biostimulant |
| ANE | Ascophyllum nodosum Extract |
| TGW | Thousand Grain Weight |
| RCB | Randomized Complete Block design |
| PCA | Principal Component Analysis |
| LSD | Least Significant Difference |
| E1, E2, E3, E4 | Experimental Environments (different locations/seasons in Thessaly) |
References
- El-Hashash, E.F.; El-Absy, K.M. Barley (Hordeum vulgare L.) breeding. In Adv. Plant Breed. Strateg.: Cereals, Vol. 5; Springer International Publishing: Cham, Switzerland, 2019; pp. 1–45. [Google Scholar] [CrossRef]
- Kaur, A.; Purewal, S.S.; Phimolsiripol, Y.; Punia Bangar, S. Unraveling the hidden potential of barley (Hordeum vulgare): An important review. Plants 2024, 13, 2421. [Google Scholar] [CrossRef]
- Fox, G.P.; Bettenhausen, H.M. Variation in quality of grains used in malting and brewing. Front. Plant Sci. 2023, 14, 1172028. [Google Scholar] [CrossRef]
- Vahamidis, P.; Stefopoulou, A.; Kotoulas, V.; Lyra, D.; Dercas, N.; Economou, G. Yield, grain size, protein content and water use efficiency of null-LOX malt barley in a semiarid Mediterranean agroecosystem. Field Crops Res. 2017, 206, 115–127. [Google Scholar] [CrossRef]
- Vahamidis, P.; Stefopoulou, A.; Kotoulas, V.; Voloudakis, D.; Dercas, N.; Economou, G. A further insight into the environmental factors determining potential grain size in malt barley under Mediterranean conditions. Eur. J. Agron. 2021, 122, 126184. [Google Scholar] [CrossRef]
- Li, Y.; Schwarz, P.B.; Barr, J.M.; Horsley, R.D. Factors predicting malt extract within a single barley cultivar. J. Cereal Sci. 2008, 48, 531–538. [Google Scholar] [CrossRef]
- Cozzolino, E.; Di Mola, I.; Ottaiano, L.; Nocerino, S.; Sifola, M.I.; El-Nakhel, C.; Rouphael, E.; Mori, M. Can seaweed extract improve yield and quality of brewing barley subjected to different levels of nitrogen fertilization? Agronomy 2021, 11, 2481. [Google Scholar] [CrossRef]
- Asres, T.; Tadesse, D.; Wossen, T.; Sintayehu, A. Performance evaluation of malt barley: From malting quality and breeding perspective. J. Crop Sci. Biotechnol. 2018, 21, 451–457. [Google Scholar] [CrossRef]
- Beillouin, D.; Leclere, M.; Barbu, C.M.; Benezit, M.; Trépos, R.; Gauffreteau, A.; Jeuffroy, M.H. Azodyn-Barley, a winter-barley crop model for predicting and ranking genotypic yield, grain protein and grain size in contrasting pedoclimatic conditions. Agric. For. Meteorol. 2018, 262, 237–248. [Google Scholar] [CrossRef]
- Vahamidis, P.; Stefopoulou, A.; Kotoulas, V.; Bresta, P.; Nikolopoulos, D.; Karabourniotis, G.; Mantonakis, G.; Vlachos, C.; Dercas, N.; Economou, G. Grain size variation in two-rowed malt barley under Mediterranean conditions: Phenotypic plasticity and relevant trade-offs. Field Crops Res. 2022, 279, 108454. [Google Scholar] [CrossRef]
- Yin Tan, W.; Li, M.; Devkota, L.; Attenborough, E.; Dhital, S. Mashing performance as a function of malt particle size in beer production. Crit. Rev. Food Sci. Nutr. 2023, 63, 5372–5387. [Google Scholar] [CrossRef]
- Peltonen-Sainio, P.; Jauhiainen, L.; Sadras, V.O. Phenotypic plasticity of yield and agronomic traits in cereals and rapeseed at high latitudes. Field Crops Res. 2011, 124, 261–269. [Google Scholar] [CrossRef]
- Sadras, V.O.; Mahadevan, M.; Zwer, P.K. Oat phenotypes for drought adaptation and yield potential. Field Crops Res. 2017, 212, 135–144. [Google Scholar] [CrossRef]
- van Bergen, E.; Atencio, G.; Saastamoinen, M.; Beldade, P. Thermal plasticity in protective wing pigmentation is modulated by genotype and food availability in an insect model of seasonal polyphenism. Funct. Ecol. 2024, 38, 1765–1778. [Google Scholar] [CrossRef]
- Kusmec, A.; de Leon, N.; Schnable, P.S. Harnessing phenotypic plasticity to improve maize yields. Front. Plant Sci. 2018, 9, 1377. [Google Scholar] [CrossRef]
- Yu, W.; Tan, X.; Zou, W.; Hu, Z.; Fox, G.P.; Gidley, M.J.; Gilbert, R.G. Relationships between protein content, starch molecular structure and grain size in barley. Carbohydr. Polym. 2017, 155, 271–279. [Google Scholar] [CrossRef]
- Tabak, M.; Lepiarczyk, A.; Filipek-Mazur, B.; Lisowska, A. Efficiency of nitrogen fertilization of winter wheat depending on sulfur fertilization. Agronomy 2020, 10, 1304. [Google Scholar] [CrossRef]
- Gupta, S.; Yildirim, S.; Andrikopoulos, B.; Wille, U.; Roessner, U. Deciphering the interactions in the root–soil nexus caused by urease and nitrification inhibitors: A review. Agronomy 2023, 13, 1603. [Google Scholar] [CrossRef]
- Vahamidis, P.; Stefopoulou, A.; Kotoulas, V. Optimizing sustainability in malting barley: A practical approach to nitrogen management for enhanced environmental, agronomic, and economic benefits. Agriculture 2023, 13, 2272. [Google Scholar] [CrossRef]
- Kumar, R.; Bordoloi, N. Role of slow-release fertilizers and nitrification inhibitors in greenhouse gas nitrous oxide (N₂O) emission reduction from rice–wheat agroecosystem. In Agric. Greenh. Gas Emiss.: Probl. Solut.; Elsevier: Amsterdam, The Netherlands, 2024; pp. 245–259. [Google Scholar] [CrossRef]
- Hassan, M.U.; Aamer, M.; Mahmood, A.; Awan, M.I.; Barbanti, L.; Seleiman, M.F.; Bakhsh, G.; Alkharabsheh, H.M.; Babur, E.; Shao, J.; Rasheed, A.; Huang, G. Management strategies to mitigate N₂O emissions in agriculture. Life 2022, 12, 439. [Google Scholar] [CrossRef]
- Tremblay, N.; Belec, C. Adapting nitrogen fertilization to unpredictable seasonal conditions with the least impact on the environment. HortTechnology 2006, 16, 408. [Google Scholar] [CrossRef]
- He, P.; Xu, X.; Zhou, W.; Smith, W.; He, W.; Grant, B.; Ding, W.; Qiu, S.; Zhao, S. Ensuring future agricultural sustainability in China utilizing an observationally validated nutrient recommendation approach. Eur. J. Agron. 2022, 132, 126409. [Google Scholar] [CrossRef]
- Nikolajsen, M.T.; Pacholski, A.S.; Sommer, S.G. Urea ammonium nitrate solution treated with inhibitor technology: Effects on ammonia emission reduction, wheat yield, and inorganic N in soil. Agronomy 2020, 10, 161. [Google Scholar] [CrossRef]
- Allende-Montalbán, R.; Martín-Lammerding, D.; Delgado, M.D.M.; Porcel, M.A.; Gabriel, J.L. Urease inhibitors effects on the nitrogen use efficiency in a maize–wheat rotation with or without water deficit. Agriculture 2021, 11, 684. [Google Scholar] [CrossRef]
- Abalos, D.; Jeffery, S.; Sanz-Cobena, A.; Guardia, G.; Vallejo, A. Meta-analysis of the effect of urease and nitrification inhibitors on crop productivity and nitrogen use efficiency. Agric. Ecosyst. Environ. 2014, 189, 136–144. [Google Scholar] [CrossRef]
- Dimkpa, C.O.; Fugice, J.; Singh, U.; Lewis, T.D. Development of fertilizers for enhanced nitrogen use efficiency – Trends and perspectives. Sci. Total Environ. 2020, 731, 139113. [Google Scholar] [CrossRef]
- Liu, S.; Wang, X.; Yin, X.; Savoy, H.J.; McClure, A.; Essington, M.E. Ammonia volatilization loss and corn nitrogen nutrition and productivity with efficiency enhanced UAN and urea under no-tillage. Sci. Rep. 2019, 9, 6610. [Google Scholar] [CrossRef] [PubMed]
- Woodley, A.L.; Drury, C.F.; Yang, X.Y.; Phillips, L.A.; Reynolds, D.W.; Calder, W.; Oloya, T.O. Ammonia volatilization, nitrous oxide emissions, and corn yields as influenced by nitrogen placement and enhanced efficiency fertilizers. Soil Sci. Soc. Am. J. 2020, 84, 1327–1341. [Google Scholar] [CrossRef]
- Anbessa, Y.; Juskiw, P. Nitrogen fertilizer rate and cultivar interaction effects on nitrogen recovery, utilization efficiency, and agronomic performance of spring barley. Int. Sch. Res. Not. 2012, 2012, 531647. [Google Scholar] [CrossRef]
- Lynch, J.P. Steep, cheap and deep: An ideotype to optimize water and N acquisition by maize root systems. Ann. Bot. 2013, 112, 347–357. [Google Scholar] [CrossRef]
- Reynolds, M.; Foulkes, M.J.; Slafer, G.A.; Berry, P.; Parry, M.A.; Snape, J.W.; Angus, W.J. Raising yield potential in wheat. J. Exp. Bot. 2009, 60, 1899–1918. [Google Scholar] [CrossRef] [PubMed]
- Khush, G.S. Green revolution: The way forward. Nat. Rev. Genet. 2001, 2, 815–822. [Google Scholar] [CrossRef]
- Croce, R.; Carmo-Silva, E.; Cho, Y.B.; Ermakova, M.; Harbinson, J.; Lawson, T.; Zhu, X.G. Perspectives on improving photosynthesis to increase crop yield. Plant Cell 2024, 36, 3944–3973. [Google Scholar] [CrossRef]
- Schuster, A.; Santana, A.S.; Uberti, A.; Dias, F.D.S.; Dos Reis, H.M.; Destro, V.; DeLima, R.O. Genetic diversity, relationships among traits and selection of tropical maize inbred lines for low-P tolerance based on root and shoot traits at seedling stage. Front. Plant Sci. 2024, 15, 1429901. [Google Scholar] [CrossRef]
- Feng, H.; Fan, X.; Miller, A.J.; Xu, G. Plant nitrogen uptake and assimilation: Regulation of cellular pH homeostasis. J. Exp. Bot. 2020, 71, 4380–4392. [Google Scholar] [CrossRef]
- Sandhu, N.; Sethi, M.; Kumar, A.; Dang, D.; Singh, J.; Chhuneja, P. Biochemical and genetic approaches improving nitrogen use efficiency in cereal crops: A review. Front. Plant Sci. 2021, 12, 657629. [Google Scholar] [CrossRef]
- Masclaux-Daubresse, C.; Daniel-Vedele, F.; Dechorgnat, J.; Chardon, F.; Gaufichon, L.; Suzuki, A. Nitrogen uptake, assimilation and remobilization in plants: Challenges for sustainable and productive agriculture. Ann. Bot. 2010, 105, 1141–1157. [Google Scholar] [CrossRef]
- Perchlik, M.; Tegeder, M. Improving plant nitrogen use efficiency through alteration of amino acid transport processes. Plant Physiol. 2017, 175, 235–247. [Google Scholar] [CrossRef] [PubMed]
- Chen, K.E.; Chen, H.Y.; Tseng, C.S.; Tsay, Y.F. Improving nitrogen use efficiency by manipulating nitrate remobilization in plants. Nat. Plants 2020, 6, 1126–1135. [Google Scholar] [CrossRef]
- Singh, O.V.; Ghai, S.; Paul, D.; Jain, R.K. Genetically modified crops: success, safety assessment, and public concern. Appl. Microbiol. Biotechnol. 2006, 71, 598–607. [Google Scholar] [CrossRef] [PubMed]
- Wang, W.; Hu, B.; Yuan, D.; Liu, Y.; Che, R.; Hu, Y.; Chu, C. Expression of the nitrate transporter gene OsNRT1.1A/OsNPF6.3 confers high yield and early maturation in rice. Plant Cell 2018, 30, 638–651. [Google Scholar] [CrossRef] [PubMed]
- Di Sario, L.; Boeri, P.; Matus, J.T.; Pizzio, G.A. Plant biostimulants to enhance abiotic stress resilience in crops. Int. J. Mol. Sci. 2025, 26, 1129. [Google Scholar] [CrossRef] [PubMed]
- Du Jardin, P. Plant biostimulants: Definition, concept, main categories and regulation. Sci. Hortic. 2015, 196, 3–14. [Google Scholar] [CrossRef]
- Van Oosten, M.J.; Pepe, O.; De Pascale, S.; Silletti, S.; Maggio, A. The role of biostimulants and bioeffectors as alleviators of abiotic stress in crop plants. Chem. Biol. Technol. Agric. 2017, 4, 5. [Google Scholar] [CrossRef]
- Kumari, S.; Sehrawat, K.D.; Phogat, D.; Sehrawat, A.R.; Chaudhary, R.; Sushkova, S.N.; Voloshina, M.S.; Rajput, V.D.; Shmaraeva, A.N.; Marc, R.A.; Shende, S.S. Ascophyllum nodosum (L.) Le Jolis, a pivotal biostimulant toward sustainable agriculture: A comprehensive review. Agriculture 2023, 13, 1179. [Google Scholar] [CrossRef]
- Ali, O.; Ramsubhag, A.; Jayaraman, J. Biostimulant properties of seaweed extracts in plants: Implications towards sustainable crop production. Plants 2021, 10, 531. [Google Scholar] [CrossRef]
- Goni, O.; Fort, A.; Quille, P.; McKeown, P.C.; Spillane, C.; O’Connell, S. Comparative transcriptome analysis of two Ascophyllum nodosum extract biostimulants: Same seaweed but different. J. Agric. Food Chem. 2016, 64, 2980–2989. [Google Scholar] [CrossRef]
- Craigie, J.S. Seaweed extract stimuli in plant science and agriculture. J. Appl. Phycol. 2011, 23, 371–393. [Google Scholar] [CrossRef]
- Battacharyya, D.; Babgohari, M.Z.; Rathor, P.; Prithiviraj, B. Seaweed extracts as biostimulants in horticulture. Sci. Hortic. 2015, 196, 39–48. [Google Scholar] [CrossRef]
- Michalak, I.; Chojnacka, K. Algal extracts: Technology and advances. Eng. Life Sci. 2014, 14, 581–591. [Google Scholar] [CrossRef]
- Babazadeh, B.A.; Sadeghzadeh, N.; Hajiboland, R. The impact of algal extract as a biostimulant on cold stress tolerance in barley (Hordeum vulgare L.). J. Appl. Phycol. 2023, 35, 2919–2933. [Google Scholar] [CrossRef]
- Wahab, A.; Abdi, G.; Saleem, M.H.; Ali, B.; Ullah, S.; Shah, W.; Mumtaz, S.; Yasin, G.; Muresan, C.C.; Marc, R.A. Plants’ physio-biochemical and phyto-hormonal responses to alleviate the adverse effects of drought stress: A comprehensive review. Plants 2022, 11, 1620. [Google Scholar] [CrossRef]
- Godoy, F.; Olivos-Hernández, K.; Stange, C.; Handford, M. Abiotic stress in crop species: Improving tolerance by applying plant metabolites. Plants 2021, 10, 186. [Google Scholar] [CrossRef] [PubMed]
- Koprna, R.; Humplík, J.F.; Špíšek, Z.; Bryksová, M.; Zatloukal, M.; Mik, V.; Novák, O.; Nisler, J.; Doležal, K. Improvement of tillering and grain yield by application of cytokinin derivatives in wheat and barley. Agronomy 2020, 11, 67. [Google Scholar] [CrossRef]
- Zadoks, J.C.; Chang, T.T.; Konzak, C.F. A decimal code for the growth stages of cereals. Weed Res. 1974, 14, 415–421. [Google Scholar] [CrossRef]
- Sadras, V.O.; Slafer, G.A. Environmental modulation of yield components in cereals: Heritabilities reveal a hierarchy of phenotypic plasticities. Field Crops Res. 2012, 127, 215–224. [Google Scholar] [CrossRef]
- Wu, X.; Tang, Y.; Li, C.; Wu, C. Characterization of the rate and duration of grain filling in wheat in southwestern China. Plant Prod. Sci. 2018, 21, 358–369. [Google Scholar] [CrossRef]
- García, G.A.; Serrago, R.A.; Dreccer, M.F.; Miralles, D.J. Post-anthesis warm nights reduce grain weight in field-grown wheat and barley. Field Crops Res. 2016, 195, 50–59. [Google Scholar] [CrossRef]
- Cosgrove, D.J. Expansive growth of plant cell walls. Plant Physiol. Biochem. 2000, 38, 109–124. [Google Scholar] [CrossRef]
- Hakala, K.; Jauhiainen, L.; Rajala, A.A.; Jalli, M.; Kujala, M.; Laine, A. Different responses to weather events may change the cultivation balance of spring barley and oats in the future. Field Crops Res. 2020, 259, 107956. [Google Scholar] [CrossRef]
- Kaseva, J.; Hakala, K.; Högnäsbacka, M.; Jauhiainen, L.; Himanen, S.J.; Rötter, R.P.; Balek, J.; Trnka, M.; Kahiluoto, H. Assessing climate resilience of barley cultivars in northern conditions during 1980–2020. Field Crops Res. 2023, 293, 108856. [Google Scholar] [CrossRef]
- Alemayehu, F.R.; Frenck, G.; van der Linden, L.; Mikkelsen, T.N.; Jørgensen, R.B. Can barley (Hordeum vulgare L. sl) adapt to fast climate changes? A controlled selection experiment. Genet. Resour. Crop Evol. 2014, 61, 151–161. [Google Scholar] [CrossRef]
- Quille, P.; Claffey, A.; Feeney, E.; Kacprzyk, J.; Ng, C.K.Y.; O’Connell, S. The effect of an engineered biostimulant derived from Ascophyllum nodosum on grass yield under a reduced nitrogen regime in an agronomic setting. Agronomy 2022, 12, 463. [Google Scholar] [CrossRef]
- Goñi, O.; Łangowski, Ł.; Feeney, E.; Quille, P.; O’Connell, S. Reducing nitrogen input in barley crops while maintaining yields using an engineered biostimulant derived from Ascophyllum nodosum to enhance nitrogen use efficiency. Front. Plant Sci. 2021, 12, 664682. [Google Scholar] [CrossRef] [PubMed]
- Stamatiadis, S.; Evangelou, L.; Yvin, J.C.; Tsadilas, C.; Mina, J.M.G.; Cruz, F. Responses of winter wheat to Ascophyllum nodosum (L.) Le Jol. extract application under the effect of N fertilization and water supply. J. Appl. Phycol. 2015, 27, 589–600. [Google Scholar] [CrossRef]
- Laurent, E.A.; Ahmed, N.; Durieu, C.; Grieu, P.; Lamaze, T. Marine and fungal biostimulants improve grain yield, nitrogen absorption and allocation in durum wheat plants. J. Agric. Sci. 2020, 158, 279–287. [Google Scholar] [CrossRef]
- Łangowski, Ł.; Goñi, O.; Ikuyinminu, E.; Feeney, E.; O'Connell, S. Investigation of the direct effect of a precision Ascophyllum nodosum biostimulant on nitrogen use efficiency in wheat seedlings. Plant Physiol. Biochem. 2022, 179, 44–57. [Google Scholar] [CrossRef]
- Quille, P.; Kacprzyk, J.; O’Connell, S.; Ng, C.K. Reducing fertiliser inputs: Plant biostimulants as an emerging strategy to improve nutrient use efficiency. Discov. Sustain. 2025, 6, 128. [Google Scholar] [CrossRef]
- Ali, A.; Niu, G.; Masabni, J.; Ferrante, A.; Cocetta, G. Integrated nutrient management of fruits, vegetables, and crops through the use of biostimulants, soilless cultivation, and traditional and modern approaches—A mini review. Agriculture 2024, 14, 1330. [Google Scholar] [CrossRef]
- Maignan, V.; Coquerel, R.; Géliot, P.; Avice, J.C. VNT4, a derived formulation of Glutacetine® biostimulant, improved yield and N-related traits of bread wheat when mixed with urea–ammonium–nitrate solution. Agronomy 2021, 11, 1013. [Google Scholar] [CrossRef]
- Garcia-Caparros, P.; Ciriello, M.; Rouphael, Y.; Giordano, M. The role of organic extracts and inorganic compounds as alleviators of drought stress in plants. Horticulturae 2025, 11, 91. [Google Scholar] [CrossRef]
- Li, Q.; Yang, A.; Wang, Z.; Roelcke, M.; Chen, X.; Zhang, F.; Liu, X. Effect of a new urease inhibitor on ammonia volatilization and nitrogen utilization in wheat in north and northwest China. Field Crops Res. 2015, 175, 96–105. [Google Scholar] [CrossRef]
- Swify, S.; Mažeika, R.; Baltrusaitis, J.; Drapanauskaitė, D.; Barčauskaitė, K. Modified urea fertilizers and their effects on improving nitrogen use efficiency (NUE). Sustainability 2023, 16, 188. [Google Scholar] [CrossRef]
- Krol, D.J.; Forrestal, P.J.; Wall, D.; Lanigan, G.J.; Sanz-Gomez, J.; Richards, K.G. Nitrogen fertilisers with urease inhibitors reduce nitrous oxide and ammonia losses, while retaining yield in temperate grassland. Sci. Total Environ. 2020, 725, 138329. [Google Scholar] [CrossRef] [PubMed]
- Forrestal, P.J.; Wall, D.; Carolan, R.; Harty, M.A.; Roche, L.; Krol, D.; Watson, C.J.; Lanigan, G.; Richards, K.G. Effects of urease and nitrification inhibitors on yields and emissions in grassland and spring barley. Int. Fertil. Soc. 2016, September. [Google Scholar]
- Harty, M.A.; Forrestal, P.J.; Carolan, R.; Watson, C.J.; Hennessy, D.; Lanigan, G.J.; Wall, D.P.; Richards, K.G. Temperate grassland yields and nitrogen uptake are influenced by fertilizer nitrogen source. Agron. J. 2017, 109, 71–79. [Google Scholar] [CrossRef]
- Wang, W.; Li, Y.; Wang, W.; Ding, K.; Zhang, K.; Zhang, Y.; Li, J. Global meta-analysis of individual and combined nitrogen inhibitors: Enhancing plant productivity and reducing environmental losses. Glob. Chang. Biol. 2024, 30, e70007. [Google Scholar] [CrossRef] [PubMed]
- Brace, B.E.; Schlossberg, M.J. Field evaluation of urea fertilizers enhanced by biological inhibitors or dual coating. Agronomy 2024, 14, 2118. [Google Scholar] [CrossRef]
- Fox, G.P.; Bettenhausen, H.M. Variation in quality of grains used in malting and brewing. Front. Plant Sci. 2023, 14, 1172028. [Google Scholar] [CrossRef]
- Evans, D.E.; Paynter, B.H.; Izydorczyk, M.S.; Li, C. The impact of terroir on barley and malt quality–A critical review. J. Inst. Brew. 2023, 129, 211–258. [Google Scholar] [CrossRef]
- Hřivna, L.; Maco, R.; Dufková, R.; Kouřilová, V.; Burešová, I.; Gregor, T. Effect of weather, nitrogen fertilizer, and biostimulators on the root size and yield components of Hordeum vulgare. Open Agric. 2024, 9, 20220270. [Google Scholar] [CrossRef]
- Shukla, P.S.; Mantin, E.G.; Adil, M.; Bajpai, S.; Critchley, A.T.; Prithiviraj, B. Ascophyllum nodosum-based biostimulants: Sustainable applications in agriculture for the stimulation of plant growth, stress tolerance, and disease management. Front. Plant Sci. 2019, 10, 462648. [Google Scholar] [CrossRef]
- Chloupek, O.; Dostál, V.; Středa, T.; Psota, V.; Dvořáčková, O.J.P.B. Drought tolerance of barley varieties in relation to their root system size. Plant Breed. 2010, 129, 630–636. [Google Scholar] [CrossRef]
- Goettl, B.; DeSutter, T.; Bu, H.; Wick, A.; Franzen, D. Managing nitrogen to promote quality and profitability of North Dakota two-row malting barley. Agron. J. 2024, 116, 719–726. [Google Scholar] [CrossRef]
- Savin, R.; Nicolas, M.E. Effects of short periods of drought and high temperature on grain growth and starch accumulation of two malting barley cultivars. Funct. Plant Biol. 1996, 23, 201–210. [Google Scholar] [CrossRef]
- Rakita, S.; Torbica, A.; Pezo, L.; Nikolić, I. Effect of climatic conditions on wheat starch granule size distribution, gelatinization and flour pasting properties. Agronomy 2023, 13, 1551. [Google Scholar] [CrossRef]
- Yabwalo, D.N.; Berzonsky, W.A.; Brabec, D.; Pearson, T.; Glover, K.D.; Kleinjan, J.L. Impact of grain morphology and the genotype by environment interactions on test weight of spring and winter wheat (Triticum aestivum L.). Euphytica 2018, 214, 125. [Google Scholar] [CrossRef]
- Craine, E.B.; Choi, H.; Schroeder, K.L.; Brueggeman, R.; Esser, A.; Murphy, K.M. Spring barley malt quality in eastern Washington and northern Idaho. Crop Sci. 2023, 63, 1148–1168. [Google Scholar] [CrossRef]
- Stamatiadis, S.; Evangelou, E.; Jamois, F.; Yvin, J.C. Targeting Ascophyllum nodosum (L.) Le Jol. extract application at five growth stages of winter wheat. J. Appl. Phycol. 2021, 33, 1873–1882. [Google Scholar] [CrossRef]
- Nephali, L.; Piater, L.A.; Dubery, I.A.; Patterson, V.; Huyser, J.; Burgess, K.; Tugizimana, F. Biostimulants for plant growth and mitigation of abiotic stresses: A metabolomics perspective. Metabolites 2020, 10, 505. [Google Scholar] [CrossRef] [PubMed]
- Srivastava, R.K.; Panda, R.K.; Chakraborty, A.; Halder, D. Enhancing grain yield, biomass and nitrogen use efficiency of maize by varying sowing dates and nitrogen rate under rainfed and irrigated conditions. Field Crops Res. 2018, 221, 339–349. [Google Scholar] [CrossRef]
- Wang, W.; Ji, D.; Peng, S.; Loladze, I.; Harrison, M.T.; Davies, W.J.; Smith, P.; Xia, L.; Wang, B.; Liu, K.; Zhu, K.; Zhang, W.; Ouyang, L.; Liu, L.; Gu, J.; Zhang, H.; Yang, J.; Wang, F. Eco-physiology and environmental impacts of newly developed rice genotypes for improved yield and nitrogen use efficiency coordinately. Sci. Total Environ. 2023, 896, 165294. [Google Scholar] [CrossRef]
- Wang, S.; Peng, J.; Dong, W.; Wei, Z.; Zafar, S.U.; Jin, T.; Liu, E. Optimizing irrigation and nitrogen fertilizer regimes to increase the yield and nitrogen utilization of Tibetan barley in Tibet. Agronomy 2024, 14, 1775. [Google Scholar] [CrossRef]
- Djanaguiraman, M.; Narayanan, S.; Erdayani, E.; Prasad, P.V. Effects of high temperature stress during anthesis and grain filling periods on photosynthesis, lipids and grain yield in wheat. BMC Plant Biol. 2020, 20, 268. [Google Scholar] [CrossRef] [PubMed]
- Elia, M.; Slafer, G.A.; Savin, R. Yield and grain weight responses to post-anthesis increases in maximum temperature under field grown wheat as modified by nitrogen supply. Field Crops Res. 2018, 221, 228–237. [Google Scholar] [CrossRef]
- Ugarte, C.; Calderini, D.F.; Slafer, G.A. Grain weight and grain number responsiveness to pre-anthesis temperature in wheat, barley and triticale. Field Crops Res. 2007, 100, 240–247. [Google Scholar] [CrossRef]
- Shah, A.N.; Tanveer, M.; Rehman, A.U.; Anjum, S.A.; Iqbal, J.; Ahmad, R. Lodging stress in cereals—Effects and management: An overview. Environ. Sci. Pollut. Res. 2017, 24, 5222–5237. [Google Scholar] [CrossRef]
- Raya-Sereno, M.D.; Pancorbo, J.L.; Alonso-Ayuso, M.; Gabriel, J.L.; Quemada, M. Winter wheat genotype ability to recover nitrogen supply by precedent crops under combined nitrogen and water scenarios. Field Crops Res. 2023, 290, 108758. [Google Scholar] [CrossRef]
- Dahlin, I.; Kiær, L.P.; Bergkvist, G.; Weih, M.; Ninkovic, V. Plasticity of barley in response to plant neighbors in cultivar mixtures. Plant Soil 2020, 447, 537–551. [Google Scholar] [CrossRef]
- Murray, Á.; Gilliland, T.J.; Delaby, L.; Patton, D.; Creighton, P.; Forrestal, P.J.; McCarthy, B. Can a urease inhibitor improve the efficacy of nitrogen use under perennial ryegrass temperate grazing conditions? J. Agric. Sci. 2023, 161, 230–240. [Google Scholar] [CrossRef]
- Miralles, D.J.; Abeledo, L.G.; Alvarez Prado, S.; Chenu, K.; Serrago, R.A.; Savin, R. Barley. In Crop Physiology: Case Histories for Major Crops, 2nd ed.; Sadras, V.O., Calderini, D.F., Eds.; Academic Press: Cambridge, MA, USA, 2021; pp. 164–195. [Google Scholar]
- Sun, W.; Hamani, A.K.M.; Si, Z.; Abubakar, S.A.; Liang, Y.; Liu, K.; Gao, Y. Effects of timing in irrigation and fertilization on soil NO₃⁻-N distribution, grain yield and water–nitrogen use efficiency of drip-fertigated winter wheat in the North China Plain. Water 2022, 14, 1780. [Google Scholar] [CrossRef]
- Kostić, M.M.; Tagarakis, A.C.; Ljubičić, N.; Blagojević, D.; Radulović, M.; Ivošević, B.; Rakić, D. The effect of N fertilizer application timing on wheat yield on chernozem soil. Agronomy 2021, 11, 1413. [Google Scholar] [CrossRef]
- Wang, H.; Köbke, S.; Dittert, K. Use of urease and nitrification inhibitors to reduce gaseous nitrogen emissions from fertilizers containing ammonium nitrate and urea. Glob. Ecol. Conserv. 2020, 22, e00933. [Google Scholar] [CrossRef]
- Klimczyk, M.; Siczek, A.; Schimmelpfennig, L. Improving the efficiency of urea-based fertilization leading to reduction in ammonia emission. Sci. Total Environ. 2021, 771, 145483. [Google Scholar] [CrossRef]
- Serrago, R.A.; García, G.A.; Savin, R.; Miralles, D.J.; Slafer, G.A. Determinants of grain number responding to environmental and genetic factors in two- and six-rowed barley types. Field Crops Res. 2023, 302, 109073. [Google Scholar] [CrossRef]
- Tahir, N.A.R.; Lateef, D.D.; Mustafa, K.M.; Rasul, K.S. Under natural field conditions, exogenous application of moringa organ water extract enhanced the growth- and yield-related traits of barley accessions. Agriculture 2022, 12, 1502. [Google Scholar] [CrossRef]
- Izydorczyk, M.S.; Edney, M. Barley: Grain-quality characteristics and management of quality requirements. In Cereal Grains, 2nd ed.; Wrigley, C., Batey, I., Miskelly, D., Eds.; Woodhead Publishing: Cambridge, UK, 2017; pp. 195–234. [Google Scholar]
- Akhter, Z.; Bi, Z.; Ali, K.; Sun, C.; Fiaz, S.; Haider, F.U.; Bai, J. In response to abiotic stress, DNA methylation confers epigenetic changes in plants. Plants 2021, 10, 1096. [Google Scholar] [CrossRef]
- Lephatsi, M.; Nephali, L.; Meyer, V.; Piater, L.A.; Buthelezi, N.; Dubery, I.A.; Opperman, H.; Brand, M.; Huyser, J.; Tugizimana, F. Molecular mechanisms associated with microbial biostimulant-mediated growth enhancement, priming and drought stress tolerance in maize plants. Sci. Rep. 2022, 12, 10450. [Google Scholar] [CrossRef]
- Hill, C.B.; Angessa, T.T.; Westcott, S.; McFawn, L.A.; Shirdelmoghanloo, H.; Han, Y.; Li, C. Evaluation of the impact of heat stress at flowering on spikelet fertility and grain quality in barley. Agric. Commun. 2024, 2, 100066. [Google Scholar] [CrossRef]
- Shirdelmoghanloo, H.; Chen, K.; Paynter, B.H.; Angessa, T.T.; Westcott, S.; Khan, H.A.; Hill, C.B.; Li, C. Grain-filling rate improves physical grain quality in barley under heat stress conditions during the grain-filling period. Front. Plant Sci. 2022, 13, 858652. [Google Scholar] [CrossRef] [PubMed]
- Rouphael, Y.; Colla, G. Biostimulants in agriculture. Front. Plant Sci. 2020, 11, 40. [Google Scholar] [CrossRef]
Figure 1.
Diagrams with the meteorological data by enviroment with A,B,C and D, Enviroment 1, Enviroment 2, Enviroment 3 and Enviroment 4, respectively. Temperature (oC), maximum, minimum and average and precipitation (mm) οf the genotypes per decade during the biological cycle are shown. Arrows denote key phenological stages: T= Tillering; S= Stem elongation; A= Anthesis; G= Grain filling.
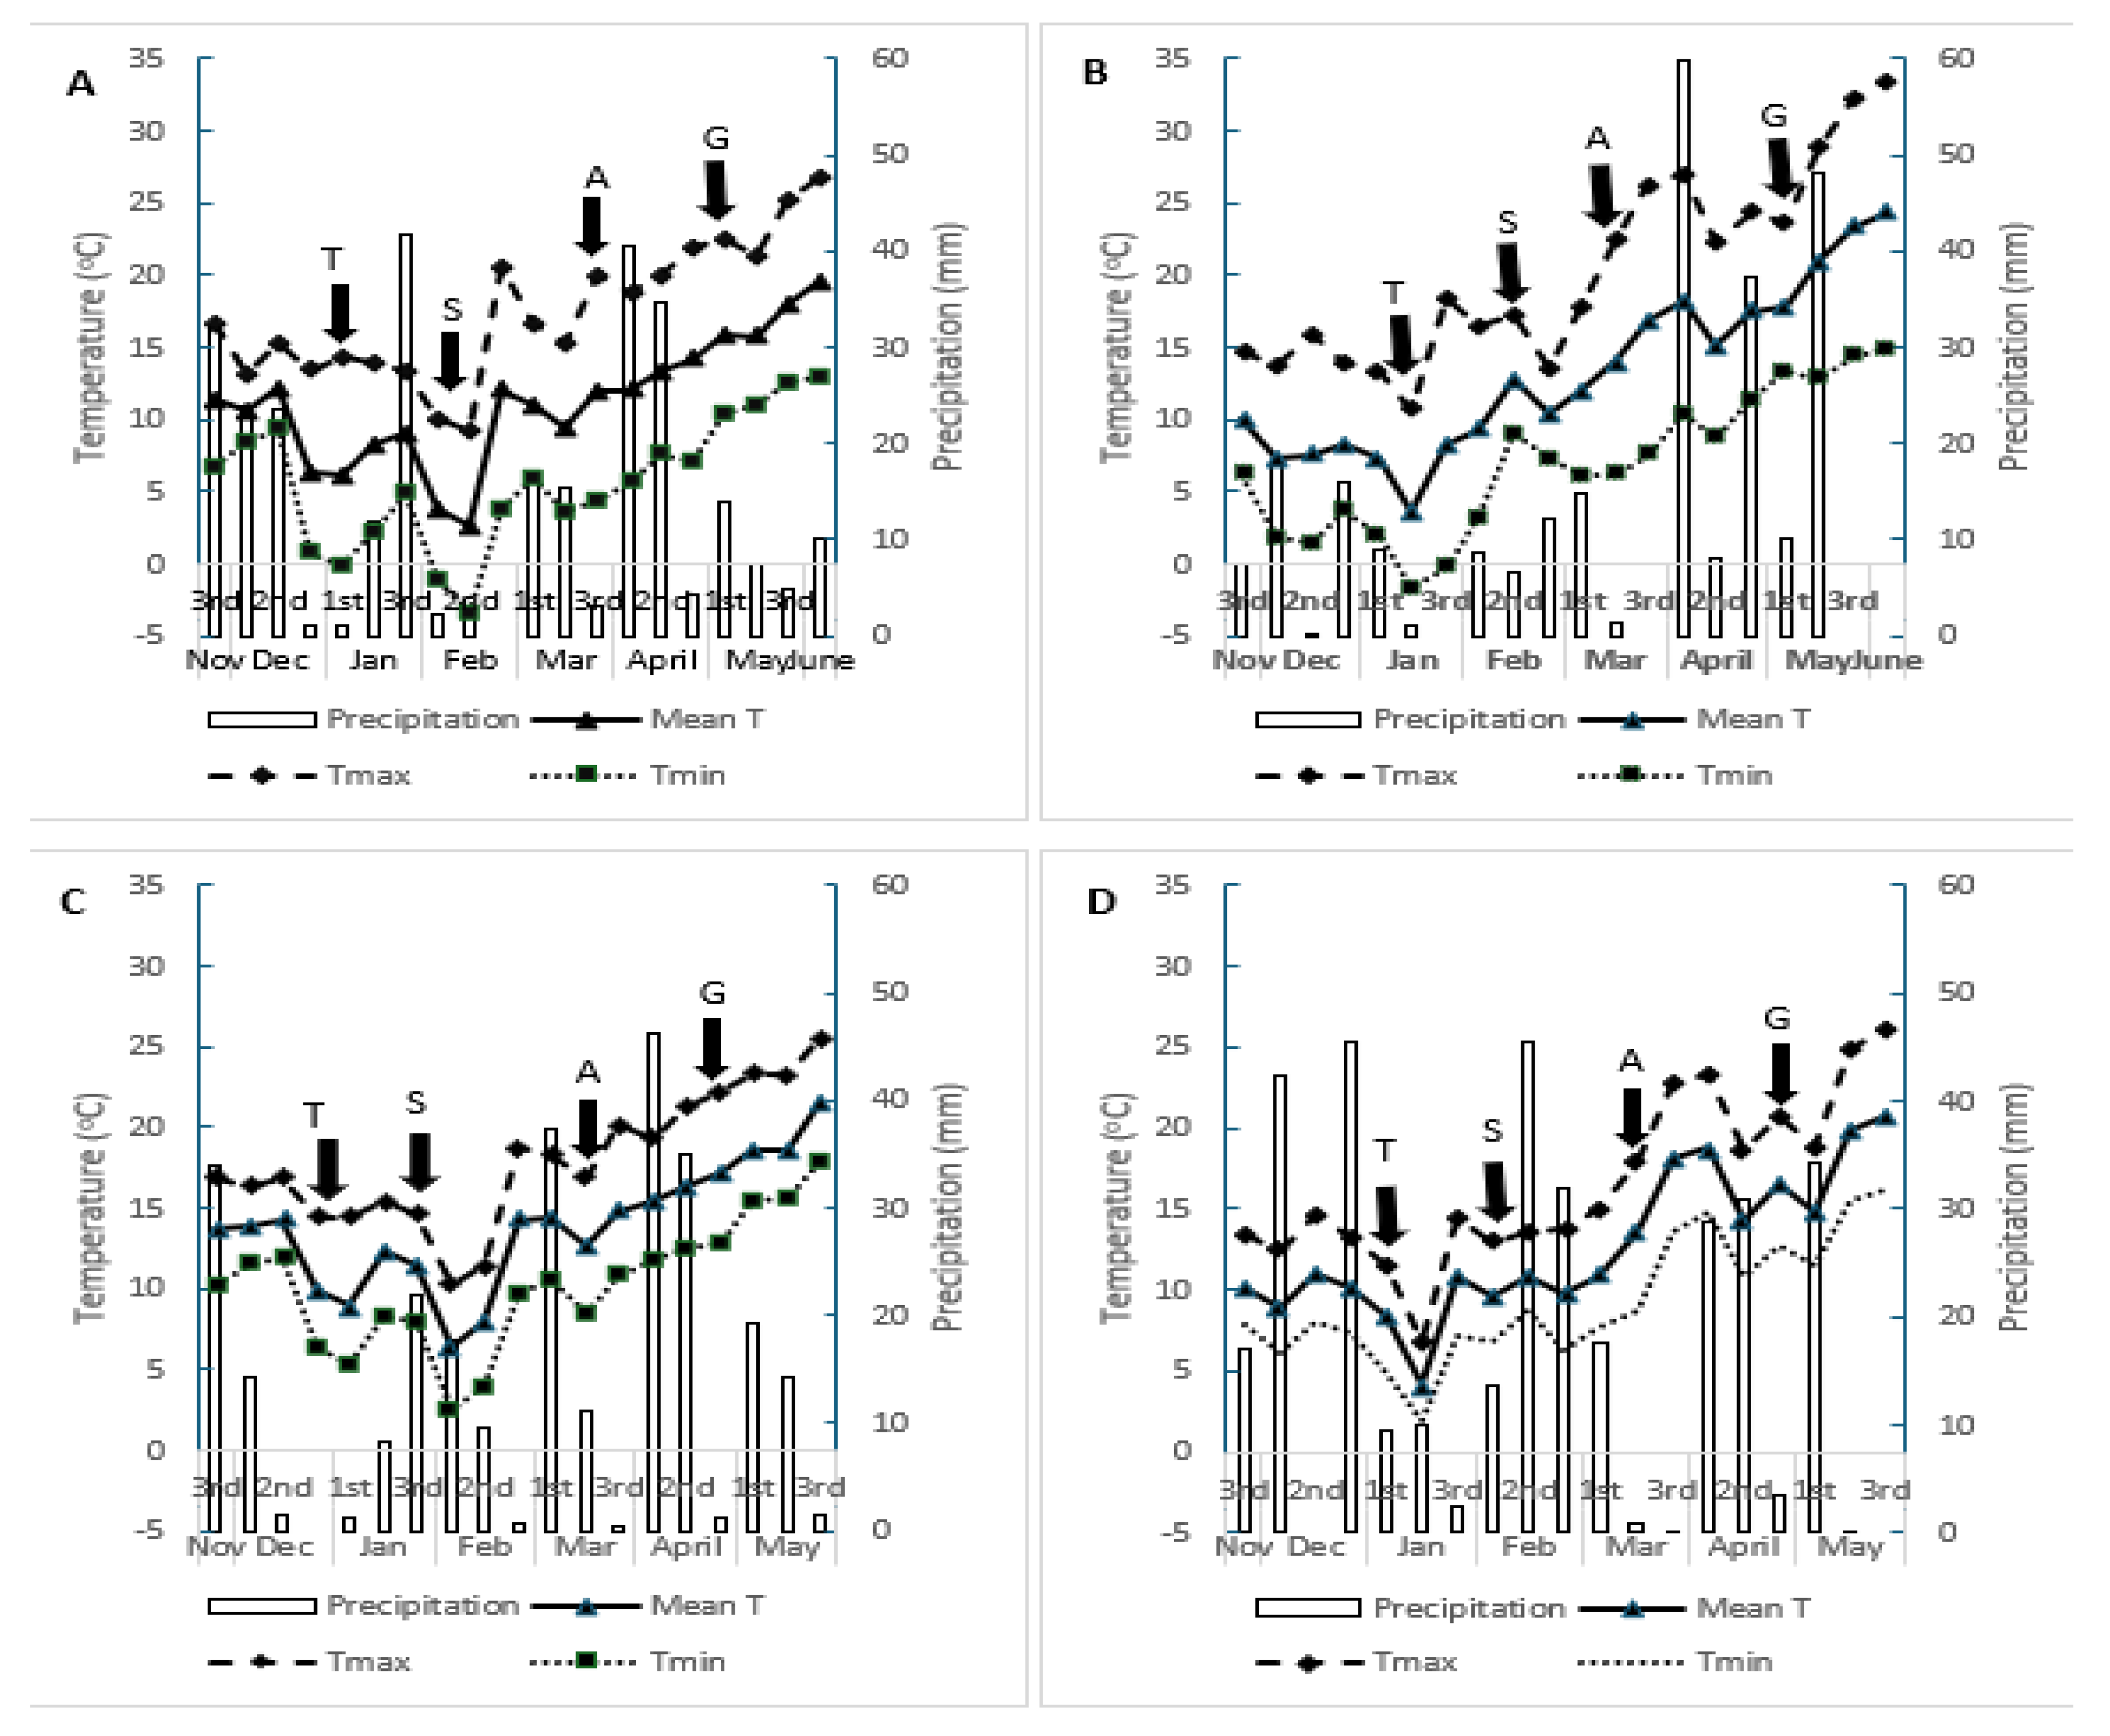
Figure 2.
A,B. Principal component analysis (PCA) conducted for all traits, quantitative and qualitative, based on A) early and B) mid-stages of biostimulant and surface fertilization application. Total number of samples was 80, in 4 Enviroments for the genotype G45. Red dots corresponds to a treatment and the black dots the 10 variables were yield, aboveground biomass, harvest index (HI), thousand grains weight (TGW), grain protein content (GPC), maltable, retention fraction and grain size greater than 2.8mm. U= Urea, U+B= Urea and biostimulant Ascophyllum nodosom extract, UI= Urea with inhibitor urease, UI+B= Urea with inhibitor urease and biostimulant Ascophyllum nodosom extract and C= Control without surface fertilization.
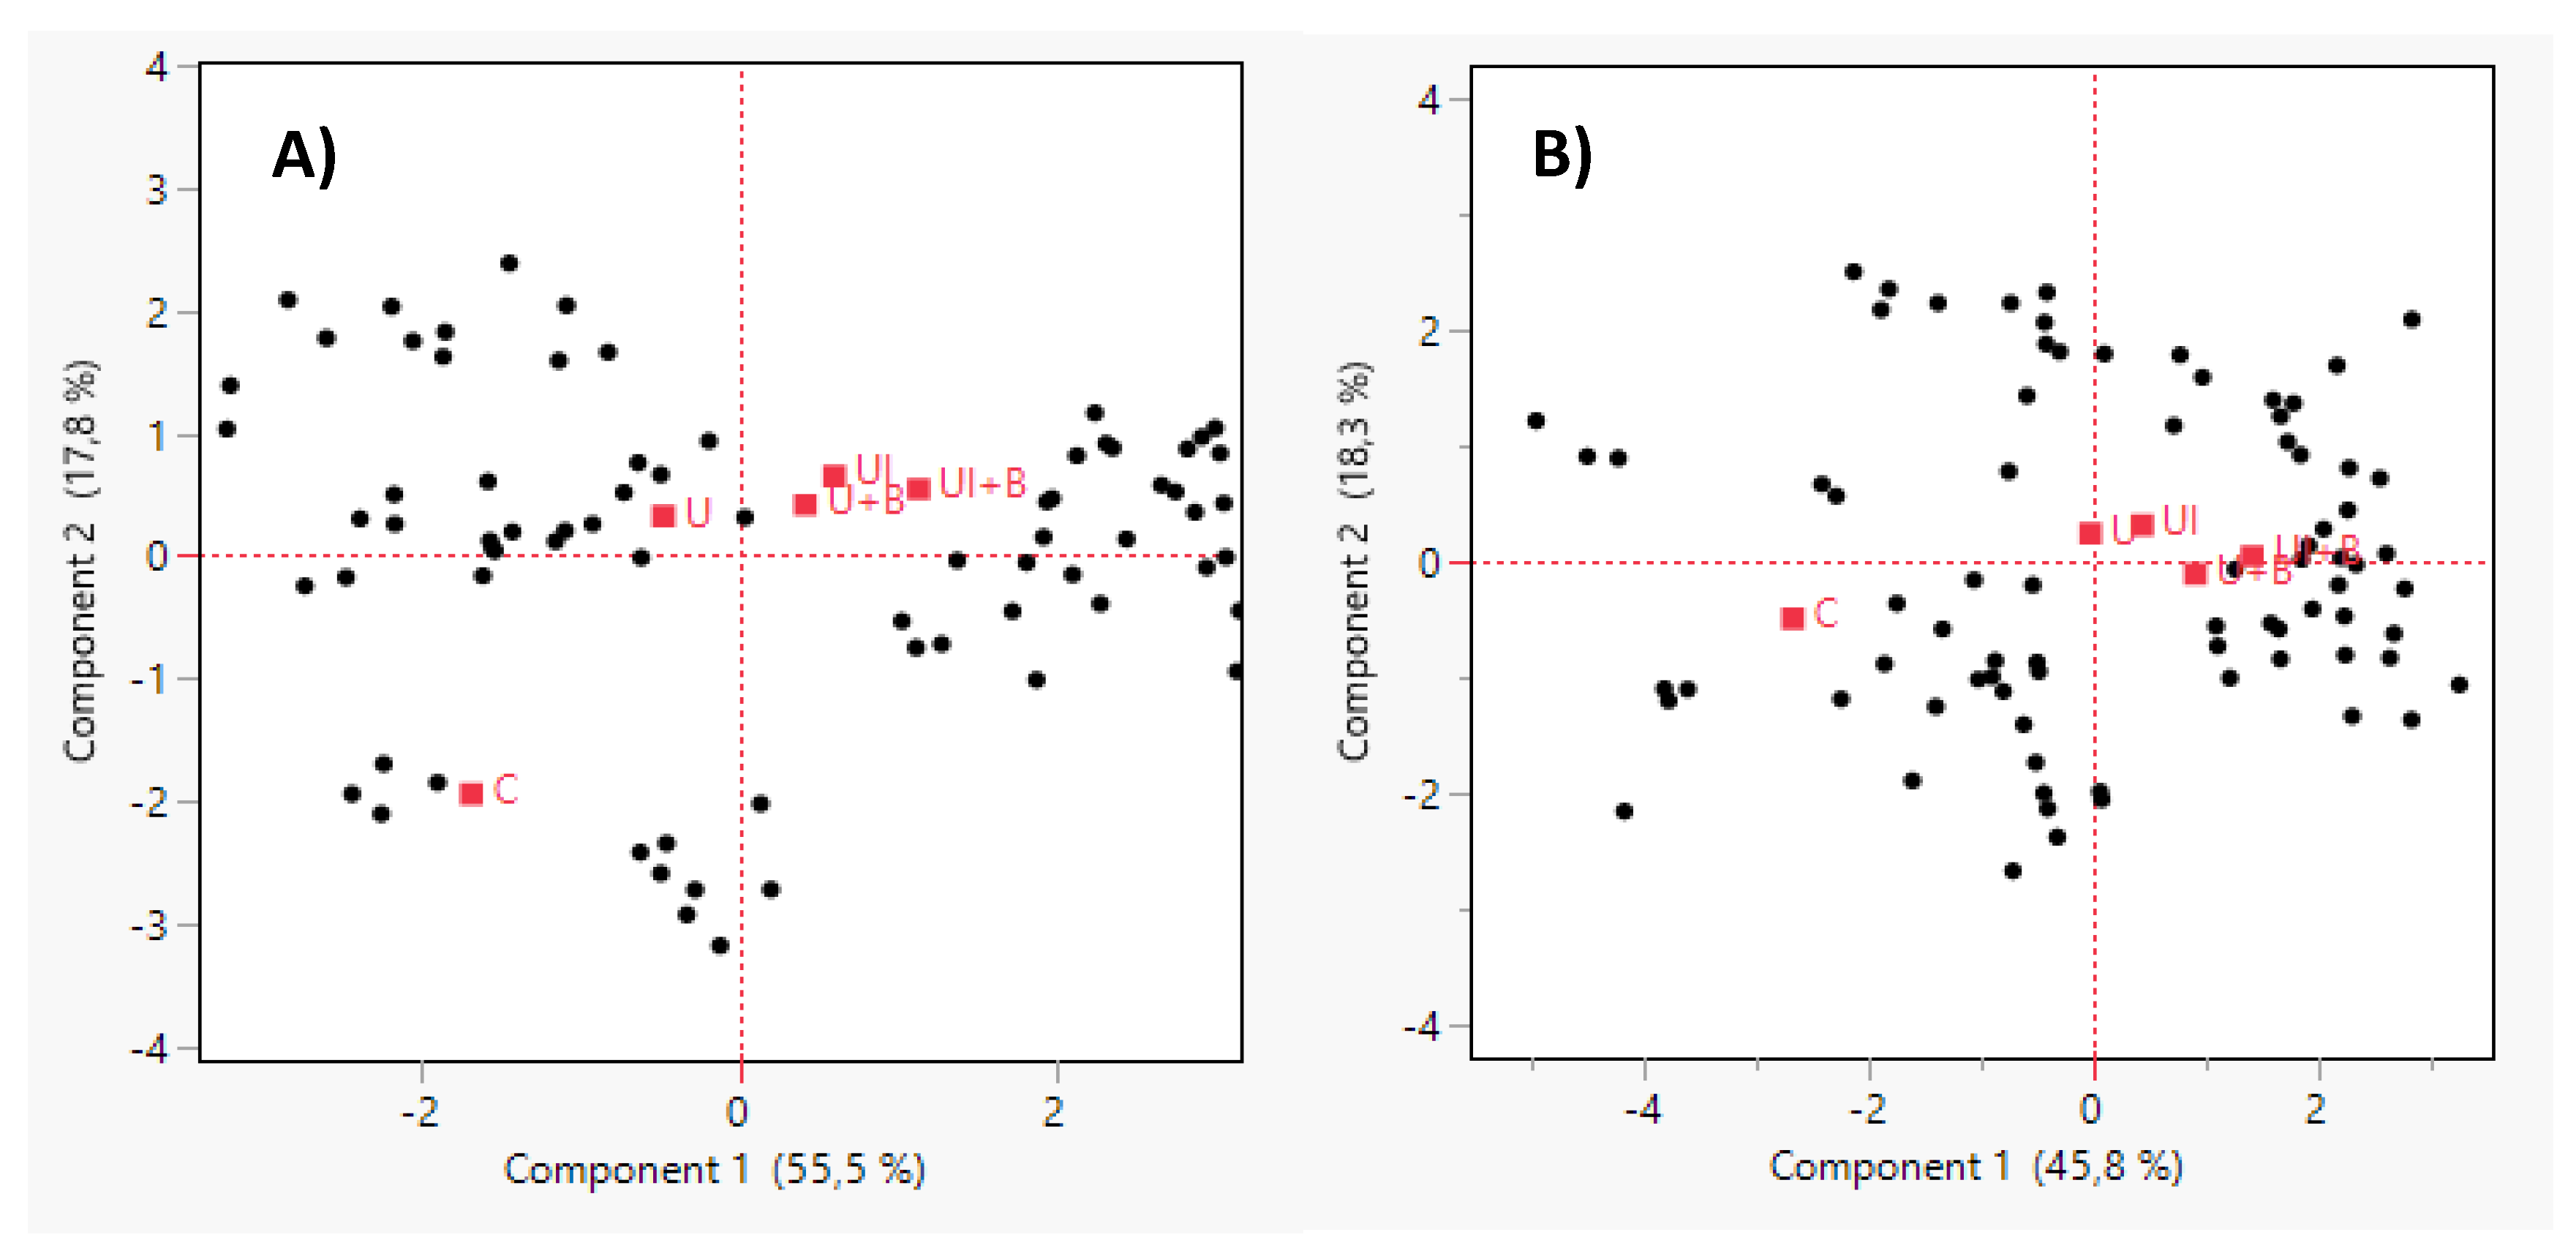

Table 1.
Soil physicochemical properties at the four experimental environments (E1–E4). Values represent measurements of organic matter content, pH, total nitrogen, available phosphorus, and exchangeable potassium.
Table 1.
Soil physicochemical properties at the four experimental environments (E1–E4). Values represent measurements of organic matter content, pH, total nitrogen, available phosphorus, and exchangeable potassium.
| Soil Properties | ||||||||||||
| Soil Texture |
Organic matter (%) |
pH | Total Nitrogen (%) |
Phosphorus (ppm) | Potassium (ppm) | |||||||
| E1 | Clay | 2.02 | 7.05 | 0.147 | 20.12 | 266 | ||||||
| E2 | Clay | 2.34 | 7.10 | 0.161 | 23.66 | 224 | ||||||
| E3 | Clay loam | 1.95 | 7.20 | 0.133 | 19.57 | 172 | ||||||
| E4 | Clay loam | 1.86 | 7.22 | 0.129 | 16.53 | 281 | ||||||
Table 2.
Interaction of enviroment, genotypes and treatments on quantitative traits (Aboveground Biomass, Yield, Harvest Index (HI), Spikelets per square meter and Grains*Spike-1).
Table 2.
Interaction of enviroment, genotypes and treatments on quantitative traits (Aboveground Biomass, Yield, Harvest Index (HI), Spikelets per square meter and Grains*Spike-1).
| Quantitative Traits | |||||||
|---|---|---|---|---|---|---|---|
| Aboveground Biomass | Yield | HI | Spikelets*m-2 | TGW | Grains* Spike-1 | ||
| Environment (E) | *** | *** | *** | *** | *** | ns | |
| Genotype (G) | *** | *** | *** | *** | *** | *** | |
| Treatment (T) | *** | *** | * | *** | *** | ** | |
| E*G | *** | *** | *** | *** | *** | ** | |
| E*T | *** | *** | *** | ns | ns | *** | |
| G*T | ns | ** | ns | ** | ** | *** | |
| E*G*T | ** | *** | ns | * | ** | *** | |
***=p<0.001,**=p<0.01,*=p<0.05 and ns: no significant.
Table 3.
Interaction between genotypes and treatments at Environments 1, 2, 3, 4 on aboveground biomass, yield, Harvest Index (HI), according to Fisher test (p-value<0.05). Analysis of variance (ANOVA) is also shown.
Table 3.
Interaction between genotypes and treatments at Environments 1, 2, 3, 4 on aboveground biomass, yield, Harvest Index (HI), according to Fisher test (p-value<0.05). Analysis of variance (ANOVA) is also shown.
| Aboveground Biomass | Yield | HI | ||||||||||||||
| E1 | E2 | E3 | E4 | E1 | E2 | E3 | E4 | E1 | E2 | E3 | E4 | |||||
| G45 | U | 12.85ab | 6.46ad | 11.25abc | 6.72bc | 6.68cd | 3.19ac | 6.13b | 3.28ac | 0.52 | 0.43 | 0.55cde | 0.49 | |||
| U+B | 15c | 8.24ab | 11.9ab | 8abc | 6.74cd | 3.5ab | 6.99c | 3.49ac | 0.45 | 0.43 | 0.58ce | 0.44 | ||||
| UI | 12.25b | 8.45abc | 11.3abc | 8.62ab | 7.18c | 3.68ab | 7.07c | 3.52ac | 0.58 | 0.47 | 0.63c | 0.40 | ||||
| UI+B | 13.85abc | 9.45bc | 12.05ab | 9.46ad | 7.62c | 4.02abd | 7.36c | 4.32ab | 0.55 | 0.51 | 0.62c | 0.46 | ||||
| Control | 9d | 5.51d | 9.65c | 5.35c | 4.62ae | 2.51c | 4.91d | 2.42c | 0.51 | 0.44 | 0.51ade | 0.49 | ||||
| G20 | U | 13 ab | 7.25abd | 12.4ab | 12.16dei | 5.26ab | 3.44abc | 5.43ad | 4.63b | 0.41 | 0.47 | 0.44ab | 0.38 | |||
| U+B | 14.25ac | 10.63c | 12.65a | 14.17e | 5.43ab | 4.24bd | 5.73ab | 4.65b | 0.38 | 0.39 | 0.45ab | 0.32 | ||||
| UI | 13.1abc | 8.46abc | 12.15ab | 10.08ad | 5.33ab | 3.35abc | 5.68ab | 3.65a | 0.41 | 0.39 | 0.44ab | 0.36 | ||||
| UI+B | 14.2ac | 9.24bc | 12.35ab | 13.54e | 5.73bd | 4.94d | 5.88ab | 4.69b | 0.40 | 0.53 | 0.49ad | 0.30 | ||||
| Control | 9.3d | 5.6d | 10.45bc | 9.03ab | 3.95e | 2.57c | 3.86e | 3.49ac | 0.42 | 0.45 | 0.37b | 0.39 | ||||
| ANOVA | ||||||||||||||||
| Genotype (G) | * | *** | ** | *** | *** | * | *** | ** | *** | ns | *** | * | ||||
| Treatment (T) | *** | *** | *** | *** | *** | *** | *** | *** | ns | * | *** | ns | ||||
| G*T | * | * | * | *** | * | ** | * | *** | ns | ns | * | ns | ||||
***=p<0.001,**=p<0.01,*=p<0.05 and ns: no significant.
Table 4.
Interaction between genotypes and treatments at Environment 1 (E1), Environment 2 (E2), Environment 3 (E3) and Environment 4 (E4) on Spikelets*m-2, thousand grains weight (TGW), grains*spike-1, according to Fisher test (p-value<0.05). Analysis of variance (ANOVA) is also shown.
Table 4.
Interaction between genotypes and treatments at Environment 1 (E1), Environment 2 (E2), Environment 3 (E3) and Environment 4 (E4) on Spikelets*m-2, thousand grains weight (TGW), grains*spike-1, according to Fisher test (p-value<0.05). Analysis of variance (ANOVA) is also shown.
| Spikelets*m-2 | TGW | Grains*Spike-1 | ||||||||||||||
| E1 | E2 | E3 | E4 | E1 | E2 | E3 | E4 | E1 | E2 | E3 | E4 | |||||
| G45 | U | 745c | 423abc | 657b | 448bc | 38.80c | 35.60d | 38.59ade | 35.4ac | 29.5ab | 27.8a | 27.5ae | 28.3abc | |||
| U+B | 822cd | 476abd | 736bc | 546abc | 42.48bd | 39.45a | 39.97abd | 35.7ac | 28a | 27a | 28a | 28.8ab | ||||
| UI | 834cd | 478abd | 691bc | 583ab | 44.17ab | 40.52a | 40.22abd | 36.92a | 29.3ab | 27.7a | 28.3ac | 28.8ab | ||||
| UI+B | 880d | 535d | 768c | 615a | 46.22a | 42.40ab | 41.64abc | 38.26ad | 28a | 28ac | 31bc | 28.5ab | ||||
| Control | 597a | 371ace | 543a | 409c | 37.77c | 34.65d | 35.64e | 32.73c | 24.3c | 26.2a | 25de | 26c | ||||
| G20 | U | 582ab | 368ce | 531a | 552ab | 44.21ab | 43.92bc | 40.99abc | 40.75bd | 30.2ab | 28.2ac | 30.3abc | 28abc | |||
| U+B | 623a | 456abcd | 567a | 584ab | 44.66ab | 44.40bc | 43.11bc | 42.85b | 27.5ad | 30.5b | 31.2b | 30bd | ||||
| UI | 576ab | 410abc | 522a | 480ab | 44.71ab | 44.49bc | 41.20abc | 40.95bd | 27.8a | 29.8b | 29abc | 29.2 | ||||
| UI+B | 612a | 486bd | 546a | 551abc | 47.13a | 46.92c | 43.86c | 43.67b | 31.5b | 31b | 31.3b | 32d | ||||
| Control | 479b | 281e | 500a | 467bc | 40.49cd | 40.25a | 37.52de | 37.3a | 24.5cd | 27a | 22.8d | 27.3ac | ||||
| ANOVA | ||||||||||||||||
| Genotype (G) | *** | ** | *** | * | *** | *** | ** | *** | ns | *** | * | *** | ||||
| Treatment (T) | *** | *** | *** | ** | *** | *** | *** | *** | *** | *** | *** | *** | ||||
| G*Te | * | * | ** | * | ** | * | ns | ** | * | ** | ** | ** | ||||
***=p<0.001,**=p<0.01,*=p<0.05 and ns: no significant.
Table 5.
Interaction of enviroment, genotypes and treatments on qualitative traits (grain protein content (GPC), and sieving test).
Table 5.
Interaction of enviroment, genotypes and treatments on qualitative traits (grain protein content (GPC), and sieving test).
| Qualitative Traits | |||||
|---|---|---|---|---|---|
| GPC | Maltable (>2.2mm) | Retention (>2.5mm) | >2.8mm | ||
| Environment (E) | *** | *** | *** | *** | |
| Genotype (G) | *** | *** | *** | *** | |
| Treatment (T) | *** | *** | *** | *** | |
| E*G | *** | *** | *** | *** | |
| E*T | *** | *** | *** | *** | |
| G*T | *** | *** | *** | *** | |
| E*G*T | *** | *** | *** | *** | |
***=p<0.001,**=p<0.01,*=p<0.05 and ns: no significant.
Table 6.
Interaction between genotypes and treatments at Environments 1, 2, 3, 4 on grain protein content (GPC) and sieving test, according to Fisher test (p-value<0.05). Analysis of variance (ANOVA) is also shown.
Table 6.
Interaction between genotypes and treatments at Environments 1, 2, 3, 4 on grain protein content (GPC) and sieving test, according to Fisher test (p-value<0.05). Analysis of variance (ANOVA) is also shown.
| GPC (%) | Maltable (>2.2mm) (%) | Retention (>2.5mm) (%) | >2.8mm (%) | ||||||||||||||||||
| E1 | E2 | E3 | E4 | E1 | E2 | E3 | E4 | E1 | E2 | E3 | E4 | E1 | E2 | E3 | E4 | ||||||
| G45 | U | 7.96a | 9.78c | 9.46ab | 11.06abc | 98.31ab | 92.05a | 98.89ab | 75.45b | 87.61c | 49.82c | 88.62d | 22.46de | 56.82c | 6.46a | 54.63cde | 1.91a | ||||
| U+B | 8.61bc | 10.34cd | 11.22de | 9.09de | 98.93a | 92.28a | 98.99ab | 76.53bc | 89.45a | 53.29c | 89.31cd | 29.29de | 60.06b | 8.66abc | 57.37cd | 3.80ac | |||||
| UI | 9.77a | 11.08ae | 9.28a | 11.99cf | 98.97a | 92.35a | 98.98ab | 81.88cd | 89.79a | 67.17a | 90.55cd | 37.99d | 61.39b | 11.28bc | 59.15bcd | 0.93a | |||||
| UI+B | 10.33d | 10.47be | 10.71cd | 10.25ae | 99.06a | 93.58ab | 99.06b | 86.57d | 90.67a | 70.03a | 98.74a | 38.91d | 64.42ab | 12.61c | 62.11bc | 0.95a | |||||
| Control | 6.95c | 7.44e | 7.66b | 7.95d | 96.31b | 88.85f | 98.43cd | 74.68b | 84.54b | 40.62d | 84.04e | 11.66f | 42.18d | 5.57a | 41.71 | 0.71a | |||||
| G20 | U | 9.95ac | 11.71ab | 13.55e | 10.69ab | 98.59a | 95.37bcd | 98.69ad | 94.41a | 86.83c | 84.33e | 92.48c | 74.45ab | 60.74b | 28.73d | 67.1abc | 24.40a | ||||
| U+B | 9.88a | 11.95b | 10.70d | 11.85bcf | 98.99a | 96.72cde | 98.7ab | 95.79a | 89.51a | 86.43be | 92.95bc | 77.15a | 65.07ab | 31.84d | 69.09ab | 26.11a | |||||
| UI | 9.80a | 12.78d | 9.89c | 12.73f | 99.03a | 97.21de | 98.82ab | 96.02a | 89.79a | 89.65b | 93.24bc | 77.78a | 66.11a | 50.74e | 70.4ab | 17.35b | |||||
| UI+B | 10.95d | 11.39ab | 11.31de | 10.93abc | 99.09a | 97.61de | 98.89ab | 95.62a | 90.47a | 90.59b | 93.71bc | 79.87a | 67.40a | 56.56f | 72.45a | 27.44a | |||||
| Control | 8.18bc | 9.08c | 9.40ab | 9.14de | 96.48b | 94.86bc | 98.12c | 86.01d | 84.41b | 66.33ad | 88.21d | 68.35c | 48.09d | 7.49ab | 52.66e | 15.12b | |||||
| ANOVA | |||||||||||||||||||||
| Genotype (G) | *** | *** | *** | *** | *** | *** | ** | *** | ** | *** | *** | *** | *** | *** | *** | *** | |||||
| Treatment (T) | *** | *** | *** | *** | *** | *** | *** | *** | *** | *** | *** | *** | *** | *** | *** | *** | |||||
| G*Te | *** | *** | *** | *** | ** | *** | * | ** | ** | *** | *** | *** | * | *** | ** | *** | |||||
Disclaimer/Publisher’s Note: The statements, opinions and data contained in all publications are solely those of the individual author(s) and contributor(s) and not of MDPI and/or the editor(s). MDPI and/or the editor(s) disclaim responsibility for any injury to people or property resulting from any ideas, methods, instructions or products referred to in the content. |
© 2025 by the authors. Licensee MDPI, Basel, Switzerland. This article is an open access article distributed under the terms and conditions of the Creative Commons Attribution (CC BY) license (https://creativecommons.org/licenses/by/4.0/).
Copyright: This open access article is published under a Creative Commons CC BY 4.0 license, which permit the free download, distribution, and reuse, provided that the author and preprint are cited in any reuse.


