
Submitted:
04 September 2025
Posted:
05 September 2025
You are already at the latest version
Abstract
The continued use of agrochemicals in Valle de Arista, SLP, Mexico, has generated loss of effectiveness of molecules and impacts on public health and the environment. To identify environmental and socioeconomic impacts, a quantification method was designed using the Kovach Environmental Impact Quotient and environmental accounting of pesticides (Leach and Mumford) that included agricultural diagnosis, identification of agrochemicals impacts. Producers, technical advisors and agri-inputs dealers were surveyed as key agents of tomato (Solanum lycopersicum) and chili pepper crops (Capsicum annuum) due to their economic importance. Gower quotation coefficients were calculated to measure similarity of quantitative, qualitative and dichotomous variables with continuous, discrete and binary characteristics. The use of fungicides (carbendazim and chlorothalonil) showed the greatest environmental impact, followed by insecticides (endosulfan, thiametoxam) and herbicides. The negative externality averaged USD$15.60 ha-1, corresponding to 50% of tomato, 31.25% to poblano pepper and 18.75% to serrano pepper. Estimated damages due to the use of greenhouses were 37.7% to the consumer, 21.2% to the worker, 14.8% to aquatic life, 3.6% to birds, 9.2% to bees and 3.3% to insects.
Keywords:
public health
; environmental management
; prohibited agrochemicals
; vegetables
1. Introduction
From 1980 to 1990, San Luis Potosí, Mexico, ranked third nationally in agricultural production, primarily attributed to the agricultural zone of the Valle de Arista, which accounted for over half of the agricultural production of the state. However, this productivity entailed excessive use of agrochemicals [1]. By the mid-1990s, the productive and environmental conditions of the Valle de Arista began to show divergent trends, as a consequence of the irrational use of agrochemicals, overexploitation of the bearing capacity of the soil, depletion of the aquifer capacity, and loss of biodiversity [2].
Currently, the man primary economic activity in Valle de Arista is agriculture [3], which has been significantly impacted by the increased presence of pests and diseases. The intensive use of synthetic agricultural inputs has consequently resulted in issues such as resistance development, reduced effectiveness of active compounds (aging) and severe impacts on public health and the environment [4].
For many years, pesticides have been continuously used for pest control. This practice suggests that producers are largely unaware of more environmentally friendly alternatives (such as biological control). Unlike most agrochemicals, biological control methods are beneficial for both the environment and society [5].
Producers in the horticultural zone of the Valle de Arista, like in other agricultural production areas in Mexico, do not fully understand the environmental, economic, and social impacts associated with the intensive use of agricultural inputs (fertilizers, insecticides, herbicides, and fungicides). Several researchers have studied the consequences of irrational pesticide use; nevertheless, local analyses are essential to understand and quantify these impacts in each region [6].
Developing new production processes and tools for the identification of the impact of agricultural inputs is necessary to address this issue, with the aim of mitigating the rapid aging of pesticide active ingredients and reducing their impact on environment and human health. The following issues were proposed as guidelines for this research: key factors in the study area that influence the choice of input application technologies; negative impacts of pesticide use; production alternatives available to reduce negative impacts on agricultural production; and willingness of the farmers to adopt new tools in their agricultural production systems.
In this sense, the objective was to apply a method to identify, through a diagnosis, the factors that influence decision-making on the use of agrochemicals in an important horticultural area, by quantifying the volume of pesticides used and their impact, based on the methodology of the Environmental Impact Quotient (EIQ) [7] and the Environmental Accounting System for Pesticides [8]. The purpose was to help understand the general behavior of farmers, evaluating some of the environmental and socioeconomic risks and impacts of pesticide use.
2. Materials and Methods
Some authors [9] consider that the objective of descriptive research is to determine the prevailing situations, customs, and attitudes through the description of activities, objects, processes, and people. Additionally, this type of research (surveys) documents observable and verifiable characteristics or traits, clearly expressed in the testimonies of the research subjects. The study was conducted in the Valle de Arista region, whose municipality (22°39'00.0"N 100°51'00.0"W) is located at 86 km north of the city of San Luis Potosí, Mexico, in the Altiplano Potosino, at 1,610 m of altitude). The region has a semi-arid, semi-warm climate (BS1hw), with an annual average temperature exceeding 18 °C, annual precipitation ranging from 300 to 500 mm, summer rains, and winter precipitation accounting for approximately 10% of the annual total rain. Its main characteristic is an endorheic sub-basin that is part of the Salado hydrological region [10].
The valley encompasses the municipalities of Villa de Arista, Moctezuma, Venado, and the sub-municipality district of Bocas (part of the municipality of San Luis Potosí, Mexico), covering an area of approximately 200,000 hectares. Its primary economic activity is irrigated agriculture [11], growing mainly vegetables —such as chili peppers, tomatoes, onions, squash, and cucumbers, as well as forage species (sorghum, oats, and maize) [12]. Production is mainly for the domestic market; however, the region also contributes to export-oriented agriculture, supplying mostly the United States market.
Intervention Method
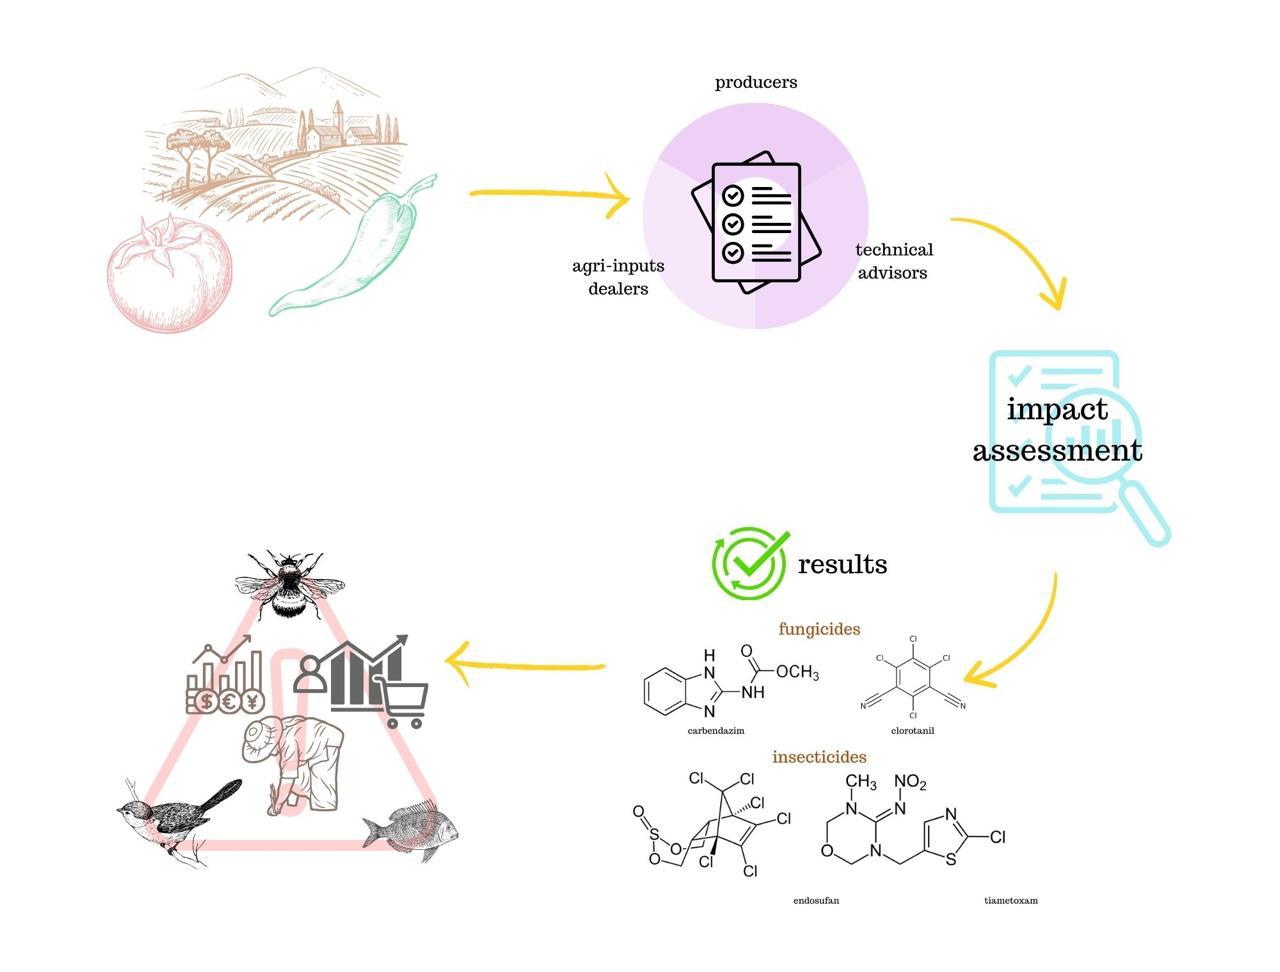
A five-phase method was used to diagnose and evaluate the impact of agrochemical use (Figure 1), which included socioeconomic, environmental, and technological variables. This approach facilitates the identification of key producer characteristics, such as age, education level, and gender. It also determines the impact by applying the Environmental Impact Quotient (EIQ) developed by [7] and the evaluation of the socioeconomic impact based on the primary inputs used, following the methodology of [8].
To estimate the impact of pesticides on various agricultural crops and calculate the Environmental Impact that would facilitate the organization and simplification of data on their use, the model of [7] was used. This model converts environmental impact into quantitative information, developing an equation based on three key components of agricultural production systems: harm to workers, consumers and non-human biota. The unit of measurement is a score assigned to each component according to the level of risk it represents to human health and the ecosystem. This methodology is based on the physical, chemical and toxicological properties of the products [13]. The EIQ is one of the most widely used pesticide risk indicators in the world, as it has proven to be an effective tool for evaluating the potential hazardous effects of pesticides on human health and the environment, across a wide range of crops, farming practices, and agricultural areas [13]. In Mexico, the EIQ model has been used to quantify and compare the environmental impact of pesticides in chili crops [14], as well as to assess the environmental impact of pesticide use in apple orchards [15].
The values determining the EIQ for numerous pesticides were taken from a database sponsored by Cornell University [26]. Once the EIQ was determined, an Environmental Field Impact Factor (EIFF) was developed, based on the dose and frequency of application of the pesticide in the field calculated using the following equation.:
where:
- q = active ingredient percentage of the insecticide
- d = amount of commercial products applied in the field
- n = number of applications
- EIQ = environmental impact quotient obtained from the database of [7].
Figure 2 shows the context of the method, considering the main economically significant crops in Valle de Arista. Likewise, it includes their economic, environmental, social, and technological aspects, as well as the variables that integrate them, in order to determine the diagnosis and to enable the development of proposals.
Comprehensive Diagnosis of the Study Area
This stage includes a non-experimental field study, directly developed with the agricultural sector of the Valle de Arista, as suggested by [16], who states that field research involves collecting data directly from the stakeholders or from the reality where the events take place.
A database was developed by collecting information through surveys conducted with farmers, agricultural workers, professionals, and input marketers in the study region. The effectiveness, efficiency, and costs of the main agrochemicals used were categorized. Furthermore, the statistical analysis of this data enabled the identification of the phytosanitary issues, pest control technologies, and impact on the environment, agricultural workers, and consumers.
Through an observational analytical study, variables of interest were selected to understand their relationship. The aim was to detect patterns in the application of agricultural inputs, describe associations between variables. A simple random sampling method was used, i.e., all farmers, technicians, and companies had the same probability of being included, and each of these had an equal chance of being chosen.
Statistical Analysis and Decision-Making
The first step in data analysis was coding assigning numerical symbols to the responses provided by the respondents. A database was developed to obtain a diagnosis about the reasons that led farmers to make decisions regarding the use of agrochemicals, fertilizers, or innovative inputs (Table 1).
Socioeconomic Impact Assessment
Leach and Mumford [8] developed a method that allows to evaluate the economic cost of negative externalities produced by the use of pesticides. A negative externality is a harmful effect that a certain economic activity generates on third parties that are not directly involved in said activity, and that is not reflected in the costs of production or in the market prices [20]. Pollution due to the use of pesticides in soil, water and air and its impact on human health are examples of negative externalities, and their cost is not always recognized in the conventional market (the one governed by free supply and demand) due to the complexity that its estimation represents [6]. However, it is always absorbed by society. This method is based on the ecotoxicology of the active ingredient, its behavior in the environment, its price and quantity applied to different agricultural crops. The cost of externalities described in the system they called environmental accounting of pesticides is based on the characterization proposed by [7], and the social cost is estimated for six components of ecosystems: water for domestic use, fish and aquatic life, biodiversity, cultural landscape, hives (bees) and human health (Table 2).
Leach and Mumford [8] classified the costs of each environmental impact category according to their effect on the environment and the health of workers and consumers (Table 3).
With the components described, it is possible to evaluate which active ingredients of pesticides are most harmful to the environment and which represent the greatest cost to society, as well as to propose their reduction or elimination [7]. The calculation was developed for countries in Europe and the USA, concentrating the costs for the six groups. However, for these absolute values to be applied to other crops and study areas, an adjustment factor for each country's economic level, known as purchasing power parity (PPP), must be used [7]. PPP is an economic method that allows comparing the purchasing power of different currencies, adjusting for differences in price levels between countries. PPP is based on the idea that the same amount of money should purchase the same amount of goods and services in different countries, once local prices are adjusted by [22]. According to the Organization for Economic Cooperation and Development (OECD), the PPP rate for Mexico is 48 over a level of USD$100 (OECD, 2020), so that with the information from Table 2 and Table 3, as well as the PPP factor, the cost of externalities in the use of pesticides was estimated using the USD as a reference value.
Sample Size and Information Analysis
To validate the method, N=40 key stakeholders (producers, technical advisors, and agricultural input marketers) of tomato (Solanum lycopersicum L.) and poblano and serrano peppers (Capsicum annuum L.) were identified and surveyed. These stakeholders cultivate and technically manage the most economically important crops and cultivated areas in the study area. Statistical analysis was performed using descriptive statistics to explain the most important generalities of the key stakeholders' production systems. To stratify the farmers, a principal components analysis was performed, and the variables that explained the greatest proportion of the variation were selected. Subsequently, the Gower similarity coefficient was calculated [17], considering that it is a measure of similarity that allows the simultaneous use of quantitative, qualitative and dichotomous variables and facilitates identifying the degree of similarity between individuals [17] to whom continuous, discrete and binary characteristics have been measured with the following equation:
where:
- p1 = number of quantitative variables
- a = number of matches in 1
- d = number of matches in 0 of the p2 binary variables
- α = number of matches for the p3 qualitative variables
- Gh = range of the ith quantitative variable
- Range = X maximum – X minimum
3. Results
The respondents were adults between 30 and 57 years old (average: 45). Their education level ranged from elementary school to bachelor's degree (average: secondary school). They cultivate crops on both owned and rented lands, although the average indicates a trend toward the latter. None of the participants engage in rainfed agriculture; instead, they all depend on open-field irrigation systems. However, there is also a trend toward the use of shade house and greenhouses.
Regarding the production destination, all participants stated that their production is sold in the domestic market. The main crops are tomato and poblano chili, with a smaller proportion of serrano chili. The generational shift is underway, with few training activities available though. They mentioned to be either willing or getting ready to properly manage pesticide waste. The most significant pests are red spider mites and chili weevil, which lead them to consider using pesticides such as Imidacloprid and Malathion. The main diseases are caused by Phytophthora sp. and Rhizoctonia sp., which they control with 75% Chlorothalonil. Weed control is manual and with the herbicide 2,4-D. Some respondents mentioned the use of Chlorothalonil and Mancozeb (fungicides), as well as beneficial organisms such as Beauveria bassiana and mycorrhizal fungi (Glomus sp.). They also include monitoring and pheromone trapping in the case of chili weevil.
The analysis showed the formation of thirteen groups that accounted for 80% of the variability of responses (Figure 3 and Figure 4).
The principal component analysis (PCA) showed that seven components accounted for 82% of the variance (Figure 5). PC1 linked the production infrastructure (open field, shade net, or greenhouse), type of crop (poblano chili, serrano chili, and tomato), production costs, and main pests, with a 25% variability.
Meanwhile, PC2 considered the following variables: application and final disposal of waste, use of biological inputs, and additional practices to prevent or protect crops. As a whole, they accounted for 15% of the variability in the responses of farmers. Together with PC1, they accounted for a 40% cumulative variance. PC3 (11%) was composed of the surface area cultivated and generational shift variables, summing a ≤51% of the variance. PC4 (9%) was related to farmer training and the use of low environmental impact agricultural inputs (green label), while PC5 (8%) grouped the land ownership variable. Finally, PC6 included the use of fungicides and nematicides for disease control (8%), while PC7 was the application and final disposal of waste (6%).
Estimation of the Environmental Impact of Chemical Synthesis Inputs
Table 4 shows the main pesticides used by the farmers and the calculated field environmental impact factor.
The Environmental Impact Factor in the Field (EIFF) value ranged from 2 to 30 (average: 11 units). The highest EIFF was recorded by the fungicide carbendazim (30), followed by chlorothalonil (24.25). One of the active ingredients on the list is chlorpyrifos (EIFF: 14 units), which is used for insect control. In this evaluation, the said pesticide was seldom used and therefore did not have a high impact. This insecticide has been banned in many European countries and nearly eliminated in the USA. Several authors have classified pesticides based on the EIFF, using the system proposed by [18]; therefore, low-impact pesticides were classified between 0 and 20 units, medium-impact between 21 and 40 units, and high-impact pesticides with values above 40 units. The products used in the study area (e.g., chlorothalonil and carbendazim) are considered of medium impact, while the rest were classified as low impact. When analyzing the total impact by groups, the highest EIFF found was for the use of fungicides, followed by insecticides, and lastly by herbicides, with no significant difference in their values (Table 5).
Cumulatively, 251 units of insecticide were applied to tomatoes, while 217 and 165 units were applied to poblano and serrano peppers, respectively. Authors like [19] pointed out that products with values greater than 550 have a very strong environmental pressure and they therefore propose reducing the doses and frequency of application. They even suggest the use of alternative methods, such as biological or mechanical control, without fully eliminating chemical products.
Along with the PPP factor, the cost of externalities for pesticide use in Valle de Arista was estimated using USD as the reference value. Table 6 shows the costs of the externalities from carboxylic groups frequently used by farmers. The average cost of negative externalities per farmer was USD $15.60 per hectare. When multiplied by the total cultivated hectares of the 20 surveyed participants (160 hectares per year), this figure results in an average cost of USD $2,496.00 per year. Pymetrozine registered the lowest impact with USD $3.32 per hectare, while carbendazim was the ingredient with the highest impact at USD $46.84 per hectare, followed by the Maneb fungicide with a cost of USD $23.84 per hectare.
The cost of all pesticides was estimated at USD $350.2, which matched the costs of tomato (50%), Poblano chili (31.25%), and serrano chili (18.75%) cultivation. The most significant damages were caused to the consumer (37.7%), applicators and harvesters (21.2%), and aquatic life (14.8%). Birds (3.6%), bees (9.2%), and beneficial insects (3.3%) were subjected to a lower proportion of the damage (Table 7).
Discussion
The use of multivariate analyses such as the Gower coefficient and Principal Component Analysis (PCA) allowed us to identify important differences between types of producers, associated with variables such as infrastructure, commercial orientation, and level of training. This differentiation is key to avoiding the implementation of proposals or alternatives for general application, which rarely respond to the diversity of our farmers. These results are consistent with various studies conducted in agricultural systems (25), which have shown that typological characterization allows for the design of more efficient intervention strategies.
Regarding low-impact agricultural practices, a limited presence of biological and ethological control was identified. Although these strategies have proven effective, many producers still perceive them as uncertain or insufficient compared to traditional agrochemicals. This perception is reinforced by the lack of technical training, the limited availability of bioinputs, and the absence of technical support. Another factor is that many of these practices are still not recognized or valued in marketing channels, which discourages their adoption. As [5] points out, without coherent institutional-governmental support, it will be difficult to consolidate low-impact alternatives in territories with high production pressure. Therefore, it is essential to strengthen rural extension services and create marketing incentives that allow for the inclusion of low-impact alternatives in agricultural management programs.
Regarding the socioeconomic impact, Leach and Mumford [8] developed another method that evaluates the economic cost of the negative externalities of pesticides. Authors like [20] explains what the negative externalities are undesirable situations in which the actions of an economic activity harms third parties who are not part of the market and who nevertheless do not receive compensation for the damage. Soil, water, and air pollution caused by pesticide use, as well as its impact on human health, are examples of negative externalities. Their cost is not always recognized in the conventional market (ruled by supply and demand), given its complex calculation. However, this cost is always absorbed by society [21]. This method is based on the ecotoxicology of the active ingredient, its behavior in the environment, its price, and the amount applied to different agricultural crops.
This study arose from an interest in understanding and addressing the effects of intensive agrochemical use in rural areas. The goal was to design and apply a comprehensive methodology capable of identifying, quantifying, and proposing actions to reduce the environmental and socioeconomic impacts derived from agrochemical use in Valle de Arista, San Luis Potosí, Mexico. The proposal is based on the integration of the Environmental Impact Quotient (EIQ) of [7] and the environmental accounting model for pesticides developed by Leach and Mumford [8]; tools widely recognized for their applicability in agricultural systems [7,8].
The results show that the fungicides Carbendazim and Chlorothalonil are the active ingredients with the greatest environmental impact, with EIQ values in the field of 30 and 24.25 units, respectively. These results are consistent with previous work documenting the high toxicity and environmental persistence of these compounds [15,23]. Although Chlorpyrifos appears with a low incidence, its mere presence suggests that there are still deep-rooted practices that require regulatory and training attention [24], since these pesticides are banned in many countries and yet continue to be marketed in Mexico.
From an economic perspective, the Leach and Mumford model estimated an average externality cost of USD $15.60 per hectare. Although this value may seem low, it represents a constant cost, assumed by the most vulnerable: rural communities, agricultural workers, consumers, and aquatic ecosystems. The active ingredients with the highest social costs were Carbendazim and Pymetrozine, significantly affecting consumers (37.7%), agricultural workers (21.2%), and aquatic organisms (14.8%). This impact distribution coincides with the negative externalities of pesticides [8,20], where the real cost is not paid by the producer, but by vulnerable sectors of the social and environment, and the need to implement programs related to health and environmental sanitation, among others.
Although it is not possible to generalize about the predominant agricultural practices in the study region, the results provide insight into the local dynamics of farmers. This approach cannot provide definitive answers, but it opens up possibilities for reorienting the types of agrochemicals used and for designing alternative methodological avenues for research that can mitigate impacts on the contextualized environment as an entity and as the sum of its parts.
The ability to translate qualitative ecological and social impacts into understandable and usable data for integrated management is one of the main contributions of this work. From this perspective, the methodology represents a solid foundation for designing tools that help rethink agricultural production strategies in a more comprehensive manner, considering not only economic yields and benefits, but also the social costs and externalities that often remain invisible in conventional assessments. The systematic application of this type of method can contribute to the formulation of public policies and strategies that promote social well-being, environmental protection, and the economic viability of agricultural production systems. It is evident that in the agricultural area of Valle de Arista, it is essential to gradually transform production systems by including agroecological practices and prioritizing those that respond to both productive demands and the urgent need to protect the environment and improve living conditions, promoting viable and sustainable solutions.
The participation of farmers from the agricultural region of Valle de Arista, San Luis Potosí, Mexico, allowed this study to both describe the current practices of farmers in the use of agrochemicals and to quantify the environmental and socioeconomic impact of these practices. The Environmental Impact Quotient (EIQ) show that fungicides Carbendazim and Chlorothalonil have the highest environmental impact; in contrast, Chlorpyrifos, an active ingredient banned in other countries, has a low impact due to its infrequent use. The socioeconomic analysis, based on the pesticide environmental accounting method, estimates an annual average cost of USD $15.60 per hectare, due to the negative externalities generated by pesticide use.
4. Conclusions
Carbendazim and Pymetrozine are the active ingredients with the highest socioeconomic cost, primarily impacting the consumer, then workers (applicator and harvester), and aquatic life. This proposal not only diagnoses the current situation, but it is also a crucial tool for planning strategies that promote social, environmental, and economic well-being, highlighting the need for a shift toward sustainable agricultural practices that include alternatives such as biological control. These alternatives, along with the training of farmers, could reduce dependence on pesticides and minimize their negative impacts on the environment and human health.
Author Contributions
For research articles with several authors, a short paragraph specifying their individual contributions must be provided. The following statements should be used “Conceptualization, J.C.I. and V.M.R.M.; methodology, I.H.R. and V.M.R.M.; software, E.P.R.; validation, B.I.T.T., and V.M.R.V.; formal analysis, A.S.M.; investigation, V.M.R.M.; resources, B.I.T.T.; data curation, X.X.; writing—original draft preparation, V.M.R.M and I.H.R.; writing—review and editing, J.C.I. All authors have read and agreed to the published version of the manuscript.
Funding
This research received no external funding.
Conflicts of Interest
The authors declare no conflicts of interest.
Abbreviations
The following abbreviations are used in this manuscript:
| EIQ | Environmental Impact Quotient |
| PPP | Purchasing power parity |
| EIFF | Environmental Field Impact Factor |
| OECD | Organization for Economic Cooperation and Development |
References
- Maisterrena, J., & Mora, I. (2000). Oasis y espejismo: Proceso e impacto de la agroindustria del jitomate en el valle de Arista, S.L.P. El Colegio de San Luis: Sistema de Investigación Miguel Hidalgo: Gobierno del Estado, Secretaría de Ecología y Gestión Ambiental. https://catalog.hathitrust.org/Record/004168225.
- Maisterrena, J., Mora, I., & Centro de Investigaciones Históricas de San Luis Potosí. (1996). Riego, trabajo y producción de hortalizas: El Valle de Arista en el altiplano potosino: avance de investigación. Centro de Investigaciones Historicas de San Luis Potosí. https://catalog.hathitrust.org/Record/101234527.
- Instituto Nacional de Estadística y Geografía (INEGI). (2020). Censo de Población y Vivienda 2020. https://www.inegi.org.mx/programas/ccpv/2020/.
- Torres, D., & Capote, T. (2004). Agroquímicos un problema ambiental global: uso del análisis químico como herramienta para el monitoreo ambiental. Ecosistemas, 13(3).
- Zelaya-Molina, L. X., Chávez-Díaz, I. F., de los Santos-Villalobos, S., Cruz-Cárdenas, C. I., Ruíz-Ramírez, S., & Rojas-Anaya, E. (2022). Control biológico de plagas en la agricultura mexicana. Revista mexicana de ciencias agrícolas, 13(SPE27), 69–79. [CrossRef]
- Altieri, M. A., & Nicholls, C. I. (2009). Cambio climático y agricultura campesina: Impactos y respuestas adaptativas - Leisa. https://leisa-al.org/web/revista/volumen-24-numero-04/cambio-climatico-y-agricultura-campesina-impactos-y-respuestas-adaptativas/.
- Kovach, J., Petzoldt, C., Degni, J., & Tette, J. (1992). A Method to Measure the Environmental Impact of Pesticides. https://hdl.handle.net/1813/55750.
- Leach, A. W., & Mumford, J. D. (2008). Pesticide Environmental Accounting: A method for assessing the external costs of individual pesticide applications. Environmental Pollution, 151(1), 139–147. [CrossRef]
- Guevara Alban, G. P., Verdesoto Arguello, A. E., & Castro Molina, N. E. (2020). Metodologías de investigación educativa (descriptivas, experimentales, participativas, y de investigación-acción). RECIMUNDO, 4(3), 163–173. [CrossRef]
- Comisión Nacional para el Conocimiento y Uso de la Biodiversidad (CONABIO). (2023). Región hidrológica del río Salado. Sistema Nacional de Información sobre Biodiversidad. https://www.biodiversidad.gob.mx.
- Instituto Nacional de Estadística y Geografía (INEGI). (2020). Censo de Población y Vivienda 2020. https://www.inegi.org.mx/programas/ccpv/2020/.
- Instituto Nacional de Estadística y Geografía (INEGI). (2022). Censo Agropecuario 2022. https://www.inegi.org.mx/programas/cagf/2022/.
- Jáquez-Matas, S. V., Pérez-Santiago, G., Márquez-Linares, M. A., & Pérez-Verdín, G. (2022a). Impactos económicos y ambientales de los plaguicidas en cultivos de maíz, alfalfa y nogal en Durango, México. Revista Internacional de Contaminación Ambiental. [CrossRef]
- Vargas-González, G., Alvarez-Reyna, V. de P., Guigón-López, C., Cano-Ríos, P., García-Carrillo, M., Vargas-González, G., Alvarez-Reyna, V. de P., Guigón-López, C., Cano-Ríos, P., & García-Carrillo, M. (2019). Impacto ambiental por uso de plaguicidas en tres áreas de producción de melón en la Comarca Lagunera, México. CienciaUAT, 13(2), 113–127. [CrossRef]
- Ramírez Legarreta, M. R., & Jacobo-Cuéllar, J. L. (2002). Impacto ambiental del uso de plaguicidas en huertos de manzano del noroeste de Chihuahua, México. Revista Mexicana de Fitopatología, 20(2), 165–170.
- Arias, F. G. (2012). El Proyecto de Investigación: Introducción a la Metodología Científica. 6ta. Edición. Fidias G. Arias Odón.
- Demey, J. R., Pla, L., Vicente-Villardón, J. L., Rienzo, J. A. D., & Casanoves, F. (2011). Medidas de distancia y de similitud.
- Mazlan, N., & Mumford, J. (2005). Insecticide use in cabbage pest management in the Cameron Highlands, Malaysia. Crop Protection, 24(1), 31–39. [CrossRef]
- López, C. G., & González-González, P. A. (2007). Manejo de plagas en el cultivo de chile y su impacto ambiental en la zona agrícola de Jiménez-Villa López, Chihuahua, México: Pest management in the pepper crop and their environmental impact in the Jiménez-Villa López, Chihuahua, México agricultural zone. TECNOCIENCIA Chihuahua, 1(2), Article 2. [CrossRef]
- Mankiw, N. G. (2012). Principios de Economía (6a ed.). Cengage Learning. https://fliphtml5.com/xbyw/sivt/Mankiw%2C_N._G._%282012%29_Principios_de_Econom%C3%ADa_%286%C2%AA_ed.%29._Cengage_Learning/842/.
- Altieri, M. A., & Nicholls, C. I. (2009). Cambio climático y agricultura campesina: Impactos y respuestas adaptativas - Leisa. https://leisa-al.org/web/revista/volumen-24-numero-04/cambio-climatico-y-agricultura-campesina-impactos-y-respuestas-adaptativas/.
- Obstfeld, M., & Krugman, P. R. (2006). Economía internacional: Teoría y política. http://148.202.167.116:8080/xmlui/handle/123456789/3184.
- Silva, V.; Mol, H.G.J.; Zomer, P.; et al. Pesticide residues in European agricultural soils–A hidden reality unfolded. Sci. Total Environ. 2019, 653, 1532–1545. [CrossRef]
- US EPA. Información básica sobre pesticidas. https://www.epa.gov/espanol/informacion-basica-sobre-pesticidas.
- Mercado Escamilla, F.; Ayala Garay, A.V.; et al. Factores que influyen en la adopción de innovaciones en productores de naranja en Veracruz. Agric. Soc. Desarro. 2019, 16(2), 183–198. [CrossRef]
- Universidad de Cornell. (s/f). EIQ | CALS. Recuperado el 11 de marzo de 2025, de https://cals.cornell.edu/new-york-state-integrated-pest-management/risk-assessment/eiq.
Figure 1.
Phases of the diagnosis and evaluation method regarding the impact of agrochemicals. Figure developed by the authors.
Figure 1.
Phases of the diagnosis and evaluation method regarding the impact of agrochemicals. Figure developed by the authors.

Figure 2.
Context, aspects, and elements of both horticultural crops and the phases, variables, and potential method that reduces the impact of agrochemical use. Figure developed by the authors.
Figure 2.
Context, aspects, and elements of both horticultural crops and the phases, variables, and potential method that reduces the impact of agrochemical use. Figure developed by the authors.
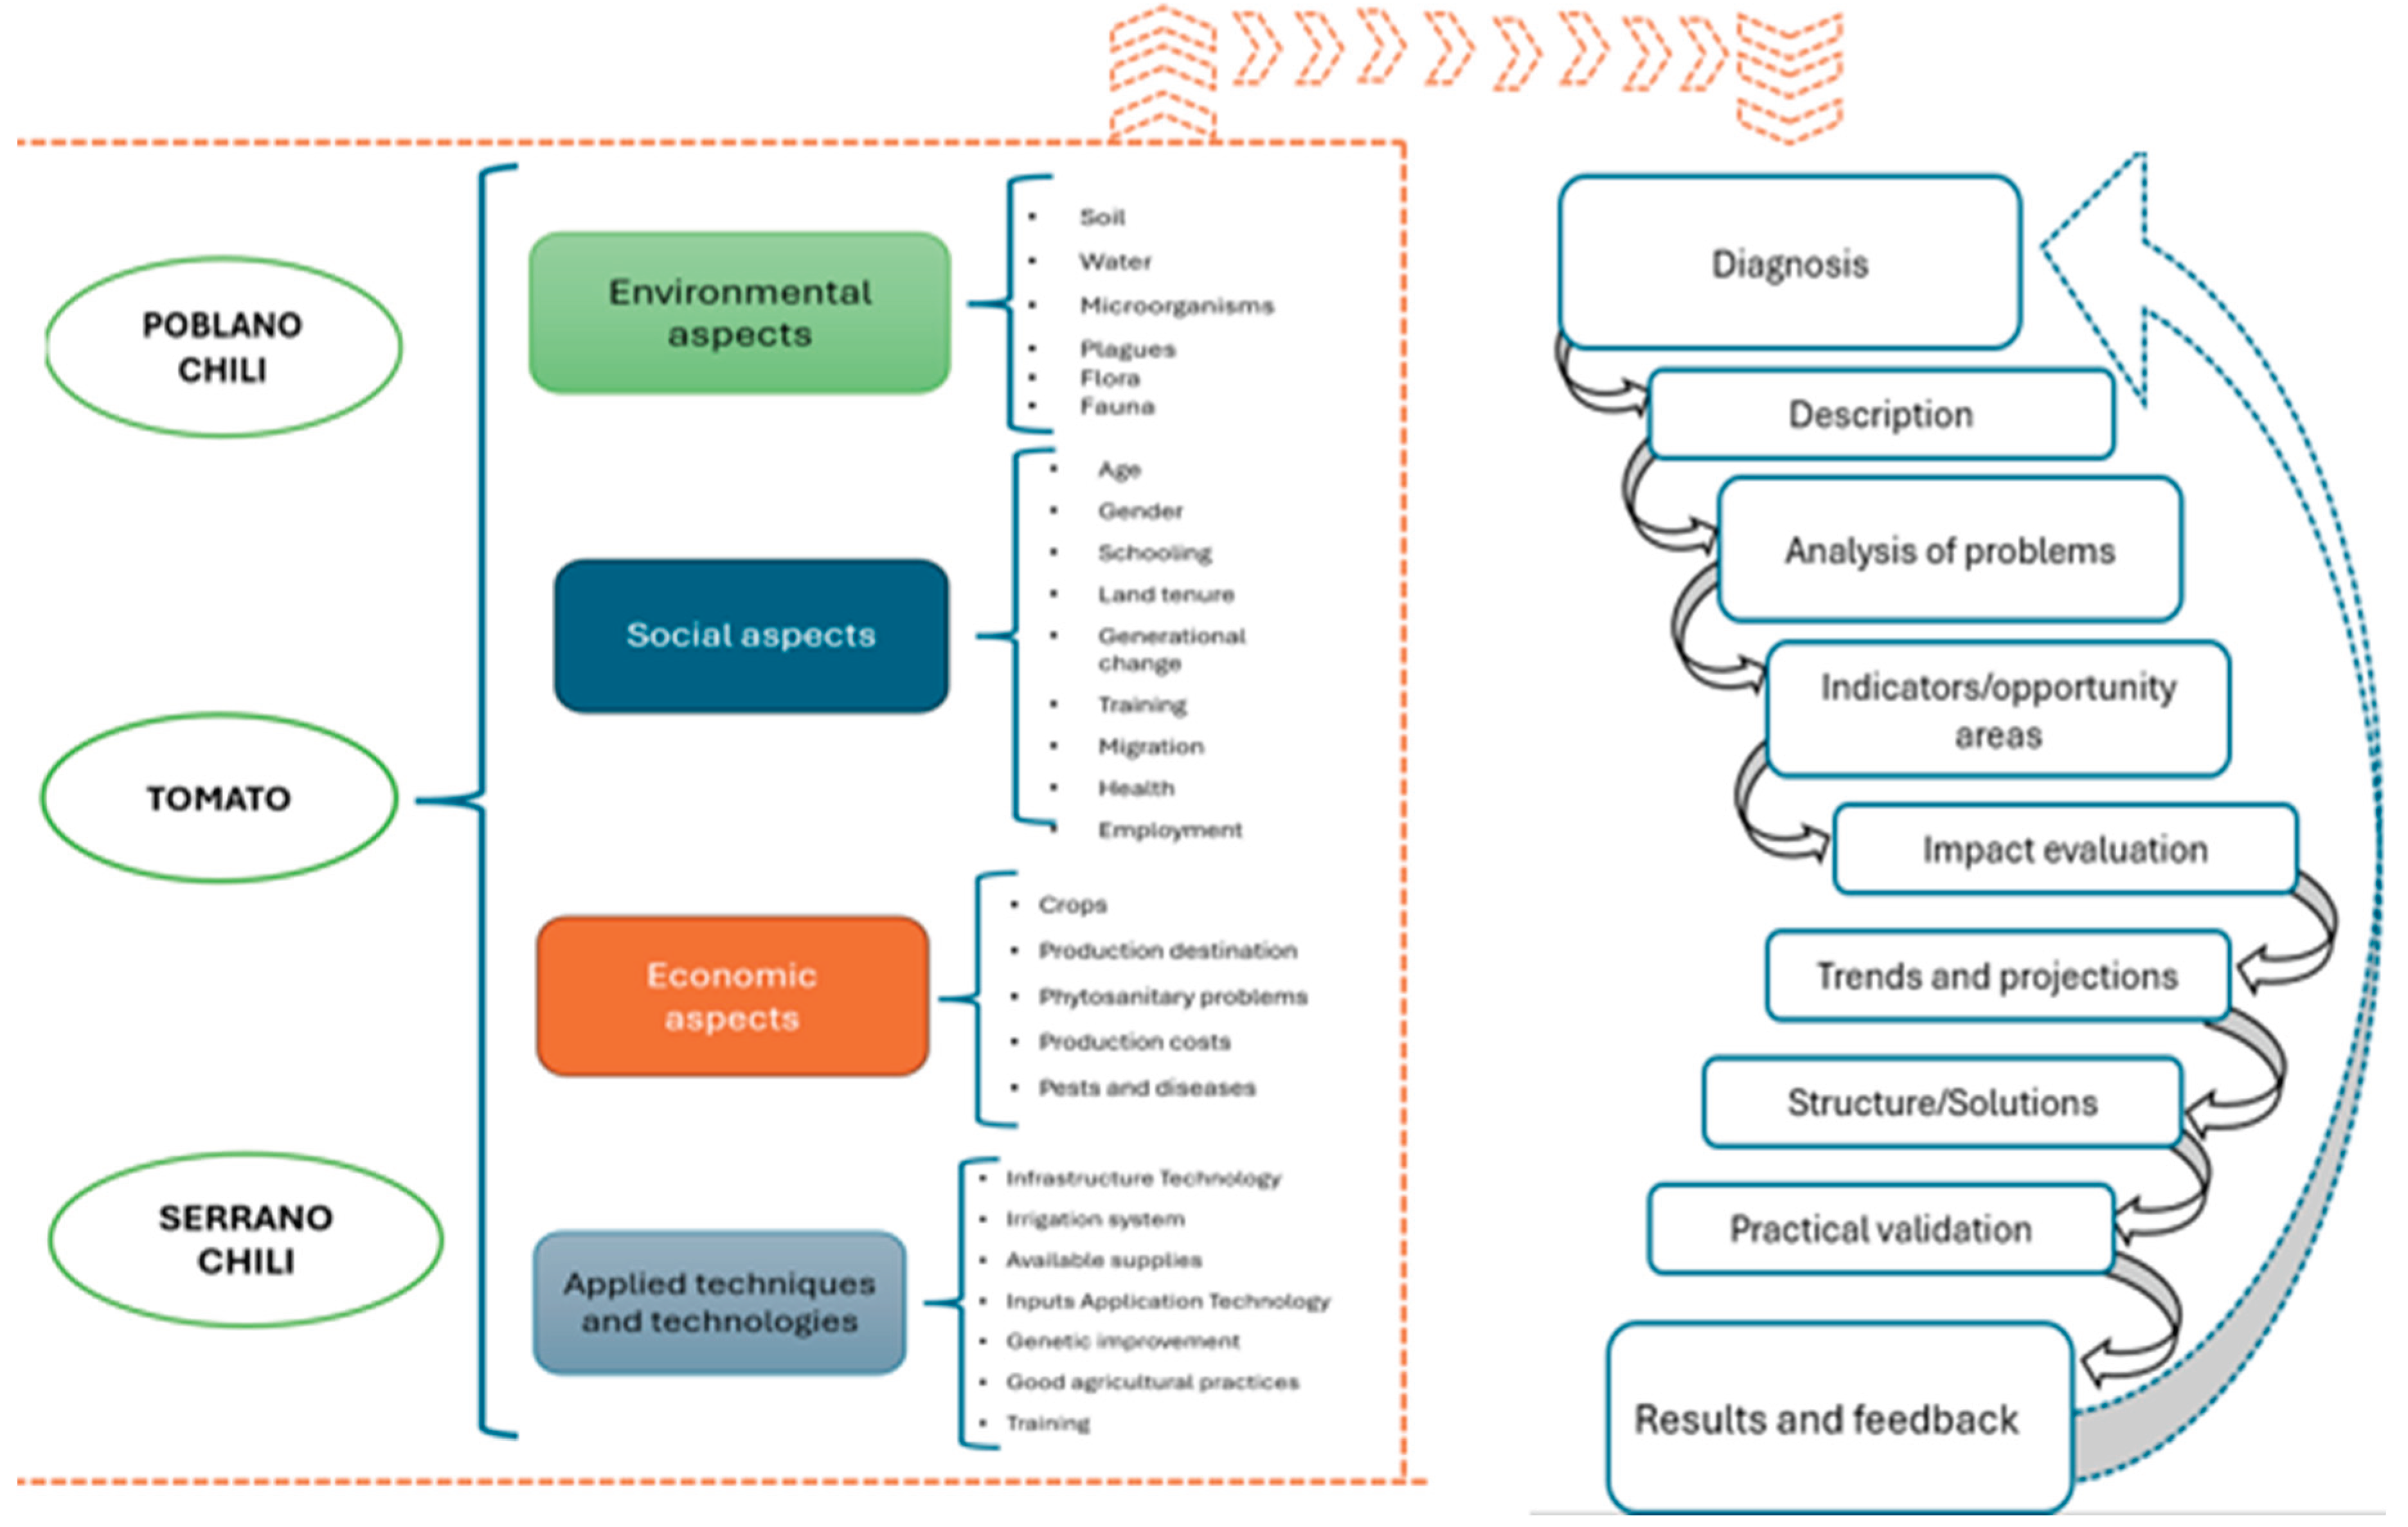
Figure 3.
Explanatory variance according to respondent groups.
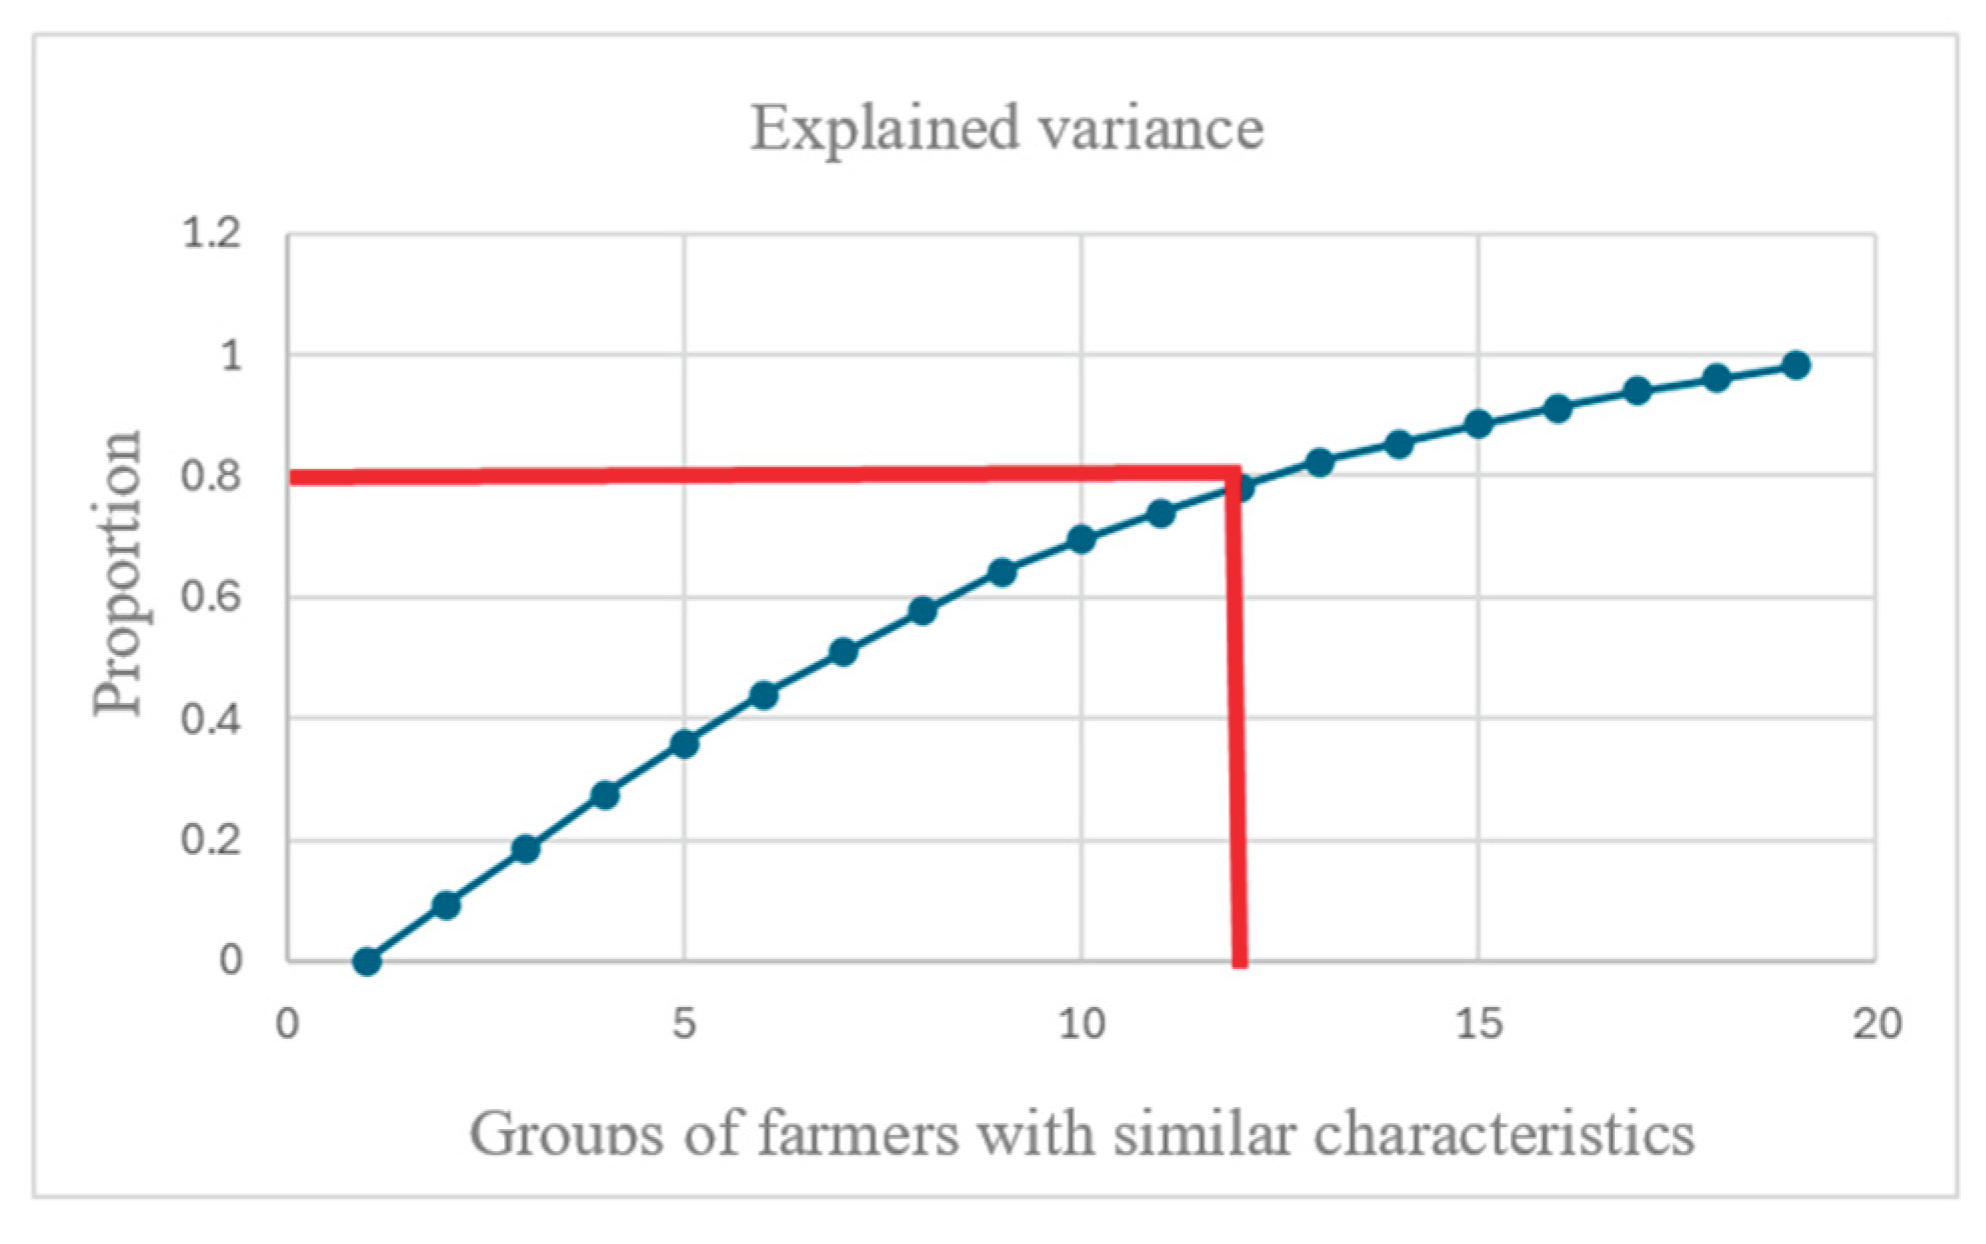
Figure 4.
Producer groups by similarity.
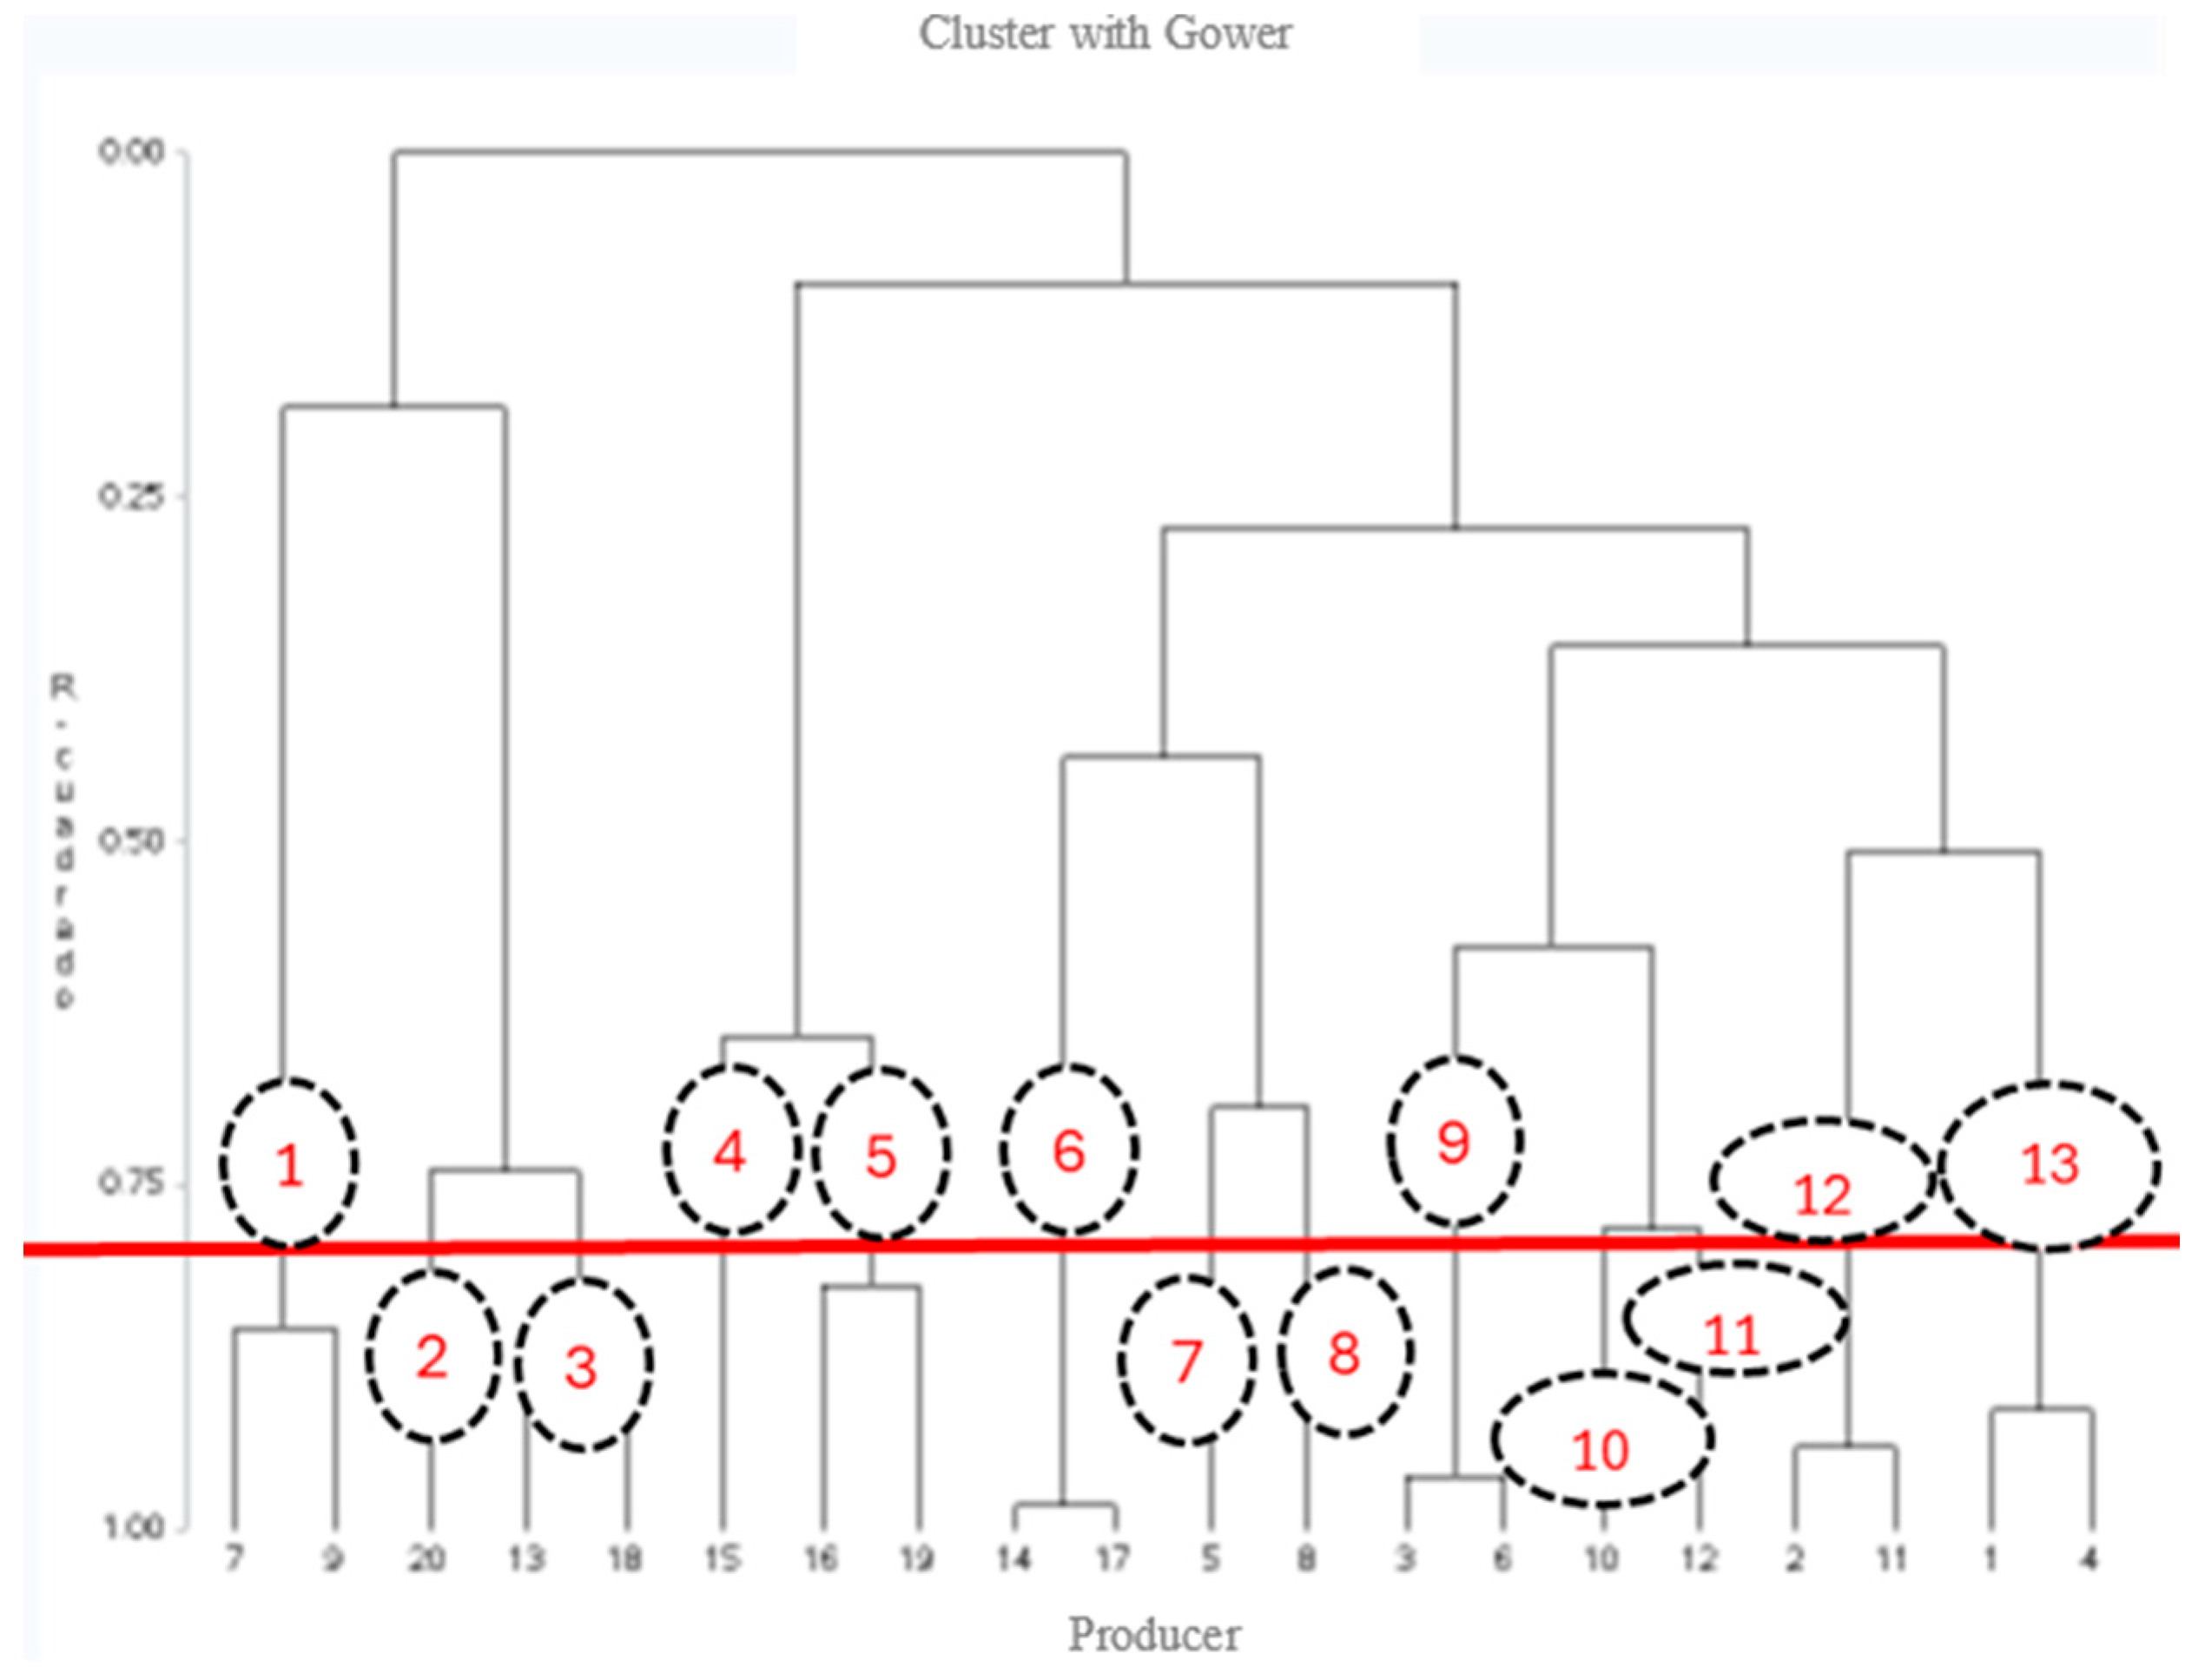
Figure 5.
Percentage value of each main component.
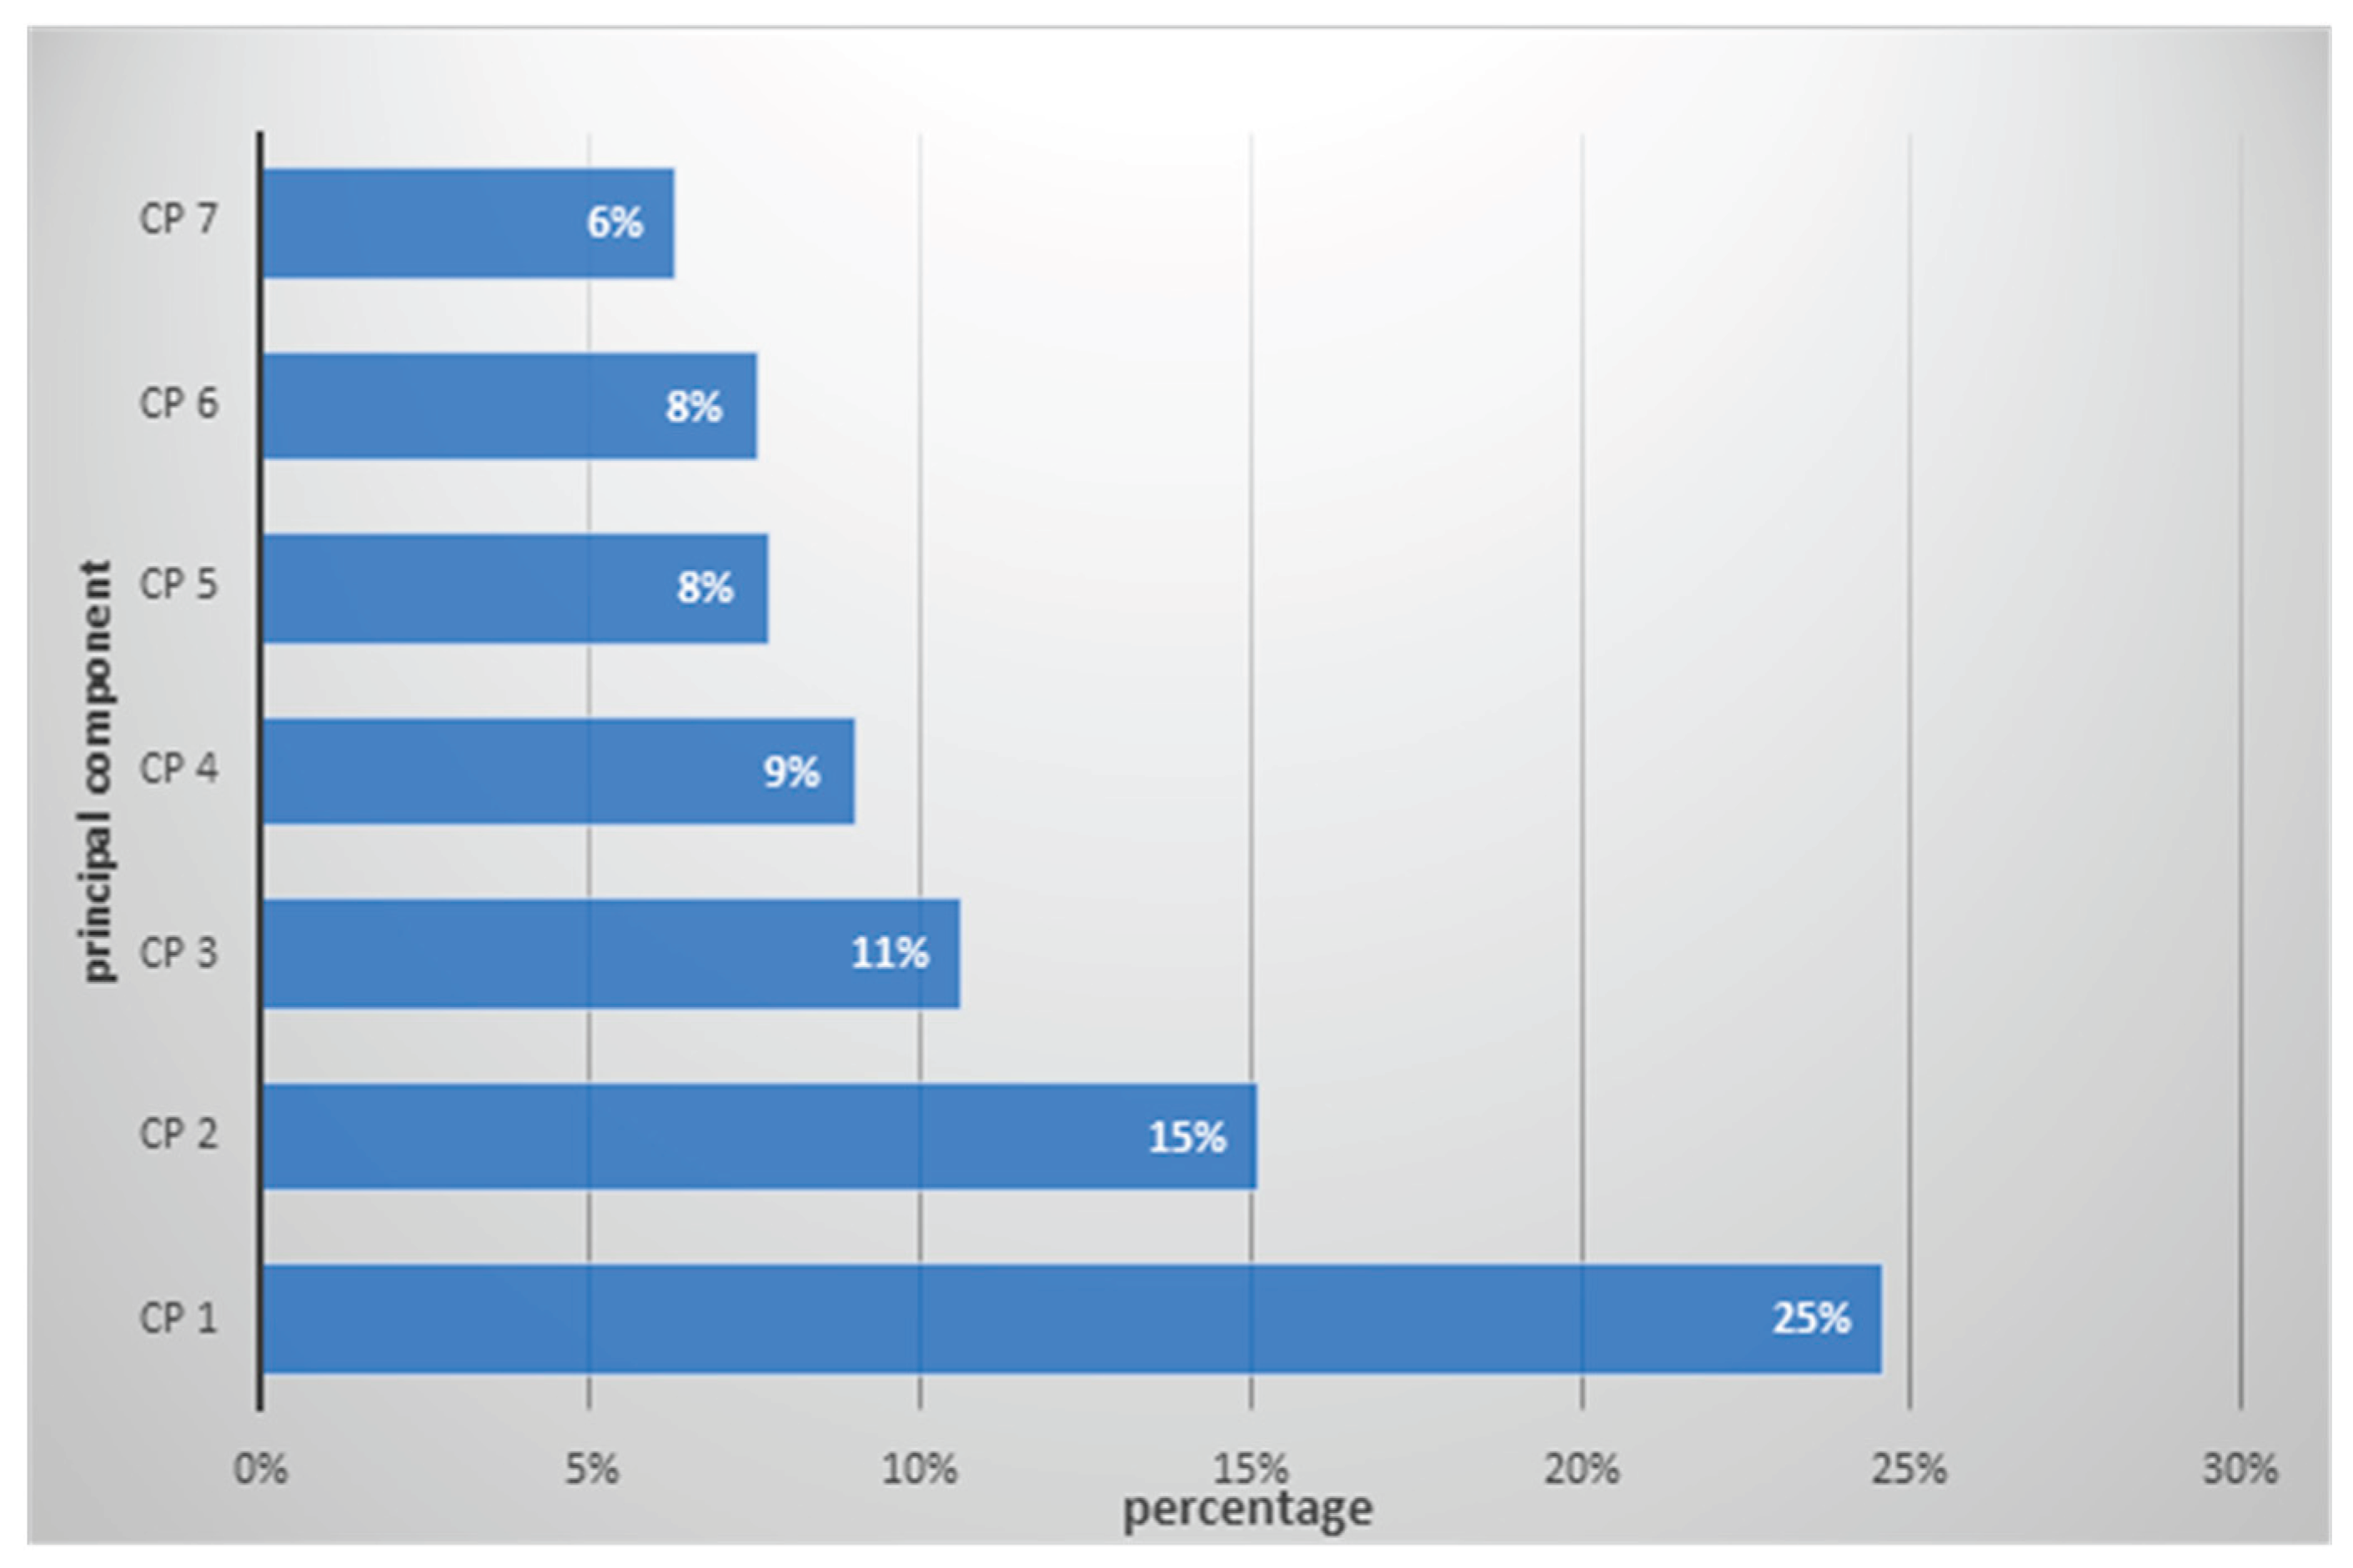

Table 1.
Summary of coded variables that make up the method.
| Variable | Categorization |
|---|---|
| schooling | 1=primary school; 2=high school; 3=high school; 4=university or more |
| land tenure | 1=owned; 2 = rental |
| production infrastructure | 1= open field; 2= shade net; 3= greenhouse |
| crop | 1= tomato; 2= poblano chili; 3= serrano chili; 4= other crop |
| production destination | 1= domestic; 2 = export |
| generational change | 1= no relief; 2= in process of relief; 3= complete relief |
| training | 1= untrained; 2= trained; 3= highly trained |
| application and disposal of waste | 1= very poor management; 2= poor management; 3= good management; 4= excellent management |
| plagues | 1= soldier worm; 2= aphid; 3= whitefly; 4= thrips; 5= red spider mite; 6= chili weevil |
| pesticide used | 1= chlorpyrifos; 2= deltamethrin; 3= endosulfan; 4= imidacloprid; 5= malathion; 6= methomyl; 7= oxamyl; 8= permethrin; 9= pymetrozine; 10 = thiamethoxam |
| diseases | 1= fusarium; 2= phytophthora; 3=rhizoctonia; 4= verticillium |
| nematicide fungicide | 1= benomyl; 2= captan; 3= carbendazim; 4= carboxin; 5=chlorothalonil; 6 =fosetyl-al; 7= maneb; 8= metalaxyl-M; 9=thiram |
| input or technique to control weeds | 1= mulching; 2=manual weeding; 3=2,4-D; 4=paraquat; 5= glyphosate |
| other inputs used | 1= 2,4, D; 2=chlorothalonil; 3=endosulfan; 4=mancozeb; 5 =paraquat; 6=glyphosate |
| uses low-impact inputs (green label) | 1=yes; 2=no |
| uses inputs of biological origin | 1=bacillus; 2= Beauveria; 3= mycorrhizae; 4= trichoderma; 5=others |
| other practices to protect or prevent your crops | 1=color ribbons; 2=plant extracts; 3=pheromones; 4=monitoring; 5=repellents; 6=trapping |
Table 2.
Estimated average cost of negative externalities from pesticide use Source: Leach and Mumford [8].
Table 2.
Estimated average cost of negative externalities from pesticide use Source: Leach and Mumford [8].
| Environmental Impact Category | (USD kg-1 of active ingredient) | |||
|---|---|---|---|---|
| England | USA | Germay | Mexico PPP* (48/100) | |
| Domestic water pollution | 9.66 | 2.00 | 5.15 | 0.96 |
| Fish and aquatic life pollution | 0.68 | 0.29 | 1.47 | 0.14 |
| Biodiversity losses | 1.01 | 0.37 | 0.18 | 0.18 |
| Cultural landscape modification | 3.98 | 0.00 | 0.00 | 0.00 |
| Beehive losses | 0.08 | 0.26 | 0.04 | 0.12 |
| Effects on human health | 0.08 | 0.3 | 0.8 | 0.14 |
| Total | 15.49 | 3.22 | 7.64 | 1.55 |
*=PPP=purchasing power parity.
Table 3.
Distribution of environmental impact categories on the health of workers, consumers, and the environment by level of importance (%) [8]. Aquifers Aquatic life Birds Bees Beneficial insects.
Table 3.
Distribution of environmental impact categories on the health of workers, consumers, and the environment by level of importance (%) [8]. Aquifers Aquatic life Birds Bees Beneficial insects.
| Effects on Human Health | Workers | Consumer | Environment | Total | |||||
|---|---|---|---|---|---|---|---|---|---|
| Appy | Collect | Aquifers | Aquatic life | Birds | Bees | Beneficial insects | |||
| Water for Domestic Use | 0.11 | 0.09 | 0.60 | 0.09 | 0.11 | 1 | |||
| Fish and Aquatic Life | 0.51 | 0.49 | 1 | ||||||
| Biodiversity Losses | 0.31 | 0.31 | 0.10 | 0.29 | 1 | ||||
| Cultural Landscape Modification | 0.50 | 0.20 | 0.11 | 0.20 | 1 | ||||
| Loss of Beehives | 1.00 | 1 | |||||||
| Effects on Human Health | 0.79 | 0.15 | 0.05 | 1 | |||||
Table 4.
Environmental Impact Factor in the Field (EIFF) per farmer per hectare.
| Farmer | Pesticide used | EIFF | Nematicide/fungicide | EIFF | Other inputs | EIFF | Sum of impacts per farmer (ha) |
|---|---|---|---|---|---|---|---|
| 1 | Chlorpyrifos | 10 | Maneb | 15 | Endosulfan | 11.10 | 36.84 |
| 2 | Permethrin | 13 | Carbendazim | 30 | 2,4-d | 3.97 | 47.08 |
| 3 | Endosulfan | 21 | Benomyl | 5 | Paraquat | 3.71 | 28.75 |
| 4 | Endosulfan | 12 | Metalaxyl-m | 0 | Glyphosate | 4.42 | 16.83 |
| 5 | Imidacloprid | 10 | Fosetyl-al | 3 | Chlorothalonil | 2.02 | 15.18 |
| 6 | Pymetrozine | 2 | Carboxin | 11 | Oxamyl | 14.40 | 27.78 |
| 7 | Malathion | 12 | Chlorotalonil | 18 | Endosulfan | 11.10 | 41.20 |
| 8 | Malathion | 11 | Benomyl | 12 | Chlorothalonil | 18.19 | 41.01 |
| 9 | Chlorpyrifos | 4 | Benomyl | 18 | Paraquat | 4.95 | 26.96 |
| 10 | Chlorpyrifos | 0 | Maneb | 15 | 2,4-d | 3.97 | 19.47 |
| 11 | Permethrin | 13 | Benomyl | 6 | Glyphosate | 3.68 | 22.54 |
| 12 | Methomyl | 12 | Fosetyl-al | 4 | Chlorothalonil | 24.25 | 40.45 |
| 13 | Methomyl | 12 | Maneb | 15 | Endosulfan | 14.80 | 42.11 |
| 14 | Oxamyl | 14 | Carboxin | 14 | Chlorothalonil | 12.12 | 40.56 |
| 15 | Oxamyl | 10 | Methalaxyl-m | 0 | Endosulfan | 22.20 | 32.12 |
| 16 | Thiametoxam | 16 | Chlorothalonil | 12 | Paraquat | 11.13 | 39.24 |
| 17 | Thiametoxam | 16 | Tyram | 14 | Paraquat | 4.95 | 34.98 |
| 18 | Deltamethrin | 7 | Tyram | 8 | Glyphosate | 4.42 | 19.66 |
| 19 | Malathion | 8 | Carboxin | 4 | Chlorothalonil | 16.17 | 28.25 |
| 20 | Methomyl | 12 | Captan | 13 | Endosulfan | 9.25 | 33.75 |
| Total | 215 | Total | 219 | Total | 200.78 |
Table 5.
Values of the environmental impact factor in the field per crop.
| Environmental Impact Factor in the Field (EIFF) |
||||
|---|---|---|---|---|
| Crop | Insecticide | Fungicide | Herbicide | Sum |
| Tomato | 104 | 98 | 49 | 251 |
| Poblano chili | 65 | 68 | 84 | 217 |
| Serrano chili | 46 | 53 | 66 | 165 |
| Sum | 215 | 219 | 199 |
Table 6.
Cost of externalities of the main pesticides (USD ha-1).
| Ingredient | FIAC | Applicator | Collector | Consumer | Aquifers | Aquatic life | Birds | Hives | Beneficial insects | total | |
|---|---|---|---|---|---|---|---|---|---|---|---|
| insecticide | Chlorpyrifos | 7.30 | 1.6 | 0.79 | 4.26 | 1.15 | 1.67 | 0.40 | 1.04 | 0.38 | 11.29 |
| Deltamethrin | 6.80 | 1.5 | 0.74 | 3.97 | 1.07 | 1.56 | 0.37 | 0.97 | 0.35 | 10.53 | |
| Endosulfan | 14.0 | 3.07 | 1.51 | 8.16 | 2.20 | 3.20 | 0.77 | 2.00 | 0.72 | 21.64 | |
| Imidacloprid | 10.28 | 2.26 | 1.11 | 6.00 | 1.62 | 2.35 | 0.57 | 1.47 | 0.53 | 15.89 | |
| Malathion | 10.00 | 2.19 | 1.08 | 5.83 | 1.57 | 2.29 | 0.55 | 1.43 | 0.52 | 15.46 | |
| Methomyl | 11.90 | 2.61 | 1.29 | 6.94 | 1.87 | 2.72 | 0.66 | 1.70 | 0.61 | 18.40 | |
| Oxamyl | 12.80 | 2.81 | 1.38 | 7.46 | 2.01 | 2.93 | 0.70 | 1.82 | 0.66 | 19.79 | |
| Permethrin | 12.80 | 2.81 | 1.38 | 7.46 | 2.01 | 2.93 | 0.70 | 1.82 | 0.66 | 19.79 | |
| Pymetrozine | 2.15 | 0.47 | 0.23 | 1.25 | 0.34 | 0.49 | 0.12 | 0.31 | 0.11 | 3.32 | |
| Thiametoxam | 15.98 | 3.51 | 1.73 | 9.32 | 2.52 | 3.66 | 0.88 | 2.28 | 0.82 | 24.70 | |
| fungicide | Benomyl | 10.21 | 2.24 | 1.10 | 5.95 | 1.61 | 2.34 | 0.56 | 1.46 | 0.53 | 15.78 |
| Captan | 12.62 | 2.77 | 1.36 | 7.36 | 1.99 | 2.89 | 0.69 | 1.80 | 0.65 | 19.51 | |
| Carbendazim | 30.30 | 6.65 | 3.27 | 17.67 | 4.77 | 6.93 | 1.67 | 4.32 | 1.56 | 46.84 | |
| Carboxin | 9.67 | 2.12 | 1.04 | 5.64 | 1.52 | 2.21 | 0.53 | 1.38 | 0.50 | 14.95 | |
| Chlorothalonil | 14.72 | 3.23 | 1.59 | 8.58 | 2.32 | 3.37 | 0.81 | 2.10 | 0.76 | 22.76 | |
| Fosetyl-al | 3.60 | 0.79 | 0.39 | 2.10 | 0.57 | 0.82 | 0.20 | 0.51 | 0.19 | 5.57 | |
| Maneb | 15.42 | 3.38 | 1.67 | 8.99 | 2.43 | 3.53 | 0.85 | 2.20 | 0.79 | 23.84 | |
| Metalaxyl-m | 0.42 | 0.09 | 0.05 | 0.24 | 0.07 | 0.10 | 0.02 | 0.06 | 0.02 | 0.65 | |
| Thiram | 11.24 | 2.47 | 1.21 | 6.56 | 1.77 | 2.57 | 0.62 | 1.60 | 0.58 | 17.38 | |
| herbicide | Paraquat | 6.18 | 1.36 | 0.67 | 3.60 | 0.97 | 1.41 | 0.34 | 0.88 | 0.32 | 9.55 |
| 2,4-d | 3.97 | 0.87 | 0.43 | 2.32 | 0.62 | 0.91 | 0.22 | 0.57 | 0.20 | 6.14 | |
| Glyphosate | 4.17 | 0.91 | 0.45 | 2.43 | 0.66 | 0.95 | 0.23 | 0.59 | 0.21 | 6.45 | |
| total | 226.5 | 49.7 | 24.5 | 132.1 | 35.7 | 51.8 | 12.5 | 32.3 | 11.7 | 350.2 |
Table 7.
Cost of externalities per crop.
| Tomato | Poblano chili | Serrano chili | Total | |
|---|---|---|---|---|
| Area (ha) | 80 | 50 | 30 | 160.0 |
| Percentage (%) | 50 | 31.25 | 18.75 | 100.0 |
| Impact category (USD $ year-1) | ||||
| Applicator (14.19%) | 24.85 | 15.53 | 9.32 | 49.69 |
| Collector (6.99 %) | 12.23 | 7.65 | 4.59 | 24.47 |
| Consumer (37.7%) | 66.06 | 41.29 | 24.77 | 132.12 |
| Aquifers (10.18%) | 17.83 | 11.14 | 6.69 | 35.66 |
| Aquatic life (14.8 %) | 25.92 | 16.20 | 9.72 | 51.85 |
| Birds (3.56 %) | 6.24 | 3.90 | 2.34 | 12.47 |
| Hives (9.22 %) | 6.15 | 10.09 | 6.06 | 32.30 |
| Beneficial insects (3.33 %) | 5.83 | 3.65 | 2.19 | 11.67 |
| Total | 175.1 | 109.4 | 65.6 | 350.2 |
Disclaimer/Publisher’s Note: The statements, opinions and data contained in all publications are solely those of the individual author(s) and contributor(s) and not of MDPI and/or the editor(s). MDPI and/or the editor(s) disclaim responsibility for any injury to people or property resulting from any ideas, methods, instructions or products referred to in the content. |
© 2025 by the authors. Licensee MDPI, Basel, Switzerland. This article is an open access article distributed under the terms and conditions of the Creative Commons Attribution (CC BY) license (http://creativecommons.org/licenses/by/4.0/).
Copyright: This open access article is published under a Creative Commons CC BY 4.0 license, which permit the free download, distribution, and reuse, provided that the author and preprint are cited in any reuse.


