
Submitted:
04 September 2025
Posted:
05 September 2025
You are already at the latest version
Abstract
Background: Early child development is strongly shaped by household socioeconomic conditions and child health. We examined associations between household socioeconomic status (SES), child nutrition, and developmental status using the Early Childhood Development Index 2030 (ECDI2030) among children aged 24–59 months in the Mont Ngafula health zone in Kinshasa. Methods: We performed a crosssectional analysis of 348 children (analytical n = 302 for multivariable models). The outcome was being developmentally “on track” (ONTRACK) by ECDI2030. Key exposures included SES (tertiles: poor, middle, rich) and stunting (binary). We estimated unadjusted prevalences and fitted multivariable logistic regression models adjusted for child age, sex, respondent sex, caregiver education, household size, improved water and sanitation, wasting, and a continuous individual dietary diversity score (IDDS). Sensitivity analyses used multiple imputations (20 imputations) for missing anthropometry measurements. The model diagnostics included VIF, Hosmer–Lemeshow, linktest, and classification metrics. Findings: Overall, 245/348 children (70.4%) were classified as on track. ONTRACK prevalence rose across SES tertiles (poor 59.5%, middle 69.8%, rich 81.9%; Pearson χ2 = 14.01, p = 0.001). In the adjusted analyses (n = 302), children who attended preschool education had higher odds of being on track (aOR 4.77, 95% CI 2.23–10.21, p < 0.001). The children in the rich tertile had higher odds of being on track than those in the poor tertile (adjusted odds ratio [aOR] 3.15, 95% CI 1.55–6.41, p = 0.002); the middle tertile showed a weaker association (aOR 1.80, 95% CI 0.97–3.33, p ≈ 0.062). Child age categories (36–47 months: aOR 0.55, 95% CI 0.31–0.96, p = 0.037; 48–59 months: aOR 0.26, 95% CI 0.12–0.56, p = 0.001) and stunting (aOR 0.42, 95% CI 0.20–0.89, p = 0.024) were inversely associated with being developmentally on track. These results were found to be consistent with the multiple imputation sensitivity analyses. Interpretation: Preschool attendance and a higher household socioeconomic position are strongly associated with better early developmental outcomes, while an age of 48–59 months and stunting are associated with a markedly lower likelihood of being developmentally on track. Integrated policies that reduce household poverty, promote early education, and prevent/treat early faltering growth could improve early childhood developmental trajectories.
Keywords:
early childhood development
; ECDI2030
; stunting
; socioeconomic status
; childhood nutrition
; cross‑sectional survey
1. Introduction
Early childhood represents a critical period that determines an individual’s health, education, and productivity throughout their life [1]. The early years of life are characterized by rapid brain development, making children sensitive to environmental influences [2]. Evidence shows that appropriate interventions during this period can significantly improve children’s academic achievement, reduce social and economic inequalities, and promote better health outcomes in adulthood [3,4]. Worldwide, 80 million children aged 36–59 months are off track for their early childhood development (ECD) according to the former Early Childhood Development Index (ECDI), with Sub-Saharan Africa being the most affected region due to poverty and chronic malnutrition [5]. The international committee has recognized this problem as needing to be solved as a priority through Sustainable Development Goal 4 (SDG4), which calls for access to quality ECD, care, and education by 2030 [6]. UNICEF developed ECDI2030 to monitor the progress made, targeting children aged 24–59 months [7].
Despite the growing global use of ECDI2030, locally representative evidence in Kinshasa is limited. National surveys such as DRC MICS 2018 report an on-track prevalence of approximately 56.7% at the national level and 72.7% for Kinshasa specifically, based on the findings of the former ECDI [8]. Although this national survey provides important country benchmarks for ECD, those aggregates mask substantial within-city and within-health-zone variations, with studies showing significant variations between neighborhoods in Kinshasa [9,10,11]. Such heterogeneity limits the utility of national figures for local program planning and resource allocation.
This study addresses that gap by applying the ECDI2030 in a three-stage probability sample representative of Mont Ngafula II, an urban–rural health zone in Kinshasa. To the best of our knowledge, we provide the first sub-district ECD estimates in this health zone and directly link those local prevalence estimates with measured preschool attendance, child nutritional status, and household socioeconomic position. By presenting health zone levels, survey-weighted estimates, and multivariable associations, this study supplies actionable, locally disaggregated evidence that complements national reports such as DRC MICS 2018 and supports targeted early childhood policies at the health zone level.
This study aimed to estimate the survey-weighted prevalence of being “on track” on the ECDI among children aged 24–59 months in Mont Ngafula II and to identify factors associated with being on track.
2. Methodology
2.1. Study Design and Sampling
We conducted a cross-sectional analysis of household survey data collected in Mont Ngafula health zone in Kinshasa, DRC, between 2 December and 20 December 2024. Observations with missing outcome data were excluded from the analyses, unless otherwise stated. A three-stage probability sampling strategy was used: first, five health areas were randomly selected from the Mont Ngafula II health zone sampling frame; second, within each selected health area, enumeration areas (EAs) were randomly selected proportional to size; third, within each EA, households were listed and systematically sampled. In each selected household, one eligible child (24–59 months) was selected for inclusion. A sample size target of 297 was calculated, assuming an expected on-track ECD prevalence of 72.7%, a desired precision of ±5 percentage points, 95% confidence, the population of children aged 24–59 months in the health zone (11, 233), and a design effect of 1. Sampling weights were calculated as the inverse of the probability of selection at each stage (product of stage-specific selection probabilities), adjusted for non-response, and post-stratified to known population totals for child age and sex where available. In all of the prevalence estimates and regression analyses, we used these survey weights and accounted for clustering at the EA level and stratification by health area. For the variance estimation, we employed robust (Taylor series linearization) standard errors.
2.2. Measurements
Parents or caregivers completed a standardized questionnaire in French or Lingala (the local language), which was administered by trained interviewers. The questionnaire included the UNICEF ECDI2030 items [7,12], household assets and characteristics for socioeconomic status (SES), preschool attendance (defined as any regular attendance at a formal or informal group educational program for children prior to primary school in the past 12 months), child’s dietary diversity assessed using a 24 h recall of consumption of eight food groups of FAO [13], and household food insecurity assessed with the HFIAS [14]. Anthropometric measures (weight, length/height) were taken following the WHO field protocols and used to calculate height-for-age Z-scores (HAZ) and weight-for-height Z-scores (WHZ). Stunting was defined as HAZ < −2, and wasting was defined as WHZ < −2 [15]. Questionnaires were translated and back-translated and pilot tested prior to conducting the fieldwork. The interviewers received 5 days of training, and the field supervision included daily quality checks.
The primary outcome was “on track” development status measured with the ECDI2030 and coded as a binary variable ONTRACK (Yes/No). ECDI2030 assessed ECD through 20 behavioral and cognitive items that represent developmental milestones. The child achieves a milestone if the response is “yes” from items 1 to 18; any other response than “every day” for item 19, and any other response than “more often” or “much more often” for item 20 item are considered “on track” developmental status (Table 1). The minimum number of milestones that need to be achieved to be considered on track for each age group is as follows: 7 for 24 to 29 months, 9 for 30 to 34 months, 11 for 35 to 41 months, 13 for 42 to 47 months, and 15 for 48 to 59 months. A child was classified as “on track” if they achieved the minimum number of developmental milestones specified by ECDI2030 for their age group (7 milestones for 24–29 months, 9 for 30 to 34 months, 11 for 35 to 41 months, 13 for 42 to 47 months, and 15 for 48 to 59 months). Key exposures included household SES categorized into tertiles (poor, middle, rich), child age group (24–35, 36–47, 48–59 months), and child sex. Nutritional status variables were derived as binary indicators: stunted (1 = stunted, 0 = not stunted) and wasted (1 = wasted, 0 = not wasted). Additional covariates included respondent sex, caregiver education (education level: secondary school and above), household size (6+), improved drinking water, improved sanitation, and a continuous individual dietary diversity score (IDDS).
2.3. Statistical Analysis
We first described sample characteristics using frequencies and means (unweighted) and calculated the unweighted prevalence of ONTRACK with 95% confidence intervals. Bivariate associations between ONTRACK and categorical covariates were assessed using Pearson’s chi-square tests. Continuous predictors were compared with simple linear regression. Multivariable logistic regression was used to estimate adjusted odds ratios (aORs) and 95% confidence intervals (CIs) for factors associated with being on track (ONTRACK). The primary adjusted model included child age group, child sex, preschool attendance, IDDS, stunting and wasting indicators, parent or caregiver sex and education level, household size, SES, improved water, and sanitation. Model estimates were exponentiated to the present odds ratios. We stored the main model and re-ran models, including SES × child sex interaction, to evaluate effect modification. Model diagnostics included variance inflation factors (VIF > 5 considered indicative concern) to assess collinearity (ordinary logistic model), Hosmer–Lemeshow goodness-of-fit, the linktest for specification, classification table measures (sensitivity, specificity, positive/negative predictive values), and the inspection of influential observations (DFBETAs) for the unweighted models. Marginal predicted probabilities and contrasts were estimated using margins and visualized with marginsplot to illustrate adjusted probabilities of ONTRACK across SES and age strata. The sensitivity analyses excluded (1) observations with missing anthropometry measurements and (2) multiple imputations via chained equations for anthropometric and nutrition variables with 20 imputations. Pooled estimates were obtained with the mi estimate. All statistical analyses were conducted in Stata version 17.0/SE. Statistical significance was assessed as a two-sided alpha of 0.05.
2.4. Ethics
The survey protocol was approved by the Kinshasa School of Public Health Ethics Committee (ESP/CE/84/2025), and informed consent was obtained from the caregivers prior to participation.
3. Results
3.1. On Track for ECD Prevalence and Sample Characteristics
The sample for analysis comprised 348 children aged 24–59 months. Of these, 245 (70.4%) were classified as on track by the ECDI2030, and 103 (29.6%) were not on track. The sample was approximately balanced by sex (170 girls [48.9%]; 178 boys [51.1%]) and included children across three age groups: 24–35 months (n = 134, 38.5%), 36–47 months (n = 124, 35.6%), and 48–59 months (n = 90, 25.9%). The mean (SD) child age was 39.5 months (SE 0.56). The mean weight and height were 14.07 kg (SE 0.17) and 95.26 cm (SE 0.51), respectively (see Table 2).
3.2. Factors Associated with Being on Track for ECD
3.2.1. Bivariate Associations
In unadjusted cross-tabulations, preschool attendance (Pearson chi2(1) = 11.08, p = 0.001) and SES (Pearson chi2(2) = 14.01, p < 0.001) were strongly associated with ONTRACK status. The proportion of on-track children increased across preschool attendance categories (not attended 65.34%; attended 83.51%) and SES tertiles (poor 59.5% [69/116], middle 69.8% [81/116], rich 81.9% [95/116]). Stunting (p = 0.013) and parent or caregiver age categories (0.046) were weakly associated with ONTRACK status. There were no significant bivariate associations between ONTRACK and child sex (p = 0.586) or child age group (p = 0.171). In a simple regression, ONTRACK was positively associated with the continuous score of SES (coefficient 0.855; 95% CI 0.398 to 1.313; p < 0.001).
3.2.2. Multivariable Logistic Regression (Primary Model)
The primary adjusted logistic regression included 302 observations (listwise deletion for missing covariates). After adjustment, children who attended a preschool education program had higher odds of being developmentally on track compared with those who did not attend such a program (aOR 4.77, 95% CI 2.23–10.21, p < 0.001). Children from the rich tertile had substantially higher odds of being on track compared with children from the poor tertile (aOR 2.65, 95% CI 1.34–5.24, p = 0.007). Children with a middle SES had a non-statistically significant higher odds compared with those with a poor SES (aOR 1.72, 95% CI 0.93–3.19, p ≈ 0.080). Child age categories and stunting were inversely associated with being on track. Children aged 48–59 months had lower odds of being developmentally on track compared with those aged 24–35 months (aOR 0.26, 95% CI 0.12–0.56, p = 0.001). Children aged 36–47 months also had lower odds of being developmentally on track compared with those aged 24–35 months (aOR 0.55, 95% CI 0.31–0.96, p = 0.037). Stunted children had substantially lower odds of being developmentally on track (aOR 0.41, 95% CI 0.18–0.93, p = 0.034). Other covariates (child sex, child IDDS, wasting, parent or caregiver sex, parent or caregiver education, marital status, household size, drinking water source, and sanitation) showed point estimates close to the null and were not statistically significant in the fully adjusted model (see Table 3 for full model coefficients).
3.2.3. Predicted Probabilities and Interaction Analyses
The marginal predicted probabilities of ONTRACK by SES and child age group showed a graded relationship: for 24–35-month-old children, the adjusted probabilities were 0.668 for poor (95% CI 0.554–0.782), 0.780 for middle (0.679–0.881), and 0.860 for rich (0.784–0.935); for 36–47-month-old children, they were 0.565 for poor (0.440–0.691), 0.696 for middle (0.588–0.804), and 0.798 for rich (0.692–0.903); and for 48–59-month-old children, they were 0.527 for poor (0.373–0.681), 0.662 for middle (0.523–0.801), and 0.771 for rich (0.652–0.891) (Figure 1). An interaction model including child_sex × SES produced no evidence of effect modification (interaction terms did not reach conventional significance) (margins plotted by sex).
3.2.4. Model Performance and Diagnostics
The classification table (cut point 0.5) indicated high sensitivity (96.3%) but low specificity (13.6%), with overall correct classification of 72.52%. The Hosmer–Lemeshow goodness-of-fit test suggested adequate calibration (Hosmer–Lemeshow χ2(8) = 4.25; p = 0.834). The linktest showed a significant _hat (p < 0.001) and a non-significant _hatsq (p = 0.918), indicating predictive information without evidence of gross specification error captured by the squared predictor. Collinearity diagnostics (uncentered VIF) indicated elevated VIF with improved water (VIF = 10.51), with a mean VIF of 3.00; these findings suggest potential collinearity for a variable that was considered in the sensitivity analyses.
3.2.5. Sensitivity Analyses
The results of the sensitivity analyses were robust. Multiple imputations (20 imputations) for anthropometry and nutrition variables produced similar directions and magnitudes of association: preschool attendance remained positively associated with ONTRACK status (mi pooled estimates: coefficient for preschool attendance = 1.63, p < 0.001), while child age categories and stunting remained inversely associated with ONTRACK (mi pooled estimates: coefficients for child age 36–47 months = −0.67, p = 0.041; child age 48–59 months = −1.30, p = 0.001; and stunted ≈ −0.89, p = 0.026). Excluding observations with missing anthropometry measurements produced qualitatively similar results.
4. Discussion
In this cross-sectional survey, we found a clear, graded relationship between household SES and early developmental status: children from the wealthiest households were approximately three times more likely to be developmentally on track than children from the poorest households. Concurrently, stunting was strongly independently correlated with being off track, even after adjusting for sociodemographic and household factors. Together, these results reinforce a well-established pathway linking poverty to compromised child growth and, in turn, to poorer developmental outcomes.
In the present study, 70.40% of children aged 24 to 59 months were developmentally on track in the Mont Ngafula II health zone. Although it is difficult to make a comparison due to the different indicators used in Sub-Saharan Africa and the DRC, this prevalence is higher than the average for Sub-Saharan Africa (55%) [5] and that in the DRC (56.7%) and similar to the prevalence in Kinshasa (72.7%) [8]. A recent assessment of ECD showed a higher prevalence than ours when using the same index in Thailand [16]. This indicates a delay in investment in ECD interventions in the DRC, but it is important to note that some areas, such as Mont Ngafula II, are making progress towards achieving SDG target 4.2 in the DRC; these areas could serve as a reference for rural and urban–rural areas to improve ECD at the national level.
Preschool attendance was strongly associated with being developmentally on track. These results are consistent with several studies [17,18,19]. This could be explained by the fact that the legal framework for the organization of preschool education in the DRC is better implemented in urban areas, where there is a proliferation of institutions and community initiatives in favor of preschool education, with a high concentration in Kinshasa and Haut Katanga [20,21].
With regard to the association between household SES and ECD, although the indicators are different and make comparison impossible, these results are consistent with those of many previous studies [19,22,23]. Several neuroscience studies have highlighted the associations between low socioeconomic status and small gray matter volume in the hippocampus, which is in turn associated with a low volume in the frontal and temporal lobes [24,25]. In contrast, a recent study in Thailand in 2024 that used the same index showed that SES was not associated with ECD [16]. This is likely due to the impact of an intervention aimed at reducing socioeconomic disparities and child poverty by providing assistance to poor families [23].
Our study indicates a negative association between a child’s age and ECD. This was similar to research performed in Afghanistan [26] and contradicts what is known in the literature, namely that the older the child, the more likely they are to be developmentally on track [7,27,28,29]. This observation in the present study could be explained by several contextual factors that have been highlighted in the literature. First, these age groups receive more parental attention, particularly in terms of care and stimulation, compared with older children, who are assumed to be less vulnerable [30,31,32,33,34]. Also, younger children receive slightly more integrated health services (vaccination, CPS), providing them with access to essential health, nutrition, and development interventions [33,35,36]. The negative association between stunting and ECD, consistent with the existing literature, likely stems from nutritional deficiencies affecting brain growth, myelination, neural connectivity, and neuroplasticity, leading to delays in motor, cognitive, and socioemotional development [37,38]. In addition, children with stunted growth often exhibit apathy, reduced responsiveness, and more frequent episodes of infectious diseases, which limit their social interactions and restrict them from receiving the stimulation necessary for optimal development [4,39,40]. Finally, stunted growth often reflects conditions of poverty and food insecurity, which are accompanied by an impoverished educational environment that exacerbates developmental inequalities from early childhood [19,22]. The association observed in this study could, therefore, result from common determinants of these two phenomena, such as structural poverty or low stimulation, rather than a direct link. However, well-established biological mechanisms also support the direct effect of stunting on brain development.
For policy and programming, our findings argue for combined, equity-focused approaches. First, poverty alleviation and social protection (cash transfers, food security programs, parental leave, and childcare subsidies) can raise household capacity to provide stimulating, resource-rich environments that support development. Second, nutrition-specific interventions (early identification and treatment of undernutrition, promotion of optimal infant and young child feeding, micronutrient supplementation) and nutrition-sensitive programs (sanitation, maternal mental health support, caregiving interventions) are needed to prevent growth faltering that translates into developmental deficits. Third, integrating early stimulation and responsive caregiving and early education components into existing nutrition and primary health platforms would address both biological and psychosocial drivers of development simultaneously.
Programmatic targeting should prioritize the most deprived households and children who are already stunted and older while monitoring development outcomes (not only anthropometry) to capture intervention impact. From a research perspective, longitudinal studies are needed to clarify causal sequencing and test whether combined nutrition + early learning packages produce additive or synergistic gains in developmental trajectories. Finally, implementation should include the strong monitoring and measurement of equity (disaggregated by SES, sex, and age) to ensure that interventions reach and benefit the children at the highest risk.
The limitations of this analysis chiefly include its cross-sectional design, potential confounding residuals, and some missing anthropometry measurements restricting causal claims from being made, but the consistency across sensitivity analyses strengthens our confidence in the observed associations. Overall, policies that address both household poverty and early faltering growth, delivered through integrated platforms, are the most promising avenue to improve early child development at the population scale.
5. Conclusions
In this representative sample, preschool attendance and higher household SES were strongly associated with better early childhood development outcomes, while child age and stunting were strongly associated with poor outcomes. These findings underscore the persistent links between poverty, early child growth faltering, and early developmental outcomes, suggesting that integrated nutrition and early child development interventions that target the most disadvantaged households may be needed.
Author Contributions
Conceptualization, B.M.B. and P.Z.A.; methodology, B.M.B. and P.Z.A.; software, F.K.K., B.M.B., and P.Z.A., formal analysis, B.M.B., F.K.K. and P.Z.A.; investigation, B.M.B., N.M.M., D.-A.B.B., and G.B.B.; results interpretation, B.M.B., F.K.K. and P.Z.A.; validation, P.Z.A., F.K.K., and P.B.M.; writing—original draft preparation, B.M.B., N.M.M., and P.B.M.; writing—review and editing, B.M.B., F.K.K., P.Z.A., and P.B.M.; visualization, B.M.B., F.K.K., and P.Z.A. All authors have read and agreed to the published version of the manuscript.
Funding
This research received no external funding.
Institutional Review Board Statement
This study was approved by the ethics committee of the Kinshasa School of Public Health (ESP/CE/84/2025).
Data Availability Statement
The data used for this publication and the do.file can be made available upon reasonable request to the corresponding author.
Acknowledgments
We thank the KSPH students who were involved in the data collection. We also express our thanks to the parents and caregivers in Mont Ngafula II HZ for sharing their experiences with us.
Conflicts of interest
The authors declare no conflicts of interest.
References
- World Health Organization. Operationalizing Nurturing Care for Early Childhood Development: The Role of the Health Sector Alongside Other Sectors and Actors; World Health Organization: Geneva, Switzerland, 2019. [Google Scholar]
- Thompson, R.A.; Nelson, C.A. Developmental science and the media: Early brain development. Am. Psychol. 2001, 56, 5–15. [Google Scholar] [CrossRef] [PubMed]
- Greenough, W.T.; Black, J.E.; Wallace, C.S. Experience and brain development. Child Dev. 1987, 58, 539–559. [Google Scholar] [CrossRef] [PubMed]
- Grantham-McGregor S, Cheung YB, Cueto S, Glewwe P, Richter L, Strupp B; International Child Development Steering Group. Developmental potential in the first 5 years for children in developing countries. Lancet 2007, 369, 60–70. [Google Scholar] [CrossRef] [PubMed] [PubMed Central]
- McCoy, D.C.; Peet, E.D.; Ezzati, M.; Danaei, G.; Black, M.M.; Sudfeld, C.R.; Fawzi, W.; Fink, G. Early Childhood Developmental Status in Low- and Middle-Income Countries: National, Regional, and Global Prevalence Estimates Using Predictive Modeling. PLoS Med. 2016, 13, e1002034. [Google Scholar] [CrossRef] [PubMed]
- United Nations. Education—United Nations Sustainable Development; UN Web Services Section, Department of Public Information, United Nations: New York, NY, USA, 2016; pp. 1–4. Available online: https://www.un.org/sustainabledevelopment/education/%0Ahttp://www.un.org/sustainabledevelopment/education/ (accessed on 8 June 2025).
- UNICEF. The Early Childhood Development Index 2030: A New Measure of Early Childhood Development; United Nations Children’s Fund: New York, NY, USA, 2023; Available online: https://data.unicef.org/wp-content/uploads/2023/09/ECDI2030_Technical_Manual_Sept_2023.pdf (accessed on 15 June 2025).
- Institut National de Statistique. MICS-Palu 2018, Rapport Final. 2019. Available online: https://www.unicef.org/drcongo/media/3646/file/COD-MICS-Palu-2018.pdf (accessed on 15 June 2025).
- Akilimali, P.Z.; Kazenza, B.M.; Kabasubabo, F.K.; Egbende, L.M.; Kayembe, D.M.; Tran, N.T.; Mashinda, D.K. Household Food Insecurity During the COVID-19 Pandemic Between Slum and Non-Slum Areas in Kinshasa, DR Congo: A Cross-Sectional Study. Foods 2024, 13, 3657. [Google Scholar] [CrossRef] [PubMed]
- Batana, Y.M.; Masaki, T.; Nakamura, S.; Viboudoulou Vilpoux, M.E. Estimating Poverty in Kinshasa by Dealing with Sampling and Comparability Issues. Poverty and Equity Global Practice. Report No.: 9858. 2021. Available online: http://www.worldbank.org/prwp (accessed on 15 June 2025).
- Ferrari, G.; Ntuku, H.M.; Schmidlin, S.; Diboulo, E.; Tshefu, A.K.; Lengeler, C. A malaria risk map of Kinshasa, Democratic Republic of Congo. Malar J. 2016, 15, 27. [Google Scholar] [CrossRef] [PubMed] [PubMed Central]
- UNICEF. Tools—UNICEF MICS. 2023. Available online: https://mics.unicef.org/tools (accessed on 6 August 2025).
- Swindale, A.; Bilinsky, P. Score de Diversité Alimentaire Des Ménages (SDAM) pour la Mesure de L’accès Alimentaire Des Ménages: Guide D’indicateurs VERSION 2. Proj d’Assistance Tech en matière d’Alimentation Nutr Académie Pour le Développement L’education. 2006. Available online: www.fantaproject.org (accessed on 15 June 2025).
- Coates, J.; Swindale, A.; Bilinsky, P. Household Food Insecurity Access Scale (HFIAS) for Measurement of Food Access: Indicator Guide; Version 3; FHI360/FANTA: Washington, DC, USA, 2007. [Google Scholar]
- WHO Multicentre Growth Reference Study Group. WHO Child Growth Standards: Length/Height-for-Age, Weight-for-Age, Weight-for-Length, Weight-for-Height and Body Mass Index-for-age: Methods and Development; Library Cataloguing-in-Publication Data; WHO Child Growth Standards: Geneva, Switzerland, 2006; Volume 51. [Google Scholar]
- Topothai, T.; Phisanbut, N.; Topothai, C.; Suphanchaimat, R.; Müller-Riemenschneider, F.; Cetthakrikul, N.; Tangcharoensathien, V. What factors are associated with early childhood development in Thailand? A cross-sectional analysis using the 2022 Multiple Indicator Cluster Survey. BMJ Paediatr. Open. 2024, 8, e002985. [Google Scholar] [CrossRef] [PubMed] [PubMed Central]
- Burger, K. How does early childhood care and education affect cognitive development? An international review of the effects of early interventions for children from different social backgrounds. Early Child Res. Q 2010, 25, 140–165. [Google Scholar] [CrossRef]
- Rao, N.; Cohrssen, C.; Sun, J.; Su, Y.; Perlman, M. Chapter Eight—Early child development in low- and middle-income countries: Is it what mothers have or what they do that makes a difference to child outcomes? JAI 2021, 61, 255–277. [Google Scholar] [CrossRef]
- Hasan, M.N.; Babu, M.R.; Chowdhury, M.A.B.; Rahman, M.M.; Hasan, N.; Kabir, R.; Uddin, M.J. Early childhood developmental status and its associated factors in Bangladesh: A comparison of two consecutive nationally representative surveys. BMC Public. Health 2023, 23, 687. [Google Scholar] [CrossRef] [PubMed] [PubMed Central]
- RDC-Ministère du plan et de la Coordination de l’aide au Développement, U.N.I.C.E.F. Les Objectifs du Développement Durable et les Enfants en République Démocratique du Congo. Kinshasa. 2024. Available online: https://www.unicef.org/drcongo/media/12511/file/COD-2024-rapport-odd-enfants-rdc.pdf (accessed on 15 June 2025).
- UNICEF. L’éducation Préscolaire en RDC. Kinshasa. 2021. Available online: https://www.unicef.org/drcongo/documents/education-prescolaire (accessed on 15 June 2025).
- Haq, I.; Hossain, M.I.; Zinnia, M.A.; Hasan, M.R.; Chowdhury, I.A. Determinants of the Early Childhood Development Index among children aged < 5 years in Bangladesh, Costa Rica and Ghana: A comparative study. East. Mediterr. Health J. 2021, 27, 1069–1077. [Google Scholar] [CrossRef] [PubMed]
- Topothai, T.; Suphanchaimat, R.; Topothai, C.; Tangcharoensathien, V.; Cetthakrikul, N.; Waleewong, O. Thailand Achievement of SDG Indicator 4.2.1 on Early Child Development: An Analysis of the 2019 Multiple Indicator Cluster Survey. Int. J. Environ. Res. Public. Health 2022, 19, 7599. [Google Scholar] [CrossRef] [PubMed] [PubMed Central]
- Noble, K.G.; Houston, S.M.; Brito, N.H.; Bartsch, H.; Kan, E.; Kuperman, J.M.; Akshoomoff, N.; Amaral, D.G.; Bloss, C.S.; Libiger, O.; et al. Sowell ER. Family income, parental education and brain structure in children and adolescents. Nat. Neurosci. 2015, 18, 773–778. [Google Scholar] [CrossRef] [PubMed] [PubMed Central]
- Hanson, J.L.; Nacewicz, B.M.; Sutterer, M.J.; Cayo, A.A.; Schaefer, S.M.; Rudolph, K.D.; Shirtcliff, E.A.; Pollak, S.D.; Davidson, R.J. Behavioral problems after early life stress: Contributions of the hippocampus and amygdala. Biol. Psychiatry 2015, 77, 314–323. [Google Scholar] [CrossRef] [PubMed] [PubMed Central]
- Dadras, O.; Stanikzai, M.H.; Jafari, M.; Tawfiq, E. Early childhood development and its associated factors among children aged 36–59 months in Afghanistan: Evidence from the national survey 2022–2023. BMC Pediatr. 2024, 24, 734. [Google Scholar] [CrossRef] [PubMed] [PubMed Central]
- Zhang, J.; Guo, S.; Li, Y.; Wei, Q.; Zhang, C.; Wang, X.; Luo, S.; Zhao, C.; Scherpbier, R.W. Factors influencing developmental delay among young children in poor rural China: A latent variable approach. BMJ Open 2018, 8, e021628. [Google Scholar] [CrossRef] [PubMed]
- Gil, J.D.; Ewerling, F.; Ferreira, L.Z.; Barros, A.J. Early childhood suspected developmental delay in 63 low- and middle-income countries: Large within- and between-country inequalities documented using national health surveys. J. Glob. Health. 2020, 10, 010427. [Google Scholar] [CrossRef] [PubMed] [PubMed Central]
- Bishwokarma, A.; Shrestha, D.; Bhujel, K.; Chand, N.; Adhikari, L.; Kaphle, M.; Wagle, A.; Karmacharya, I. Developmental delay and its associated factors among children under five years in urban slums of Nepal. PLoS ONE 2022, 17, e0263105. [Google Scholar] [CrossRef]
- Simieneh, M.M.; Mengistu, M.Y.; Gelagay, A.A.; Gebeyehu, M.T. Mothers’ health care seeking behavior and associated factors for common childhood illnesses, Northwest Ethiopia: Community based cross-sectional study. BMC Health Serv. Res. 2019, 19, 59. [Google Scholar] [CrossRef] [PubMed] [PubMed Central]
- Chilot, D.; Shitu, K.; Gela, Y.Y.; Getnet, M.; Mulat, B.; Diress, M.; Belay, D.G. Factors associated with healthcare-seeking behavior for symptomatic acute respiratory infection among children in East Africa: A cross-sectional study. BMC Pediatr. 2022, 22, 662. [Google Scholar] [CrossRef] [PubMed] [PubMed Central]
- Khasanah, U.; Efendi, F.; Has, E.M.M.; Adnani, Q.E.S.; Ramadhan, K.; Arna, Y.D.; Almutairi, W.M. Healthcare-seeking behavior for children aged 0–59 months: Evidence from 2002–2017 Indonesia Demographic and Health Surveys. PLoS ONE 2023, 18, e0281543. [Google Scholar] [CrossRef] [PubMed] [PubMed Central]
- Kanté, A.M.; Gutierrez, H.R.; Larsen, A.M.; Jackson, E.F.; Helleringer, S.; Exavery, A.; Tani, K.; Phillips, J.F. Childhood Illness Prevalence and Health Seeking Behavior Patterns in Rural Tanzania. BMC Public Health. 2015, 15, 951. [Google Scholar] [CrossRef] [PubMed] [PubMed Central]
- Uggla, C.; Mace, R. Parental investment in child health in sub-Saharan Africa: A cross-national study of health-seeking behaviour. R. Soc. Open Sci. 2016, 3, 150460. [Google Scholar] [CrossRef] [PubMed] [PubMed Central]
- Adedokun, S.T.; Yaya, S. Factors influencing mothers’ health care seeking behaviour for their children: Evidence from 31 countries in sub-Saharan Africa. BMC Health Serv. Res. 2020, 20, 842. [Google Scholar] [CrossRef] [PubMed] [PubMed Central]
- Tshilonda, J.C.B.; Bukasa, A.K.; Kitenge, Z.N.; Ilunga, I.K.; Bimpa, C.I.; Katukumbanyi, J.P.K.; Mangola, D.K.; Kabanga, A.; Bileo, B.; Ngoyi, A.; et al. Knowledge and Rates of Use of Preschool Consultation by the Mothers in the Area of Health Tshitenge/Democratic Republic of Congo. OALib 2019, 6, 1–10. [Google Scholar] [CrossRef]
- Black, M.M.; Walker, S.P.; Fernald, L.C.H.; Andersen, C.T.; DiGirolamo, A.M.; Lu, C.; McCoy, D.C.; Fink, G.; Shawar, Y.R.; Shiffman, J.; et al. Lancet Early Childhood Development Series Steering Committee. Early childhood development coming of age: Science through the life course. Lancet 2017, 389, 77–90. [Google Scholar] [CrossRef] [PubMed] [PubMed Central]
- Prado, E.L.; Dewey, K.G. Nutrition and brain development in early life. Nutr. Rev. 2014, 72, 267–284. [Google Scholar] [CrossRef] [PubMed]
- Jeong, J.; Chi, H.; Bliznashka, L.; Pitchik, H.O.; Kim, R. Co-Occurrence of Stunting and Off-Track Early Child Development in Low- and Middle-Income Countries. JAMA Netw. Open. 2025, 8, e2462263. [Google Scholar] [CrossRef] [PubMed] [PubMed Central]
- Chi, H.; Eom, Y.J.; Jeong, J.; Lee, H.Y.; Kim, R. Joint parental stimulation and early childhood development in 26 sub-Saharan African countries. BMJ Paediatr. Open. 2025, 9, e003091. [Google Scholar] [CrossRef] [PubMed] [PubMed Central]
Figure 1.
Socio-economic status and Child Development: Predictive Margins by Age and Gender.
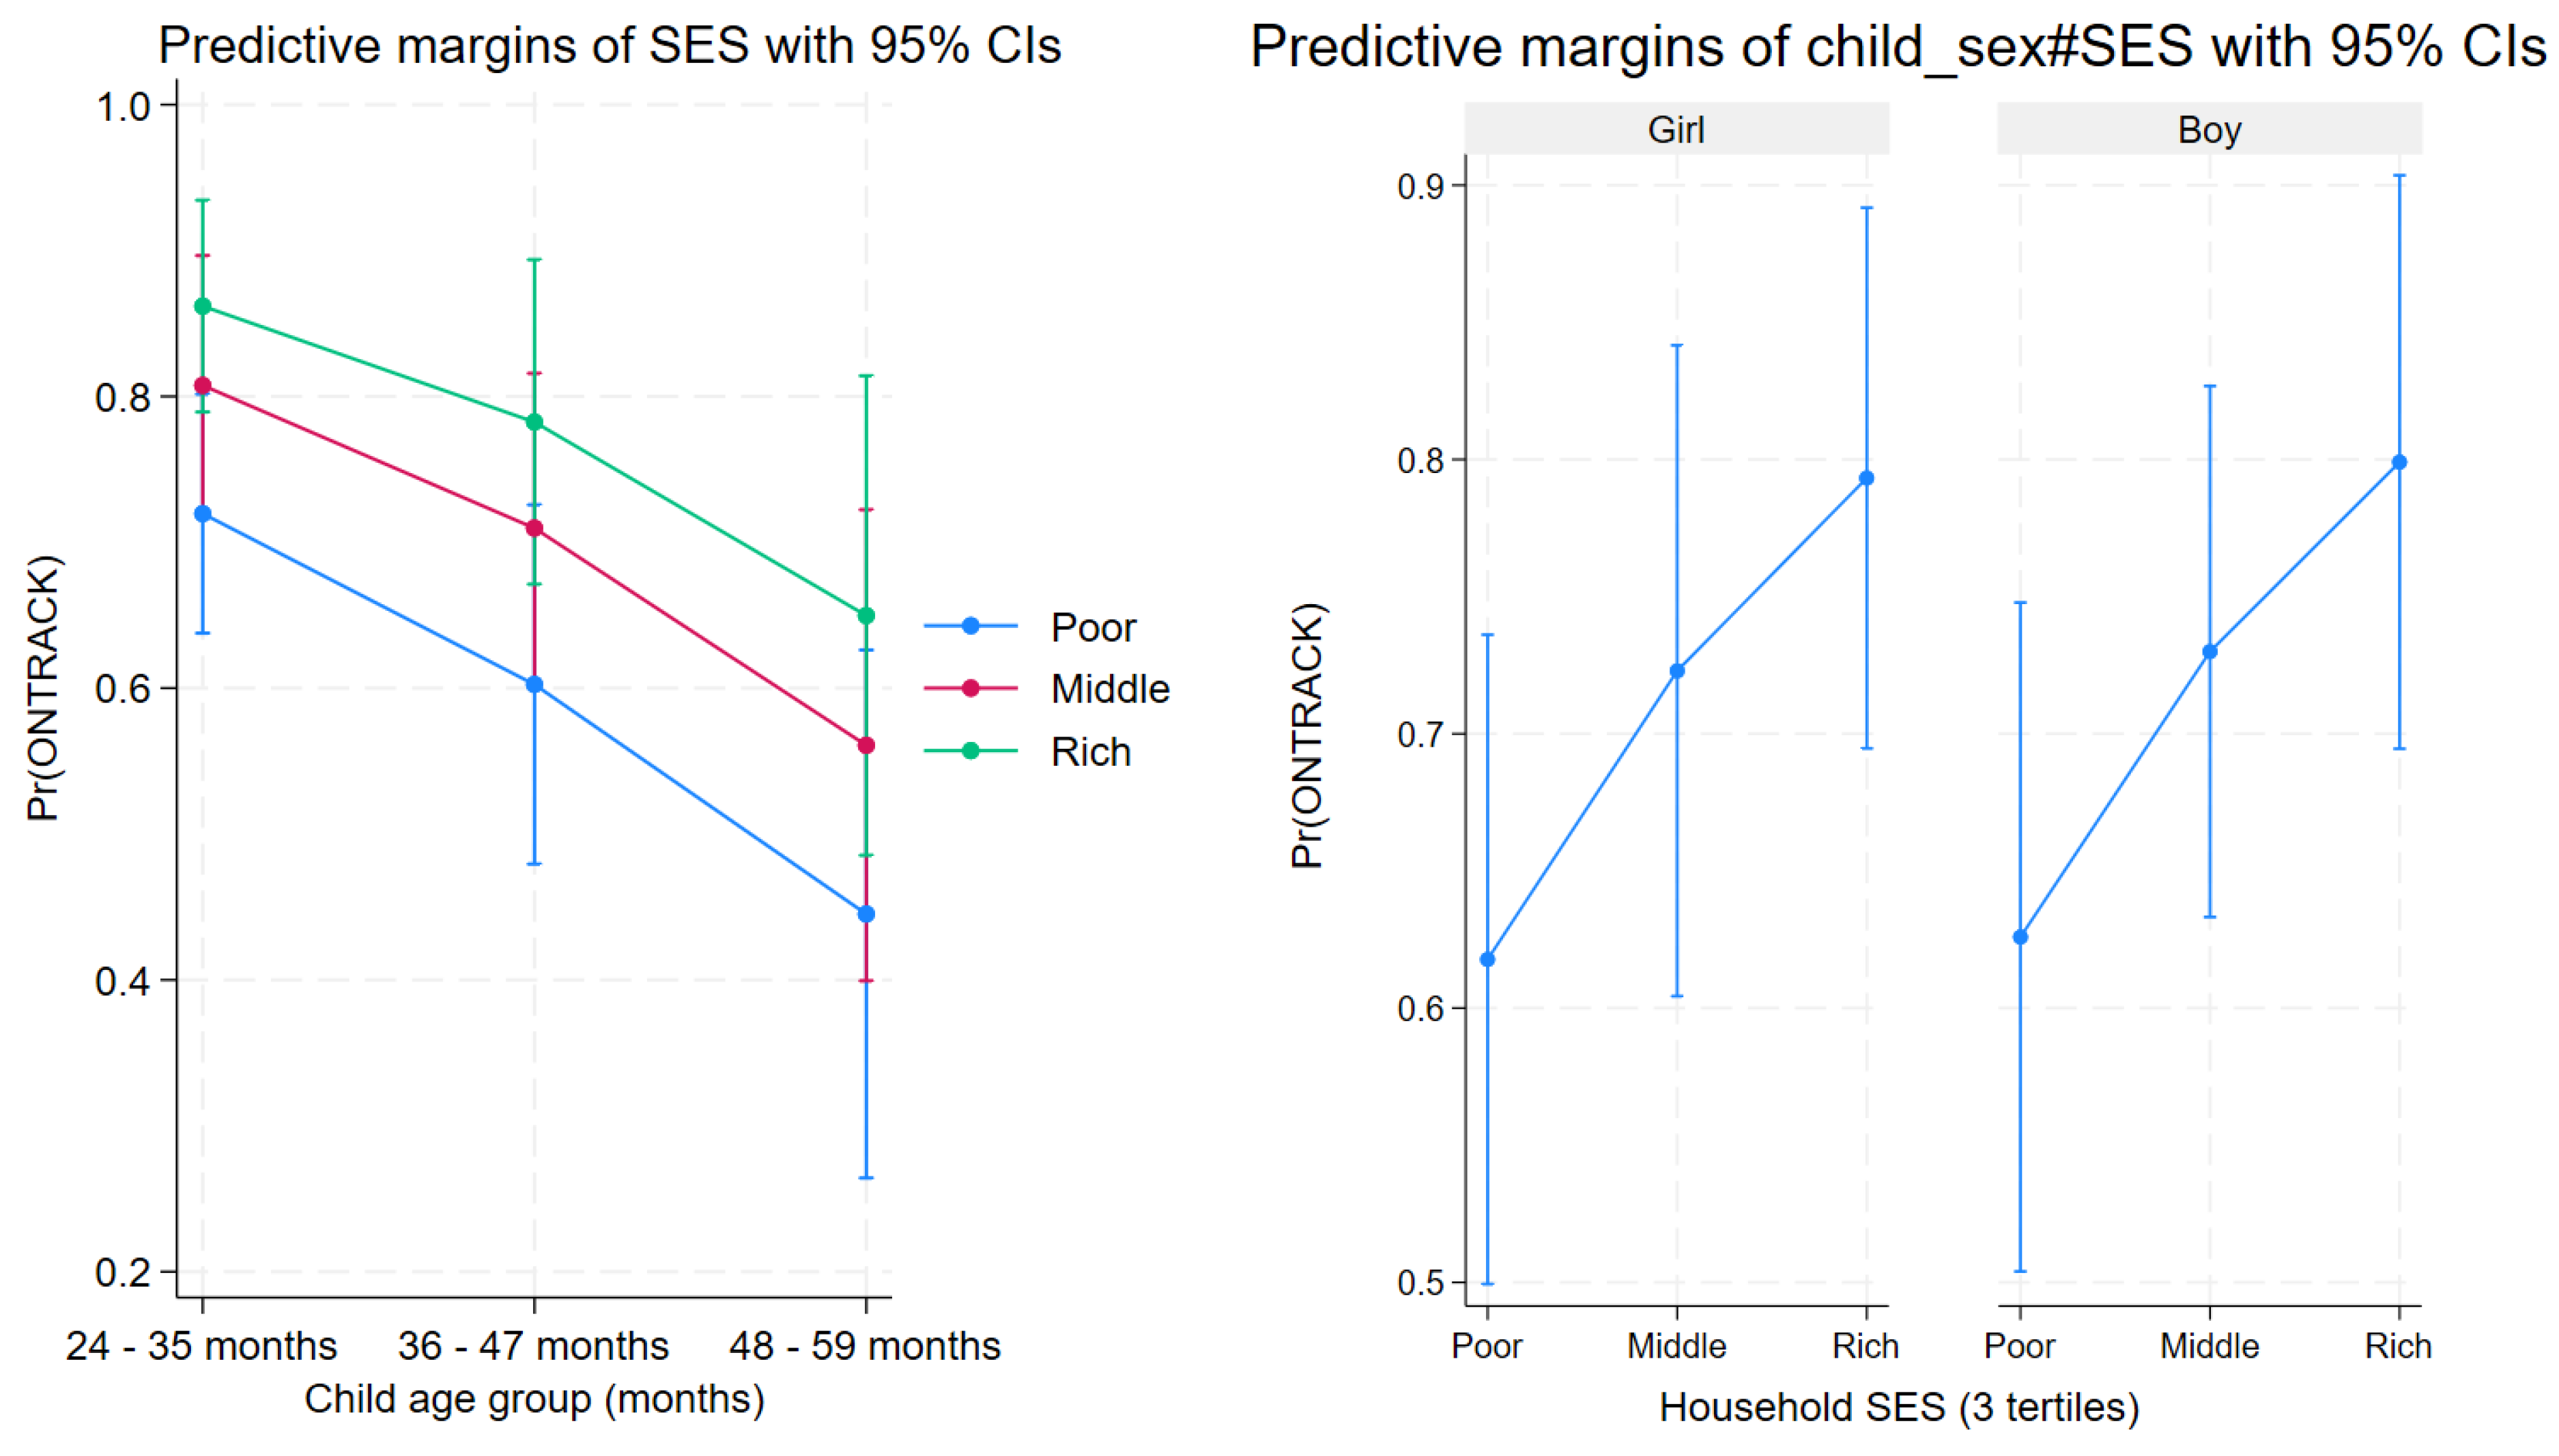

Table 1.
Development domains, subdomains, and stages of the Early Childhood Development Index 2030 (ECDI2030) [7].
Table 1.
Development domains, subdomains, and stages of the Early Childhood Development Index 2030 (ECDI2030) [7].
| Domain | Subdomain | Milestones |
|---|---|---|
| Health | Gross motor skills |
|
| ||
| Personal care |
|
|
| Fine motor skills |
|
|
| Learning | Expressive language |
|
| ||
| ||
| ||
| Reading and writing |
|
|
| ||
| Pre-writing |
|
|
| Numeracy |
|
|
| ||
| ||
| Executive function |
|
|
| Psychosocial well-being | Emotional skills |
|
| ||
| Social skills |
|
|
| Internalized behavior |
|
|
| Externalized behavior |
|
Table 2.
Sociodemographic characteristics overall and according to early childhood development.
| Characteristics | Total (Column) n (%) or Mean (SD) |
Early Childhood Development (Row) | ||
|---|---|---|---|---|
| On track n (%) or Mean (SD) |
Not on Track n (%) or Mean (SD) |
p-Value | ||
| 348 (100.00) | 245 (70.40) | 103 (29.60) | ||
| Children’s characteristics | ||||
| Sex | 0.613 | |||
| Boy | 178 (51.15) | 123 (69.10) | 55 (30.90) | |
| Girl | 170 (48.85) | 122 (71.76) | 48 (28.24) | |
| Age (in months) | 0.156 | |||
| 24–35 | 134 (38.51) | 102 (76.12) | 32 (23.88) | |
| 36–46 | 124 (35.63) | 84 (67.74) | 40 (32.26) | |
| 47–59 | 90 (25.86) | 59 (65.56) | 31 (34.44) | |
| Age (continuous) | 39.53 (10.04) | 39.27 (10.01) | 40.16 (10.12) | 0.453 |
| Preschool education | 0.001 | |||
| No | 251 (72.13) | 164 (65.34) | 87 (34.66) | |
| Yes | 97 (27.87) | 81 (83.51) | 16 (16.49) | |
| Food diversity | 0.401 | |||
| Inadequate | 127 (36.49) | 85 (66.93) | 42 (33.07) | |
| Adequate | 221 (63.51) | 160 (72.40) | 61 (27.60) | |
| Weight (Kg) | 14.08 (3.01) | 14.19 (2.88) | 13.83 (3.27) | 0.336 |
| Height (Cm) | 95.38 (9.10) | 96.15 (8.16) | 93.64 (10.77) | 0.024 |
| Stunting (n = 313) | 0.028 | |||
| No | 275 (87.86) | 199 (72.36) | 76 (27.64) | |
| Yes | 38 (12.14) | 20 (52.63) | 18 (47.37) | |
| Wasting (n = 304) | 0.874 | |||
| No | 272 (89.47) | 191 (70.22) | 81 (29.78) | |
| Yes | 32 (10.53) | 23 (71.88) | 9 (28.12) | |
| Underweight (n = 314) | 0.250 | |||
| No | 278 (85.54) | 196 (70.50) | 82 (29.50) | |
| Yes | 36 (11.46) | 22 (61.11) | 14 (38.89) | |
| Parents or caregivers’ characteristics | ||||
| Sex | 0.720 | |||
| Female | 315 (90.52) | 221 (70.16) | 94 (29.84) | |
| Male | 33 (9.48) | 24 (72.73) | 9 (27.27) | |
| Age (in years) | 0.088 | |||
| <30 | 131 (37.64) | 84 (64.12) | 47 (35.88) | |
| ≥30 | 217 (62.36) | 161 (74.19) | 56 (25.81) | |
| Education level | 0.995 | |||
| Low | 142 (40.80) | 100 (70.42) | 42 (29.58) | |
| Secondary school or above | 206 (59.20) | 149 (70.39) | 61 (29.61) | |
| Occupation | 0.990 | |||
| Unemployed | 59 (16.09) | 39 (69.64) | 17 (30.36) | |
| Housewife | 78 (22.41) | 55 (70.51) | 23 (29.49) | |
| Employee | 214 (61.49) | 151 (70.56) | 63 (29.44) | |
| Marital status | 0.195 | |||
| Alone | 86 (24.71) | 55 (63.95) | 31 (36.05) | |
| Married/in union | 262 (75.29) | 190 (72.52) | 72 (27.48) | |
| Household characteristics | ||||
| Household size | 0.572 | |||
| <6 | 141 (40.52) | 97 (68.79) | 44 (31.21) | |
| ≥6 | 207 (59.48) | 148 (71.50) | 59 (28.50) | |
| Socioeconomic status | 0.002 | |||
| Poor | 116 (33.33) | 69 (59.48) | 47 (40.52) | |
| Middle | 116 (33.33) | 80 (68.97) | 36 (31.03) | |
| Rich | 116 (33.33) | 96 (82.76) | 20 (17.24) | |
| Food security level | 0.402 | |||
| Food insecurity | 287 (82.47) | 199 (69.34) | 88 (30.66) | |
| Food security | 61 (17.53) | 46 (75.41) | 15 (24.59) | |
| Source of drinking water | 0.500 | |||
| Unimproved | 6 (1.72) | 5 (83.33) | 1 (16.67) | |
| Improved | 342 (98.28) | 240 (70.18) | 102 (29.82) | |
| Sanitation | 0.285 | |||
| Unimproved | 110 (31.64) | 72 (65.45) | 38 (34.55) | |
| Improved | 238 (68.36) | 173 (72.69) | 65 (27.31) | |
| Hand-washing point | 0.514 | |||
| Absent or present without soap and water | 124 (35.63) | 85 (68.55) | 39 (31.45) | |
| Present with water | 224 (64.37) | 160 (71.43) | 64 (28.57) | |
| Number of meals per day | 0.233 | |||
| <3 | 277 (79.60) | 190 (68.59) | 87 (31.41) | |
| ≥3 | 71 (20.40) | 55 (77.46) | 16 (22.54) | |
Table 3.
Full adjusted model examining child, parent or caregiver, household characteristics, and early childhood development, n = 302.
Table 3.
Full adjusted model examining child, parent or caregiver, household characteristics, and early childhood development, n = 302.
| Variable | aOR | CI 95% | p-Value |
|---|---|---|---|
| Child sex (girl = ref) | |||
| Boy | 1.04 | 0.55–1.98 | 0.900 |
| Child age (24–35 months = ref) | |||
| 36–47 months | 0.55 | 0.31–0.96 | 0.037 |
| 48–59 months | 0.26 | 0.12–0.56 | 0.001 |
| Preschool education attendance (no = ref) | |||
| Yes | 4.77 | 2.23–10.21 | <0.001 |
| IDDS (inadequate food diversity = ref) | |||
| Adequate food diversity | 1.23 | 0.63–2.40 | 0.528 |
| Stunting (no = ref) | |||
| Yes | 0.41 | 0.18–0.93 | 0.034 |
| Wasting (no = ref) | |||
| Yes | 1.19 | 0.43–3.35 | 0.724 |
| Parent or caregiver age (under 30 years = ref) | |||
| 30 years and above | 1.60 | 0.74–3.46 | 0.220 |
| Parent or caregiver education level (low = ref) | |||
| Secondary school and above | 0.85 | 0.43–1.71 | 0.647 |
| Marital status (alone = ref) | |||
| Married or in union | 1.40 | 0.67–2.93 | 0.356 |
| Household size (under 6 = ref) | |||
| 6 and more | 1.20 | 0.68–2.13 | 0.510 |
| SES (poor = ref) | |||
| Middle | 1.72 | 0.93–3.19 | 0.080 |
| Rich | 2.65 | 1.34–5.24 | 0.007 |
| Drinking water source (unimproved = ref) | |||
| Improved | 0.78 | 0.07–8.63 | 0.830 |
| Sanitation (unimproved = ref) | |||
| Improved | 1.34 | 0.69–2.63 | 0.376 |
Disclaimer/Publisher’s Note: The statements, opinions and data contained in all publications are solely those of the individual author(s) and contributor(s) and not of MDPI and/or the editor(s). MDPI and/or the editor(s) disclaim responsibility for any injury to people or property resulting from any ideas, methods, instructions or products referred to in the content. |
© 2025 by the authors. Licensee MDPI, Basel, Switzerland. This article is an open access article distributed under the terms and conditions of the Creative Commons Attribution (CC BY) license (http://creativecommons.org/licenses/by/4.0/).
Copyright: This open access article is published under a Creative Commons CC BY 4.0 license, which permit the free download, distribution, and reuse, provided that the author and preprint are cited in any reuse.


