
Submitted:
17 September 2025
Posted:
17 September 2025
You are already at the latest version
Abstract
Background: Socioeconomic factors may influence maternal nutrition knowledge, which directly affects the nutritional status of children under five. This study seeks to explore the importance of socioeconomic status (SES) in relation to maternal nutrition knowledge, as well as how these factors influence children's nutritional status. Method: This cross-sectional study focused on mothers of children aged 36-59 months (n=657). A structured questionnaire was employed to collect data socioeconomic determinants. Anthropometric measurements were taken to assess the nutritional status of the children. The Boruta algorithm, implemented using R Studio, was used to integrate socioeconomic factors and identify key predictors of maternal nutrition knowledge and nutrition status. Result: The analysis revealed that SES was a strong predictor of maternal nutrition knowledge and nutritional status in children under five, particularly stunting and wasting. However, SES was not confirmed as a predictor of underweight. Underweight was an important predictor for stunting and wasting. Furthermore, weaning practices and exclusive breastfeeding were found to be important predictors for underweight, suggesting the importance of infant and young child feeding (IYCF) practices for nutritional status. Conclusion: SES is an important determinant in predicting maternal nutrition knowledge and nutrition status (stunting and wasting) among children under five. These findings underscore the importance of specific nutrition interventions, which must be prioritised by addressing SES and require multi-sectoral strategies to reduce poverty, promote maternal nutrition knowledge, support family income, and improve healthcare access.
Keywords:
Socio-economic
; maternal nutrition knowledge
; stunting
; underweight
; wasting
; mother
1. Introduction
Malnutrition is a prevailing global health concern, especially for children aged under five. More than 47 million children worldwide are suffering from wasting, a severe form of acute malnutrition, and approximately 148.1 million (22.3%) are stunting. Stunting refers to a chronic condition that comes after malnourishment due to years of inadequate nutrition and/or repeated infections that result in impaired growth and cognitive development [1]. Child survival, long-term health and socioeconomic progress are threatened by these forms of malnutrition which lead to lifelong disadvantage, as stunted children complete fewer grades at school and earn less income than non-stunted children [1,2].
Undernutrition adversely affects children aged under five since they require adequate nutrition during their transitional period into adulthood. The symptoms of malnutrition are particularly apparent in stunting (height-for-age Z score below -2 standard deviations) and wasting (weight-for-height Z score below -2 standard deviations), which are indicative of chronic and acute undernutrition, respectively [3,4]. Approximately 15.4% of children globally are underweight [5], representing a composite of these conditions.
The burden of malnutrition is a challenge recently in developing countries as a consequence of poverty and limited access to nutrient-rich foods [6]. Southeast Asia is experiencing the triple burden of malnutrition (2); stunting, micronutrient deficiencies (“hidden hunger”), and susceptibility to obesity that challenges sustainable health development. Indonesia is not an exception, as it still needs to face those problems despite the remarkable economic growth. In terms of national prevalence, there has been a decline in stunting from 27.7% in 2019 to 21.6% in 2022; however, rates remain above the WHO acceptable threshold level of under 20% [7]. A study found that in 2022, 6.8% of children under five had been wasted and 2.1% were severely wasted (1). Urban areas - such as examined in this study, Surabaya - are particularly vulnerable due to persistent socioeconomic disparities.
Previous research identified that lower family income, mother's education, employment, and access to health information are key predictors of maternal nutrition knowledge [8,9,10], which in turn influences child nutritional outcomes [11,12,13]. Maternal nutrition knowledge may affect infant and young child feeding practices [14], and such behaviour is essential to the prevention of malnutrition, but it has not been systematically addressed by most public health strategies. Health promotion activities that address socioeconomic determinants predicting maternal nutrition knowledge are necessary to mitigate the root cause and break the continuity of malnutrition. Nevertheless, the challenges in conducting programmes in the community are about poverty, illiteracy, and availability of nutrition-based foods which need to be addressed through policy measures involving the community [2,6]. By understanding the influence of socioeconomic status (SES) on maternal knowledge regarding child nutrition, it is possible to establish balanced interventions targeting underlying determinants of malnutrition.
The effectiveness of nutrition education interventions underscores maternal nutrition knowledge as a critical determinant for child nutritional status. Many studies demonstrate that the provision of effective nutrition education improves mothers’ knowledge, affecting child feeding practices [15,16] and reducing the risk of malnutrition in children. For instance, the study conducted in Kupang Regency, Indonesia, showed that family-centred education using media such as booklets and food samples was effective to improve nutritional practices among pregnant women during the first 1,000 days of life, which led to reduced stunting [17]. Various interventions have been implemented, including nutrition education [18,19], brainstorming [20], and audiovisual demonstrations [21] to enhance maternal nutrition knowledge and child nutritional status. Nutritional health education methods and media can be in booklets [22], guidebooks, leaflets, and internet technology applications (ICT or webApps or APK) [21,23,24], which have demonstrated significant improvements in maternal nutrition knowledge, showing its relevance with positive child health outcomes, including reduced stunting prevalence [25]. However, the effectiveness of such interventions inherently requires a prior prerequisite condition, especially the equitable capacity for knowledge acquisition. A mother's ability to access, comprehend, and utilise educational resources is not uniform but is profoundly mediated by their household's socioeconomic status (SES), which governs exposure to information, formal education, and technology [26]. Therefore, this research aims to identify socio-economic determinants that limit maternal nutrition knowledge, thereby being useful in designing crucial nutrition strategies that effectively improve maternal nutrition knowledge and child nutritional status.
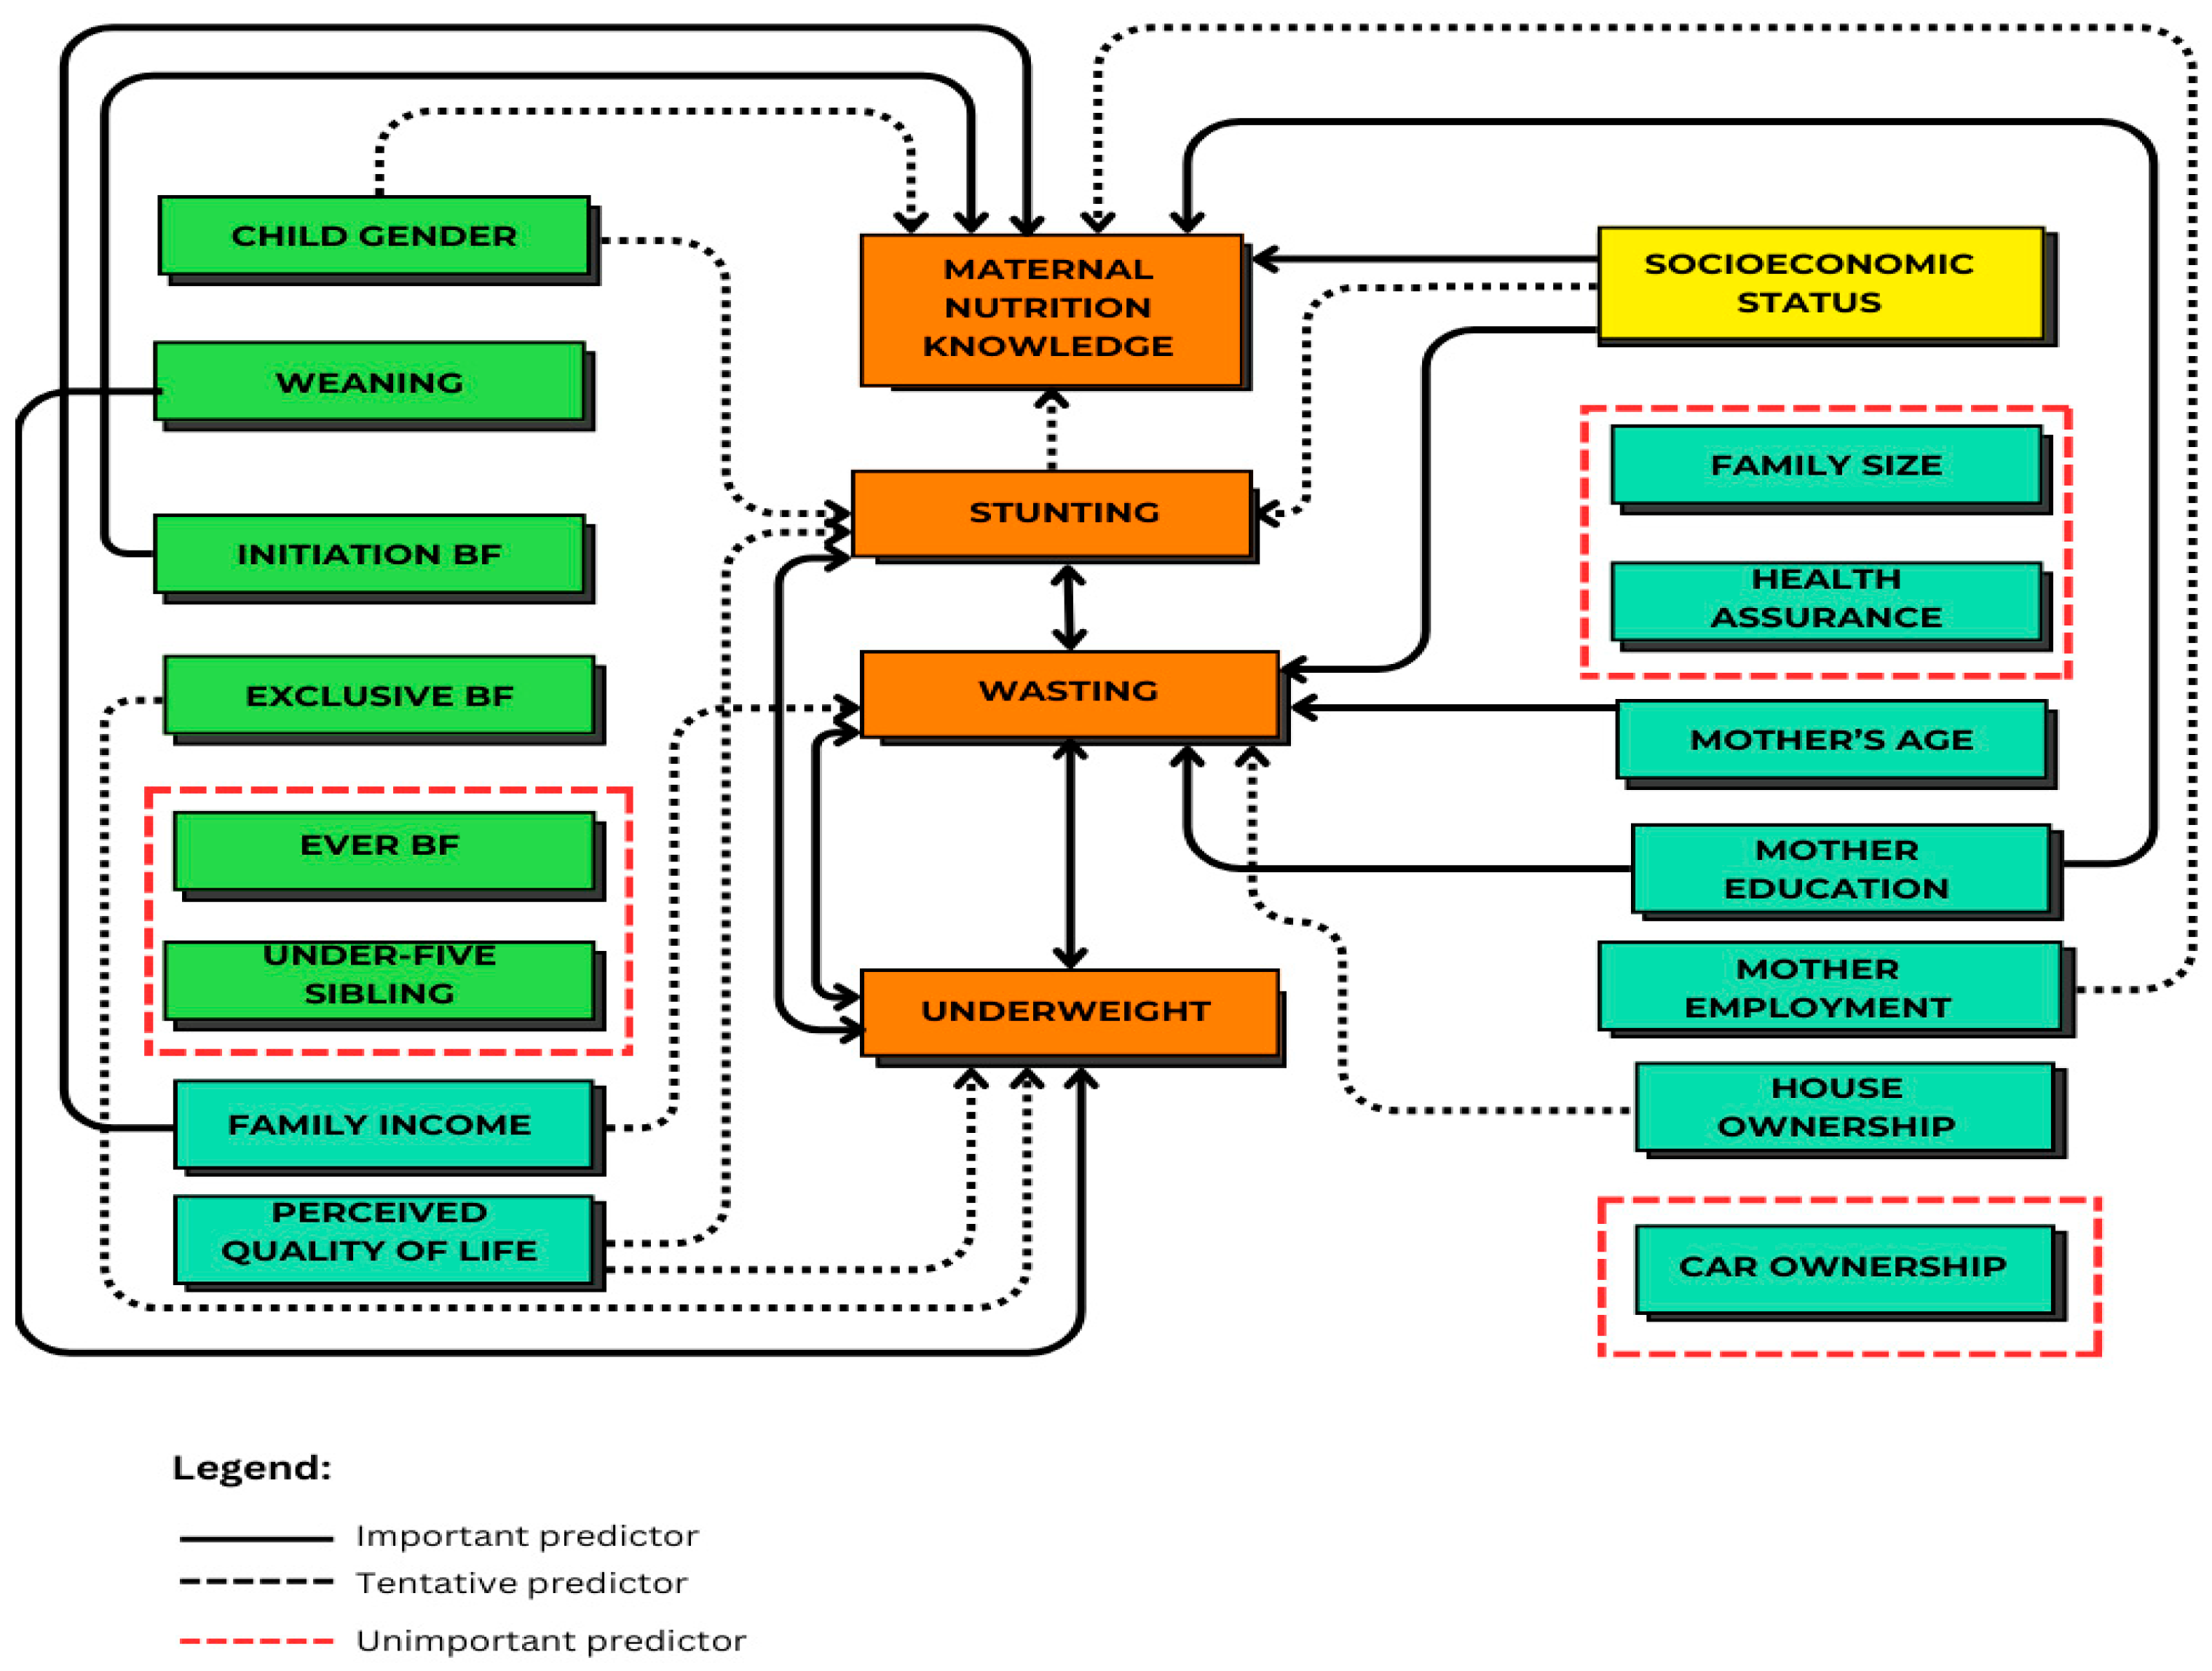
According to the WHO CSDH and UNICEF modified framework, we conceptualise maternal socioeconomics as structural determinants that influence maternal nutrition knowledge and child nutritional status. More precisely, it is the broader socioeconomic factors that relate to women’s resources through education, occupation, and income [27,28]. This position affects intermediate determinants of material circumstances (food accessibility related to affordability of food, living and working conditions) and behavioural factors, among which maternal nutrition knowledge lies as one such key behavioural resource that shapes feeding, caregiving, and use of health services. In this study, we design maternal nutrition knowledge as a mediator which is linked to child nutrition outcomes, acknowledging that inequities arise from upstream systems and are passed on through intermediate states involving children’s growth. Therefore, this study aims to develop a predictive model by identifying the most important socioeconomic determinants as predictors of maternal nutrition knowledge as well as nutritional status of children under five in Surabaya, Indonesia. These findings may also be required to determine which predictors could be suggested for implementing the comprehensive public health intervention based on the predictive model by Boruta analysis.
2. Materials and Methods
2.1. Study Design
The study targeted mothers with children aged 36 to 59 months, ultimately including 657 households in the analysis. A multi-stage cluster random sampling method was employed, using census blocks provided by the Indonesian Bureau of Statistics. This process involved randomly selecting two sub-districts from each district. The sample size for each district was determined proportionally, based on the number of children under five in each district relative to the overall population of children under five in all selected districts. Before participation, written informed consent was obtained from all respondents after a comprehensive explanation of the study’s purpose. Participant confidentiality was strictly upheld throughout the study to ensure anonymity and privacy.
2.2. Data Collection
Data collection was carried out through face-to-face interviews using a structured questionnaire at public health service facilities, scheduled to coincide with routine child monitoring sessions in each subdistrict. Variables were categorized as independent variables including sociodemographic, socioeconomic, and related information were collected using a structured questionnaire. Sociodemographic factors are included child gender, household size, sibling under five, and child health assurance. Socioeconomic status (SES) is a measure of where an individual standing within society, and typically includes assessing income, level of education, occupation, and combined with wealth which refer to financial prosperity (assets, such as house and ownership) [30,31,32]. In this study, SES was computed based on family income, mother education, mother employment, car ownership, house ownership, and perceived quality of life (Table 1). SES levels were measured by total score into tertiles and classified as low SES (≤33.33%), middle SES (33.34%-66.67%), and high SES (>66.67%) [33].
The dependent variables were identified as maternal nutrition knowledge (MNK) and child nutrition status. MNK can be defined as the understanding about nutrients, dietary practices and food preferences by a mother that helps to maintain health and provide proper growth and development of infant. We employed the Qualtrics Survey General Nutrition Knowledge Questionnaire-Revised (GNKQ-R), which has eighteen questions with total scores 52, was used to assess MNK. The GNKQ-R is considered a reliable instrument for evaluating nutritional knowledge in adult population [34]. We divided MNK into three levels by tertiles calculation as cut off points [35]. According to MNK scores, we classified: low MNK (≤17 score), moderate MNK (17-34 score), and high MNK (≥35 score). While child nutrition status indicators were measured weight and height of children. Children weight was measure rigorously with a calibrated and zeroed scale before weighing. Children were weighed with minimal clothing and without footwear, and asked to remain as still as possible. Heights of children were measured in a standing position using a stadiometer. Anthropometric data collection followed the World Health Organization (WHO) guidelines for the measurement, analysis, and reporting of anthropometric indicators in children under five years of age [36]. Nutritional status was evaluated using the WHO Child Growth Standards, with classifications generated through WHO ANTHRO software version 3.2.2. The collected data were converted into Z-scores for key indicators: height-for-age (HAZ), weight-for-height (WHZ), and weight-for-age (WAZ). Stunting, wasting, and underweight were defined as HAZ, WHZ, and WAZ values below -2 standard deviations from the median of the reference population, respectively.
2.3. Data Analysis
Demographic and household characteristics were analyzed as categorical variables to interpret frequency distributions using IBM SPSS version 27.0. Further statistical analysis was performed with the Boruta package which were used previous research identifying the most critical predictors for dependent variables [37]. This process enhances machine learning model performance by eliminating irrelevant variables, thereby simplifying models, improving speed, and increasing accuracy [38]. It is available via the Comprehensive R Archive Network (CRAN) at Boruta Package. The Boruta algorithm provides strong all relevant feature selection by identifying every determinant that is statistically significant to the outcome. The Boruta feature selection algorithm was employed to identify important determinants of outcome variables such as MNK and undernutrition outcomes, including stunting, wasting, and underweight. Boruta algorithm helps in confirming relevant features and discarding irrelevant ones, making it resistant to noise and overfitting using random forest. We prefer Boruta to comprehensively identify all relevant socioeconomic determinants. This non-parametric approach is important in nutritional science study, as it effectively provides high dimensional, complex omics data, and also non-linear relationships, unlike parametric methods in SPSS which relies on parametric assumptions and stepwise methods that can miss important, correlated features or those with complex interactions. Importance scores for these variables were calculated and visualized through boxplots. In these visualizations, blue boxplots represent the minimum, average, and maximum Z-scores of the shadow attributes for dependent variables, red boxplots denote rejected features, and green boxplots highlight confirmed important variables.
3. Results
3.1. Study Population
This study included 657 mothers with children aged between 36 and 59 months. Of the children, 326 (49.6%) were boys and 331 (50.4%) were girls. Among the participants, 25.3% of children were reported to be stunted, while 16.1% and 22.5% were classified as wasted and underweight, respectively. Additionally, 97% of mothers demonstrated low levels of nutritional knowledge.
Socioeconomic status (SES) was determined by family income, mother education, mother employment, car ownership, house ownership, and perceived quality of life. This research revealed that majority of family having under minimum wage per month 2024 (Rp. 4.725.479) [39] was (39.4%). Following with family monthly income below Rp. 5.700.000 was as much 44.3%. Data also showed that the most of mothers have high school education (57.2%) and unemployed (57.7%), mostly no house ownership (67.6%), and no car ownership (87.4%). Most mothers (66.4%) reported as family with an average perceived quality of life evaluated their overall situation as neither particularly good nor poor (Table 1).
Socioeconomic status (SES) of the households was categorized into three levels: high, middle, and low SES. The findings revealed that only 5.0% of the households were classified as high SES, indicating a small proportion of families with significant economic resources. The majority of respondents (89.5%) fell into the middle SES category, reflecting households with average economic stability, while 5.5% were identified as low SES, highlighting the population facing lack of financial to attain a decent standard of living MNK was measured and specified in 3 levels: low, moderate, and high. Even though mostly of respondents demonstrated a moderate level of MNK (72%), but we still found 27.4% of them having low MNK, and less having high MNK (6.0%).
Children who indicated undernutrition experiencing stunting (25.3%), wasting (16.1%), and underweight (22.5%). Furthermore, child feeding practices demonstrated unsuccessful of exclusive breastfeeding (BF) only 37% of children whereas children who ever breastfeed reached 91.9%. Also, a low of proper initiation BF was found of 32.6% experiencing initiation BF within 1 hour after giving birth (Table 1).
3.2. The Important Predictors of Maternal Nutrition Knowledge (MNK)
The Boruta analysis was used to determine the most important predictors of MNK. The results highlighted several critical findings and may reveal important predictors in influencing maternal nutrition knowledge and child nutrition. SES and initiation BF scores emerged as the most important predictors for MNK, respectively. Furthermore, stunting and child gender were indicated as tentative predictors for MNK, suggests its roles as moderate predictors which related to MNK. Furthermore, SES variables found to be important in influencing MNK were mother education and family income (Table 2; Figure 1).
3.3. The Importance Predictors of Stunting
Wasting and underweight were identified as important determinants, contributing significantly to the model's ability to accurately predict stunting status, and were classified as confirmed with Boruta analysis. Additionally, SES and child gender were revealed as moderate effects on stunting, whereas the indicator of SES highlighted as moderate predictor of stunting was perceived quality of life as shown in Table 3 and Figure 2.
3.4. The Importance Predictors of Wasting
The study also sought to identify key determinants for predicting wasting status using the Boruta algorithm. SES was revealed as an important predictor for wasting, following stunting, underweight, and mother’s age also emerged as highly significant determinants, strongly influencing wasting status. In addition, the analysis found several SES determinants as strong important determinant i.e., mother education, whereas moderate important determinants i.e., family income and house ownership. Several factors were deemed non-significant in predicting wasting status, including MNK, child gender, child health assurance, under five siblings, exclusive BF, and ever BF. These findings, presented in Table 4 and Figure 3, provide valuable insights into the critical and non-critical factors correlated with wasting status in children under five.
3.5. The Importance Predictors of Underweight
SES was not confirmed as an important determinant for underweight, even though perceived quality of life revealed as a moderate predictor. In contrast with stunting wasting, and weaning practices, which were classified as important determinants by Boruta analysis, contributing significantly to the predictive model to accurately predict underweight status. Additionally, moderate determinants were found, including mother’s age and exclusive BF, illustrated in Table 5 and Figure 4. These findings provide critical perspectives into the determinants of underweight status and may contribute to health priority programmes and modelling initiatives with related studies.
4. Discussion
The current study has underscored the importance of socioeconomic determinants which are determined by family income, mother education, mother employment, car ownership, house ownership, and perceived quality of life as predictors for MNK and nutritional status of children 36–59 months. Employing Boruta algorithm analysis, socioeconomic status (SES) significantly indicated as the most important predictor across models for MNK and undernutrition status, particularly wasting status in children, while also confirming as important determinants of being stunting and underweight that may influence directly and indirectly. The results provide evidence that child undernutrition is a multidimensional problem in which socioeconomic determinants which are determined SES might affect the ability of mothers to access and understand nutrition-related knowledge as well as the resources needed for optimal child growth.
4.1. Socioeconomic Status and Maternal Nutrition Knowledge (MNK)
This study found that MNK has strongly association with SES and early initiation of BF. Previous study highlighted that higher SES is an important driver for exposure to health information, uptake of antenatal and postnatal services also influences engagement with healthcare services [40,41,42]. Low SES mothers may additionally face barriers as reading literacy is a pre-requisite for obtaining health information, they have more difficulties in utilization of health care and other competing economic priorities. Recent findings indicated that maternal knowledge mediates the association SES and feeding practices, leading to better dietary diversity and growth among children, respectively [43,44]. In this study, SES classified by education, employment, income and wealth condition aligns with previous studies that highlight the relationship between education, income, and occupation with MNK levels [42].
Interestingly, mother education as one of SES determinants was revealed as an important predictor for MNK. This study aligns with previous findings which highlighted significant relationship between maternal education level and MNK [45,46]. Previous study analyzed about relationship mother education with level of exposure and access to media. The effect of a mother's higher level of education can be partly explained by their access to information, as measured by newspaper, television, social media, posters, and/or other internet and communication technologies in general and with respect to child health and nutrition [47,48]. Moreover, their ability to express, to think autonomously on the basis of an acquired knowledge and the effect of their immediate environment and community also help explain how they make choices about nutrient health care for children.
Recent study revealed that family income was predictor for nutrition knowledge among pregnant women [49]. This finding similarly identified with current study which indicated that family income was an important predictor of MNK. Family income can influence access to various resources that contribute to nutrition knowledge. For instance, it can determine a family's ability to acquire diverse and nutrient food preferences, which can, in turn, familiarize mothers with a broader spectrum of food groups and their nutritional significance. Additionally, family income may influence access to health and nutrition information, such as books, magazines, or online resources focused on child health and nutrition. It can also affect the ability to seek out and utilize healthcare services that provide dietary counseling, whether from general practitioners, nurses, or specialized nutritionists. These various avenues, influenced by a family's financial capacity, collectively contribute to a pregnant woman's acquisition of comprehensive nutrition knowledge, enabling her to make informed decisions regarding her and her child's dietary well-being.
Additionally, stunting status was also identified as an important predictor of MNK in the Boruta model, which may reflect a bi-directional relationship. While mothers whose child is underweight may actively be seeking nutrition information once growth faltering has been diagnosed, low pre-diagnosis knowledge of these mothers might lead to poor feeding practices causing underweight. These results are inconsistent with previous research that did not find an association between MNK and malnutrition [50,51]. Otherwise, malnutrition may suggest improved MNK was affected after experiencing malnutrition in children. Consequently, mothers find out more about child feeding and healthy food for their child.
4.2. Socioeconomic Status (SES) and Child Undernutrition
The significant association of SES with wasting, and indirectly with stunting and underweight implies that SES plays a crucial role in determining different forms of malnutrition as primary determinant. This is consistent with previous studies that children in lower-SES households are more vulnerable to being stunting. Children in low- and middle-income countries from the poorest wealth quintiles are higher likelihood to be stunted, wasted, or underweight compared to those in the highest quintiles [52]. SES was the strongest predictor of stunting and wasting, consistent with a number of recent studies that show large, positive relationships between higher household wealth and improved child growth outcomes [53,54]. In terms of mechanism, SES works in different ways on child nutrition by affecting household food security [55] and dietary diversity [43] enabling access to good health care facilities, better sanitation and hygiene conditions [56] and indirectly increasing maternal education which again predicts better feeding practice [57] and getting better job opportunity which may support household food security [58].
The present study revealed that SES is an moderate predictor for stunting, which relates to perceived quality of life in households. It aligns with previous research that found the relationship between SES and their ability to secure a diverse, nutrient-rich diet and constrain access to maternal healthcare [43,59], safe water, and sanitation facilities [56]. Previous research suggested that lower SES also correlates with lower maternal education levels [9,42]. Aligned with this study, it also confirmed that SES is one important predictor for MNK, which in turn reduces the likelihood of adopting optimal IYCF practices.
This study highlights that SES works through acute deprivation, which is found in wasting in children and may increase vulnerability to infectious diseases. Consistent with previous research, households that have lower purchasing power often rely on the worst alternative foods, such as substitutes for cereal-based processed foods [60], and lack access to health care during illness episodes, which contribute to accelerated weight loss and wasting [61,62]. Similar to what has been reported in Sub-Saharan African countries and South Asia, low household income was consistently associated with increased odds of wasting [63,64], particularly in the context of high infection burdens [63].
Furthermore, this study emphasizes that the mother education has the strongest socioeconomic impact on child nutrition, particularly on wasting, as it gives the knowledge required to feed and medicate children optimally related to the information about various nutrients, recognizing sickness symptoms, regardless of finances, whereas family income and house ownership were less but still considerably, whether a household can afford healthy food and shelter stability but not necessarily use effectively without maternal education. Parallel with this, previous study revealed that improving maternal education is essential in order to address child undernutrition (stunting, wasting, and underweight), because it provides mothers with the necessary knowledge input for a better childcare and nutrition practice [65].
For underweight, the pathway of effect of SES is an indirect effect through stunting and wasting, since stunting and wasting were important predictors for underweight. Likewise, stunting and wasting were identified as important predictors of underweight, indicating a strong interrelationship among these indicators of child malnutrition. However, it found in the previous study that low SES households have high cumulative risks because the same underlying socioeconomic barriers contribute to both acute and chronic forms of malnutrition exposures like poor dietary quality, inadequate feeding frequency and recurrent infections which directly leads to low weight-for-age [66]. Moreover, the present study indicated that IYCF practices, particularly weaning practices [67] and exclusive BF [68] as predictors of underweight which means a possible link with undernutrition status as studied in prior studies [67,68].
SES may exert relatively low impact on child undernutrition in predominantly homogenous low-socioeconomic groups and is mainly modulated by feeding culture and maternal nutritional knowledge, which determine dietary patterns in mothers and children [69]. Nutrition intervention must, therefore, be implemented at multiple levels of society and not in an isolated manner, for addressing malnutrition is challenging. A multifaceted approach, which certainly has to include revamping MNK to encourage healthier dietary patterns and thus dietary diversity, leading families towards a better nutritional status, can prove effective.
Previous studies also indicated that differences in SES may be lesser between individuals and other factors, such as cultural feeding norms (food taboos, food prohibitions) or MNK, are responsible for greater dietary patterns for mothers and children [70,71,72]. This highlights the importance of a multi-level analysis that takes into consideration not only overall economic inequality, but also localized socio-cultural factors. Consequently, interventions need to be focused on culture, integrating with SES improvements and tailored education for reducing cultural barriers and improving MNK.
These studies underscore the importance of IYCF behaviours in child growth and nutritional status development. Weaning practices highlight as an important predictor of underweight, consistent with earlier finding indicated a significant relationship between weaning practices and underweight [73]. In addition, exclusive BF had the trend for being a less definitive essential predictor for underweight than weaning practices, suggesting that while exclusive breastfeeding may influence nutritional status changes over time, its effect needs further investigation.
The evidence presented highlights the need to incorporate economic and educational interventions into child nutrition strategies. Programs aimed at poverty alleviation, conditional cash transfers and women’s economic empowerment are required together with culturally tailored antenatal educational programs delivered through community health workers as well as specific maternal nutrition-based mass media campaigns. Structural (SES) and behavioral (MNK, feeding practices) determinants should be targeted to achieve sustainable reductions in stunting, wasting, and underweight.
4.3. Strengths and Limitation
This study combines a more detailed assessment using the Boruta algorithm for feature selection improved methodological rigor by enabling an objective recapitulation of the most important predictors and reduced bias compared to regression models. Boruta uses shadow features and selects the only relevant models to target variable based on random forest importance measure. Moreover, combining maternal, child and household factors across different domains (i.e. SES, MNK, child nutritional status) allowed a comprehensive examination of both structural and behavioral determinants in IYCF; hence the results have direct programmatic and policy relevance.
However, some limitations should be considered. Boruta Algorithm prohibits causal inference, while observed associations, particularly for some factors such as MNK and child nutritional status, may reflect reverse causality. Self-reported measures of breastfeeding initiation, exclusive BF, and maternal knowledge have the potential for recall and social desirability bias which could result in non-differential misclassification. Last, the research instrument (questionnaire) contained only close-ended questions. By implication, this meant participants would have limited response options. When SES was not found as an important predictor, we could not know which other variable may directly influence dependent variables. Qualitative study was suggested for further research to explore uncovered information. Lastly, Boruta also still need for deeper examination by another test, for example Chi square test, to investigate the difference effect of SES levels to MNK and undernutrition.
5. Conclusions
The importance of socioeconomic determinants to predict MNK and child undernutrition outcomes in this study is underscored. SES was the most important predictor of MNK and stunting which suggests interventions addressing both economic constraints together with nutritional education may be required to enhance the impact of nutrition programmes. Socioeconomic determinants such as family income and mother education are the most important predictors for MNK. Whereas child feeding practices (weaning practices and exclusive BF) are important in predicting undernutrition, as well initiation BF in predicting MNK, especially to those whose long-term child growth outcomes are not severely affected by the structural socioeconomic status. Results support a multi-sectoral approach including economic, maternal education and nutrition-specific interventions to break the intergenerational cycle of malnutrition and enable sustainable improvements in early child health and development for resource-limited settings. Interventions aimed at enhancing SES, strengthening access to health services, and targeted nutrition education are required in tackling the root causes of child undernutrition.
Figure 5.
Importance model of socioeconomic for predicting maternal nutrition knowledge (MNK) and undernutrition.
Figure 5.
Importance model of socioeconomic for predicting maternal nutrition knowledge (MNK) and undernutrition.
Author Contributions
A.D.A. participated in designing the study, developing the questionnaires, analysing statistical test, and interpreting the data, and writing the manuscript, R.D.L. contributed to data collection/survey coordination and writing research gap, E.N. reviewed and edited the text, and H.J.F. participated in designing the study, developing the questionnaires, reviewing, and finalizing the manuscript. All authors have read and agreed to the published version of the manuscript.
Funding
This research received no external funding. The APC was funded by Semmelweis University
Institutional Review Board Statement
Ethical approval was secured from the Health Research Ethics Committee of the National Research and Innovation Agency (NRIA) Indonesia; Number: 039/KE.03/SK/02/2024. The study’s objectives, risks, advantages, confidentiality, and respondents’ responsibilities were comprehensively conveyed to parents in the local language. Data collection commenced solely upon the obtaining of informed written consent from respondents.
Informed Consent Statement
Informed consent was obtained from all respondents involved in this research.
Data Availability Statement
The raw data of this study is available upon request to the authors for the purpose of academic research.
Acknowledgments
The authors would like to express their sincere gratitude, enumerators and nutritionists in Surabaya, Indonesia, who had been involved in this study. The authors wish to special thank Sekolah Tinggi Ilmu Kesehatan Hang Tuah Surabaya and Health Sciences Division, Doctoral College, and the Department of Social Sciences, Faculty of Health Sciences, Semmelweis University, Hungary, and Surabaya Health Office for their institutional support.
Conflicts of Interest
The study was undertaken solely for academic purposes, and the authors declare no conflicts of interest.
Abbreviations
The following abbreviations are used in this manuscript:
| MNK | Maternal nutrition knowledge |
| CSDH | Conceptual Framework for Action on The Social Determinants of Health |
| ICT | Information and Communication Technology |
| WebApps | Web applications |
| APK | Android Package Kit |
| BF | Breastfeeding |
| WHZ | Weight for height Z-score |
| HAZ | Height for age Z-score |
| WAZ | Weight for age Z-score |
| WHO | World Health Organization |
| SES | Socioeconomic status |
| IYCF | Infant and young child feeding |
| GNKQ-R | General Nutrition Knowledge Questionnaire-Revised |
References
- UNICEF, WHO, WORLD BANK. Level and trend in child malnutrition. World Health Organization [Internet]. 2023 [cited 2024 Dec 23];4. Available from: https://www.who.int/publications/i/item/9789240073791.
- Rahut DB, Mishra R, Bera S. Geospatial and environmental determinants of stunting, wasting, and underweight: Empirical evidence from rural South and Southeast Asia. Nutrition. 2024 Apr 1;120:112346. [CrossRef]
- WHO, UNICEF. WHO Child Growth Standards and the Identification of Severe Acute Malnutrition in Infants and Children: A Joint Statement by the World Health Organization and the United Nations Children’s Fund. WHO Child Growth Standards and the Identification of Severe Acute Malnutrition in Infants and Children: A Joint Statement by the World Health Organization and the United Nations Children’s Fund [Internet]. 2009 [cited 2024 Dec 23];11. Available from: http://apps.who.int/iris/bitstream/10665/44129/1/9789241598163_eng.pdf.
- Briend A, Khara T, Dolan C. Wasting and stunting--similarities and differences: policy and programmatic implications. Food Nutr Bull [Internet]. 2015 Mar 1 [cited 2024 Dec 23];36(1 Suppl):S15–23. Available from: https://pubmed.ncbi.nlm.nih.gov/25902610/ . [CrossRef]
- World Health Organization. Underweight among children under 5 years of age (number in millions) (JME) [Internet]. [cited 2024 Dec 23]. Available from: https://www.who.int/data/gho/data/indicators/indicator-details/GHO/gho-jme-underweight-numbers-(in-millions).
- Siddiqui F, Salam RA, Lassi ZS, Das JK. The Intertwined Relationship Between Malnutrition and Poverty. Front Public Health [Internet]. 2020 Aug 28 [cited 2024 Dec 23];8:525026. Available from: www.frontiersin.org . [CrossRef]
- Rini Puji Lestari T. STUNTING IN INDONESIA: UNDERSTANDING THE ROOTS OF THE PROBLEM AND SOLUTIONS. PUSAKA DPR RI [Internet]. 2023 Jul [cited 2024 Dec 23];Vol. XV / No. 14. Available from: https://berkas.dpr.go.id/pusaka/files/info_singkat/Info%20Singkat-XV-14-II-P3DI-Juli-2023-196-EN.pdf.
- Kamiya Y. Socioeconomic Determinants of Nutritional Status of Children in Lao PDR: Effects of Household and Community Factors. J Health Popul Nutr [Internet]. 2011 [cited 2024 Dec 23];29(4):339. Available from: https://pmc.ncbi.nlm.nih.gov/articles/PMC3190364/ . [CrossRef]
- Ijaiya MA, Anjorin S, Uthman OA. Income and education disparities in childhood malnutrition: a multi-country decomposition analysis. BMC Public Health [Internet]. 2024 Dec 1 [cited 2024 Dec 23];24(1):2882. Available from: https://bmcpublichealth.biomedcentral.com/articles/10.1186/s12889-024-20378-z . [CrossRef]
- Yani DI, Rahayuwati L, Sari CWM, Komariah M, Fauziah SR. Family Household Characteristics and Stunting: An Update Scoping Review. Nutrients [Internet]. 2023 Jan 1 [cited 2024 Dec 23];15(1):233. Available from: https://pmc.ncbi.nlm.nih.gov/articles/PMC9824547/ . [CrossRef]
- Fadare O, Amare M, Mavrotas G, Akerele D, Ogunniyi A. Mother’s nutrition-related knowledge and child nutrition outcomes: Empirical evidence from Nigeria. PLoS One [Internet]. 2019 Jan 1 [cited 2024 Dec 23];14(2). Available from: https://pubmed.ncbi.nlm.nih.gov/30817794/ . [CrossRef]
- Hosen MZ, Pulok MH, Hajizadeh M. Effects of maternal employment on child malnutrition in South Asia: An instrumental variable approach. Nutrition [Internet]. 2023 Jan 1 [cited 2024 Dec 23];105. Available from: https://pubmed.ncbi.nlm.nih.gov/36335875/ . [CrossRef]
- Debela BL, Demmler KM, Rischke R, Qaim M. Maternal nutrition knowledge and child nutritional outcomes in urban Kenya. Appetite. 2017 Sep 1;116:518–26. [CrossRef]
- Maternal Nutrition and Complementary Feeding | UNICEF East Asia and Pacific [Internet]. [cited 2024 Dec 23]. Available from: https://www.unicef.org/eap/reports/maternal-nutrition-and-complementary-feeding.
- Mohammed EAI, Taha Z, Eldam AAAG, Shommo SAM, El Hidai MM, Mohammed I, et al. Effectiveness of a Nutrition Education Program in Improving Mothers’ Knowledge and Feeding Practices of Infants and Young Children in Sudan. Open Access Maced J Med Sci [Internet]. 2022 Mar 3 [cited 2024 Dec 23];10(E):776–82. Available from: https://oamjms.eu/index.php/mjms/article/view/8842 . [CrossRef]
- Effendy DS, Prangthip P, Soonthornworasiri N, Winichagoon P, Kwanbunjan K. Nutrition education in Southeast Sulawesi Province, Indonesia: A cluster randomized controlled study. Matern Child Nutr [Internet]. 2020 Oct 1 [cited 2024 Dec 23];16(4):e13030. Available from: https://pmc.ncbi.nlm.nih.gov/articles/PMC7507461/ . [CrossRef]
- Setia A, Shagti I, Maria Boro RA, Mirah Adi A, Saleh A, Amryta Sanjiwany P. The Effect of Family-Based Nutrition Education on the Intention of Changes in Knowledge, Attitude, Behavior of Pregnant Women and Mothers With Toddlers in Preventing Stunting in Puskesmas Batakte, Kupang Regency, East Nusa Tenggara, Indonesia Working Area. 14(3).
- Black MM, Delichatsios HK, Story MT, editors. Nutrition Education: Strategies for Improving Nutrition and Healthy Eating in Individuals and Communities. 2019 Nov 28 [cited 2025 Sep 12];92. Available from: https://karger.com/books/book/115/Nutrition-Education-Strategies-for-Improving.
- Prasetyo YB, Permatasari P, Susanti HD. The effect of mothers’ nutritional education and knowledge on children’s nutritional status: a systematic review. International Journal of Child Care and Education Policy [Internet]. 2023 Dec 1 [cited 2025 Sep 12];17(1):1–16. Available from: https://link.springer.com/articles/10.1186/s40723-023-00114-7 . [CrossRef]
- Demilew YM, Alene GD, Belachew T. Effect of guided counseling on nutritional status of pregnant women in West Gojjam zone, Ethiopia: A cluster-randomized controlled trial. Nutr J [Internet]. 2020 Apr 28 [cited 2025 Sep 12];19(1):1–12. Available from: https://nutritionj.biomedcentral.com/articles/10.1186/s12937-020-00536-w . [CrossRef]
- Wahyurin IS, Aqmarina AN, Rahmah HA, Hasanah AU, Silaen CNB. Effect of stunting education using brainstorming and audiovisual methods towards knowledge of mothers with stunted children. Ilmu Gizi Indonesia [Internet]. 2019 Feb 25 [cited 2025 Sep 12];2(2):141–6. Available from: https://ilgi.respati.ac.id/index.php/ilgi2017/article/view/111.
- Suryati S, Supriyadi S. THE EFFECT OF BOOKLET EDUCATION ABOUT CHILDREN NUTRITION NEEDS TOWARD KNOWLEDGE OF MOTHER WITH STUNTING CHILDREN IN PUNDONG PRIMARY HEALTH CENTER WORK AREA BANTUL YOGYAKARTA. Procceeding the 4th International Nursing Conference [Internet]. 2019 Nov 28 [cited 2025 Sep 12];0(0):102–9. Available from: https://jurnal.unmuhjember.ac.id/index.php/INC/article/view/2703.
- Dinengsih S, Hakim N. The influence of the lecture method and the android-based application method on adolescent reproductive health knowledge. JKM (Jurnal Kebidanan Malahayati) [Internet]. 2020 Oct 26 [cited 2025 Sep 12];6(4):515–22. Available from: https://ejurnalmalahayati.ac.id/index.php/kebidanan/article/view/2975.
- Patel AB, Kuhite PN, Alam A, Pusdekar Y, Puranik A, Khan SS, et al. M-SAKHI—Mobile health solutions to help community providers promote maternal and infant nutrition and health using a community-based cluster randomized controlled trial in rural India: A study protocol. Matern Child Nutr. 2019 Oct 1;15(4). [CrossRef]
- Mistry SK, Hossain MB, Arora A. Maternal nutrition counselling is associated with reduced stunting prevalence and improved feeding practices in early childhood: A post-program comparison study. Nutr J [Internet]. 2019 Aug 27 [cited 2025 Sep 12];18(1):1–9. Available from: https://nutritionj.biomedcentral.com/articles/10.1186/s12937-019-0473-z . [CrossRef]
- Kassaw MW, Bitew AA, Gebremariam AD, Fentahun N, Açik M, Ayele TA. Low Economic Class Might Predispose Children under Five Years of Age to Stunting in Ethiopia: Updates of Systematic Review and Meta-Analysis. J Nutr Metab [Internet]. 2020 [cited 2025 Sep 12];2020. Available from: https://pubmed.ncbi.nlm.nih.gov/33489361/ . [CrossRef]
- A Conceptual Framework for Action on the Social Determinants of Health [Internet]. [cited 2025 Sep 12]. Available from: https://www.who.int/publications/i/item/9789241500852.
- Health C on EHP to A the SD of, Health B on G, Medicine I of, National Academies of Sciences E and M. Frameworks for Addressing the Social Determinants of Health. 2016 Oct 14 [cited 2025 Sep 12]; Available from: https://www.ncbi.nlm.nih.gov/books/NBK395979/.
- UNICEF, York) UNICEFEB (1990 sess. : N. Strategy for improved nutrition of children and women in developing countries. [Internet]. UNICEF,; 1990 [cited 2025 Sep 12]. Available from: https://digitallibrary.un.org/record/227230.
- Marrie RA. Demographic, Genetic, and Environmental Factors That Modify Disease Course. Neurol Clin [Internet]. 2011 May 1 [cited 2025 Aug 7];29(2):323–41. Available from: https://www.sciencedirect.com/science/article/abs/pii/S073386191000157X . [CrossRef]
- Socioeconomic status [Internet]. [cited 2025 Aug 7]. Available from: https://www.apa.org/topics/socioeconomic-status.
- McKinsey. Personalized Medicine - The path forward. Translational Informatics. 2013;35–60.
- Fiala MA, Finney JD, Liu J, Stockerl-Goldstein KE, Tomasson MH, Vij R, et al. Socioeconomic Status is Independently Associated with Overall Survival in Patients with Multiple Myeloma. Leuk Lymphoma [Internet]. 2015 Sep 2 [cited 2025 Aug 7];56(9):2643. Available from: https://pmc.ncbi.nlm.nih.gov/articles/PMC4831207/ . [CrossRef]
- Kliemann N, Wardle J, Johnson F, Croker H. Reliability and validity of a revised version of the General Nutrition Knowledge Questionnaire. Eur J Clin Nutr [Internet]. 2016 Oct 1 [cited 2024 Dec 23];70(10):1174–80. Available from: https://pubmed.ncbi.nlm.nih.gov/27245211/ . [CrossRef]
- Yanagihara Y, Narumi-Hyakutake A. Relationship between nutrition knowledge and nutritional adequacy in Japanese university students: a cross-sectional study. J Nutr Sci [Internet]. 2025 Feb 5 [cited 2025 Aug 7];14:e14. Available from: https://pmc.ncbi.nlm.nih.gov/articles/PMC11811863/ . [CrossRef]
- English - WHO Child Growth Standards and the Identification of Severe Acute Malnutrition in Infants and Children - NCBI Bookshelf [Internet]. [cited 2024 Dec 23]. Available from: https://www.ncbi.nlm.nih.gov/books/NBK200776/?report=reader.
- Saleem J, Zakar R, Butt MS, Aadil RM, Ali Z, Bukhari GMJ, et al. Application of the Boruta algorithm to assess the multidimensional determinants of malnutrition among children under five years living in southern Punjab, Pakistan. BMC Public Health [Internet]. 2024 Dec 1 [cited 2024 Dec 23];24(1):1–10. Available from: https://bmcpublichealth.biomedcentral.com/articles/10.1186/s12889-024-17701-z . [CrossRef]
- Kursa MB, Rudnicki WR. Feature Selection with the Boruta Package. J Stat Softw [Internet]. 2010 Sep 16 [cited 2024 Dec 23];36(11):1–13. Available from: https://www.jstatsoft.org/index.php/jss/article/view/v036i11 . [CrossRef]
- Jaringan Dokumentasi dan Informasi Hukum [Internet]. [cited 2025 Sep 13]. Available from: https://dokumjdih.jatimprov.go.id/arsip/info/48965.html.
- Pandey S, Karki S. Socio-economic and Demographic Determinants of Antenatal Care Services Utilization in Central Nepal. Int J MCH AIDS [Internet]. 2014 [cited 2025 Aug 9];2(2):212. Available from: https://pmc.ncbi.nlm.nih.gov/articles/PMC4948147/.
- Escañuela Sánchez T, Linehan L, O’Donoghue K, Byrne M, Meaney S. Facilitators and barriers to seeking and engaging with antenatal care in high-income countries: A meta-synthesis of qualitative research. Health Soc Care Community [Internet]. 2022 Nov 1 [cited 2025 Aug 9];30(6):e3810. Available from: https://pmc.ncbi.nlm.nih.gov/articles/PMC10092326/ . [CrossRef]
- Yadav AK, Sahni B, Jena PK. Education, employment, economic status and empowerment: Implications for maternal health care services utilization in India. J Public Aff [Internet]. 2021 Aug 1 [cited 2025 Aug 9];21(3):e2259. Available from: /doi/pdf/10.1002/pa.2259 . [CrossRef]
- Harvey CM, Newell ML, Padmadas S. Maternal socioeconomic status and infant feeding practices underlying pathways to child stunting in Cambodia: structural path analysis using cross-sectional population data. BMJ Open [Internet]. 2022 Nov 3 [cited 2025 Aug 9];12(11):e055853. Available from: https://pmc.ncbi.nlm.nih.gov/articles/PMC9639063/ . [CrossRef]
- Tahreem A, Rakha A, Anwar R, Rabail R, Maerescu CM, Socol CT, et al. Impact of maternal nutritional literacy and feeding practices on the growth outcomes of children (6–23 months) in Gujranwala: a cross-sectional study. Front Nutr. 2024 Jan 7;11:1460200. [CrossRef]
- Gbratto-Dobe SAW, Segnon HB. Is mother’s education essential to improving the nutritional status of children under five in Côte d′Ivoire? SSM - Health Systems [Internet]. 2025 Jun 1 [cited 2025 Sep 13];4:100056. Available from: https://www.sciencedirect.com/science/article/pii/S294985622500008X.
- Phyo WY, Khin OK, Aung MH. Mothers’ Nutritional Knowledge, Self-efficacy, and Practice of Meal Preparation for School-age Children in Yangon. Makara Journal of Health Research [Internet]. [cited 2025 Sep 13];25:25. Available from: https://scholarhub.ui.ac.id/mjhr.
- Thomas D, Strauss J, Henriques MH. How Does Mother’s Education Affect Child Height? J Hum Resour. 1991 Spring;26(2):183. [CrossRef]
- Prickett KC, Augustine JM. Maternal Education and Investments in Children’s Health. J Marriage Fam [Internet]. 2015 Feb 1 [cited 2025 Sep 13];78(1):7. Available from: https://pmc.ncbi.nlm.nih.gov/articles/PMC4712746/ . [CrossRef]
- Wang WC, Zou SM, Ding Z, Fang JY. Nutritional knowledge, attitude and practices among pregnant females in 2020 Shenzhen China: A cross-sectional study. Prev Med Rep [Internet]. 2023 Apr 1 [cited 2025 Sep 13];32:102155. Available from: https://pmc.ncbi.nlm.nih.gov/articles/PMC9975685/ . [CrossRef]
- Forh G, Apprey C, Frimpomaa Agyapong NA. Nutritional knowledge and practices of mothers/caregivers and its impact on the nutritional status of children 6–59 months in Sefwi Wiawso Municipality, Western-North Region, Ghana. Heliyon [Internet]. 2022 Dec 1 [cited 2025 Aug 9];8(12):e12330. Available from: https://www.sciencedirect.com/science/article/pii/S2405844022036180 . [CrossRef]
- Albanus FS, Ashipala DO. Nutritional knowledge and practices of mothers with malnourished children in a regional hospital in Northeast Namibia. J Public Health Afr [Internet]. 2023 Aug 1 [cited 2025 Aug 9];14(8):2391. Available from: https://pmc.ncbi.nlm.nih.gov/articles/PMC10519119/ . [CrossRef]
- Atsu BK, Guure C, Laar AK. Determinants of overweight with concurrent stunting among Ghanaian children. BMC Pediatr [Internet]. 2017 Jul 27 [cited 2025 Aug 11];17(1):1–12. Available from: https://bmcpediatr.biomedcentral.com/articles/10.1186/s12887-017-0928-3 . [CrossRef]
- Chowdhury MRK, Rahman MS, Billah B, Kabir R, Perera NKP, Kader M. The prevalence and socio-demographic risk factors of coexistence of stunting, wasting, and underweight among children under five years in Bangladesh: a cross-sectional study. BMC Nutr [Internet]. 2022 Dec 1 [cited 2025 Aug 11];8(1):1–12. Available from: https://bmcnutr.biomedcentral.com/articles/10.1186/s40795-022-00584-x . [CrossRef]
- Soekatri MYE, Sandjaja S, Syauqy A. Stunting Was Associated with Reported Morbidity, Parental Education and Socioeconomic Status in 0.5–12-Year-Old Indonesian Children. International Journal of Environmental Research and Public Health 2020, Vol 17, Page 6204 [Internet]. 2020 Aug 27 [cited 2025 Aug 11];17(17):6204. Available from: https://www.mdpi.com/1660-4601/17/17/6204/htm . [CrossRef]
- Silas VD, Pomat W, Jorry R, Emori R, Maraga S, Kue L, et al. Household food insecurity during the COVID-19 pandemic and associated socioeconomic demographic factors in Papua New Guinea: Evidence from the Comprehensive Health and Epidemiological Surveillance System. BMJ Glob Health [Internet]. 2023 Nov 19 [cited 2025 Aug 11];8(11). Available from: https://pubmed.ncbi.nlm.nih.gov/37984899/ . [CrossRef]
- Arini D, Ernawati D, Hayudanti D, Alristina AD. Impact of socioeconomic change and hygiene sanitation during pandemic COVID-19 towards stunting. International Journal of Public Health Science (IJPHS) [Internet]. 2022 Dec 1 [cited 2025 Jul 27];11(4):1382–90. Available from: https://ijphs.iaescore.com/index.php/IJPHS/article/view/21602 . [CrossRef]
- Emmanuel NB, Mapatano MA, Celestin BLN, Kalombola C, Gérard MM, Bavon TM, et al. Complementary Feeding Practices Associated With Malnutrition in Children Aged 6-23 Months in the Tshamilemba Health Zone, Haut-Katanga, DRC, 2021. Acta Scientifci Nutritional Health. 2023;02–17. [CrossRef]
- Alristina C:, Mahrouseh AD;, Irawan N;, Laili AS;, Zimonyi-Bakó RD;, Feith AV;, et al. Prematurity and Low Birth Weight Among Food-Secure and Food-Insecure Households: A Comparative Study in Surabaya, Indonesia. Nutrients 2025, Vol 17, Page 2479 [Internet]. 2025 Jul 29 [cited 2025 Aug 1];17(15):2479. Available from: https://www.mdpi.com/2072-6643/17/15/2479/htm.
- Adhikari N, Acharya K, Upadhya DP, Pathak S, Pokharel S, Pradhan PMS. Infant and young child feeding practices and its associated factors among mothers of under two years children in a western hilly region of Nepal. PLoS One [Internet]. 2021 Dec 1 [cited 2025 Jan 7];16(12):e0261301. Available from: https://pmc.ncbi.nlm.nih.gov/articles/PMC8675745/ . [CrossRef]
- Noort MWJ, Renzetti S, Linderhof V, du Rand GE, Marx-Pienaar NJMM, de Kock HL, et al. Towards Sustainable Shifts to Healthy Diets and Food Security in Sub-Saharan Africa with Climate-Resilient Crops in Bread-Type Products: A Food System Analysis. Foods [Internet]. 2022 Jan 2 [cited 2025 Aug 11];11(2):135. Available from: https://www.mdpi.com/2304-8158/11/2/135/htm . [CrossRef]
- Ogunniran OP, Ayeni KI, Shokunbi OS, Krska R, Ezekiel CN. A 10-year (2014-2023) review of complementary food development in sub-Saharan Africa and the impact on child health. 2024 [cited 2025 Aug 11]; Available from: . [CrossRef]
- Oniang’o R, Maingi Z, Jaika S, Konyole S. Africa’s contribution to global sustainable and healthy diets: a scoping review. Front Nutr. 2025 May 2;12:1519248. [CrossRef]
- Asebe HA, Asmare ZA, Mare KU, Kase BF, Tebeje TM, Asgedom YS, et al. The level of wasting and associated factors among children aged 6–59 months in sub-Saharan African countries: multilevel ordinal logistic regression analysis. Front Nutr. 2024 Jun 6;11:1336864. [CrossRef]
- Headey DD, Ruel MT. Economic shocks predict increases in child wasting prevalence. Nature Communications 2022 13:1 [Internet]. 2022 Apr 20 [cited 2025 Aug 11];13(1):1–9. Available from: https://www.nature.com/articles/s41467-022-29755-x . [CrossRef]
- Lawal SA, Okunlola DA, Adegboye OA, Adedeji IA. Mother’s education and nutritional status as correlates of child stunting, wasting, underweight, and overweight in Nigeria: Evidence from 2018 Demographic and Health Survey. Nutr Health [Internet]. 2024 Oct 1 [cited 2025 Sep 13];30(4):821–30. Available from: https://pubmed.ncbi.nlm.nih.gov/36591921/ . [CrossRef]
- Okutse AO, Athiany H. Socioeconomic disparities in child malnutrition: trends, determinants, and policy implications from the Kenya demographic and health survey (2014 - 2022). BMC Public Health [Internet]. 2025 Dec 1 [cited 2025 Aug 11];25(1):1–17. Available from: https://link.springer.com/articles/10.1186/s12889-024-21037-z . [CrossRef]
- Ajmal S, Ajmal L, Ajmal M, Nawaz G. Association of Malnutrition With Weaning Practices Among Infants in Pakistan. Cureus [Internet]. 2022 Nov 2 [cited 2024 Dec 24];14(11). Available from: https://pubmed.ncbi.nlm.nih.gov/36475148/ . [CrossRef]
- Pereira TA de M, Freire AKG, Gonçalves VSS. EXCLUSIVE BREASTFEEDING AND UNDERWEIGHT IN CHILDREN UNDER SIX MONTHS OLD MONITORED IN PRIMARY HEALTH CARE IN BRAZIL, 2017. Revista Paulista de Pediatria [Internet]. 2020 [cited 2025 Sep 13];39:e2019293. Available from: https://pmc.ncbi.nlm.nih.gov/articles/PMC7418335/.
- Erda R, Hamidi D, Desmawati D, Rasyid R, Sarfika R. Evaluating socio-demographic, behavioral, and maternal factors in the dual burden of malnutrition among school-aged children in Batam, Indonesia. Narra J [Internet]. 2025 Feb 21 [cited 2025 Sep 16];5(1):e2049. Available from: https://pmc.ncbi.nlm.nih.gov/articles/PMC12059860/ . [CrossRef]
- Dembedza VP, Mapara J, Chopera P, Macheka L. Relationship between cultural food taboos and maternal and child nutrition: A systematic literature review. North African Journal of Food and Nutrition Research [Internet]. 2025 Mar 13 [cited 2025 Aug 11];9(19):95–117. Available from: https://www.ajol.info/index.php/najfnr/article/view/292015 . [CrossRef]
- Lekey A, Masumo RM, Jumbe T, Ezekiel M, Daudi Z, McHome NJ, et al. Food taboos and preferences among adolescent girls, pregnant women, breastfeeding mothers, and children aged 6–23 months in Mainland Tanzania: A qualitative study. PLOS Global Public Health [Internet]. 2024 Aug 12 [cited 2025 Aug 11];4(8):e0003598. Available from: https://journals.plos.org/globalpublichealth/article?id=10.1371/journal.pgph.0003598 . [CrossRef]
- Journal TI. To Explore the Perceived Food Taboos during Pregnancy and their Relation to Maternal Nutrition and Health. Texila International Journal of Academic Research [Internet]. 2023 Jan 1 [cited 2025 Aug 11];60–74. Available from: https://www.academia.edu/106137666/To_Explore_the_Perceived_Food_Taboos_during_Pregnancy_and_their_Relation_to_Maternal_Nutrition_and_Health.
- Ajmal S, Ajmal L, Ajmal M, Nawaz G. Association of Malnutrition With Weaning Practices Among Infants in Pakistan. Cureus [Internet]. 2022 Nov 2 [cited 2025 Aug 11];14(11):e31018. Available from: https://pmc.ncbi.nlm.nih.gov/articles/PMC9717723/ . [CrossRef]
Figure 1.
Box plots Boruta algorithm for maternal nutrition knowledge (MNK). Blue boxplots represent the minimum, average, and maximum Z scores of a shadow attribute. Z scores for attributes that were rejected and confirmed are depicted by red and green boxplots, respectively.
Figure 1.
Box plots Boruta algorithm for maternal nutrition knowledge (MNK). Blue boxplots represent the minimum, average, and maximum Z scores of a shadow attribute. Z scores for attributes that were rejected and confirmed are depicted by red and green boxplots, respectively.
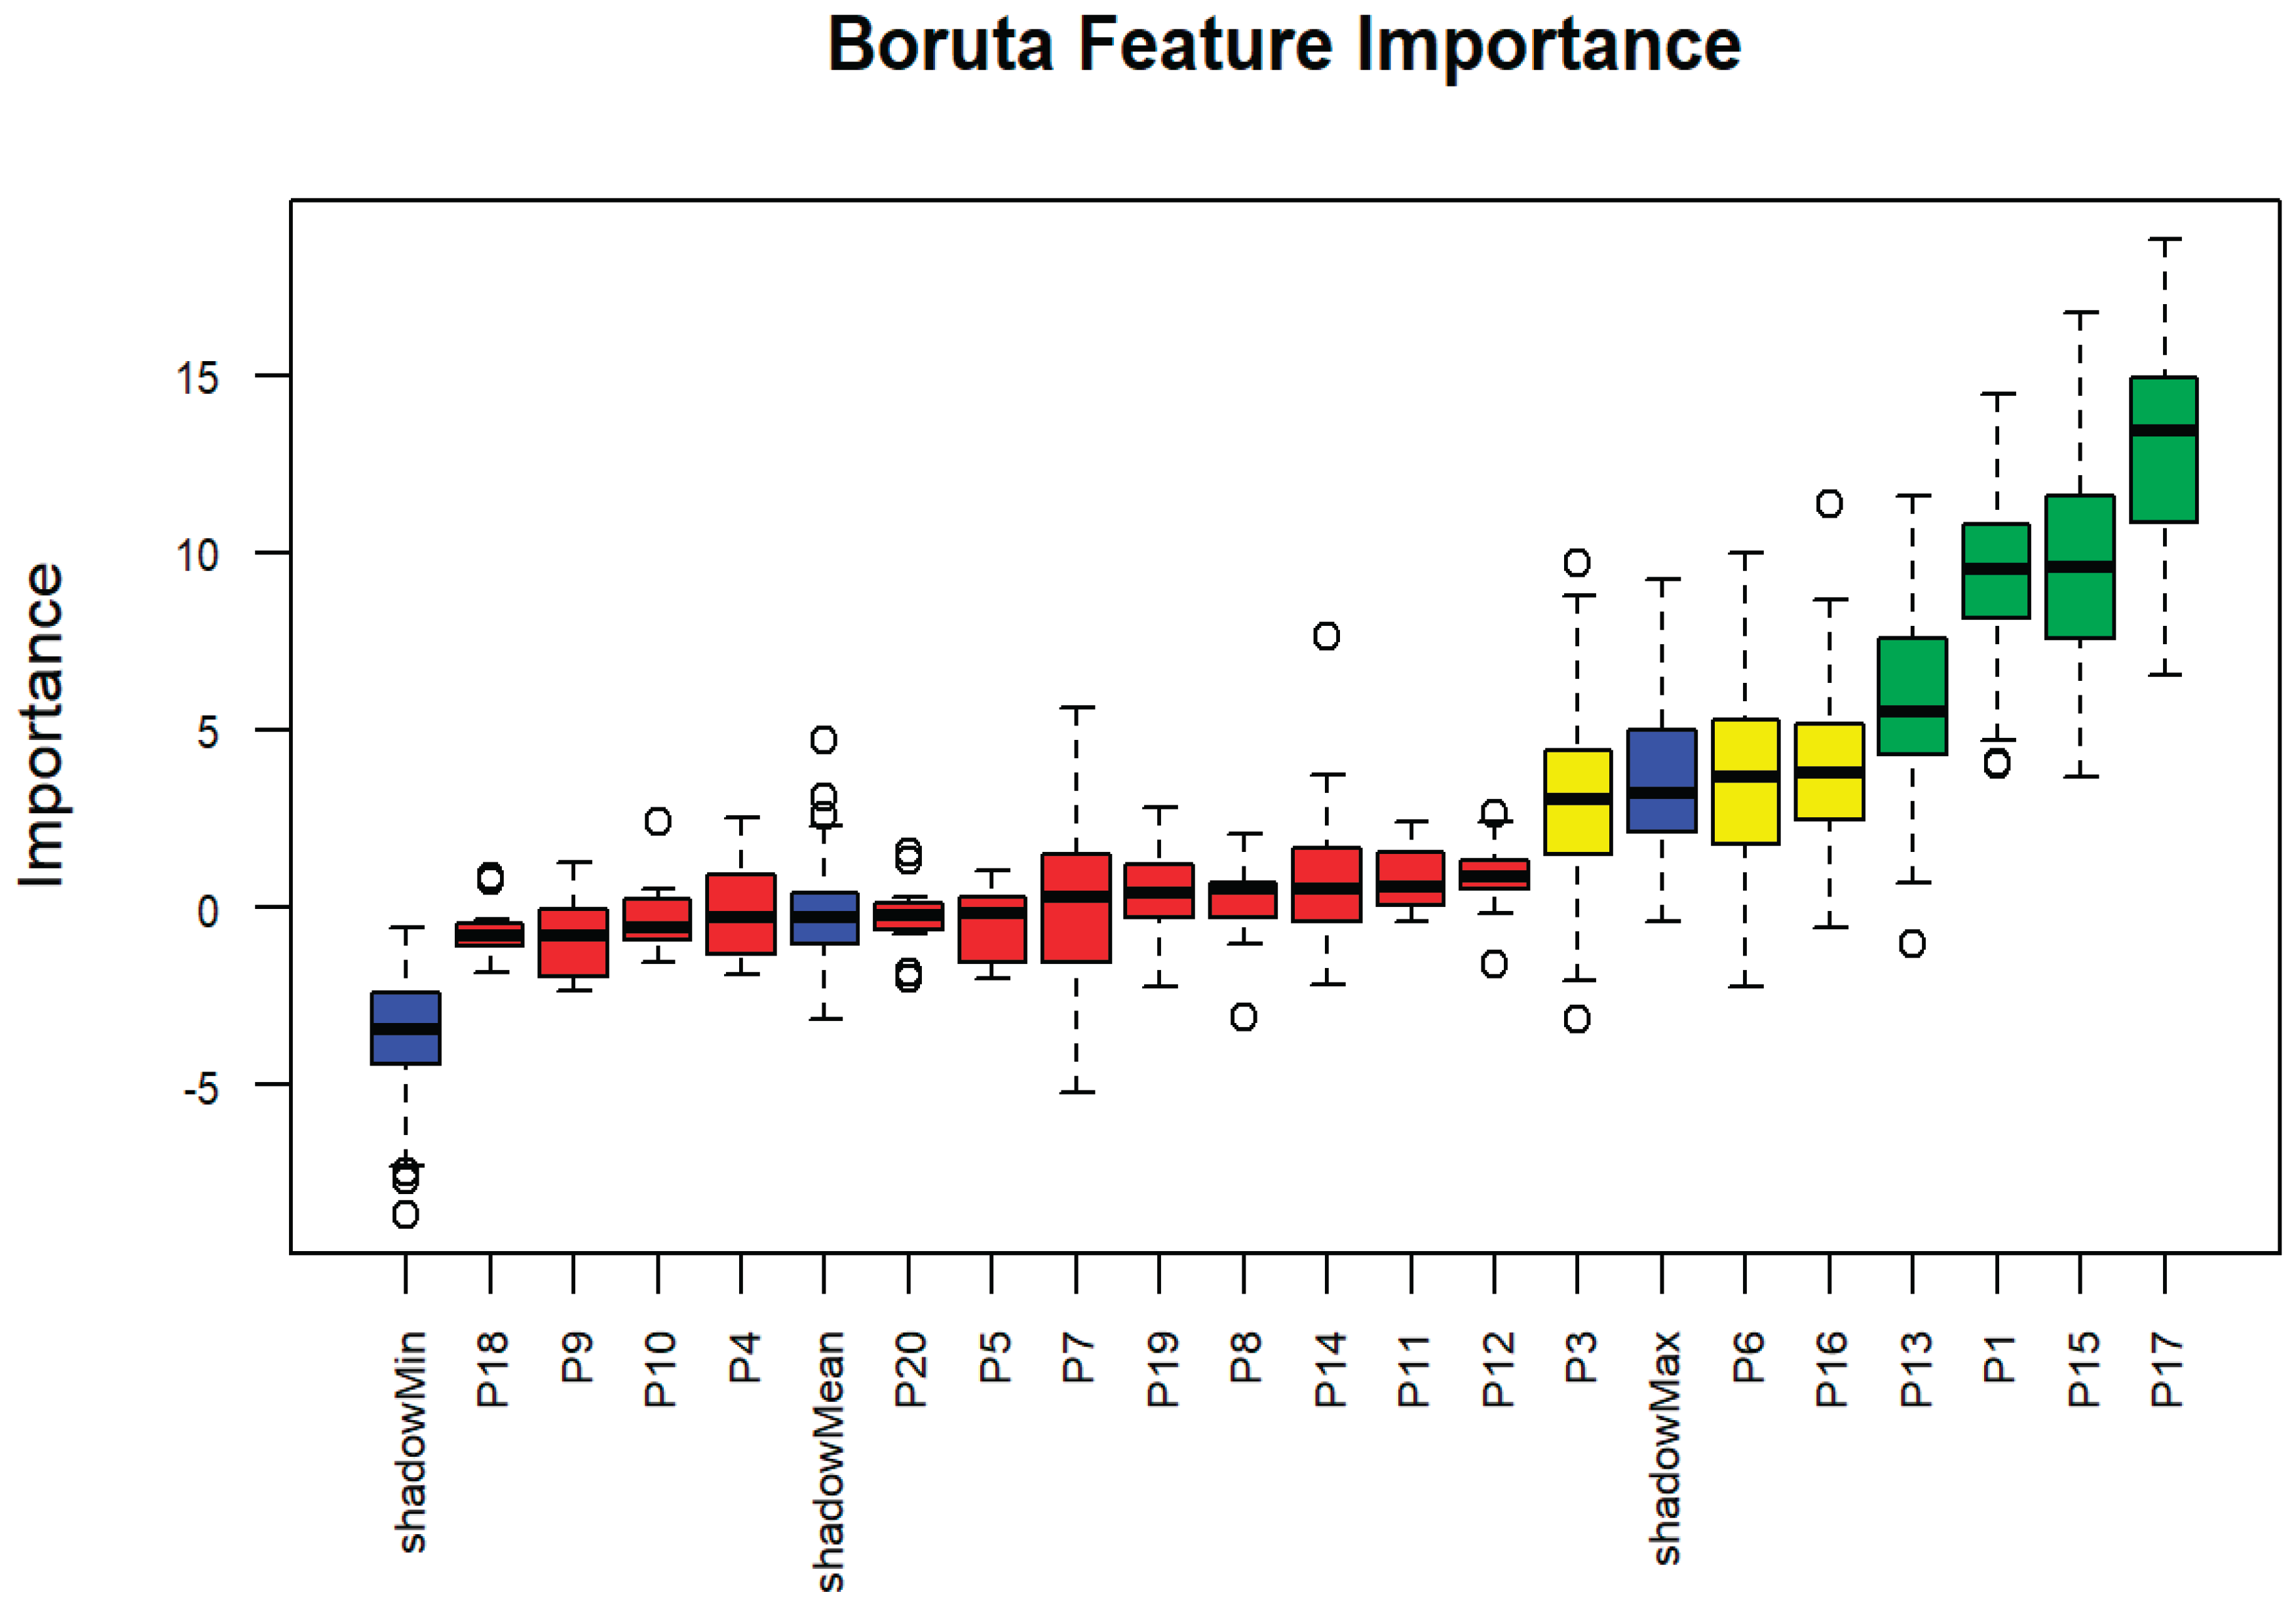
Figure 2.
Box Plots Boruta Algorithm for Stunting Status. Blue boxplots represent the minimum, average, and maximum Z scores of a shadow attribute. Z scores for attributes that were rejected and confirmed are depicted by red and green boxplots, respectively.
Figure 2.
Box Plots Boruta Algorithm for Stunting Status. Blue boxplots represent the minimum, average, and maximum Z scores of a shadow attribute. Z scores for attributes that were rejected and confirmed are depicted by red and green boxplots, respectively.
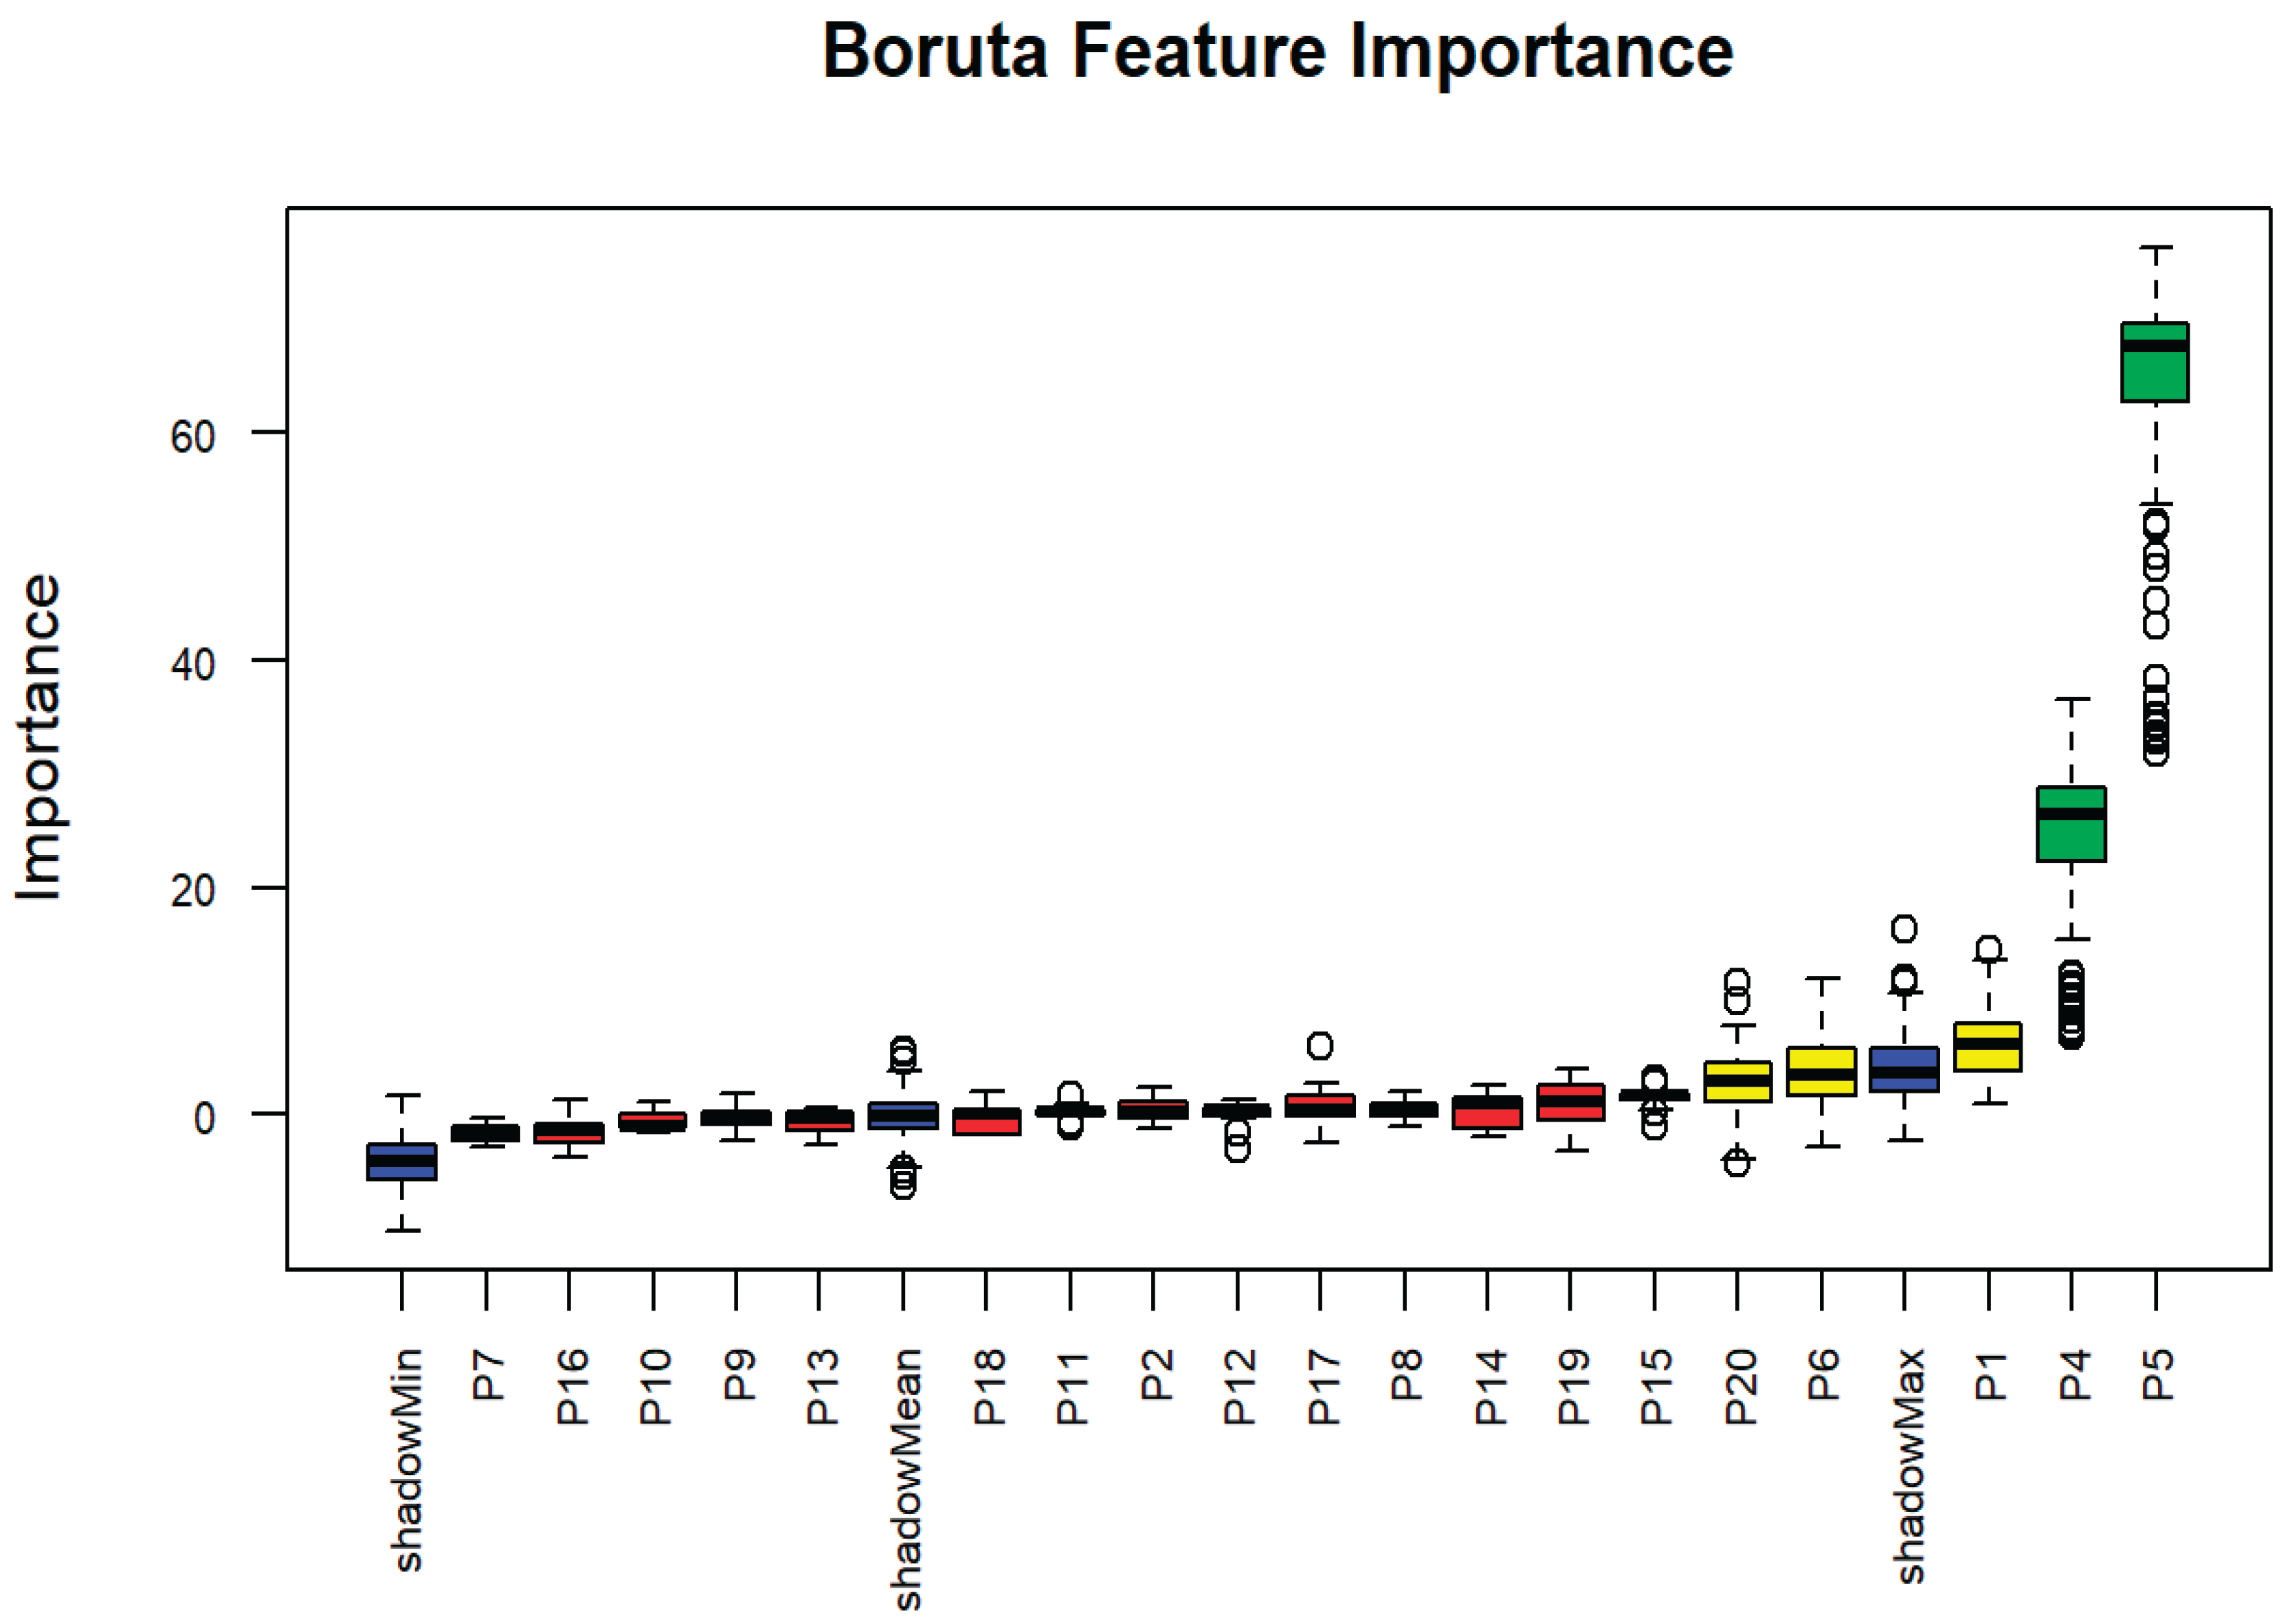
Figure 3.
Box plots Boruta algorithm for wasting status. Blue boxplots represent the minimum, average, and maximum Z scores of a shadow attribute. Z scores for attributes that were rejected and confirmed are depicted by red and green boxplots, respectively.
Figure 3.
Box plots Boruta algorithm for wasting status. Blue boxplots represent the minimum, average, and maximum Z scores of a shadow attribute. Z scores for attributes that were rejected and confirmed are depicted by red and green boxplots, respectively.
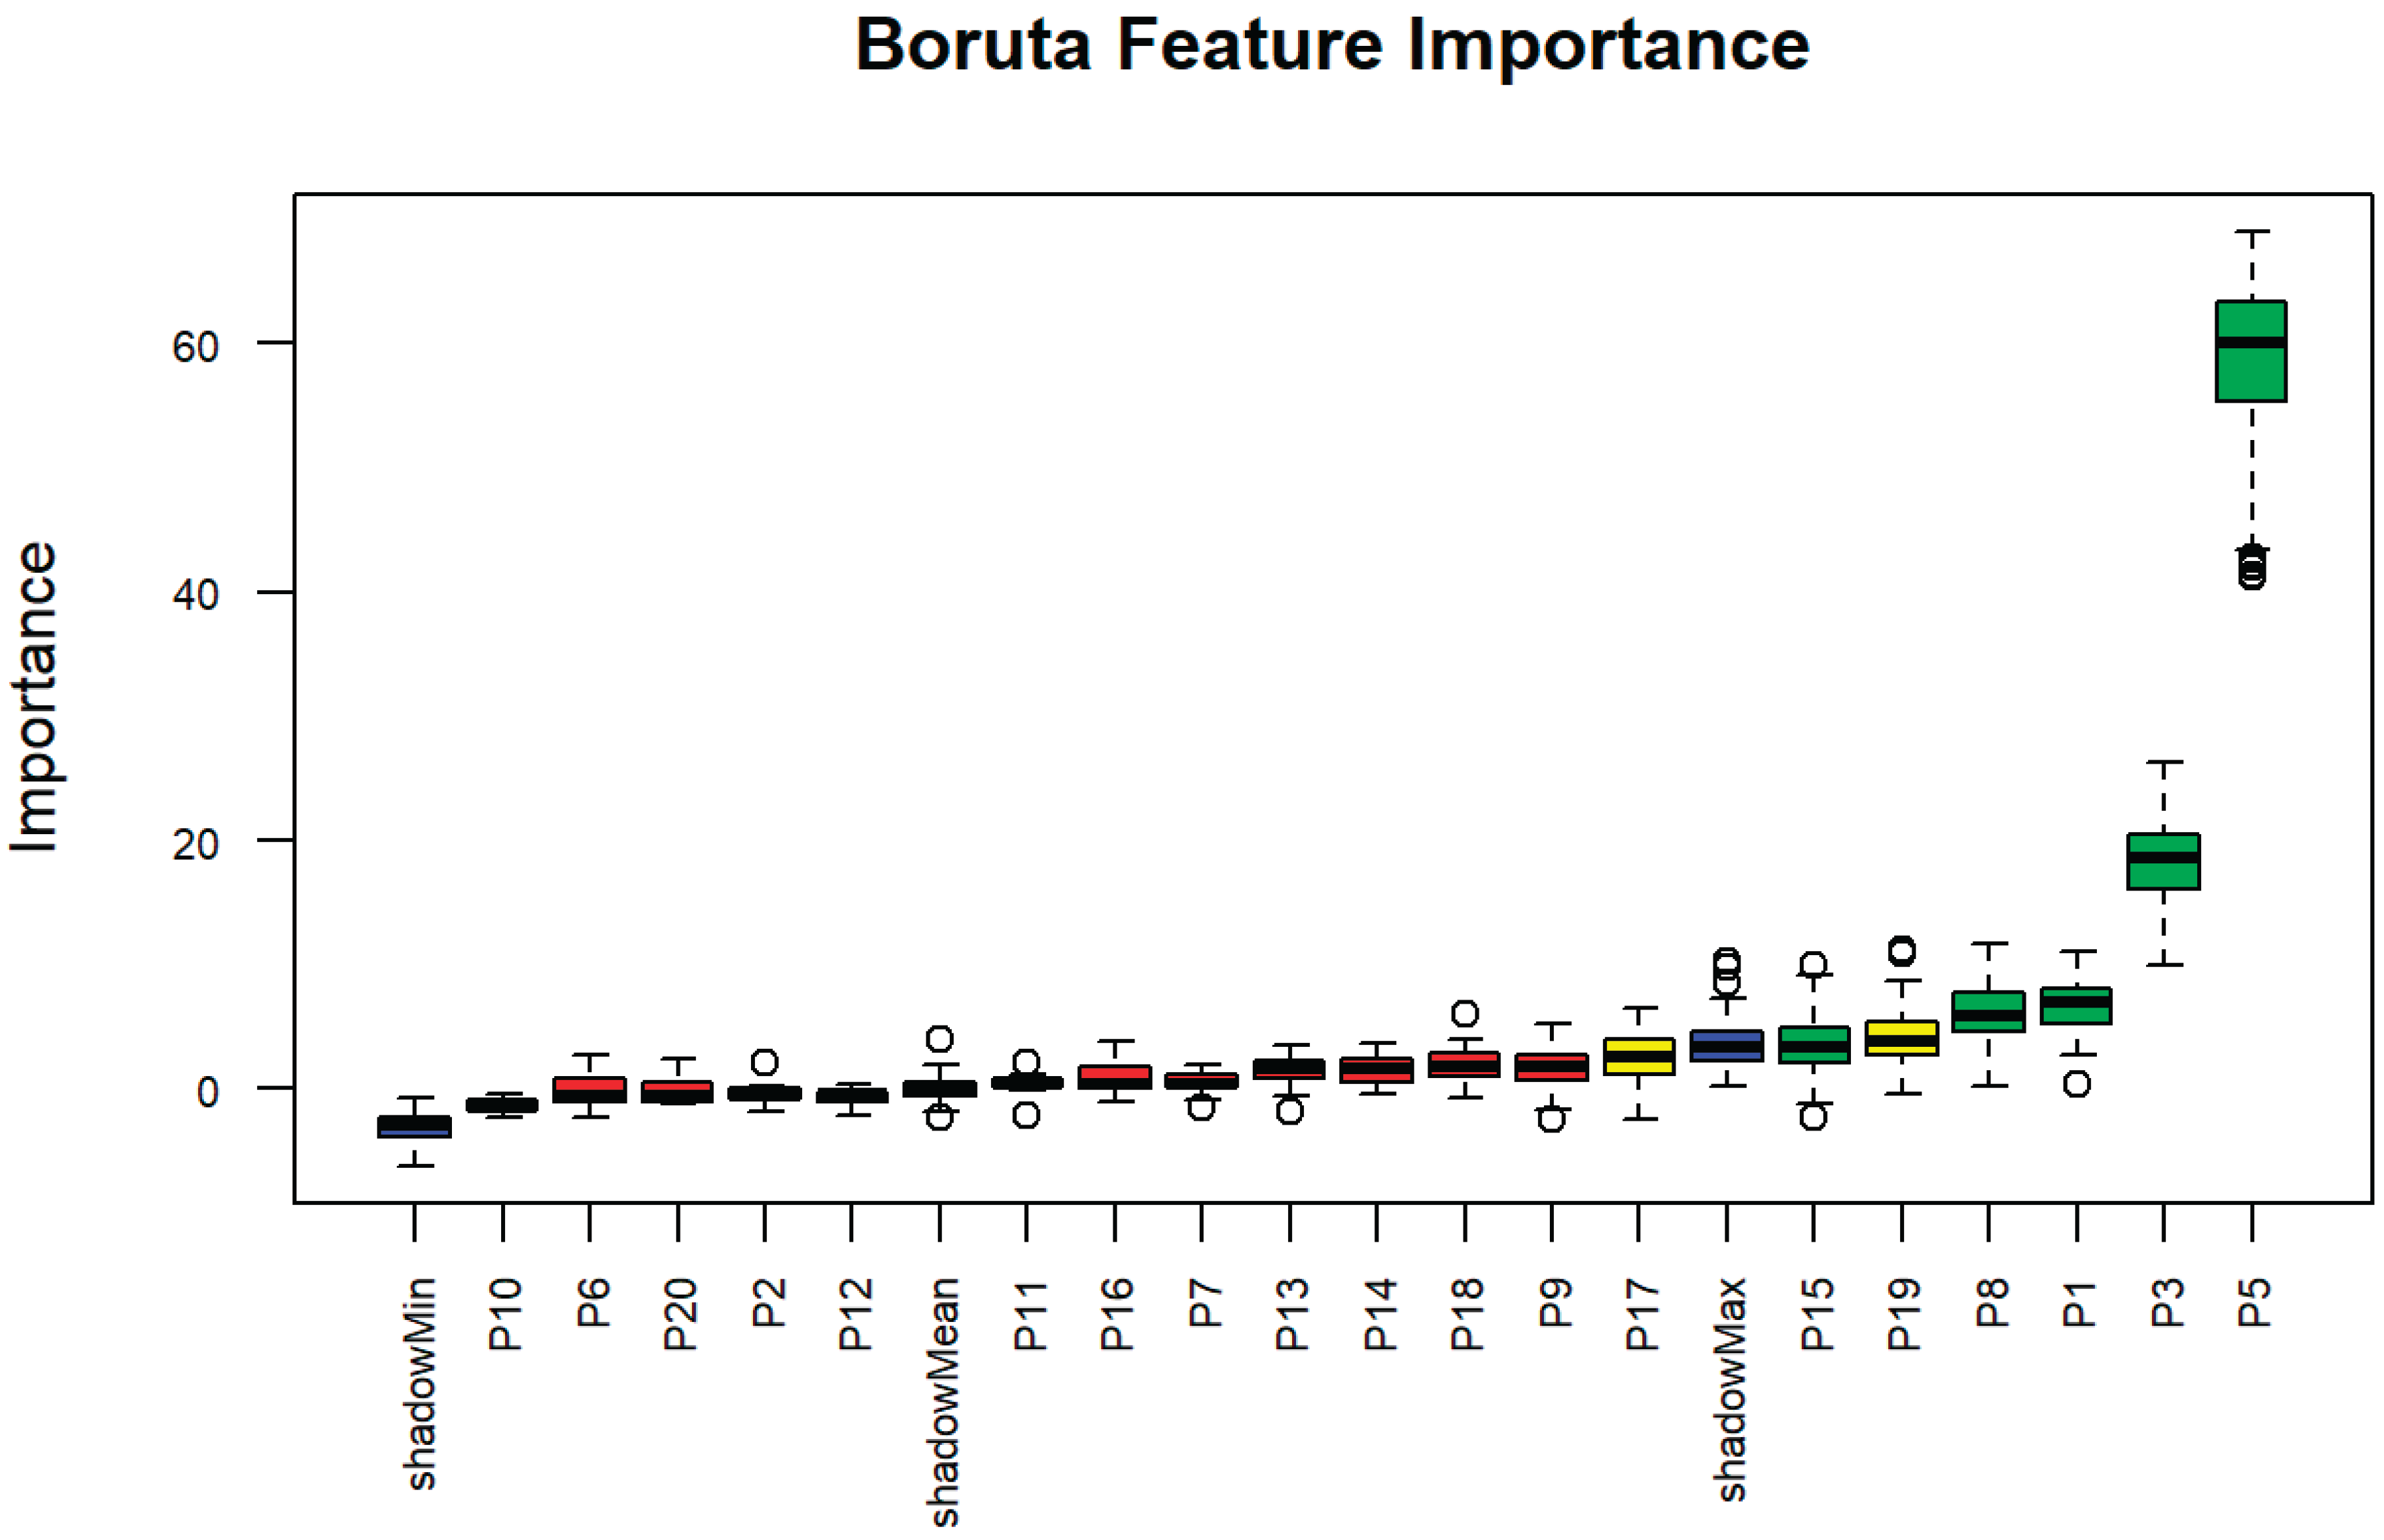
Figure 4.
Box plots Boruta algorithm for underweight status. Blue boxplots represent the minimum, average, and maximum Z scores of a shadow attribute. Z scores for attributes that were rejected and confirmed are depicted by red and green boxplots, respectively.
Figure 4.
Box plots Boruta algorithm for underweight status. Blue boxplots represent the minimum, average, and maximum Z scores of a shadow attribute. Z scores for attributes that were rejected and confirmed are depicted by red and green boxplots, respectively.
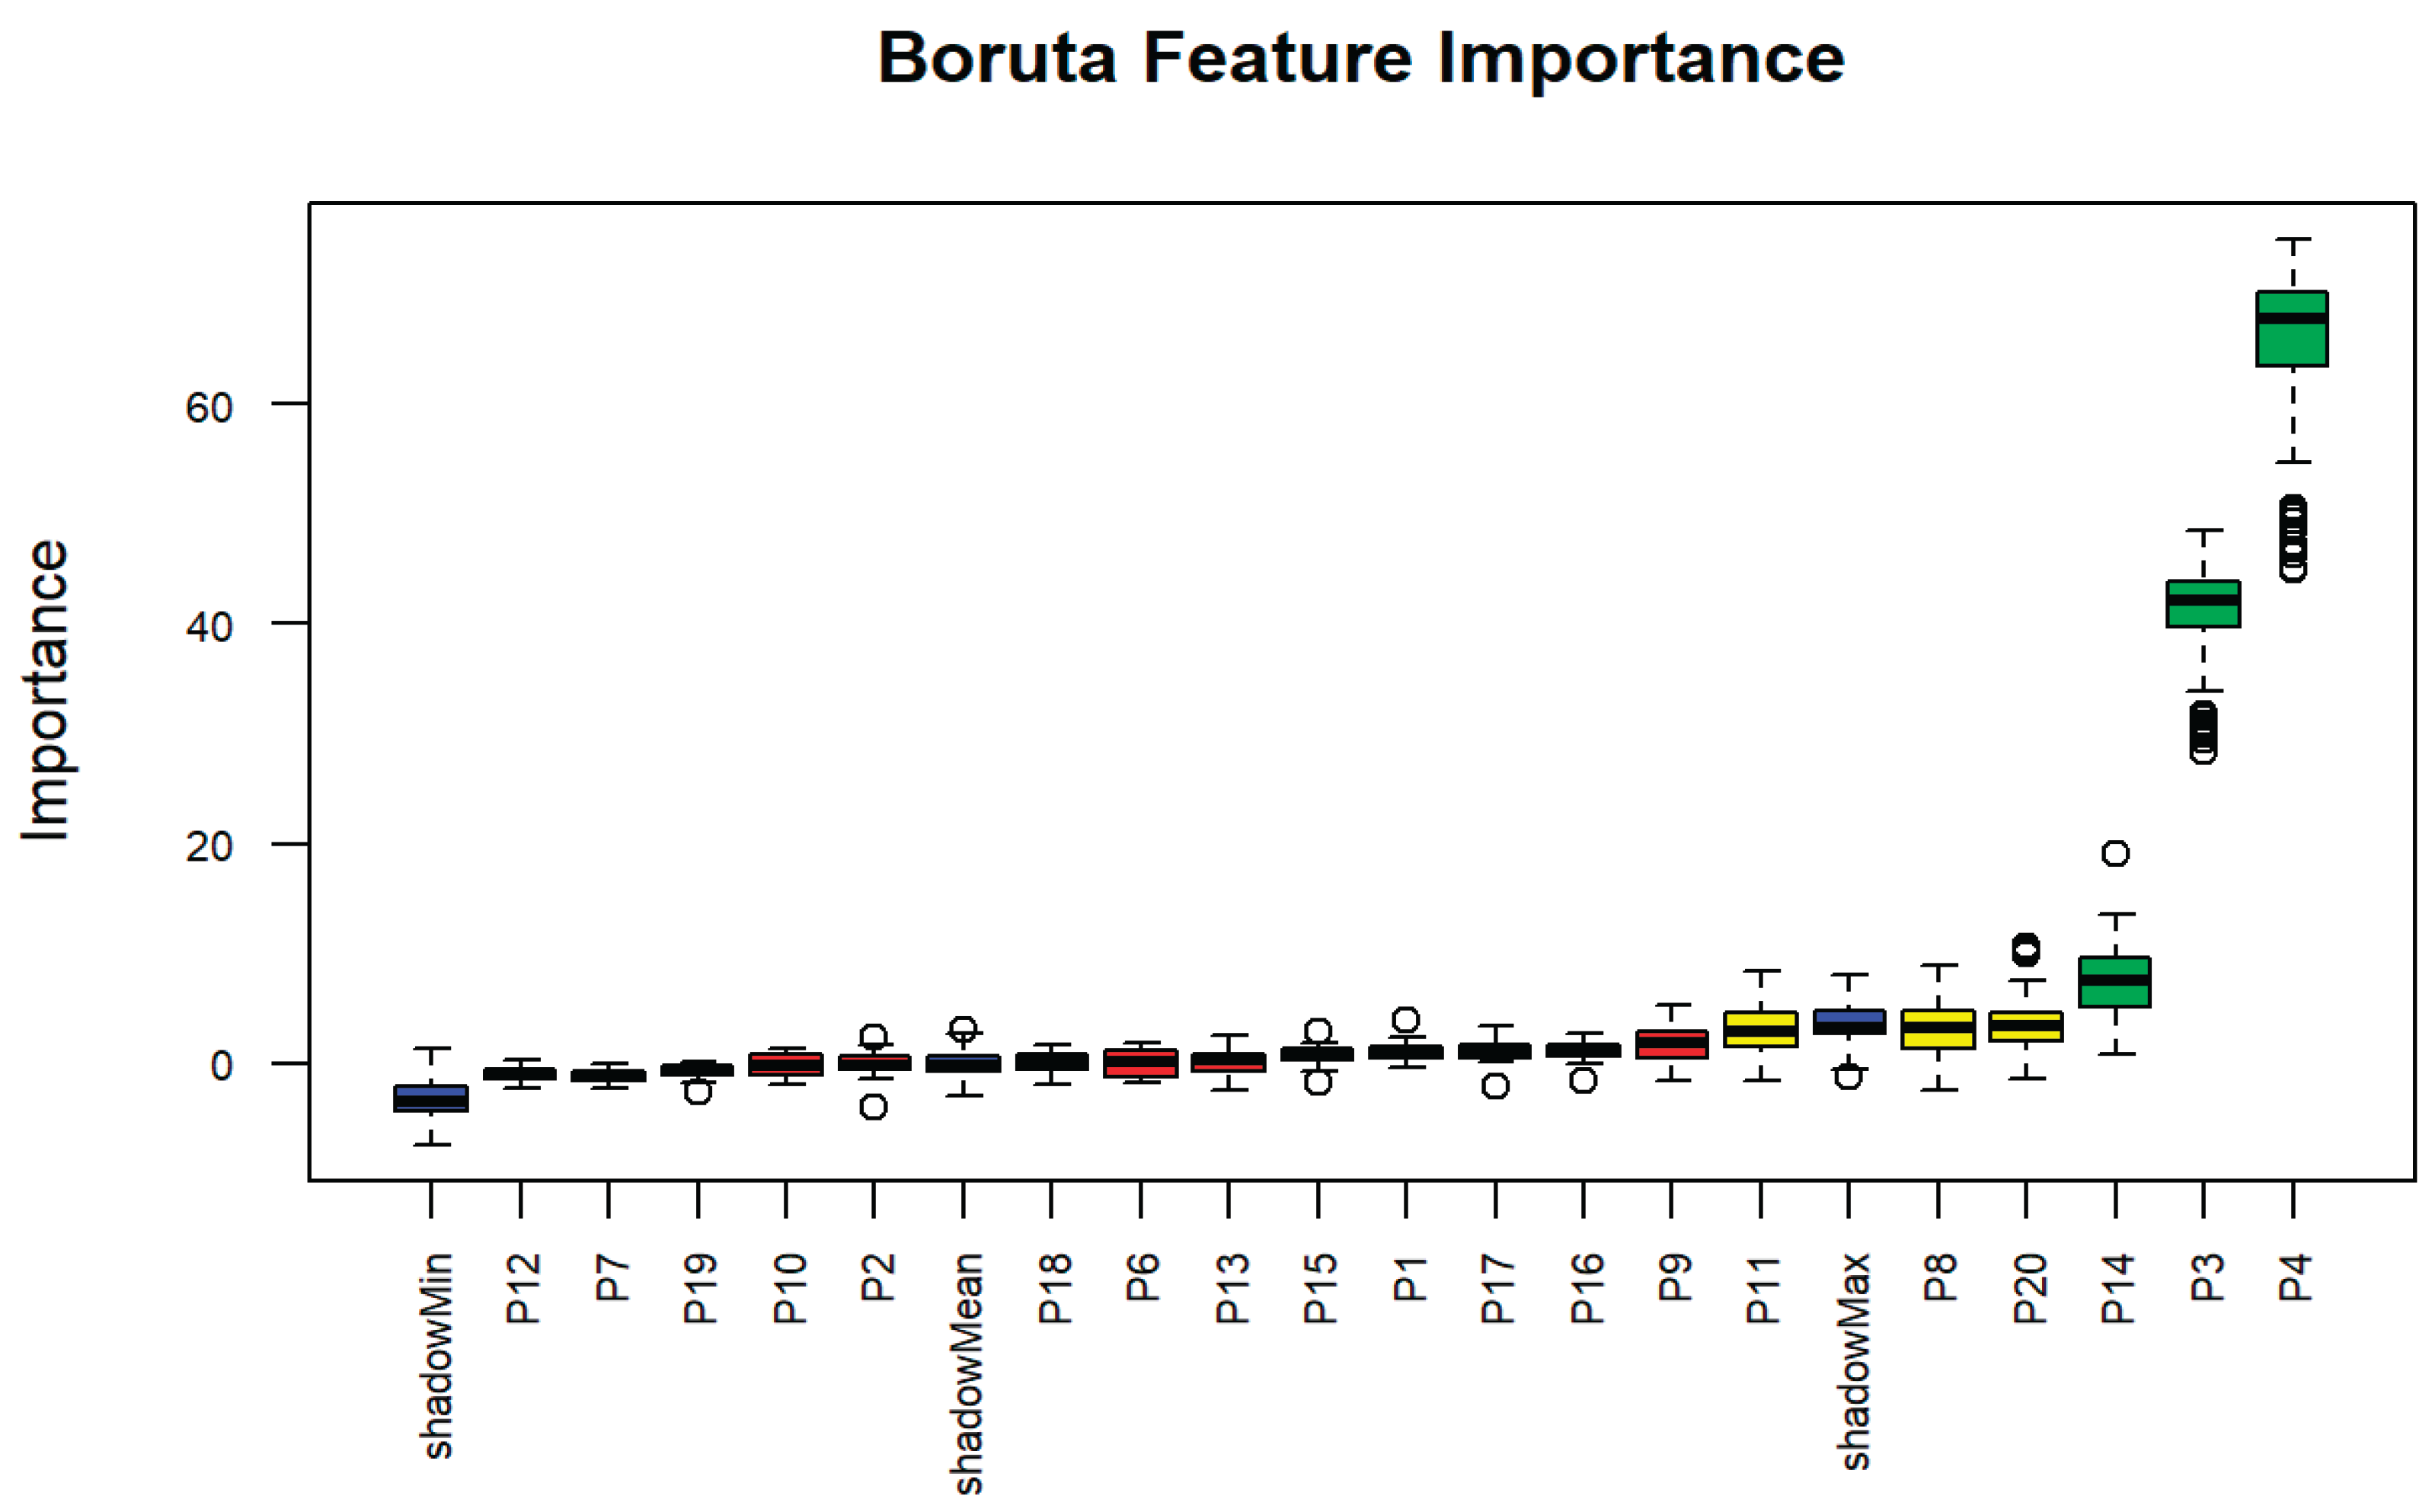

Table 1.
Characteristics of the study participants.
| Variables | Frequency |
Percentage (%) |
| Socioeconomic status: | ||
| Low | 36 | 5.5 |
| Middle | 588 | 89.5 |
| High | 33 | 5.0 |
| Maternal nutrition knowledge (MNK): | ||
| Low | 180 | 27.4 |
| Moderate | 473 | 72.0 |
| High | 4 | 6.0 |
| Mother’s age: | ||
| < 20 years | 1 | 2.0 |
| 20 to 29 years | 100 | 15.2 |
| 30 to 39 years | 336 | 51.1 |
| ≥ 40 years | 220 | 33.5 |
| Family size: | ||
| ≤3 members | 114 | 17.4 |
| 4 - 6 members | 449 | 68.3 |
| >6 members | 94 | 14.3 |
| Under-five sibling: | ||
| ≤2 children | 621 | 94.5 |
| ≥3 children | 36 | 5.5 |
| Child gender: | ||
| Boy | 326 | 49.6 |
| Girl | 331 | 50.4 |
| Child health insurance: | ||
| Yes | 353 | 53.7 |
| No | 304 | 46.3 |
| Stunting: | ||
| Yes | 166 | 25.3 |
| No | 491 | 74.7 |
| Wasting: | ||
| Yes | 106 | 16.1 |
| No | 551 | 83.9 |
| Underweight: | ||
| Yes | 148 | 22.5 |
| No | 509 | 77.5 |
| Ever breastfeeding: | ||
| Yes | 604 | 91.9 |
| No | 53 | 8.1 |
| Exclusive breastfeeding: | ||
| Yes | 245 | 37.3 |
| No | 412 | 62.7 |
| Initiation breastfeeding: | ||
| Within 1 hour | 214 | 32.6 |
| After 1 hour or more | 443 | 67.4 |
| Weaning practices: | ||
| Less than 6 months | 124 | 18.9 |
| Between 6 months - 24 months | 330 | 50.2 |
| 24 months or more | 203 | 30.9 |
| Mother education: | ||
| No education | 4 | 0.6 |
| Primary school | 179 | 27.2 |
| High school | 376 | 57.2 |
| Higher degree and above | 98 | 14.9 |
| Mother employment status: | ||
| Employed | 278 | 42.3 |
| Unemployed | 379 | 57.7 |
| Family income: | ||
| ≤ Rp 2.300.000 per month | 259 | 39.4 |
| Rp 2.300.001 - Rp 4.500.000 per month | 291 | 44.3 |
| Rp 4.500.001 - Rp 5.700.000 per month | 61 | 9.3 |
| Rp 5.700.001 - Rp 7.000.000 per month | 26 | 4.0 |
| Rp 7.000.001 - Rp 10.000.000 per month | 13 | 2.0 |
| > Rp 10.000.001 per month | 7 | 1.1 |
| Car ownership: | ||
| Yes | 83 | 12.6 |
| No | 574 | 87.4 |
| House ownership: | ||
| Yes | 213 | 32.4 |
| No | 444 | 67.6 |
| Perceived quality of life: | ||
| Rather better off | 202 | 30.7 |
| Average | 436 | 66.4 |
| Rather worse off | 19 | 2.9 |
Table 2.
Determinants importance scores from Boruta algorithm for maternal nutrition knowledge (MNK).
Table 2.
Determinants importance scores from Boruta algorithm for maternal nutrition knowledge (MNK).
| Code Variables |
Mean imp. |
Median imp. |
Min imp. |
Max imp. |
Norm hits | Decision |
| P1. SES | 9.398 | 9.543 | 4.025 | 14.438 | 0.980 | Confirmed |
| P3. Stunting | 3.003 | 3.024 | -3.153 | 9.706 | 0.374 | Tentative |
| P4. Wasting | -0.135 | -0.301 | -1.896 | 2.507 | 0.000 | Rejected |
| P5. Underweight | -0.505 | -0.182 | -2.009 | 1.029 | 0.000 | Rejected |
| P6. Child gender | 3.812 | 3.649 | -2.207 | 9.991 | 0.475 | Tentative |
| P7. Health assurance | 0.202 | 0.276 | -5.197 | 5.626 | 0.051 | Rejected |
| P8. Mother’s age | 0.064 | 0.518 | -3.104 | 2.075 | 0.000 | Rejected |
| P9. Family size | -0.901 | -0.789 | -2.344 | 1.277 | 0.000 | Rejected |
| P10. Under-five sibling | -0.243 | -0.551 | -1.527 | 2.406 | 0.000 | Rejected |
| P11.Exclusive BF | 0.837 | 0.589 | -0.403 | 2.412 | 0.000 | Rejected |
| P12.Ever BF | 0.887 | 0.890 | -1.600 | 2.638 | 0.000 | Rejected |
| P13. Initiation BF | 5.892 | 5.516 | -1.014 | 11.589 | 0.727 | Confirmed |
| P14.Weaning practices | 0.938 | 0.550 | -2.183 | 7.634 | 0.020 | Rejected |
| P15.Mother education | 9.521 | 9.556 | 3.691 | 16.766 | 0.980 | Confirmed |
| P16.Mother employment | 3.806 | 3.795 | -0.569 | 11.37 | 0.556 | Tentative |
| P17.Family income | 13.013 | 13.43 | 6.525 | 18.811 | 1.000 | Confirmed |
| P18.Car Ownership | -0.636 | -0.815 | -1.824 | 0.857 | 0.000 | Rejected |
| P19.House Ownership | 0.313 | 0.421 | -2.235 | 2.812 | 0.000 | Rejected |
| P20.Perceived quality of life | -0.225 | -0.202 | -2.006 | 1.542 | 0.000 | Rejected |
Table 3.
Determinants importance scores from Boruta algorithm for stunting status.
| Code Variables |
Mean imp. |
Median imp. |
Min. imp |
Max. imp |
Norm hits |
Decision |
| P1. SES | 6.075 | 6.164 | 0.851 | 14.483 | 0.657 | Tentative |
| P2. MNK | 0.301 | 0.181 | -1.263 | 2.455 | 0.000 | Rejected |
| P4. Wasting | 24.503 | 26.458 | 6.830 | 36.536 | 1.000 | Confirmed |
| P5. Underweight | 62.803 | 67.701 | 31.805 | 76.340 | 1.000 | Confirmed |
| P6. Child gender | 3.912 | 3.412 | -2.931 | 12.018 | 0.465 | Tentative |
| P7. Health assurance | -1.720 | -1.764 | -2.786 | -0.243 | 0.000 | Rejected |
| P8. Mother’s age | 0.388 | 0.618 | -1.079 | 1.977 | 0.000 | Rejected |
| P9. Family size | -0.382 | -0.413 | -2.300 | 1.840 | 0.000 | Rejected |
| P10. Under-five sibling | -0.475 | -1.004 | -1.650 | 1.117 | 0.000 | Rejected |
| P11.Exclusive BF | 0.198 | 0.179 | -1.073 | 1.593 | 0.000 | Rejected |
| P12.Ever BF | -0.052 | 0.467 | -3.014 | 1.290 | 0.000 | Rejected |
| P13. Initiation BF | -0.645 | -0.272 | -2.602 | 0.507 | 0.000 | Rejected |
| P14.Weaning practices | 0.387 | 0.918 | -1.929 | 2.606 | 0.010 | Rejected |
| P15.Mother education | 1.549 | 1.685 | -1.023 | 3.082 | 0.010 | Rejected |
| P16.Mother employment | -1.570 | -1.425 | -3.790 | 1.211 | 0.000 | Rejected |
| P17.Family income | 0.708 | 0.473 | -2.582 | 6.074 | 0.020 | Rejected |
| P18.Car Ownership | -0.356 | -0.050 | -1.767 | 2.084 | 0.000 | Rejected |
| P19.House Ownership | 0.820 | 1.075 | -3.153 | 4.024 | 0.030 | Rejected |
| P20.Perceived quality of life | 2.819 | 2.993 | -4.321 | 11.632 | 0.374 | Tentative |
Table 4.
Determinants importance scores from Boruta algorithm for wasting status.
|
Code Variables |
Mean imp. |
Median imp. |
Min. imp |
Max. imp. |
Norm hits |
Decision |
| P1. SES | 6.697 | 6.900 | 0.396 | 10.973 | 0.919 | Confirmed |
| P3. MNK | -0.335 | -0.504 | -1.859 | 2.062 | 0.000 | Rejected |
| P3. Stunting | 18.184 | 18.585 | 9.927 | 26.268 | 1.000 | Confirmed |
| P5. Underweight | 57.893 | 59.973 | 41.257 | 68.979 | 1.000 | Confirmed |
| P6. Child gender | -0.149 | -0.605 | -2.343 | 2.689 | 0.000 | Rejected |
| P7. Health assurance | 0.476 | 0.419 | -1.494 | 2.018 | 0.000 | Rejected |
| P8. Mother’s age | 6.144 | 5.829 | 0.292 | 11.605 | 0.889 | Confirmed |
| P9. Family size | 1.704 | 1.821 | -2.435 | 5.220 | 0.131 | Rejected |
| P10. Under-five sibling | -1.388 | -1.436 | -2.333 | -0.468 | 0.000 | Rejected |
| P11.Exclusive BF | 0.374 | 0.313 | -2.203 | 2.160 | 0.000 | Rejected |
| P12.Ever BF | -0.722 | -0.460 | -2.129 | 0.352 | 0.000 | Rejected |
| P13. Initiation BF | 1.491 | 1.604 | -1.751 | 3.483 | 0.030 | Rejected |
| P14.Weaning practices | 1.546 | 1.626 | -0.469 | 3.599 | 0.040 | Rejected |
| P15.Mother education | 3.604 | 3.399 | -2.304 | 9.878 | 0.545 | Confirmed |
| P16. Mother employment | 0.775 | 0.370 | -1.026 | 3.781 | 0.020 | Rejected |
| P17.Family income | 2.509 | 2.552 | -2.512 | 6.517 | 0.465 | Tentative |
| P18.Car Ownership | 1.872 | 1.729 | -0.770 | 5.997 | 0.081 | Rejected |
| P19.House Ownership | 4.088 | 3.901 | -0.468 | 11.262 | 0.566 | Tentative |
| P20.Perceived quality of life | -0.125 | -0.535 | -1.265 | 2.428 | 0.000 | Rejected |
Table 5.
Determinants importance scores from Boruta algorithm for underweight status.
|
Code Variables |
Mean imp. |
Median imp. |
Min. imp |
Max. imp |
Norm hits |
Decision |
| P1. SES | 1.184 | 1.103 | -0.395 | 3.958 | 0.020 | Rejected |
| P2. MNK | 0.024 | -0.150 | -3.965 | 2.393 | 0.010 | Rejected |
| P3. Stunting | 40.846 | 42.037 | 28.338 | 48.492 | 1.000 | Confirmed |
| P4. Wasting | 65.480 | 67.689 | 44.840 | 74.953 | 1.000 | Confirmed |
| P6. Child gender | 0.033 | 0.158 | -1.773 | 1.959 | 0.000 | Rejected |
| P7. Health assurance | -1.061 | -0.986 | -2.302 | 0.035 | 0.000 | Rejected |
| P8. Mother’s age | 3.003 | 3.227 | -2.405 | 9.000 | 0.444 | Tentative |
| P9. Family size | 1.713 | 1.838 | -1.642 | 5.277 | 0.131 | Rejected |
| P10. Under-five sibling | -0.146 | -0.225 | -1.900 | 1.331 | 0.000 | Rejected |
| P11.Exclusive BF | 3.086 | 2.995 | -1.604 | 8.378 | 0.465 | Tentative |
| P12.Ever BF | -0.969 | -1.004 | -2.206 | 0.412 | 0.000 | Rejected |
| P13. Initiation BF | 0.165 | 0.403 | -2.381 | 2.601 | 0.010 | Rejected |
| P14.Weaning practices | 7.546 | 7.621 | 0.878 | 19.141 | 0.869 | Confirmed |
| P15.Mother education | 0.785 | 0.952 | -1.683 | 2.981 | 0.010 | Rejected |
| P16.Mother employment | 1.233 | 1.422 | -1.576 | 2.680 | 0.010 | Rejected |
| P17.Family income | 1.032 | 1.137 | -2.124 | 3.358 | 0.010 | Rejected |
| P18.Car Ownership | 0.085 | 0.109 | -1.864 | 1.676 | 0.000 | Rejected |
| P19.House Ownership | -0.783 | -0.622 | -2.573 | 0.187 | 0.000 | Rejected |
| P20.Perceived quality of life | 3.578 | 3.490 | -1.337 | 10.594 | 0.465 | Tentative |
Disclaimer/Publisher’s Note: The statements, opinions and data contained in all publications are solely those of the individual author(s) and contributor(s) and not of MDPI and/or the editor(s). MDPI and/or the editor(s) disclaim responsibility for any injury to people or property resulting from any ideas, methods, instructions or products referred to in the content. |
© 2025 by the authors. Licensee MDPI, Basel, Switzerland. This article is an open access article distributed under the terms and conditions of the Creative Commons Attribution (CC BY) license (http://creativecommons.org/licenses/by/4.0/).
Copyright: This open access article is published under a Creative Commons CC BY 4.0 license, which permit the free download, distribution, and reuse, provided that the author and preprint are cited in any reuse.


