Submitted:
03 September 2025
Posted:
03 September 2025
You are already at the latest version
Abstract
Background/Objectives: The Chinese dwarf cherry (Cerasus humilis) is an endemic shrub fruit tree species in China. Its fruit are flavorful, nutrient-rich, and have considerable research and utilization potential. However, most currently-cultivated varieties of Cerasus humilis are highly acidic and primarily used for processing. Consumer-preferred, low-acid, fresh-eating varieties are scarce, limiting industrial development. We used 208 F₁ individuals derived from a cross between high-acid “Nongda 4” and the low-acid “DS-1.” Methods: Restriction site-associated DNA-sequencing (RAD-seq) was used to develop single nucleotide polymorphism (SNP) markers and construct a high-density genetic linkage map. Using two years of fruit titratable acidity phenotypic data, quantitative trait locus (QTL) mapping and candidate gene screening were performed. Results: The genetic map contained 2491 SNP markers, assigned to eight linkage groups. The total genetic distance was 672.71 cM, with an average distance of 0.27 cM between markers, indicating high map quality. QTL mapping identified 18 loci associated with fruit titratable acidity, including 11 major-effect QTLs (logarithm of odds, LOD ≥3.5). These major-effect QTLs were concentrated on linkage groups LG2 and LG5, with an explained phenotypic variation of 8.6–31.13%. Two candidate genes were identified within QTL intervals: phosphoester phosphatase and MATE transmembrane transporter. The phosphatase gene’s expression showed a strong correlation with titratable acid content (P < 0.01, correlation coefficient 0.93), suggesting that it plays an important role regulating fruit acidity in Cerasus humilis. Conclusions: This study supports marker-assisted breeding of low-acid, fresh-eating varieties, aiding commercial promotion of Cerasus humilis.
Keywords:
Cerasus humilis
; genetic map
; fruit acidity
; quantitative trait locus mapping
; candidate gene
1. Introduction
The Chinese dwarf cherry (Cerasus humilis) is a rare and endemic fruit tree resource in China. It has recently gained attention due to its unique biological characteristics and economic value [1,2,3]. The fruit of C. humilis is rich in vitamins, amino acids, carbohydrates, organic acids, and other substances [4]. Cerasus humilis ranks among fruits with the highest calcium content, earning the title, "the star of calcium supplementation" [5]. It has high stress resistance (cold- and drought-resistant, barren-tolerant) and is valuable for ecological restoration (soil and water conservation) and fruit product development [6,7]. With the development of characteristic ecological agriculture, its cultivation area has gradually expanded. However, current cultivated varieties are highly acidic and primarily used for processing. Consumer-preferred, low-acid, fresh-eating varieties are scarce, impeding commercialization of C. humilis. Therefore, elucidating the genetic regulatory mechanism of fruit acidity and directionally improving fruit quality via molecular means are crucial for commercial promotion of C. humilis [8].
Genetic linkage maps are fundamental tools for indicating the genetic basis of fruit tree traits and also provide crucial support for quantitative trait locus (QTL) mapping [9,10]. The construction of maps relies on efficient molecular marker technologies [11]. Single nucleotide polymorphisms (SNPs), due to their large quantity, wide coverage, and high detection efficiency, have become the mainstream choice for genetic map construction [12]. Many people have constructed genetic linkage maps using this method [13,14,15]. Restriction site-associated DNA-sequencing (RAD-seq) is based on genome-wide restriction enzyme sites, with high-throughput sequencing conducted on specific restriction fragments [16]. This method considerably reduces genome complexity and sequencing costs, and rapidly identifies high-density SNP loci. It is widely used in genetic variation detection, genetic map construction, gene mapping for important traits, and population genetic evolution analysis [17,18]. This sequencing technique proves useful in examining the genetic mechanisms underlying target traits and has been widely applied to non-model organisms, with one or more genetic maps constructed in various fruit trees species [19].
Fruit acidity is a quantitative trait with complex genetic and variation mechanisms [20,21]. QTL mapping identifies chromosomal regions linked to target traits and estimates their genetic effects using association analysis of phenotypic data and marker genotypes. This provides a basis for marker-assisted selection, thereby improving breeding efficiency [22]. Diaz-Garcia et al. mapped 16 QTLs associated with titratable acidity in five cranberry fruit traits [23]. Tang et al. identified eight QTLs related to total acidity in jujube fruit using composite interval mapping, with LODs of 3.05–4.01 and a phenotypic variation explained (PVE) of 17.70–22.60% [24]. Jiang et al. used resequencing data to map 11 QTLs associated with fruit acidity in apricot and identified 88 genes related to malic acid, 310 related to citric acid, and 40 related to total acidity within QTL intervals [25].
Advances in molecular marker technologies have promoted the formulation of genetic linkage maps and have enabled effective QTL mapping [26,27]. Currently, it has been widely in various fruit trees, including pear [28], peach [29], plum [30], and apple [31]. However, studies on the genetic map and QTL mapping of C. humilis are limited, hindering progress in molecular marker-assisted breeding of C. humilis. Cerasus humilis has fewer chromosomes (2n = 2x = 16) and a small genome (~229.21 Mbp) [32]. Constructing genetic maps for QTL mapping is essential for identifying genes related to fruit traits in C. humilis.
In the current study, 208 F₁ hybrid individuals from the Nongda 4 × DS-1 cross were used as mapping materials. RAD-seq was used to develop SNP markers to construct a genetic map. QTL mapping for fruit titratable acidity (TA) and the screening of candidate genes were conducted. This study aimed to provide theoretical and technical support for molecular marker-assisted breeding and accelerate the development of breeding high-quality C. humilis varieties.
2. Materials and Methods
2.1. Plant Materials
All experimental materials, including two parents and F₁ hybrids, were collected from the C. humilis Shixiang Experimental Field of Shanxi Agricultural University (37°26′ N, 112°32′ E). The female parent was from the high-acid Nongda4 cultivar and the male parent from the low-acid DS-1 strain. Their hybrid progenies were planted in 2019. The experimental field had uniform water and fertilizer conditions, and field management was conducted referencing conventional field production management to ensure consistent growth environments for all plants.
2.2. RAD-Sequencing and SNP Statistics
Young leaves of all samples were collected in spring and treated with liquid nitrogen. Genomic DNA extraction was performed with a DNA extraction kit (Solarbio, Beijing, China). Library construction and high-throughput sequencing were performed by Lianchuan Biological Company using the Illumina HiSeq PE150 platform (Illumina, San Diego, USA). The quality-controlled sequencing data were aligned to the C. humilis reference genome (https://doi.org/10.6084/m9.figshare.11669673) using BWA software under default parameter settings, and the number of aligned reads was counted. Subsequently, variant calling was conducted using GATK and SAMtools [33]. SNPs consistently identified using both software were retained as reliable loci. Polymorphic SNPs were selected to form the final SNP dataset for subsequent genetic map construction.
2.3. Genetic Map Construction and Quality Evaluation
The double pseudo-test-cross method was used for the construction of a genetic map [34]. To ensure genetic map quality, polymorphic SNPs were filtered and genotyped [35]. SNPs with a parental sequencing depth <5× were excluded. Selected markers whose genotypes covered at least 75% of all offspring individuals were retained, with thresholds adjusted appropriately based on marker data quantity. Markers with a chi-square test (P < 0.001) were filtered out to avoid impacting QTL mapping. As a cross-pollinated population was used, only polymorphic markers other than the aa × bb type (homozygous) were retained to match population characteristics.
SNP markers were divided into eight linkage groups based on their positions in the reference genome. JoinMap was used to determine the linear order of markers within linkage groups and calculate genetic distances between neighboring markers to produce the genetic map [36]. Genetic map quality was assessed by analyzing mapped marker linkage relationships. Visualization of these relationships were performed by generating plots using an in-house R script.
2.4. QTL Mapping and Screening of Candidate Genes
Using the constructed genetic map of C. humilis and phenotypic data collected over two consecutive years [37], QTL mapping for fruit titratable acidity in C. humilis was conducted using the interval mapping method in MAPQTL software [25]. A threshold of LOD ≥3 was established to identify the presence of a QTL. QTLs with an LOD >3.5 were considered significant. The proportion of PVE for each QTL was computed. QTL mapping intervals were matched against the physical positions of the C. humilis reference genome to obtain detailed information on genes within these regions. All genes within QTL intervals were functionally annotated using databases (NR, Swiss-Prot, COG, GO, KEGG) to screen candidate genes related to titratable acid metabolism in C. humilis fruit.
3. Results
3.1. RAD Sequencing Data Analysis
RAD-seq was conducted on two parents and 208 F₁ individuals, generating 241.86 Gb of data. The maternal parent, Nongda 4, produced 0.79 Gb of data, with a base quality Q30 ratio of 91.15% and an average GC content of 41.61%. The paternal parent, DS-1, produced 1.78 Gb of data, with a base quality Q30 ratio of 90.87% and an average GC content of 41.7%. The 208 offspring produced 239.29 Gb of data, with an average base quality Q30 ratio of 90.65% and an average GC content of 40.82%. The average Q30 value of all samples was 90.89%, indicating that sample sequencing data were of good quality with high accuracy (i.e., low error rate) (Table S1). When aligned to the reference genome of C. humilis (Table S2), the maternal parent, Nongda 4, and paternal parent, DS-1, had an average sequencing depth of 5.89×, whereas that of the hybrid offspring was 5.25×; the alignment rates with the reference genome were 95.83%, 95.03%, and 93.71%, respectively.
3.2. Genetic Map Construction
After multiple rounds of rigorous filtering and genotyping, 2,491 SNP markers were finally confirmed to be usable. These included 1,537 "lm × ll," 668 "nn × np," and 286 "hk × hk" marker types. A genetic map was constructed that included 2,491 SNP markers, with eight linkage groups (LGs) covering a total genetic distance of 672.71 cM (Table 1; Figure 1). The mean interval between markers was 0.27 cM. Linkage group lengths ranged from 54.6 cM (LG8) to 142.71 cM (LG2), with an average length of 84.09 cM per group. The number of SNP markers ranged from 153 (LG8) to 465 (LG1). LG2 was the longest linkage group, containing 142.71 SNP markers. The shortest was LG8, with 153 SNP markers. LG2 had the longest average genetic distance (0.37 cM), and LG1 had the shortest (0.17 cM). The average proportion of gaps <5 cM in each linkage group was 99.49%.
3.3. Quality Evaluation of the Genetic Map
For assessing the quality of the genetic map, recombination plots were generated for each linkage group (Figure 2). A positive correlation was found between genetic distance and linkage strength across all linkage groups. This indicates that the constructed genetic map was of high quality.
3.4. QTL Mapping and Candidate Gene Identification
QTL mapping results for titratable acidity in C. humilis fruit showed that 18 QTLs were detected in the 2021 or 2022 datasets (Table 2; Figure 3), with 11 being significant. In 2021, 13 QTLs were detected, which were mapped to linkage groups LG2 (21TA-1 to 21TA-7) and LG5 (21TA-8 to 21TA-13), with LOD thresholds of 3.25–11.28 and PVE of 10.19–31.13%. In 2022, five QTLs were identified, fewer than in 2021. These QTLs were each mapped to one of the linkage groups (LG1, LG2, LG3, LG5, and LG6), with LOD thresholds of 3.14–3.86 and PVE of 7.1–8.7%.
Based on the results of QTL mapping and database annotation, two candidate genes were identified. Both genes were located on LG2: a phosphoester phosphatase gene (MSTRG.15867) and a MATE transmembrane transporter (MSTRG.17104). Transcriptome data from Nongda 4 and DS-1 [8] were integrated to analyze the expression levels of candidate genes identified using QTL mapping in fruit of two C. humilis germplasms at different developmental stages. Simultaneously, a comparison was made with fruit titratable acid content at the corresponding stages (Figure 4).
As C. humilis fruits developed, the relative expression levels of the phosphoester phosphatase gene of both Nongda 4 and DS-1 increased and subsequently decreased, aligning with the changes in titratable acid content. Moreover, the expression level in Nongda 4 was higher than that in DS-1. According to the correlation analysis (Table 3), the relative expression level of the phosphoester phosphatase gene was strongly correlated with titratable acid content (P <0.01), with a correlation coefficient of 0.93. This indicates that the gene is closely related to the regulation of fruit acidity in C. humilis.
4. Discussion
Cerasus humilis not only has strong stress resistance but its fruit is rich in nutrients and holds considerable value in both ecological and economic aspects. However, high fruit acidity in existing cultivars limits their suitability for fresh consumption. Therefore, elucidating the genetic mechanism underlying fruit acidity and performing targeted improvements are essential for progress in commercial utilization. In this study, the experimental material consisted of an F₁ hybrid population derived from crossing the high-acid Nongda 4 with the low-acid DS-1 varieties of C. humilis. A genetic linkage map was built utilizing RAD-seq technology. Two years of phenotypic data were used for QTL mapping of fruit titratable acidity and candidate gene identification. Genetic linkage maps are fundamental tools to indicate the genetic basis of fruit tree traits, and their density and accuracy directly affect QTL mapping efficiency [38].
In the current study, a genetic map was built using 208 F₁ hybrids from a cross between Nongda 4 and DS-1, offering advantages in parental selection and population size. The marked differences in acidity and other fruit traits between parents provided abundant materials for genetic variation, leading to extensive fruit trait segregation in the F₁ generation, ensuring sufficient variation for genetic map construction. The size of the F₁ segregating population critically affects the map’s accuracy, resolution, saturation, and application. A larger segregating population is conducive to constructing a more accurate genetic map [39]. Large-scale cultivation of fruit tree populations requires a large amount of land area. Subsequent genetic linkage mapping also demands substantial investment in human resources, materials, and finances. This results in relatively small population sizes used for constructing fruit tree genetic maps. Currently, most constructed fruit tree genetic maps are based on populations of <150 individuals [23,24], which may reduce mapping precision. However, the 208 F₁ individuals used in this study produced more molecular markers, substantially improving the map’s accuracy, resolution, saturation, overall representativeness, and reliability.
Traditional molecular marker technologies have single marker types and limited numbers, resulting in large gaps in constructed genetic maps, thus compromising map quality and subsequent research [40,41]. The advent of third-generation molecular SNP markers, genotyping by sequencing, and restriction enzyme digestion sequencing technologies has led to major advances in fruit tree genetic mapping [42]. RAD-seq, a reduced-representation genome sequencing approach based on genome-wide restriction enzyme digestion sites, reduces genome complexity and sequencing costs while enabling rapid identification of high-density SNP loci [43].
In the current study, RAD-seq technology generated 241.86 Gb of data, with an average Q30 value for all samples reaching 90.89%, indicating high sequencing quality data and low error rates, ensuring accurate SNP marker development. The constructed C. humilis genetic linkage map contained 2491 SNP markers. The eight linkage groups had a total genetic distance of 672.71 cM, with an average inter-marker distance of only 0.27 cM. Moreover, the average proportion of gaps <5 cM per linkage group was 99.49%. This map provides a solid platform for subsequent QTL mapping and gene discovery. The mapping results align with successful RAD-seq application in other fruit trees, including apple [42], pear [43], and hawthorn [44].
QTL mapping is a key method for elucidating the genetic mechanisms of quantitative traits; results are affected by multiple factors, with LOD score thresholds being particularly important [45]. The current study set an LOD score of 3.0 to detect QTL effects and 3.5 to define significant QTLs. These thresholds balance mapping accuracy with minimizing false-positives and the omission of minor-effect QTLs. Interval mapping identified 18 QTLs associated with fruit titratable acidity in C. humilis, of which, 10 were major-effect QTLs concentrated in LG2 and LG5. The distribution of QTLs showed similarities to and distinctions from fruit acidity-related QTLs in other fruit trees. For example, QTLs controlling acidity traits in peach have been mapped to LG5 [46], which concurs partly with the findings of this research. This suggests that the genetic regulation of fruit acidity may involve partially-conserved genetic mechanisms across different fruit tree species. Due to differences in genetic background, genome structure, and evolutionary history in different fruit tree species, QTL mapping results for fruit acidity also demonstrates obvious variation. For example, in studies on apricot [47], pear [28], and apple [48], the distribution and number of QTLs associated with fruit titratable acidity vary. The QTLs for C. humilis fruit acidity identified in the current study showed inconsistent intervals between 2021 and 2022, potentially due to environmental sensitivity to quantitative traits: differences in climatic conditions, pest and disease incidence, and harvest periods between 2021 and 2022 may have altered fruit acidity, affecting QTL mapping results. This also highlights the necessity of conducting multi-year and -location experiments in quantitative trait research. Yao [49] also found that quantitative traits were highly complex and environmentally-influenced. Therefore, stable QTLs represent a small proportion of all identified QTLs, with few being practically useful. Despite QTL instability across years, they still provide valuable insight into genetic regulatory mechanisms underlying C. humilis fruit acidity.
Three genes were screened within the QTL mapping intervals. After database annotation, two candidate genes on LG2 were identified: a phosphoester phosphatase gene (MSTRG.15867) and a MATE transmembrane transporter (MSTRG.17104). The relative phosphoester phosphatase gene expression level aligned with the variation in titratable acid content and was strongly correlated (0.93; P <0.01). This suggests that this gene is crucial for regulating fruit acidity in C. humilis. It is purported to influence fruit acidity by participating in organic acid metabolic pathways, such as synthesis regulation, decomposition, or transport of organic acids. Phosphatases may be involved in phosphorus metabolism-related signal transduction, influencing organic acid accumulation or degradation [50]. However, the specific regulatory mechanism remains unclear and requires further comprehensive verification using techniques such as gene editing and transgenesis.
MATE transmembrane transporters may regulate fruit acidity by mediating organic acid intracellular transport and influencing their distribution among different organelles or cells [51]. The gene identified in the current study was located within the QTL interval. Although the correlation between its expression level and fruit titratable acid content has not been verified, its potential role in regulating C. humilis fruit acidity remains plausible. Further studies, including gene expression analysis and protein function verification, are needed to elucidate its specific regulatory mechanism in C. humilis fruit acidity.
However, despite its contribution, this study had several limitations. Despite the high marker density of the genetic map, some linkage groups (e.g., LG4) had relatively large gaps, which may lead to the omission of some QTLs. Candidate gene functions were only inferred based on expression correlations without in vivo and in vitro validation. Non-coding RNAs or regulatory elements within QTL intervals were not analyzed, potentially ignoring epigenetic regulatory mechanisms.
Future research can be improved in three respects: applying higher-density sequencing and fine mapping to close gaps between and refine candidate gene regions; verifying candidate gene functions using gene editing or transgenic technologies to clarify their specific roles in acidity regulation; and integrating metabolome data to analyze the associations between candidate genes and organic acid metabolites (e.g., citric and malic acid) to elucidate related metabolic pathways.
5. Conclusions
A highly saturated and precise genetic linkage map was constructed for C. humilis, forming a strong basis for genomic research in the plant. Using this map and two years of phenotypic data, 18 QTLs associated with fruit titratable acidity were identified, including 11 major-effect loci concentrated on LG2 and LG5. These findings elucidate the genetic mechanisms underlying fruit acidity. A phosphoester phosphatase gene and a MATE transmembrane transporter gene were selected as candidate genes, with the former strongly correlated to acidity variation. The study provides theoretical and technical support for marker-assisted breeding and accelerates the development of high-quality, low-acid C. humilis cultivars.
Supplementary Materials
The following supporting information can be downloaded at the website of this paper posted on Preprints.org, Table S1: Sequencing data of parents and F1 progenies; Table S2: Sequencing data and reference genome comparison.
Author Contributions
C.G. designed the project; F.H. managed genotypic data and performed the analysis; C.G. and Y.L. reviewed and revised the manuscript. Every author has read through and consented to the published version of the manuscript.
Funding
This research was supported by the High-Level Scientific and Technological Talent Program of Lüliang City (2024RC31) and the Basic Research Project of Shanxi Province (202203021212500).
Institutional Review Board Statement
Not applicable.
Informed Consent Statement
Not applicable.
Data Availability Statement
Data will be made available upon request to the corresponding author.
Acknowledgments
Special thanks to Lianchuan Biological Company for their contribution to genetic and QTL mapping.
Conflicts of Interest
The authors declare no conflicts of interest.
Abbreviations
The following abbreviations are used in this manuscript:
| RAD-seq | restriction site–associated DNA sequencing |
| SNP | single nucleotide polymorphism |
| QTL | quantitative trait locus |
| LOD | logarithm of the odds |
| PVE | phenotypic variation explained |
References
- Mo, C.; Li, W.D.; He, Y.X.; Ye, L.Q.; Zhang, Z.S.; Jin, J.S. Variability in the sugar and organic acid composition of the fruit of 57 genotypes of Chinese Dwarf Cherry [Cerasus humilis (Bge.) Sok]. J Hortic Sci Biotechnol. 2015, 90(4), 419–426. [Google Scholar] [CrossRef]
- Ren, J.; Sun, L.N.; Zhang, Q.Y.; Song, X.S. Drought tolerance is correlated with the activity of antioxidant enzymes in Cerasus humilis seedlings. Biomed Res. Int. 2016, 9851095. [Google Scholar] [CrossRef]
- Yang, R.; Yang, Y.; Hu, Y.; Yin, L.; Qu, P.; Wang, P.; Mu, X.; Zhang, S.; Xie, P.; Cheng, C.; et al. Comparison of bioactive compounds and antioxidant activities in differentially pigmented Cerasus humilis fruits. Molecules 2023, 28, 6272. [Google Scholar] [CrossRef] [PubMed]
- Ye, L.Q.; Yang, C.X.; Li, W.D.; Hao, J.B.; Sun, M.; Zhang, J.R.; Zhang, Z.S. Evaluation of volatile compounds from Chinese Dwarf Cherry (Cerasus humilis (Bge.) Sok.) germplasms by headspace solid-phase micro-extraction and gas chromatography-mass spectrometry. Food Chem. 2017, 217, 389–397. [Google Scholar] [CrossRef] [PubMed]
- Mu, X.P.; Aryal, N.; Du, J.M.; Du, J.J. Oil content and fatty acid composition of the kernels of 31 different cultivars of Chinese dwarf cherry [Cerasus humilis (Bge.) Sok]. J Hortic Sci Biotechnol. 2015, 90, 525–529. [Google Scholar] [CrossRef]
- Li, W.D.; Li, O.; Mo, C.; Jiang, Y.S.; He, Y.; Zhang, A.R.; Chen, L.M.; Jin, J.S. Mineral element composition of 27 Chinese dwarf cherry [Cerasus humilis (Bge.) Sok.] genotypes collected in China. J Hortic Sci Biotechnol. 2014, 89(6), 674–678. [Google Scholar] [CrossRef]
- Ji, X.L.; Zhang, M.Y.; Wang, D.; Li, Z.; Lang, S.Y.; Song, X.S. Genome-wide identification of WD40 superfamily in Cerasus humilis and functional characteristics of ChTTG1. Int J Biol Macromol. 2023, 225, 376–388. [Google Scholar] [CrossRef]
- Guo, C.Z.; Wang, P.F.; Zhang, J.C.; Guo, X.; Mu, X.P.; Du, J.J. Organic acid metabolism in Chinese dwarf cherry [Cerasus humilis (Bge.) Sok.] is controlled by a complex gene regulatory network. Front. Plant Sci. 2022, 13, 982112. [Google Scholar] [CrossRef]
- Mohd Shaha, F.R.; Liew, P.L.; Zaman, F.Q.; Nulit, R.; Barin, J.; Rolland, J.; Yong, H.Y.; Boon, S.H. Genotyping by sequencing for the construction of oil palm (Elaeis guineensis Jacq.) genetic linkage map and mapping of yield related quantitative trait loci. PeerJ. 2024, 12, e16570. [Google Scholar] [CrossRef]
- Wang, W.; Xu, Z.; Qian, L.; Hang, S.; Niu, Y.; Shen, C.; Wei, Y.; Liu, B. Genetic mapping and validation of QTL controlling fruit diameter in cucumber. BMC Plant Biol. 2024, 24(1), 1271. [Google Scholar] [CrossRef]
- Kumar, R.; Das, S.P.; Choudhury, B.U.; Kumar, A.; Prakash, N.R.; Verma, R.; Chakraborti, M.; Devi, A.G.; Bhattacharjee, B.; Das, R.; et al. Advances in genomic tools for plant breeding: Harnessing DNA molecular markers, genomic selection, and genome editing. Biol Res. 2024, 57(1), 80. [Google Scholar] [CrossRef]
- Davey, J.W.; Hohenlohe, P.A.; Etter, P.D.; Boone, J.Q.; Catchen, J.M.; Blaxter, M.L. Genome-wide genetic marker discovery and genotyping using next-generation sequencing. Nat. Rev. Genet. 2011, 12(7), 499–510. [Google Scholar] [CrossRef]
- Antanaviciute, L.; Fernández-Fernández, F.; Jansen, J.; Banchi, E.; Evans, K.M.; Viola, R.; Velasco, R.; Dunwell, J.M.; Troggio, M.; Sargent, D.J. Development of a dense SNP-based linkage map of an apple rootstock progeny using the Malus Infinium whole genome genotyping array. BMC Genomics. 2012, 13, 203. [Google Scholar] [CrossRef] [PubMed]
- Su, K. , Guo, Y. S., Zhong, W. H., Lin, H., Liu, Z. D., Li, K., Li, Y. Y., & Guo, X. W. High-density genetic linkage map construction and white rot resistance quantitative trait loci mapping for genus Vitis based on restriction site-associated DNA sequencing. Phytopathology. 2021, 111(4), 659–670. [Google Scholar] [CrossRef] [PubMed]
- Xie, Y.H.; Feng, Y.; Chen, Q.; Zhao, F.K.; Zhou, S.J.; Ding, Y.; Song, X.L.; Li, P.; Wang, B.H. Genome-wide association analysis of salt tolerance QTLs with SNP markers in maize (Zea mays L.). Genes Genom. 2019, 41(10), 1135–1145. [Google Scholar] [CrossRef]
- Pereira, L.; Ruggieri, V.; Pérez, S.; Alexiou, K.G.; Fernández, M.; Jahrmann, T.; Pujol, M.; Garcia-Mas, J. QTL mapping of melon fruit quality traits using a high-density GBS-based genetic map. BMC Plant Biol. 2018, 18(1), 324. [Google Scholar] [CrossRef]
- Barchi, L.; Lanteri, S.; Portis, E.; Valè, G.; Volante, A.; Pulcini, L.; Ciriaci, T.; Acciarri, N.; Barbierato, V.; Toppino, L.; et al. A RAD tag-derived marker based eggplant linkage map and the location of QTLs determining anthocyanin pigmentation. PLoS ONE. 2012, 7(8), e43740. [Google Scholar] [CrossRef]
- Jia, J.Z.; Zhao, S.C.; Kong, X.Y.; Li, Y.R.; Zhao, G.Y.; He, W.M.; Appels, R.; Pfeifer, M.; Tao, Y. ; Zhang, X; et al. Aegilops tauschii draft genome sequence reveals a gene repertoire for wheat adaptation. Nature. 2013, 496, 91–95. [Google Scholar] [CrossRef] [PubMed]
- Díaz-Arce, N.; Rodríguez-Ezpeleta, N. Selecting RAD-seq data analysis parameters for population genetics: The more the better? Front Genet. 2019, 10, 533. [Google Scholar] [CrossRef]
- Monforte, A.J.; Diaz, A.; Caño-Delgado, A.; van der Knaap, E. The genetic basis of fruit morphology in horticultural crops: Lessons from tomato and melon. J Exp Bot. 2014, 65, 4625–4637. [Google Scholar] [CrossRef]
- Argyris, J.M.; Díaz, A.; Ruggieri, V.; Fernández, M.; Jahrmann, T.; Gibon, Y.; Picó, B.; Martín-Hernández, A.M.; Monforte, A.J.; Garcia-Mas, J. QTL analyses in multiple populations employed for the fine mapping and identification of candidate genes at a locus affecting sugar accumulation in melon (Cucumis melo L.). Front Plant Sci. 2017, 8, 1679. [Google Scholar] [CrossRef]
- Zeng, Y.L.; Wang, M.Y.; Hunter, D.C.; Matich, A.J.; McAtee, P.A.; Knäbel, M.; Hamiaux, C.; Popowski, E.A.; Jaeger, S.R.; Nieuwenhuizen, N.J.; et al. Sensory-directed genetic and biochemical characterization of volatile terpene production in kiwifruit. Plant Physiol. 2020, 183(1), 51–66. [Google Scholar] [CrossRef]
- Diaz-Garcia, L. , Schlautman, B., Covarrubias-Pazaran, G., Maule, A., Johnson-Cicalese, J., Grygleski, E., Vorsa, N., & Zalapa, J. Massive phenotyping of multiple cranberry populations reveals novel QTLs for fruit anthocyanin content and other important chemical traits. Mol Genet Genomics. 2018, 293(6), 1379–1392. [Google Scholar] [CrossRef]
- Tang, H.X. , Pei, G.Y., Zhang, Q., Wang, Z.T. QTL mapping analysis of jujube fruit-related traits. Acta Hortic Sin. 2023, 50(4), 754–764. [Google Scholar] [CrossRef]
- Jiang, F.C. , Yang, L., Zhang, J.H., Zhang, M.L., Yu, W.J., Sun, H.Y. QTL mapping and screening of major-effect genes regulating organic acid accumulation in apricot fruit. Acta Hortic Sin. 2025, 52(4), 846–856. [Google Scholar] [CrossRef]
- Yamamoto, T.; Kimura, T.; Shoda, M.; Imai, T.; Saito, T.; Sawamura, Y.; Kotobuki, K.; Hayashi, T.; Matsuta, N. Genetic linkage maps constructed by using an interspecific cross between Japanese and European pears. Theor Appl Genet. 2002, 106, 9–18. [Google Scholar] [CrossRef]
- Gangadhara Rao, P.; Behera, T.K.; Gaikwad, A.B.; Munshi, A.D.; Srivastava, A.; Boopalakrishnan, G.; Vinod. Genetic analysis and QTL mapping of yield and fruit traits in bitter gourd (Momordica charantia L.). Sci Rep. 2021, 11(1), 4109. [Google Scholar] [CrossRef]
- Qin, M.F.; Li, L.T.; Singh, J.; Sun, M.Y.; Bai, B.; Li, S.W.; Ni, J.P.; Zhang, J.Y.; Zhang, X.; Wei, W.L.; et al. Construction of a high-density bin-map and identification of fruit quality-related quantitative trait loci and functional genes in pear. Hortic Res. 2022, 9, uhac141. [Google Scholar] [CrossRef] [PubMed]
- Shi, P.; Xu, Z.; Zhang, S.Y.; Wang, X.J.; Ma, X.F.; Zheng, J.C.; Xing, L.B.; Zhang, D.; Ma, J.J.; Han, M.Y.; Zhao, C.P. Construction of a high-density SNP-based genetic map and identification of fruit-related QTLs and candidate genes in peach [Prunus persica (L.) Batsch]. BMC Plant Biol. 2020, 20(1), 438. [Google Scholar] [CrossRef] [PubMed]
- Battistoni, B.; Salazar, J.; Vega, W.; Valderrama-Soto, D.; Jiménez-Muñoz, P.; Sepúlveda-González, A.; Ahumada, S.; Cho, I.; Gardana, C.S.; Morales, H. An upgraded, highly-saturated linkage map of Japanese plum (Prunus salicina Lindl.), and identification of a new major locus controlling the flavan-3-ol composition in fruits. Front Plant Sci. 2022, 13, 805744. [Google Scholar] [CrossRef]
- Oh, S.; Ahn, S.; Han, H.; Kim, K.; Kim, S.A.; Kim, D. Genetic linkage maps and QTLs associated with fruit skin color and acidity in apple (Malus×domestica). Hortic. Environ. Biotechnol. 2023, 64(2), 299–310. [Google Scholar] [CrossRef]
- Wang, P.F.; Yi, S.K.; Mu, X.P.; Zhang, J.C.; Du, J.J. Chromosome-level genome assembly of Cerasus humilis Using PacBio and Hi-C Technologies. Front. Genet. 2020, 11, 956. [Google Scholar] [CrossRef] [PubMed]
- Zhu, H.H.; Zhou, X. Statistical methods for SNP heritability estimation and partition: A review. Comput Struct Biotechnol J. 2020, 18, 1557–1568. [Google Scholar] [CrossRef]
- Yamamoto, T.; Kimura, T.; Shoda, M.; Imai, T.; Saito, T.; Sawamura, Y.; Kotobuki, K.; Hayashi, T.; Matsuta, N. Genetic linkage maps constructed by using an interspecific cross between Japanese and European pears. Theor Appl Genet. 2002, 106(1), 9–18. [Google Scholar] [CrossRef]
- Catchen, J.M.; Amores, A.; Hohenlohe, P.; Cresko, W.; Postlethwait, J.H. Stacks: Building and genotyping loci de novo from short-read sequences. G3 (Bethesda). 2011, 1(3), 171–182. [Google Scholar] [CrossRef]
- Rastas, P.; Paulin, L.; Hanski, I.; Lehtonen, R.; Auvinen, P. Lep-MAP: Fast and accurate linkage map construction for large SNP datasets. Bioinformatics. 2013, 29(24), 3128–3134. [Google Scholar] [CrossRef]
- Guo, C.Z. Genetic analysis of fruit organic acids, screening and functional verification of key organic acid metabolism regulating genes in Chinese dwarf cherry. Ph.D. Dissertation, Shanxi Agricultural University, Shanxi, 2023. [Google Scholar]
- Jiang, Y.M.; Dong, L.; Li, H.Q.; Liu, Y.N.; Wang, X.D.; Liu, G.Q. Genetic linkage map construction and QTL analysis for plant height in proso millet (Panicum miliaceum L.). Theor Appl Genet. 2024, 137(4), 78. [Google Scholar] [CrossRef]
- Shi, P.; Xu, Z.; Zhang, S.Y.; Wang, X.J.; Ma, X.F.; Zheng, J.C.; Xing, L.B.; Zhang, D.; Ma, J.J.; Han, M.Y.; Zhao, C.P. Construction of a high-density SNP-based genetic map and identification of fruit-related QTLs and candidate genes in peach [Prunus persica (L.) Batsch]. BMC Plant Biol. 2020, 20(1), 438. [Google Scholar] [CrossRef] [PubMed]
- Wang, Y.; Georgi, L.L.; Reighard, G.L.; Scorza, R.; Abbott, A.G. Genetic mapping of the evergrowing gene in peach [Prunus persica (L.) Batsch]. J Hered. 2002, 93(5), 352–358. [Google Scholar] [CrossRef]
- Wang, Y.; Georgi, L.L.; Zhebentyayeva, T.N.; Reighard, G.L.; Scorza, R.; Abbott, A.G. High-throughput targeted SSR marker development in peach (Prunus persica). Genome 2002, 45(2), 319–328. [Google Scholar] [CrossRef]
- Sun, R. , Chang, Y., Yang, F., Wang, Y., Li, H., Zhao, Y., Chen, D., Wu, T., Zhang, X., & Han, Z. A dense SNP genetic map constructed using restriction site-associated DNA sequencing enables detection of QTLs controlling apple fruit quality. BMC Genom. 2015, 16(1), 747. [Google Scholar] [CrossRef]
- Li, H. , Chen, A., Tang, H., & Luan, M. High-density genetic map construction and QTL analysis of the first flower node in kenaf using RAD-seq. BMC Plant Biol. 2024, 24(1), 1191. [Google Scholar] [CrossRef]
- Wang, D.S. , Cheng, B.B., & Zhang, J.J. High-density genetic map and quantitative trait loci map of skin color in hawthorn (Crataegus pinnatifida bge. Var. major N.E.Br.). Front Genet. 2024, 15, 1405604. [Google Scholar] [CrossRef] [PubMed]
- Powder, K.E. Quantitative Trait Loci (QTL) mapping. In: Methods in Molecular Biology (Ed.) Clifton, N.J. 2020, pp. 211–229. [CrossRef]
- Rawandoozi, Z.J. , Hartmann, T.P., Carpenedo, S., Gasic, K., Linge, C.d.S., Cai, L., Van de Weg, E., Byrne, D.H. Identification and characterization of QTLs for fruit quality traits in peach through a multi-family approach. BMC Genom. 2020, 21(1), 522. [Google Scholar] [CrossRef] [PubMed]
- Dondini, L. , Domenichini, C., Dong, Y., Gennari, F., Bassi, D., Foschi, S., Lama, M., Adami, M., De Franceschi, P., Cervellati, C., Bergonzoni, L., Alessandri, S., Tartarini, S. Quantitative trait loci mapping and identification of candidate genes linked to fruit acidity in apricot (Prunus armeniaca L.). Front Plant Sci. 2022, 13, 838370. [Google Scholar] [CrossRef]
- Sun, R.; Chang, Y.; Yang, F.; Wang, Y.; Li, H.; Zhao, Y.; Chen, D.; Wu, T.; Zhang, X.; Han, Z. A dense SNP genetic map constructed using restriction site-associated DNA sequencing enables detection of QTLs controlling apple fruit quality. BMC Genom. 2015, 16, 747. [Google Scholar] [CrossRef] [PubMed]
- Yao, Y.J.; You, Q.B.; Duan, G.Z.; Ren, J.J.; Chu, S.S.; Zhao, J.Q.; Li, X.; Zhou, X.N.; & Jiao, Y.Q. Quantitative trait loci analysis of seed oil content and composition of wild and cultivated soybean. BMC Plant Biol. 2020, 20, 51. [Google Scholar] [CrossRef]
- Wu, S.; Li, M.; Zhang, C.; Tan, Q.; Yang, X.; Sun, X.; Pan, Z.; Deng, X.; Hu, C. Effects of phosphorus on fruit soluble sugar and citric acid accumulations in citrus. Plant Physiol Biochem. 2021, 160, 73–81. [Google Scholar] [CrossRef]
- Dong, B.; Meng, D.; Song, Z.; Cao, H.; Du, T.; Qi, M.; Wang, S.; Xue, J.; Yang, Q.; Fu, Y. CcNFYB3-CcMATE35 and LncRNA CcLTCS-CcCS modules jointly regulate the efflux and synthesis of citrate to enhance aluminium tolerance in pigeon pea. Plant Biotechnol J. 2024, 22, 181–199. [Google Scholar] [CrossRef]
Figure 1.
Genetic lengths and marker distribution of eight linkage groups in the genetic map of Cerasus humilis. Black bars represent mapped markers.
Figure 1.
Genetic lengths and marker distribution of eight linkage groups in the genetic map of Cerasus humilis. Black bars represent mapped markers.
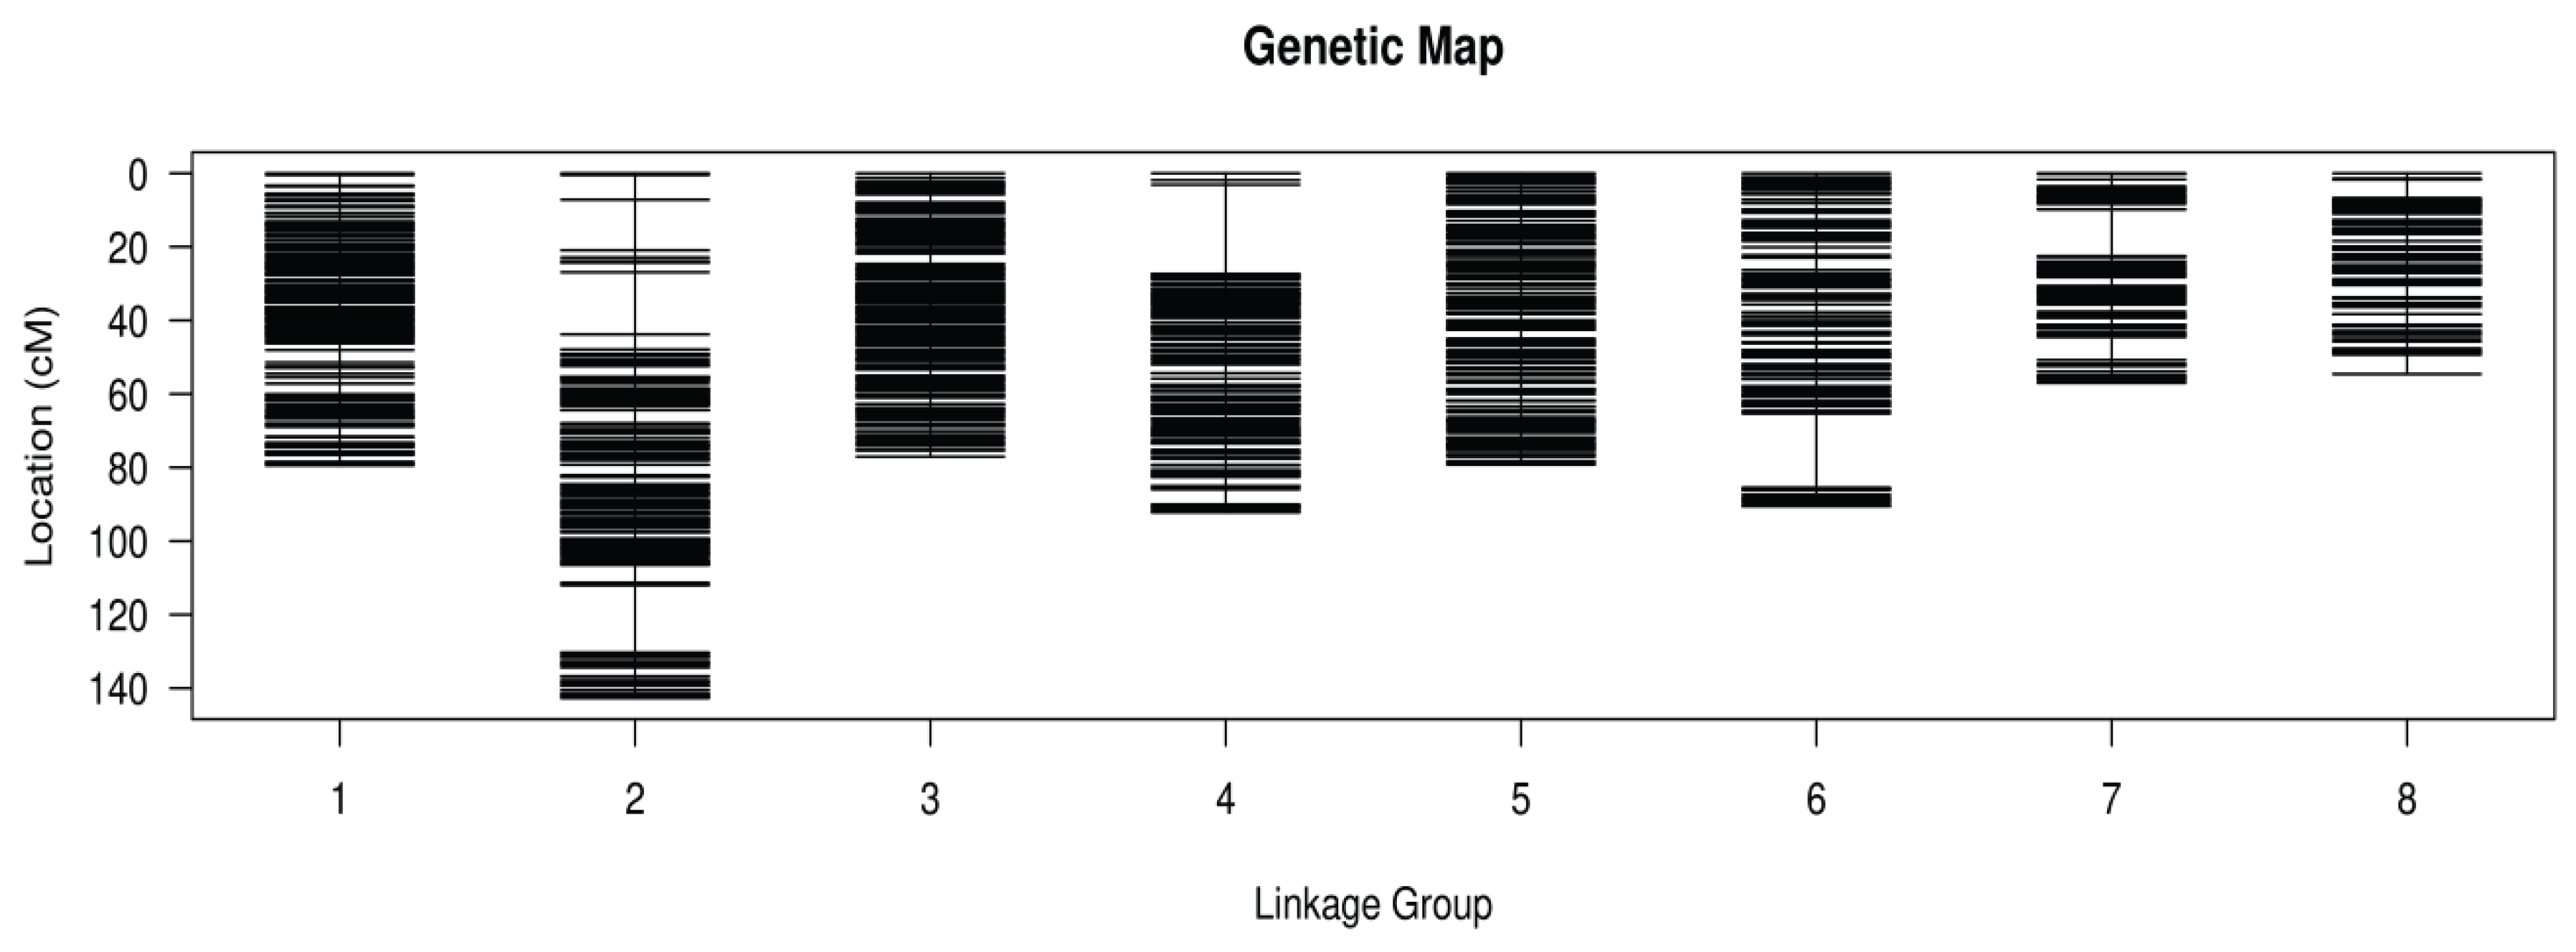
Figure 2.
Marker linkage relationship on the genetic map. Each cell denotes the recombination rate of pair-wise markers. Yellow and purple indicate lower and higher recombination rates, respectively.
Figure 2.
Marker linkage relationship on the genetic map. Each cell denotes the recombination rate of pair-wise markers. Yellow and purple indicate lower and higher recombination rates, respectively.
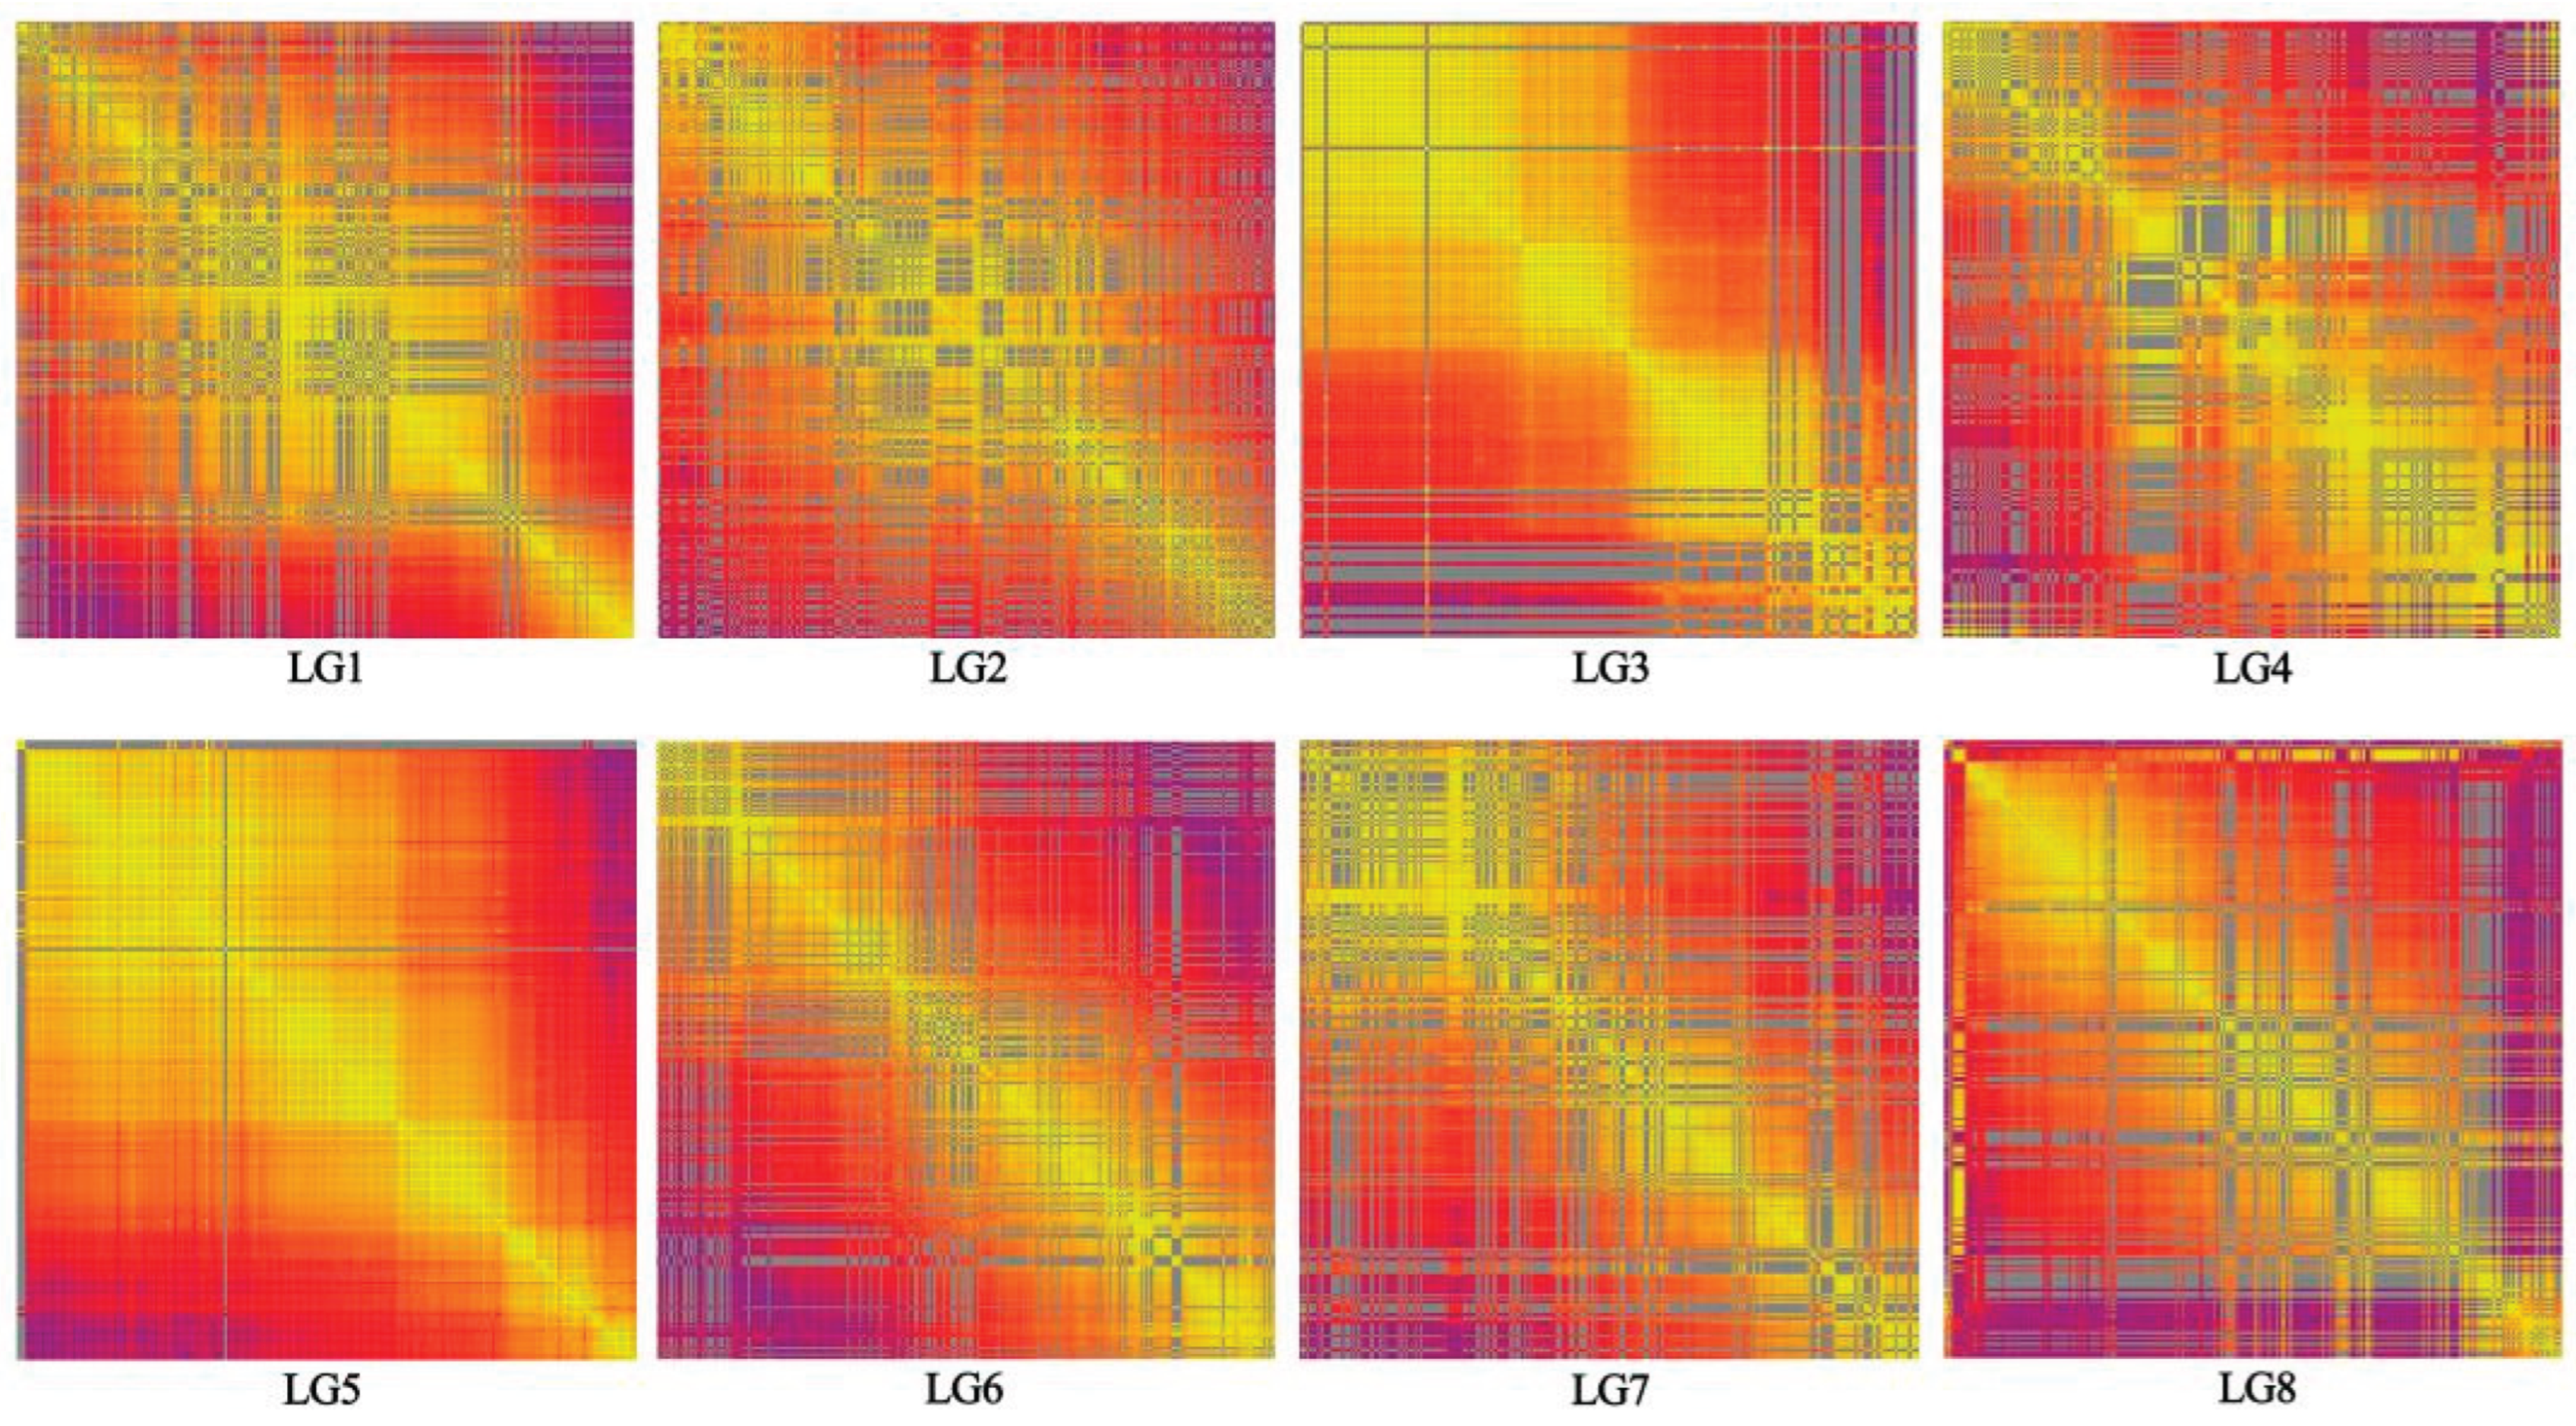
Figure 3.
Quantitative trait locus (QTL) distribution for titratable acid on linkage groups. The x-axis represents the linkage groups.
Figure 3.
Quantitative trait locus (QTL) distribution for titratable acid on linkage groups. The x-axis represents the linkage groups.
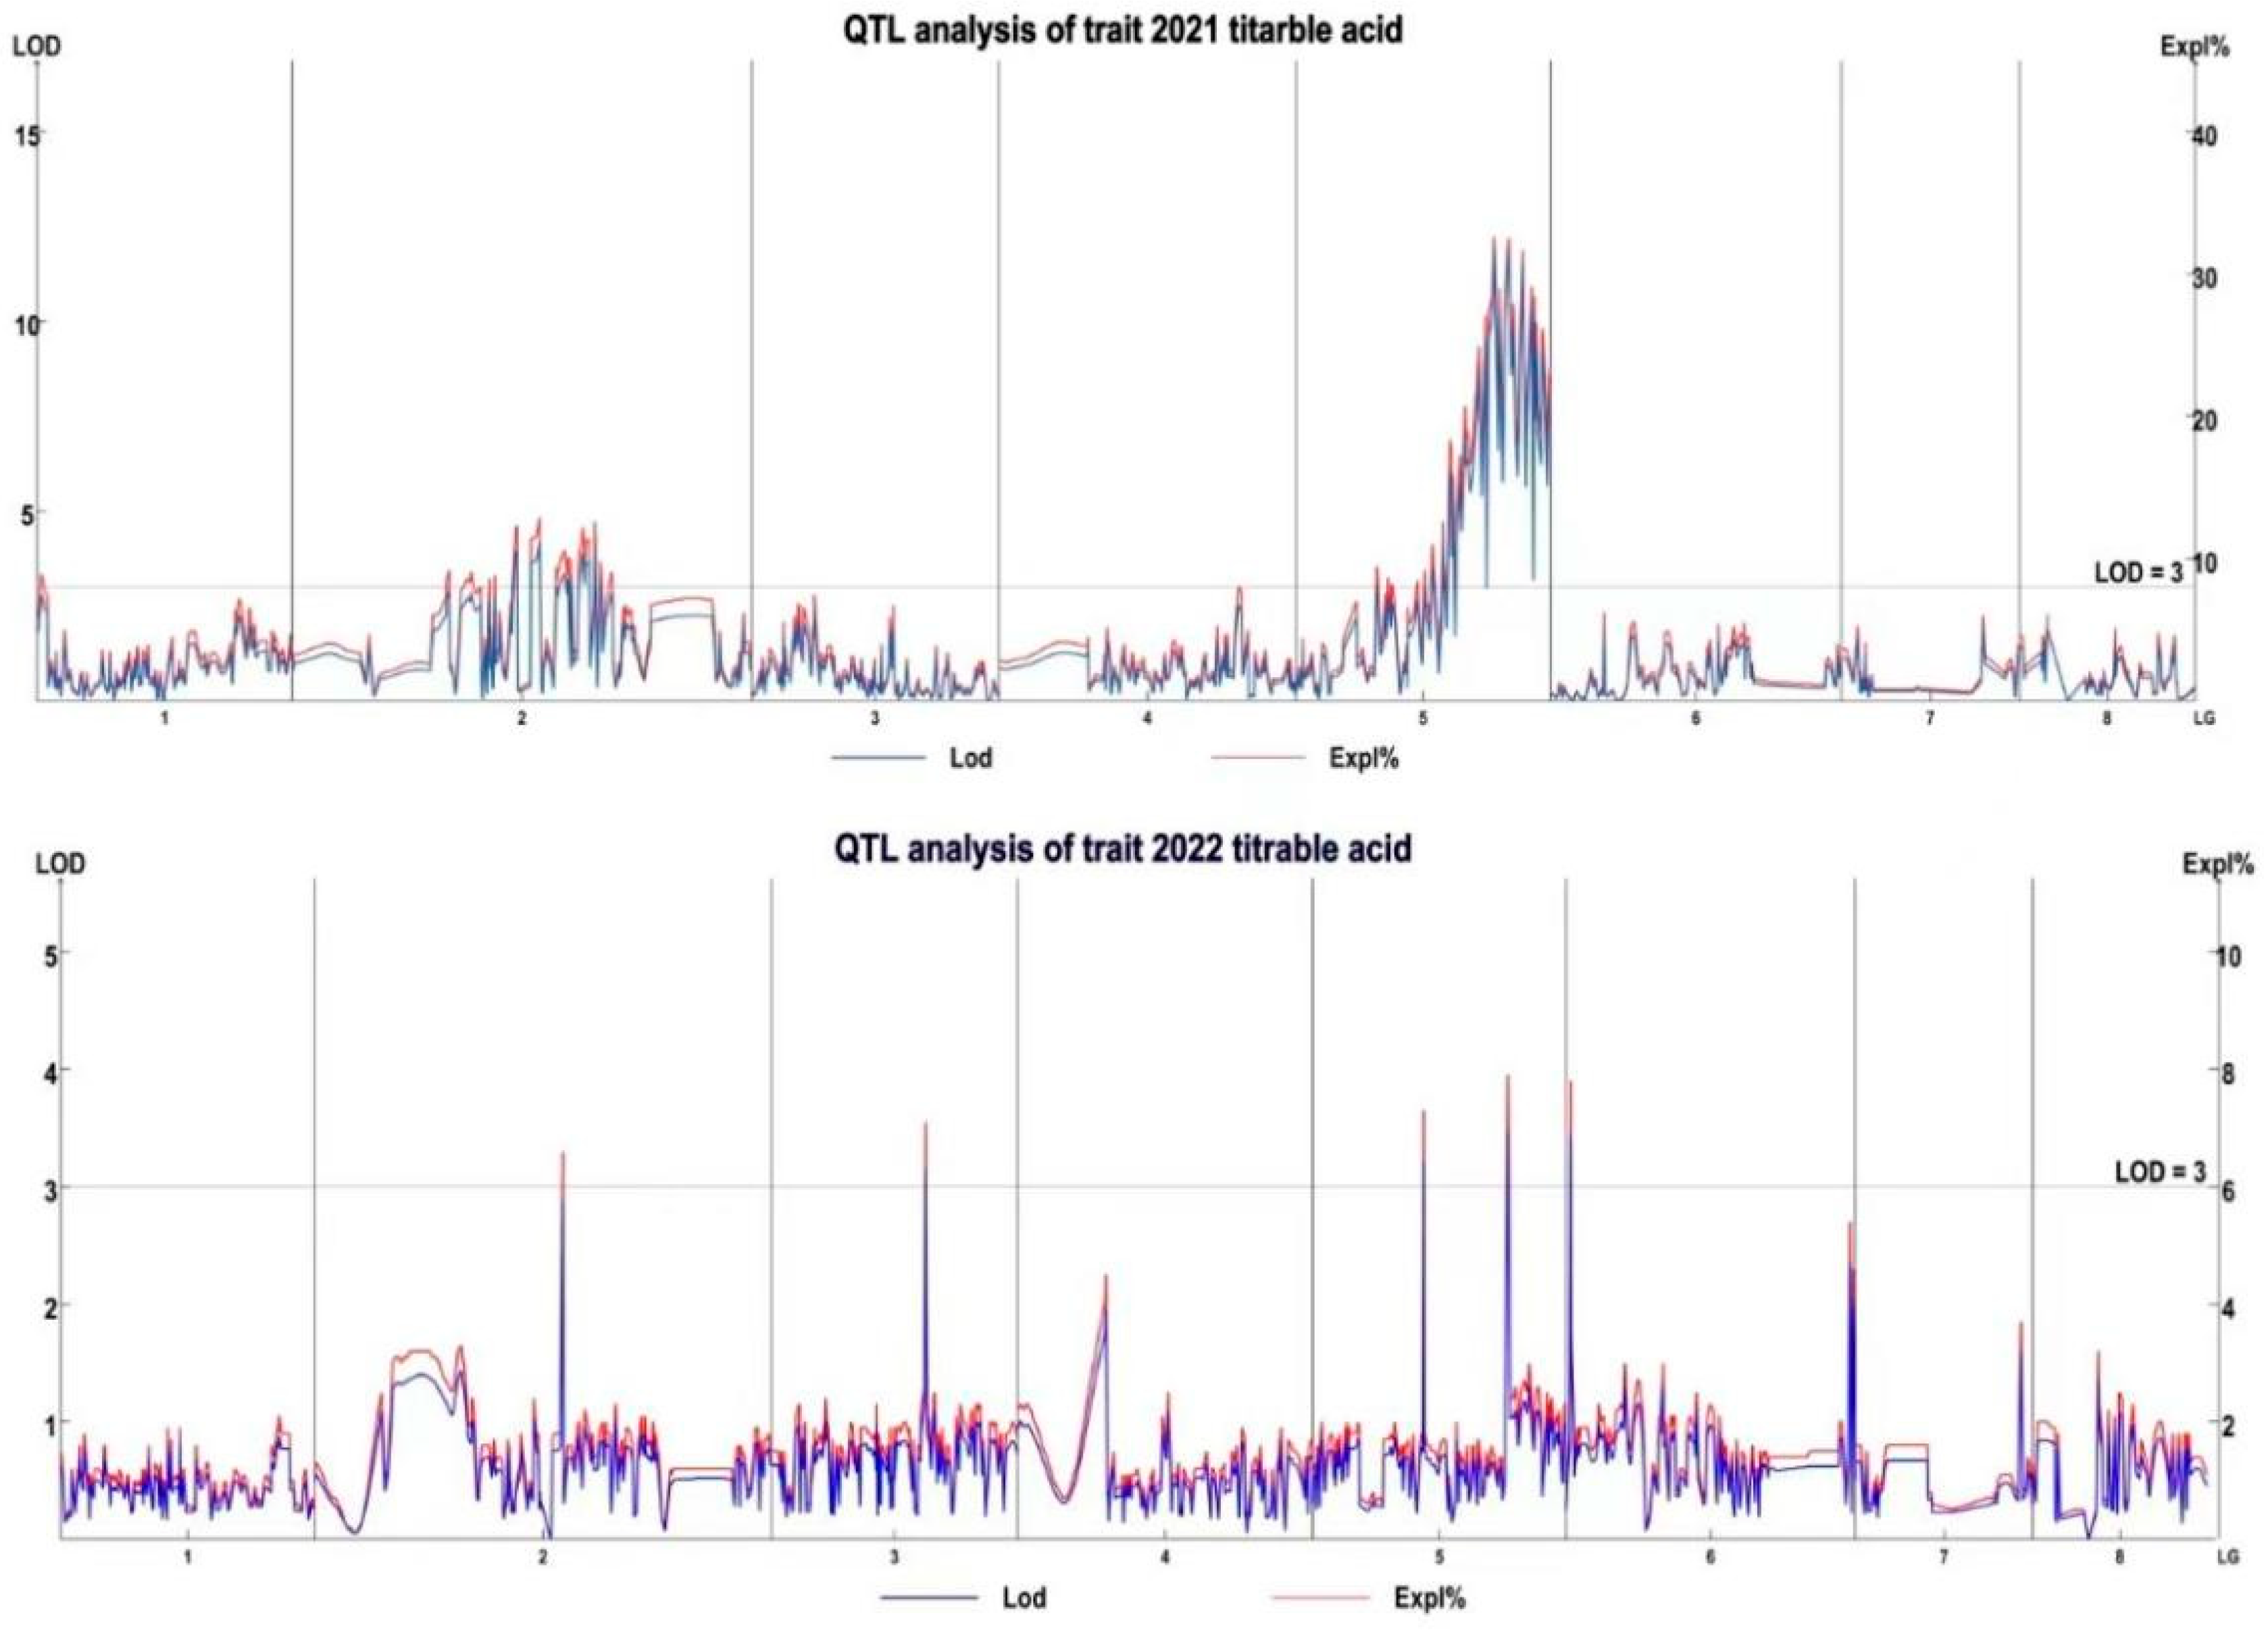
Figure 4.
Dynamic changes of titratable acid content and phosphatidate phosphatase gene expression during the fruit development of different germplasm.
Figure 4.
Dynamic changes of titratable acid content and phosphatidate phosphatase gene expression during the fruit development of different germplasm.
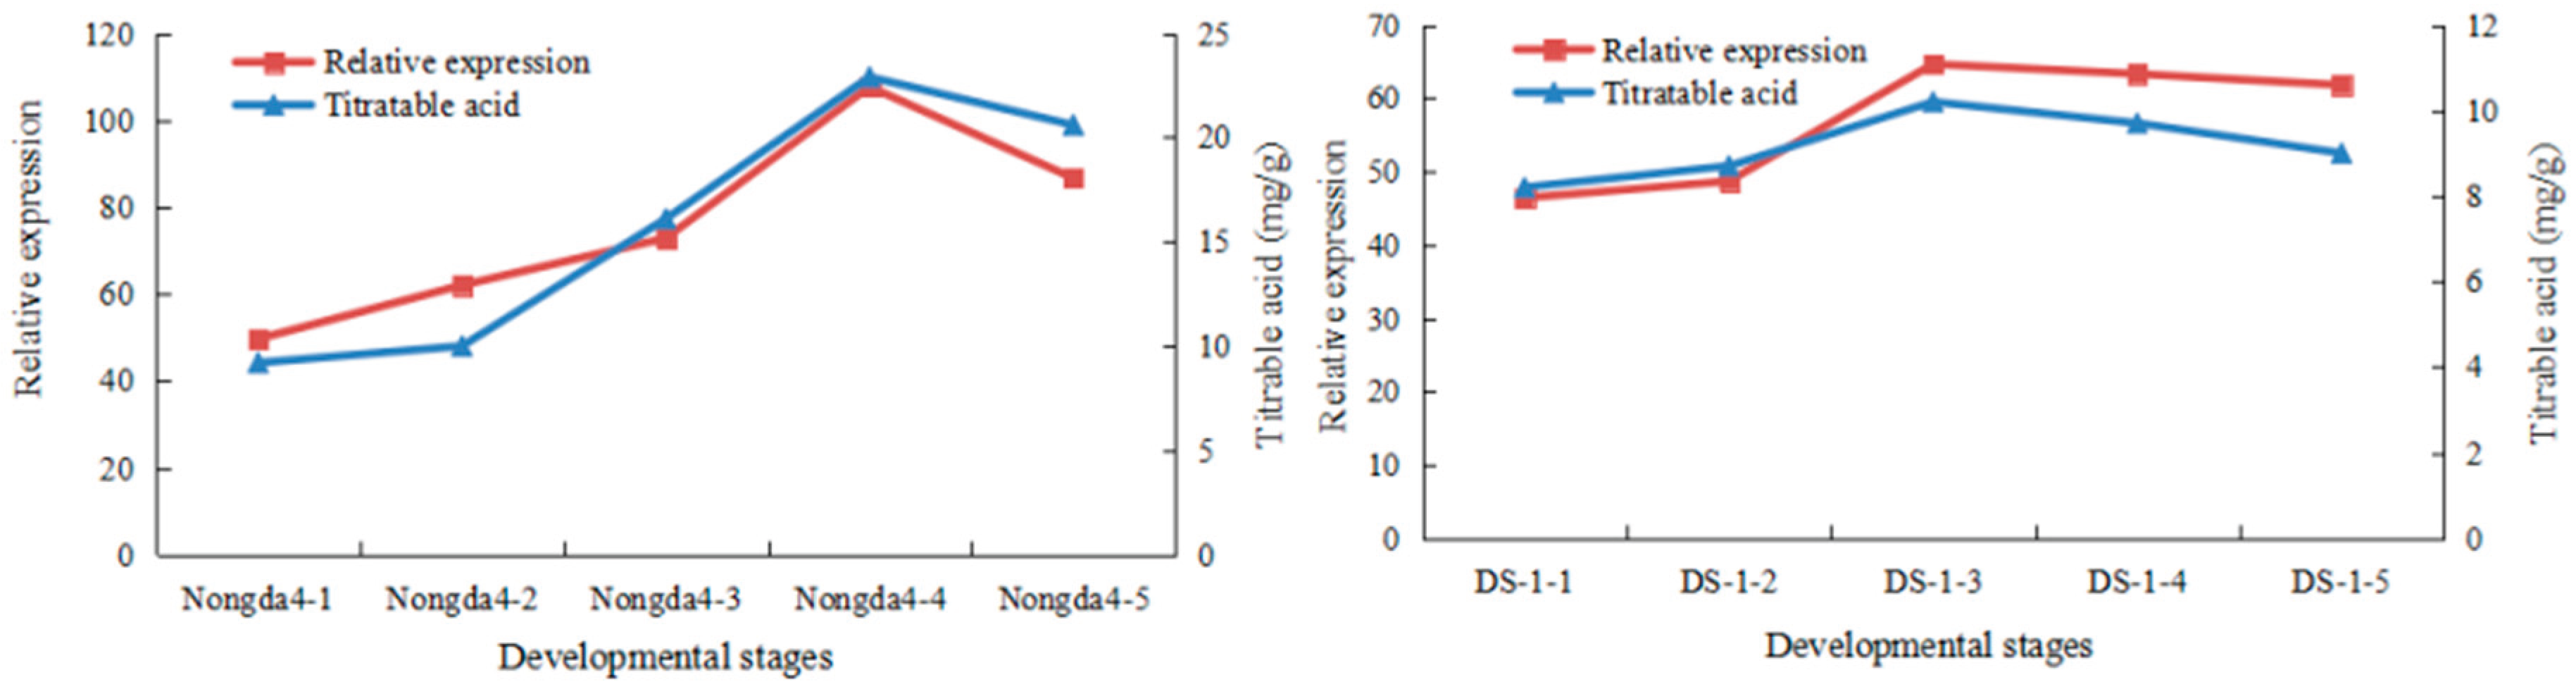

Table 1.
Summary of the genetic map characteristics for Nongda 4 and DS-1.
| Linkage group | SNP number | Total distance (cM) | Average distance (cM) | Max Gap (cM) | Gaps <5 cM (%) |
|---|---|---|---|---|---|
| LG1 | 465 | 79.45 | 0.17 | 3.35 | 100 |
| LG2 | 389 | 142.71 | 0.37 | 18.23 | 98.97 |
| LG3 | 384 | 77.04 | 0.2 | 2.87 | 100 |
| LG4 | 333 | 92.18 | 0.28 | 24.22 | 99.7 |
| LG5 | 305 | 79.2 | 0.26 | 2.39 | 100 |
| LG6 | 265 | 90.52 | 0.34 | 20.17 | 99.62 |
| LG7 | 197 | 57.01 | 0.29 | 12.71 | 98.98 |
| LG8 | 153 | 54.6 | 0.36 | 5.28 | 98.68 |
| Total | 2491 | 672.71 | - | - | - |
| Average | 311.38 | 84.09 | 0.27 | 11.15 | 99.49 |
SNP, single nucleotide polymorphism.
Table 2.
Quantitative trait locus (QTL) mapping results of fruit acidity based on the genetic map.
| Year | Linkage Group | QTL | Confidence interval (cM) | Mark number | LOD | PVE (%) |
|---|---|---|---|---|---|---|
| 2021 | LG2 | 21TA-1 | 69.433–69.912 | 6 | 3.87 | 12.03 |
| LG2 | 21TA-2 | 74.218–77.568 | 16 | 3.86 | 12.01 | |
| LG2 | 21TA-3 | 84.51–85.467 | 4 | 3.33 | 10.45 | |
| LG2 | 21TA-4 | 86.663–87.381 | 6 | 3.25 | 10.19 | |
| LG2 | 21TA-5 | 89.056–90.97 | 13 | 3.41 | 10.69 | |
| LG2 | 21TA-6 | 91.209–92.405 | 10 | 3.68 | 11.45 | |
| LG2 | 21TA-7 | 94.08–94.319 | 3 | 3.91 | 12.13 | |
| LG5 | 21TA-8 | 42.349–42.588 | 3 | 3.47 | 10.83 | |
| LG5 | 21TA-9 | 45.7–45.94 | 3 | 3.56 | 11.13 | |
| LG5 | 21TA-10 | 48.093–48.811 | 8 | 5.43 | 16.44 | |
| LG5 | 21TA-11 | 50.007–59.338 | 35 | 6.29 | 18.71 | |
| LG5 | 21TA-12 | 60.056–61.971 | 10 | 11.28 | 31.13 | |
| LG5 | 21TA-13 | 63.407–79.197 | 55 | 8.36 | 24.06 | |
| 2022 | LG1 | 22TA-1 | 29.432 | 3 | 3.86 | 8.7 |
| LG2 | 22TA-2 | 60.336 | 1 | 3.81 | 8.6 | |
| LG3 | 22TA-3 | 48.332 | 1 | 3.14 | 7.1 | |
| LG5 | 22TA-4 | 34.693 | 1 | 3.23 | 7.3 | |
| LG6 | 22TA-5 | 1.436 | 1 | 3.45 | 7.8 |
LOD, logarithm (base 10) of odds; PVE, phenotypic variation explained.
Table 3.
Correlation analysis of titratable acid content and phosphatidate phosphatase gene expression during Chinese dwarf cherry fruit development.
Table 3.
Correlation analysis of titratable acid content and phosphatidate phosphatase gene expression during Chinese dwarf cherry fruit development.
| Correlation coefficient | Phosphatidate phosphatase gene (FPKM) |
|---|---|
| Titratable acid content | 0.93** |
FPKM, fragments per kilobase of exon per million mapped fragments.
Disclaimer/Publisher’s Note: The statements, opinions and data contained in all publications are solely those of the individual author(s) and contributor(s) and not of MDPI and/or the editor(s). MDPI and/or the editor(s) disclaim responsibility for any injury to people or property resulting from any ideas, methods, instructions or products referred to in the content. |
© 2025 by the authors. Licensee MDPI, Basel, Switzerland. This article is an open access article distributed under the terms and conditions of the Creative Commons Attribution (CC BY) license (http://creativecommons.org/licenses/by/4.0/).
Copyright: This open access article is published under a Creative Commons CC BY 4.0 license, which permit the free download, distribution, and reuse, provided that the author and preprint are cited in any reuse.


