1. Introduction
Mitochondria have been depicted as granular capsule-like structures based on past transmission electron microscope images, but in addition to the structures, they exhibit various morphological forms, including filamentous and rod-shaped structures, and interconnected structures made of elongated mitochondria called network structure (Bereiter-Hahn and Vöth, 1994; Labbé and Murley, 2014; Hinton et al., 2023). The diversity and changes in their architectures have been proposed based on observations made using light microscopy (Bereiter-Hahn and Vöth, 1994), and these findings have recently been confirmed by those with super-resolution microscopy and three-dimensional high-resolution electron microscopy (Hinton, et al., 2023; Stephan, et al., 2024). When oxidative damages are generated in mitochondria, fusion between neighboring mitochondria allows damaged proteins and DNA to be replaced with normal ones from other mitochondria, and metabolic products to be shared (Chen et al., 2010). Damaged mitochondria undergo fission, and the smaller sections with the damaged parts are broken down and eliminated by mitophagy. Fusion and fission are essential for maintaining the function of mitochondria within cells (Sauvanet et al., 2010; Benard et al., 2007). Even during normal cell proliferation, the morphology changes depending on the phase of the cell cycle (Madan et al., 2022). The elongated structures formed via the fusion of multiple mitochondria during interphase in mammalian cells transform into granular structures just before entering M-phase. At the end of M-phase, these elongated structures are reassembled. The ability of mitochondria to take on different shapes was postulated to be related to their dynamic nature involving repeated fusion and fission (Bereiter-Hahn and Vöth, 1994). However, no direct evidence has been provided to show that the factors controlling mitochondrial fusion and fission influence these shape changes.
The studies on the molecular mechanisms that regulate mitochondrial morphogenesis commenced with the isolation of mitochondrial morphogenesis-deficient mutants in budding yeast (Okamoto and Shaw, 2005). Three GTPases essential for mitochondrial fusion and fission were originally identified: the cytoplasmic dynamin-related GTPase, Drp1, plays a key role in mitochondrial fission, while Mfn1/2 functions in the outer membrane fusion of mitochondria, and Opa1 in the inner membrane fusion of mitochondria. Orthologs for those small GTPases have been identified in Drosophila and mammals (Hales and Fuller 1997; Eura et al., 2003; Deng et al., 2008). If these factors do not function properly, the balance between fusion and fission is disturbed, which can impact mitochondrial morphogenesis and function. In addition, LETM1 is a mitochondria inner membrane protein that is required for mitochondria morphology and cristae structures (Nakamura et al., 2020). Disrupting mammalian Endophilin B1, which is located on the outer membrane of mitochondria, also causes abnormal elongation of the outer mitochondrial membrane and disturbs the balance between fusion and fission (Karbowski et al., 2004). Here, we refer to these two membrane proteins as mitochondrial morphology proteins and studied them together with the fusion and fission factors. It is becoming increasingly clear that mitochondrial morphology is closely associated with important biological phenomena, including the cell cycle, apoptosis, starvation response, and developmental events (Zhao et al., 2013). Some proteins involved in mitochondrial morphology have been reported to play a crucial role in mouse embryogenesis and brain development: mice lacking the fusion and fission factors, mfn1 (mitofusin 1), mfn2 (mitofusin 2), Opa1 (optic atrophy 1), and Drp1 (dynamin-related protein 1), are lethal in the early stages of embryogenesis (Liesa et al., 2009, Chen et al., 2003, Davies et al., 2007, Ishihara et al., 2009, Wakabayashi et al., 2009). These reports suggest that mitochondrial dynamics play a crucial role in embryonic and neural development. However, it remains unclear whether mitochondrial morphological changes, especially the formation of mitochondrial networks, are necessary for the development of other tissues.
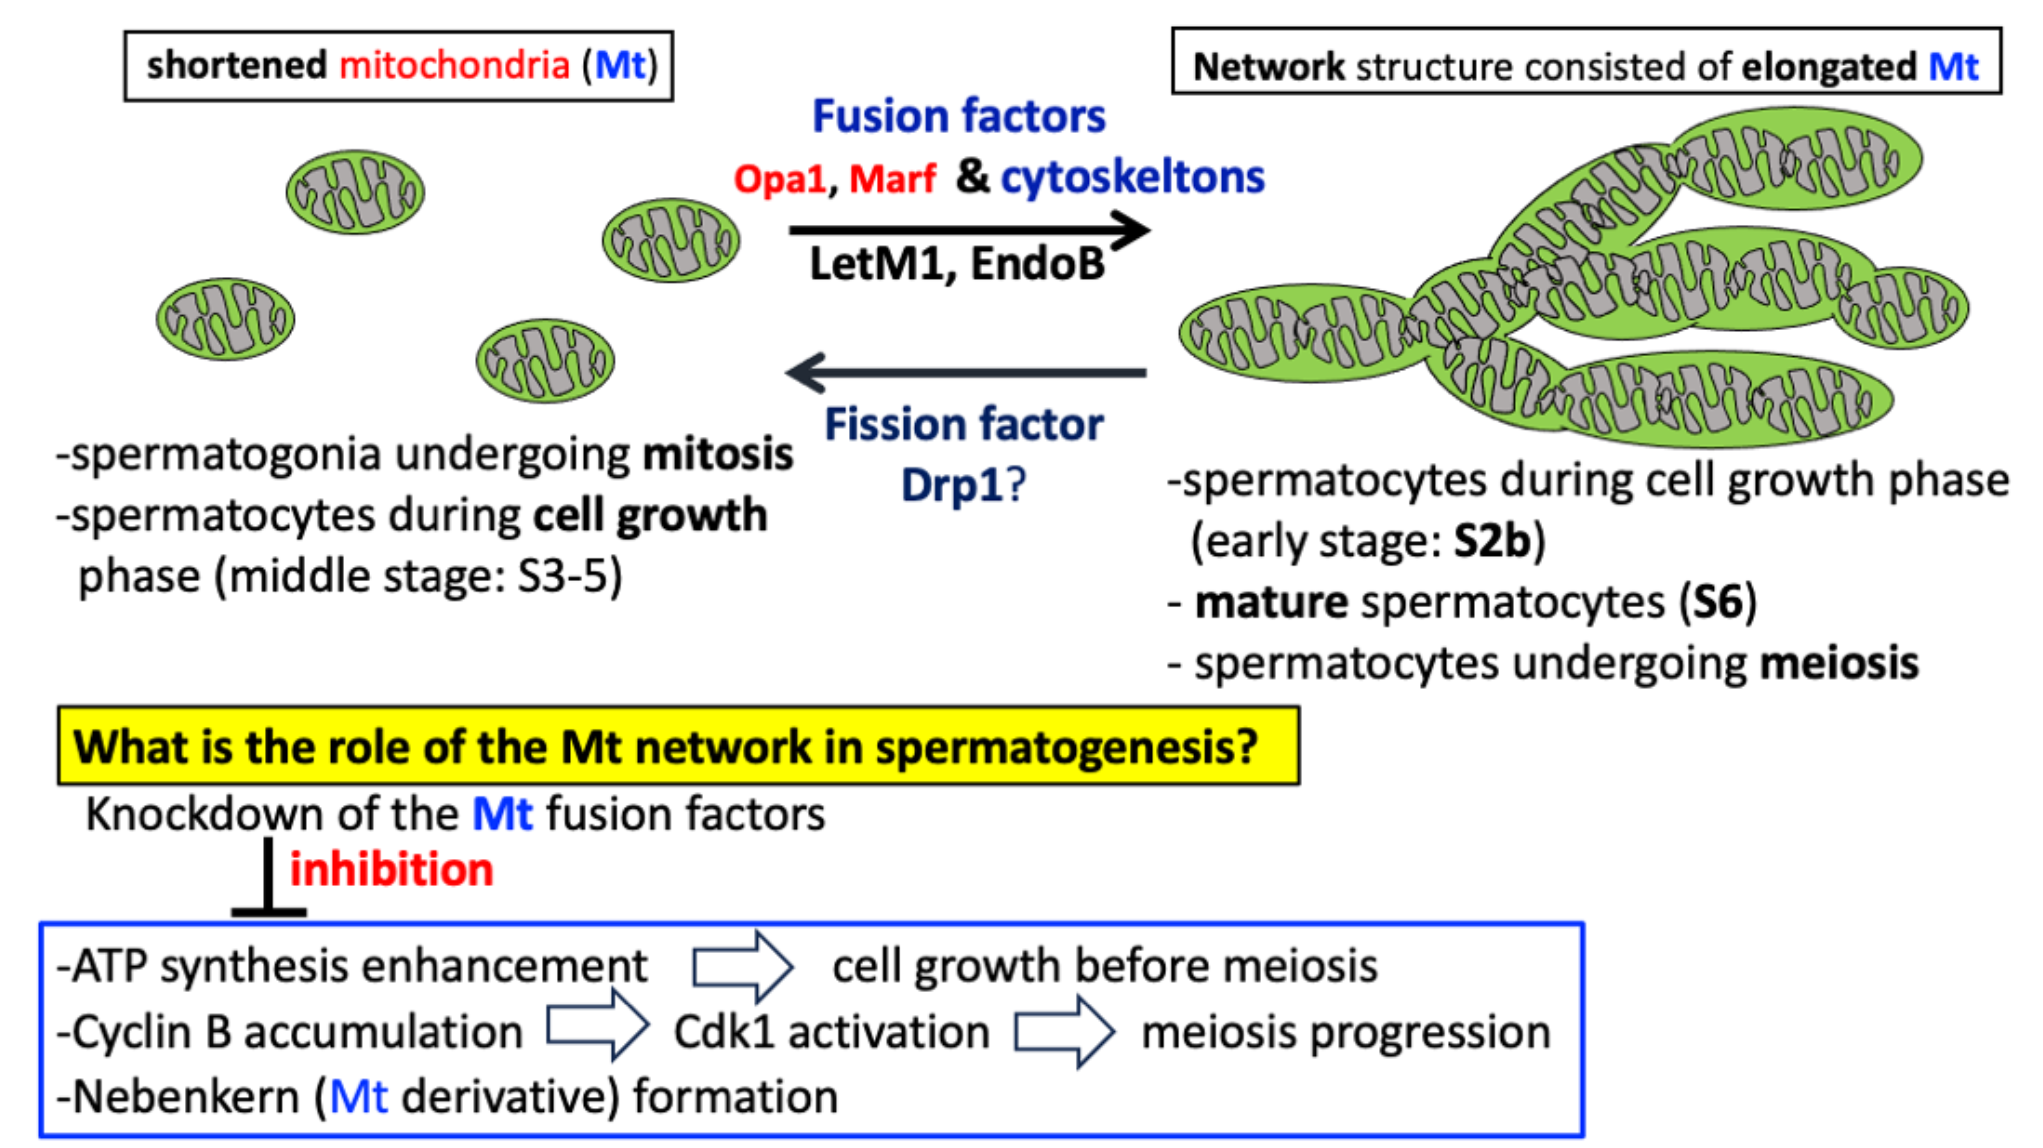
The morphology of mitochondria undergoes remarkable changes during spermatogenesis in Drosophila (Fuller, 1993; Ichihara et al., 2007; Inoue et al., 2012; Vedelek et al., 2024). The spermatogenesis process begins with the asymmetric division of germline stem cells localized at the testis tip. Of their two daughter cells, one becomes a spermatogonium destined for differentiation and undergoes four rounds of mitosis, resulting in the production of 16 primary spermatocytes. These cells form a cell unit designated as a cyst, and thereafter, these 16 cells synchronously undergo a remarkable growth during the cell growth phase, which is divided into seven phases: S1 (premeiotic DNA replication phase), S2a, S2b, S3 to S6 (Cenci et al., 1994; Inoue et al., 2012). The cells at each stage can be easily distinguished by their size and the intracellular distribution of Sa protein. (Inoue, et al., 2012; Azuma et al., 2021). The cells in the S2b stage are characterized by a polar distribution of the nucleus and mitochondrial aggregates adjacent to the nucleus. Thereafter, in the S3-5 stage, when the nucleus is localized at the center of the cells, mitochondria are dispersed through the cytoplasm. At the S6 stage, at the end of the growth phase, spermatocytes reach their maximum size. These characteristics make the cells at each stage easier to identify. After the spermatocyte completes the growth phase, it undergoes two consecutive meiotic divisions. In meiotic cells, mitochondria are diffused into the cytoplasm at the onset of prophase I and align along aster microtubules (Fuller, 1993; Inoue, 2012). Mitochondria are then clustered between two facing asters and are then distributed along the central spindle microtubules. Mitochondria detach from the microtubule structure and spread throughout the cytoplasm at the end of meiosis I. Second meiosis proceeds in the same manner, resulting in the production of 64 spermatids (Ichihara et al., 2007). Mitochondria in a post-meiotic cell, designated a spermatid, construct a large and spherical aggregate known as a Nebenkern next to the nucleus. Thus, as mitochondria form a noticeable structure in the post-meiotic cells, abnormalities that result from mitochondrial morphology and distribution in meiosis can be easily recognized.
In Drosophila, two orthologues of the mammalian mitochondrial outer membrane fusion factors are expressed. One is Marf, which is ubiquitously expressed through development in Drosophila, and the other is fzo (fuzzy onion), which is expressed specifically in male germ cells. The fzo mutants form multiple small Nebenkerns (Hales and Fuller, 1997). Similar abnormalities in Nebenkern formation have been reported in mutant spermatocytes for Opa1, responsible for inner membrane fusion (McQuibban et al., 2006). The cells lacking Drp1, encoding a mitochondrial fission factor, also display a similar Nebenkern phenotype (Aldridge et al., 2007). These findings suggest that both mitochondrial fusion and fission factors are required for the Nebenkern formation. Abnormal Nebenkerns may arise from abnormalities in the process where mitochondria fuse to create two giant organelles. Alternatively, it may be issues in the distribution or structure of mitochondria before or during meiotic divisions. The fine morphology and distribution of mitochondria before and during meiosis, as well as the regulatory factors involved in these processes, remain to be investigated.
In this study, we focused on morphological changes of mitochondria during Drosophila spermatogenesis, especially before and during meiosis. We investigated whether the mitochondrial fusion factors, Marf and Opa1, are required for the formation of a network structure consisting of the elongated mitochondria. In addition, we investigated whether the morphology proteins, Letm1 and EndoB, are also required for the mitochondrial morphological changes. Moreover, we investigated whether the mitochondrial network structure constructed via these gene products plays an indispensable role in male meiosis. We also address the mechanism underlying the fact that the knockdown of the fusion genes essential for the network structure inhibits meiosis. Since mitochondria are essential organelles in spermatogenesis, not only in Drosophila but also in mammals, our findings may provide important insights into the roles of mitochondrial dynamics in spermatogenesis.
3. Discussion
3.1. Mitochondria in Drosophila Spermatocytes Undergo Stage-Specific Changes Between a Shortened Form and an Interconnected Network Structure
Several studies have reported that mitochondria undergo a remarkable morphological change to form a large cluster called Nebenkern after meiosis (Fuller, 1993; Inoue et al., 2012; Vedelek et al., 2024). We focused on the investigation of mitochondrial fine structures in spermatogonia and spermatocytes before and during meiosis using high-resolution confocal microscopy, super-resolution microscopy, N-SIM, and TEM. Spermatogonia derived from germline stem cells undergo four mitotic divisions, during which shortened and granular mitochondria were observed. This morphology is consistent with that observed in mammalian cells in mitosis (Taguchi et al., 2007; Madan et al., 2022). On the other hand, we found that the mitochondrial network structure composed of elongated mitochondria and a shortened form are repeated during the development of spermatocytes. In the S2b stage corresponding to polar spermatocytes, mitochondria accumulate next to the nucleus (Cenci et al., 1994). Illustrations based on the past EM observations show discrete mitochondria in a granular shape or oval capsules that look like two fused (Tate’s TEM observation in Fuller 1993). Previous observation under light microscopy also described that phase-dark structures possibly corresponding to mitochondria form clusters at this stage (Hales and Fuller, 1997; Aldridge et al., 2007). We have performed immunostaining to identify mitochondria in meiotic cells (Ichihara et al., 2007; Inoue et al., 2012). Here, we demonstrated that the network structure made of elongated mitochondria was constructed at the S2b stage and transformed into shortened forms by the subsequent apolar stages corresponding to the S3 stage. These observations are consistent with a previous description (Fuller, 1993). By the end of the growth phase, just before meiosis, the network structures were constructed. In Tate’s illustration based on his EM observation, an elongated mitochondria-like structure was drawn (Fuller 1993). The metaphase I to telophase I cells have rod-shaped mitochondria whose length is more than 10 times their diameter (Fuller 1993). Our observations clarify that mitochondria form a network, which may be interconnected with multiple mitochondria before and during male meiosis. In combination with previous immunostaining results (Ichihara et al., 2007), we conclude that the organelles are associated with microtubule and nuclear envelope structures that form specifically during meiosis. They are subsequently released into the cytoplasm upon cytokinesis. This specific pattern of mitochondrial distribution suggests that a regulatory mechanism ensuring the equal segregation of mitochondria transferred to daughter cells during meiosis, rather than being the result of equal partitioning of the cytoplasm, may be present.
In mammalian cell mitosis, the mitochondrial membrane potential changes during cell division. Mitochondria are polarized until metaphase as much as in interphase cells, but thereafter, they become depolarized. After cytokinesis, the potential was recovered. The electron supply to the mitochondrial electron transfer chain is suppressed during M phase, possibly to reduce the reactive oxygen species (ROS) generated by mitochondrial fragmentation during the M phase (Hirusaki et al., 2017; Madan et al., 2022). In contrast, in Drosophila male meiosis, mitochondria maintain the network structure formed during the cell growth phase. Since active mitochondria are transferred to daughter cells while staying intact, ATP production continues uninterrupted. This may give an advantage in meiosis, as ATP supply can be provided immediately on-site. ATP is also required for morphological changes in mitochondria after the completion of meiosis II (Aldridge et al., 2007).
3.2. Requirement of Fusion Factors for the Formation of the Mitochondrial Network, and Microtubules and F-Actin for Their Distribution Before and During Male Meiosis
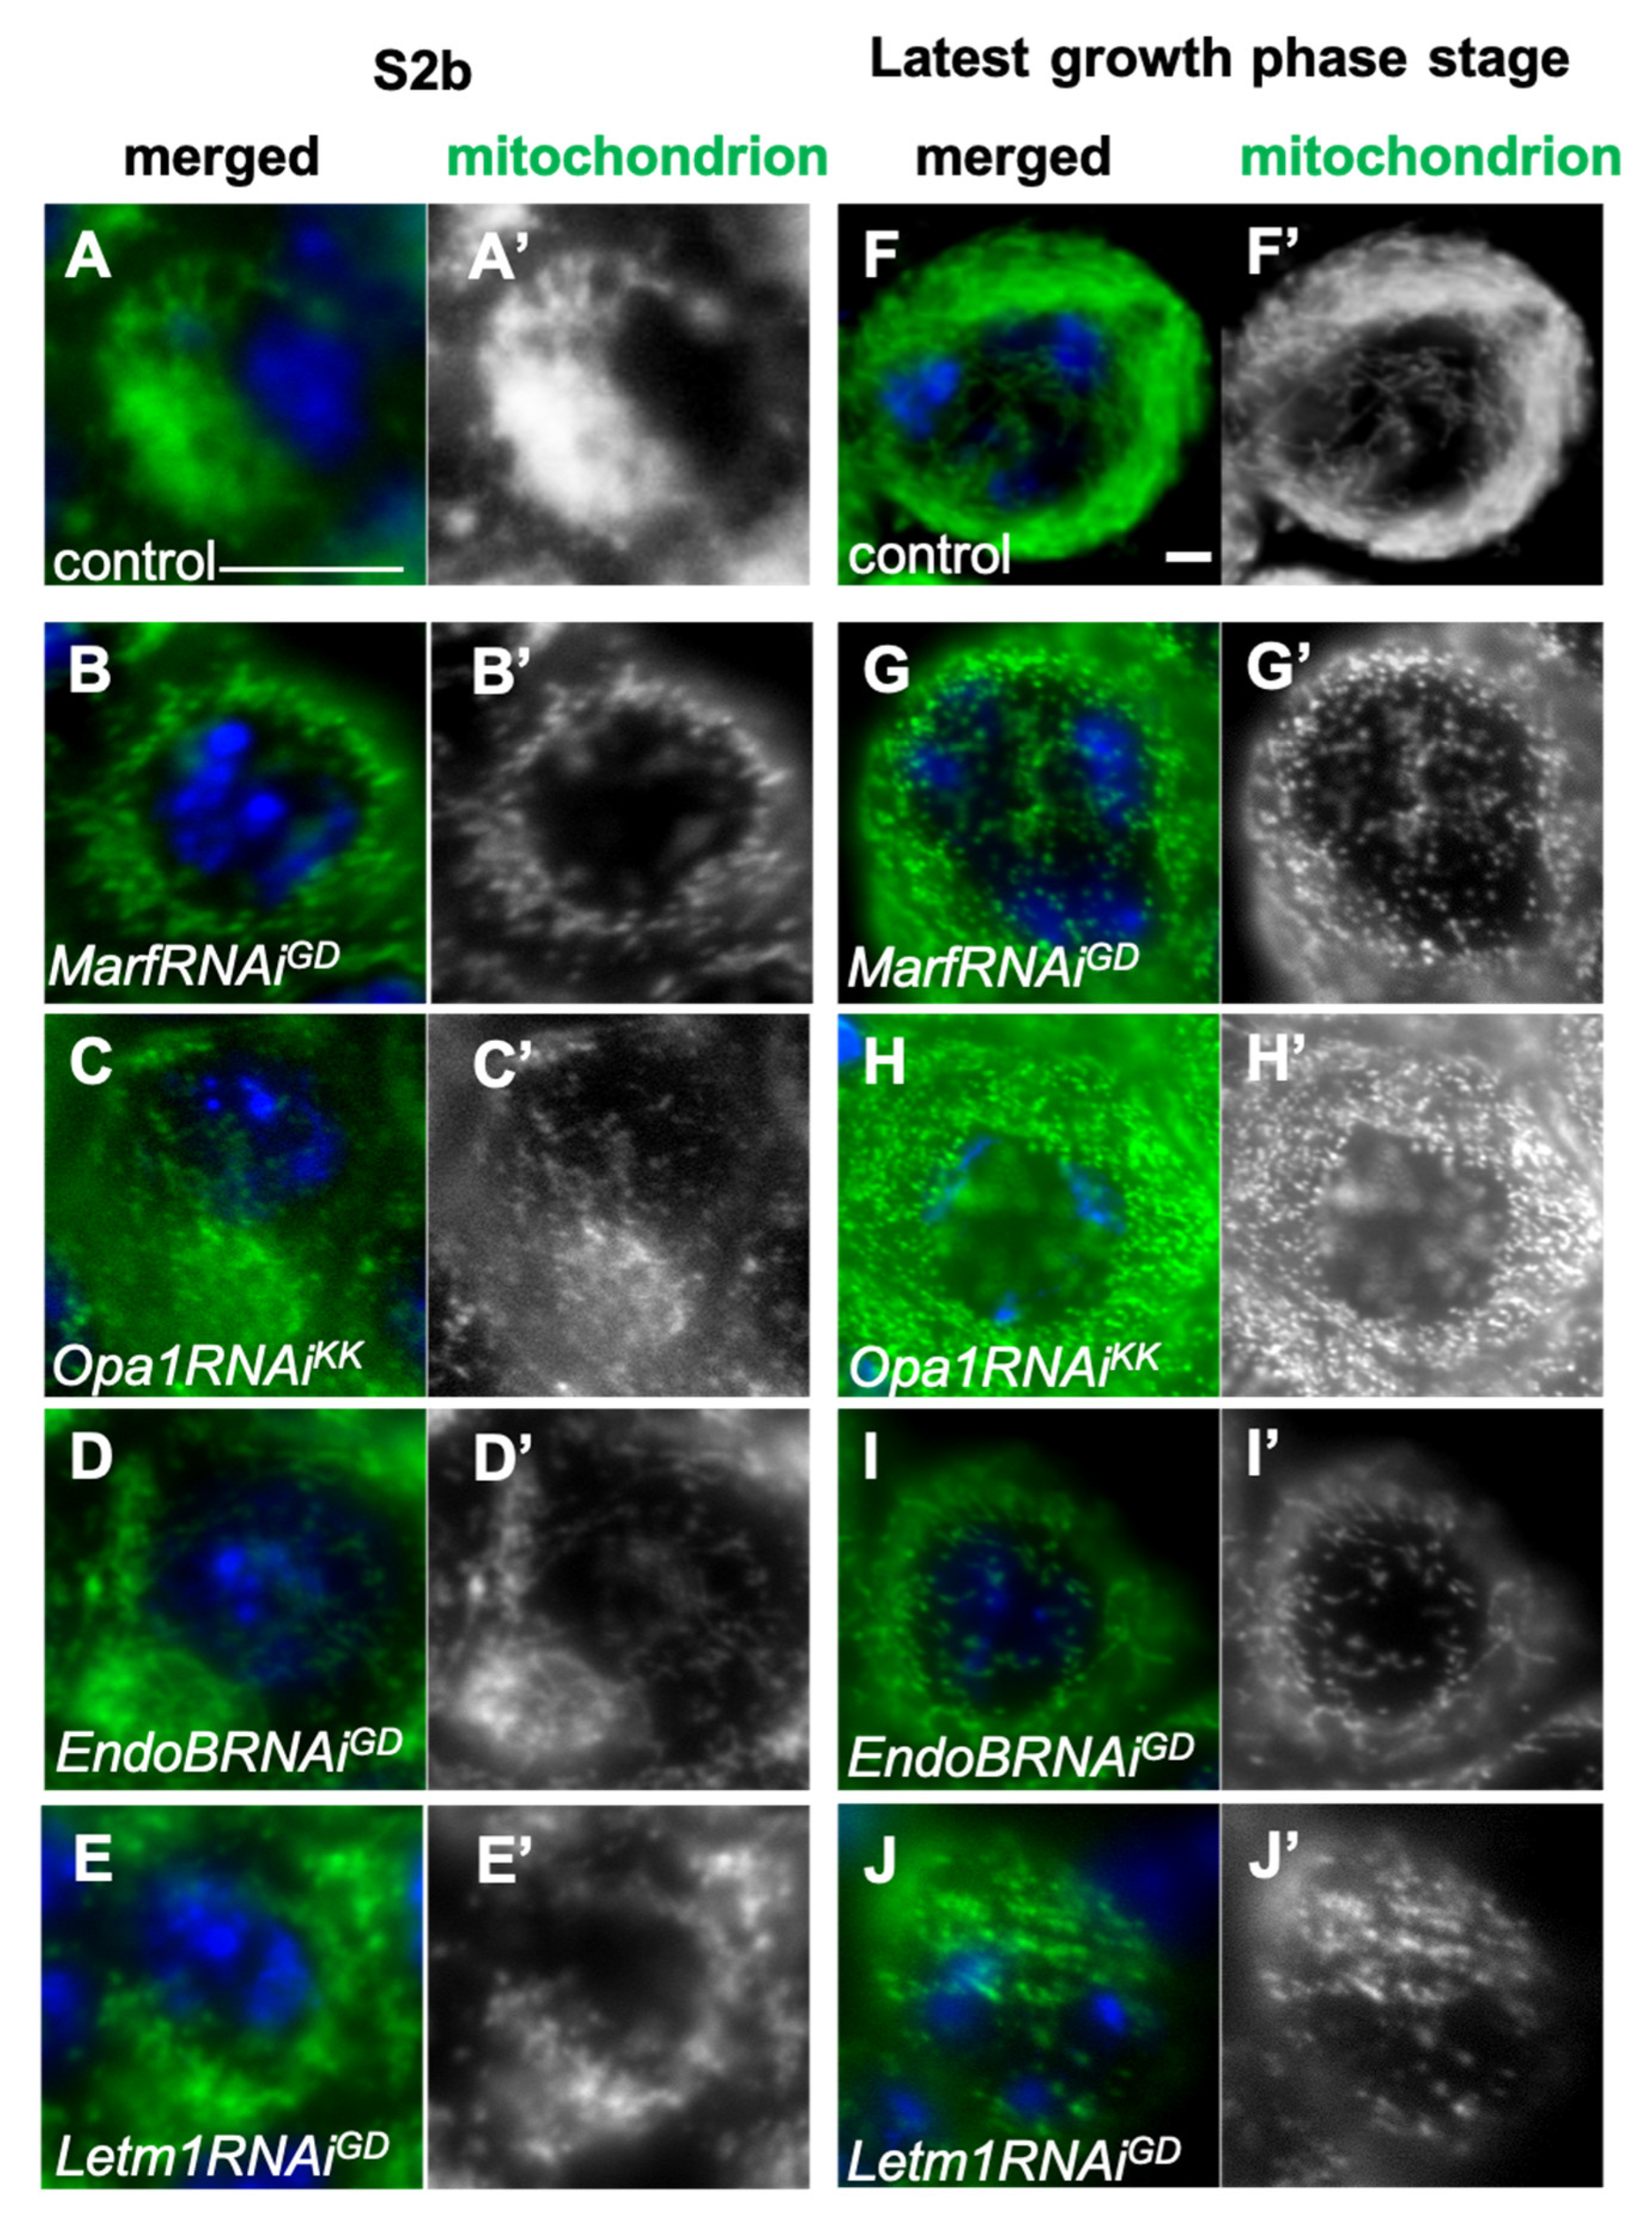
This study demonstrated that Marf, which is required for the fusion of the mitochondrial outer membrane, and Opa1, for the inner membrane fusion, are indispensable for the formation of elongated mitochondrial structures at S2b and S6 stages. This is consistent with the observation in Drosophila axons and heart tubes (Westermann, 2008; Trevisan et al., 2018). When the fusion/fission balance shifts toward fission due to a decrease in fusion, the network converts a higher number of smaller mitochondria in neurons (Trevisan et al., 2018; Jones and Naylor, 2022), because Drp1 counteracts with Marf and Opa1 (Westermann, 2008). When the fission factor, Drp1, was depleted using Drp1RNAi stock that enables effective knockdown, or when Drp1DN was ectopically expressed, no cells with remaining elongated mitochondrial structures were observed in the subsequent stages, where the elongated structure transforms into the shortened forms. Aldridge and colleagues reported that the phase-dark structures corresponding to mitochondria form a tight cluster in the spermatocytes homozygous for the lethal allele of Drp1 at the stage (Aldridge et al., 2007). The cells with Drp1RNAi and expression of Drp1DN may have retained more of the normal Drp1 than spermatocytes homozygous for the lethal mutation. The mitochondrial network structure is typical of normal cells before meiosis, so even if the cluster increases in cells with lower Drp1 activity, it may be challenging to find.
In addition to the well-known GTPases as mitochondrial dynamics factors, knockdown of EndoB, which is localized to the outer membrane (OMM), and Letm1 to the inner membrane affected the formation of the mitochondrial network. In mammalian cultured cells, inhibiting EndoB1 results in an abnormal structure where only the OMM elongates (Karbowski et al., 2004). Similarly, the mitochondrial morphology and cristae structures were disturbed in the Letm1RNAi mammalian cells (Nakamura et al., 2020). These two mitochondrial morphology proteins are also required for the formation of the mitochondrial network before meiosis in Drosophila.
On the other hand, regarding the roles of cytoskeletons for the mitochondrial morphological changes, it remains to be concluded in mammalian cells as conflicting results have been reported (Ishihara et al., 2003; Mattenberger et al., 2003; Jourdain et al., 2009; Cho et al., 2021; Jones and Naylor, 2022). Although mitochondria change their subcellular distribution along microtubules, we have not observed distinct morphological alterations in mitochondria elongation and network formation after microtubule depolymerization. However, we cannot rule out that there was not enough time for detectable morphological changes in mitochondria to occur. By contrast, F-actin may play a more critical role in maintaining the mitochondrial network structure. Further experiments are needed to verify the hypothesis.
3.3. Requirement of the Mitochondrial Network Formed via the Fusion Factors for the Cell Growth of Spermatocytes Before Meiosis
Knockdown of mitochondria fusion factors and mitochondrial morphology proteins, EndoB and Letm1, impaired ATP synthesis in mitochondria. In these spermatocytes, cell growth was inhibited. Similar growth inhibition was observed upon knockdown of blw, which encodes an ATP synthase. Therefore, ATP depletion caused by inhibiting fusion factors and morphology proteins may result in growth inhibition. ATP is synthesized more efficiently in elongated mitochondria formed via these factors (Mitra et al., 2009). It is reasonable to speculate that inhibition of this process led to a decrease in ATP levels and cell growth inhibition. In ATP-depleted cells, AMPK activity increases, and inhibiting Tsc2 in the insulin-like peptides (ILP)-induced pathway eventually reduces protein synthesis (Inoki et al., 2003). Activation of the signaling pathways by ILPs is required for cell growth before meiosis (Ueishi et al., 2009). Consistently, when mitochondrial dynamics are disturbed in yeast and mammalian cells, ATP synthesis ceases (Wong et al., 2000; Parone et al., 2008). Therefore, inhibition of elongated mitochondrial structures, formed via mitochondrial fusion factors and morphology proteins, may have led to a decrease in ATP levels, resulting in cell growth impairments in spermatocytes. In normal cells, elongated mitochondria were observed in the polar spermatocyte stage (S2b). During the subsequent apolar stage (S3–S5), the spermatocyte growth becomes most active. Before the stages, ATP required for these processes may be efficiently synthesized within the elongated network structure. Alternatively, it may not be simply due to a reduction in ATP levels. In mammalian cells harboring the fragmented mitochondria, oxidative phosphorylation decreases while ROS production increases (Lunova et al., 2024). ROS may also influence the progression of the growth phase. Further investigation is needed to clarify this speculation.
3.4. Elongated Mitochondria Networks Are Transferred to Daughter Cells While Maintaining the Structures, Depending on Microtubules and F-Actin in Male Meiosis
In the interphase of mammalian cultured cells, mitochondria form an interconnected tubular network, and their membrane potential increases from G1 to S phase and at the G2/M phase (Mitra et al., 2009). Subsequently, mitochondria undergo fission before the M phase. This is assumed to facilitate the equal partition of mitochondria (Labbé et al., 2014). In contrast, we demonstrated that the mitochondrial network structure is established in spermatocytes and is transferred while maintaining its structure in meiosis. Compared to the shortened forms (where ATP synthesis is suppressed), the fused forms allow ATP to be supplied when it is needed. This is beneficial during the ATP-dependent dynamic stages of cell growth phase and subsequent M-phase. Additionally, the interconnected structure may facilitate equal distribution of the organelles during meiosis. After that, the organelles quickly cluster together to create Nebenkern. In mitosis, even if one of the two daughter cells receives an insufficient number of mitochondria, they can be amplified during the next S phase. In contrast, meiosis lacks a subsequent cell cycle to compensate for the insufficiency. To prevent this, a control mechanism might exist that guarantees equal mitochondrial partitioning.
Microtubules and F-actin play indispensable roles in transporting mitochondria to specific sites in mitotic cells and neurons (Chung et al., 2016; Lawrence et al., 2016). Consistently, mitochondria are transferred into two daughter cells in male meiosis, while being closely associated with aster and central spindle microtubules (Ichihara et al., 2007, live analysis in this study). F-actin also plays an indispensable role in accumulating these organelles next to the nucleus at the S2b, and in moving along microtubules and clustering at the cell equator during meiosis. The roles of these cytoskeletons in transporting mitochondria are consistent with findings in mammalian cells (Madan et al., 2022). Unexpectedly, even after microtubules were depolymerized, the mitochondrial network was maintained, and no significant changes in its distribution were observed in meiosis. This may be inconsistent with reports on mitosis in mammalian cells (Jones and Naylor, 2022). In Drosophila male meiosis, once the mitochondrial network is formed, the structure may be maintained without disintegrating even in the absence of microtubules. Each mitochondrion in the network may be interconnected with others during meiosis. Alternatively, another intracellular structure may bundle mitochondria. F-actin may play a significant role in the clustering and movement of the organelles.
3.5. The Establishment of the Mitochondrial Network Structure, Formed via Fusion Factors and Morphology Proteins, Plays Important Roles in the Execution of Male Meiosis
This study demonstrated that the network structure composed of elongated mitochondria is established before Drosophila male meiosis and is transferred to daughter cells, maintaining their network structures. This distribution differs from that in mitosis. When we depleted the fusion factors and the morphology proteins, EndoB and Letm1, we observed abnormal spermatid cysts consisting of only 16 cells. This phenotype has been observed in other mutants, in which the first and second meiosis do not occur (White-Cooper et al.,1993; Tanabe et al., 2017; Okazaki et al., 2020). The inhibition of fusion factors results in a shift in the fission/fusion balance toward fission, and the resultant inability to form a network structure leads to fewer meiotic cells. On the other hand, in testes where the fission factor Drp1 was down-regulated, but not in testes with Drp1 knockdown, abnormal spermatid cysts derived from a single meiosis were also observed, albeit at a lower frequency. Therefore, the fission factor may also play a role in male meiosis through maintaining the fusion/fission balance.
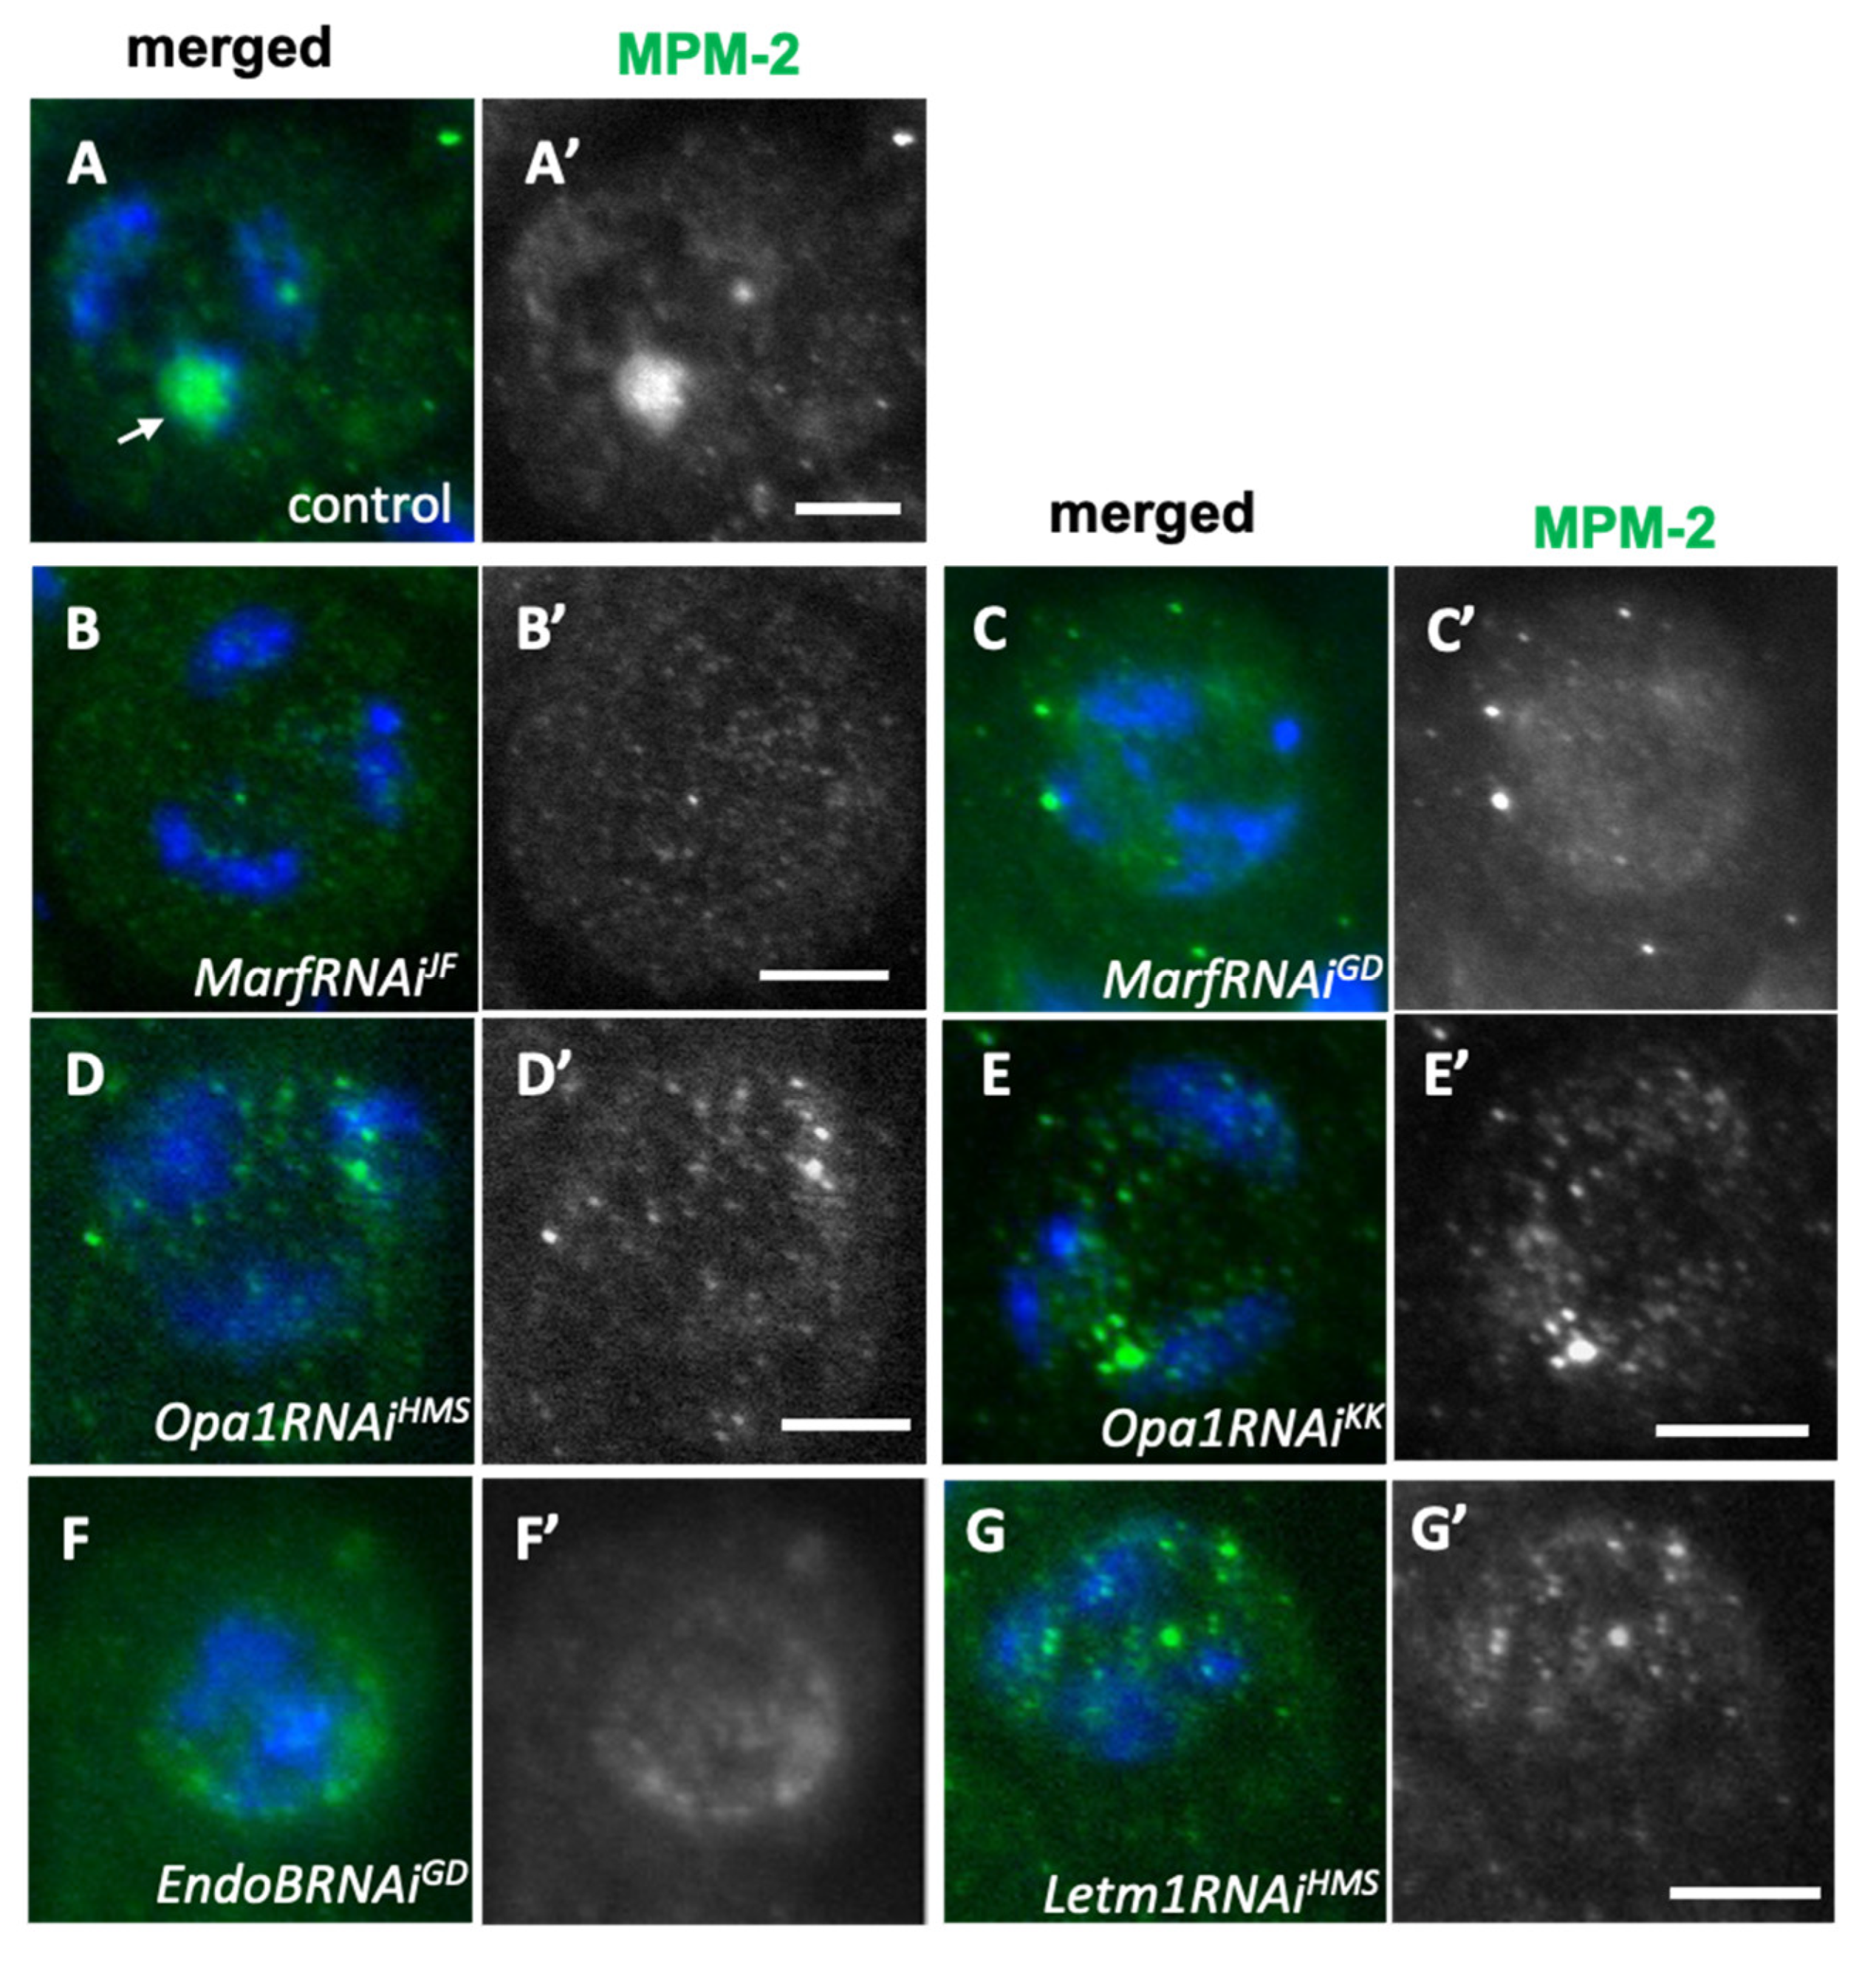
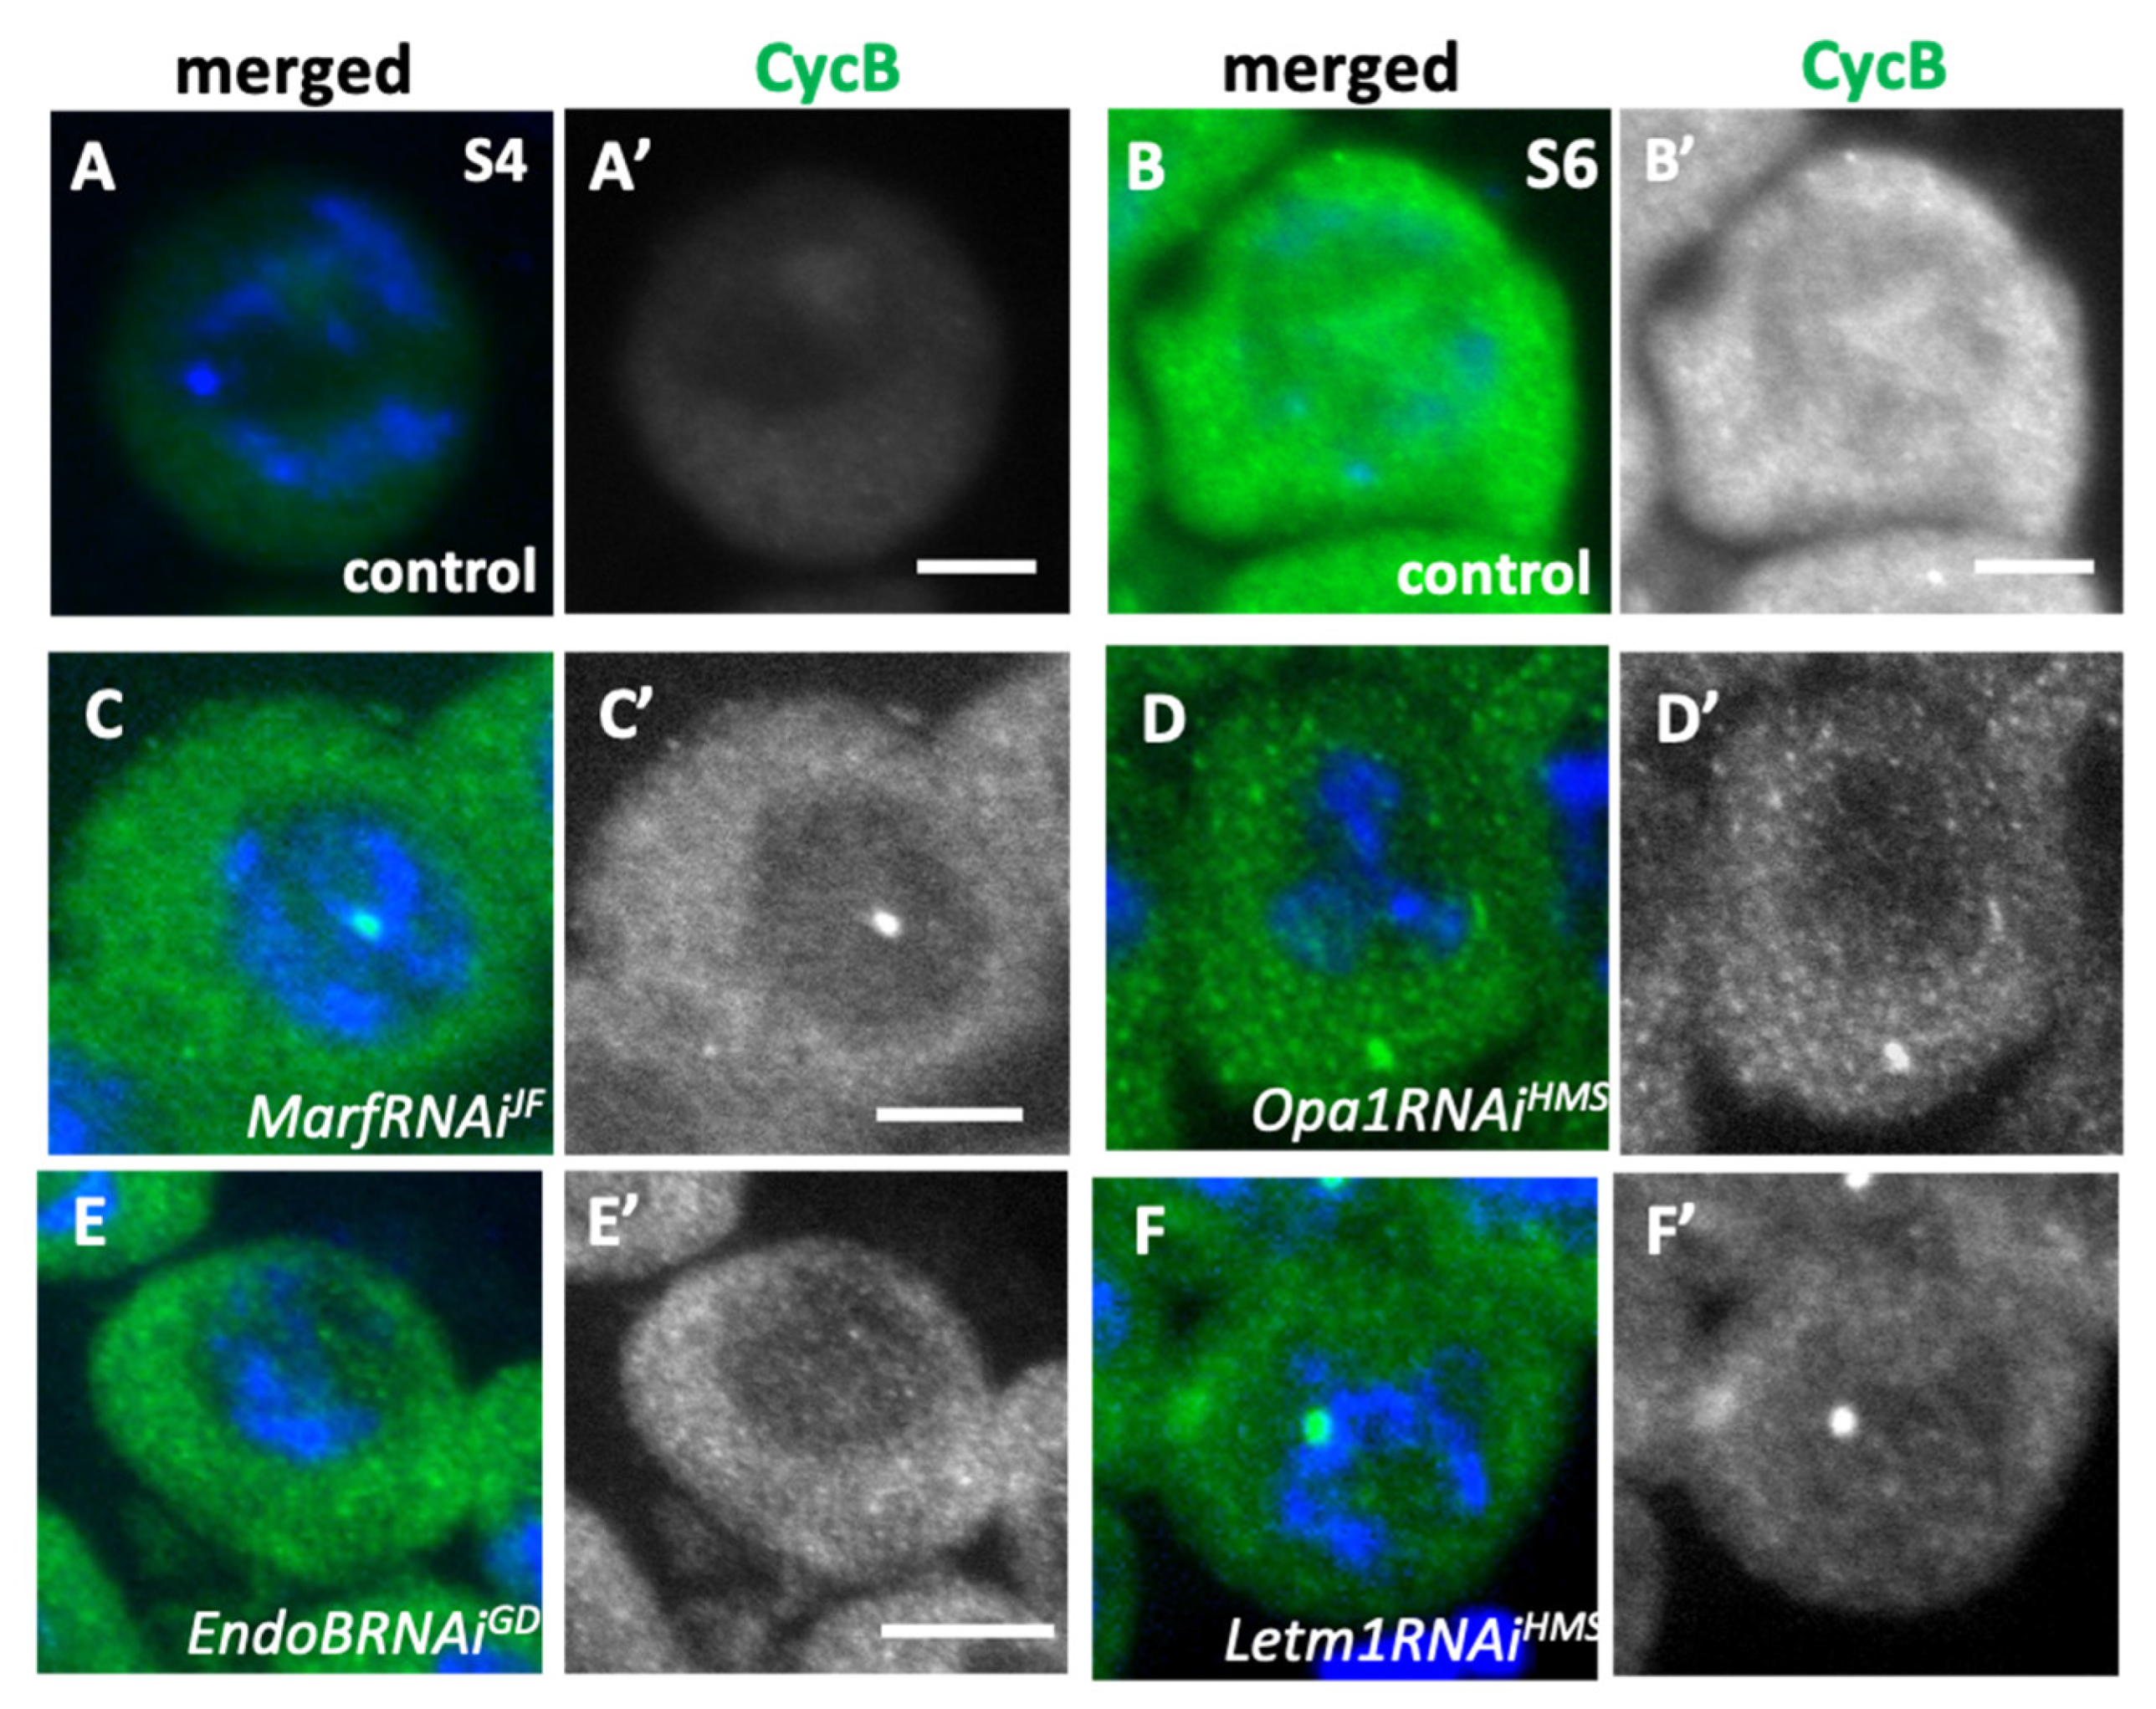
Moreover, these abnormal cells in spermatid cysts, consisting of 16 or 32 cells, possessed two or more nuclei smaller than nuclei containing diploid chromosome complements. In the absence of meiosis I initiation, chromosome segregation does not happen (White-Cooper et al., 1993), and multiple nuclei should not form. This phenotype bears a striking resemblance to a mutant phenotype in which chromosome separation commences, yet is abruptly halted during anaphase, consequently resulting in the formation of nuclei at the sites of the chromosomes (Tanabe et al., 2019). When the elongated structure is disrupted, meiosis initiates but may fail to complete at the appropriate time. In primary spermatocytes with knockdown of factors involved in mitochondrial dynamics, the CycB accumulation at the onset was less pronounced than in controls. No nuclear transport of CycB, and consistently, no prominent anti-MPM2 immunostaining was observed. In the knockdown cells, the onset of meiosis may have been delayed compared to controls. To verify the possibility, it is necessary to observe meiotic cells; however, we were unable to find typical meiotic cysts. In mouse oocytes, the Drp1-knockdown also affects the restart of meiosis (Udagawa et al., 2014). Considering this consistent finding, we speculate that the inhibition of mitochondrial network formation led to the absence of CycB expression. The timing of CycB expression is determined by transcriptional control and the release of mRNA translation inhibition (Baker et al., 2023). In future studies, it will be important to investigate whether Rbp4 and Fest proteins (Baker et al., 2015), which regulate CycB translation, are affected by the knockdown of the fusion factors. In the ATP synthetase-knockdown spermatocytes, meiosis is completed (Sawyer et al., 2017, this study). Therefore, impaired ATP synthesis in mitochondria is not a direct cause of failure and abnormalities in meiosis. This study does not clearly explain why the knockdown of the factors involved in mitochondrial morphological changes impacts chromosome segregation during meiosis. This is a limitation of the current research. Since mitochondria are essential organelles in spermatogenesis, not only in Drosophila but also in mammals, our findings can provide important insights into the roles of mitochondrial dynamics in cell division and differentiation of male germ line cells.
4. Materials and Methods
4.1. Drosophila Stocks
w1118 (w) was used as a normal control stock. For the silencing of mRNAs for dynamic factors for mitochondria and the related proteins, the following UAS-RNAi stocks were used; P{GD11094}v40478 (#40478) (hereinafter referred to as UAS-MarfRNAiGD)(from Vienna Drosophila Resource Center (VDRC), Vienna, Austria) (Poole et al., 2008), P{JF01650}(UAS-MarfRNAiJF) (from Bloomington Drosophila Stock Center (BDSC)(Indiana University, Bloomington, IN, USA))(Ratnaparkhi, 2013), P{KK106290}VIE-260B(v107599)(UAS-Opa1RNAiKK)(v106290)(from VDRC)(Shin et al., 2024), P{HMS00349}(UAS-Opa1RNAi) (from BDSC)(Yang et al., 2013), UAS-Drp1 RNAi JF02762 (UAS-Drp1RNAiJF)(Sênos Demarco, et al., 2019), P{GD2208}(UAS-Letm1RNAiGD) (v6662)(from VDRC) (Schnorrer, et al., 2010), P{TRiP.HMS01644} (UAS-Letm1RNAiHMS)(from BDSC)(Li et al., 2020), P{GD14693}(UAS-EndoBRNAiGD)(v29293)(from VDRC)(Zhu, et al., 2013), P{KK107885}VIE-260B}(UAS-EndoBRNAiKK) (v104712 from VDRC). To induce ectopic expression of dsRNAs against the relevant mRNAs, we used P{UAS-Dcr2}; P{bam-GAL4::VP16} (hereinafter abbreviated as bam-GAL4) for spermatocyte-specific RNAi experiments (Kitazawa et al., 2012). Thus, spermatocytes carrying UAS-XRNAi#, P{UAS-Dcr2} and P{bam-GAL4::VP16}, in which the relevant mRNA for the gene X is depleted, are denoted as XRNAi#. As a control, F1 males between bam-Gal4 and wild-type (bam>+) were used. To visualize microtubules, P{Ubi-tub56D-GFP} (GFP-tubulin) was used (Inoue et al., 2004). We used M{UAS-CycB.ORF.3xHA} (#F001154, Fly-ORF; University of Zurich, Zurich, Switzerland) for the overexpression of Cyclin B (Yamazoe et al., 2023). For a downregulation of Drp1, its dominant negative mutant protein was also induced using P{UAS-Drp1K38A}(UAS-Drp1DN)(a gift from J. Chung (Seoul National Univ.)(Park, et al., 2009). P{bam-GAL4::VP16} was used as a Gal4 driver for spermatocyte-specific induction of gene expression (Hayashi et al., 2016). sa (Lin et al., 1996, #1762, BDSC) and twe (White-Cooper et al., 1993, #4274, BDSC) mutants, whose male meiosis does not take place, were used as controls. All Drosophila stocks were maintained on standard cornmeal food at 25 °C as previously described (Oka et al., 2019). To maintain the stocks and obtain adults for aging-related experiments, the following standard cornmeal fly food was prepared: Per liter of water, 40 g of dried yeast (Asahi Group, Tokyo, Japan), 40 g of corn flour (Nippun, Tokyo, Japan), 100 g of glucose (Kato Chemical, Aichi, Japan), and 7.2 g of agar powder (Matsuki Agar, Nagano, Japan) were added, and 5 mL of a 10% methyl para hydroxybenzoate solution and 5 mL of propionic acid (Tokyo Kasei Kogyo, Tokyo, Japan) were added to 1L of the fly food. For an efficient induction of GAL4-dependent gene expression, individuals carrying the GAL4 driver gene and UAS transgenes were raised at 28 °C. Other experiments and stock maintenance were conducted at 25 °C.
4.2. Preparation of Post-Meiotic Spermatid Cysts
To estimate whether two consecutive meiotic divisions were executed correctly, we observed nuclei in post-meiotic spermatids at the onion stage just after the completion of meiosis II under phase-contrast microscopy, as previously described (Inoue et al., 2004; Tanabe et al., 2017). A pair of testes from pharate adults or newly eclosed adult flies (within 1 day old) was dissected to isolate spermatocyte cysts in Testis buffer (183 mM KCl, 47 mM NaCl, 10 mM EDTA, pH 6.8) and covered with a coverslip (Matsunami Co., Osaka, Japan) to flatten the cysts. To observe spermatids under a phase-contrast microscope, the cysts collected from the testes were mildly flattened in Testis buffer under a cover slip. After removing the coverslips, we transferred them into 100% methanol for 3 min at −30 °C to fix the samples. Subsequently, they were rehydrated in PBS (137.0 mM NaCl, 2.7 mM KCl, 10.1 mM Na2HPO4·12H2O, 1.8 mM KH2PO4), and then the DNA was stained with DAPI. Samples were observed using a phase-contrast microscope (Olympus, Tokyo, Japan, model: IX81). Normal spermatocytes undergo two meiotic divisions to form 64 spermatocytes simultaneously. The resultant spermatid possesses a one-to-one ratio of nucleus to mitochondrial aggregates, known as Nebenkerns (Fuller, 1993; Tanabe et al., 2017).
4.3. Drug Administration to the Testis Cells
To inhibit microtubule polymerization, testes from young adult flies were dissected in 50 µM/ml colchicine (# W01W0103-0385 (WAKO Pure Chemicals, Osaka, Japan)) in testis buffer and incubated for 15 min before fixation. For inhibition of actin-filament polymerization, testes from adult flies were dissected in 100 µM latrunculin A in testis buffer for 45 min before fixation. Testes squashes to evaluate onion-stage spermatids were performed as described above and viewed under phase-contrast microscopy.
4.4. Immunostaining of Testis Cells
Testis cells, collected from the testes as described above, were fixed in ethanol at −30 °C for 10 min, followed by fixation in 3.7% formaldehyde for 7 min. The slides were permeabilized in PBST (PBS containing 0.01% Triton-X) for 10 min and blocked with 10% normal goat serum in PBS. The following primary antibodies were used at the dilutions described: MPM-2 antibody (05-368, Sigma-Aldrich, St. Louis, MO, USA), 1/200; anti-Complex V alpha-subunit monoclonal antibody (#439800, Thermo Fisher, Waltham, MA, USA), 1/400; anti-Cyclin B monoclonal antibody (Developmental Studies Hybridoma Bank, Iowa City, IA, 1/200. After incubating with the primary antibody overnight at 4 °C, the fixed samples were repeatedly washed in PBS and subsequently incubated with anti-mouse or anti-rabbit IgG conjugated with Alexa Fluor 488 or 555 (Thermo Fisher, Waltham, MA, USA). After washing in PBS, they were mounted with VECTASHIELD Mounting Medium with DAPI (Vector Laboratories, Burlingame, CA, USA) and observed under IX81 fluorescent microscope (Olympus, Tokyo, Japan). Image acquisition was controlled using MetaMorph software version 7.6 (Molecular Devices, SAN Jose, CA, USA).
4.5. ATP Assay
Ten pairs of testis were homogenized in the cell lysis buffer (10 mM Tris (pH 7.5), 100mM NaCl, 1 mM EDTA, 0.01% Triton X-100) on ice. These homogenates were immediately frozen in liquid nitrogen and subsequently inactivated at 99 °C for 3 min. After centrifugation at 6010× g for 10 min, the ATP levels were quantified in the supernatants using the ATP Determination Kit (#A22066, Invitrogen, Waltham, MA, USA). The fluorescence intensity was measured using a luminometer (Lumat LB9507, Berthold Technologies, Bad Wildbad, Germany). Based on the standard curve created, the ATP levels of the samples were determined. Protein concentration was measured using the Qubit 2.0 Fluorometer (Invitrogen, Waltham, MA, USA) and calculated as ATP [mM]/Protein [mg].
4.6. Transmission Electron Microscope Observation of Adult Testes
Abdomens of young male flies (within two days after eclosion) were placed in fixative solution (4% paraformaldehyde, 2% glutaraldehyde in 0.1 M cacodylate buffer, pH = 7.4), as previously reported (Ozaki et al., 2022). The fixed specimens were washed with 0.1 M cacodylate buffer and treated with 2% osmium tetroxide in 0.1 M cacodylate buffer. The specimens were dehydrated by consecutive incubation in 50%, 70%, 90%, and 100% ethanol. After the specimens were infiltrated with propylene oxide and put into a 7:3 mixture of propylene oxide and resin (Quetol-812, Nisshin EM Co., Tokyo, Japan), they were transferred to new resin and polymerized. The specimens in the polymerized resins were ultrathin sectioned at 70 nm using Ultracut-UCT (Leica, Vienna, Austria) and mounted on copper grids. After staining with 2% uranyl acetate, the sections were washed with distilled water and stained with lead stain solution (Sigma-Aldrich Co., Tokyo, Japan). The grids were observed using a transmission electron microscope (JEM-1400Plus, JEOL Ltd., Tokyo, Japan) at 100 kV acceleration voltage and photographed with a CCD camera (EM-14830RUBY2, JEOL Ltd., Tokyo, Japan).
4.7. Statistical Analysis
Each dataset comparing the control and each knockdown was statistically assessed using Student’s t-test, as described in a previous study (Azuma et al., 2021). Data were considered significant at p-values < 0.05. Statistical analyses were performed using Excel (version 16.78.3, Redmond, WA, USA) and GraphPad Prism 9 (GraphPad Software, San Diego, CA, USA).
Figure 1.
Differences in mitochondrial morphology between spermatogonia undergoing mitosis and spermatocytes before and during the first meiotic division in Drosophila. (A-H) Immunostaining of spermatogonia and spermatocytes expressing GFP-Tubulin (green in A-M, white in A”-M”) using Complex V alpha-subunit antibody (red in A-M, white in A’-M’). Blue in A-M indicates DNA. (A-C) Spermatogonia undergoing mitosis (A, B) and in interphase (C). Mitochondria exhibit a granular morphology (arrowheads) at mitosis, or slightly larger clusters (arrow) in interphase. (D-F) Spermatocytes during the cell growth phase. (D) A spermatocyte at the S2b phase, in which elongated mitochondria are formed (arrows) and clustered next to the nucleus. (E) A spermatocyte at the S4. Mitochondria undergo fission and spread within the cytoplasm. (F) A spermatocyte at the S5-6, in which the mitochondrial network structure is beginning to reform (inset: a magnified view of the region enclosed by a square in F’). (G-K) The primary spermatocytes undergoing meiotic division. (G) A prophase I cell, in which the elongated mitochondrial network structures (arrows) are maintains. (H) A metaphase I cell. Mitochondria accumulate near the plus ends of the aster microtubules while maintaining the elongated structure (arrows). (I, J) Anaphase I cells. Elongated mitochondria (arrows) are localized on the central spindle microtubules. From telophase I (K) to cytokinesis (L), mitochondria are equally distributed to the daughter cells from central spindle microtubules. (L) They diffuse into the cytoplasm as the midbody microtubules disintegrates. (M) Upon completion of the second meiotic division, mitochondria form single aggregate, Nebenkern. Insets in I’, K’, and L’: magnified views. Bars: 10 µm.
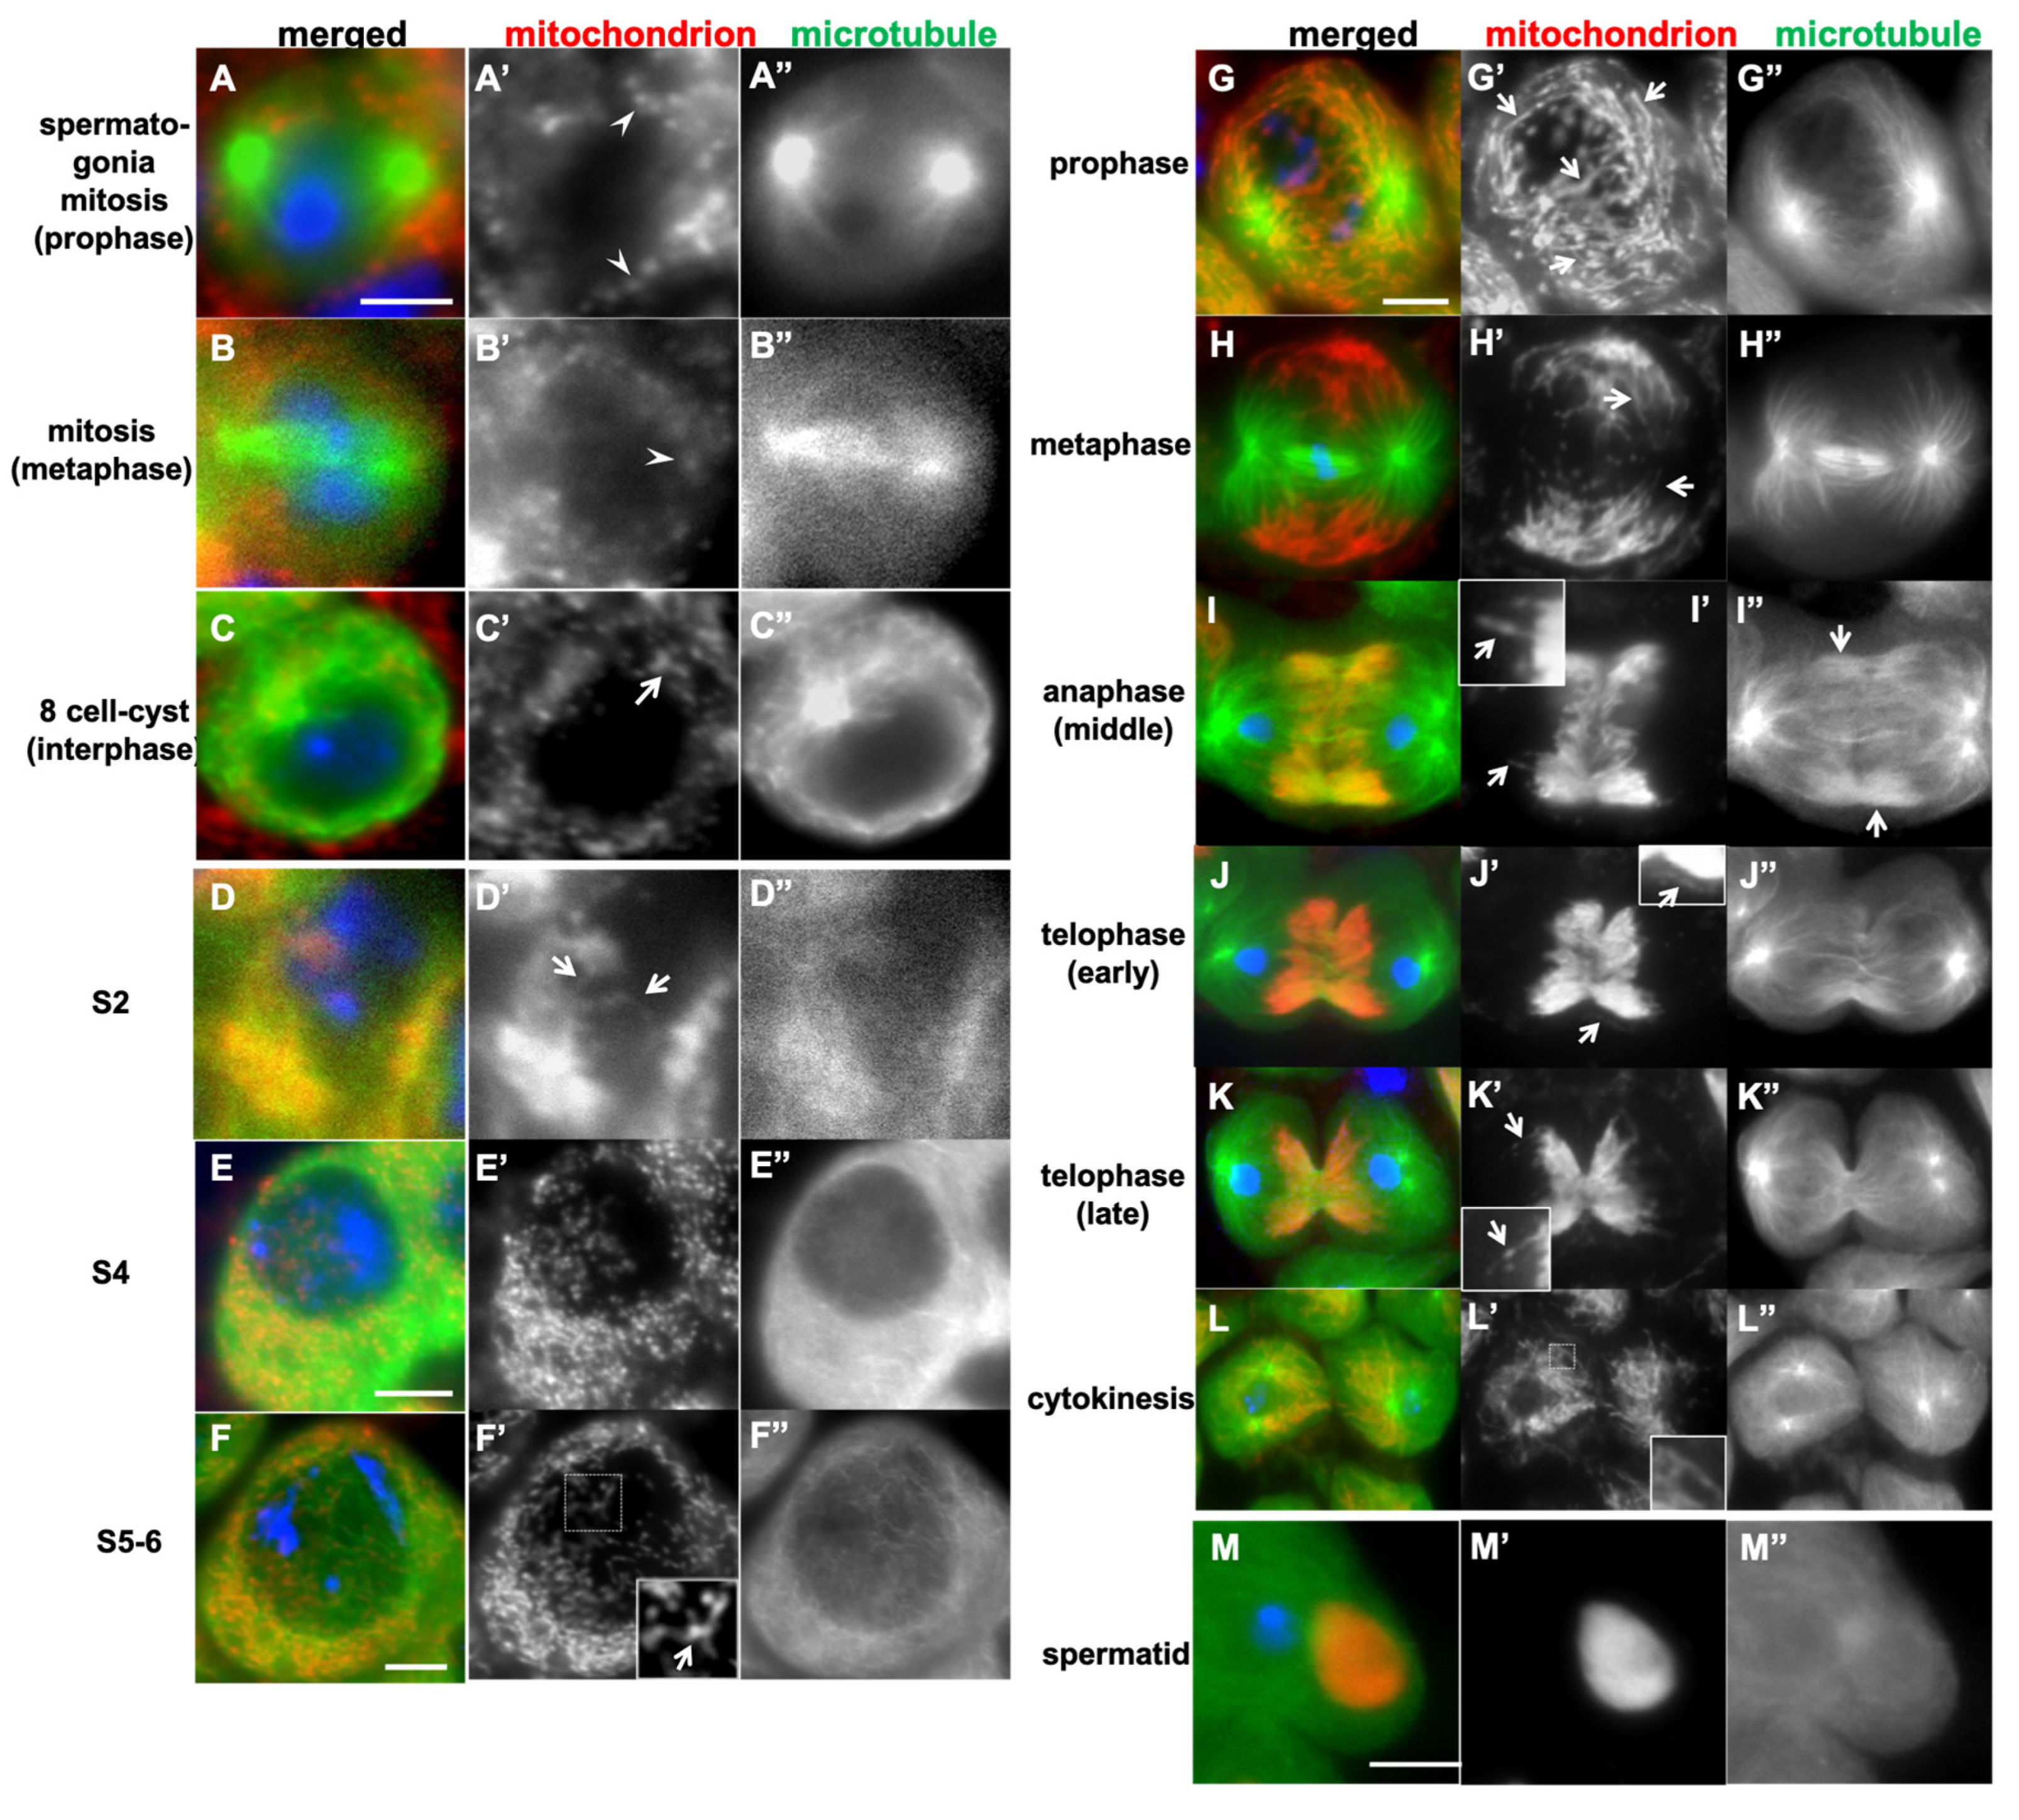
Figure 2.
The distribution of mitochondria associated with microtubules in primary spermatocytes was disrupted by colchicine treatment.(A- G) Immunostaining of colchicine-treated primary spermatocytes with anti-Complex V alpha-subunit antibody to visualize mitochondria (red in A-G, white in A’-G’). The cells expressing GFP-Tubulin (green in A-G, white in A”-G”) were used to confirm the microtubule depolymerization. Blue in A-H indicates DNA. (A) A colchicine-treated spermatocyte at S2b, in which the elongated mitochondria (arrow) are maintained. (B) Spermatocytes at the S6 stage, in which the elongated mitochondria are maintained after colchicine treatment (arrows). (inset: enlarged view of the area enclosed by a square). (C-G) Mitochondria in colchicine-treated spermatocytes undergoing meiosis I at prophase-like (C) and metaphase-like (D) stages. Note that mitochondria remained localized in the cytoplasm while maintaining their network structure (arrows in C’). (E, F) Cells that have passed through metaphase I/anaphase I before colchicine treatment. Note that the alignment of mitochondria along microtubules and orientations toward the microtubule-organizing center is lost (arrows in F’). (G) Telophase I cells in which elongated mitochondrial structures are maintained between sister nuclei. Bars: 10mm.
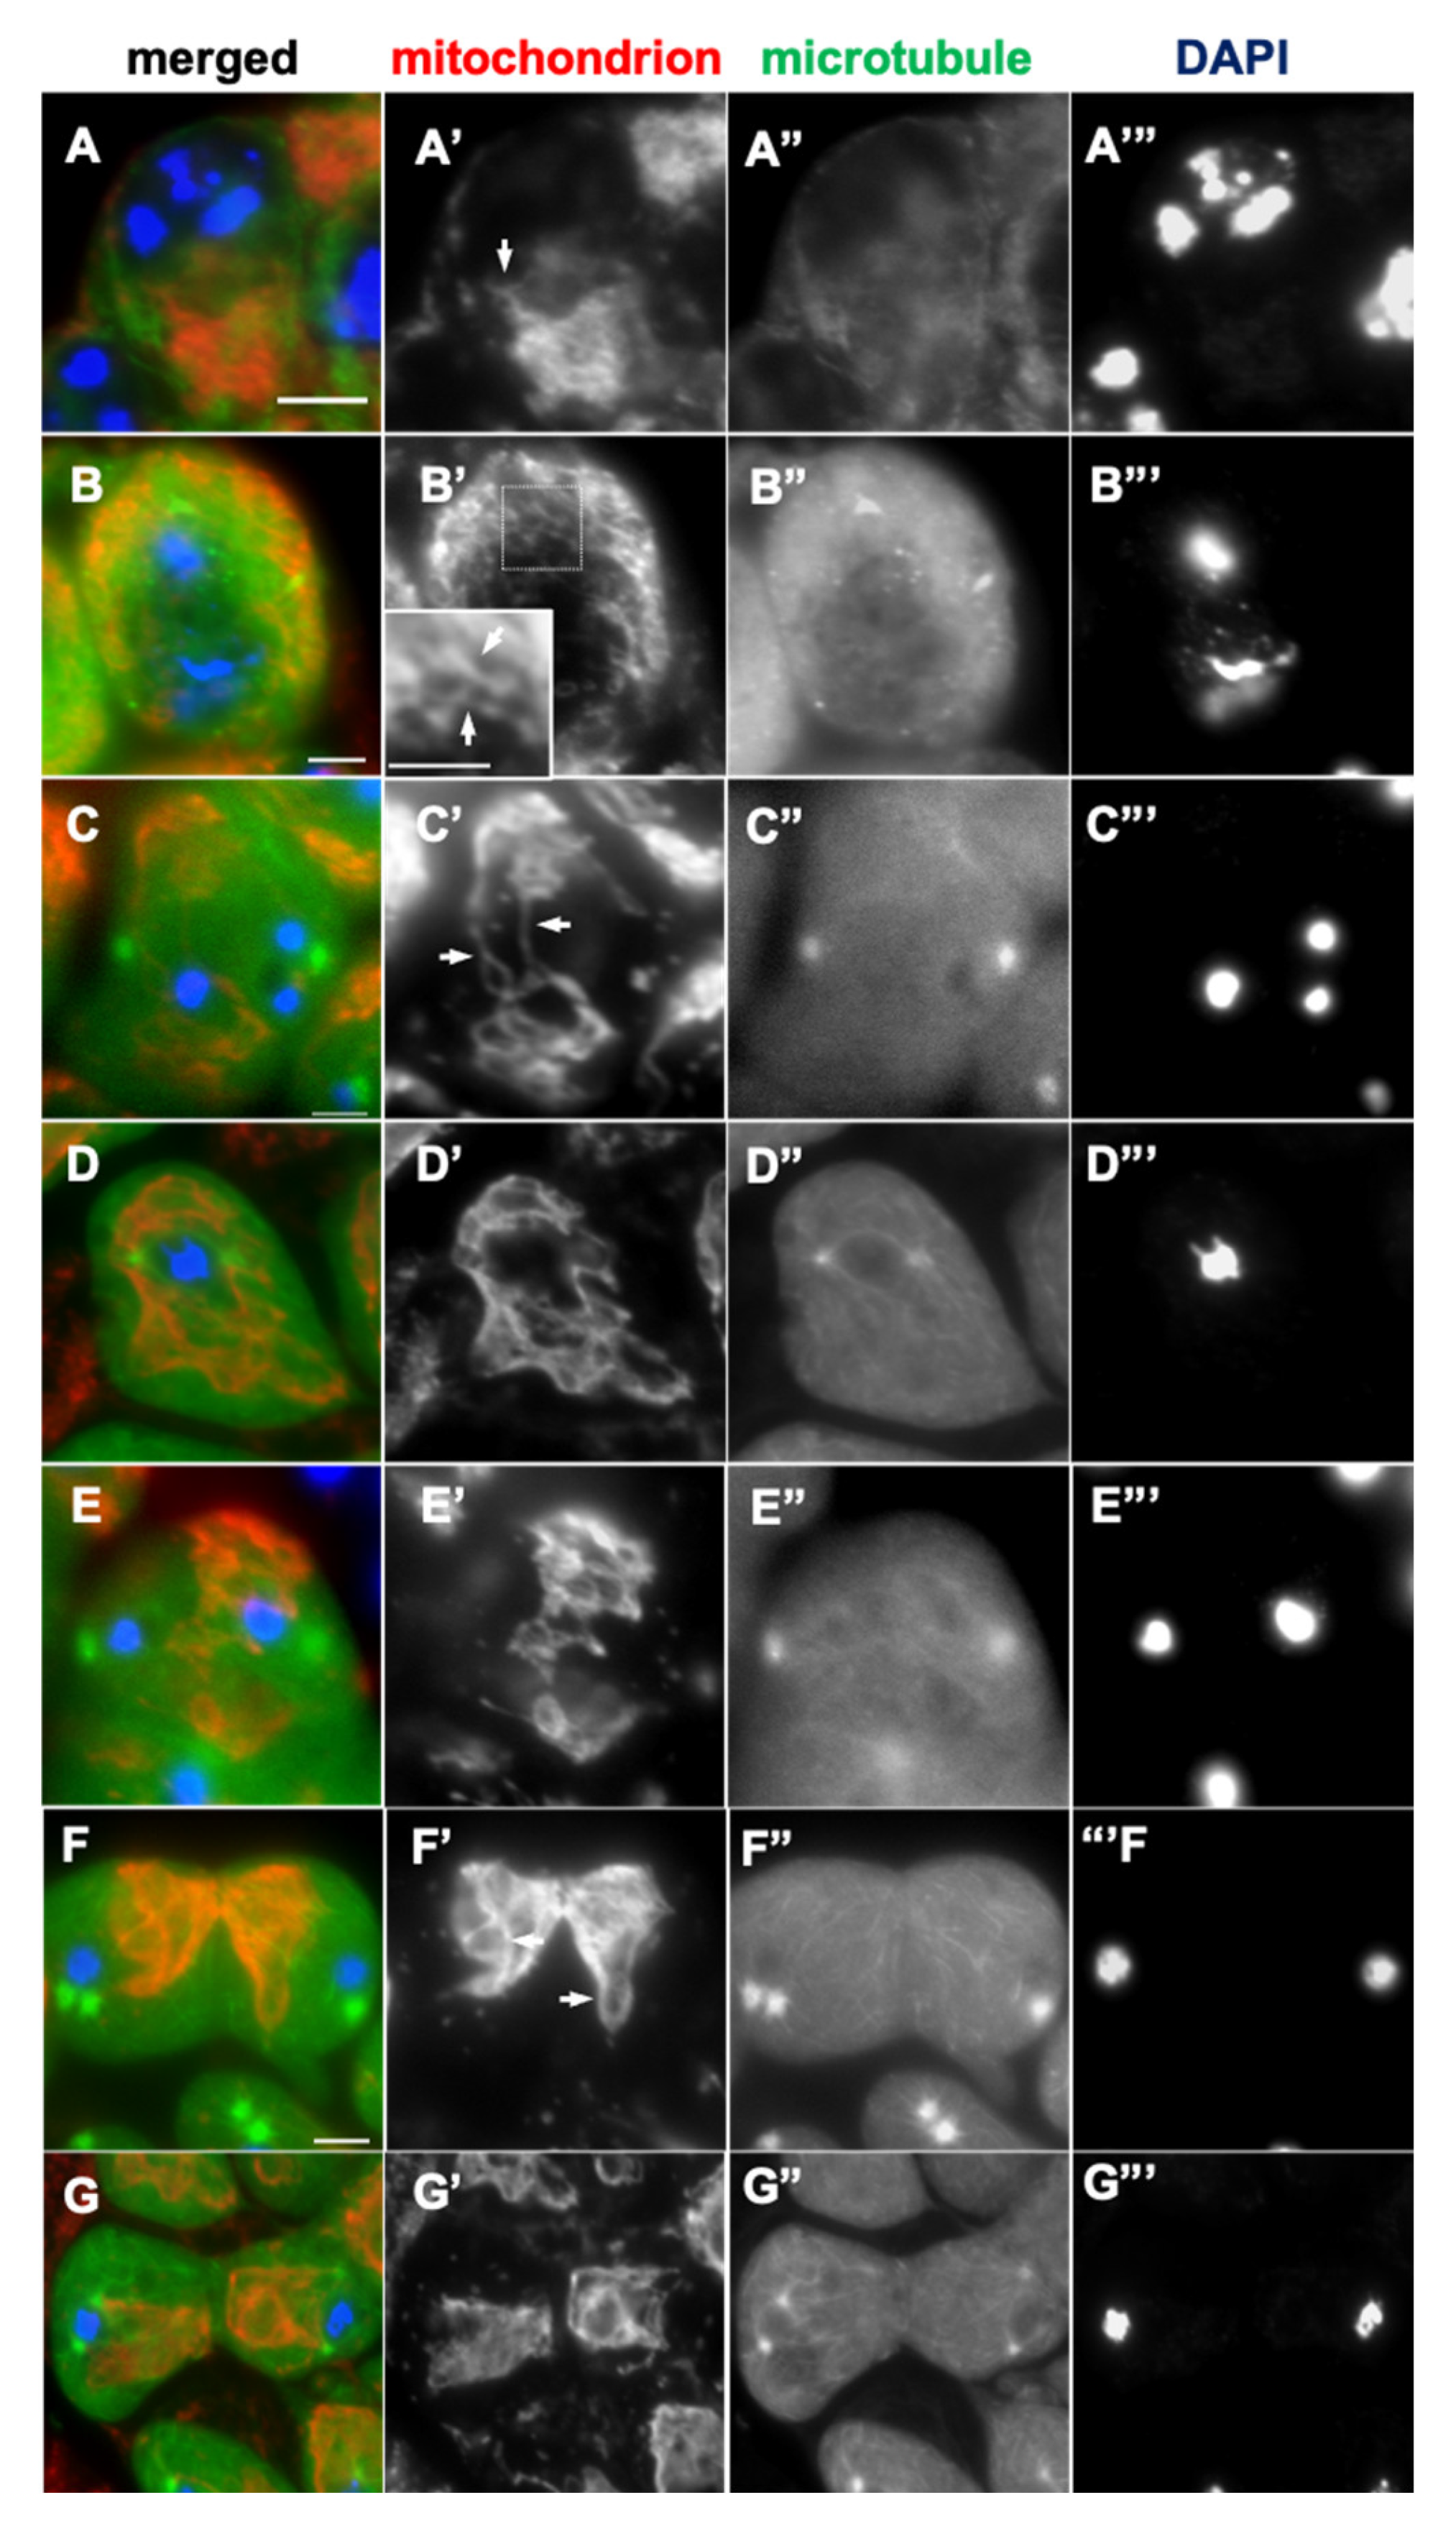
Figure 3.
A close association of the mitochondria with F-actin in spermatocytes at S2b of the growth phase and in early spermatids, and the perturbation of the distribution after Latrunculin A treatment. (A, B) Anti-Complex V alpha-subunit immunostaining to observe colocalization of mitochondria (green in A, B, white in A’, B’) with F-actin, which was visualized by phalloidin staining (red in A, B, white in A”, B”) of early spermatocytes at S2b (A) and spermatids at onion stage (B). The arrow indicates elongated mitochondria in the S2b cell. A mitochondrial aggregate (Nebenkern) colocalizes with F-actin in the spermatid (B). (C-H) Mitochondria in the cells treated with Latrunculin A were visualized by the immunostaining (green in C-H, white in C’-H’). DNA staining by DAPI (blue in C-H, white in C”-H”). (C) Mitochondria in a spermatocyte at the S2b. Note that they are not elongated, and some of them do not stay next to the nucleus. (D) Shortened granular-like mitochondria in the spermatocyte at S6. (E-H) Mitochondria in Latruncurin A-treated cells undergoing meiosis I, at metaphase I (E), anaphase I (F), telophase I (G), and Nebenkern exhibiting the heterogeneous staining in spermatids (H). Bars: 10 µm.
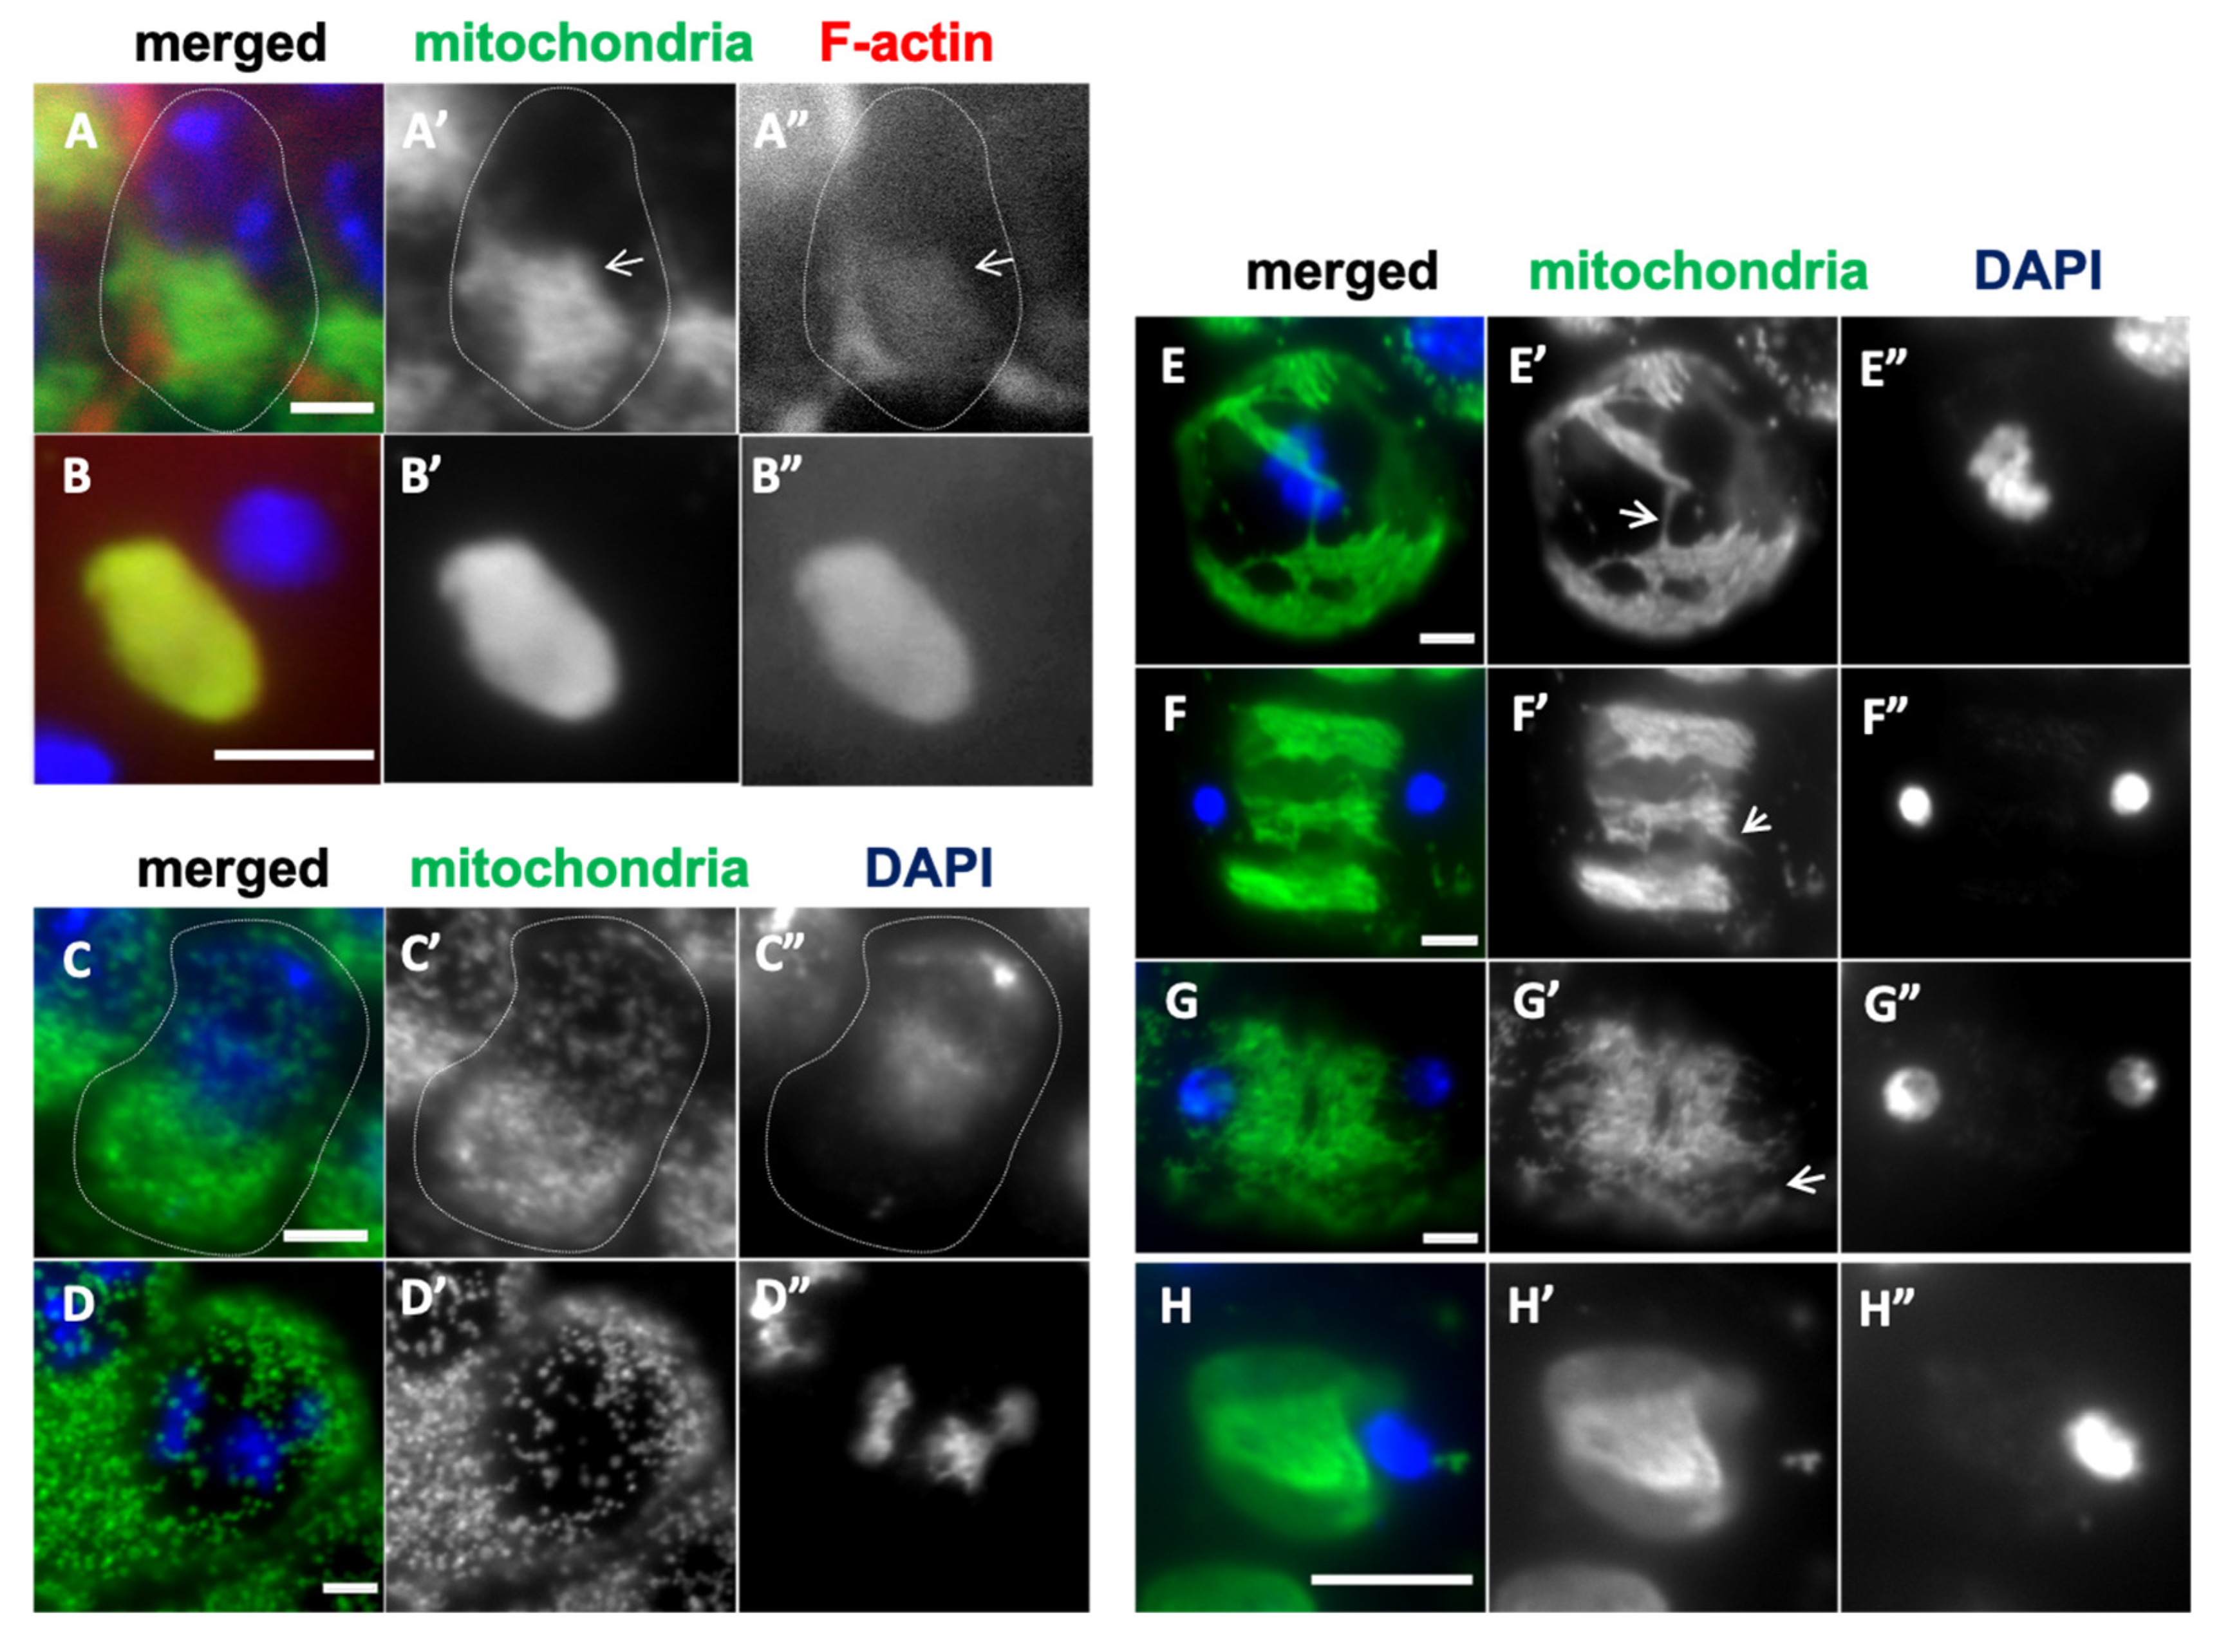
Figure 4.
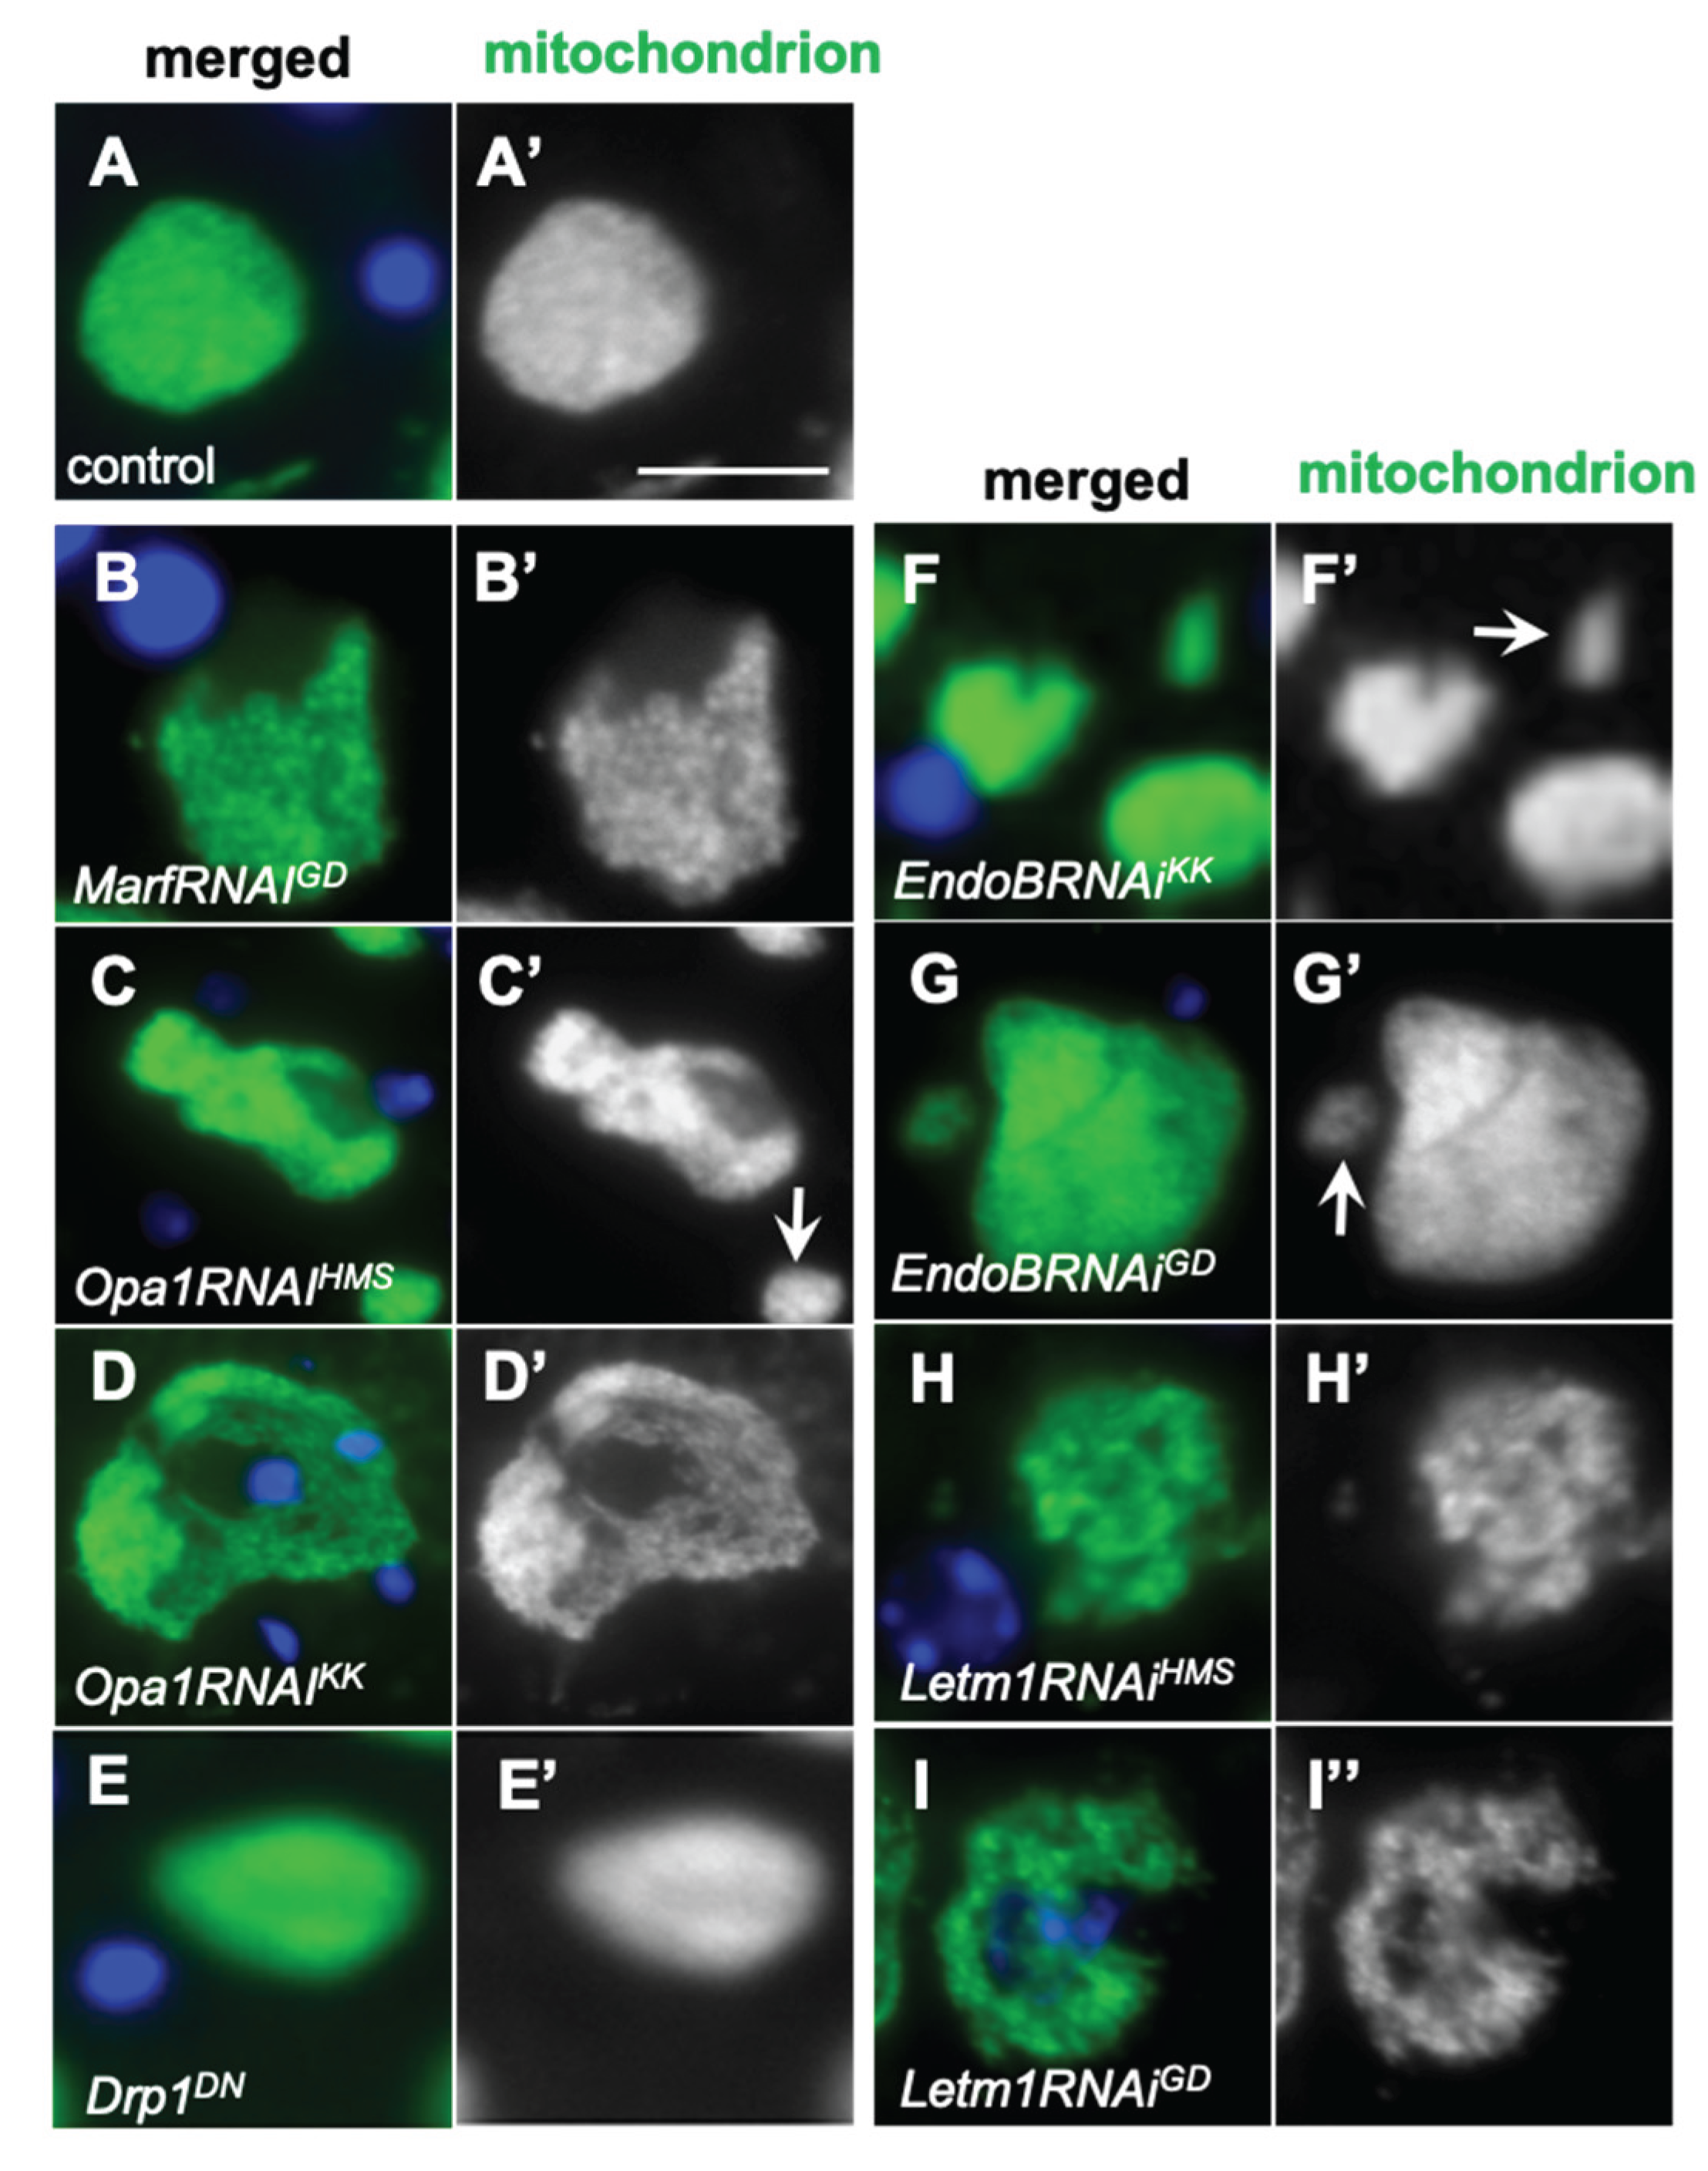
Knockdown of mitochondrial fusion factor genes, Marf and Opa1, and that of EndoB and Letm1 encoding mitochondrial morphology proteins, and their distribution in spermatocytes during the cell growth phase. (A-J)Immunostaining of early spermatocytes at S2b (A-E), and at S6 or the most developed stages of the growth phase (F-J) to visualize mitochondria (green in A-J, white in A’-J’). Blue in A-J: DNA. (A, F) Wild-type (control) spermatocytes at S2b (A) and S6 (F). Spermatocytes at S2b (A-E) and S6 (F-J) with a knockdown of mitochondrial fusion factors, Marf and Opa1, and the morphology proteins, EndoB and Letm1. (B, G) MarfRNAiGD, (C, H) Opa1RNAi Opa1RNAiKK. Spermatocytes at S2b (D, E) and S6 (I, J) with a knockdown of EndoB and Letm1. (D, I) EndoBRNAiGD. (E, J) Letm1RNAiGD. Bars: 10mm.
Figure 4.
Knockdown of mitochondrial fusion factor genes, Marf and Opa1, and that of EndoB and Letm1 encoding mitochondrial morphology proteins, and their distribution in spermatocytes during the cell growth phase. (A-J)Immunostaining of early spermatocytes at S2b (A-E), and at S6 or the most developed stages of the growth phase (F-J) to visualize mitochondria (green in A-J, white in A’-J’). Blue in A-J: DNA. (A, F) Wild-type (control) spermatocytes at S2b (A) and S6 (F). Spermatocytes at S2b (A-E) and S6 (F-J) with a knockdown of mitochondrial fusion factors, Marf and Opa1, and the morphology proteins, EndoB and Letm1. (B, G) MarfRNAiGD, (C, H) Opa1RNAi Opa1RNAiKK. Spermatocytes at S2b (D, E) and S6 (I, J) with a knockdown of EndoB and Letm1. (D, I) EndoBRNAiGD. (E, J) Letm1RNAiGD. Bars: 10mm.
Figure 5.
Growth inhibition of spermatocytes with knockdown of mitochondrial fusion factors, the morphology proteins, and the blw gene encoding the mitochondrial complex V α subunit. The horizontal axis shows the mean diameter (µm) of the control spermatocytes at S6 stage, those of the cells at the most developed stages with knockdown of mitochondrial fusion factor genes, Marf (yellow: MarfRNAiJF and MarfRNAiGD) and Opa1(orange: Opa1RNAiHMS and Opa1RNAiKK), the cells with knockdown of mitochondrial morphology genes, EndoB (gray: EndoBRNAiKK and EndoBRNAiGD) and Letm1(gray: Letm1RNAiHMS and Letm1RNAiGD), and the cells with knockdown of blw (brown: blwRNAi). The diameters of spermatocytes within the cysts at the S6 or the most developed stages (n ≥ 20 cells) were measured, and the average length is shown on the horizontal axis. The largest cells with knockdown of mitochondrial fusion and fission factors have significantly smaller diameters than control cells. p < 0.0001 in every genotype compared with control (Student’s t-test). Error bars indicate the standard error of the mean.
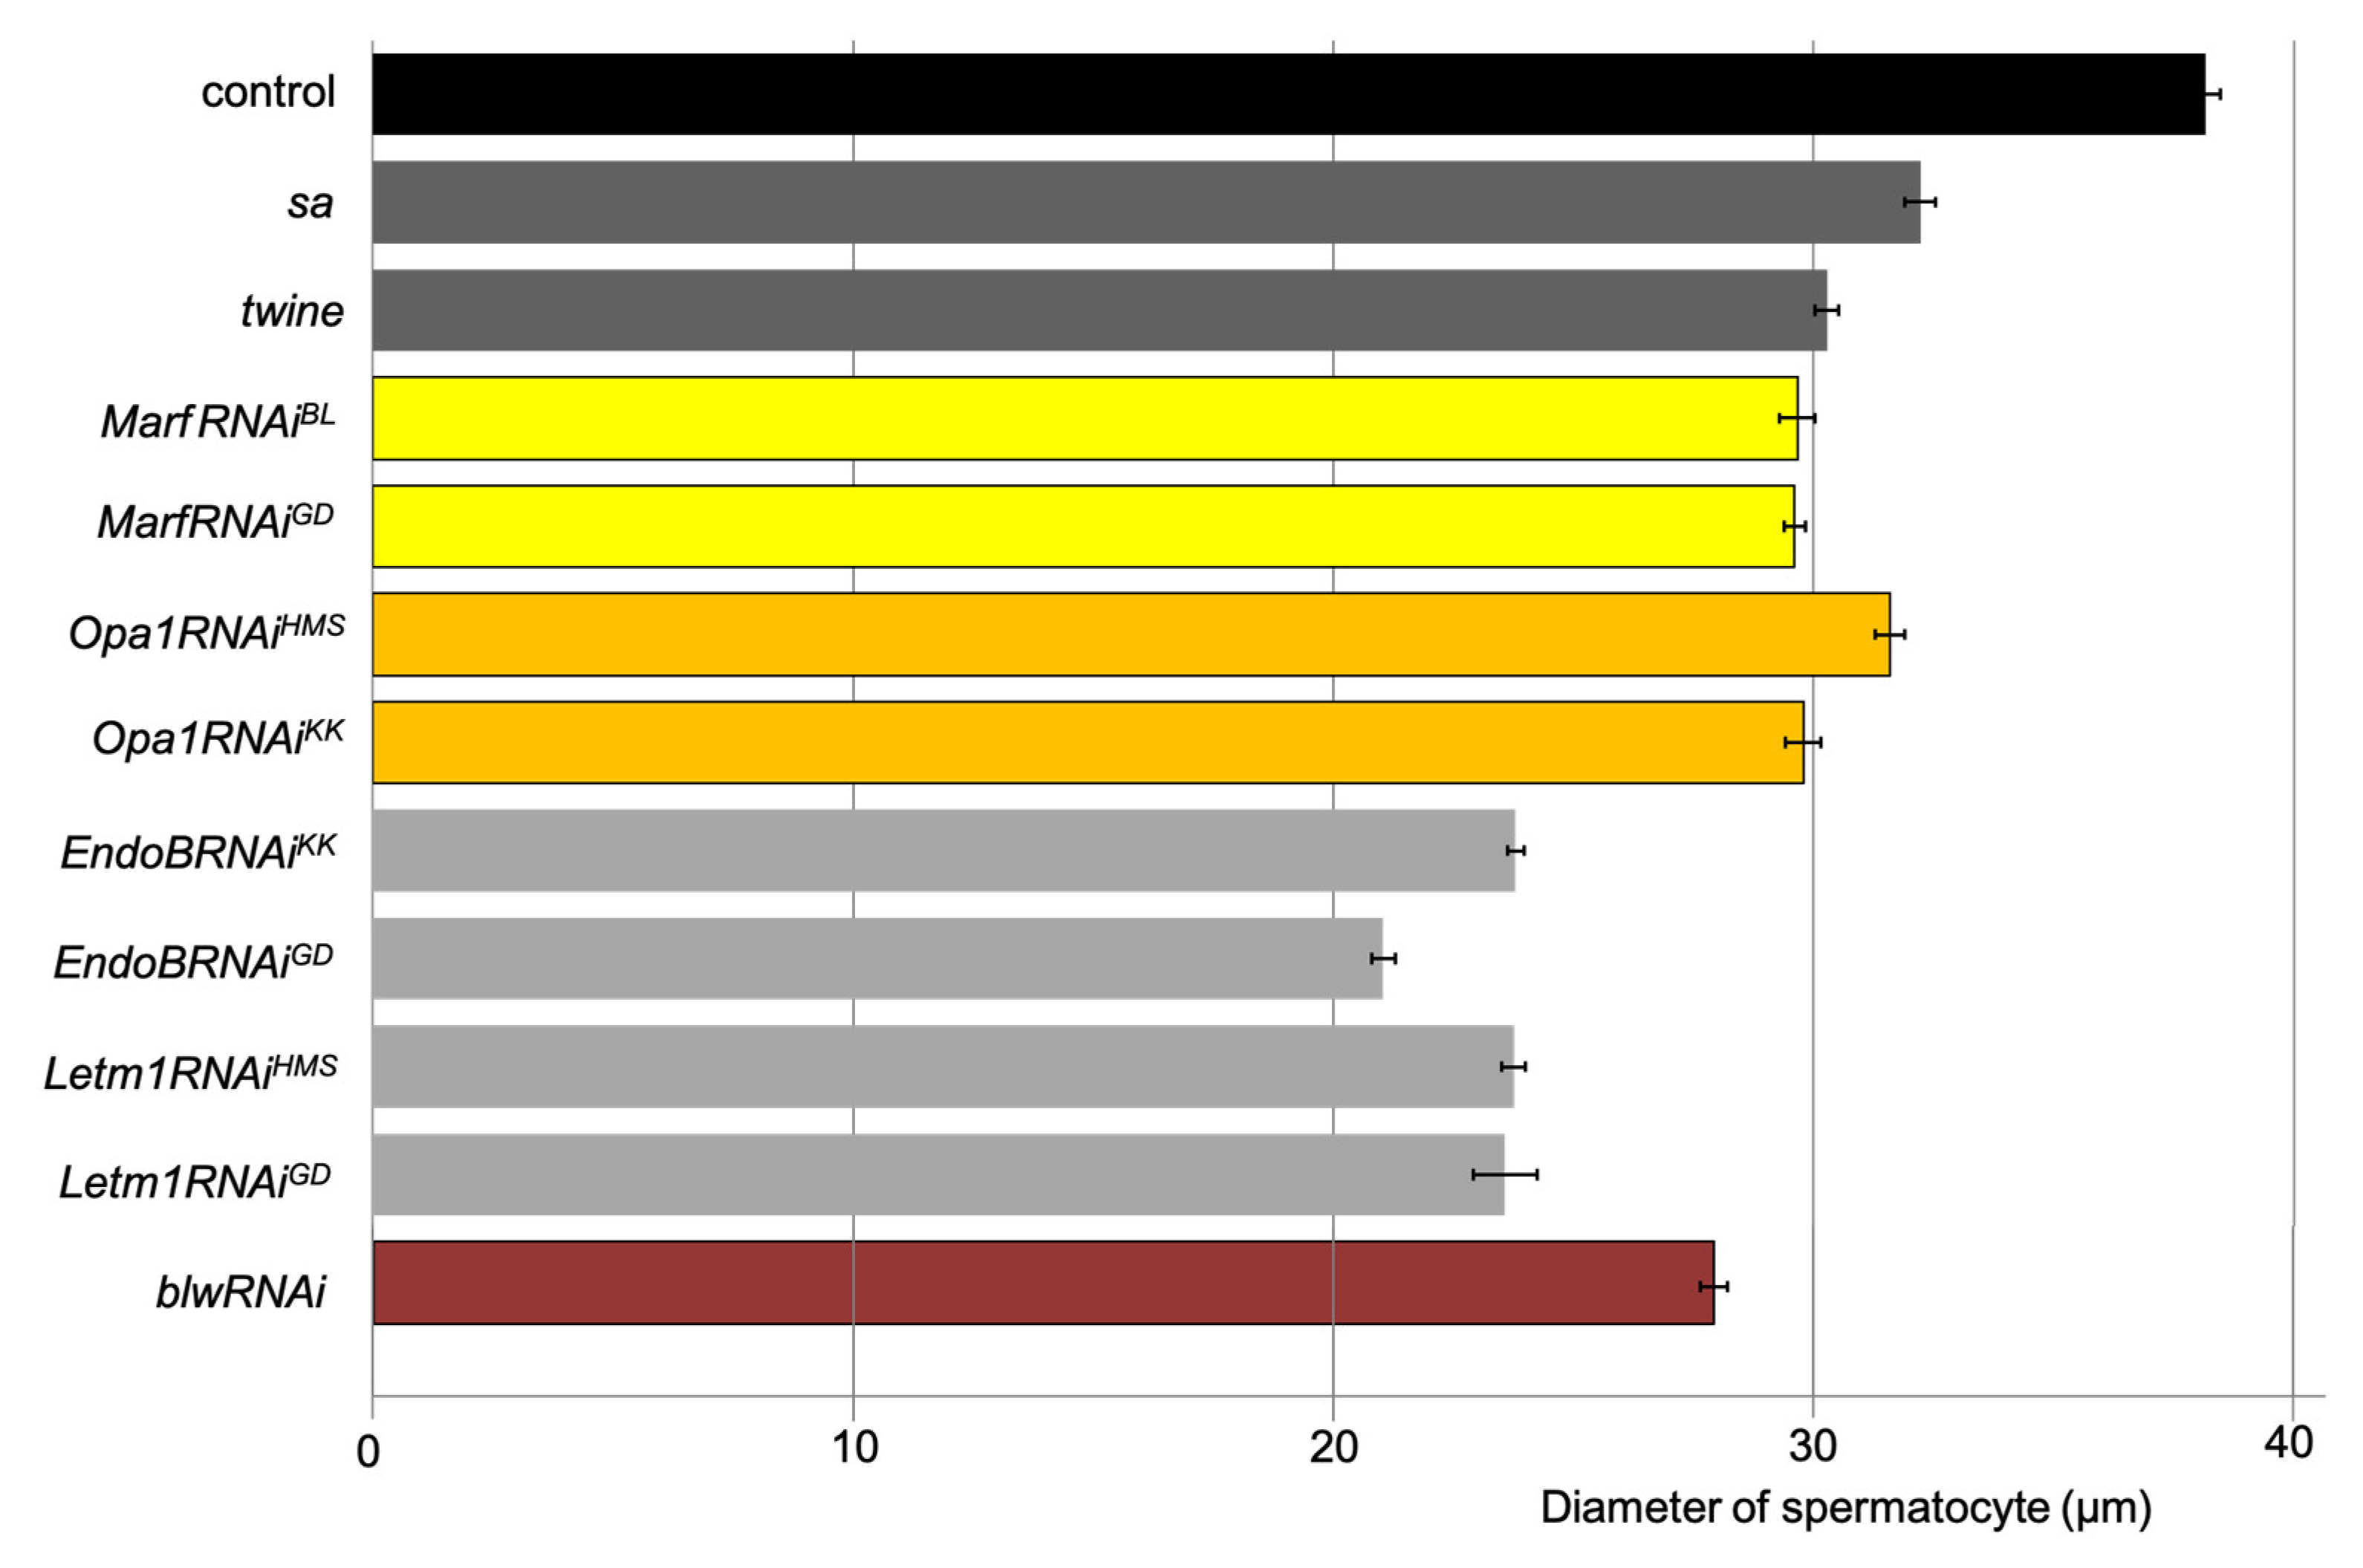
Figure 6.
Abnormal spermatid cysts derived from the spermatocytes with knockdown of mitochondrial fusion and fission factors, and EndoB and Letm1 without undergoing either one or both of meiotic divisions. (A-H) Immunostaining to visualize mitochondria (red in A-H, white in A’-H’) in the spermatids of intact cysts at the onion stage. Blue in A-H, white in A”-H”; DNA staining. (A) An intact cyst composed of 64 spermatids in control testis, in which was produced via two meiotic divisions. (B-D) Intact spermatid cysts derived from spermatocytes with a knockdown of mitochondrial fusion factor genes, Marf (B; MarfRNAiGD) and Opa1 (C; Opa1RNAiGD, D; Opa1RNAiHMS). (B) An intact spermatid cyst composed of 60 cells in MarfRNAiGD testis. (C) An intact cyst composed of only 16 cells in Opa1RNAiHMS testis. An arrow in C indicates an example of nuclei with normal size, and arrowheads indicate smaller nuclei. (D) An intact cyst composed of only 32 cells in the testis expressing a dominant negative mutant for a fission gene, Drp1DN. (E-H) Intact spermatid cysts derived from spermatocytes with knockdown of mitochondrial membrane protein genes, EndoB (E; EndoBRNAiKK, F; EndoBRNAiGD) and Letm1 (G; Letm1RNAiHMS, H; Letm1RNAiGD). (E) An intact cyst composed of only 16 cells in EndoBRNAiHMS testis, (F) an intact cyst composed of only 32 cells in EndoBRNAiGD testis, (G), an intact cyst composed of only 16 cells in Letm1RNAiHMS testis, (H) an intact cyst composed of only 32 cells in Letm1RNAiKK testis. Bars: 10 mm.
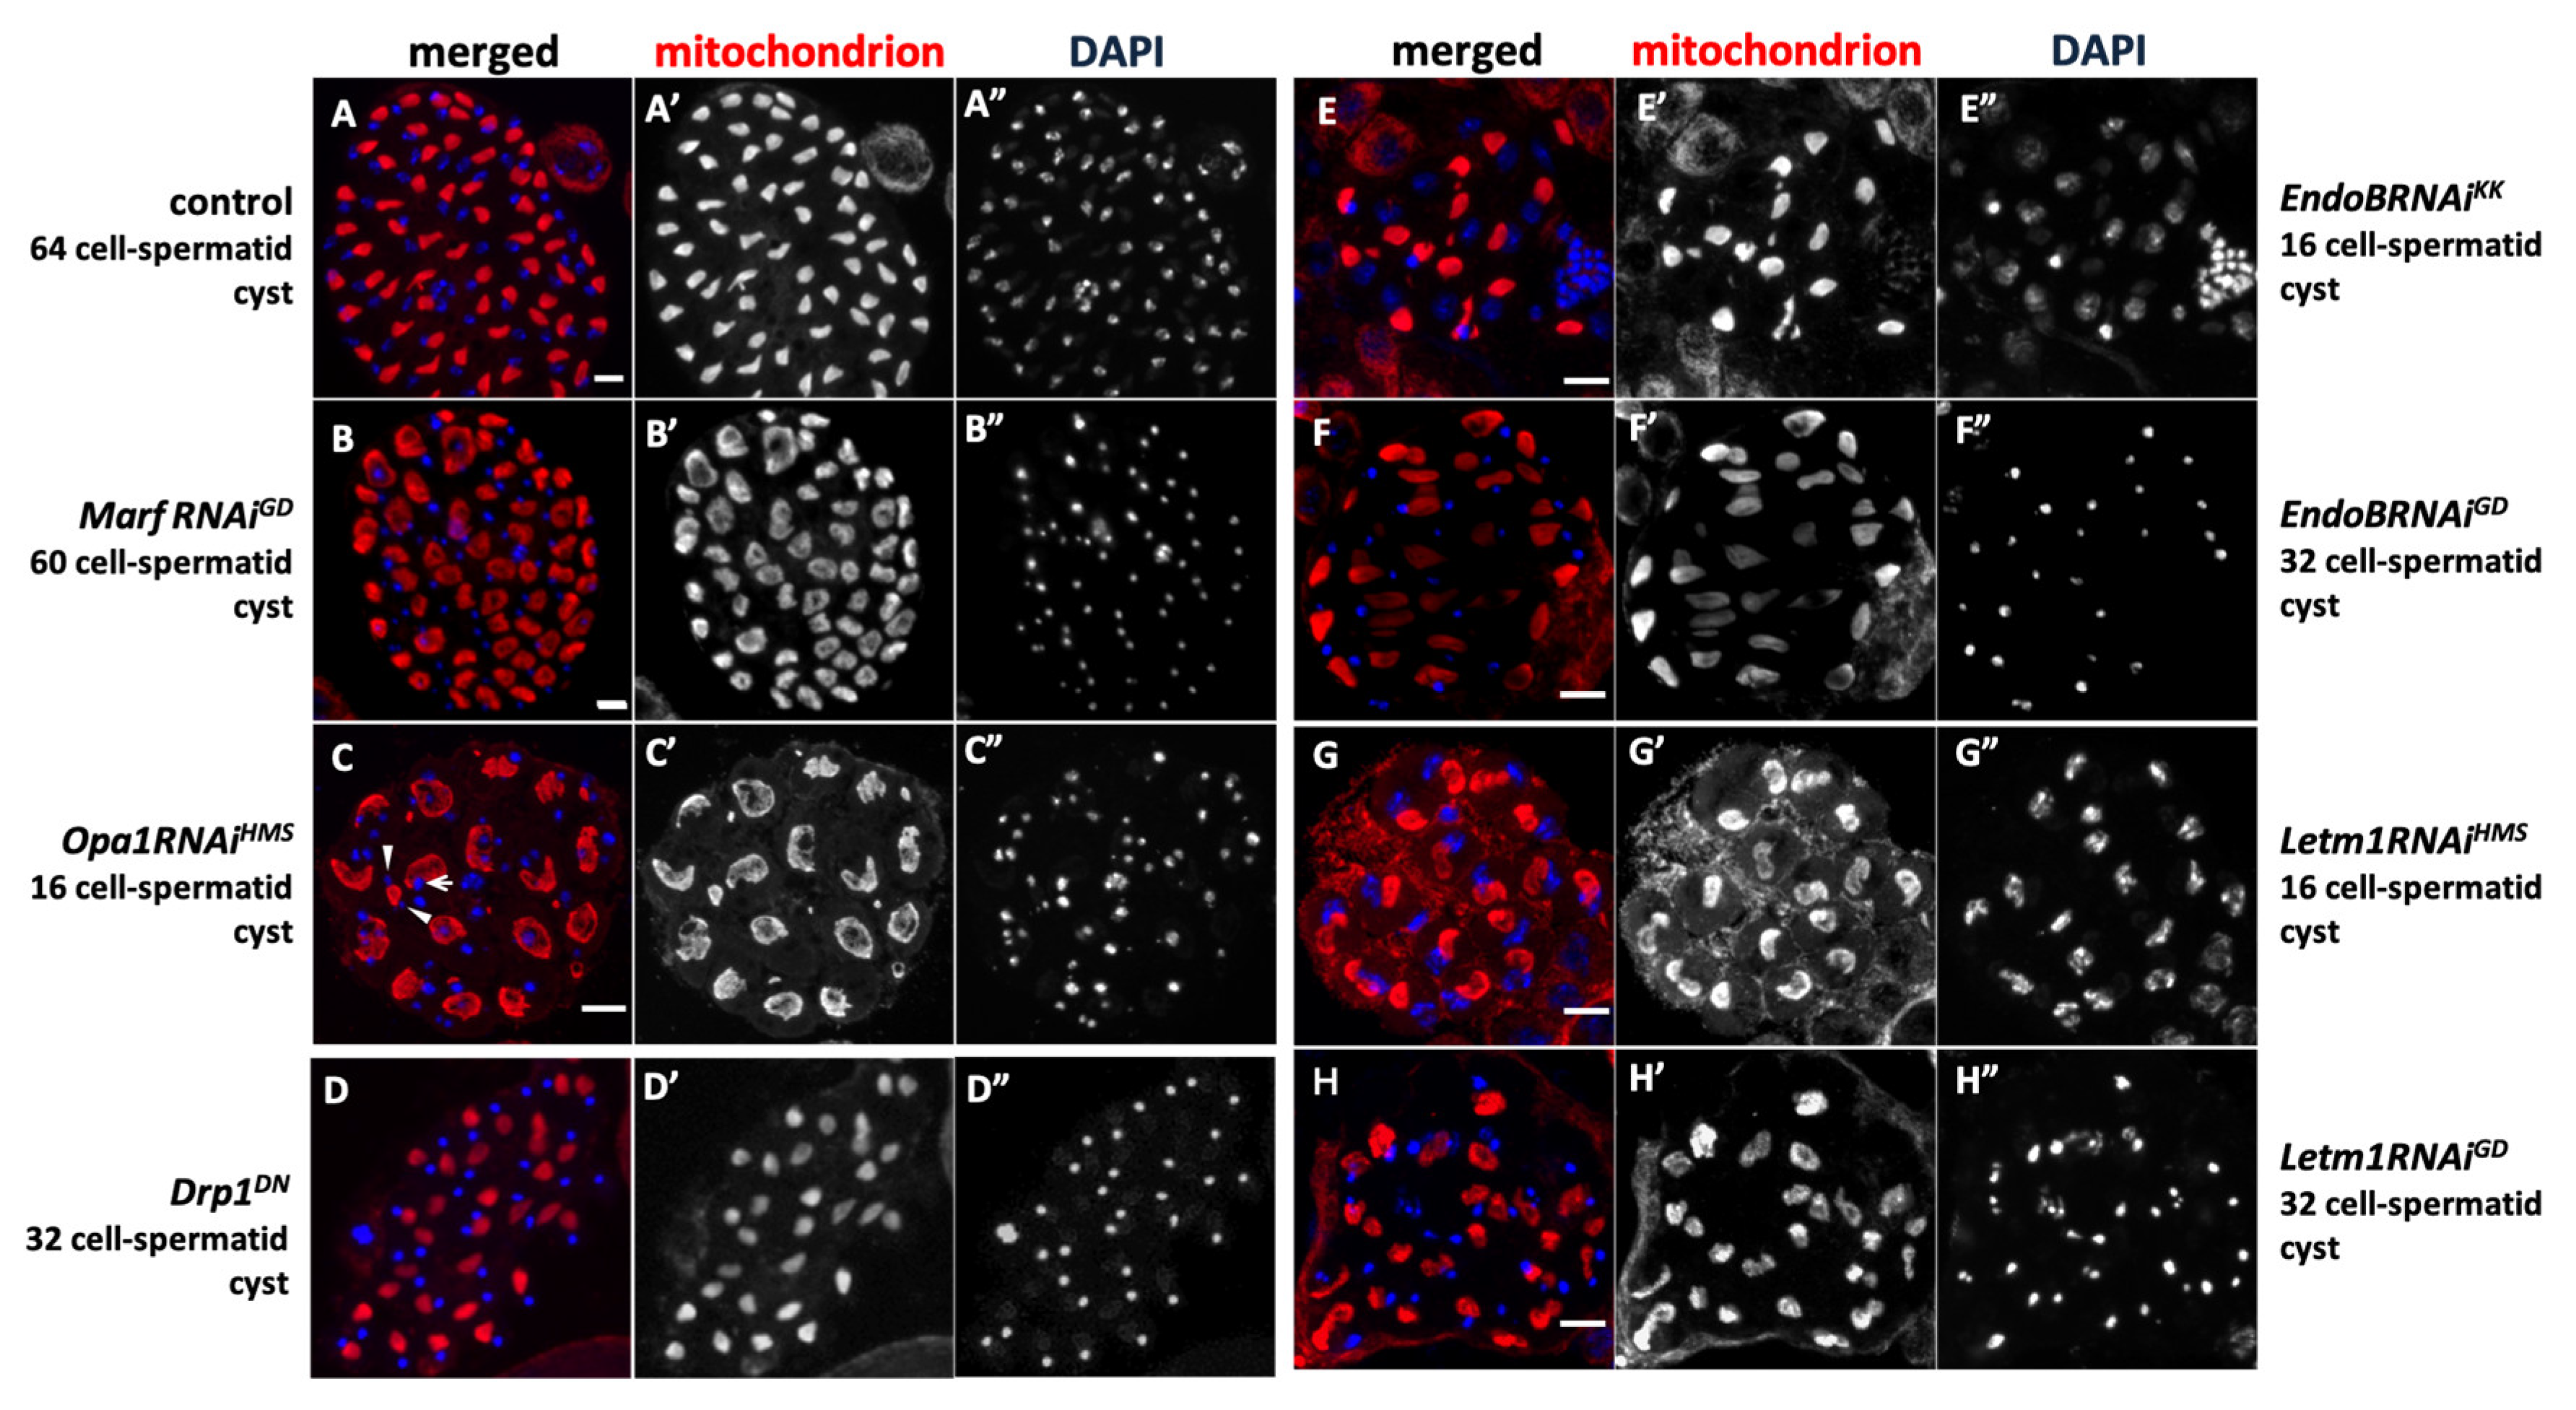
Figure 7.
Absence of activated Cyclin-dependent kinases in spermatocytes with knockdown of mitochondrial fusion and fission factors. (A-G) Immunostaining of spermatocytes with MPM2 antibody that recognizes proteins phosphorylated by the activated CDK1. (A) In wild-type spermatogonia before the onset of meiosis, a strong anti-MPM2 signal is observed on the nucleolus (arrow). (B-G) The spermatocytes with knockdown of mitochondrial fusion factors, Marf (B: MarfRNAiJF, C: MarfRNAiGD) and Opa1(D: Opa1RNAiHMS, E: Opa1RNAiKK). Note that the strong anti-MPM2 signals are not observed in the knockdown cells. (F, G) The spermatogonia with knockdown of the mitochondrial morphology factors, EndoB (F: EndoRNAiGD) and Letm1(G: Letm1RNAiHMS). Dot-like immunostaining foci do not colocalize with the nucleolus. Blue in A-G: DNA. Bars: 10mm.
Figure 8.
A loss of Cyclin B accumulation in the nuclei of spermatocytes harboring a knockdown of mitochondrial fusion factors and the morphology proteins. (A-F)Anti-Cyclin B (CycB) immunostaining of primary spermatocytes (green in A-F, white in A’-F’). Blue in A-F: DNA. (A, B)The immunostaining signals in wild-type spermatocytes at mid-cell growth phase (the S4 stage)(A), and the S6 (B), in which the robust CycB signal was accumulated in the cytoplasm as well as in the nucleus. (C-F) The spermatocytes with knockdown of mitochondrial fusion factors, Marf (C: MarfRNAiJF,) and Opa1(D: Opa1RNAiHMS), and those with that of the mitochondrial morphology proteins, EndoB (E: EndoBRNAiGD) and Letm1(F: Letm1RNAiHMS) at the most developed stages. Note that the CycB accumulation was less than that in the wild type, and no cells harboring its accumulation in the nucleus were observed. Bars: 10mm.
Figure 9.
Abnormal formation of Nebenkerns in spermatids derived from spermatocytes with knockdown of mitochondrial fusion factors, and the morphology proteins, and those from spermatocytes expressing Drp1DN. (A-I) Immunostaining of spermatids at the onion stage to visualize mitochondria (green in A-I, white in A’-I’). Blue in A-I: DNA staining. (A) Control spermatid. (B-D) spermatids derived from spermatocytes with a knockdown of mitochondrial fusion factors, Marf (B; MarfRNAiGD), and Opa1 (C; Opa1RNAiHMS and D; Opa1RNAiKK)). (E) A spermatid from a spermatocyte expressing the dominant negative mutant (Drp1DN). (F-I) Spermatids derived from spermatocytes with knockdown of mitochondrial morphology proteins, EndoB (F; EndoRNAiJF and G; EndoBRNAiGD), and Letm1 (H: Letm1RNAiHMS and I: Letm1RNAiGD). Note that Nebenkerns in B-I failed to be assembled into single spherical structures, and the spermatids possess multiple small Nebenkerns (arrows in C’, F’, G’). Bar: 10 µm.
Table 1.
Frequencies of abnormal spermatid cysts, which resulted from meiotic defects in spermatocytes with depletion of mitochondrial fusion and fission factors and the morphology proteins.
Table 1.
Frequencies of abnormal spermatid cysts, which resulted from meiotic defects in spermatocytes with depletion of mitochondrial fusion and fission factors and the morphology proteins.
| Knockdown & Dominant negative exp. |
16 cell-
cysts* |
17-31 cell-
cysts |
32 cell-
cysts |
33-63 cell-
cysts |
64 cell-
cysts(normal) |
| control |
0(0) |
0(0) |
0(0) |
0(0) |
68(100) |
| MarfRNAiJF |
0(0) |
0(0) |
0(0) |
0(0) |
50(100) |
| MarfRNAiGD |
0(0) |
0(0) |
0(0) |
8(20.0) |
32(80.0) |
| Opa1RNAiHMS |
3(3.2) |
0(0) |
2(2.2) |
0(0) |
88(94.6) |
| Opa1RNAiKK |
97(84.3) |
16(15.7) |
0(0) |
0(0) |
0(0) |
| Drp1RNAiJF |
0(0) |
0(0) |
0(0) |
0(0) |
59(100) |
| Drp1DN |
0(0) |
0(0) |
0(0) |
30(58.8) |
21(41.2) |
| EndoBRNAiKK |
54(100) |
0(0) |
0(0) |
0(0) |
0(0) |
| EndoBRNAiGD |
42(82.4) |
0(0) |
9(17.6) |
0(0) |
0(0) |
| Letm1RNAiHMS |
40(100) |
0(0) |
0(0) |
0(0) |
0(0) |
| Letm1RNAiGD |
42(84.0) |
0(0) |
8(16.0) |
0(0) |
0(0) |
Table 2.
Frequencies of spermatid cysts with abnormal nuclear numbers and size, which were generated from abnormalities in meiotic divisions, which were derived from spermatocytes harboring a depletion of opa1.
Table 2.
Frequencies of spermatid cysts with abnormal nuclear numbers and size, which were generated from abnormalities in meiotic divisions, which were derived from spermatocytes harboring a depletion of opa1.
| Knockdown |
n |
nuclear numbers in a spermatid (%) |
macro/
micro nuclei (% cells) |
| normal |
abnormal |
| 1 |
0 |
2 |
3 |
4 |
5> |
Total
(%) |
| control |
1,290 |
99.5 |
0.4 |
0.1 |
0 |
0 |
0 |
0.5 |
0 |
| Opa1RNAiHMS |
1,713 |
27.1 |
7 |
24.3 |
15.8 |
12.3 |
13.4 |
73.9 |
23.5 |
| Opa1RNAiKK |
952 |
70 |
29.9 |
12.2 |
11.6 |
4.6 |
1.5 |
30 |
32.4 |
Table 3.
A partial rescue of the failure of meiotic divisions by the knockdown of mitochondrial fusion factor gene, opa1, and the morphology gene, EndoB, by overexpression of Cyclin B (CycB).
Table 3.
A partial rescue of the failure of meiotic divisions by the knockdown of mitochondrial fusion factor gene, opa1, and the morphology gene, EndoB, by overexpression of Cyclin B (CycB).
| Knockdown & ectopic expression |
16 cell-
cysts (%)*1
|
17~31 cell
-cysts |
32 cell
-cysts*2
|
33-63 cell
-cysts |
64 cell
-cysts*3
|
Total
cysts |
| Opa1RNAiKK, mCherry |
91(84.3) |
16(14.8) |
1(0.9) |
0(0) |
0(0) |
108 |
| Opa1RNAiKK, CycB |
67(51.9) |
7(5.4) |
33(25.6) |
4(3.1) |
18(14.0) |
129 |
| EendoBRNAiKK, mCherry |
67(62.6) |
26(24.3) |
3(2.8) |
11(10.3) |
0(0) |
107 |
| EndoBRNAiKK, CycB |
8(7.6) |
17(16.2) |
11(10.5) |
40(38.1) |
29(27.6) |
105 |
| CycB |
0(0) |
0(0) |
0(0) |
0(0) |
106(100) |
106 |