
Submitted:
10 July 2024
Posted:
11 July 2024
You are already at the latest version
Abstract
Drp1 is considered the master regulator of mitochondrial fission and affects the proper segregation during mitosis. Here, we identified two clusters on mitochondria, including Drp1-Ser-616/Mff/Mid51 and-Drp1-Ser637/Fis1/Mid49 for midzone fission (division) and peripheral fission signatures, respectively. This study revealed that phospho-Drp1-Ser637 is involved in mitigating mitochondrial oxidative stress, resolving a long-standing localization issue. Additionally, we demonstrated that Mid49 and Mid51 exhibit distinct functions in recruiting Drp1 for mitochondrial fission. It also confirmed the essential role of the Fis1 and Mid49 adaptors contributed into mitochondrial fission within the phospho-Drp1-Ser637/Fis1/Mid49 cluster during M-phase. Moreover, it suggested that there is mutual exclusivity between two clusters of phospho-Drp1 with four adaptors on mitochondria, as well as varied responses to specific anti-cancer drugs during mitotic arrest. Remarkably, the upregulation of the spindle assembly checkpoint (SAC) was also observed, ensuring the prolongation of M-phase with the formation of multipolar spindles. Collectively, the phospho-Drp1-637/Fis1/Mid49 cluster may not only function in peripheral fission (mitophagy) but also serve as a key SAC coordinator for the regulation of spindle assembly during mitotic arrest. These findings appear to be mutually exclusive of phospho-Drp1 with four adaptors on mitochondria and vary in response to specific anti-cancer drugs.
Keywords:
phospho-Drp1
; periphery fission
; spindle assembly checkpoint
; multipolar spindles
; mitotic arrest
; anti-cancer drugs
1. Introduction
Mitochondria maintain their tubule-vesicular reticulum structure through dynamic equilibrium between fission and fusion events. Functional regulation of dynamin-related protein 1 (Drp1) relies on post-translational modifications such as sumoylation, S-nitrosylation, ubiquitination, and phosphorylation [12,13]. Preferentially, Drp1-Ser637 was first identified as a phosphorylation site by PKA and as a dephosphorylation site by calcineurin. Drp1 phosphorylation at the Ser-637 site leads to an elongated mitochondrial morphology [14,15,16], whereas Drp1 phosphorylation at Ser-616 by CDK1/Cyclin B induces mitochondrial fission during mitosis [17]. Additionally, we have also reported that GSK3β-mediated phosphorylation at Ser693 of Drp1 is crucial for controlling mitochondrial morphology against oxidative stress [18].
Drp1 is not always localized to the outer mitochondrial membrane (OMM). Its association with OMM is also mediated by interactions with four adaptor proteins: fission 1 (Fis1), mitochondria fission factor (Mff), and mitochondrial dynamics protein 49 kDa (Mid49) and 51 kDa (Mid51). In mammalian cells, the interactions of Drp1 with Mff, Mid49, and Mid51 play prominent roles in the three-step process of mitochondrial fission [19]. The first step is phosphorylation (activation) of Drp1, and the second step involves Drp1 recruitment to the OMM through interaction with the Drp1 receptors Fis1, Mff, Mid49, and Mid51 [20], while Drp1 assembles into ring-like structures that encircle and constrict the mitochondria consuming GTP to produce two individual organelles in the final fission step [21,22,23,24]. Among the four adaptor proteins, Fis1 is specifically involved in peripheral fission, whereas Mff is involved in midzone division [6,7].
Microtubules are essential for many cellular functions including vesicle transport and cell motility, polarity, and division [25,26,27]. Boveri first coined the term centrosome to describe the location in the cytoplasm and identified its role in mitosis and aneuploidy [28]. The centrosome serves as the major microtubule organizing center (MTOC) and ensures the formation of the bipolar spindle essential for mitotic integrity and chromosomal segregation during the cell cycle. At the onset of the mitotic phase, each centrosome consisting of a pair of centrioles embedded in amorphous pericentriolar material (PCM) undergoes structural and functional reorganization known as centrosome maturation [29,30]. Centrosome organization is regulated by the interaction of centrosomal adapter proteins and their coordinate-bounded kinases that regulate centrosome dynamics. Recent studies indicate that CDK1, Polo-like kinase, Nek kinase, and the Aurora family proteins may be involved in regulating centrosome maturation and formation of the mitotic spindle [31,32,33,34,35,36] but their substrates and targets for centrosome maturation are unknown. Thus, the molecular mechanisms responsible for microtubule distribution and maintenance remain to be fully defined.
The knockdown of Drp1 induced mitochondrial hyperfusion that triggers replication stress and defects in chromosome segregation during mitosis [18,37,38]. Defects in mitochondrial fission led to centrosome amplification, misaligned chromosomes, and chromosome instability in metaphase. Moreover, the blockade of ETC complex I causing overexpression of Aurora A, Polo-like kinase 4 (Plk4), and Cyclin E has been observed with the emergence of amplified centrosomes [39]. Treatment with rotenone (ETC complex I inhibitor) in HeLa cells blocks mitosis and inhibits cell proliferation by suppressing the reassembly of microtubules [38]. These mitochondrial proteins can influence cell cycle progression, alter chromosome morphology, and localize to centrosomes [10,39,40,41,42], whereas Aurora A and Plk1 locate and phosphorylate RALA (a Ras subfamily member) and mitochondrial rho (Miro) in the mitochondria, respectively [9,10,40,41,42]. In addition, an extended mitotic arrest, due to the activation of spindle assembly checkpoint (SAC) or other causes, is a prerequisite for efficient induction of cell death during mitosis. The SAC monitors the microtubule-kinetochore interactions during metaphase to anaphase transition. It is activated in the presence of unattached kinetochores and/or a lack of tension between sister kinetochores. SAC then orchestrates the degradation of a wide spectrum of effector, facilitating metaphase to anaphase [9,10]. More recently, Kleele et al. showed that distinct fission signatures predict mitochondrial degradation or biogenesis [6]. This revolutionary view of two ways to split a mitochondrion includes Drp1 along with its four adaptor proteins, Mff, Fis1, Mid51, and Mid49 to mediate mitochondria fission [6,7,43]. Furthermore, Mid49 and Mid51 can independently recruit Drp1, implying that they offer specificity during mitochondrial division [6,7,11,43,44]. Previously, we showed that the phosphorylation status of Drp1-Ser-637 by PKA in mitochondrial fission modulates mitophagy via PINK1/Parkin to exert multipolar spindle assembly during mitosis [8]. Although it has been reported that mitochondria are involved in centrosome and SAC functions [9,10,31,32,33,34,35,36,37,38,39,40,41,42], the communication and regulation mechanisms between these two organelles remains not fully elucidated.
In this study, we investigated two signaling clusters involved in mitochondrial fission, phospho-Drp1-616/Mff/Mid51 and phospho-Drp1-637/Fis1/Mid49, which demonstrated an elegant interplay of multiplicity and closely linked to two distinct fission signatures, namely midzone fission and peripheral fission signatures [6,7]. Moreover, our study revealed that the phospho-Drp1-637/Fis1/Mid49 cluster not only functions via peripheral fission signature (mitophagy) but also serves as a key coordinator of the SAC to regulate multiple spindle formation during mitotic arrest.
2. Materials and Methods
Materials
The antibodies used included Drp1 (BD Biosciences, San Diego, CA). phospho-Drp1-Ser-637 and phospho-Drp1-Ser-616, Fis1, Cleaved Caspase-3 (Asp175), Cleaved PARP, Cyclin A, Cyclin B, Cyclin D, Bax, Bcl-2, puma, Mcl-1, Phospho-CDK1-T14, CDK1, and VDAC (Cell Signaling Technology, Beverly, MA). Caspase-8 and Caspase-9, Mid49 (also known as SMCR7) and Mid51 (also known as SMCR7L) (Proteintech Group, Chicago, IL). BubR1 and PTTG1 (securin-M01) (Abnova, Taipei, Taiwan), Mad2 (Abcam, Cambridge, MA, USA), CDC20 and CDC27 (ABclonal lnc., Woburn, MA, USA), GAPDH (Santa Cruz, CA, USA). CCK-8 (Sigma 96992), nocodazole, thymidine, Mdi, Dyn, DHEA, taxel, Dox, Oxa, and 5-Fu (Sigma-Aldrich, St. Louis, MO, USA).
Cell Lines and Cell Culture Conditions
HeLa cervical cancer cell line, U251 human glioblastoma multiforme (GBM) cell line, and human colon cancer (CRC) cell line HCT116 (ATCC CCL-247) were obtained from the American Type Culture Collection (ATCC). The culture media were purchased from the Gibco division of Thermo Fisher Scientific, Inc. (Waltham, Massachusetts, USA). HeLa and U251 cell lines were cultured in 10% DMEM, while the HCT116 cell line was cultured in 10% McCoy’s 5A medium supplemented with 1% penicillin and 1% streptomycin (Gibco). The cells were cultured at 37°C in a fully humidified environment with 5% CO2 and maintained at a concentration of 2 × 10⁵ cells per milliliter to ensure asynchronous growth and exponential proliferation.
Cell Cycle Synchronization
Double Thymidine
A double-thymidine blockade was employed to synchronize the progression of HeLa cells at the G1/S transition point. A 100 mM stock solution of thymidine (Sigma Chemical Co.) was prepared by dissolving thymidine in serum-free media and stored at 4°C [45]. HeLa cells were synchronized by treating them with 2 mM thymidine from the 100 mM stock solution for 18 hours. Afterward, cells were washed twice with PBS and provided with regular culture media. Subsequently, 9 hours after release from the first block, fresh medium containing 2 mM thymidine was introduced and maintained for an additional 17 hours. Cell samples were harvested at 1 to 2-hour intervals from the time of release from the second thymidine blockade, with trypsin-EDTA used for cell detachment and neutralized with medium containing 10% FBS. To determine the specific cell cycle phases at different time points, synchronized cell samples were collected, fixed with 70% methanol, and analyzed using PI staining and flow cytometry to identify when most cells were in the G1, S, or G2/M phases. Following the double thymidine block, which arrested cells at the G1/S boundary, there was a subsequent 1-hour release period. After this release, the cells were resuspended in prewarmed media at 37°C containing Mdi, Dox, Oxa, and 5-Fu for 1 hour (to assess the G1 phase), 4 hours (S phase), 8 hours (M phase), and 12 hours (M+4 hours phase).
Nocodazole
Nocodazole was utilized to synchronize the progression of HeLa cells as they entered the M phase [8]. The cells were treated with 200 ng/ml nocodazole for 16 hours, followed by a subsequent 1-hour release period before the cells were resuspended in prewarmed media at 37°C containing Mdi, Dox, Oxa, and 5-Fu for 24 hours.
Cytotoxicity Assay
Cells were plated in 96-well plates and exposed to various concentrations of Mdi, Dox, Oxa, and 5-Fu for 24, 48, or 72 hours. Subsequently, the cell viability was assessed by the CCK-8 kit according to the manufacturer’s instructions. The optical density was quantified using a 96-well plate reader at 450 nm.
Clonogenic Cell Survival Assay
Cells were initially seeded at a density of 2 × 10³ cells per well in 6-well plates before treatment with Mdi, Dox, Oxa, and 5-Fu. The drugs and culture medium were refreshed every 2-3 days once the cells had proliferated sufficiently. Following a 14-day incubation, the cells were gently washed and fixed with 4% paraformaldehyde for 30 minutes. Subsequently, the cells were stained with 0.1% crystal violet for 30 minutes, then treated with DMSO, and the staining intensity was quantified by measuring the absorbance at 570 nm.
Flow Cytometry
Cells were rinsed with PBS and subsequently fixed in 70% methanol overnight at 4°C before staining with 10 µg/mL PI and 20 mg/mL RNase A for 30 minutes at 37°C in the dark. Subsequently, the cells were prepared for flow cytometry using the Attune NxT flow cytometer (Thermo Fisher Scientific) measuring PI fluorescence in 10,000 individual nuclei. The Attune Cytometric Software was employed for cell cycle modeling to determine the distribution of cells within the G1, S, and G2/M cell cycle phases.
siRNA Transfection
Cells were seeded in 6-well plates before the addition of 5 nM of siRNA in 1 µL of Lipofectamine (Life Technologies) in 200 µL of Optimem (Thermo Fisher Scientific) for 6 hours. Then, 1 mL of DMEM supplemented with 20% FBS and 1% P/S was added to each well. siRNA transfection was performed 36 hours before the start of either the double-thymidine or nocodazole block and 4 days before cell harvesting or fixation for subsequent flow cytometry or microscopy experiments. The levels of endogenous proteins were monitored by immunoblotting at various time points. The following siRNA sequences were used:
siDrp1 (Sense: 5’-GCUACUUUACUCCAACUUAUUTT-3’; Antisense: 5’-AAUAAGUUGGAGUAAAGUAGCTT-3’).
siFis1 (Sense: 5’-AACGAGCUGGUGUCUGUGGAGTT-3’; Antisense: 5’-CUCCACAGACACCAGCUCGUUTT-3’).
siMid51 (Sense: 5’-GCAUGUCCCUGCAGGAGAAACTT-3’; Antisense: 5’-GUUUCUCCUGCAGGGACAUGCTT-3’).
siMFF (Sense: 5’-GGAUUGUUGUAGCAGGAAATT-3’; Antisense: 5’-UUUCCUGCUACAACAAUCCTT-3’).
siMid49 (Sense: 5’-CCUGCAGUGUCAGACACAGCGTT-3’; Antisense: 5’-GCAUGUCCCUGCAGGAGAAACTT-3’).
Plasmid Construction and Site-Directed Mutagenesis
Drp1 DNA fragments were amplified and inserted into the pEGFP vector (Clontech) to create pEGFP constructs for various Drp1 variants. Primers for mutagenesis of different Drp1 variants were used according to the manufacturer’s instructions. Dpn-I was used to digest the DNA after PCR. For transformation, XL10-Gold ultracompetent cells were mixed with Dpn I-treated DNA and subjected to a heat pulse. After incubation on ice, LB medium was added, and the transformed cells were spread on selective plates to select colonies for sequencing analysis.
Immunofluorescence Staining and Confocal Microscopy
Mitotic spindle formation was assessed using primary mouse anti-α-tubulin and γ-tubulin antibodies (dilution 1:1000), followed by rhodamine-conjugated secondary goat anti-mouse antibodies (dilution 1:5000). Additionally, 4’,6-diamidino-2-phenylindole (DAPI) was employed to facilitate DNA counterstaining. Immunofluorescence imaging was performed using the Zeiss LSM700 laser scanning confocal microscope.
Co-Immunoprecipitation
The pEGFP-Drp1, pEGFP-Fis1, and pEGFP-Mff fragments were expressed in HeLa cells. Cell lysates were prepared using 1 ml of RIPA buffer and incubated overnight at 4°C with either Anti-Fis1 or Anti-Mff antibodies. Subsequently, the lysates were incubated with 30 μL of Protein-A/G magnetic beads for 10 minutes at room temperature before washing three times with RIPA buffer. Finally, the bound proteins were eluted by adding 20 μL of 5X loading dye and analyzed by immunoblotting.
Western Blot Analysis
HeLa cells cultured in 10% DMEM were harvested 24 hours post-transfection or drug treatment. After a single wash with PBS, the proteins were extracted and separated by SDS/PAGE on 10–12% gels, transferred to PVDF membranes, and blocked with 5% milk in PBS/Tween for 1 hour. After three washes, the membranes were probed with primary antibodies, followed by incubation with secondary HRP-conjugated antibodies for 1 hour. Protein bands were visualized using chemiluminescence and a gel imager CCD camera.
Mitochondria Subcellular Fractionation
Adherent cells were cultured as described above and then fractionated into the cytosol and mitochondrial fractions using the subcellular protein fractionation kit (Thermo Fisher Scientific, 89874) according to the manufacturer’s protocol. The cytosol and mitochondrial pellets were resuspended in an SDS-PAGE buffer and analyzed by western blotting.
Quantitative Real-Time RT-PCR
RNA was extracted from 2×10⁵ cells using the Geneaid Tissue Total RNA Mini Kit (Taipei, Taiwan) according to the manufacturer’s instructions. cDNA was synthesized using the Applied Biosystems High-Capacity cDNA Reverse Transcription Kit and qPCR was performed on a 7500 Real-time PCR System (Applied Biosystems) using the Power SYBR Green PCR Master Mix (Applied Biosystems) with 18s rRNA as the reference gene. Ct values were calculated using StepOnePlus software and relative mRNA expression was determined using the 2−ΔCt method. The primer sequences were as follows: Drp1: Forward 5’-AAGAACCAACCCAGGCAAC-3’, Reverse 5’-TTCACGGCATGACCTTTTT-3’. Mff: Forward 5’-CCAAACGCTGACCTGGAAC-3’, Reverse 5’-TTTCCTGCTACAACAATCCTCTCC-3’. Fis1: Forward 5’-CAAGGAACTGGAGCGGCTCATT-3’, Reverse 5’-GGACACAGCAAGTCCGATGAGT-3’. Mid51: Forward 5’-AGGATGACAATGGCATTGGC-3’, Reverse 5’-CCGATCGTACATCCGCTTAAC-3’. Mid49: Forward 5’-AGAACTCTGCCATGGTCTTCT-3’, Reverse 5’-CGTTCTATTATCAGGCAGGTCC-3’.
Statistical Analysis
All experiments were conducted in triplicate, and the data are presented as mean ± SEM. Statistical analysis was performed using GraphPad InStat 8 software (GraphPad Software, Inc., San Diego, CA, USA). Data were analyzed with one-way ANOVA followed by post hoc pairwise Tukey’s tests, with significance set at p < 0.05.
3. Results
3.1. Two Signaling Clusters of Mitochondrial Fission on Double-Thymidine Synchronized HeLa Cell Cycle Progression- Phsopho-Drp1 Status with Four Drp1 Adaptors
Previously, we demonstrated that dysfunction in the electron transport chain (ETC) due to mitochondrial division inhibitor 1 (mdivi-1, Mdi) disrupts mitosis because Protein Kinase A (PKA) activates mito-Drp1-Ser-637, while CDK1/Cyclin B activates Drp1-Ser-616. These activations initiate mitochondrial fission through the PINK1/Parkin pathway, promoting efficient mitophagy and resulting in the formation of multipolar spindles during the M phase [8]. Interestingly, the dynamic imbalance in the mitochondrial fission protein Drp1, its phosphorylation sites, and its four binding proteins (Mff, Fis1, Mid49, and Mid51) may be key factors in centrosome instability, which in turn triggers the formation of multipolar spindles [45,46,47,48]. The accumulation of cells in G2/M suggests that unsuccessful division of the mitochondrial network before subcellular formation inhibits successful mitosis. To investigate whether this G2/M accumulation results from a delay or a blockage in cell cycle progression, we monitored cell cycle progression after releasing cells from double-thymidine blockade (Figure 1a,b). Thymidine, a pyrimidine deoxynucleoside, synchronizes cells in early S-phase [45]. Double-thymidine blockade of synchronization ensures that >95% of control cells go through distinct cell cycle stages: G1 phase (0-2 hours), S phase (2-7 hours), and synchronized mitosis (7-8 hours) (Figure 1a,b). Additionally, the levels of cell cycle-related proteins and the dynamics of Drp1 phosphorylation strongly correlate with the highest expression of various cell cycle-related proteins including Cyclins B, A, and D (Figures 1c and S1A). The cell cycle-arrested cells were released at the G1/S transition into mitotic arrest at different time points: 1 hour (G1 phase), 4 hours (S phase), 8 hours (M phase), and 12 hours (M+4 hours phase) (Figure 1d) and as expected, most mock cells arrested in G1 after the second thymidine block and initiated cell cycle progression (Figure S1B). Furthermore, Mdi-treated cells remained arrested in the G2/M phase 8 to 12 hours after release from the second thymidine, as indicated by high levels of Cyclin B expression, whereas Dynasore (an inhibitor of dynamin, Dyn) treated cells entered the subsequent G1 phase, as evidenced by elevated Cyclin D expression (Figure 1e). The effects of Mdi and Dyn on the cell cycle progression of G1/S synchronized HeLa cells and Drp1 receptors were examined to investigate the changes in phospho-Drp1-Ser-637, phospho-Drp1-Ser-616, and their four main adaptors during cell division. Simultaneously, we observed several significant findings related to cells undergoing mitotic arrest and those treated with specific drugs. Firstly, cells simulating mitotic arrest showed a substantial increase in phosphorylated Drp1 (Ser-616), Mff, and Mid51 adaptors, while exhibiting a decrease in Mid49 adaptors compared to G1 phase and S phase groups, indicating a characteristic pattern of normal mitochondrial fission during the M phase (Figure 1f). Secondly, Mdi treatment replaced Drp1 (Ser-616) accumulation with the accumulation of phosphorylated Drp1 (Ser-637), upregulated Fis1 and Mid49 adaptors, and downregulated Mff and Mid51 adaptors compared to the mock group (Figure 1f). These data highlight the dynamic imbalance of the mitochondrial fission protein Drp1, its phosphorylation sites, and its four binding adaptors (Mff, Fis1, Mid49, and Mid51).
3.2. The Two Signaling Clusters of Mitochondrial Fission Correspond to and Link Two Distinct Types of Mitochondrial Fission during Mitosis
Two distinct mitochondrial fission types have been observed, midzone fission driven by Mff adaptors during cell proliferation and biogenesis and peripheral zone fission triggered by stress signals, like increased ROS, reduced membrane potential, and altered calcium levels, involving interaction with lysosomes through Fis1 adaptors [6]. However, further research is needed to understand the phosphorylation of Drp1 and its adaptors in these fission patterns. HeLa cells were synchronized using the double-thymidine block to explore the effects of commonly used anticancer drugs such as Mdi, Doxorubicin (Dox), Oxaliplatin (Oxa), and 5-fluorouracil (5-Fu) on cell behavior, particularly their potential to induce S or mitotic phase arrest. Cells were treated with Mdi, Dox, Oxa, and 5-Fu and collected at various time points: 1 hour (G1 phase), 4 hours (S phase), 8 hours (M phase), and 12 hours (M + 4 hours phase), revealing that Dox and Oxa treatment produced similar patterns to Mdi treatment (Figures 1g and S2A). However, there were distinct molecular patterns within subpopulations, with phosphorylated-Drp1 (Ser-616) in the mitochondria of Dox and Oxa-treated mock cells replaced by phosphorylated-Drp1 (Ser-637) in the cytoplasm (Figure 1g,h). This was also associated with an upregulation of Fis1 and Mid49 adaptors, along with a downregulation of Mff and Mid51 adaptors (Figures 1h and S2B). In contrast, 5-Fu treatment had no significant impact on the phosphorylation pattern of Drp1 or its adaptor levels, except for a slight increase in Mid49 expression, which was consistent with observations in M+4 stage mock cells (Figure 1g,h). These results suggest that mitochondrial fission adaptors can be divided into two groups, those involved in midzone fission consisting of phosphorylated Drp1 (Ser-616), Mff, and Mid51, and those associated with peripheral zone fission consisting of phosphorylated Drp1 (Ser-637), Mid49, and Fis1. Also, midzone fission, i.e., mitochondrial division, exerts a significant influence during the M phase of the cell cycle, with distinctive subpopulation features of midzone fission gradually emerging during the G2 phase. These findings underscore the significance of phosphorylated Drp1 (Ser-637) in resolving mitochondrial oxidative stress, addressing a longstanding localization issue. Additionally, he indispensable role of the Fis1 adaptor as a key partner in the mitochondrial fission signature is confirmed, particularly within the phospho-Drp1-Ser637/Fis1/Mid49 cluster.
3.3. The Delicate Interplay of Two Phospho-Drp1 (Ser-616 and Ser-637) Clusters
Two distinct clustering signals were observed in our system for phosphorylated Drp1 (Ser-616) and their association with Mff/Mid51 for mitochondrial fission during normal conditions, while phosphorylated Drp1 (Ser-637) associated with Fis1/Mid49 for prolonged mitochondrial fission during the M phase. Pin-pon competition assays and affinity pull-down experiments on phosphorylated Drp1 (Ser-616 and Ser-637) Wild-type (Wt), phosphomimetic (Asp; D-form), and phospho-null mutant (Ala; A-form) were performed to investigate whether these two clusters exist during the M phase and compete with each other. Co-immunoprecipitation (Co-iP) experiments to examine interactions between Mff and Drp1-Wt, Drp1-S637D, Drp1-S637A, Drp1-S616D, and Drp1-S616A showed that under Mff overexpression (Figure 2a, left panel) and Co-iP with the Mff antibody (Figure 2a, right panel, lanes 2, 3 and 6), endogenous Drp1-Ser-616 and exogenous Drp1-S616A interacted with Mid51, with a notably weaker interaction for Drp1-S616D (Figure 2b, lane 4). Similarly, under Fis1 overexpression (Figure 2b, left panel) and Co-iP with a Fis1 antibody (Figure 2b), endogenous Drp1-Ser-637 and exogenous Drp1-S637A interacted with Mid49 and Fis1 (Figure 2b right panel, lanes 2, 3 and 4). Of note, Drp1-S637D can compete with Mid49 (Figure 2b right panel, lane 5). Taken together, these findings demonstrate that phosphorylated Drp1 exhibits distinct interactions with adaptors depending on its phosphorylation state. Additionally, nocodazole treatment induced Drp1-Ser-637 phosphorylation leading to reduced Drp1-Ser-616 expression when overexpressing Drp1-S637A (Figure 2c), whereas treatment with forskolin, a PKA activator, induced phosphorylation of the Drp1-Ser-637/Fis1/Mid49 cluster (Figure 2d, lanes 2, 3, and 4 compared to lane 1). Interestingly, Drp1-S616A, but not Drp1-S616D competed with Drp1-Ser-637 and enhanced Mff and Mid51 (Figure 2d, lane 6 compared to 7). These results imply that more complex interplay of the two phospho-Drp1 (Ser-637/Fis1/Mid49 and Ser-616/Mff/Mid51) clusters. Furthermore, Mdi and Dox treatment altered Drp1 phosphorylation and mitochondrial receptor proteins during the M phase, confirming the presence of two distinct clustering signals for phosphorylated Drp1 at Ser-616 and Ser-637 during the M phase (Figure 2e). In summary, our study involved a series of experiments employing Co-IP with Mff, Fis1, wild-type Drp1, Drp1(S), phospho-null mutant (A), and phosphomimetic mutant (D) to investigate the presence/competition of these two clusters during the M phase of the cell cycle. Our findings suggest that phospho-Drp1 exhibits distinct adaptor interactions depending on its phosphorylation status. These experiments provided valuable insights into the regulation of Drp1 during cell division, shedding light on the complex regulatory mechanisms governing the phospho-Drp1 status with its four adaptors in mitotic arrest. For further details, please refer to the discussion section and the proposed model.
3.4. The Impact of DRUGS on the Hela cell Cycle and Survival
We evaluated the impact of specific Drp1 inhibitors, Mdi or Dyn, various chemotherapy drugs: Oxa, 5-Fu, Doxo, pacilitaxel (taxol), and one hormonal anticancer drug, Dehydroepiandrosterone (DHEA), on cell division functionality. Comparative analysis with the control group revealed that treatment with Doxo, Oxa, Mdi, and taxol induced growth arrest at the G2/M phase in HeLa cells, while 5-Fu caused growth arrest at the S phase. Particularly, noteworthy is the pronounced sensitivity of HeLa cells to DHEA, indicating that the proliferating cell population is in the Sub-G1 phase, suggestive of possible apoptosis. However, Dyn had no impact on the cell cycle (Figure S3A). Notably, treatment with compounds like nocodazole or taxol induces cell cycle arrest and subsequent apoptosis [49]. Subsequently, our focus shifted to Mdi, Doxo, Oxa, and 5-Fu, selected for their ability to induce cell-cycle arrest at different stages. We explored how these drugs affect mitochondrial dynamics, centrosome stability, aneuploidy, and multipolar spindle formation by examining their expression patterns throughout the cell cycle in HeLa cells synchronized with a double-thymidine block. Our protein analysis revealed that Mdi and Dox treatments increased expression levels during the M phase, especially with elevated Cyclin B levels in the M+4 phase compared to the Mock group. Conversely, all four drugs led to increased Cyclin A expression, a marker of the S phase. Notably, 5-Fu-treated cells in the M+4 phase showed Cyclin D expression similar to the Mock group (Figure 3a). FACS analysis indicated that Mdi, Dox, and Oxa-treated cells remained in G2/M for 8 to 12 hours after double-thymidine block release, whereas 5-Fu-treated cells mostly progressed to the G1 phase, with only a minority remaining in G2/M. Notably, Dox induced cell death, as evidenced by an increase in the subG1 phase (Figure 3b and 3c). Taken together, these results suggest that Dox, Oxa, 5-Fu, and Mdi affect the cell cycle, mitochondrial dynamics, centrosome stability, and multipolar spindle formation.
3.5. Enhancing Sensitivity to Mitotic Arrest and Inducing Apoptosis in Various Synchronized Cells
Cell cycle arrest and subsequent apoptosis can be induced by treatment with compounds such as nocodazole or taxol [46,49], so it was hypothesized that synchronizing cells using a double thymidine block would make them more susceptible to concurrent mitotic arrest induced by Mdi-1 and chemotherapy drugs leading to HeLa cell apoptosis. CCK-8 and clonogenic assays showed that these drugs dose-dependently inhibited HeLa cell growth (Figure S3B). The clonogenic assay also confirmed their efficacy in inhibiting tumor sphere formation (Figure S3C). We further assessed pro-apoptotic and anti-apoptotic signals, including Bcl-2, Bax, Mcl-1, and Puma, which play crucial roles in caspase-dependent apoptosis. Dox increased caspase-3 levels in M-phase cells. Similarly, Mdi and Dox increased caspase-3 and PARP expression in M+4 phase cells, reduced pro-apoptotic Bcl-2 and Mcl-1, and increased anti-apoptotic Bax. Oxa and 5-Fu had similar effects but were slightly less potent than Mdi and Dox (Figure 4a). U251 and HCT116 cell lines were used to confirm that double thymidine block-induced cell synchronization enhanced sensitivity to concurrent mitotic arrest, leading to increased apoptosis when treated with Mdi and chemotherapy drugs (Figure 4b and 4c). Consistently, we observed changes in M phase Drp1 phosphorylation and mitochondrial receptor proteins in U251 and HCT116 cell lines when treated with Mdi and Dox (Figure 4d), further highlighting the presence of two distinct patterns or signals for Drp1-Ser-616 and Ser-637 phosphorylation during the M phase. These results suggest that cell synchronization through double thymidine block heightens sensitivity to concurrent mitotic arrest, resulting in increased apoptosis during Mdi and chemotherapy drug treatment. Interestingly, all drugs caused anti-mitotic arrest at the M phase suggesting that this phase is more susceptible to drugs, providing insights into potential therapeutic strategies.
3.6. Regulation of SAC Function and Mitotic Spindle Formation by a Variety of Anti-Cancer Drugs
Mdi and chemotherapeutics may play a role in regulating SAC function during cell division, so we examined the expression of key SAC proteins. The results showed that during the M phase, both Mdi and chemotherapeutics prevented CDK1 inhibitory phosphorylation, thus regulating CDK1 activity. Intriguingly, these drug treatments led to significant overexpression of all SAC components (BubR1, Mad2, CDC20, securin, CDK1, and Cyclin B) in the M+4 phase. Note that pCDK1 (T14) is a marker of the CDK1 inhibitory state; CDC27, a constitutive component of SAC for the timing of mitosis as a negative control) (Figure 5a). Additionally, these drug treatments caused Cyclin B and phosphorylated CDK1 proteins to accumulate in the mitochondria during the M+4 phase (Figure 5b). To further characterize the impact of these drugs on centrosome function, we examined spindle formation under nocodazole-induced mitotic arrest after 24 hours of treatment. The results showed that Mdi increased mitotic defects, consistent with previous findings (Figure 5C). Moreover, Dox, Oxa, and 5-Fu promoted the formation of multipolar spindles after nocodazole treatment in synchronized M-phase cells (Figure 5c). Simultaneously, we also assessed the effects of taxol and DHEA on centrosome function. The results demonstrated that taxol, which induces G2/M phase growth arrest, indeed increased mitotic defects. However, hormonal anticancer drug, DHEA had no impact on mitotic cells, indicating that DHEA has a distinct mechanism of action compared to Mdi and taxol (Figure S4A. Using Taxol as a positive control and DHEA as a negative control). To elucidate the role of Drp1 phosphorylation and its associated adaptors in the regulation of multipolar spindle formation, we conducted knockdown experiments targeting Drp1, Mff, Fis1, Mid49, or Mid51 (Figure 5d and 5e). In these knockdown experiments, we also assessed the SAC markers, including BubR1, Mad2, CDC20, securin, Cyclin B, CDK1, pCDK1 (T14), and CDC27. The data revealed that the expression of all SAC markers was heightened in response to siDrp1, siMff, and siMid51, whereas there was no significant impact with siFis1 and siMid49 (Figure 5f). These results suggest a correlation between the mitochondria fission cluster machinery and SAC function (compared to Figure 5b). It is demonstrated that reducing the expression of Fis1 or Mid49, but not Mff or Mid51, significantly eliminated multipolar spindle formation (Figure 5g). Of note, siDrp1 seemed not significantly affected multipolar spindle formation, indicating that siDrp1 was not sufficient to shutdown phosphor-Drp1-Ser-616 and phosphor-Drp1-Ser-637 (Figure 5g compared to Figure 5e). These results indicate a close association between SAC overexpression, extended M phase, and multipolar spindle formation. Furthermore, we also found that Fis1 and Mid49 play critical regulatory roles in multipolar spindle formation, while Mff and Mid51 seem to have a lesser impact on this process (Figure 5f and 5g). All these novel findings were summarized in Table 1 that could be targeted therapeutically.
4. Discussion
In this study, we investigated two clusters of mitochondrial fission signaling, phospho-Drp1-Ser-616/Mff/Mid51 and phospho-Drp1-Ser-637/Fis1/Mid49. A recent paper published in Nature introduced two distinct ways of splitting a mitochondrion: midzone fission and peripheral fission signatures [7], raising the fundamental question: do these two events coincide or correlate with mitochondrial fission signatures during the cell cycle? Herein, we present substantial evidence that these two signaling pathways align with the two distinct fission patterns during mitosis [7]. Notably, the phospho-Drp1-637/Fis1/Mid49 cluster was prominently associated with the mitochondria under various drug treatments but was not observed during the G1/S interphase. The pull-down and co-immunoprecipitation and pin-pon competition assays using Drp1-Wt, D form, and A-form mutants indicated that the two signaling clusters coexist in a stoichiometric ratio and are mutually exclusive during M-phase arrest. Future research is required to investigate the role of phosphorylation and the adaptor proteins (Mff, Fis1, Mid51, and Mid49) of Drp1, particularly by utilizing more potent anti-G1/S phase drugs. This will provide insights into how the phosphorylation status of Drp1 in conjunction with these four adaptor proteins responds to metabolic changes to form a complex (cluster) during the interphase of the cell cycle.
Functionally, the cell cycle analysis revealed that drug treatment leads to cell accumulation in the M-phase, indicating the heightened susceptibility of this phase to these drugs. However, the combined treatment of Mdi and Dox causes cell accumulation in the M+4 and subG1 phases. It is possible that some cells categorized as being in the M phase in response to Oxa and 5-Fu may have less than the duplicated amount of DNA due to entering apoptosis while arrested in G2/M. In this context, much attention has been given to the Bcl-2 protein family and caspases to understand the changes in functional cell characteristics that either predispose them to or accompany cell death. Furthermore, the formation of these two clusters was also observed in U251 and HCT116 cell lines leading to apoptosis at M+4 during mitotic arrest (Figure 4). In a clinical context, we hypothesize that impaired mitochondria, the energy powerhouse of the cell, produce impaired ATP for all M-phase kinases, their partners, and substrates. Also, the M phase might provide a more susceptible (vulnerable) environment, due in part to mitotic catastrophe possibly [50], for drug targets that cause cell cycle aberrations, resulting in M phase arrest, especially in the case of clinical anti-mitotic drugs.
Finally, the upregulation of most key components (BubR1, Mad2, CDC20, securin, Cyclin B, CDK1, and CDC27) of the SAC is essential to ensure the prolongation of the M phase, coupled with the formation of multipolar spindles (Figure 5c and Figure S4B). Additionally, we conducted RNA interference (RNAi) experiments to reduce the levels of Fis1/Mid49, while leaving Mff/Mid51 unaffected, resulting in the reversal of multipolar spindle formation (Figure 5g). It is noted that when taxol is used as a positive control, whereas DHEA is utilized as a negative control, it signifies a distinct approach (Figure S4B). These findings elucidate the crucial involvement of the Fis1 and Mid49 adaptors in the mitochondrial fission process, particularly within the phospho-Drp1-Ser637/Fis1/Mid49 cluster, suggesting their pivotal roles in this cellular mechanism (Figure 5 and Figure S4C) [6,7,8,11,47]. Interestingly, all the examined SAC proteins are located in the cytosol, whereas Cyclin B, p-CDK1(T14) (part of the Wee1 family of CDK-inhibitory kinases and crucial for Drp1-Ser616) [51], and CDK1 are found in both the cytosol and the mitochondrial portion (Figure 5b compared to Figure 1h). This observation could be explained by the increased phospho-Drp1-Ser-637, rather than the reduced phospho-Drp1-Ser616 resulting in the functional integration of mitochondria, thereby affecting SAC feedback regulation in response to anti-mitotic drugs during M phase arrest [10,51,52,53,54]. Furthermore, our data provide support for the idea that Drp1 plays a role in regulating mitochondrial stress responses during mitotic arrest, as previously suggested [55]. We found that Mdi (possibly referring to a specific compound or treatment) and chemotherapy drugs influence the function of the SAC and the dynamics of centrosomes during cell division. This influence potentially leads to mitotic abnormalities and the formation of multipolar spindles, as depicted in Figure 5c,g. Notably, Fis1 and Mid49 emerge as pivotal regulators in these processes (Figure 5f,g). Altogether, the delicate relationship among two mitochondrial fission clusters, SAC, and multipole spindle are summarized in Table 1. These discoveries provide valuable insights into the molecular mechanisms underlying the effects of these drugs on cell division and may have significant implications for cancer prognostic biomarkers and specific gene targeted therapy (Table 1). To some extent, we ask whether phospho-Drp1-Ser637/Fis1/Mid49 cluster, beyond its well-established role in mitochondrial fission, likely plays a significant part in developmental processes, neurodegenerative diseases such as Alzheimer’s disease, Huntington’s disease, and Parkinson’s disease and metabolic regulation [56,57]. Further research into this cluster could provide deeper insights into the mechanisms underlying these effects and potential therapeutic targets for related disorders. Eventually, we propose a model (Figure 6) illustrating how cellular decisions regarding mitochondrial fate influence centrosome and chromosome function during the M-phase, as well as bipolar spindle assembly. Under normal conditions, mitochondrial fission is mediated by CDK1/Cyclin B-dependent phosphorylation and Drp1-Ser616 activation [17] and proper partitioning of mitochondria is necessary for their inheritance during cell division. However, under conditions involving inhibitor insults, phosphorylated Drp1-Ser-637 drives mitophagy through activated PKA during mitotic arrest. The dynamic balance between Drp1-Ser-637 and Drp1-Ser-616, maintained in a stoichiometric ratio, affects the phospho-Drp1-Ser-637/Fis1/Mid49 signaling pathway. Noted that there are two distinct pathways for mitochondrial division, midzone fission and peripheral division (mitophagy), involving Drp1 along with four potential Drp1 adaptor proteins, namely Mff, Fis1, Mid49, and Mid51. The dashed arrow in the diagram indicates the causes and consequences of cellular decisions related to mitochondrial fate, including centrosome instability, multipolar spindle formation, chromosome instability, aneuploidy, and cell death [1,2,3,4,8,9,10,55].
5. Conclusions
In conclusion, the two phospho-Drp1 forms identified were mutually exclusive during mitosis. The phospho-Drp1-637/Fis1/Mid49 cluster, but not the phospho-Drp1-616/Mff/Mid51 cluster, not only functions in peripheral fission signature (mitophagy) but also plays a crucial role as a coordinator of the SAC, regulating centrosome aberrations (multipolar spindle formation), chromosome instability, and apoptosis during mitotic arrest, as depicted in the model (Figure 6). These orchestrated mechanisms uncovered the phospho-Drp1-637/Fis1/Mid49 cluster as a key drive of mitophagy and in combination with anti-mitotic drug treatments that could be targeted therapeutically (Table 1).
Supplementary Materials
The following supporting information can be downloaded at: Preprints.org, Figure S1: Dynamics of Drp1 Phosphorylations during Cell Cycle Progression.; Figure S2: Effects of Mdi, Doxo, Oxa, and 5-Fu on Drp1 Phosphorylation and Mitochondrial Receptor Proteins. Figure S3: Different drugs induce cell death and G2/M cell cycle arrest in HeLa cells. Figure S4: Induced in nocodazole-treated mitotic HeLa cells are multiple spindle foci by taxol and DHEA.
Author Contributions
Conceptualization, H.J.K., C.Y.H., and Y.R.H; methodology, H.J.K., T.H.N., P.Y.T. and Y. R. H; investigation, H.J.K., C.Y.T., T.H.N., P.Y.T., N.S.W and Y. R. H; formal analysis, H.J.K., C.L.S., C.Y.T, A.S.L., and J.K.L.; funding acquisition, C.Y.T, J.K.L., and Y.R.H; resources, T.S.C., C.Y.H., C.L.S., and A.S.L; writing—origifnal draft preparation, H.J.K., S.J.C., and Y.R.H.; writing—review and editing, H.J.K., C.Y.T., S.J.C., T.S.C., C.Y.H., C.L.S., and Y.R.H. All authors have read and agreed to the published version of the manuscript.
Funding
This research was funded by National Science and Technology Council, Taiwan, NSTC 112-2622-B-037-002 (awarded to Y.R.H); 112-2314-B-037-107 (awarded to J.K.L); 111-2320-B-037-028 (awarded to Y.R.H); 111-2314-B-037-095-My2 (awarded to C.Y.T); NSYSU-KMU Joint Research Project, Taiwan NSYSUKMU110-P009 (awarded to Y.R.H); Kaohsiung Medical University Grant No. KMU-DK(A)112007; KMU-DK(A)113004 (awarded to Y.R.H). Kaohsiung Medical University Hospital Grant, KMUH112-2R33 (awarded to J.K.L).
Institutional Review Board Statement
N/A
Informed Consent Statement
N/A
Data Availability Statement
All data generated or analyzed in this study are included in this published article.
Acknowledgments
N/A
Conflicts of Interest
The authors declare no conflict of interest.
References
- Sinha, D.; Duijf, P.H.G.; Khanna, K.K. Mitotic slippage: an old tale with a new twist. Cell Cycle 2019, 18, 7–15. [Google Scholar] [CrossRef] [PubMed]
- Ryniawec, J.M.; Rogers, G.C. Centrosome instability: when good centrosomes go bad. Cell Mol Life Sci 2021, 78, 6775–6795. [Google Scholar] [CrossRef] [PubMed]
- Weaver, B.A.; Silk, A.D.; Montagna, C.; Verdier-Pinard, P.; Cleveland, D.W. Aneuploidy acts both oncogenically and as a tumor suppressor. Cancer Cell 2007, 11, 25–36. [Google Scholar] [CrossRef] [PubMed]
- Nigg, E.A. Centrosome aberrations: cause or consequence of cancer progression? Nature Reviews Cancer 2002, 2, 815–825. [Google Scholar] [CrossRef] [PubMed]
- Gordon, D.J.; Resio, B.; Pellman, D. Causes and consequences of aneuploidy in cancer. Nat Rev Genet 2012, 13, 189–203. [Google Scholar] [CrossRef] [PubMed]
- Kleele, T.; Rey, T.; Winter, J.; Zaganelli, S.; Mahecic, D.; Perreten Lambert, H.; Ruberto, F.P.; Nemir, M.; Wai, T.; Pedrazzini, T., et al. Distinct fission signatures predict mitochondrial degradation or biogenesis. Nature 2021, 593, 435–439. [CrossRef]
- Chakrabarti, R.; Higgs, H. Revolutionary view of two ways to split a mitochondrion. Nature 2021, 593. [Google Scholar] [CrossRef] [PubMed]
- Ko, H.J.; Tsai, C.Y.; Chiou, S.J.; Lai, Y.L.; Wang, C.H.; Cheng, J.T.; Chuang, T.H.; Huang, C.F.; Kwan, A.L.; Loh, J.K., et al. The Phosphorylation Status of Drp1-Ser637 by PKA in Mitochondrial Fission Modulates Mitophagy via PINK1/Parkin to Exert Multipolar Spindles Assembly during Mitosis. Biomolecules 2021, 11. [CrossRef]
- Pangou, E.; Sumara, I. The Multifaceted Regulation of Mitochondrial Dynamics During Mitosis. Front Cell Dev Biol 2021, 9, 767221. [Google Scholar] [CrossRef]
- Ruan, W.; Lim, H.H.; Surana, U. Mapping Mitotic Death: Functional Integration of Mitochondria, Spindle Assembly Checkpoint and Apoptosis. Front Cell Dev Biol 2018, 6, 177. [Google Scholar] [CrossRef]
- Wu, N.S.; Ma, I.C.; Lin, Y.F.; Ko, H.J.; Loh, J.K.; Hong, Y.R. The mystery of phospho-Drp1 with four adaptors in cell cycle: when mitochondrial fission couples to cell fate decisions. Cell Cycle, 2485. [Google Scholar] [CrossRef]
- Santel, A.; Frank, S. Shaping mitochondria: The complex posttranslational regulation of the mitochondrial fission protein DRP1. IUBMB Life 2008, 60, 448–455. [Google Scholar] [CrossRef] [PubMed]
- Chang, C.R.; Blackstone, C. Dynamic regulation of mitochondrial fission through modification of the dynamin-related protein Drp1. Ann N Y Acad Sci 2010, 1201, 34–39. [Google Scholar] [CrossRef] [PubMed]
- Chang, C.R.; Blackstone, C. Cyclic AMP-dependent protein kinase phosphorylation of Drp1 regulates its GTPase activity and mitochondrial morphology. J Biol Chem 2007, 282, 21583–21587. [Google Scholar] [CrossRef] [PubMed]
- Cribbs, J.T.; Strack, S. Reversible phosphorylation of Drp1 by cyclic AMP-dependent protein kinase and calcineurin regulates mitochondrial fission and cell death. EMBO Rep 2007, 8, 939–944. [Google Scholar] [CrossRef] [PubMed]
- Cereghetti, G.M.; Stangherlin, A.; Martins de Brito, O.; Chang, C.R.; Blackstone, C.; Bernardi, P.; Scorrano, L. Dephosphorylation by calcineurin regulates translocation of Drp1 to mitochondria. Proc Natl Acad Sci U S A 2008, 105, 15803–15808. [Google Scholar] [CrossRef] [PubMed]
- Taguchi, N.; Ishihara, N.; Jofuku, A.; Oka, T.; Mihara, K. Mitotic phosphorylation of dynamin-related GTPase Drp1 participates in mitochondrial fission. J Biol Chem 2007, 282, 11521–11529. [Google Scholar] [CrossRef] [PubMed]
- Chou, C.H.; Lin, C.C.; Yang, M.C.; Wei, C.C.; Liao, H.D.; Lin, R.C.; Tu, W.Y.; Kao, T.C.; Hsu, C.M.; Cheng, J.T. , et al. GSK3beta-mediated Drp1 phosphorylation induced elongated mitochondrial morphology against oxidative stress. PLoS One 2012, 7, e49112. [Google Scholar] [CrossRef] [PubMed]
- Youle, R.J.; van der Bliek, A.M. Mitochondrial fission, fusion, and stress. Science 2012, 337, 1062–1065. [Google Scholar] [CrossRef]
- Palmer, C.S.; Osellame, L.D.; Laine, D.; Koutsopoulos, O.S.; Frazier, A.E.; Ryan, M.T. MiD49 and MiD51, new components of the mitochondrial fission machinery. EMBO Rep 2011, 12, 565–573. [Google Scholar] [CrossRef]
- Elgass, K.; Pakay, J.; Ryan, M.T.; Palmer, C.S. Recent advances into the understanding of mitochondrial fission. Biochim Biophys Acta 2013, 1833, 150–161. [Google Scholar] [CrossRef]
- Stojanovski, D.; Koutsopoulos, O.S.; Okamoto, K.; Ryan, M.T. Levels of human Fis1 at the mitochondrial outer membrane regulate mitochondrial morphology. Journal of Cell Science 2004, 117, 1201–1210. [Google Scholar] [CrossRef] [PubMed]
- Suzuki, M.; Jeong, S.-Y.; Karbowski, M.; Youle, R.J.; Tjandra, N. The Solution Structure of Human Mitochondria Fission Protein Fis1 Reveals a Novel TPR-like Helix Bundle. Journal of Molecular Biology 2003, 334, 445–458. [Google Scholar] [CrossRef] [PubMed]
- Gandre-Babbe, S.; van der Bliek, A.M. The Novel Tail-anchored Membrane Protein Mff Controls Mitochondrial and Peroxisomal Fission in Mammalian Cells. Molecular Biology of the Cell 2008, 19, 2402–2412. [Google Scholar] [CrossRef] [PubMed]
- Mogensen, M.M. Microtubule release and capture in epithelial cells. Biol Cell 1999, 91, 331–341. [Google Scholar] [CrossRef] [PubMed]
- Abal, M.; Piel, M.; Bouckson-Castaing, V.; Mogensen, M.; Sibarita, J.B.; Bornens, M. Microtubule release from the centrosome in migrating cells. J Cell Biol 2002, 159, 731–737. [Google Scholar] [CrossRef] [PubMed]
- Bugnard, E.; Zaal, K.J.; Ralston, E. Reorganization of microtubule nucleation during muscle differentiation. Cell Motil Cytoskeleton 2005, 60, 1–13. [Google Scholar] [CrossRef] [PubMed]
- Boveri, T. Concerning the origin of malignant tumours by Theodor Boveri. Translated and annotated by Henry Harris. J Cell Sci 2008, 121 Suppl 1, 1–84. [Google Scholar] [CrossRef]
- Bornens, M. Centrosome composition and microtubule anchoring mechanisms. Curr Opin Cell Biol 2002, 14, 25–34. [Google Scholar] [CrossRef] [PubMed]
- Bettencourt-Dias, M.; Glover, D.M. Centrosome biogenesis and function: centrosomics brings new understanding. Nat Rev Mol Cell Biol 2007, 8, 451–463. [Google Scholar] [CrossRef] [PubMed]
- Lane, H.A.; Nigg, E.A. Antibody microinjection reveals an essential role for human polo-like kinase 1 (Plk1) in the functional maturation of mitotic centrosomes. J Cell Biol 1996, 135, 1701–1713. [Google Scholar] [CrossRef]
- Fry, A.M.; Meraldi, P.; Nigg, E.A. A centrosomal function for the human Nek2 protein kinase, a member of the NIMA family of cell cycle regulators. Embo j 1998, 17, 470–481. [Google Scholar] [CrossRef] [PubMed]
- Casenghi, M.; Meraldi, P.; Weinhart, U.; Duncan, P.I.; Körner, R.; Nigg, E.A. Polo-like kinase 1 regulates Nlp, a centrosome protein involved in microtubule nucleation. Dev Cell 2003, 5, 113–125. [Google Scholar] [CrossRef] [PubMed]
- Casenghi, M.; Barr, F.A.; Nigg, E.A. Phosphorylation of Nlp by Plk1 negatively regulates its dynein-dynactin-dependent targeting to the centrosome. J Cell Sci 2005, 118, 5101–5108. [Google Scholar] [CrossRef] [PubMed]
- Meraldi, P.; Honda, R.; Nigg, E.A. Aurora kinases link chromosome segregation and cell division to cancer susceptibility. Curr Opin Genet Dev 2004, 14, 29–36. [Google Scholar] [CrossRef] [PubMed]
- Mayor, T.; Meraldi, P.; Stierhof, Y.D.; Nigg, E.A.; Fry, A.M. Protein kinases in control of the centrosome cycle. FEBS Lett 1999, 452, 92–95. [Google Scholar] [CrossRef] [PubMed]
- Donthamsetty, S.; Brahmbhatt, M.; Pannu, V.; Rida, P.C.; Ramarathinam, S.; Ogden, A.; Cheng, A.; Singh, K.K.; Aneja, R. Mitochondrial genome regulates mitotic fidelity by maintaining centrosomal homeostasis. Cell Cycle 2014, 13, 2056–2063. [Google Scholar] [CrossRef] [PubMed]
- Srivastava, P.; Panda, D. Rotenone inhibits mammalian cell proliferation by inhibiting microtubule assembly through tubulin binding. Febs j 2007, 274, 4788–4801. [Google Scholar] [CrossRef] [PubMed]
- Moore, A.; Golden, A. Hypothesis: Bifunctional mitochondrial proteins have centrosomal functions. Environ Mol Mutagen 2009, 50, 637–648. [Google Scholar] [CrossRef] [PubMed]
- Kashatus, D.F.; Lim, K.H.; Brady, D.C.; Pershing, N.L.; Cox, A.D.; Counter, C.M. RALA and RALBP1 regulate mitochondrial fission at mitosis. Nat Cell Biol 2011, 13, 1108–1115. [Google Scholar] [CrossRef]
- Lee, S.; Lee, K.S.; Huh, S.; Liu, S.; Lee, D.Y.; Hong, S.H.; Yu, K.; Lu, B. Polo Kinase Phosphorylates Miro to Control ER-Mitochondria Contact Sites and Mitochondrial Ca(2+) Homeostasis in Neural Stem Cell Development. Dev Cell 2016, 37, 174–189. [Google Scholar] [CrossRef]
- Blom, N.; Sicheritz-Pontén, T.; Gupta, R.; Gammeltoft, S.; Brunak, S. Prediction of post-translational glycosylation and phosphorylation of proteins from the amino acid sequence. Proteomics 2004, 4, 1633–1649. [Google Scholar] [CrossRef] [PubMed]
- Palmer, C.S.; Elgass, K.D.; Parton, R.G.; Osellame, L.D.; Stojanovski, D.; Ryan, M.T. Adaptor proteins MiD49 and MiD51 can act independently of Mff and Fis1 in Drp1 recruitment and are specific for mitochondrial fission. J Biol Chem 2013, 288, 27584–27593. [Google Scholar] [CrossRef] [PubMed]
- Zhang, Z.; Liu, L.; Wu, S.; Xing, D. Drp1, Mff, Fis1, and MiD51 are coordinated to mediate mitochondrial fission during UV irradiation-induced apoptosis. Faseb j 2016, 30, 466–476. [Google Scholar] [CrossRef] [PubMed]
- Zhou, J.Y.; Ma, W.L.; Liang, S.; Zeng, Y.; Shi, R.; Yu, H.L.; Xiao, W.W.; Zheng, W.L. Analysis of microRNA expression profiles during the cell cycle in synchronized HeLa cells. BMB Rep 2009, 42, 593–598. [Google Scholar] [CrossRef] [PubMed]
- Losón, O.C.; Song, Z.; Chen, H.; Chan, D.C. Fis1, Mff, MiD49, and MiD51 mediate Drp1 recruitment in mitochondrial fission. Mol Biol Cell 2013, 24, 659–667. [Google Scholar] [CrossRef] [PubMed]
- Yu, R.; Liu, T.; Ning, C.; Tan, F.; Jin, S.B.; Lendahl, U.; Zhao, J.; Nistér, M. The phosphorylation status of Ser-637 in dynamin-related protein 1 (Drp1) does not determine Drp1 recruitment to mitochondria. J Biol Chem 2019, 294, 17262–17277. [Google Scholar] [CrossRef]
- Pangou, E.; Bielska, O.; Guerber, L.; Schmucker, S.; Agote-Arán, A.; Ye, T.; Liao, Y.; Puig-Gamez, M.; Grandgirard, E.; Kleiss, C. , et al. A PKD-MFF signaling axis couples mitochondrial fission to mitotic progression. Cell Reports 2021, 35, 109129. [Google Scholar] [CrossRef]
- Westrate, L.M.; Sayfie, A.D.; Burgenske, D.M.; MacKeigan, J.P. Persistent Mitochondrial Hyperfusion Promotes G2/M Accumulation and Caspase-Dependent Cell Death. PLOS ONE 2014, 9, e91911. [Google Scholar] [CrossRef] [PubMed]
- Castedo, M.; Perfettini, J.L.; Roumier, T.; Andreau, K.; Medema, R.; Kroemer, G. Cell death by mitotic catastrophe: a molecular definition. Oncogene 2004, 23, 2825–2837. [Google Scholar] [CrossRef]
- Nakanishi, M.; Ando, H.; Watanabe, N.; Kitamura, K.; Ito, K.; Okayama, H.; Miyamoto, T.; Agui, T.; Sasaki, M. Identification and characterization of human Wee1B, a new member of the Wee1 family of Cdk-inhibitory kinases. Genes to Cells 2000, 5, 839–847. [Google Scholar] [CrossRef]
- Yu, H. Cdc20: a WD40 activator for a cell cycle degradation machine. Mol Cell 2007, 27, 3–16. [Google Scholar] [CrossRef] [PubMed]
- O’Farrell, P.H. Triggering the all-or-nothing switch into mitosis. Trends in Cell Biology 2001, 11, 512–519. [Google Scholar] [CrossRef] [PubMed]
- Coulonval, K.; Kooken, H.; Roger, P.P. Coupling of T161 and T14 phosphorylations protects cyclin B-CDK1 from premature activation. Mol Biol Cell 2011, 22, 3971–3985. [Google Scholar] [CrossRef] [PubMed]
- Peña-Blanco, A.; Haschka, M.D.; Jenner, A.; Zuleger, T.; Proikas-Cezanne, T.; Villunger, A.; García-Sáez, A.J. Drp1 modulates mitochondrial stress responses to mitotic arrest. Cell Death Differ 2020, 27, 2620–2634. [Google Scholar] [CrossRef] [PubMed]
- Oliver, D.; Reddy, P.H. Dynamics of Dynamin-Related Protein 1 in Alzheimer’s Disease and Other Neurodegenerative Diseases. Cells 2019, 8. [Google Scholar] [CrossRef]
- Bhatti, J.S.; Kaur, S.; Mishra, J.; Dibbanti, H.; Singh, A.; Reddy, A.P.; Bhatti, G.K.; Reddy, P.H. Targeting dynamin-related protein-1 as a potential therapeutic approach for mitochondrial dysfunction in Alzheimer’s disease. Biochim Biophys Acta Mol Basis Dis 2023, 1869, 166798. [Google Scholar] [CrossRef]
Figure 1.
Two signaling clusters of mitochondrial fission. (a) HeLa cell synchronization using double-thymidine block, analyzed by flow cytometry for cell cycle phase distribution. (b) Cell cycle phase distribution post-thymidine treatment release. (c) G1/S synchronized HeLa cells re-entering the cell cycle in fresh medium showing, Cyclin A, Cyclin B, and Cyclin D expression at different time points. (d) Double-thymidine synchronization process flowchart. (e) Cell cycle progression during Mdi and Dyn treatment was assessed by western blotting. (f) Dynamic changes in Drp1 phosphorylation and mitochondrial adaptor protein levels during Mdi and Dyn treatment. (g) HeLa cell synchronization was achieved using the double-thymidine block method. Subsequently, cells were divided into untreated and treated groups, and then exposed to Mdi, Dox, Oxa, and 5-Fu. Cell samples were collected at 1 hour (G1 phase), 4 hours (S phase), 8 hours (M phase), and 12 hours (M + 4 hours phase), and the levels of the specified proteins were assessed by western blotting. (h) Cytoplasmic and mitochondrial fractions were separated, and the protein levels of total Drp1, hosphor-Drp1 (Ser-616), hosphor-Drp1 (Ser-637), Mff, Fis1, Mid49, and Mid51 were quantified. VDAC1 served as an internal loading control, and subcellular purity was verified by checking GAPDH. NC (normal control) denotes samples without synchronized or double-thymidine treatment, while M (Mock) represents samples subjected to synchronized or double-thymidine treatment.
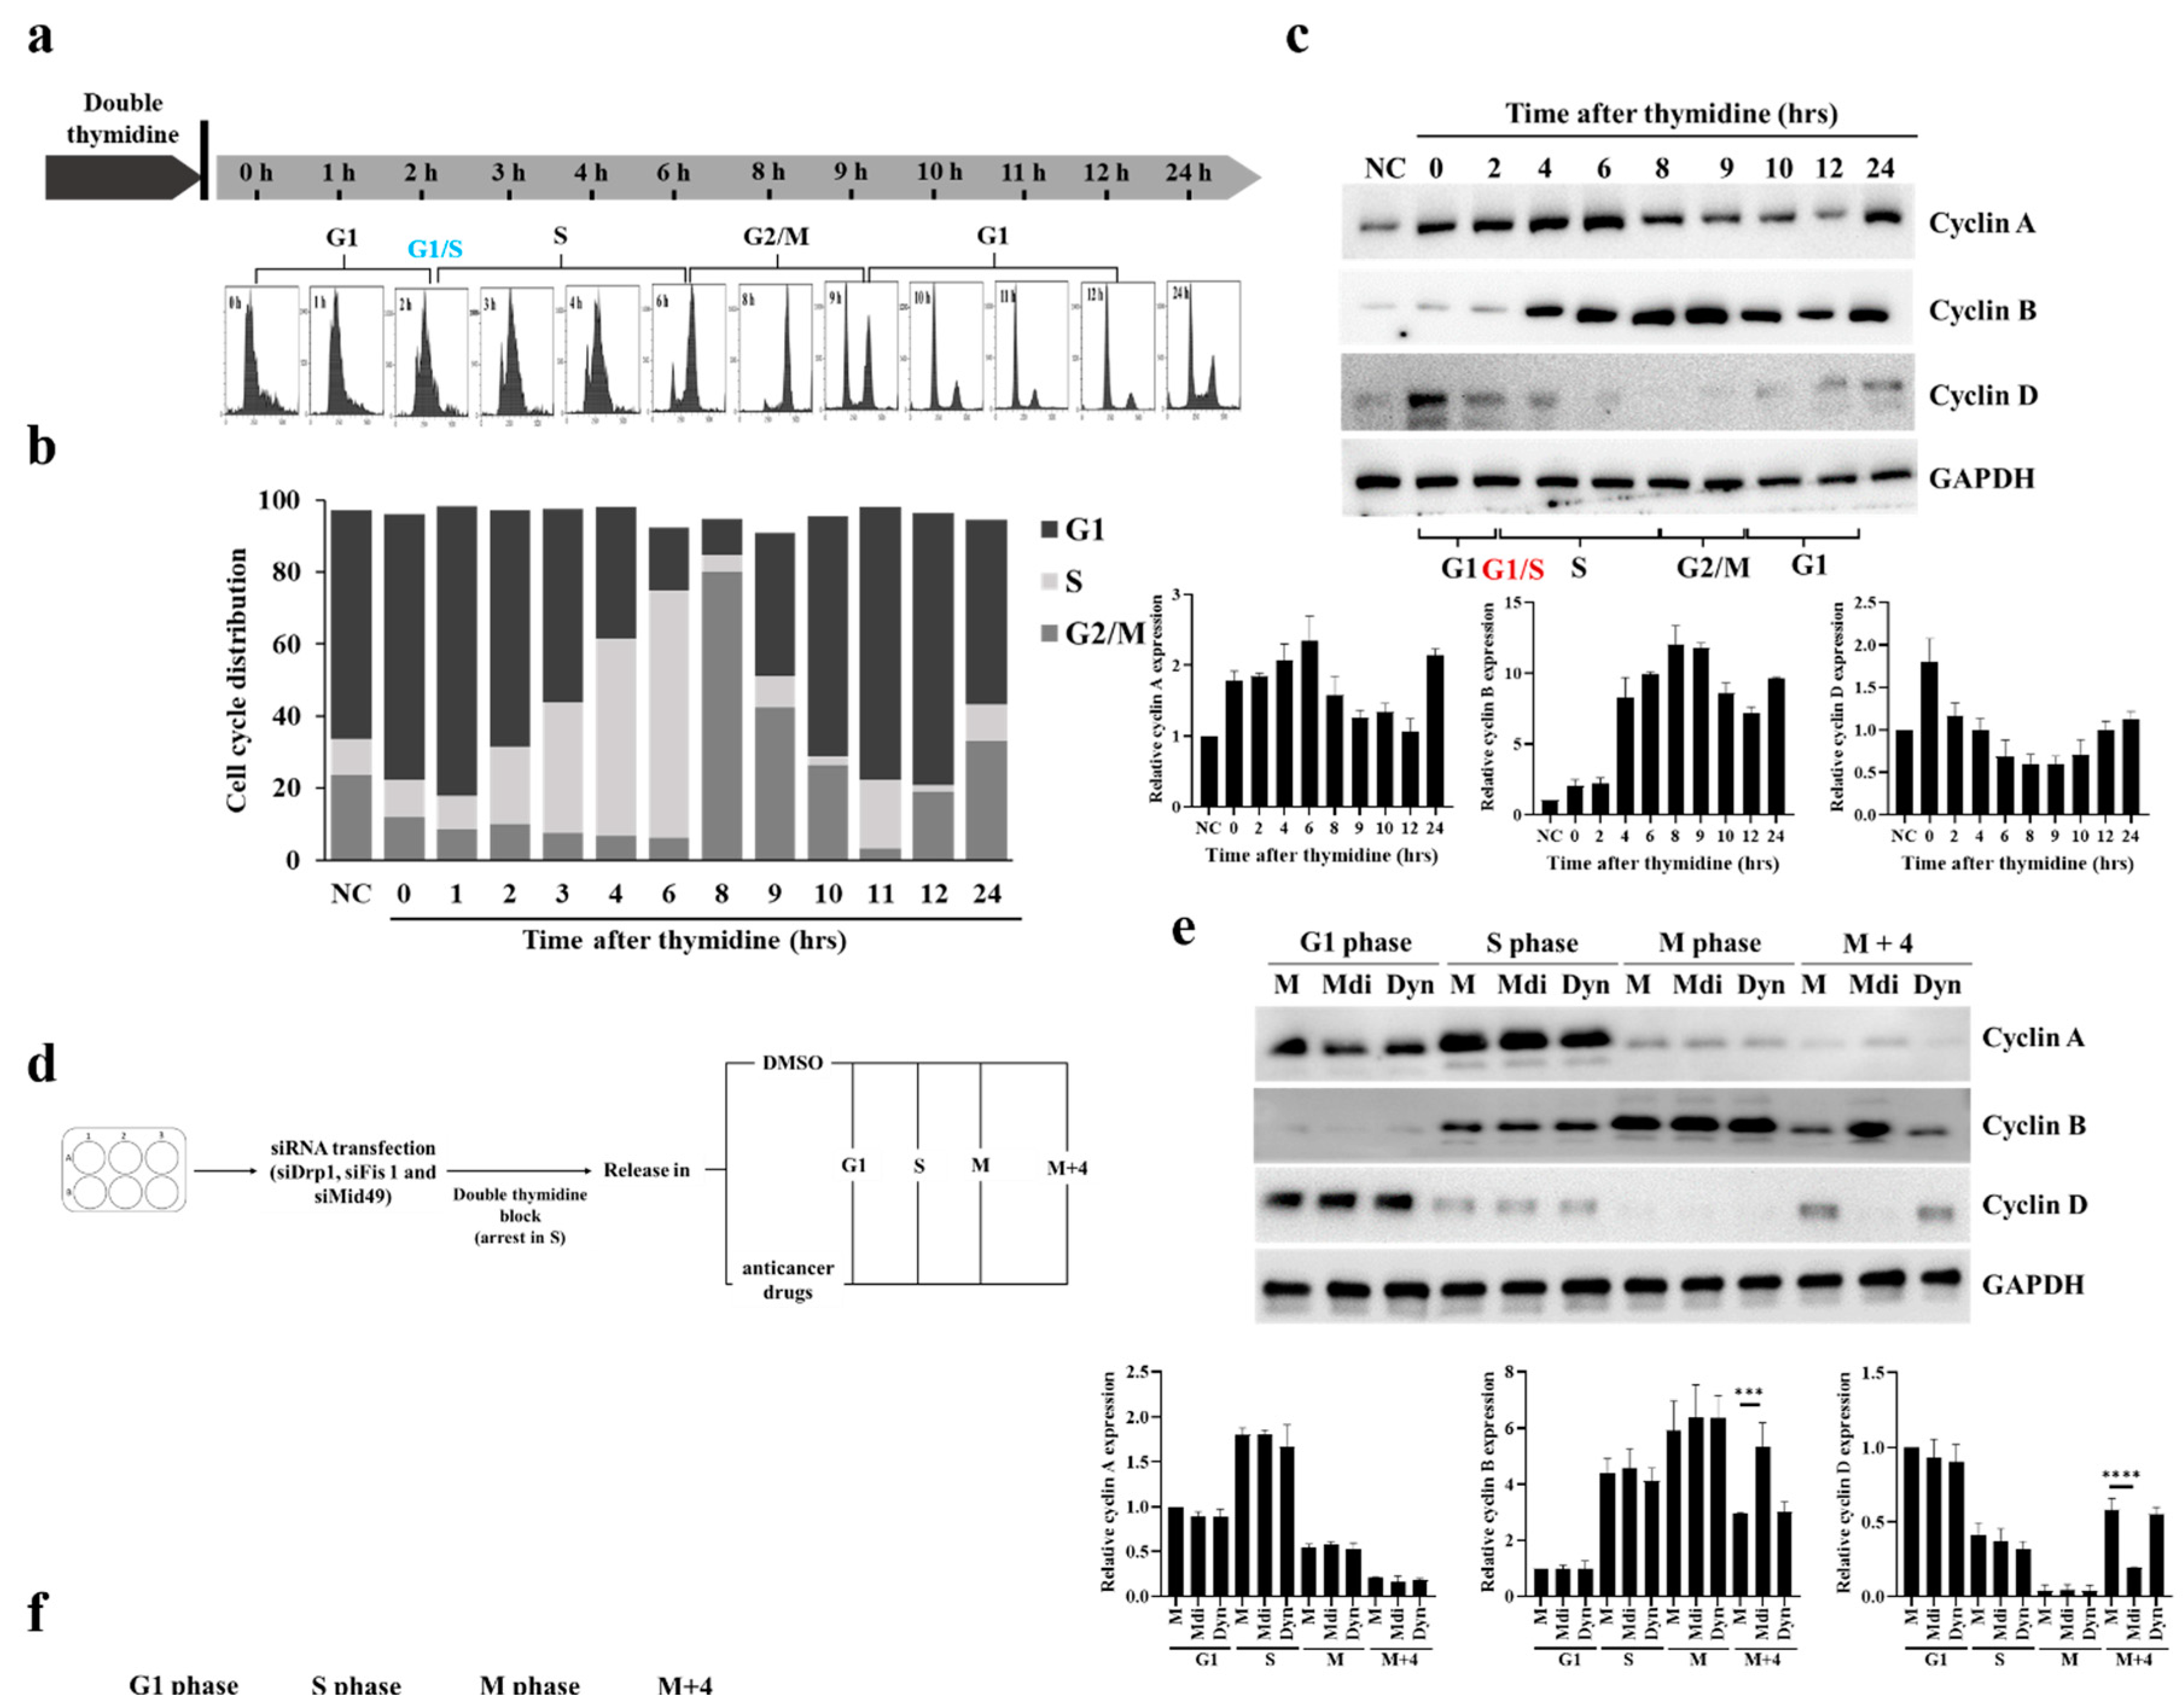
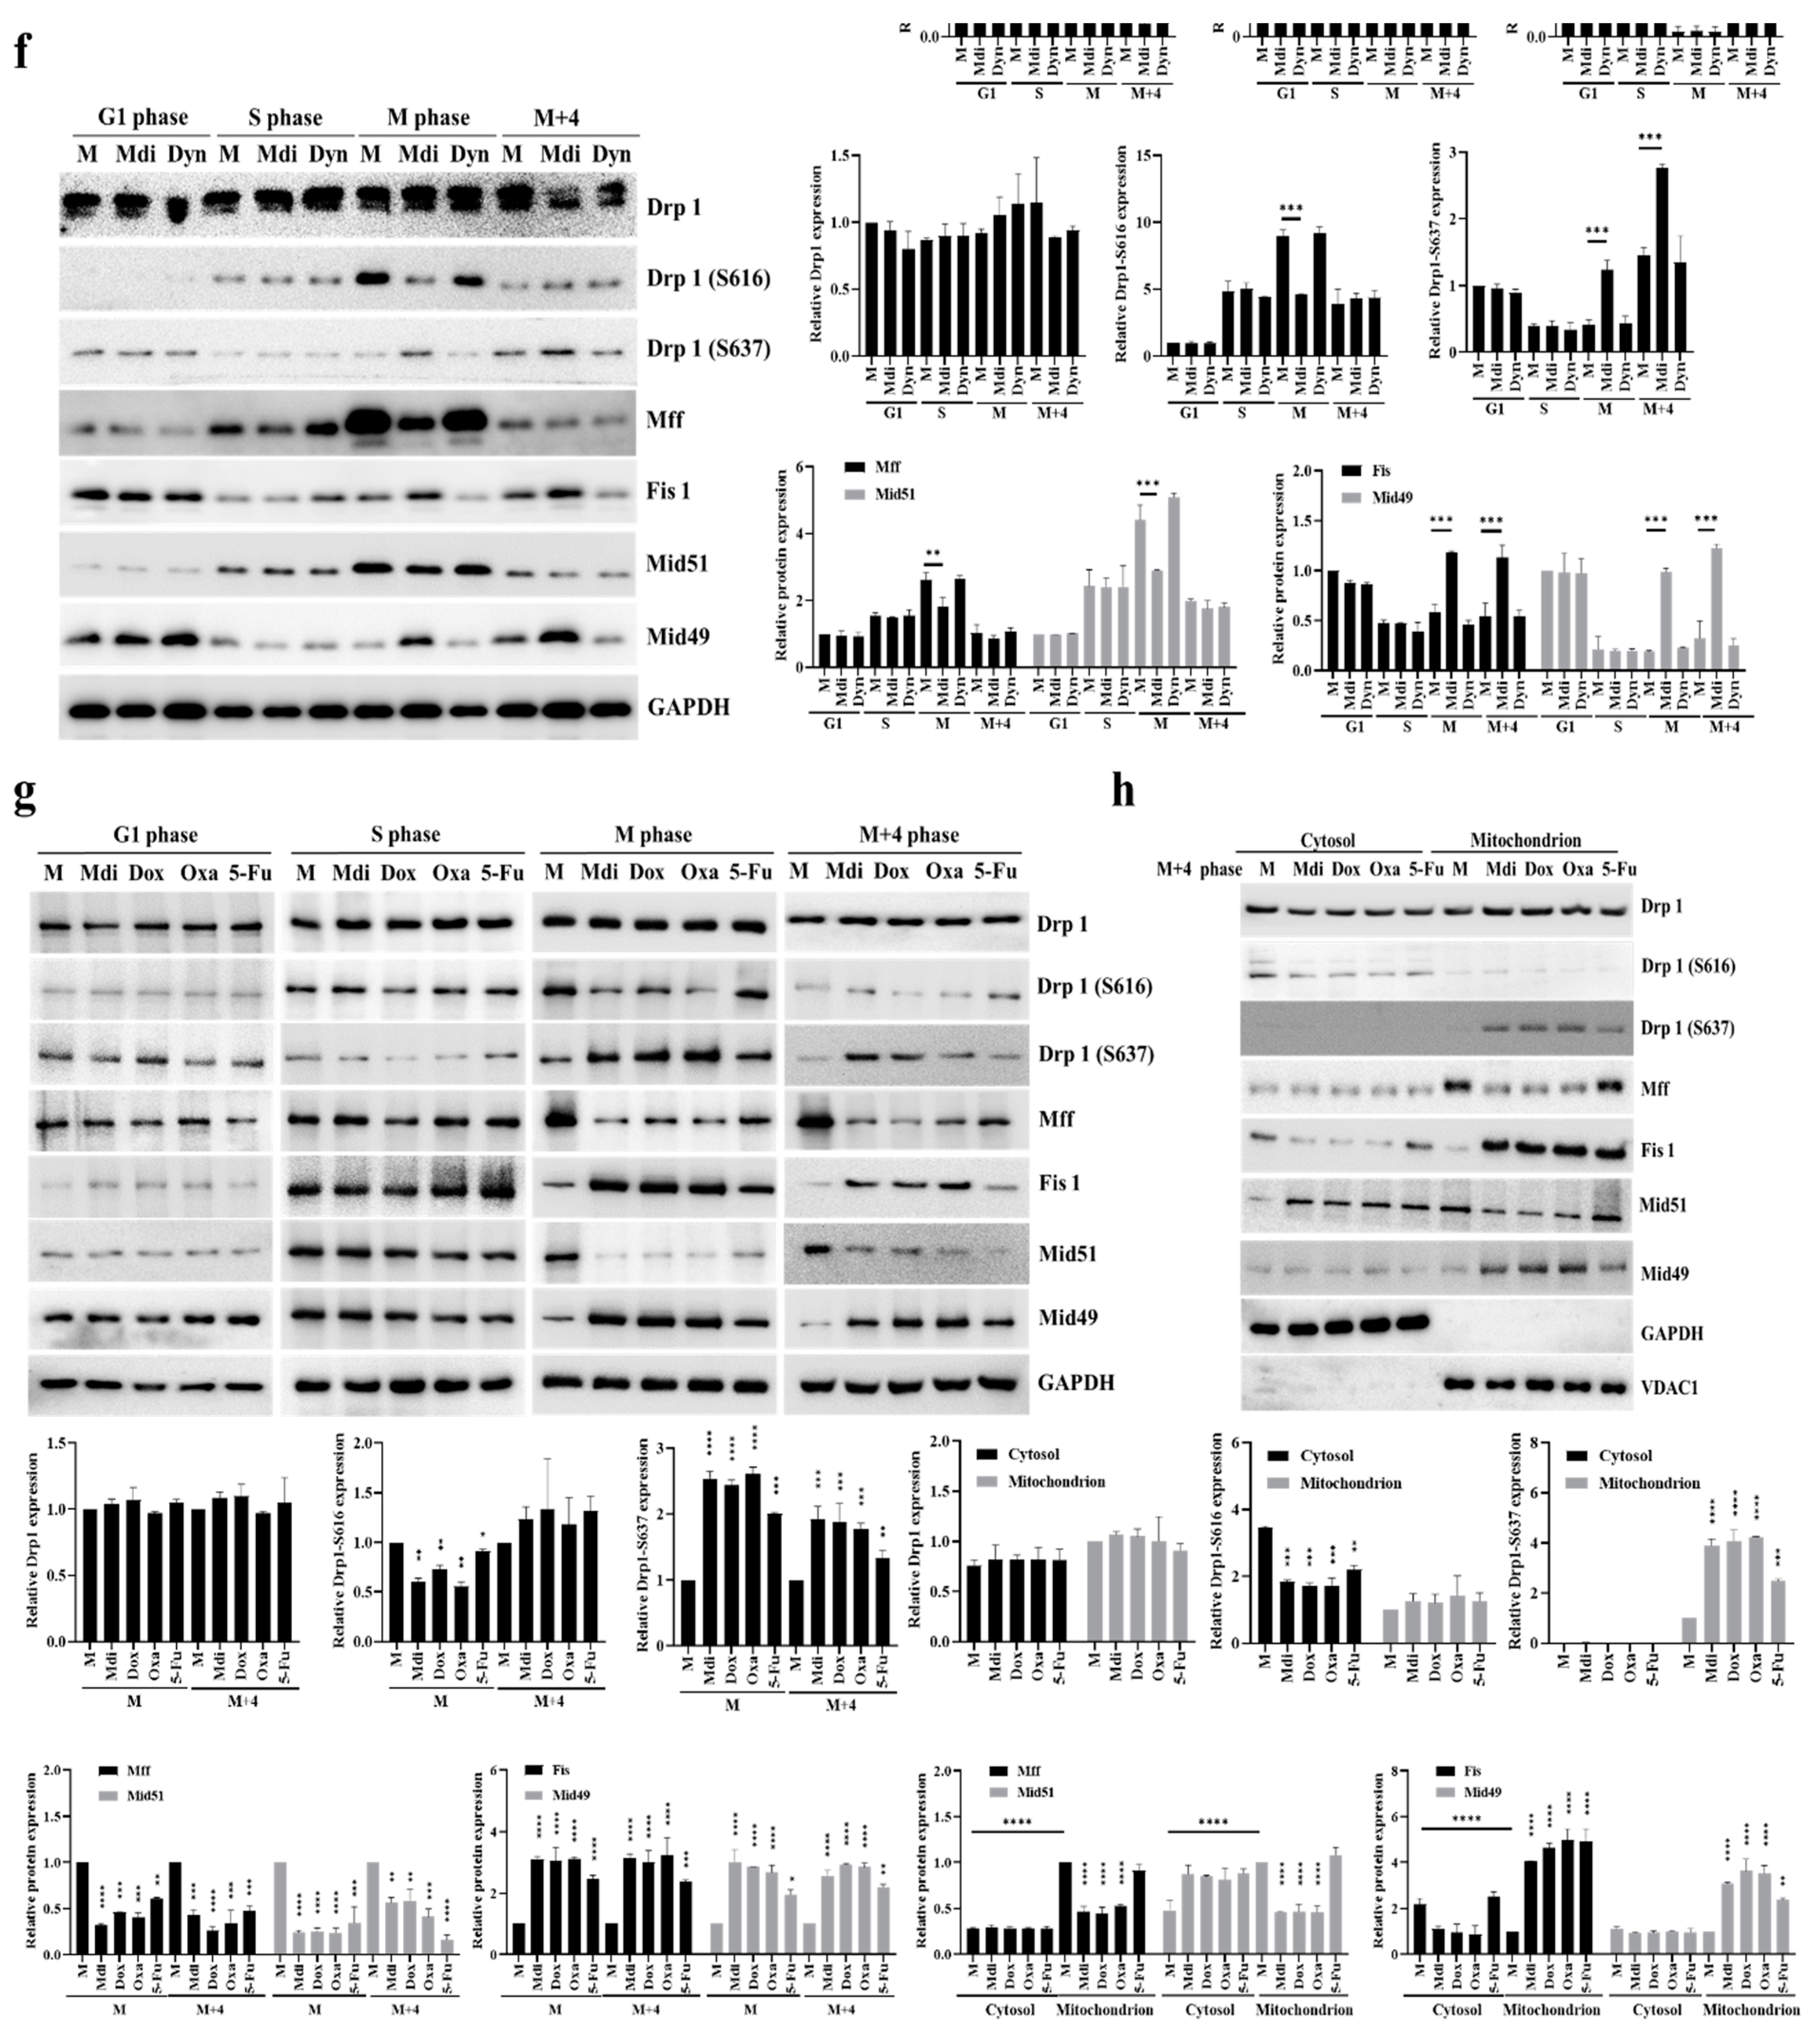
Figure 2.
The delicate interplay of two signaling clusters (Mff, Fis1, Mid49, and Mid51) in phospho-Drp1 at M-phase. (a) Co-immunoprecipitation (left panel) and pull-down (right panel) experiments revealed Mff interactions with Drp1 variants (Drp1-Wt, Drp1-S637D, Drp1-S637A, Drp1-S616D, Drp1-S616A). Mff overexpression enhanced interactions between Drp1Ser-616 and exogenous Drp1-S616A with Mid51, while interactions were weaker with Drp1-S616D. (b) Fis1 overexpression resulted in interactions between endogenous Drp1-Ser-637 and exogenous Drp1-S637A with Mid49. (c) Nocodazole treatment induced Drp1 phosphorylation at Ser-637, reducing Drp1 Ser-616 expression in Drp1S637A overexpression. (d) Forskolin treatment phosphorylated Drp1 at Ser-637, increasing Drp1-Ser-616 levels with Drp1-S616A overexpression. (e) During Mdi and Dox treatment, Drp1 phosphorylation patterns and mitochondrial receptor protein levels changed in the M phase. NC (normal control) denotes samples without synchronized or double-thymidine treatment, while M (Mock) represents samples subjected to synchronized or double-thymidine treatment.
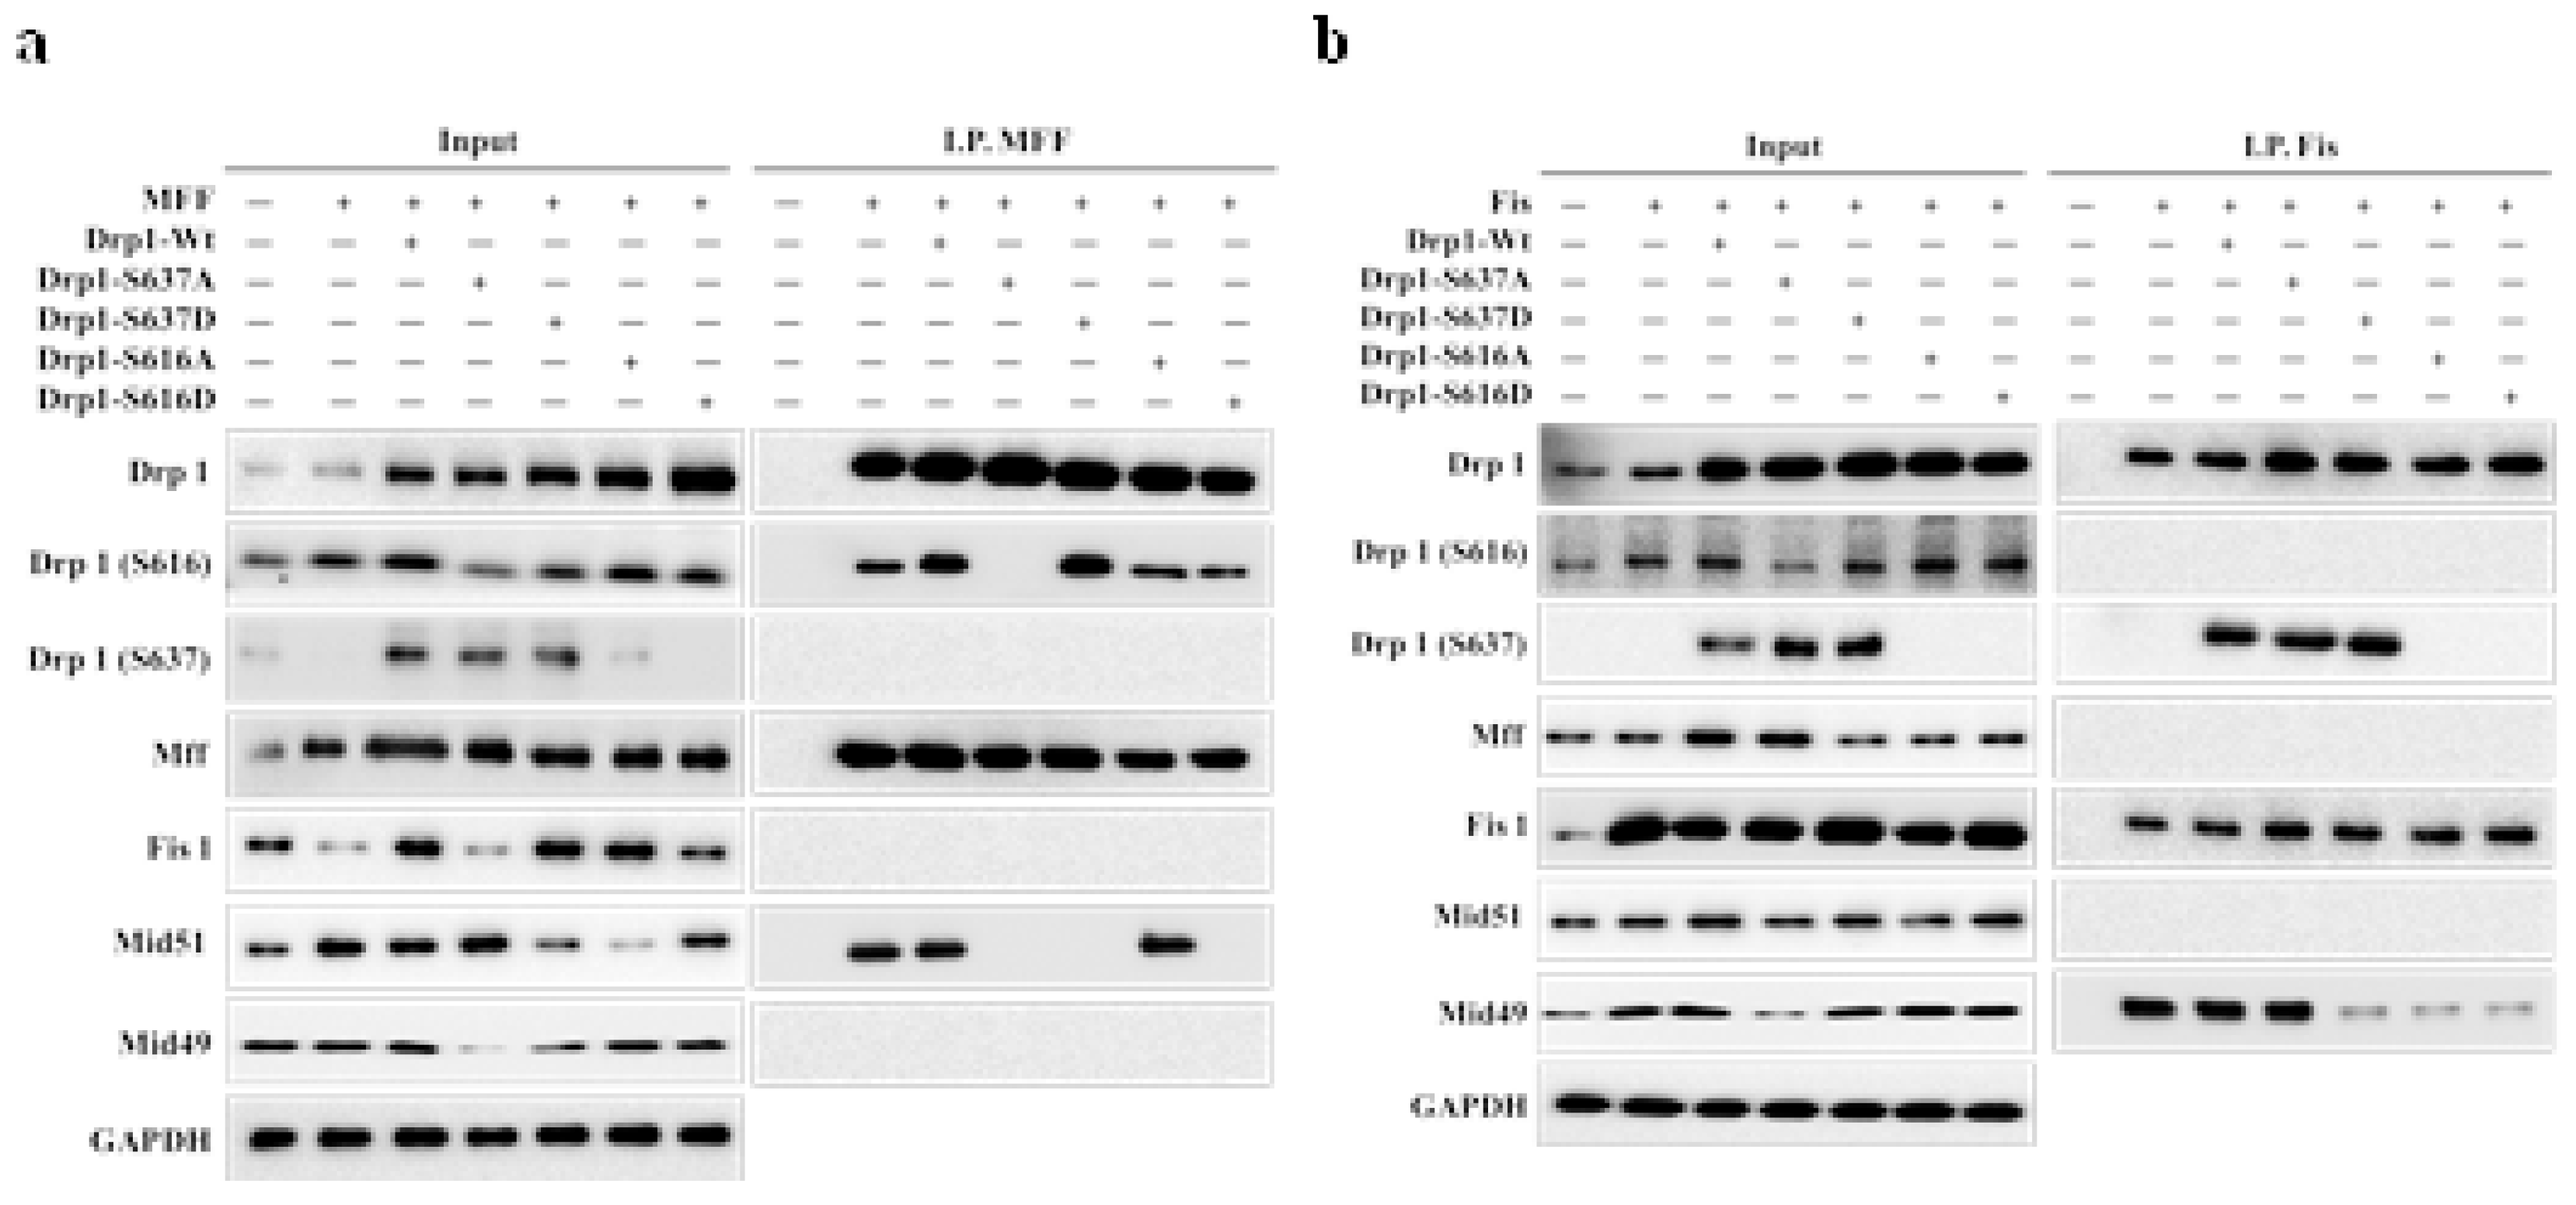
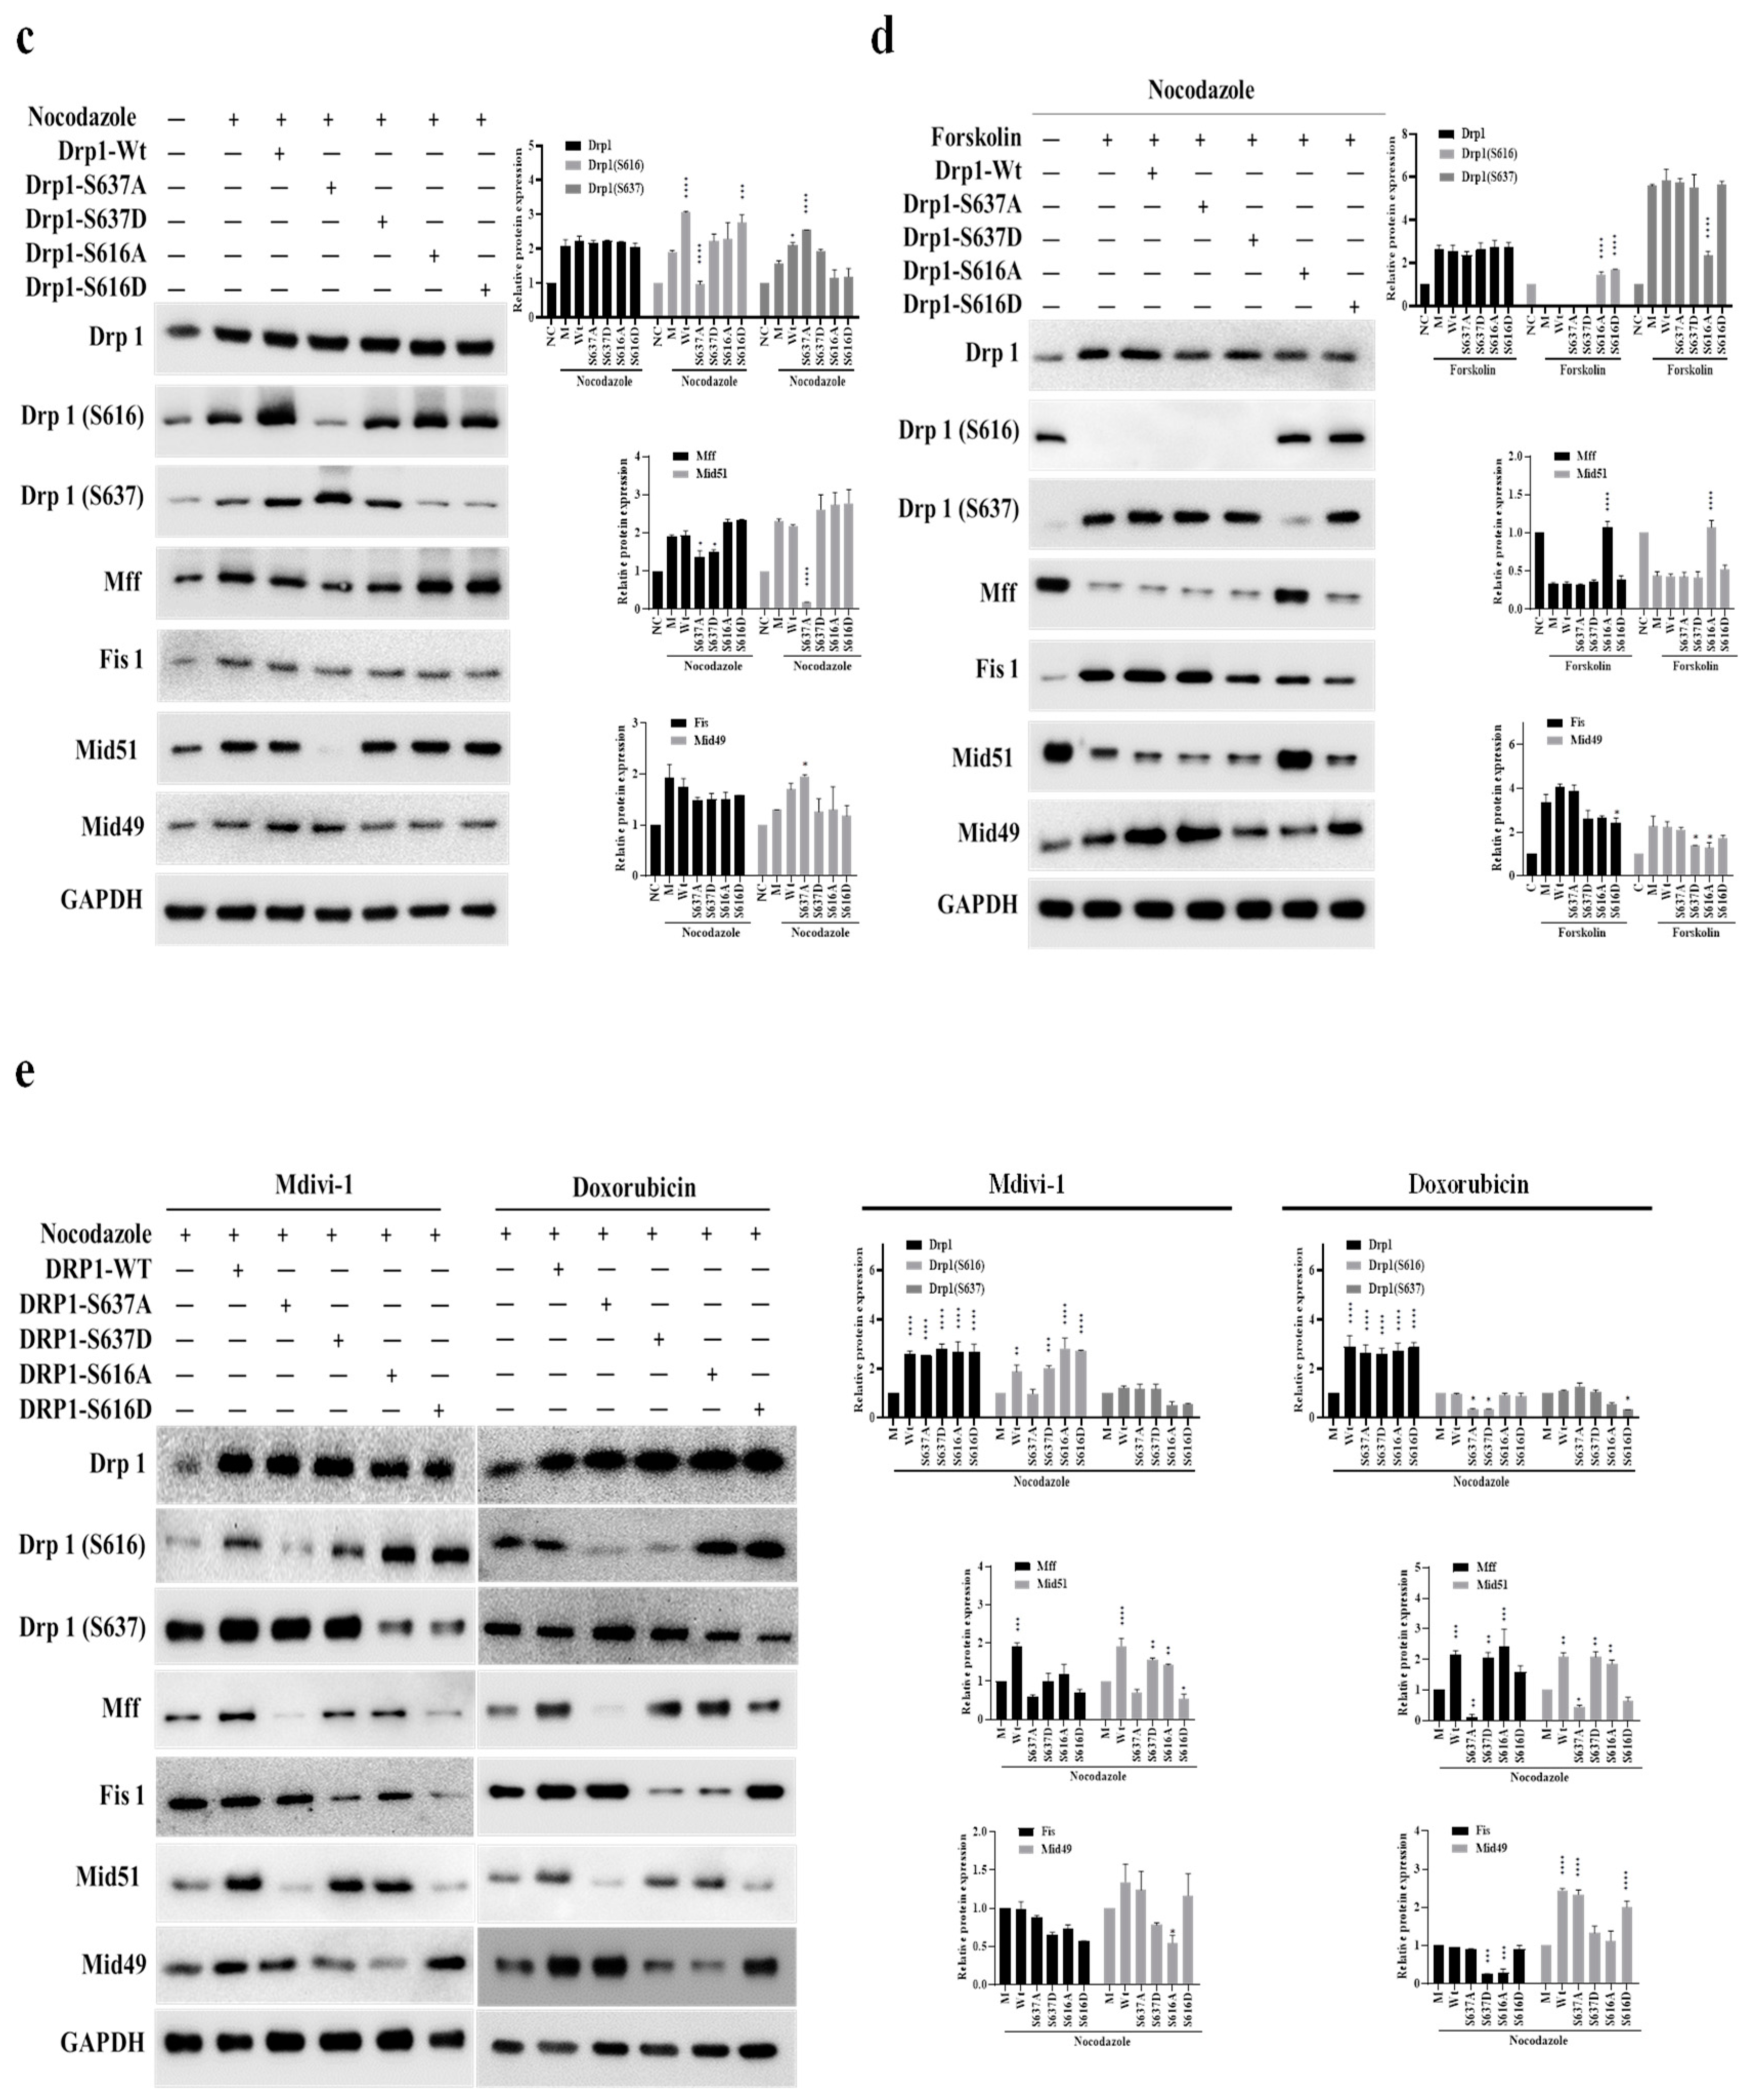
Figure 3.
Cell cycle analysis of synchronized HeLa cells treated with different compounds. (a) HeLa cells synchronized with double-thymidine treatment were exposed to Mdi, Dox, Oxa, or 5-Fu, and protein levels were assessed via western blotting. (b) Cell cycle distribution was examined at specific time points post-treatment using propidium iodide staining and FACS analysis. The histogram displays percentages in G1, G2/M, and S phases, with aneuploidy populations shaded green. (c) Quantification of cell percentages in G1, S, and G2/M across different cell cycle stages. M (Mock) represents samples subjected to synchronized or double-thymidine treatment.
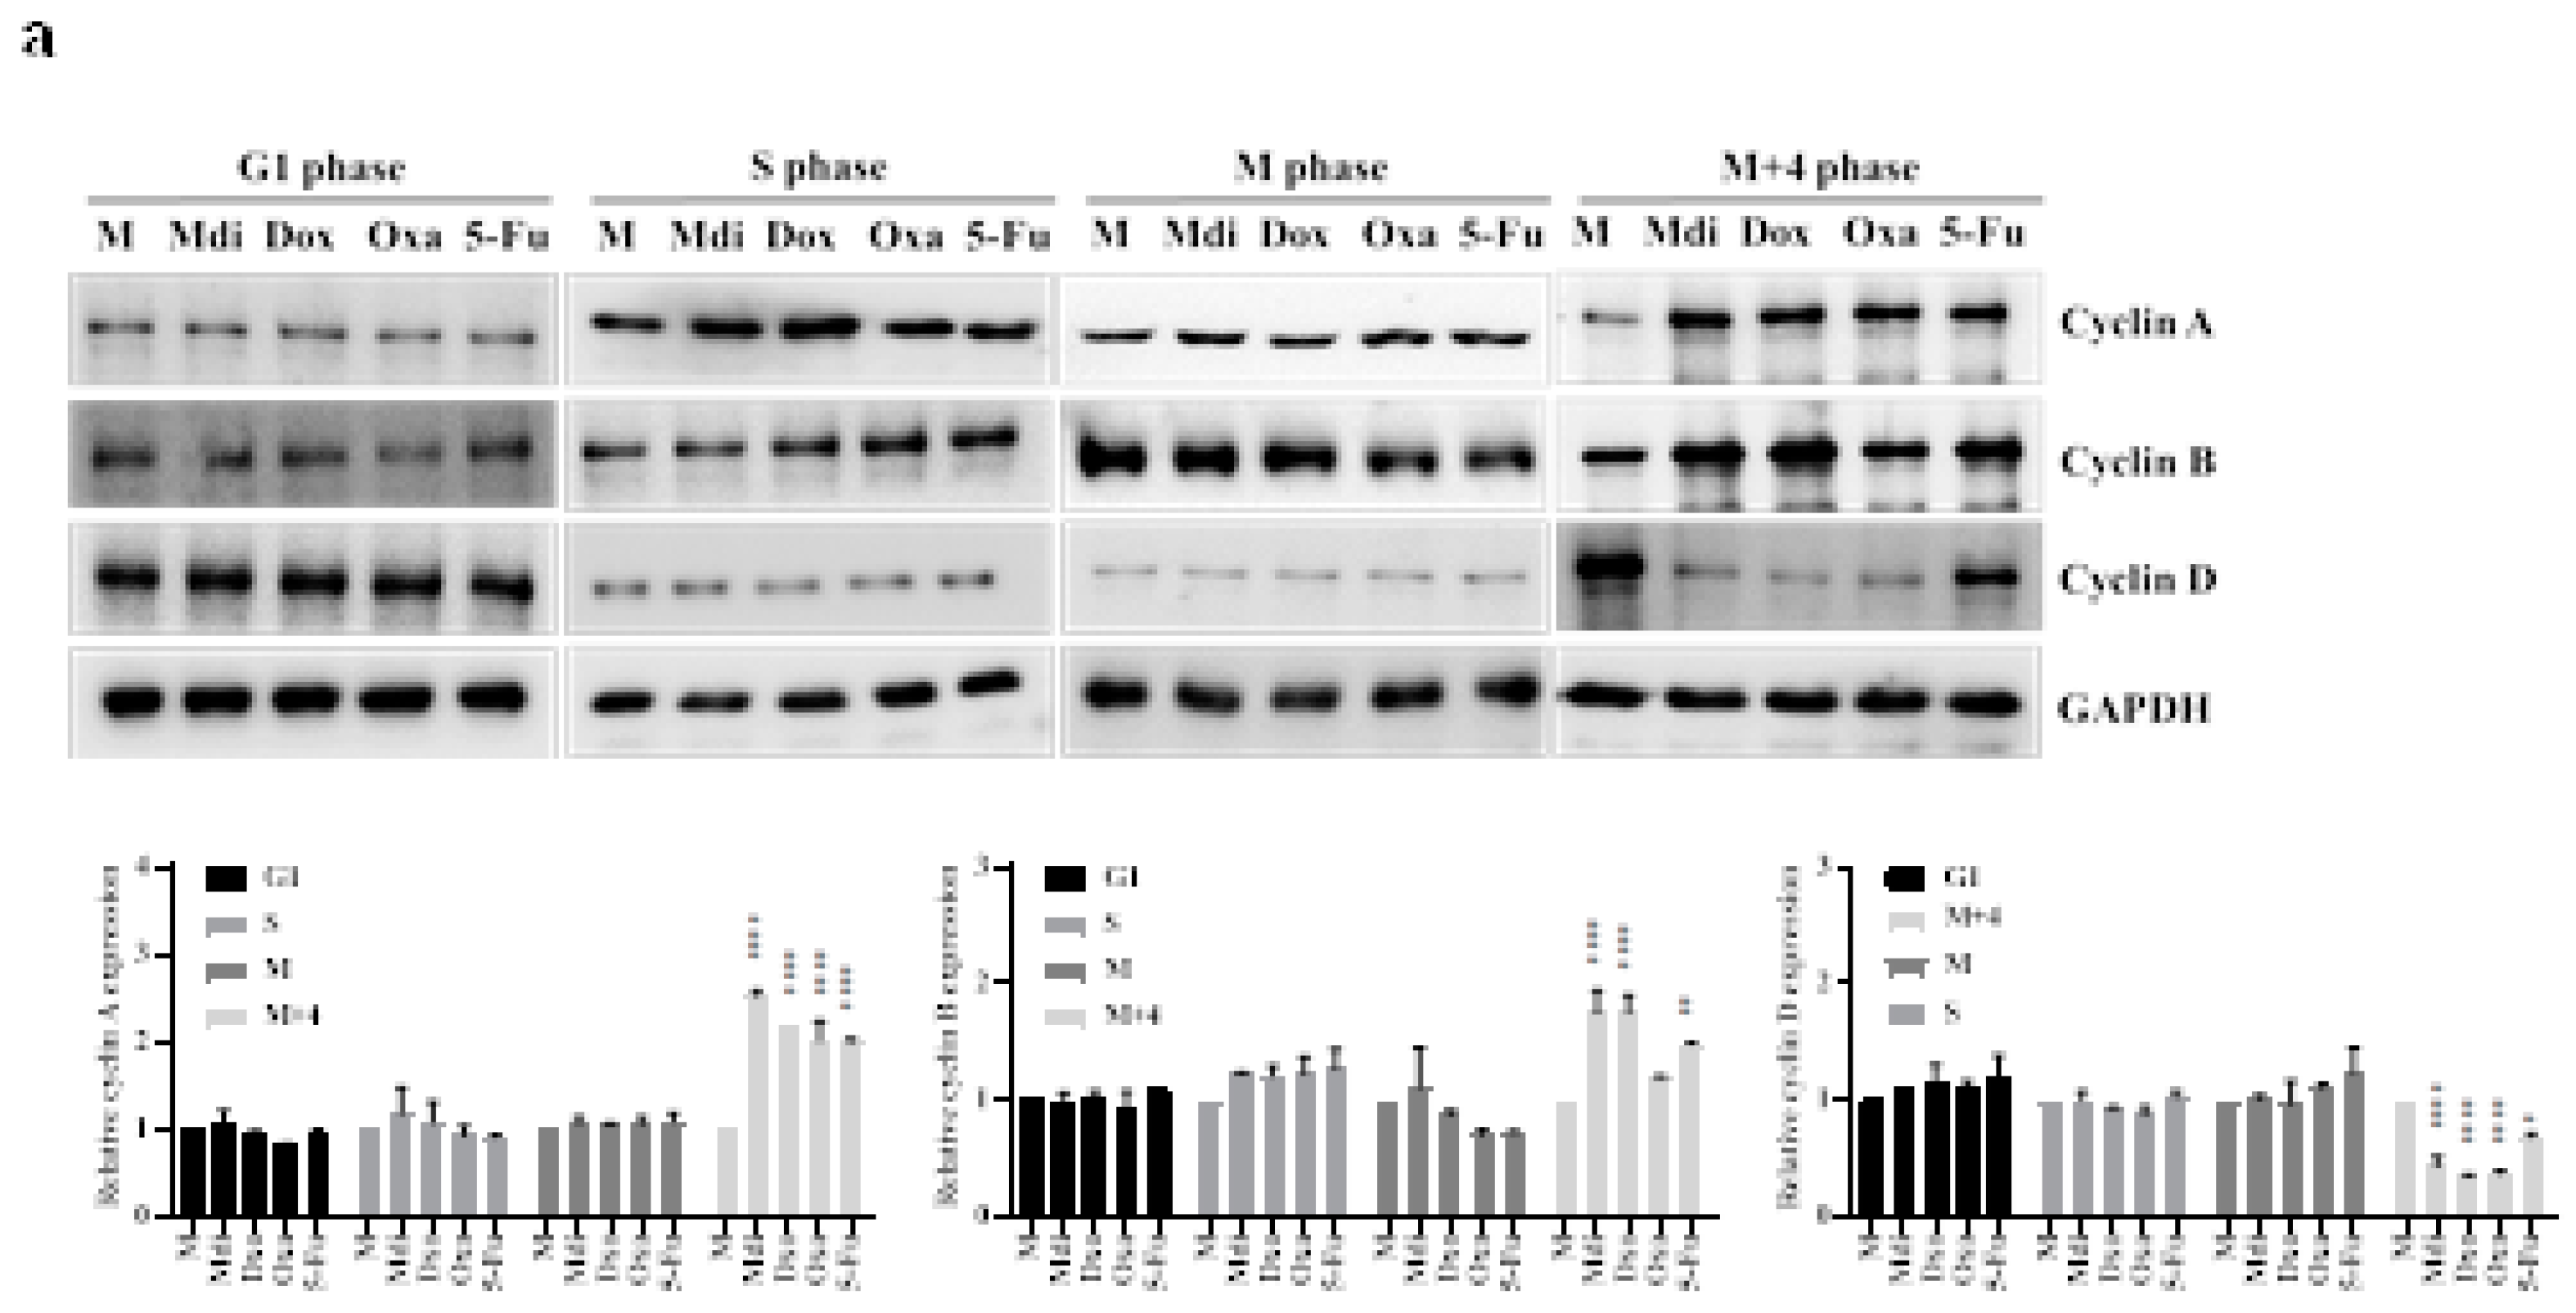
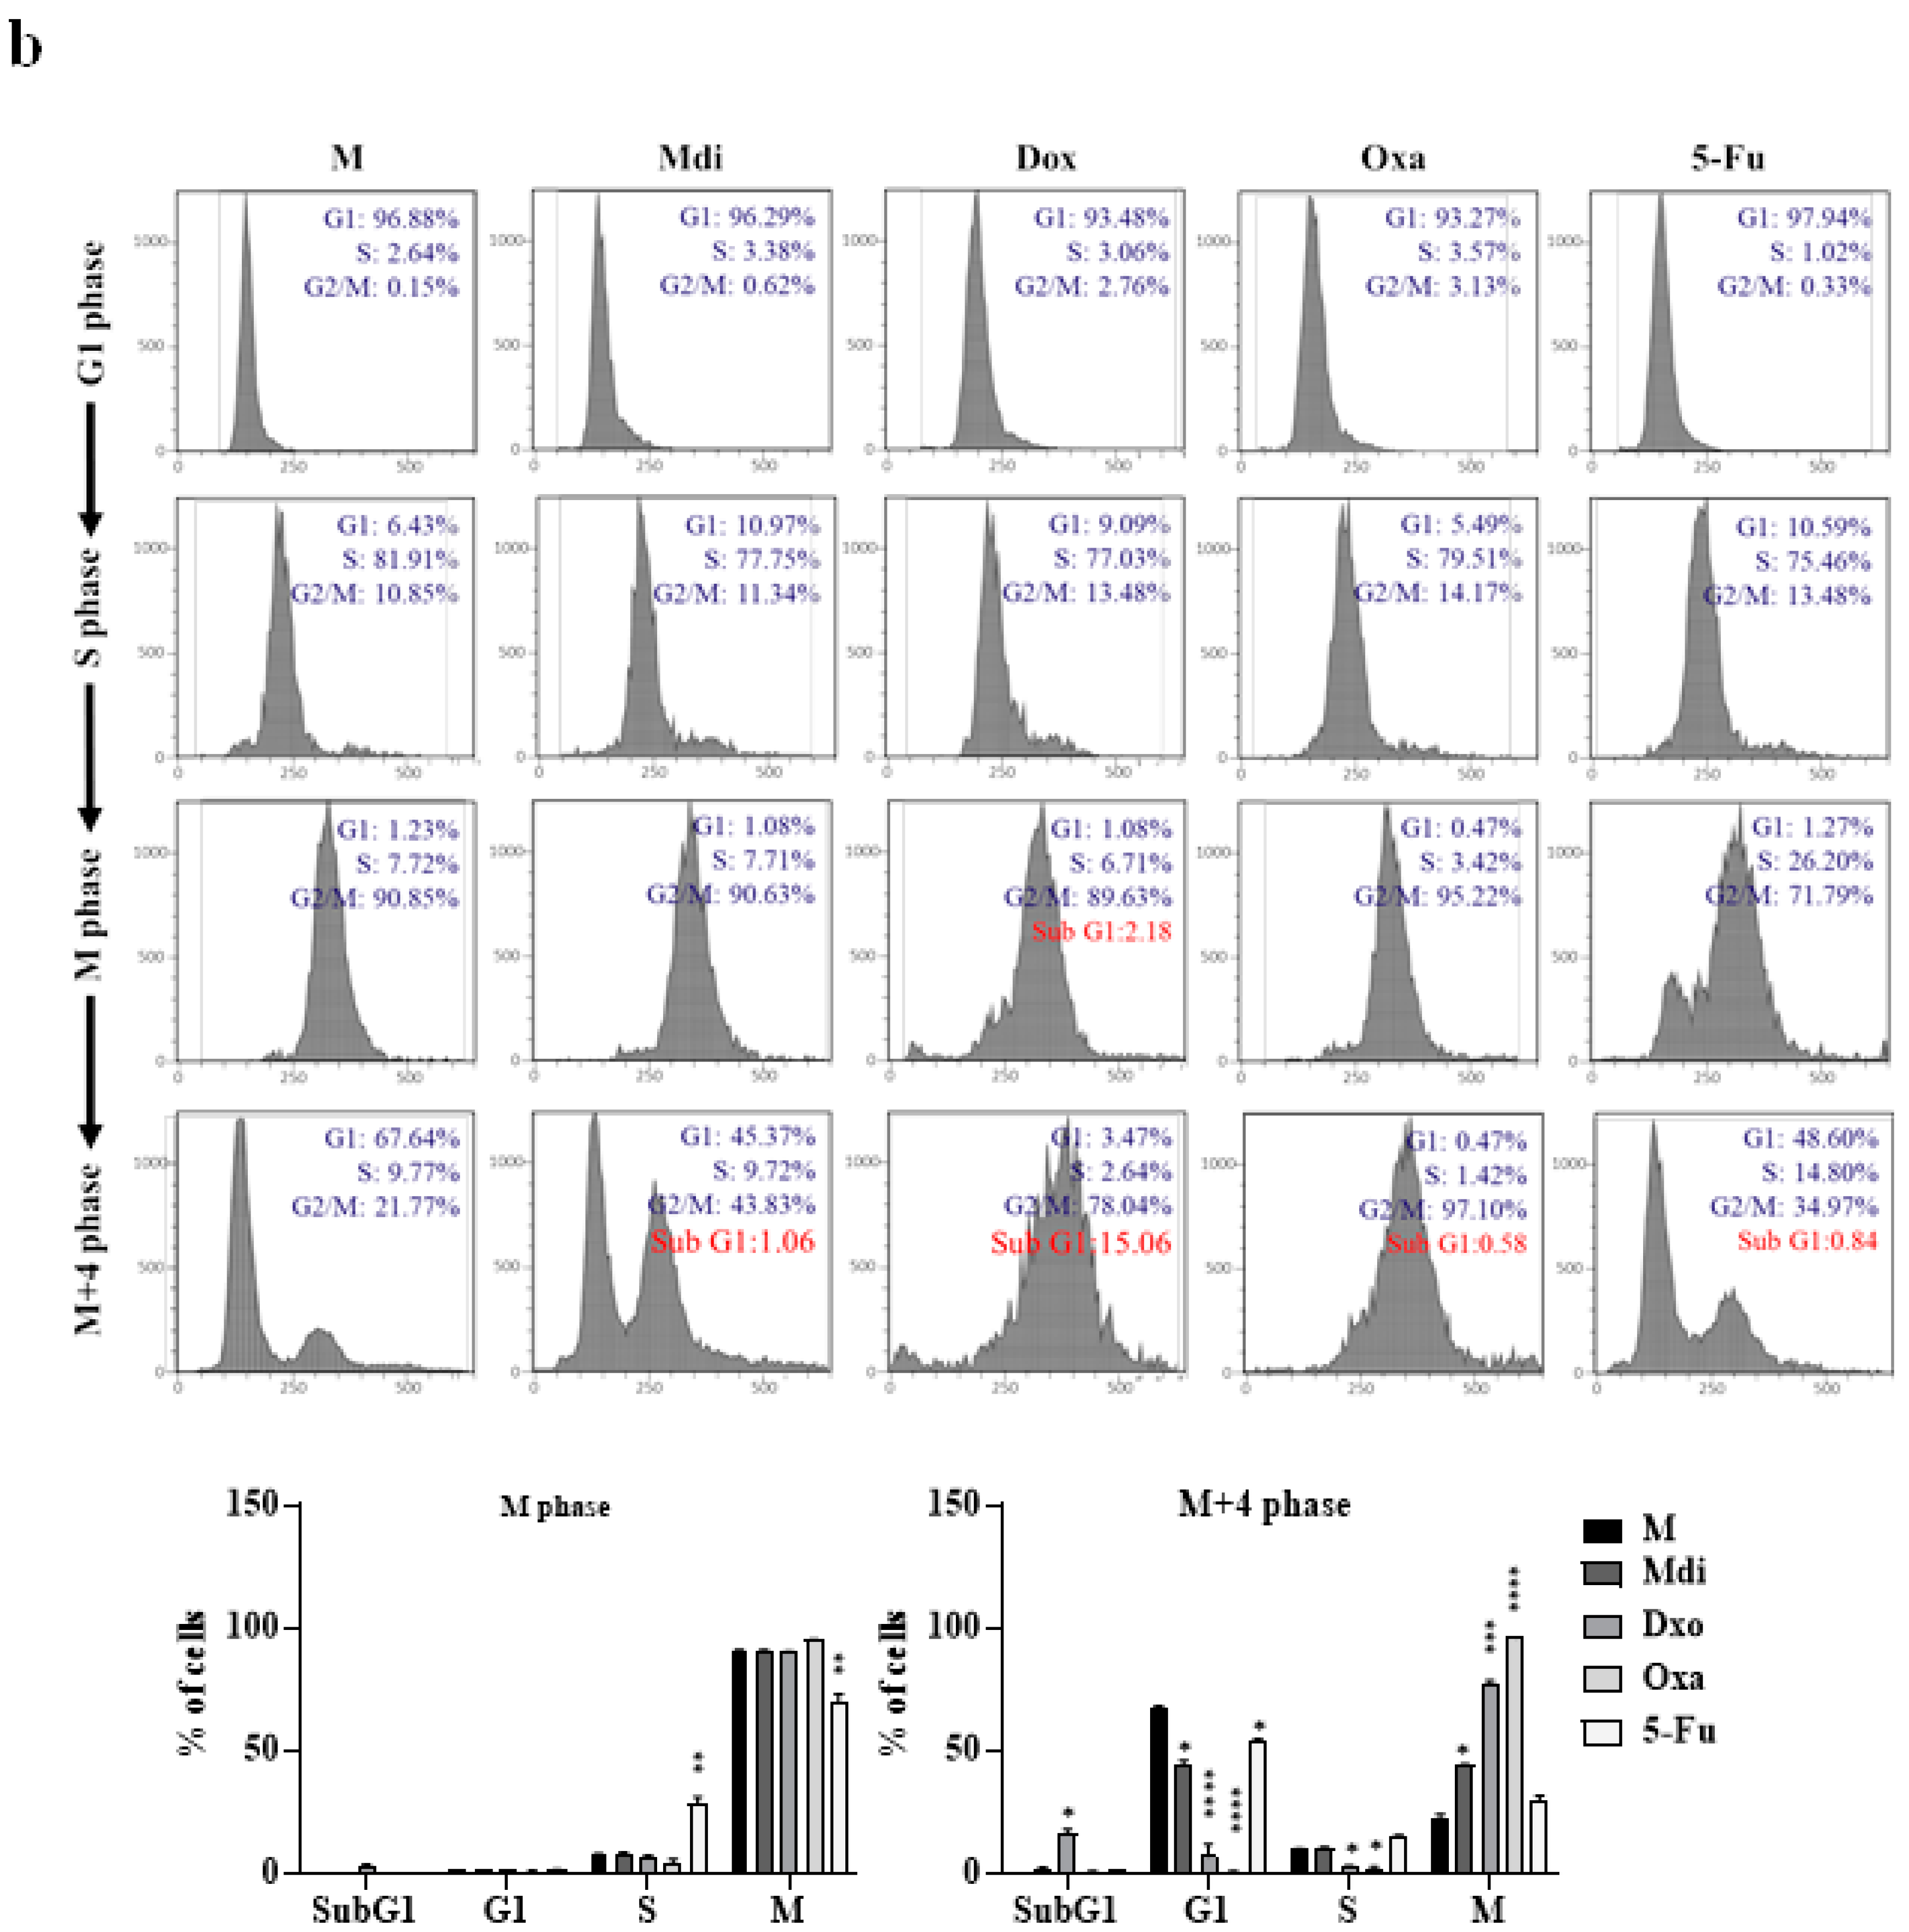
Figure 4.
Enhanced apoptosis and the synergistic response with Mdi and different chemotherapy Drugs in synchronized cells. (a) Impact of Mdi, Dox, Oxa, and 5-Fu on apoptotic signals in M phase cells. (b) Clonogenic assays were performed to assess the effect of Mdi, Dox, Oxa, and 5-Fu on colony formation in U251 and HCT116 cells. (c) Apoptosis induction and enhanced caspase 3, caspase 8, caspase 9 and PARP cleavage in synchronized cells treated with Mdi, Dox, Oxa, and 5-Fu in U251 and HCT116 cells. (d) U251 and HCT116 cells were synchronized using a double-thymidine block method before treatment with. Mdi, Dox, Oxa, and 5-Fu. After 12 hours (M + 4 hours phase), protein levels were assessed by western blotting. M (Mock) represents samples subjected to synchronized or double-thymidine treatment.
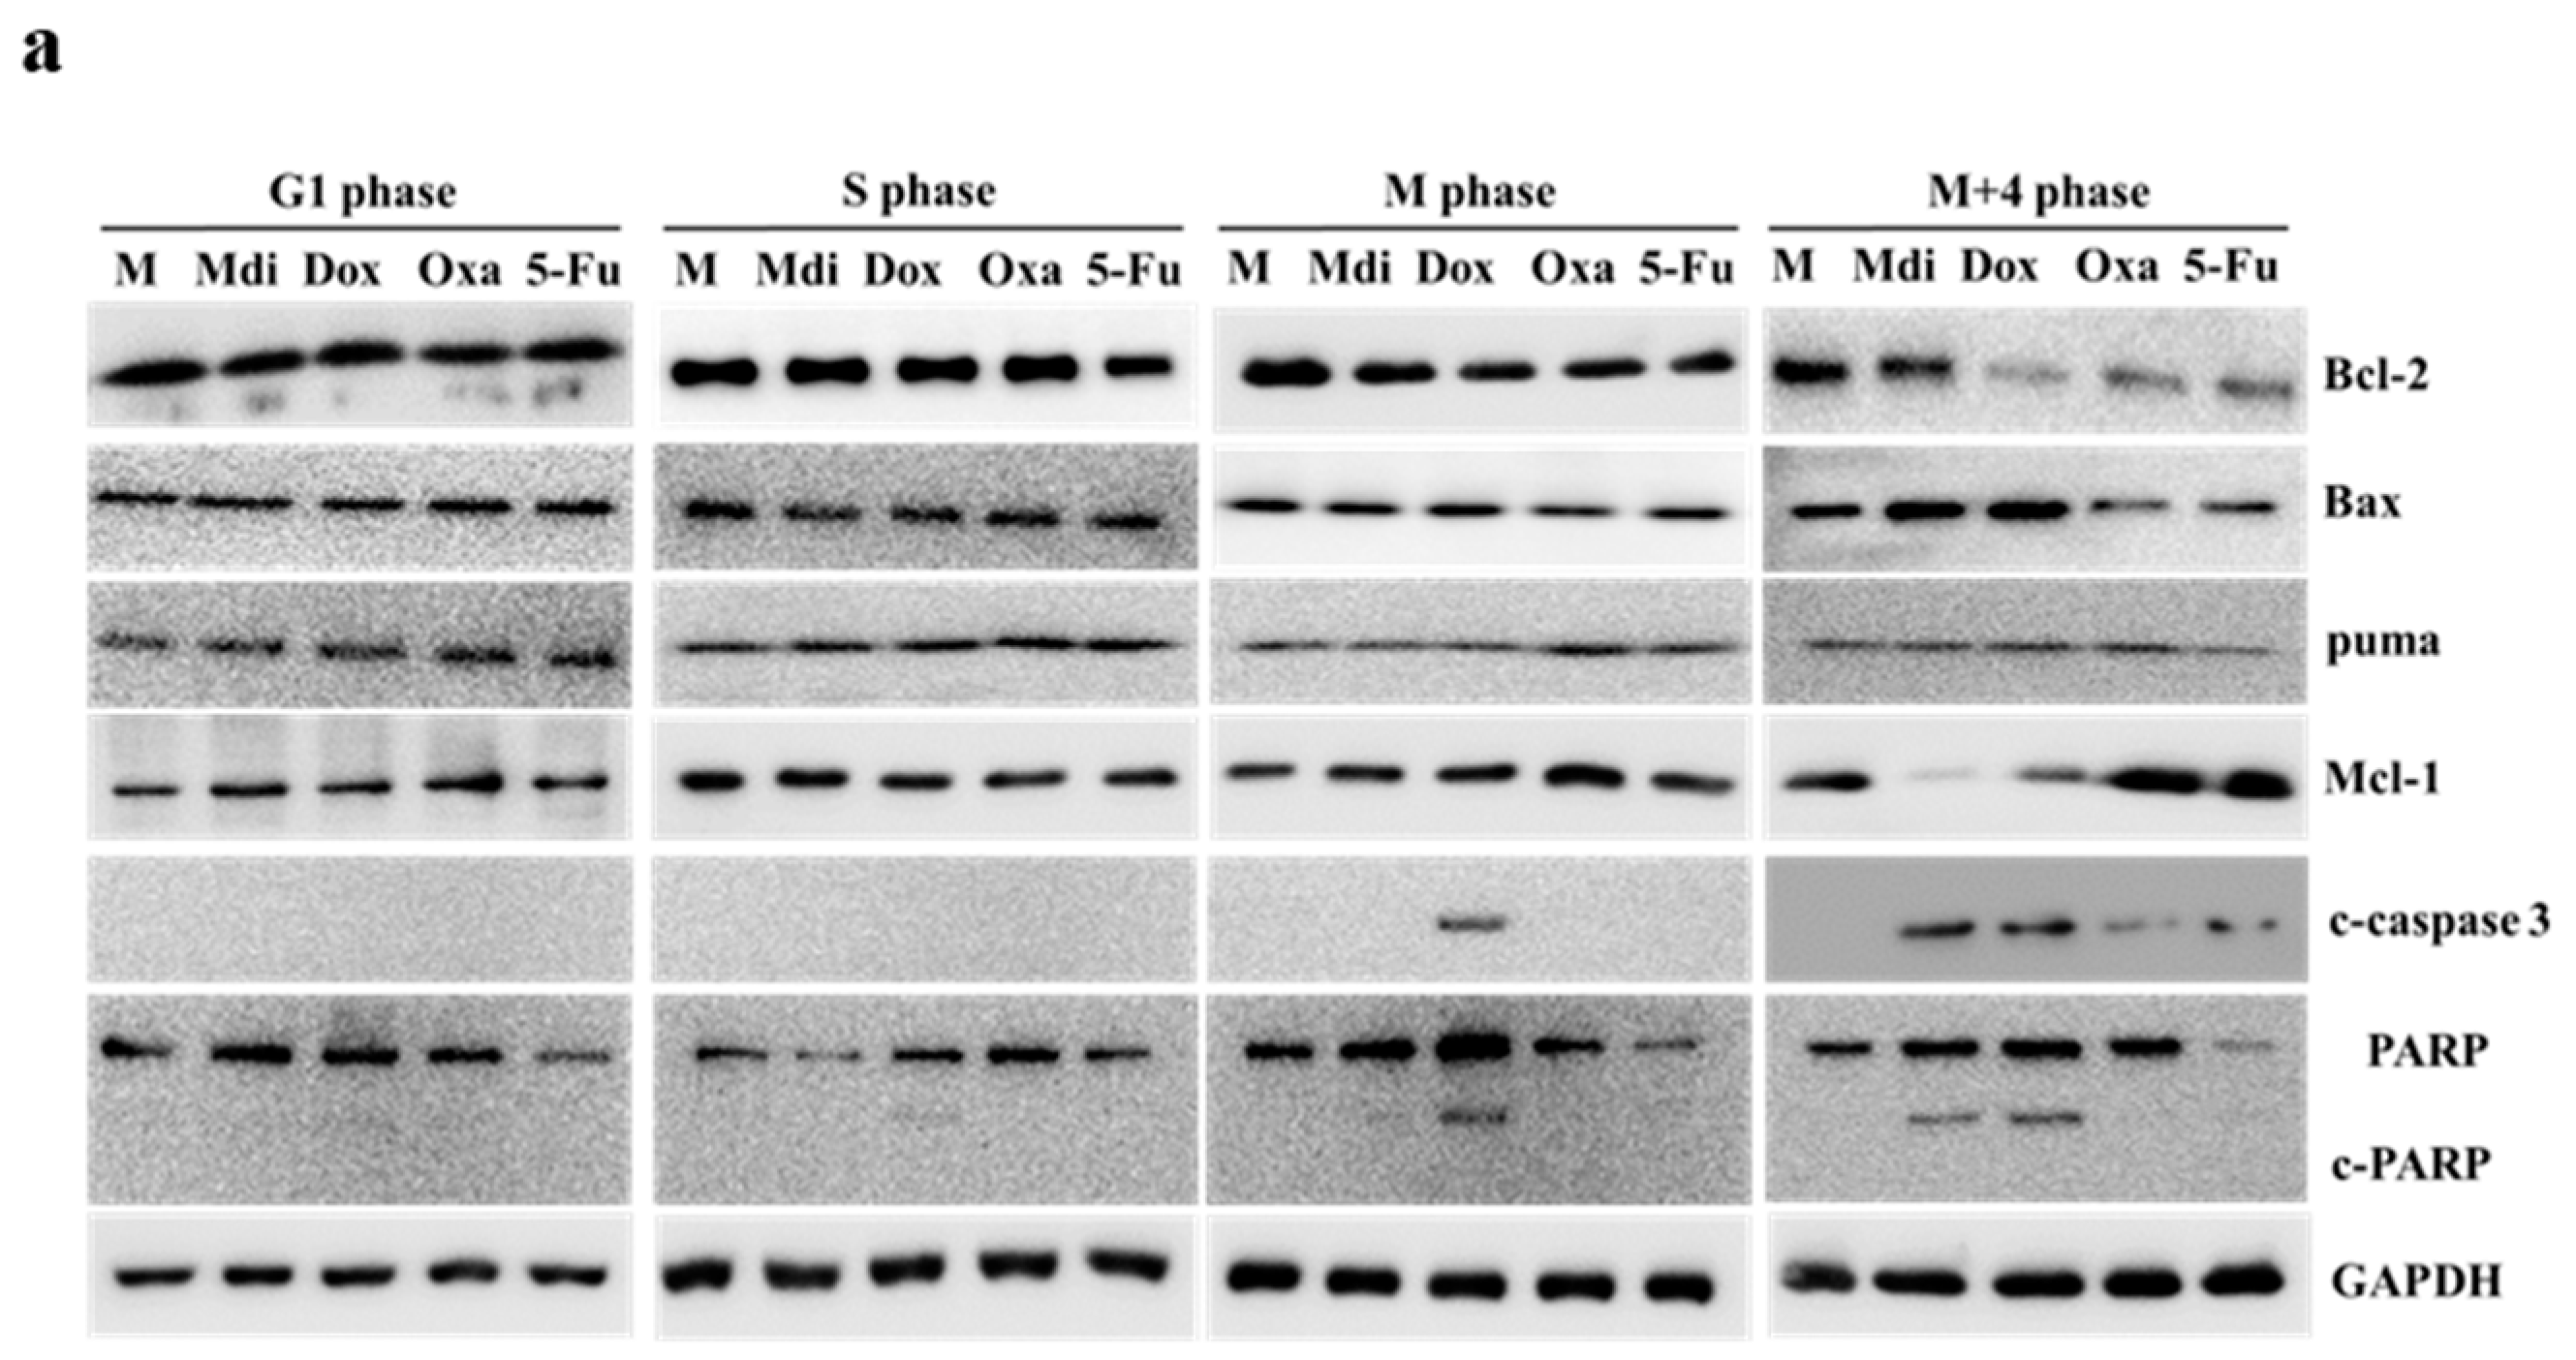
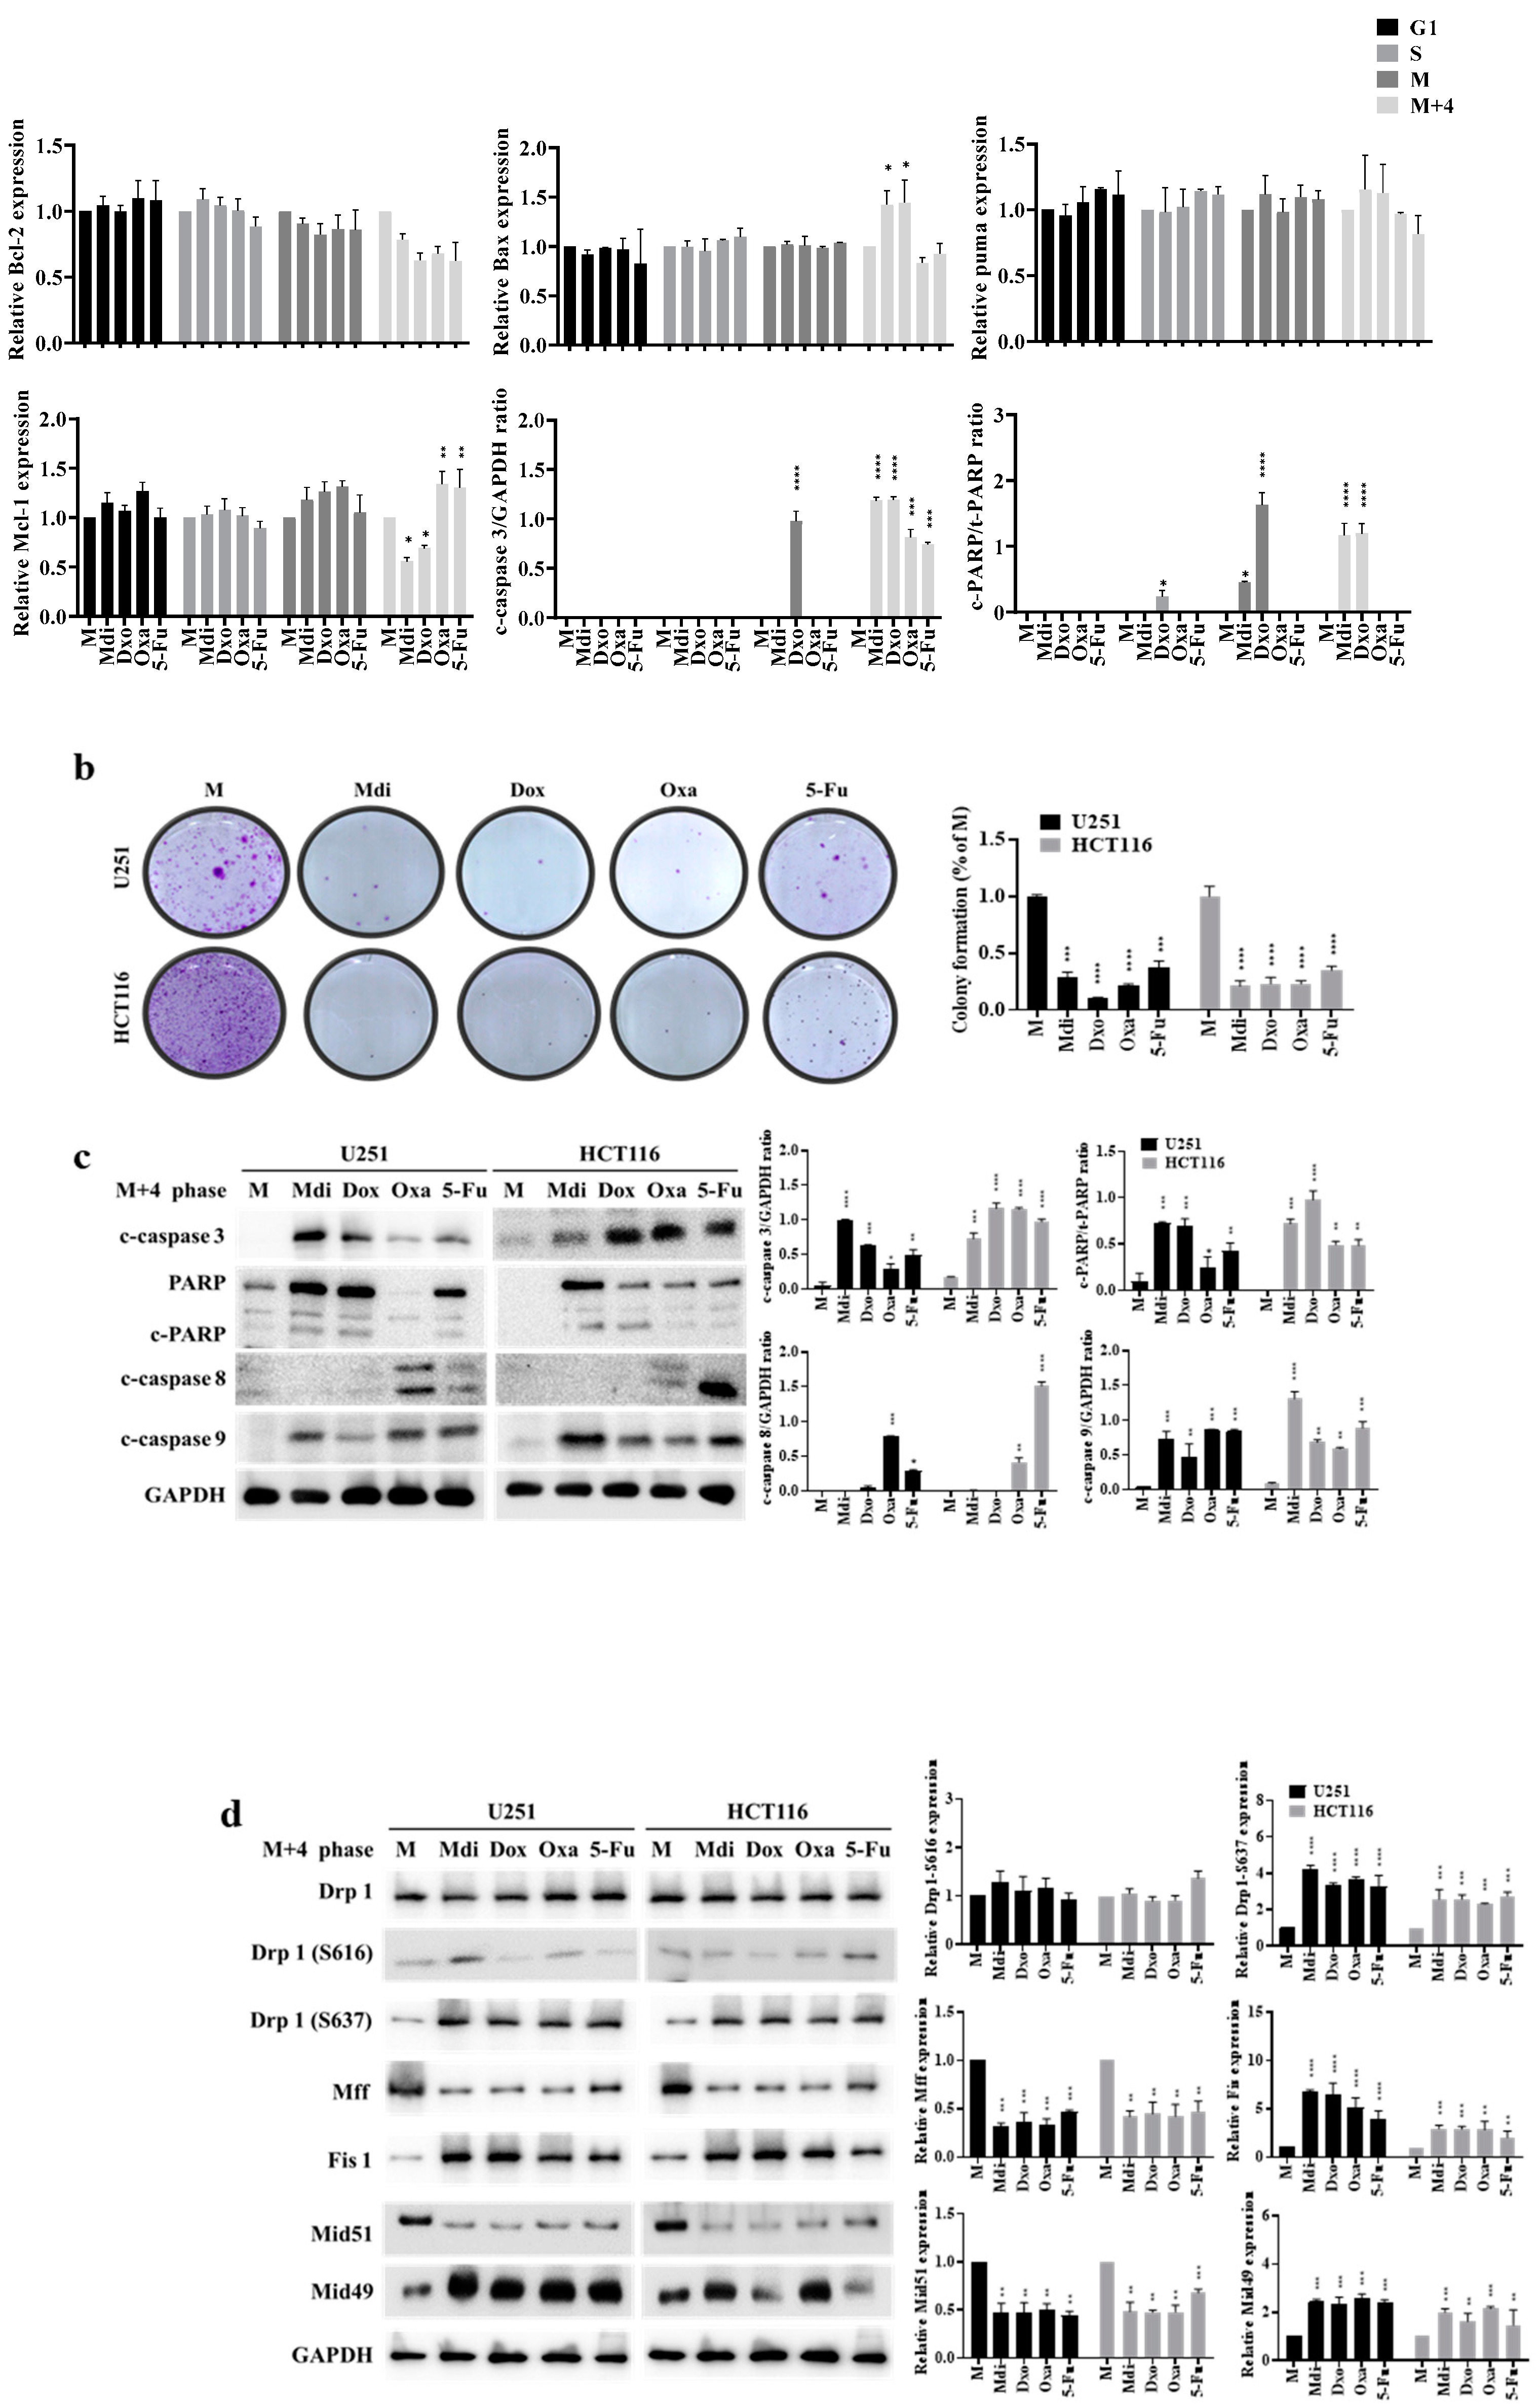
Figure 5.
Impact of Mdi and chemotherapy drugs on multipolar spindle formation and SAC function. (a) Impact of Mdi, Dox, Oxa, and 5-Fu on the SAC during the M phase. (b) Quantification of BubR1, Mad2, CDC20, Cyclin B, CDK1, pCDK1(T14) and CDC27 in cytoplasmic and mitochondrial fractions. VDAC1 was used as an internal loading control, and purity was confirmed with GAPDH. (c) Induction of multiple spindle foci by Mdi and chemotherapy drugs in nocodazole-treated mitotic HeLa cells. (d) QPCR results of knockdown experiments targeting Drp1, Mff, Fis1, Mid49, or Mid51. (e) Western blot results of knockdown experiments targeting Drp1, Mff, Fis1, Mid49, or Mid51. (f) Modulation of mitotic regulators and checkpoint proteins by siDrp1, siMff, siFis, siMid51, and siMid49 in HeLa cells treated with double-thymidine during the M+4 Phase. Quantification of SAC Markers: BubR1, Mad2, CDC20, Securin, Cyclin B, CDK1, pCDK1(T14), and CDC27. (g) Induction of multiple spindle foci by siDrp1, siMff, siFis, siMid51, and siMid49 in nocodazole-treated mitotic HeLa Cells. Confocal images show microtubules (green), centrosomes (red), and DNA (blue) in HeLa Cells after 16-hour nocodazole treatment. Scale bar: 10 μm. Cells stained with anti-α-tubulin and anti-γ-tubulin. DNA stained with DAPI. (c and f, right) Inhibition of multipolar spindle formation in HeLa Cells by drug treatment. Percentage of cells Exhibiting Bipolar Spindles and Multiple Spindle Foci. Data represent mean ± SE from three independent experiments. Approximately 300-350 mitotic cells analyzed per experiment. NC (normal control) denotes samples without synchronized or double-thymidine treatment, while M (Mock) represents samples subjected to synchronized or double-thymidine treatment.
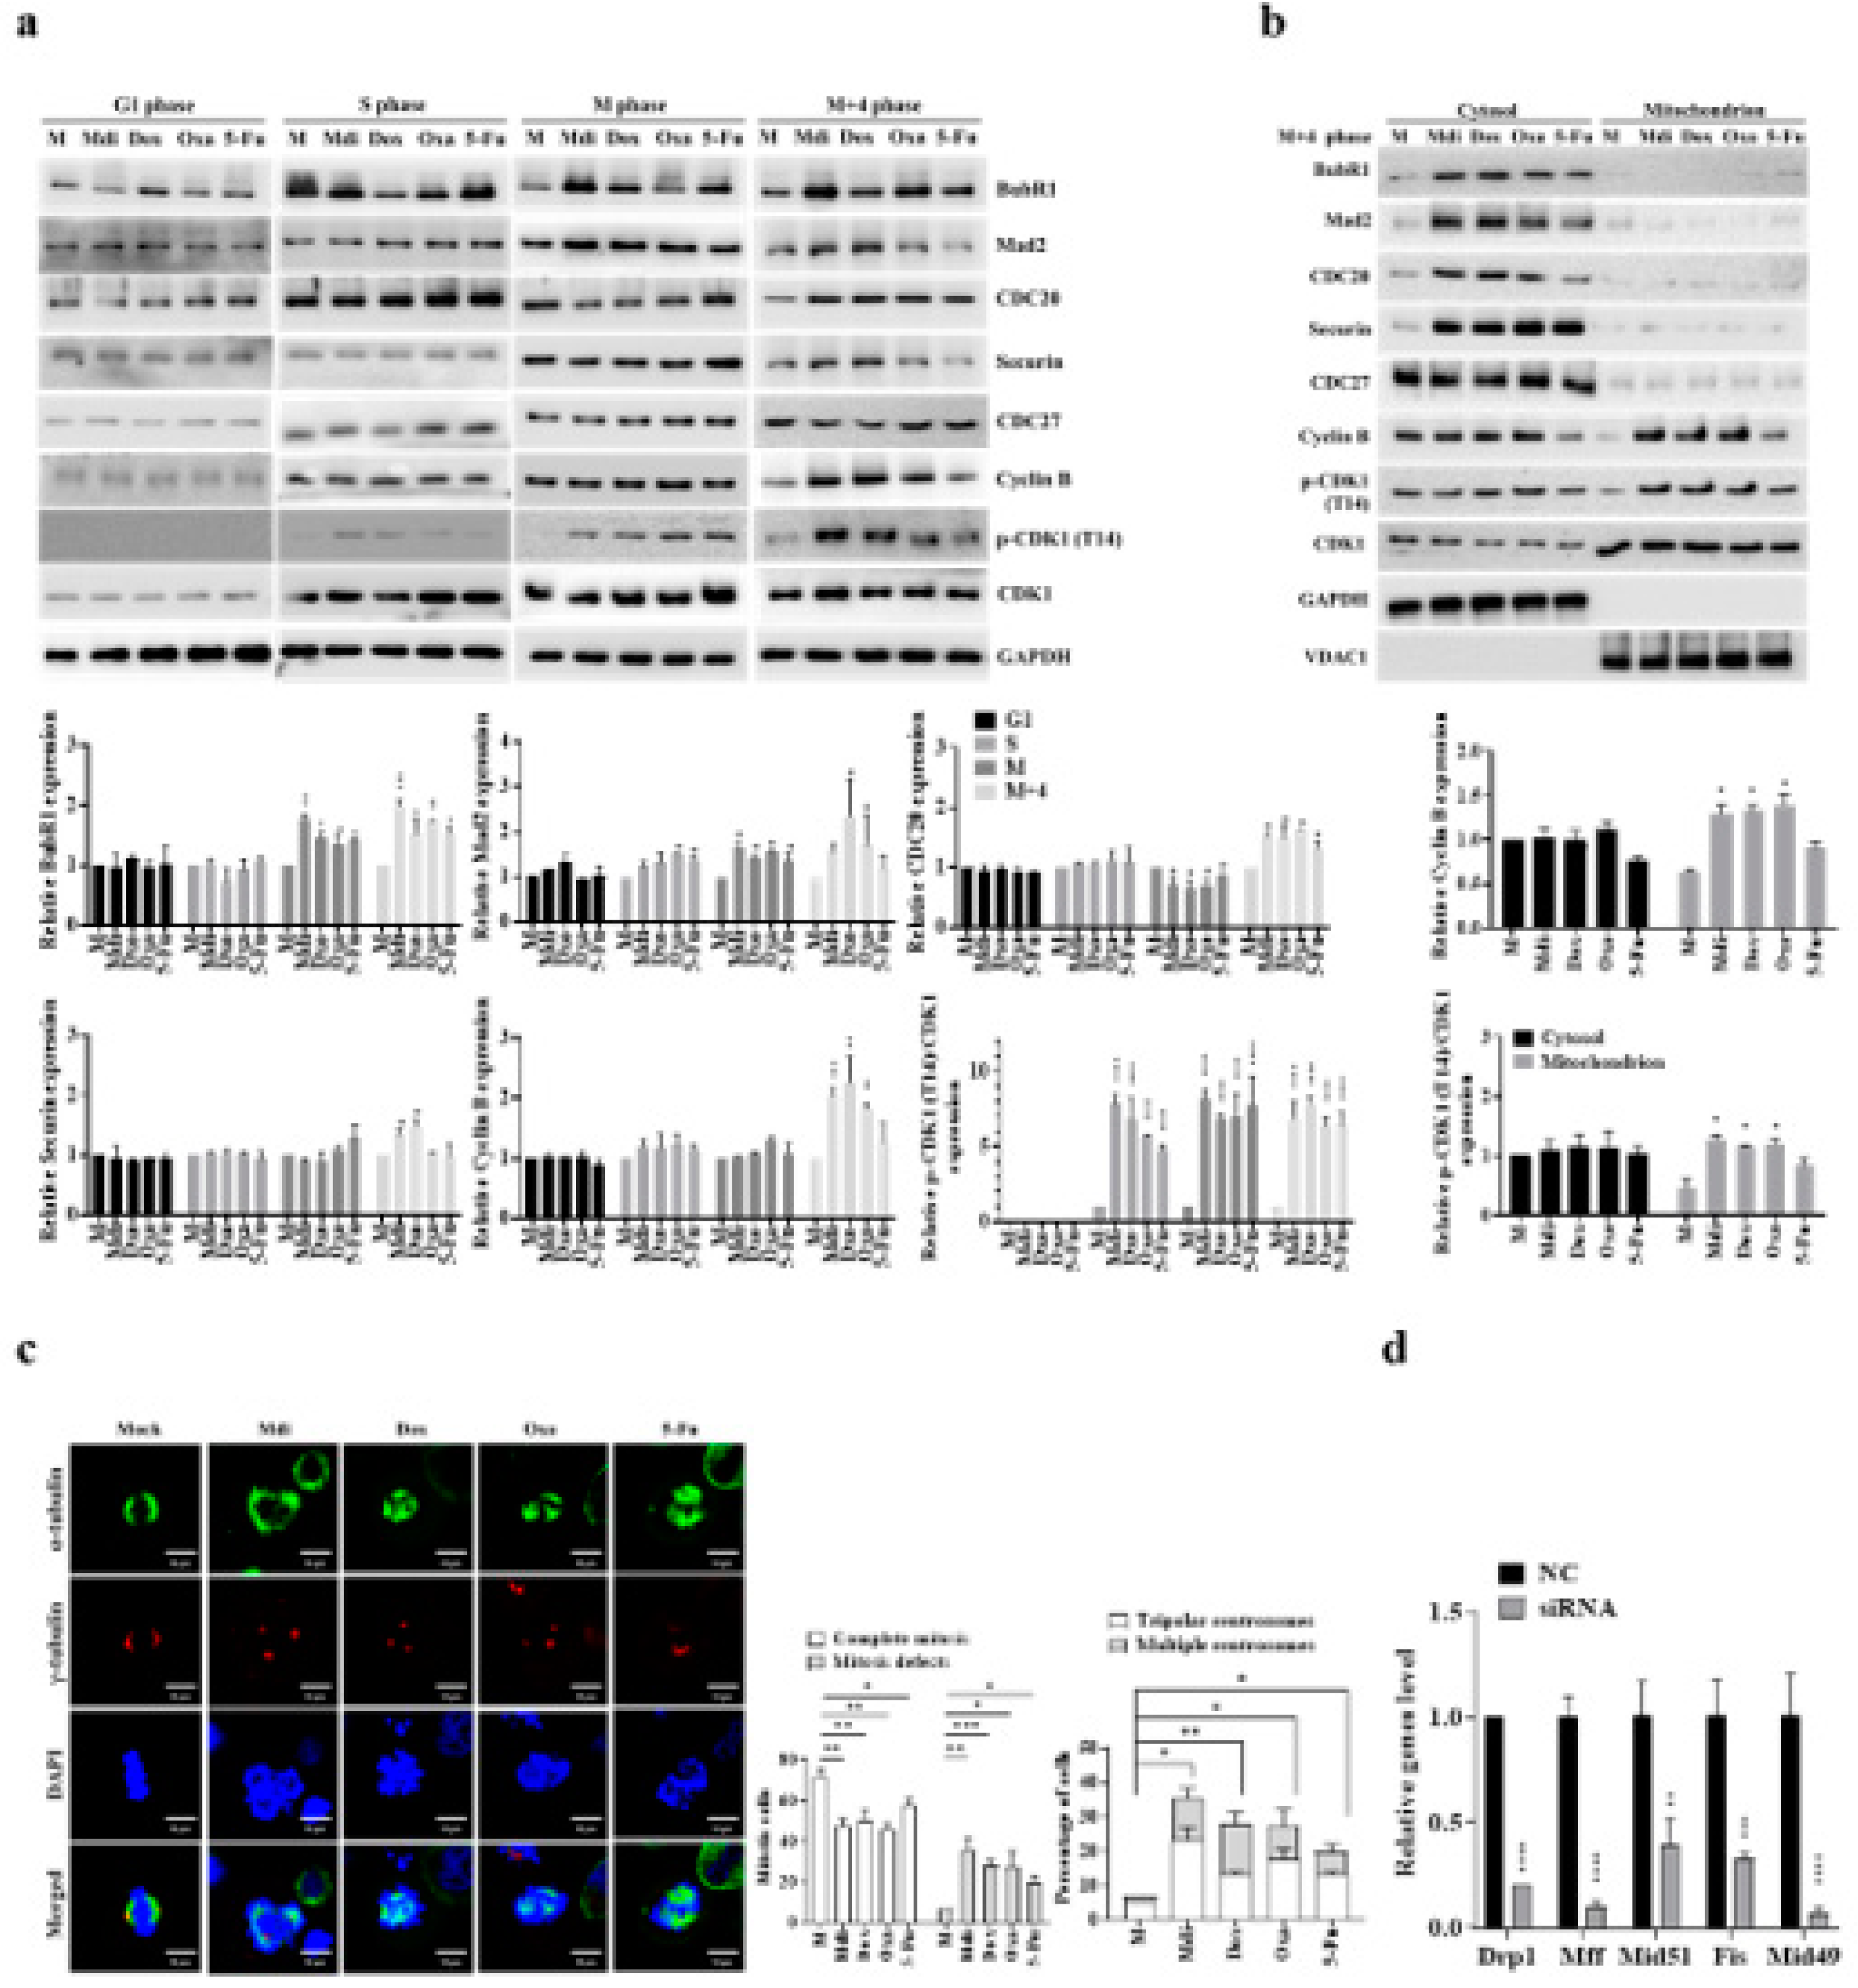
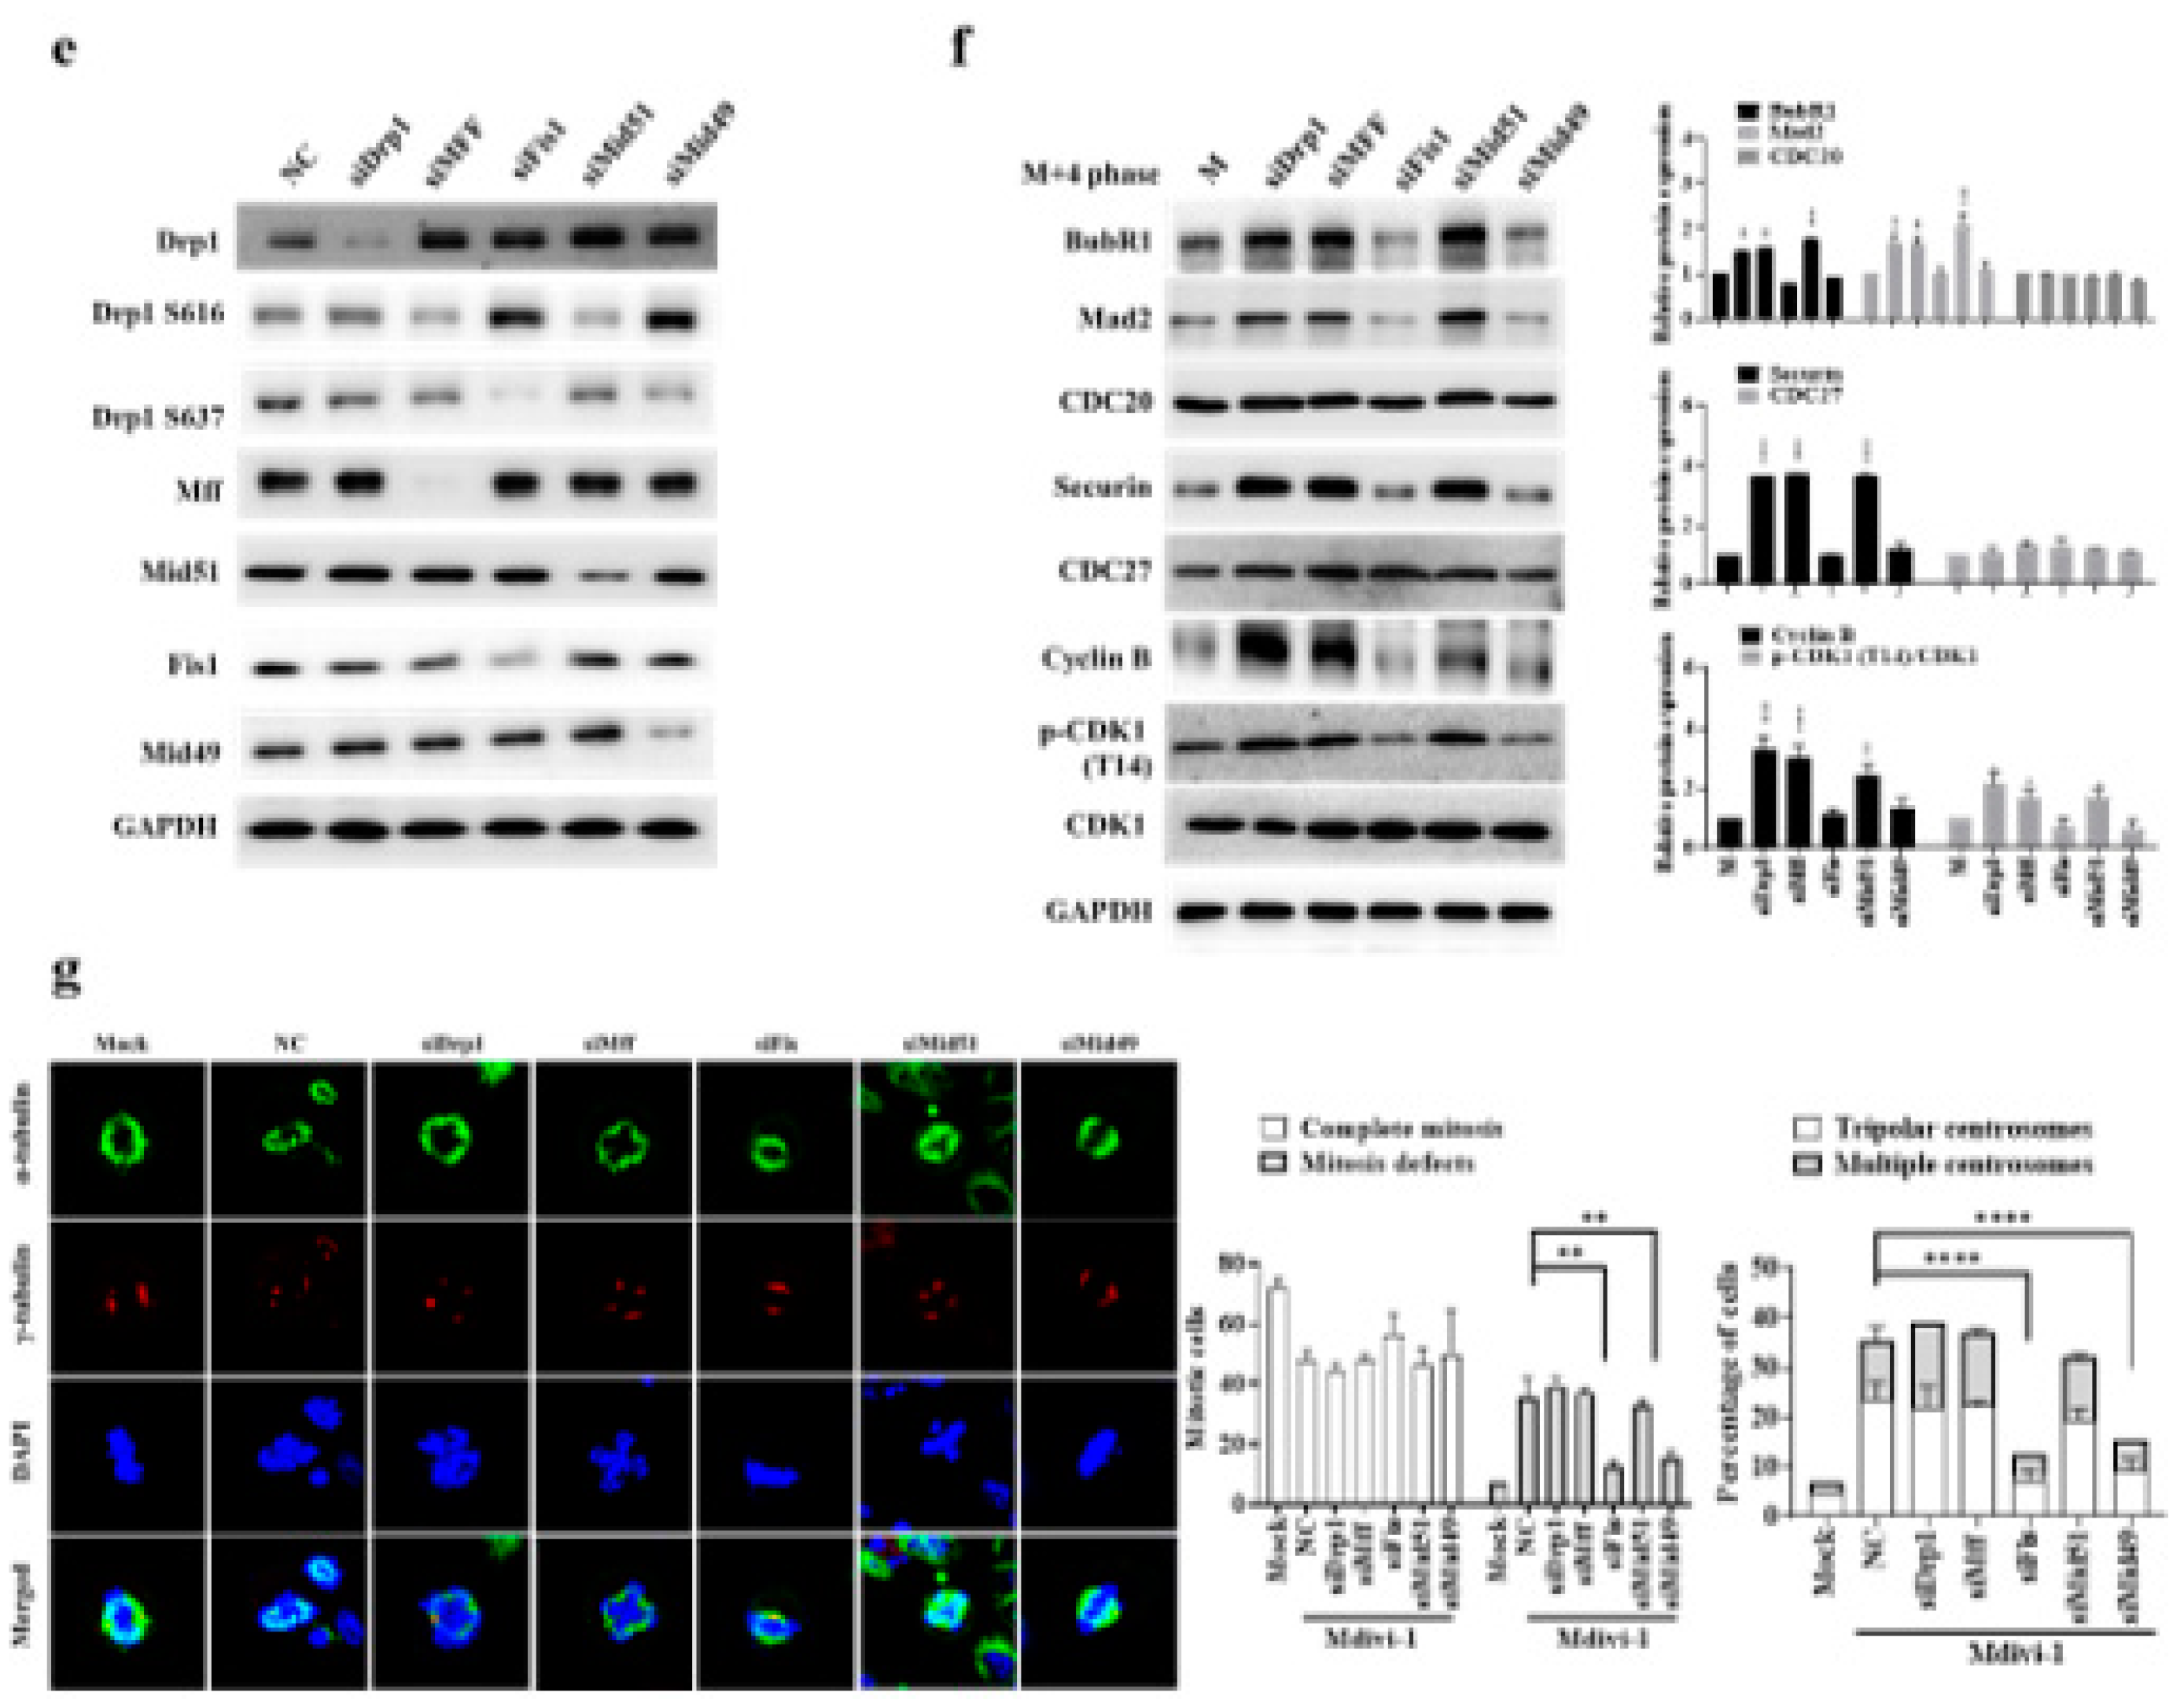
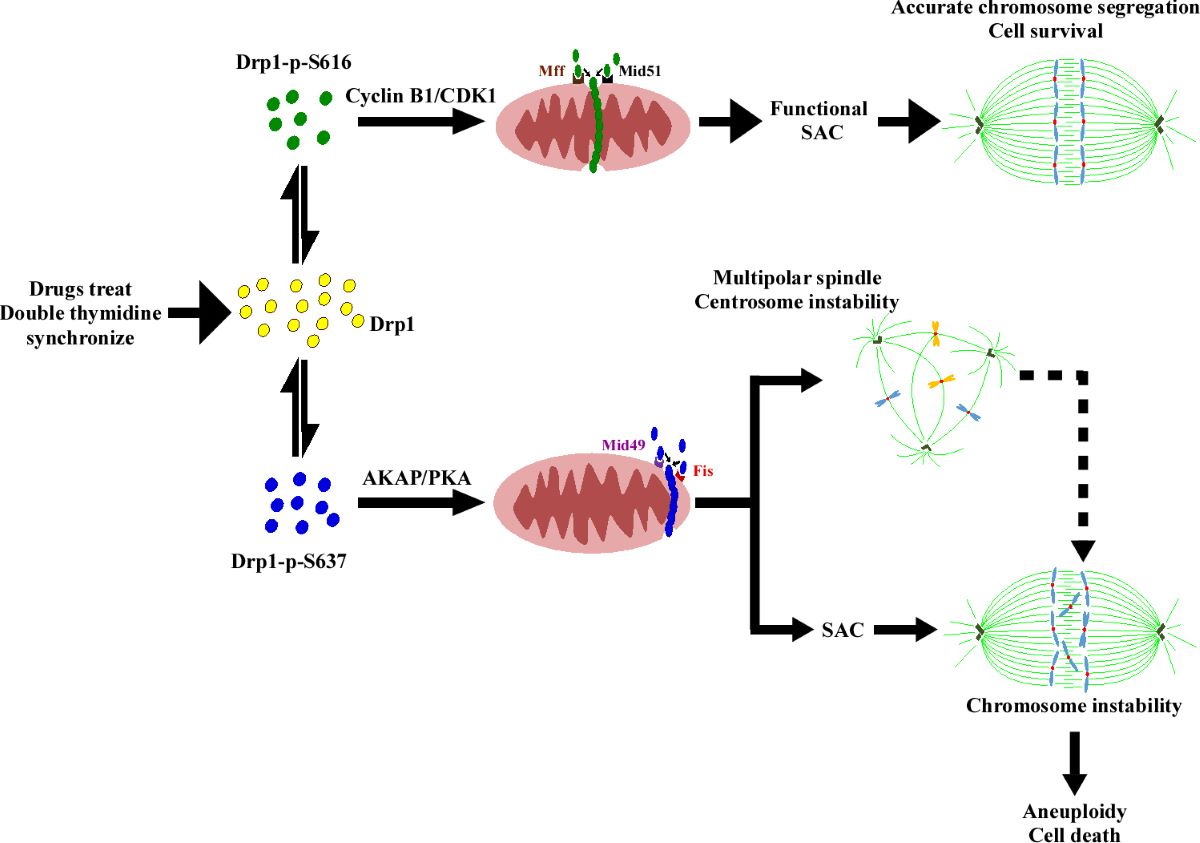
Figure 6.
Schematic demonstration of the proposed model elucidating two distinct mitochondrial fission clusters machinery during the M phase. The proposed model suggests two correlated mitochondrial fission clusters that are located mutually exclusive in the mitochondria within the same cell and which may yield clues regarding a possible cause effect relationship between mitochondrial peripheral fission signature (mitophagy) and spindle assembly (SAC and multiple spindle formation) during mitotic arrest [1,2,3,4,5]. In the M phase, mitochondrial adaptors are organized in the midzone and peripheral zone [6,7,8]. In midzone fission, Mff and Mid51 collaboratively facilitate efficient recruitment of hosphor-Drp1 (Ser616, represented by green dots) and subsequent mitochondrial division. The formation of a pre-constriction ring is aided by ER and actin contact before this event [6,9]. When mitochondria stressed during the M phase, they warrant peripheral fission, whose major players are phosphor-Drp1 (Ser637, depicted by blue dots), Mid49 and Fis1. This mechanism aims to eliminate damaged parts, ensuring that the segregated mitochondria transmitted to daughter cells remain healthy. If stress persists, cells undergo mitotic arrest and subsequent mitotic slippage or SAC adaptation [1,10]. The consequence of it is the formation of a multipolar spindle and transformation into aneuploid cells. Ultimately, the fate of mitochondria and host cells leads to apoptosis due to excessive fragmentation [2,9]. However, the link between the formation of a multipolar spindle and aneuploidy remains unclear. Interestingly, mitochondrial fragmentation (mitophagy) shares similarities with aneuploidy, as both can lead to cell death and apoptosis, potentially contributing to cancer formation. Mitophagy acts as both a tumor suppressor and an oncogenic event that could be targeted therapeutically [3,4,5,9,10,11].
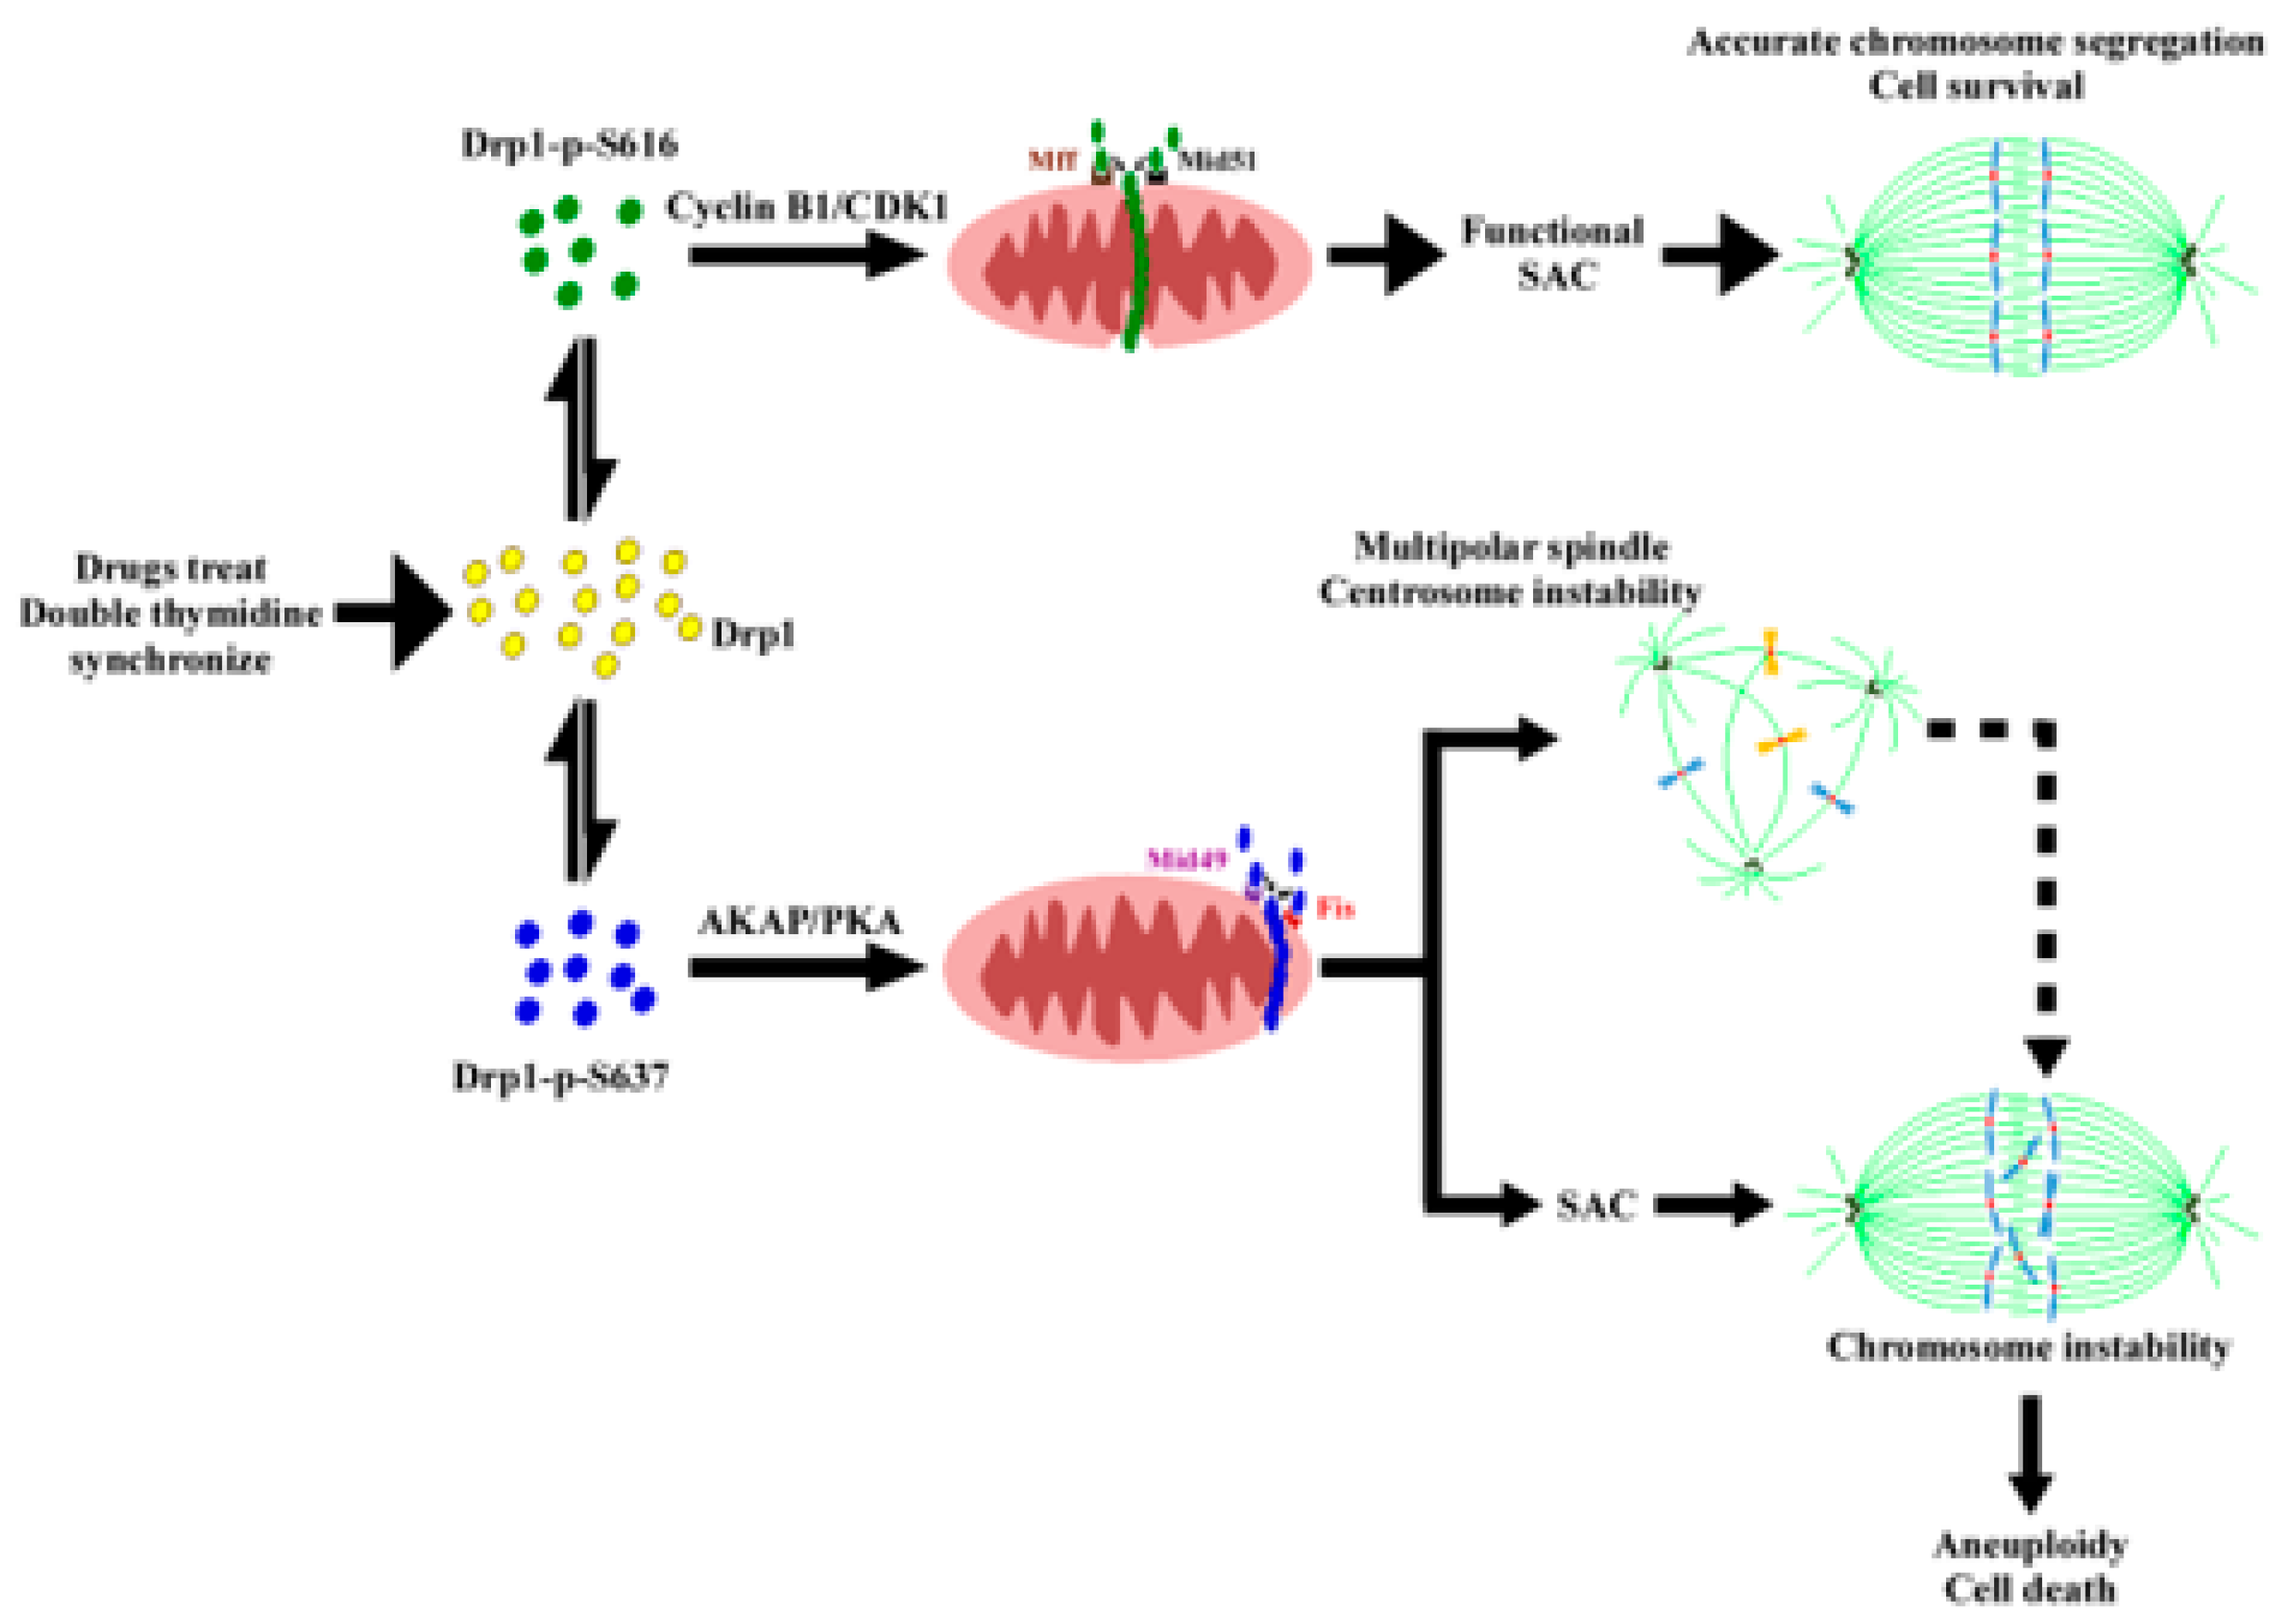

Table 1.
Functional correlation among two mitochondrial fission clusters, SAC, and multipole spindle.
Table 1.
Functional correlation among two mitochondrial fission clusters, SAC, and multipole spindle.
| Clusters | Function | Mitochondria Fission | SAC Function | Mitotic cells |
|---|---|---|---|---|
| Drp1-S616/Mff/Mid51 | Up | Midzone | Normal | Bipolar spindles |
| Drp1-S616/Mff/Mid51 | Down | Peripheral | Up | Multipolar spindles |
| Drp1-S637/Fis/Mid49 | Up | Peripheral | Up | Multipolar spindles |
| Drp1-S637/Fis/Mid49 | Down | Midzone | Normal | Bipolar spindles |
Up:Up-regulation ; Down:Down-regulation.
Disclaimer/Publisher’s Note: The statements, opinions and data contained in all publications are solely those of the individual author(s) and contributor(s) and not of MDPI and/or the editor(s). MDPI and/or the editor(s) disclaim responsibility for any injury to people or property resulting from any ideas, methods, instructions or products referred to in the content. |
© 2024 by the authors. Licensee MDPI, Basel, Switzerland. This article is an open access article distributed under the terms and conditions of the Creative Commons Attribution (CC BY) license (http://creativecommons.org/licenses/by/4.0/).
Copyright: This open access article is published under a Creative Commons CC BY 4.0 license, which permit the free download, distribution, and reuse, provided that the author and preprint are cited in any reuse.


