Submitted:
01 September 2025
Posted:
03 September 2025
You are already at the latest version
Abstract
This study examined data on drug-related accidental deaths in the United States as found in the Accidental_Drug_Related_Deaths.csv dataset to understand patterns, trends, and risk factors and gain an understanding of the potential applicability of secondary data in public health planning. The dataset contains a total of 11,981 records with 48 single-value fields that include demographic information, location of event, and substances involved. The study undertook extensive data preprocessing on the dataset that included replacing missing values, standardizing elements of the dataset, reducing the data for analysis while maintaining the ability to examine the original structure, and transforming or restructuring fields for a meaningful analysis of the data. The study applied various data mining techniques such as association rule mining, classification, clustering, and outlier detection to draw insights from the dataset. The study identified high-risk demographic groups and combinations of drugs most often found in overdose situations, spatial hotspots for overdoses, and a few outliers. The study included several visualizations and interpretations of the data, and assessed ethical considerations of privacy, data exploitation or misappropriation, and biases. The study found data mining an effective data analysis strategy to help public health, policy development and emergency management organizations anticipate and/or mitigate drug overdose incidence and severity.
Keywords:
artificial intelligence
; health
; accidental drug overdose
1. Introduction
The escalating number of drug overdose deaths, especially with involvement of synthetic opioids and polydrug use, has become a significant public health issue in the United States. As the rates of death continue rise with efforts of treatments/interventions and awareness, it becomes imperative to understand the patterns, risk factors, and the geographic distribution of drug overdose fatalities. Data mining can be an effective mechanism to get insights into complex multi-dimensional data sets. This action research adopted a secondary data set called "Accidental_Drug_Related_Deaths.csv" with 11,981 records and 48 features that documented accidental drug-related fatalities regarding demographic, geographic, and substance use. After a comprehensive data preprocessing step (cleaning, transforming, and reducing), the data set was analyzed using various data mining techniques including association rule mining, classification, clustering, and outlier detection so that risk demographic, combinations of drugs used, overdose locations, and cases of anomaly (outliers) could be identified. The data from the action research does not only provide a data use tool for health professions, government officials, and law enforcement, it will gain insight regarding ethical considerations such as data privacy and mitigating bias in public health, and further knowledge on severe overdose cases which require evidence-based steps taken to intervene [1,2,3].
Drug overdose and abuse, especially among opioids and synthetic drugs, have become a substantial public health emergency in the United States. Between 1999 and 2022, the National Institute on Drug Abuse (2024) illustrated that overdose deaths have spiked, with synthetic opioids such as fentanyl being heavily implicated. In order to identify recurring patterns in such data-rich contexts, data mining is becoming more relevant as it enables data scientists and analysts to visualize patterns that would not be identified through traditional, statistical data analysis [4,5,6]
There are many overdose studies that have adopted data mining approaches. For example, [7], performed association rule mining, identified co-occurrence patterns between two types of drugs (opioids and benzodiazepines), and determined that the presence of benzodiazepines lead to increased fatality rates when using opioids. [8], conducted clustering analyses to geographically cluster overdose cases; results indicated clusters were located in underserved urban areas. [9], used classification methods, such as decision trees and logistic regression, to predict opioid drug overdose risk based on demographic and drug use activity information [7,8].
Preprocessing is a fundamental part of data mining due to noise, missing values, and varying formats addressed in health-related datasets. This study describes the use of techniques, such as imputation, transformation, and reduction, to prepare for reliable analyses. Ethical considerations have also been discussed in two new publications [10,11,12], relating to the privacy of data, minimizing bias, and ensuring transparency with sensitive personal information and public health issues. The existing literature supports the use of data mining for drug-related overdoses, particularly when used after strict preprocessing measures and ethics evaluations are applied [13,14,15]. This study supports this claim by providing the full end-to-end preprocessing pipeline and analyzing the Accidental_Drug_Related_Deaths.csv dataset using various mining techniques through this set of methods to assist health decision-makers and emergency managers in providing data-informed solutions to public health concerns [16,17,18].
2. Data Set Description
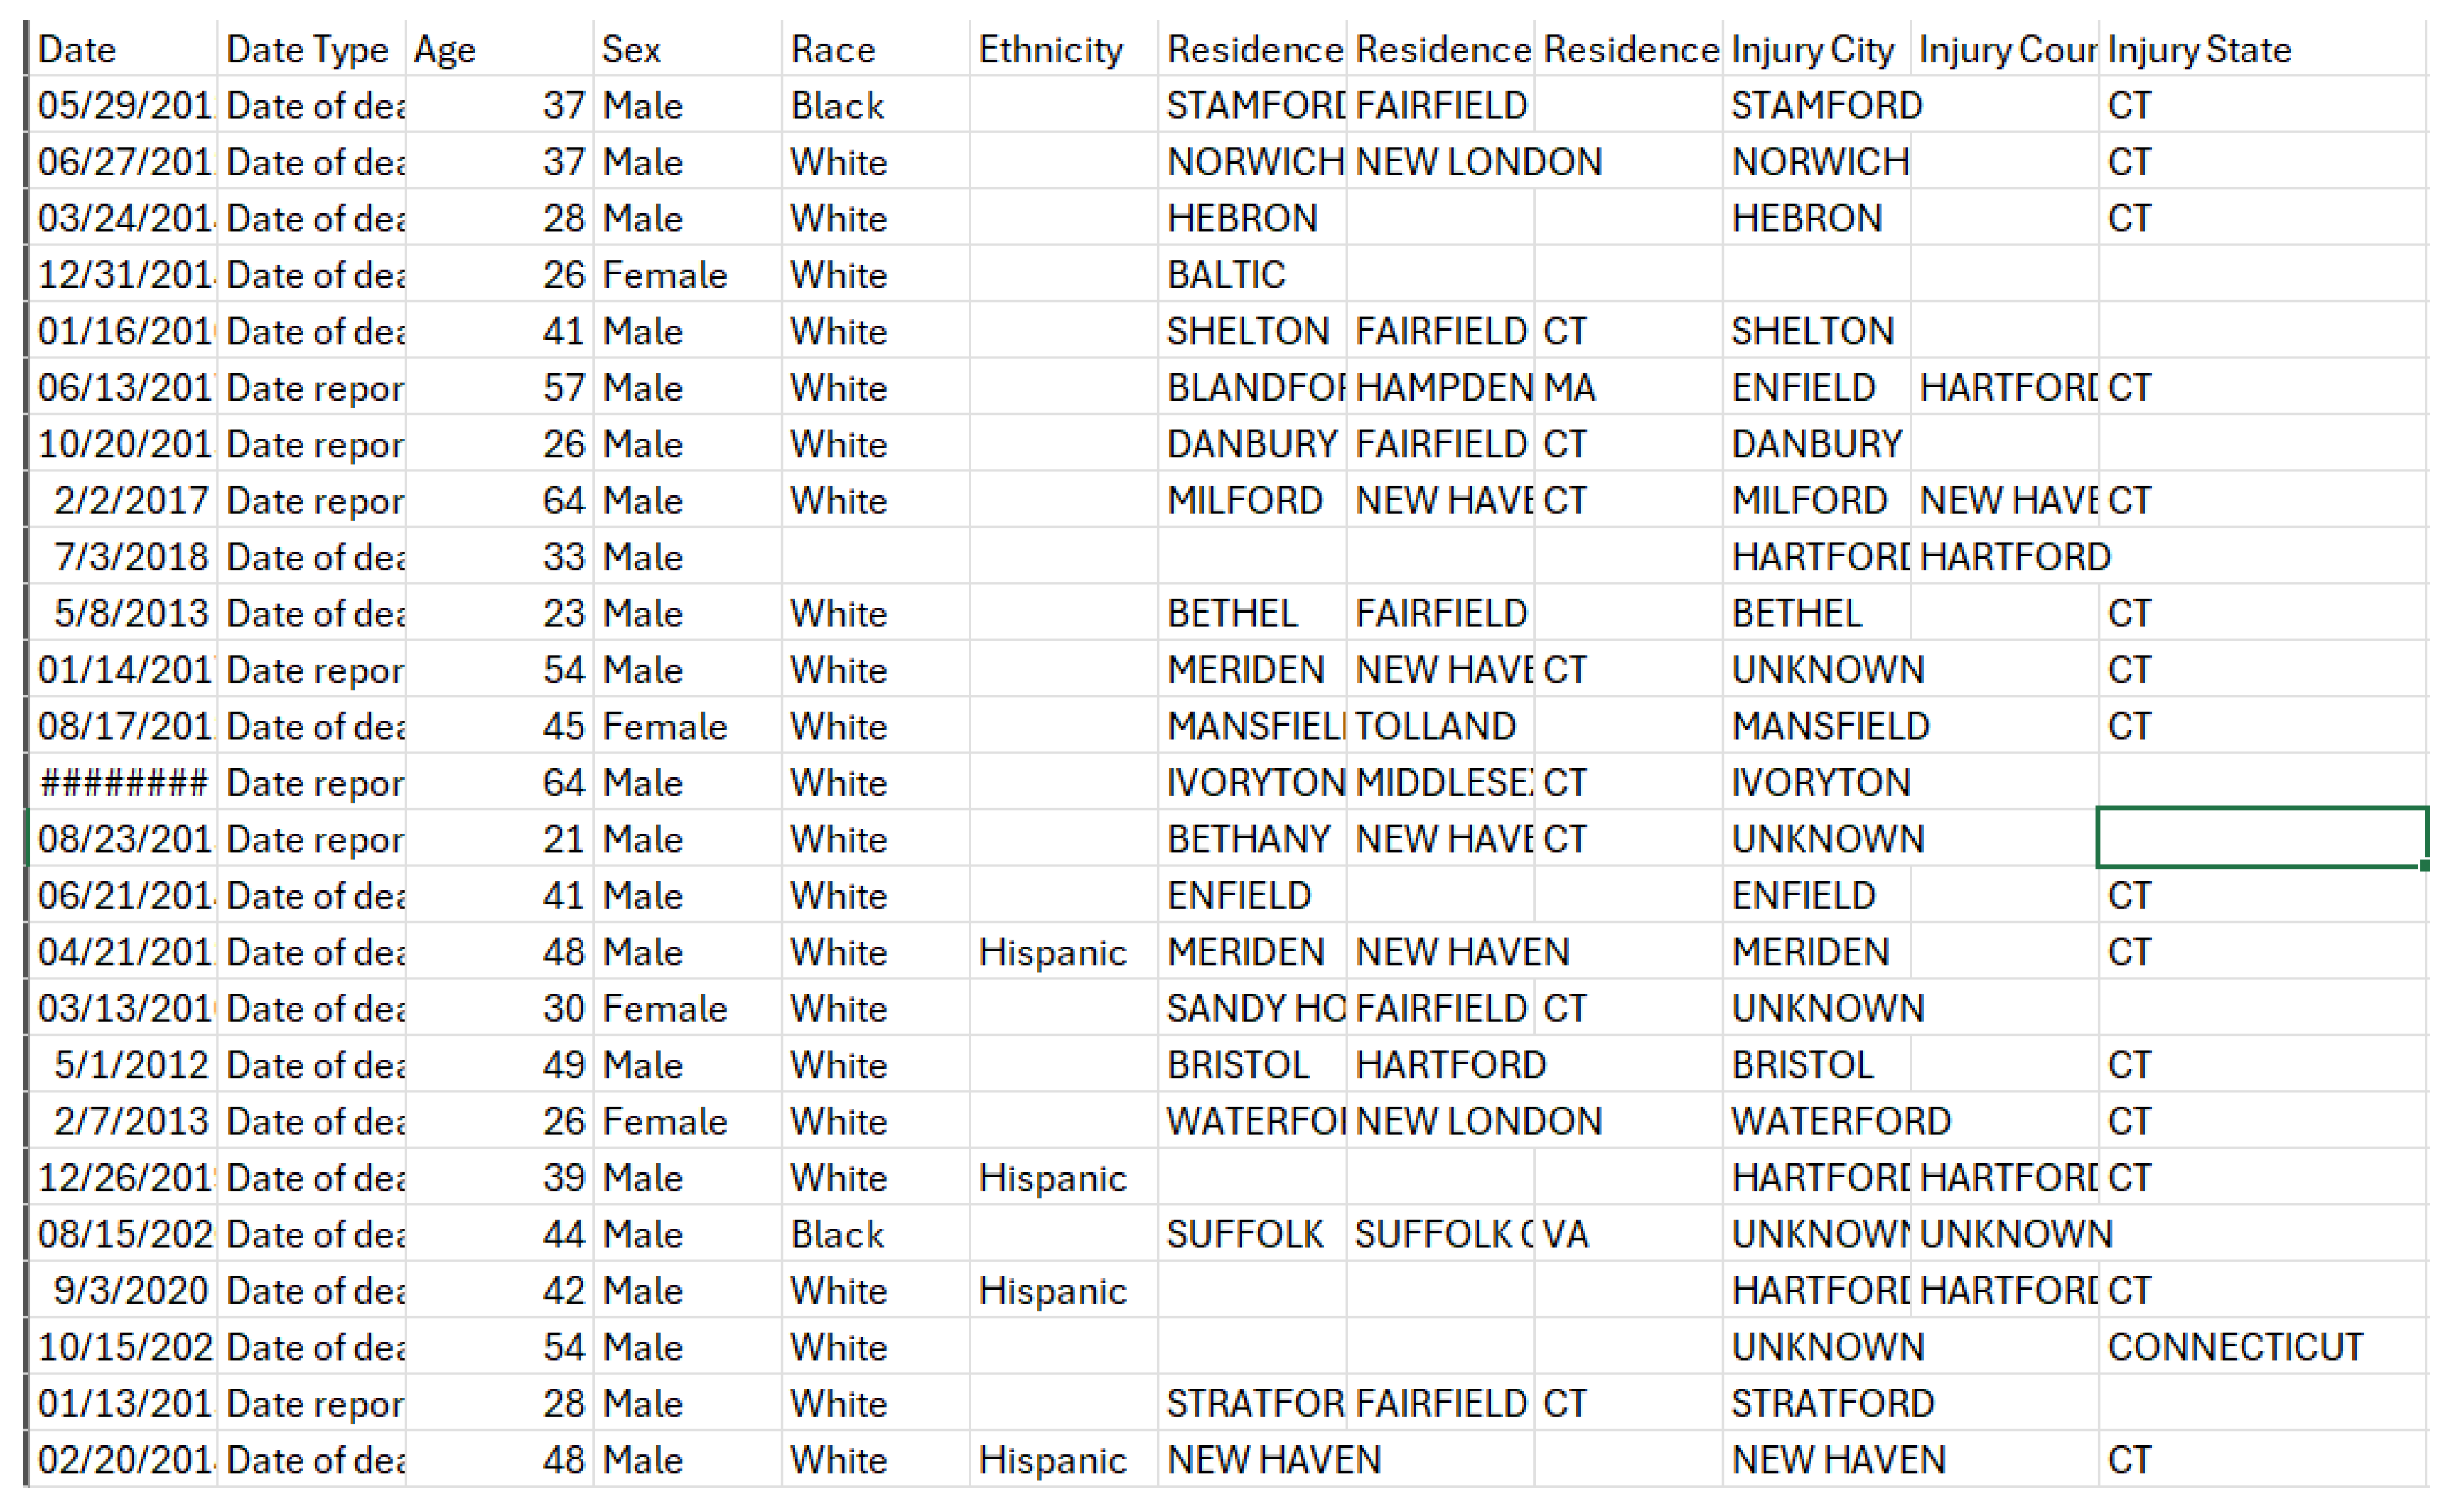
Our dataset, "Accidental_Drug_Related_Deaths_2012-2014.csv," is focused on drug-related accidental deaths – so it should not consider intentional deaths (i.e. suicides) – in United States of America. It includes details of the incident and its circumstances such as the city, county, and state in which it occurred, as well as other details, including the date and circumstances, related to the incident regarding the drug or drugs involved in the incident. A snapshot of the dataset is shown below in Figure 1. The dataset itself is too large to display here, therefore only a portion of it is shown here, but the snapshot shows all attributes (columns) in our dataset [19,20].
So, we have only included a sample. Table 1 gives an overview of each attribute, stating its type and what it measures or relates to.
As can be observed from the table above (Table 1), the vast majority of the data we have collected is in nominal form – meaning to say that it is categorical type data with is not ordered or ranked with values of related type values and are mutually exclusive. I have separated the columns into groups – it was my understanding to place columns that tell connected information into their groups and used color codes to make it look more interesting. The color coded groups are as follows (Table 2):
2.1. Missing Values
We can already see that the dataset clearly has a major problem at first look: empty rows or we can say null values. But how many are they exactly? I used the Python code in Google Colab (Figure 1.3) to help me figure this out: This code basically imports the pandas library which uses the alias pd as is the convention in python for data analysis (which pandas is used for), then it reads "Accidental_Drug_Related_Deaths.csv" in to a data frame called df, read_csv() function reads the csv file and loads it into a structured tabular format, while df.isnull() searches for null values and .sum() sums them all by column (i.e. sums the total null values per column). I used the name Null_counts for the variable that collects these values and print (Null_counts) simply prints these values.
As shown then in Table 3, only 3 of the 48 columns had zero missing values. All other columns have missing values, and the number of rows containing missing values can vary from 1 to tens of thousands. This will have to be addressed in the preprocessing.
This could be represented in a table format like below (Table 4):
'Unnamed: 48' is the only column which has no unique values as seen above. The rest of the columns though do have unique values or entries. The results from the code above show us that there are no duplicate values in our dataset. Now that the Dataset Description is finished, we will move on to the 'Problem Statement and Objectives'.
2.2. Problem Statement and Objectives
Drug addiction and abuse is a very serious issue in this present day around the world. It is an absolute destroyer of homes and ruin generations, making people vulnerable to abuse, and propelling many other crime types in society. As such, authorities around the globe are also reaching out to help tackle this mammoth issue using policies and punishments to nullify the issue. However, despite all of this the problem remains not only present but continues to enlarge. The amount of substance uses disorders and overdoses from substances have been on the up rise. To continue to support the above, we have respectively (Figure 2 and Figure 3) from the National Institute on Drug Abuse - a government department in the U.S which investigates the issue of drug abuse in the nation (National Institute on Drug Abuse, 2024).
Now, based on these figures we can see some trends. For example, to start with figure 2.1 we can see that male deaths outnumber female deaths from the year 1999-2022 and in figure 2.2 we can see the various categories of drugs and which drug categories overdoses made up the majority of deaths for each year. In essence, we can say we see trends and patterns. Before we make any decisions or make any recommendations, we have to first understand the context in which we are observing the events and to do this we need to observe trends and patterns in the dataset we have "Accidental_Drug_Related_Deaths.csv". By observing and interpreting trends and patterns we can generate helpful information that can continue leading us to a better understanding of the problem. Our Problem statement, objectives, and impacts are the following:
3. Identifying Common Combinations of Drugs in Accidental Overdose
One of the keys aims of this study is to identify which combinations of drugs are most frequently associated with accidental drug overdose deaths. Drug overdoses usually do not happen with a lone drug, but from the combined effects of two or more drugs. While determining the most common combinations is not straightforward, it can be of great value. Knowing which combinations of drugs are the most lethal, can make the process of immediate response more efficient for policymakers, first-responder personnel and health sector workers about which drug combinations pose greater risks. For instance, if responders are aware of which complete drugs are often coincident in overdose cases, it could help refine emergency treatment procedures. Also, public health agencies could advance education campaigns identifying the most deadly combinations that they want to allude to. Moreover, if they identify which combinations of drugs were somehow restricted to reduce fatalities, the knowledge will also assist policy makers to put limits on access to certain combinations of drugs that were identified as posing greater risks.
4. Determine High Risk Demographics Categorized by Gender, Ethnicity, or Age
Another important goal of the study is to identify demographic characteristics that are at a greater risk of death from accidental drug overdose. Demographic groups can be categorized by gender, age, race or ethnicity. Identifying high risk demographics allows health care and law enforcement agencies to direct attention appropriately. For example, if a greater risk is found in teenage girls of Latino origin, then prevention may be specifically targeted to that demographic. The health care system can provide medical resources and ancillary services to communities and populations that need it the most. Law enforcement can also be sensitive to demographic risk factors in designing an intervention and ensure particular focus on the groups affected most heavily.
5. Anomalous Case Detection from Overdose Data
The analysis also looks for anomalous or outlier cases in the overdose data – particularly in terms of age, which is the only numerical attribute in the dataset. The identification of anomalies is important in order to ensure continued tracking of the dataset integrity and discern any irregular trend. The death of a very young child from accidental overdose, for instance, or that of an elderly person may indicate either a data entry error, or new behavior in drug use that requires further analysis. By identifying such anomalies, the analysis has the opportunity to ensure data integrity, identify unexamined risk factors, and make sure future analysis is not misled by anomalous or outlier data points.
6. Determining High-Risk Geospatial Areas for Overdose Mortality
Geospatial analysis is an important tool for determining whether drug overdose mortality is evenly distributed across the United States, or whether it is spatially concentrated in particular areas. High-risk geographical areas allow for more effective use of public health approaches to reduce overdoses. For example, law enforcement authorities and healthcare practitioners can direct their treatment or enforcement considerations to examine geographic "hot spots" of overdose. Much like geospatial analysis, hot spots can both clarify patterns of behavior and make meaningful future predictions. Localized geospatial analysis can improve the ability to develop better national and regional policy implications and quickly plan an appropriate response in communities where the need is urgent.
7. Recognizing Common Locations for Overdoses
The last goal is to examine where overdose deaths typically occur; it could be at a home, a workplace, a hotel, a park, or a different location. Identifying where overdoses often occur will reveal important behavioral/situational characteristics and typologies associated with substance abuse and inform targeted location-specific prevention efforts. For example, if most overdoses occur in private homes, prevention programming and intervention could be directed toward households. If many overdoses occur in public spaces like hotels and cars, perhaps an increased level of monitoring or providing emergency kits would be appropriate. Recognizing patterns allows us to better understand the context of overdose deaths and in turn can help improve the design of preventive strategies and emergency responses.
7.1. Methodology
This research uses a holistic data mining approach to analyze the Accidental_Drug_Related_Deaths.csv with 11,981 records and 48 attributes. The approach has four major stages, each intended to achieve particular objectives of the study as follows: data preprocessing; data transformation/reduction; application of various data mining procedures and, visualization and interpretation. Data mining could specifically reveal frequent drug combinations, high risk demographic groups, anomalies in drug overdoses and, geospatial trends associated with overdoses.
7.2. Data Preprocessing
Data preprocessing was a vital step because the dataset included numerous missing, incorrect, inconsistent, and redundant values. The first step when dealing with the data quality issues was to process the missing values either through imputation, if the missingness is determined to be at random, or just removing them altogether and ignoring the rows/columns, based on missing value prevalence and how important the data was. Imputations were done with common approach. Missing values in numerical fields like the Age field were imputed with the mean value of that field. Missing values in categorical fields such as Sex were filled with the mode. The decision was made to remove some columns that had a significant enough amount of missing data, such as Ethnicity and the Heroin death certificate data with check boxes, because this would not affect the quality of the dataset. The categorical variables were standardized to remove data entry or spelling mistakes; as an example, (CT) and (Connecticut) for the state data were standardized to one of these values. The values in each categorical column in this study, including Race, Injury Place, and Description of Injury were categorized and used standardized grouping categories for improved inferential, explanatory or causal modeling objectives as well as interpretability of model outputs. Lastly, when there are missing and even vague data points with geolocation fields, whether by geographic coordinates, the researcher completed them or simply deleted the row if there was no way to correct the spatial determination. Finally, columns that were redundant such as Unnamed: 48, Location if Other, and Cause of Death; these columns clutter the dataset and noise from many missing values, so those values were edited until fully resolved and noted.
7.3. Data Transformation and Encoding
During the transformation stage, categorical variables were transformed into numerical representation to be compatible with machine learning algorithms. Similar variables were merged into one column. For instance Any Opioid and Other Opioid were combined into a new variable called Any Other Opioid when conducting analysis. Geolocation columns were specified in the original data set as ResidenceCityGeo, InjuryCityGeo and DeathCityGeo, either needing to be edited into multiple columns indicating the city, state, latitude and longitude, respectively for a more efficient spatial analysis. There were enhancements made to the data where it was formatted, such as personal checks of data for capitalization; for example, scrubbing variable names so that the origin city state names were consistent. Enhancements were made to textual data and with these last improvements the project dataset was primed for analysis.
7.4. Data Mining Techniques
The study used various data mining approaches to meet the analytical objectives of this study. For example, association rule mining was conducted in the form of two data mining algorithms (Apriori and FP-Growth), with respect to the goal of discovering commonly co-occurring substances in overdose cases. Such algorithms, for example, help uncover important combinations of substances related to overdoses, e.g. heroin and fentanyl usually show up together. Classification methods (decision trees, logistic regression and random forests) - were used to classify people into either high- or low-risk based on age categories, gender and race. Clustering approaches (K-Means, Hierarchical Clustering and DBSCAN) were used to find demographically based groupings and high-risk geospatial clusters. Finally, methods for outlier detection (Isolation Forest, Z-score, DBSCAN and Local Outlier Detection - LOF) were used to look for qualitatively odd occurrences, including young or elderly victims, or deaths that occurred at inadvisable locations.
7.5. Visualization and Interpretation
To assist in the interpretation of the data, many visualizations were prepared following the analysis using Python libraries such as Matplotlib and Seaborn. These included histograms we used to explore the distributions of age, commonly used substances and locations of death, barred charts to gauge the distributions of substance use, heatmaps to illustrate correlations between substances and geographic clusters of overdose deaths, and pie charts for race and ethnicity distributions after pre-processing. The visualizations expanded the clarity of our findings and improved accessibility for both policymakers and public health practitioners.
Figure 12.
rows, the percentage of missing values is negligible. These were imputed with the mean, and then rounded to the closest whole number, as Age is most often reported in whole years. I confirmed the validity of the imputation by checking the historically missing rows.
Figure 12.
rows, the percentage of missing values is negligible. These were imputed with the mean, and then rounded to the closest whole number, as Age is most often reported in whole years. I confirmed the validity of the imputation by checking the historically missing rows.
The Sex column had 12 missing or ambiguous values (for example, "X" or "Unknown"). These were imputed also with the mode, which was "Male." Since there were 8887 males and 3082 females in the dataset, the 12 missing values were inconsequential, in terms of distribution.
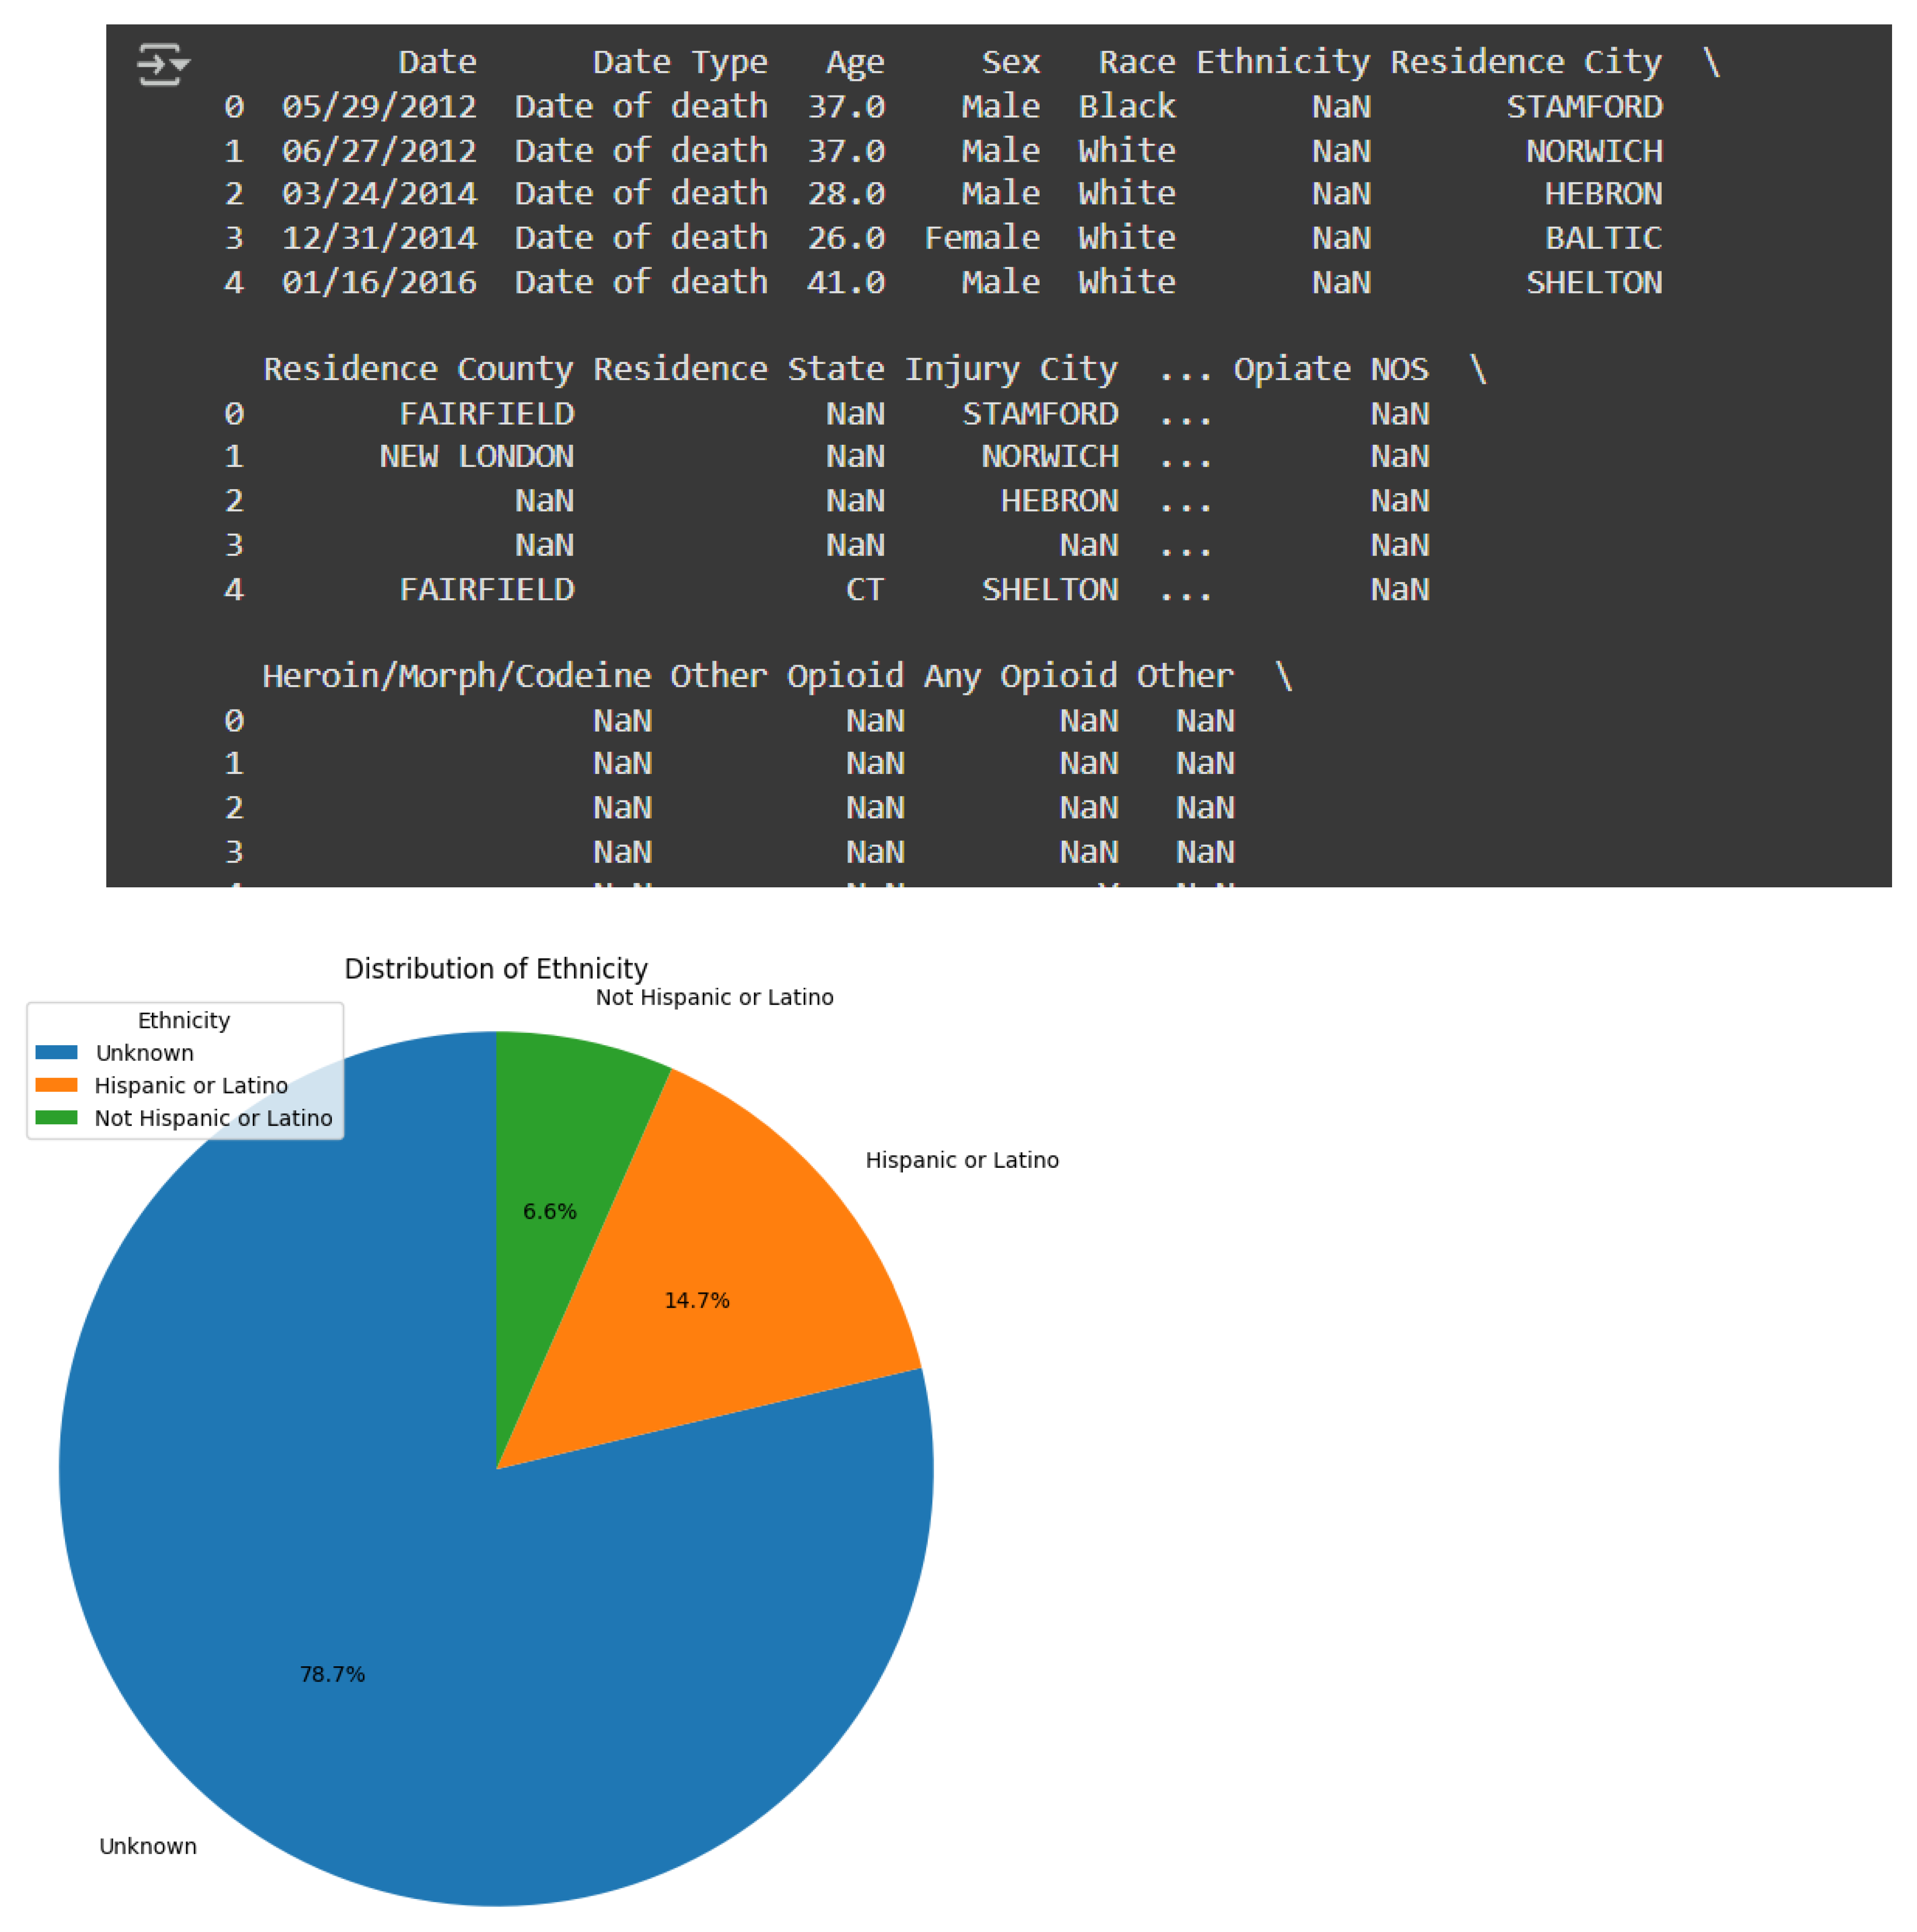
The Race column was subsequently mapped into standardized categories according to U.S. government classifications. The categories were: American Indian/Alaska Native, Asian, White, Native Hawaiian/Other Pacific Islander, and Black or African American. “Unknown/Unreported” was used for entries indicating “Other (Specify)” or for missing data. The mapping of Race complied with federally mandated categories and offered an enhanced level of consistency for analysis purposes. Similarly, the Ethnicity variable was reduced to “Hispanic or Latino,” “Not Hispanic or Latino,” and “Unknown,” for the missing values. However, with over 9,000 missing entries in this column, it was clear that this column did not meaningfully contribute to the current study. Therefore, the Ethnicity column was dropped.
Next up was Injury Place. Again, the number of unique and null values were printed for the reader's review. The entries had different descriptions of the place for location. As before, fewer but standardized categories were created. Then in ResidenceCityGeo I found three entries where I only had Connecticut (CT) and coordinates for the Location (town names were missing) without any way to look up what the town name was. I found the missing town names via Google and input them into the dataset. I noticed that City Names were all uppercase in the ResidenceCityGeo and InjuryCityGeo column. To improve readability to the reader and provide a more professional appearance, I capitalized the first letter of each word for those City Names except for the abbreviations for the states (those remained all uppercase).
The manner of death column had values such as "Accident", "Natural", and "Pending". As this dataset is strictly for an accidental drug-related death, the rows for "Natural" and "Pending" manner of death entries were removed. After the data removal, it was clear that all rows listed "Accident" in the Manner of Death column, therefore, it was redundant and dropped from the dataset.
Figure 48.
Unnamed: 49, Any Opioid, Other Opioid, Any Other Opioid.1 (This was the temporary version of the merged column we created while completing the earlier task). These columns were all empty of meaning in one way or another and we replaced them with more concise representations. The list of columns was double checked and I could feel good that all we had intended to do was accomplished.
The Other Significant Conditions column contained a sizeable amount of varied, non-standardized entries. Any missing values were replaced with 'N/A' in order to retain that column in the dataset while avoiding introducing inconsistency or losing valuable information.
For all drug related column (i.e., Heroin, Cocaine, Fentanyl, Ethanol, etc.), unique entries were standardized to binary values of 'Y' and 'N' indicating whether or not that drug was part of that patient's treatment plan. This was done to maintain a uniformity of reporting that would be compatible with many classification and clustering algorithms. The same transformation was repeated for the more infrequently used drug columns, (i.e., Methadone, Amphet, Tramad, Gabapentin, etc.)
The Other column was examined next, as it also contained an abundance of named substances. Unique values from within that column were grouped into 11 standardized categories using a mapping strategy that was based on the drug type or similarity in chemical structure. The missing values in this column were also replaced with 'N/A' since those rows did not report evidence of any substances beyond the identified labels.
The geographic columns (Residence City Geo, Injury City Geo, and Death City Geo) were separated into three different components - city, state, and geographic coordinates, using a string split given the established structure ('City', 'State', and geo-coordinates). Next, the coordinates were also separated into two separate new columns (LAT for Latitude, LONG for Longitude), making geospatial analysis more intelligible. Once these transformations were finished, the original GEO columns were dropped since we had delineated/restructured their information.
7.6. Data Reduction
In order to reduce the number of columns and eliminate redundancy, the number of columns were dropped for a reasons that can be justified. The Residence City, Residence County, Residence State, Injury City, Injury County, Injury State, Death City, Death County, and Death State columns were removed because they had a lot of missing data. In addition, we had already introduced columns for geolocation earlier and they provided all this information in a way that would be useful. The Cause of Death column was also dropped. The contents of the Cause of Death column overlapped substantially with the individual drug-specific columns, and therefore, would be redundant for our intended analysis. The Heroin death certificate (DC) column was dropped as well because it was incomplete and did not specifically explain substance-related deaths. Therefore, the Heroin DC was also not relevant for any type of data mining purpose as it could not be expressed as an actual drug or condition.
7.7. Encoding
All categorical fields were encoded into numerical types to prepare the data for machine learning purposes. It is necessary to encode categorical data into numerical formats for use with algorithms that need numerical input. The cleaned dataset saved as FINAL.csv After an error during processing was encountered, the Other and Other Significant Conditions were processed and finalized to complete the transformation and preparation of the data. The fully cleaned and encoded version of the dataset was then saved as FinalCleanDataset.csv.
7.8. Data Visualization and Interpretation
This section presents the visualizations developed to interpret the patterns, distributions, and trends found within the dataset.
Figure 1.
Missing Values per Column (Bar Plot).
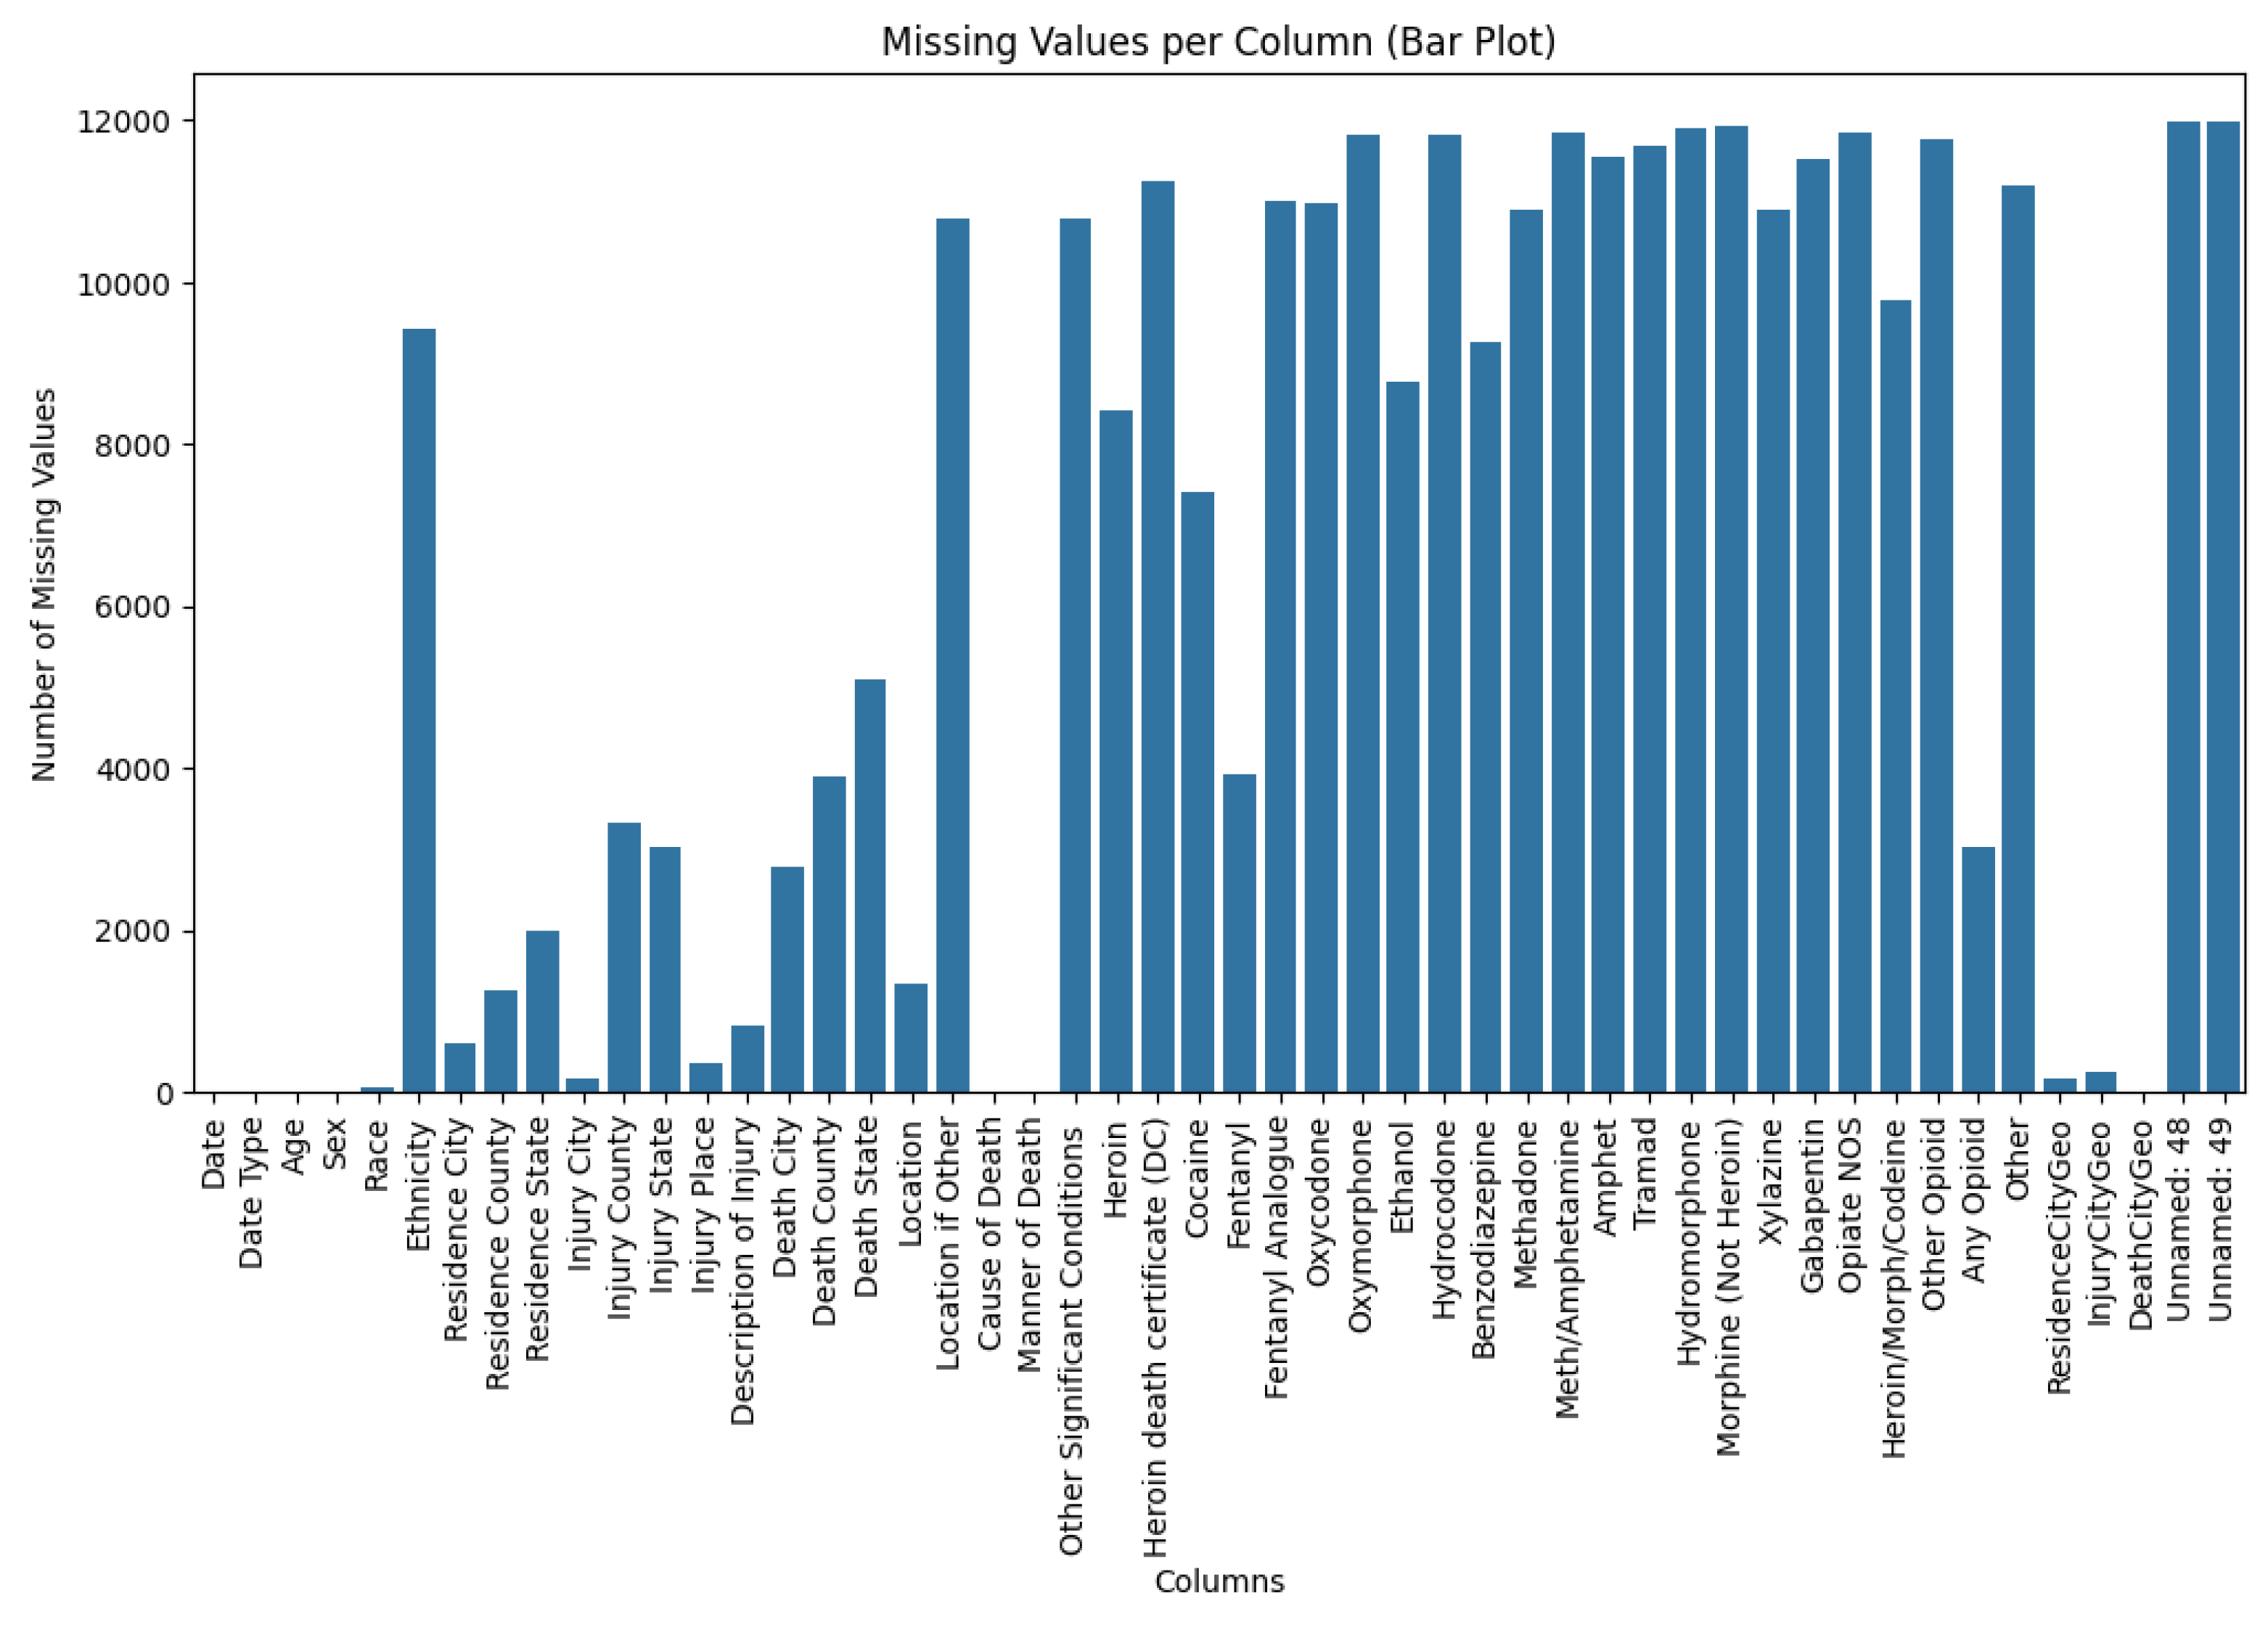
The bar chart demonstrates the number of missing values for each column. For example, Date, Date Type, Age, Sex, and Cause of Death have no missing values or only very few, while Unnamed: 48 and Unnamed: 49 have the highest missing values and unused information.
Figure 2.
Heatmap of Missing Values Before Preprocessing.
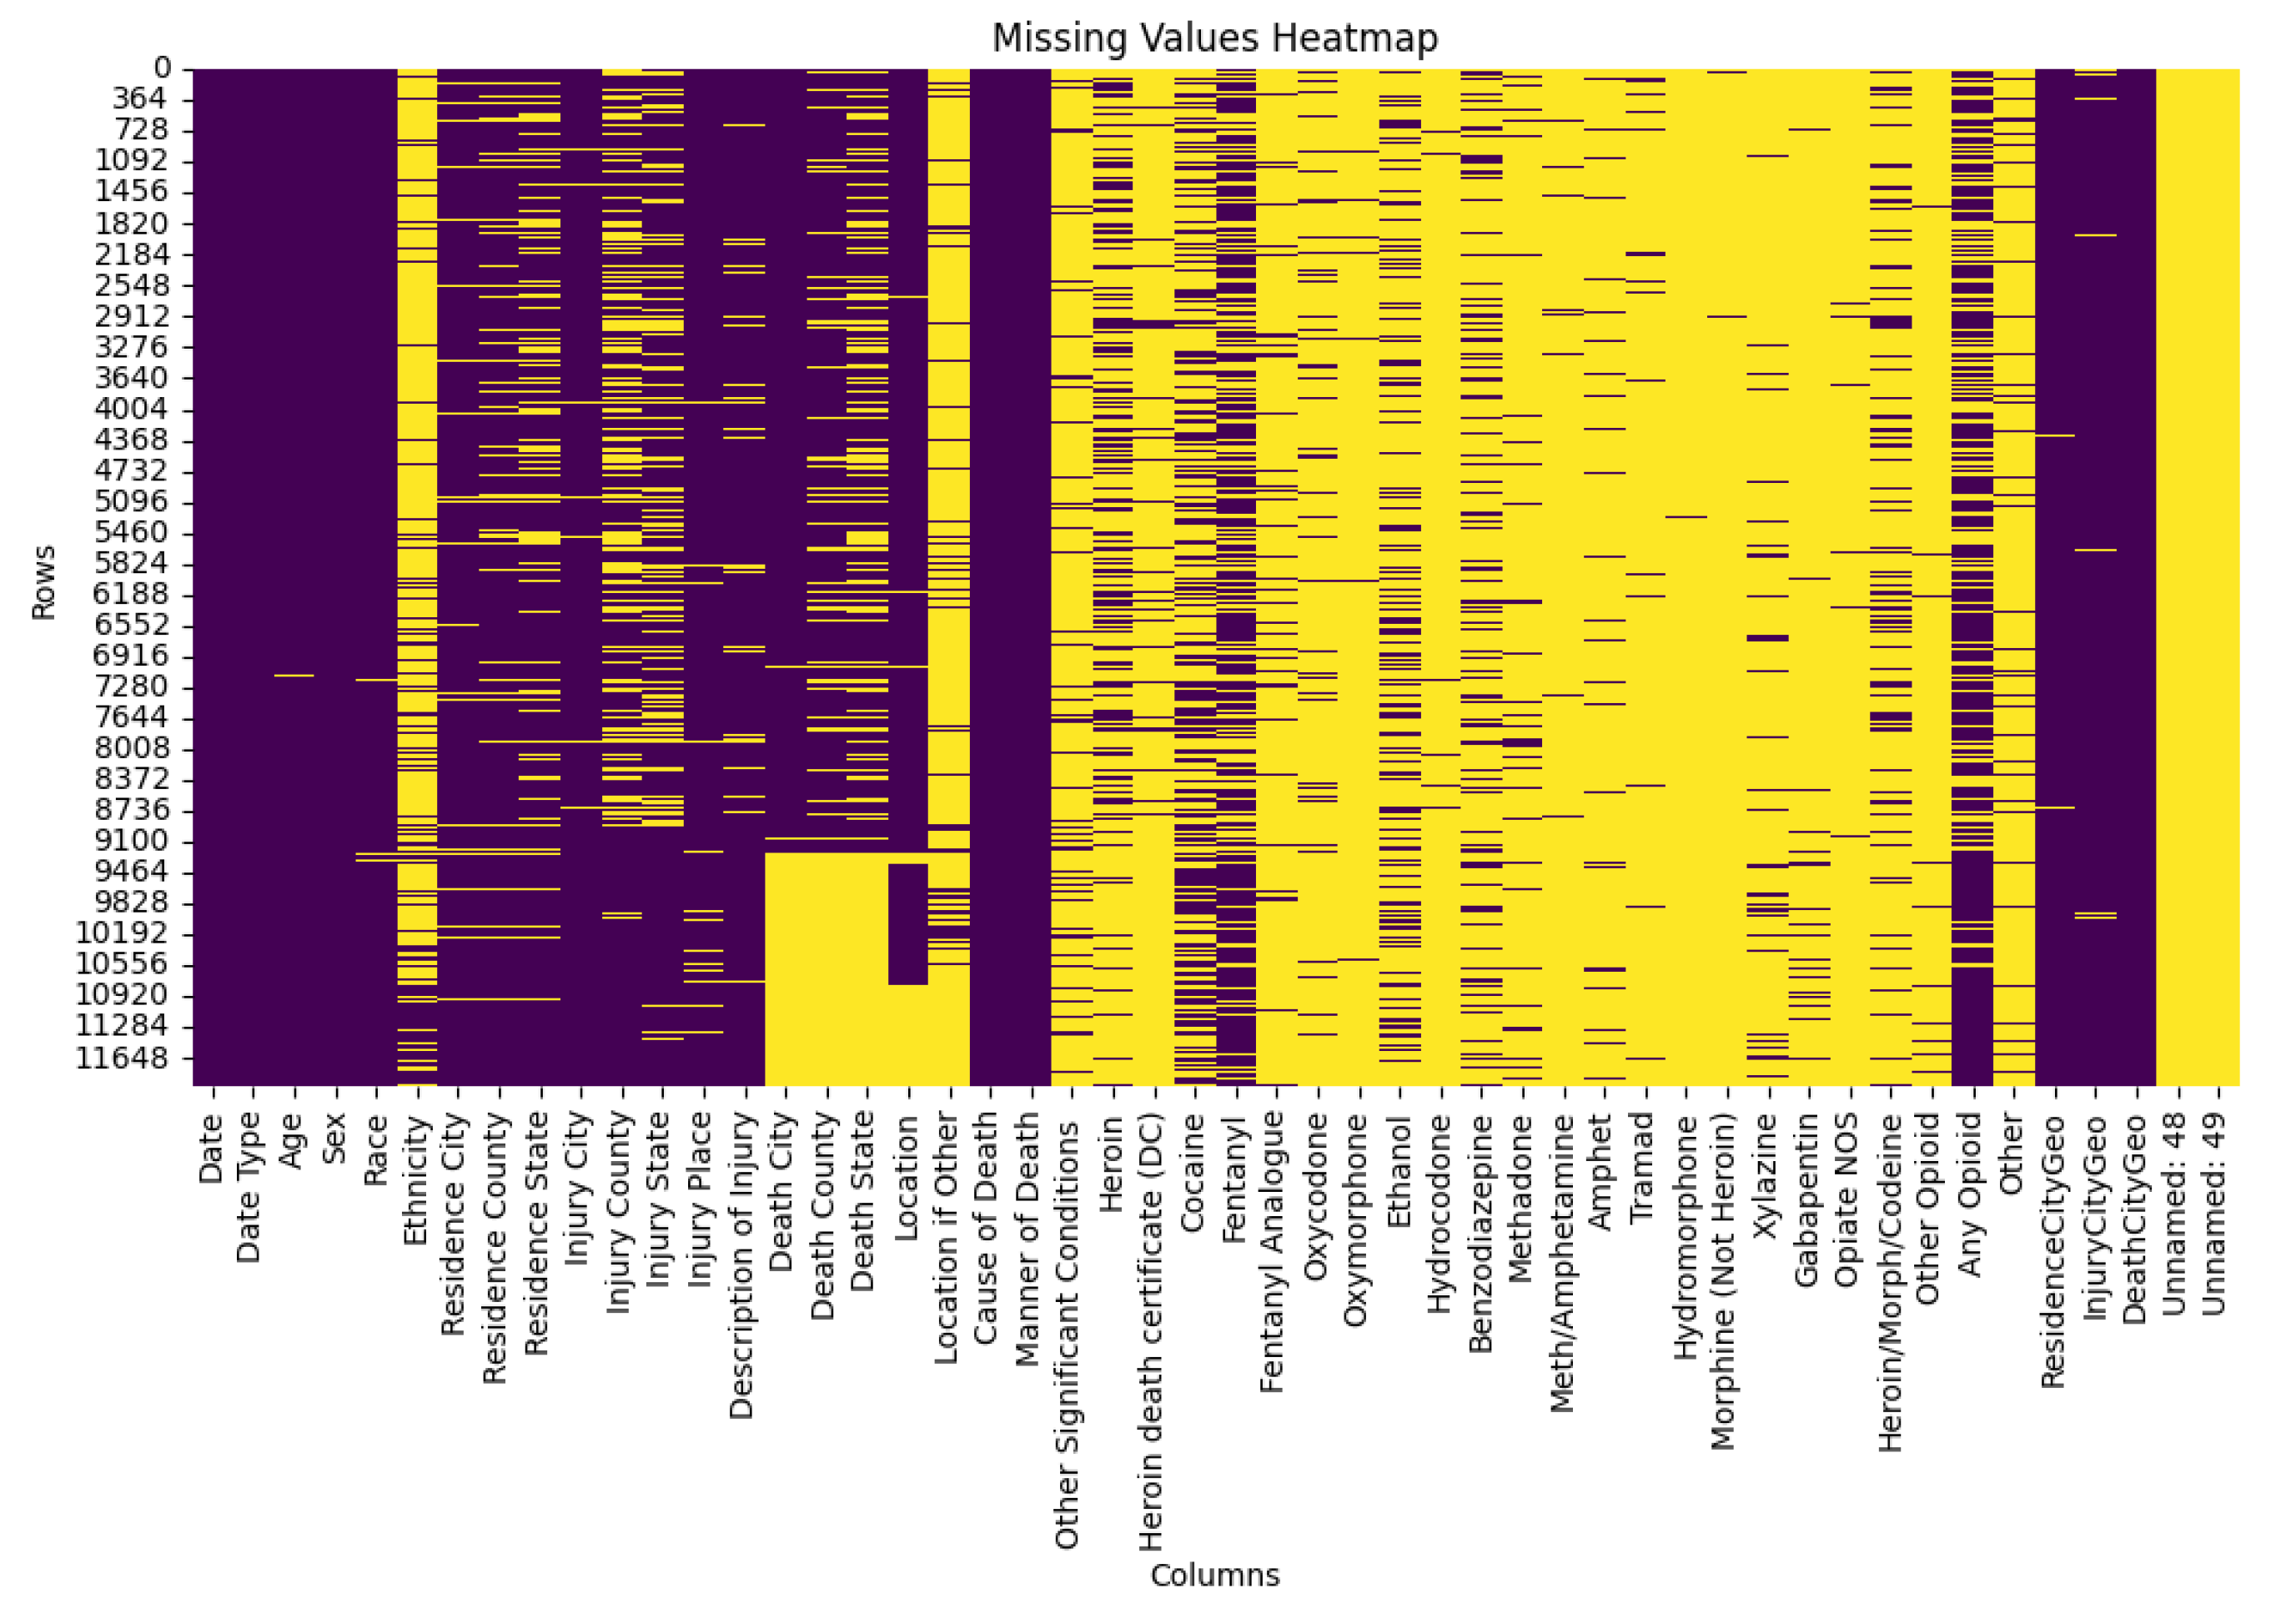
The heatmap uses purple to indicate present values and yellow to denote missing ones. These visual highlights the extent and distribution of missing data across all columns before cleaning.
Figure 3.
Unique Values per Column (Bar Plot)
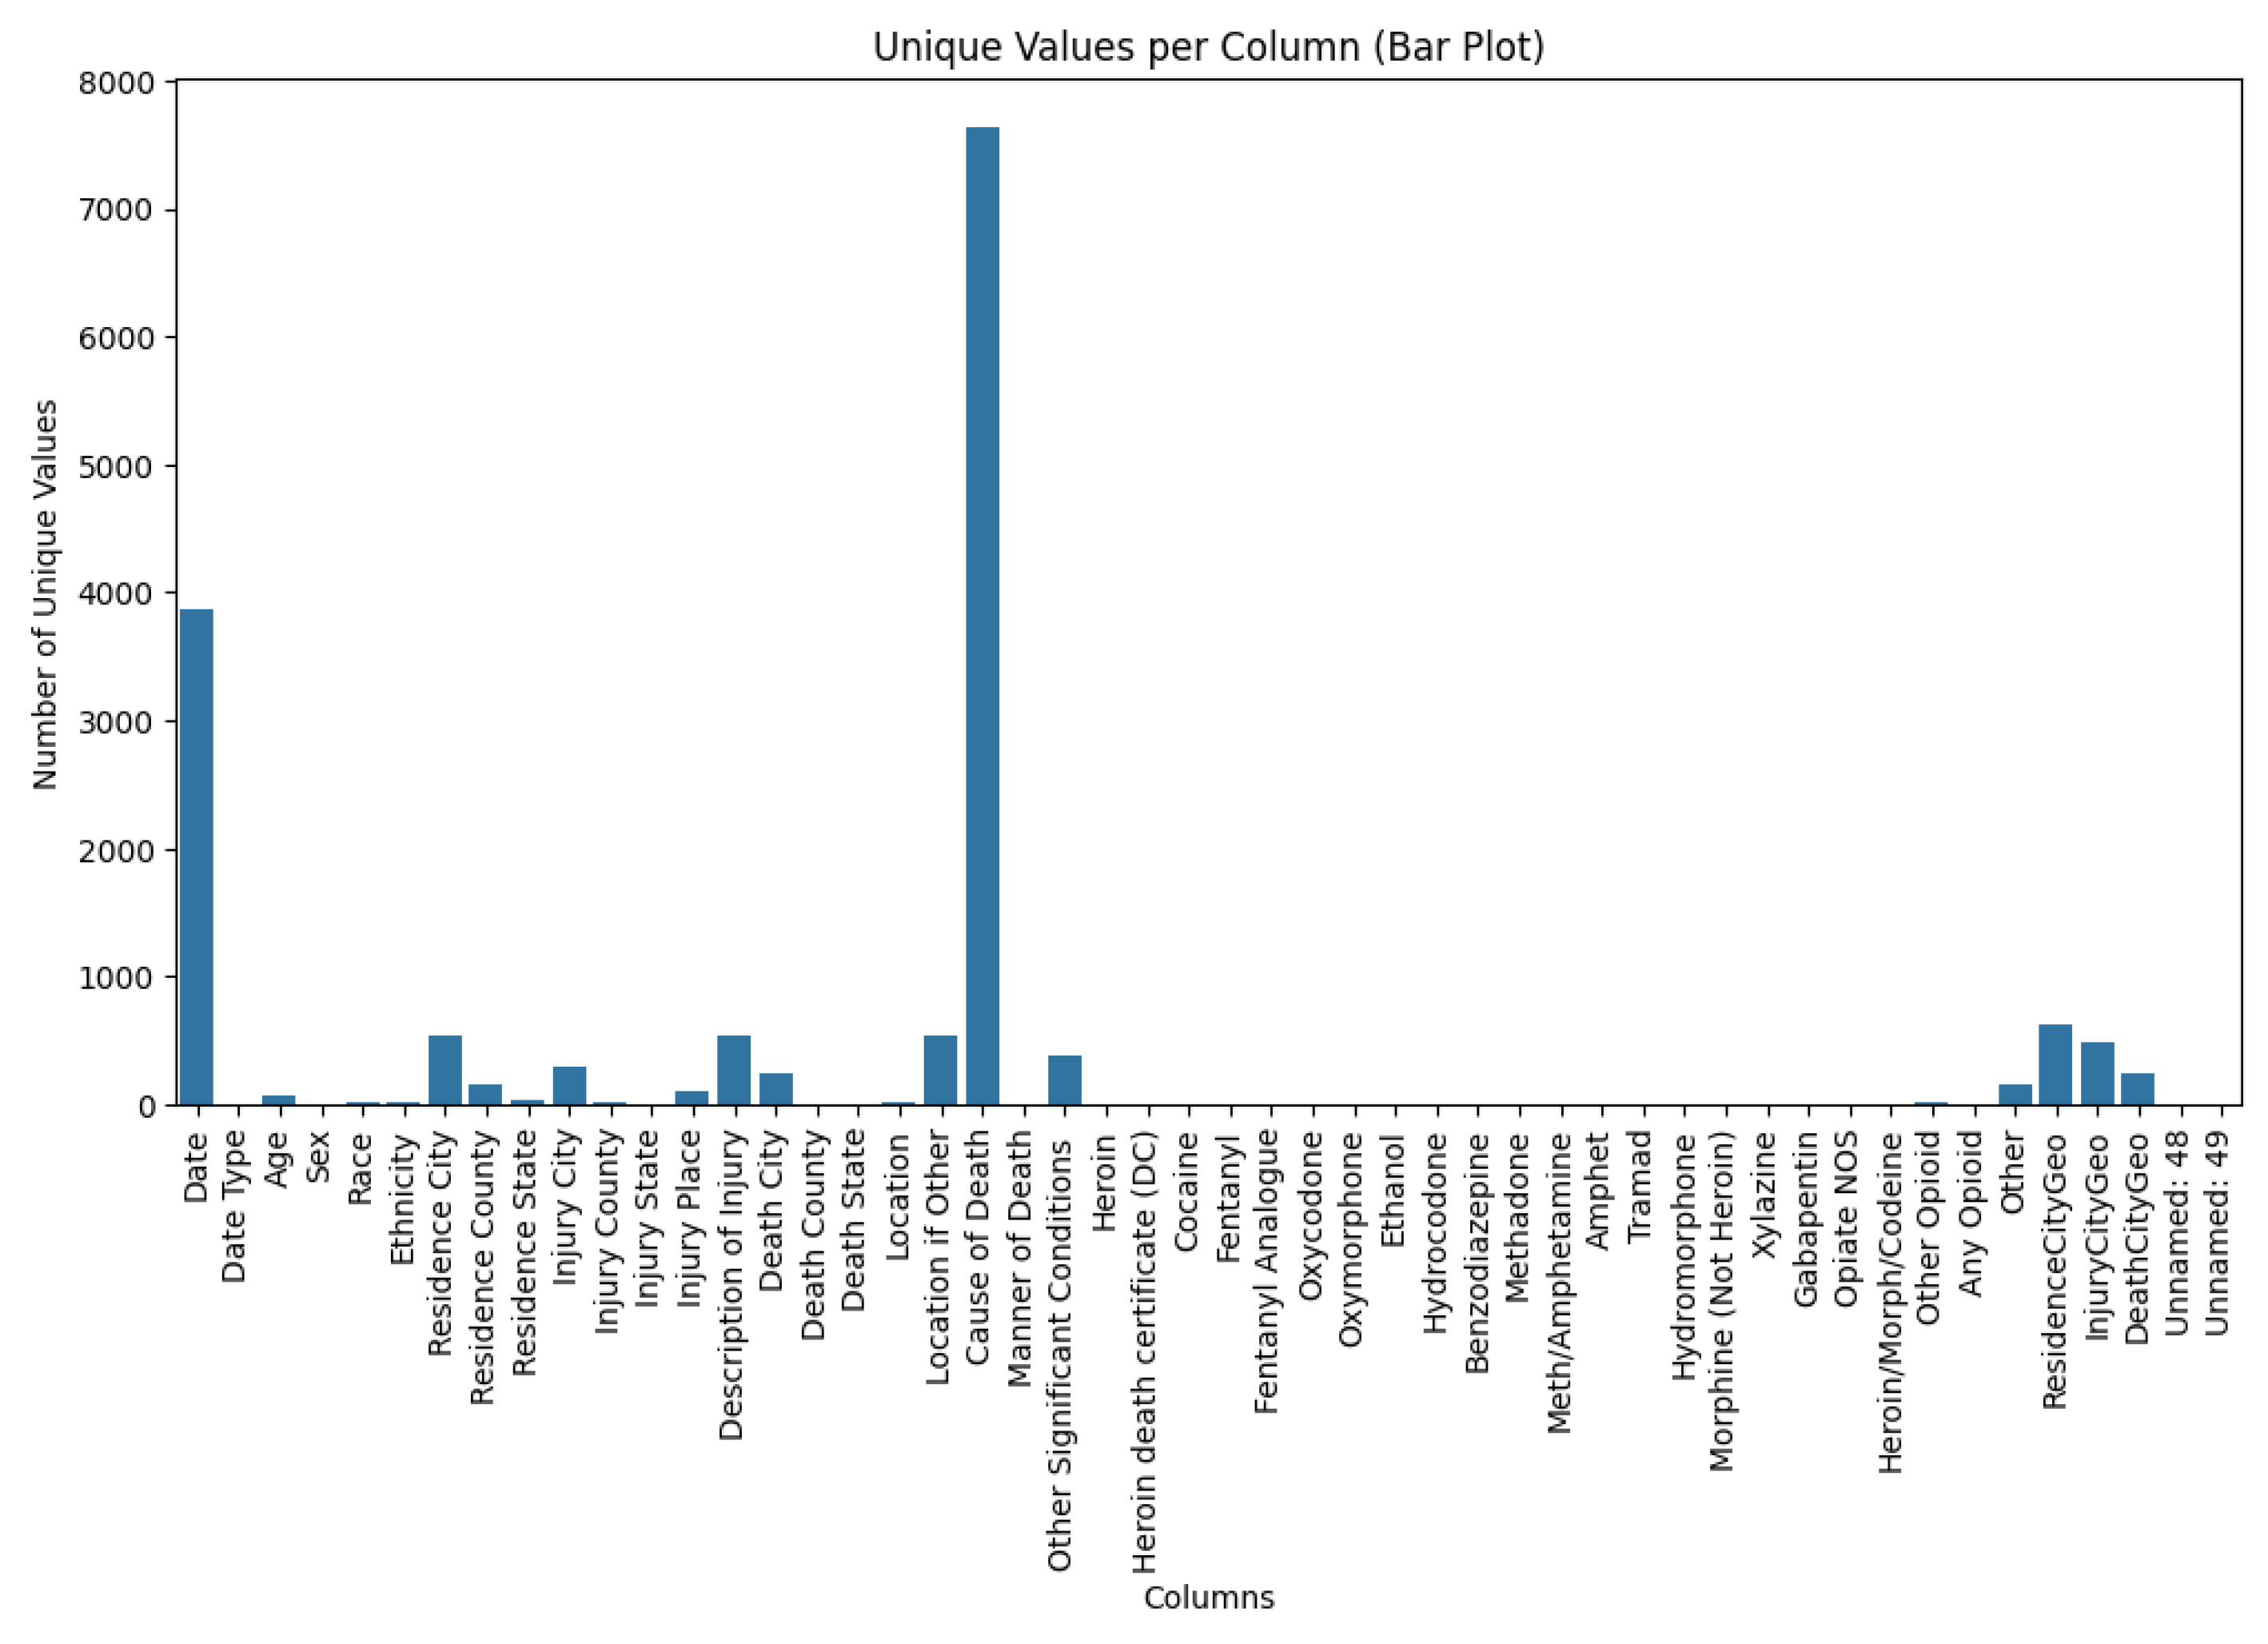
This bar plot reveals the number of unique values in each column. The Date and Cause of Death columns contain the highest number of unique entries, while most other columns show relatively limited variability.
Figure 4.
Duplicates per Column (Bar Plot).
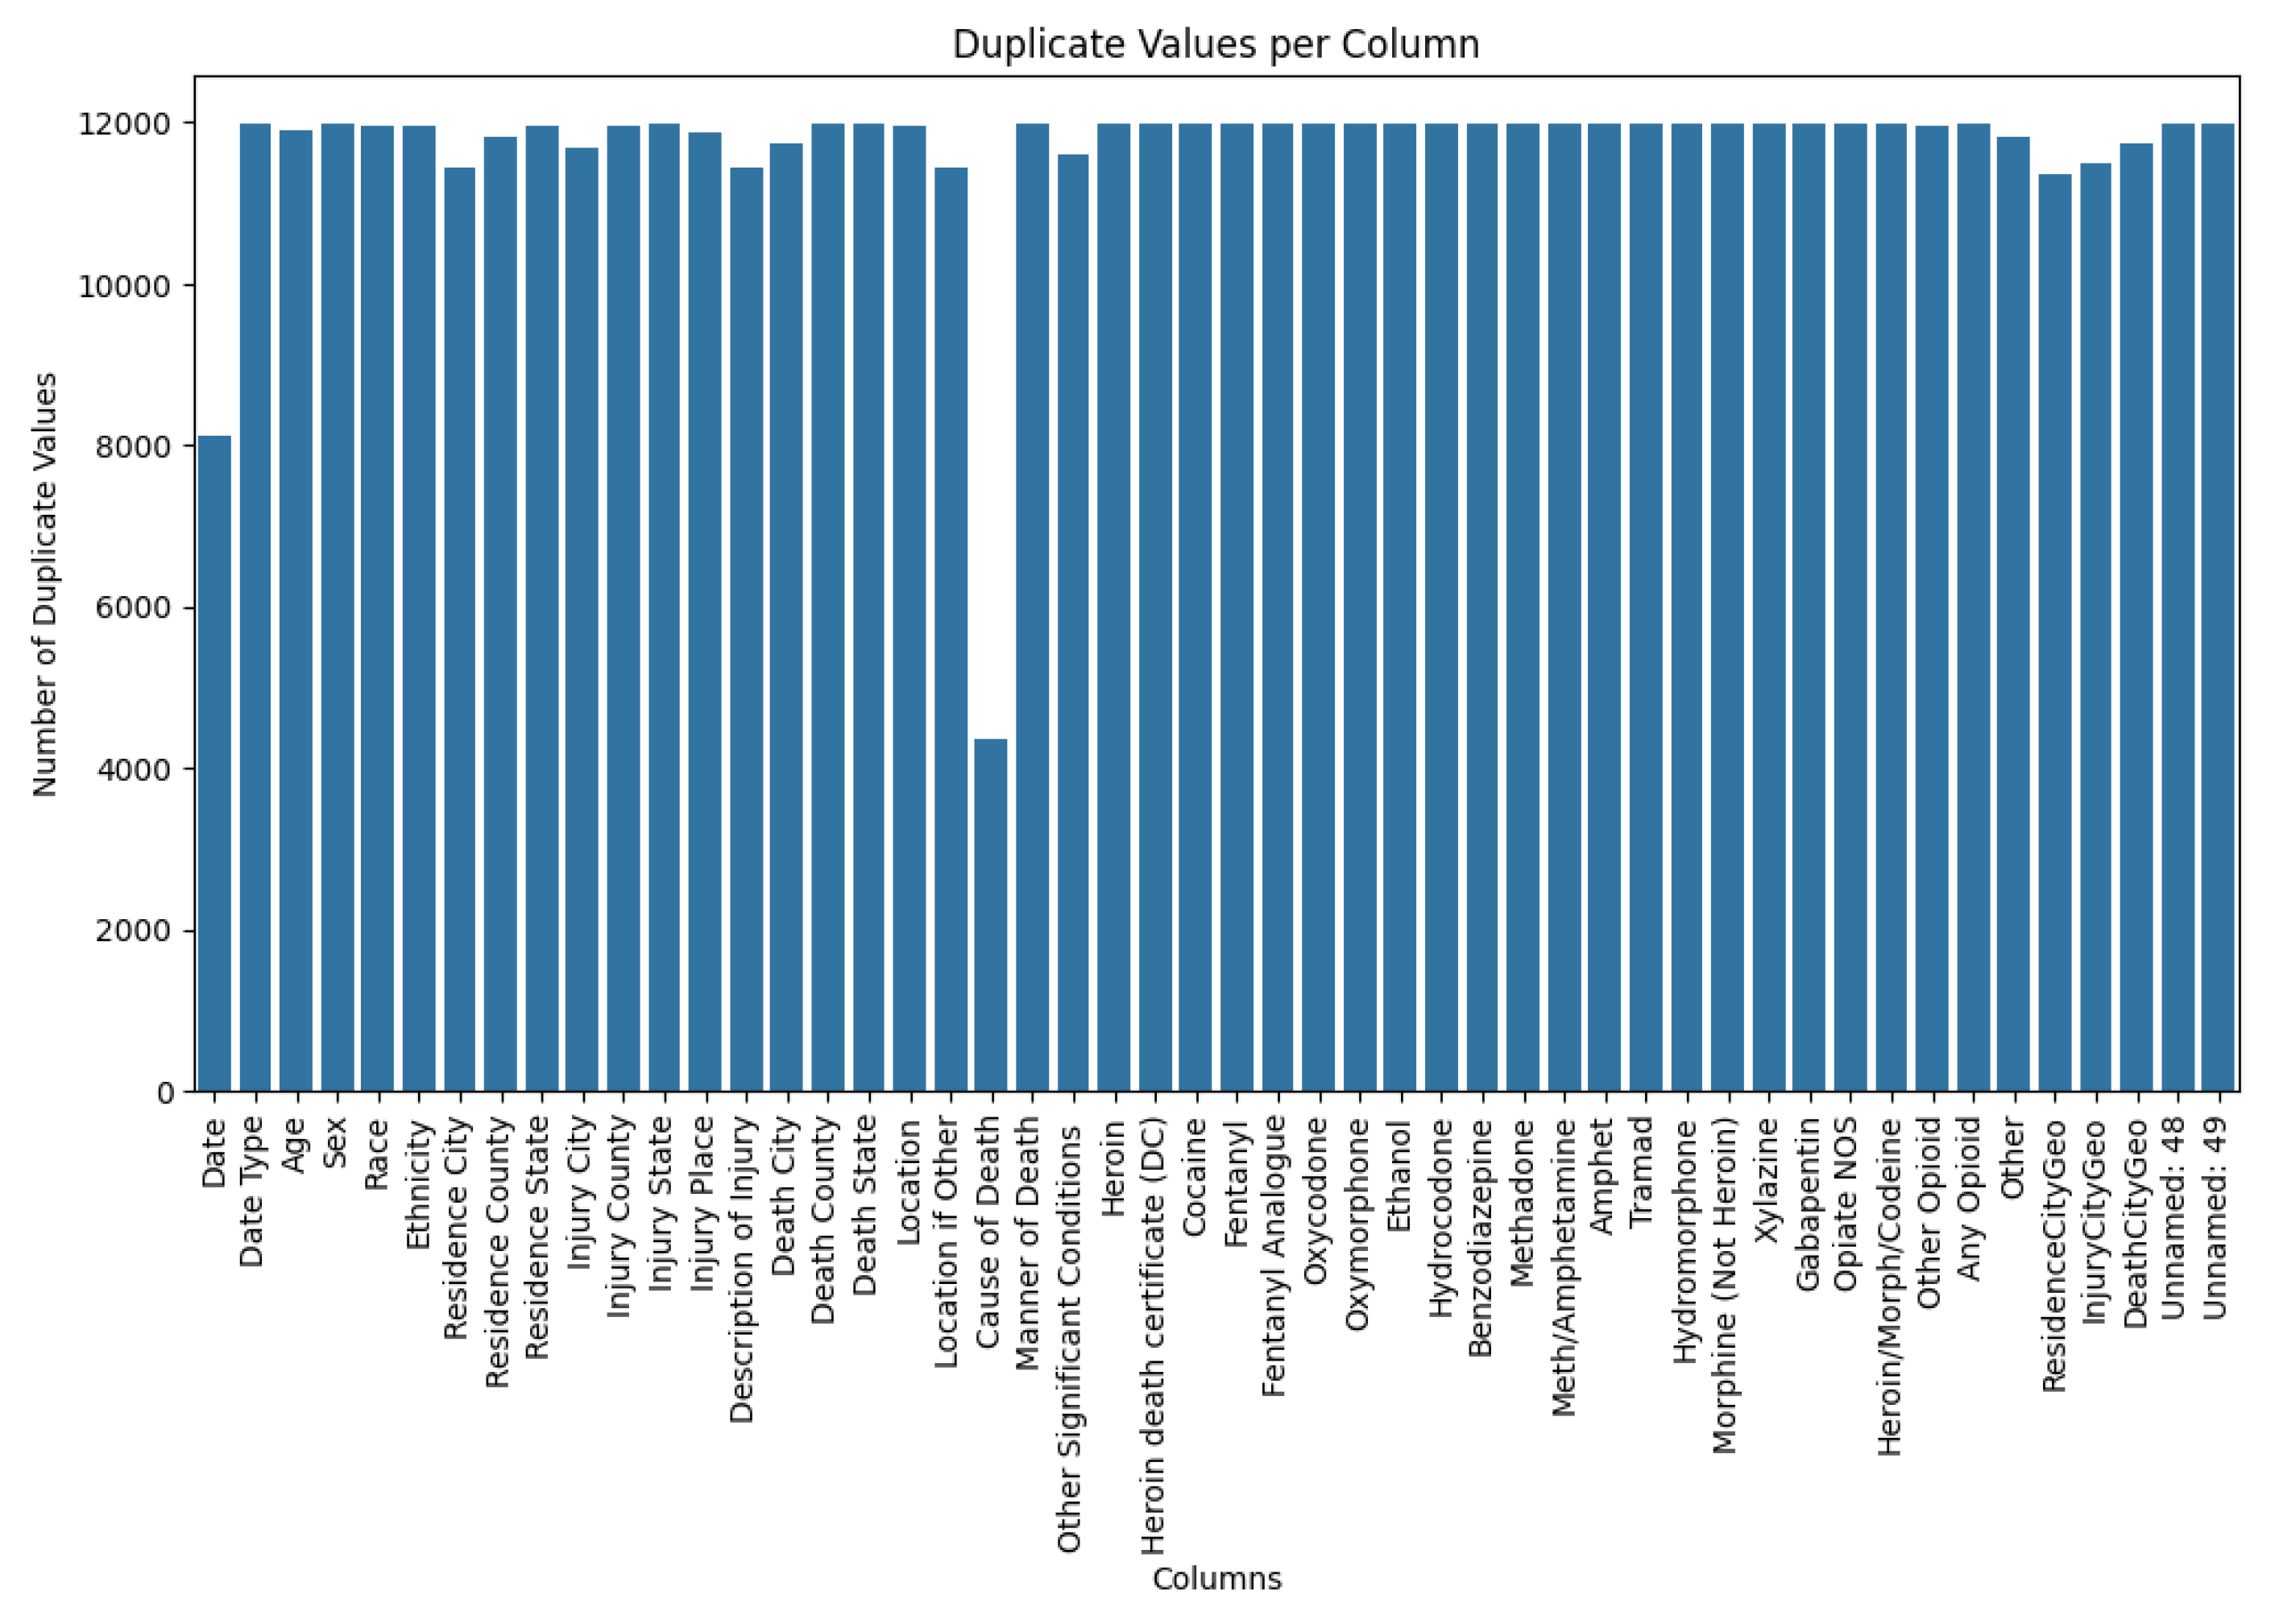
This plot demonstrates that many columns—such as Sex, Date, State, City, and Substances Used—have a high number of repeated values. This repetition is expected, as these categories often overlap across different cases.
Figure 5.
Age Distribution Before Preprocessing (Histogram).
This histogram shows the raw age distribution of the victims. The data displays a wide age range but lacks consistency due to uncleaned data.
Figure 6.
Overdose Deaths by Sex Before Preprocessing (Bar Chart).
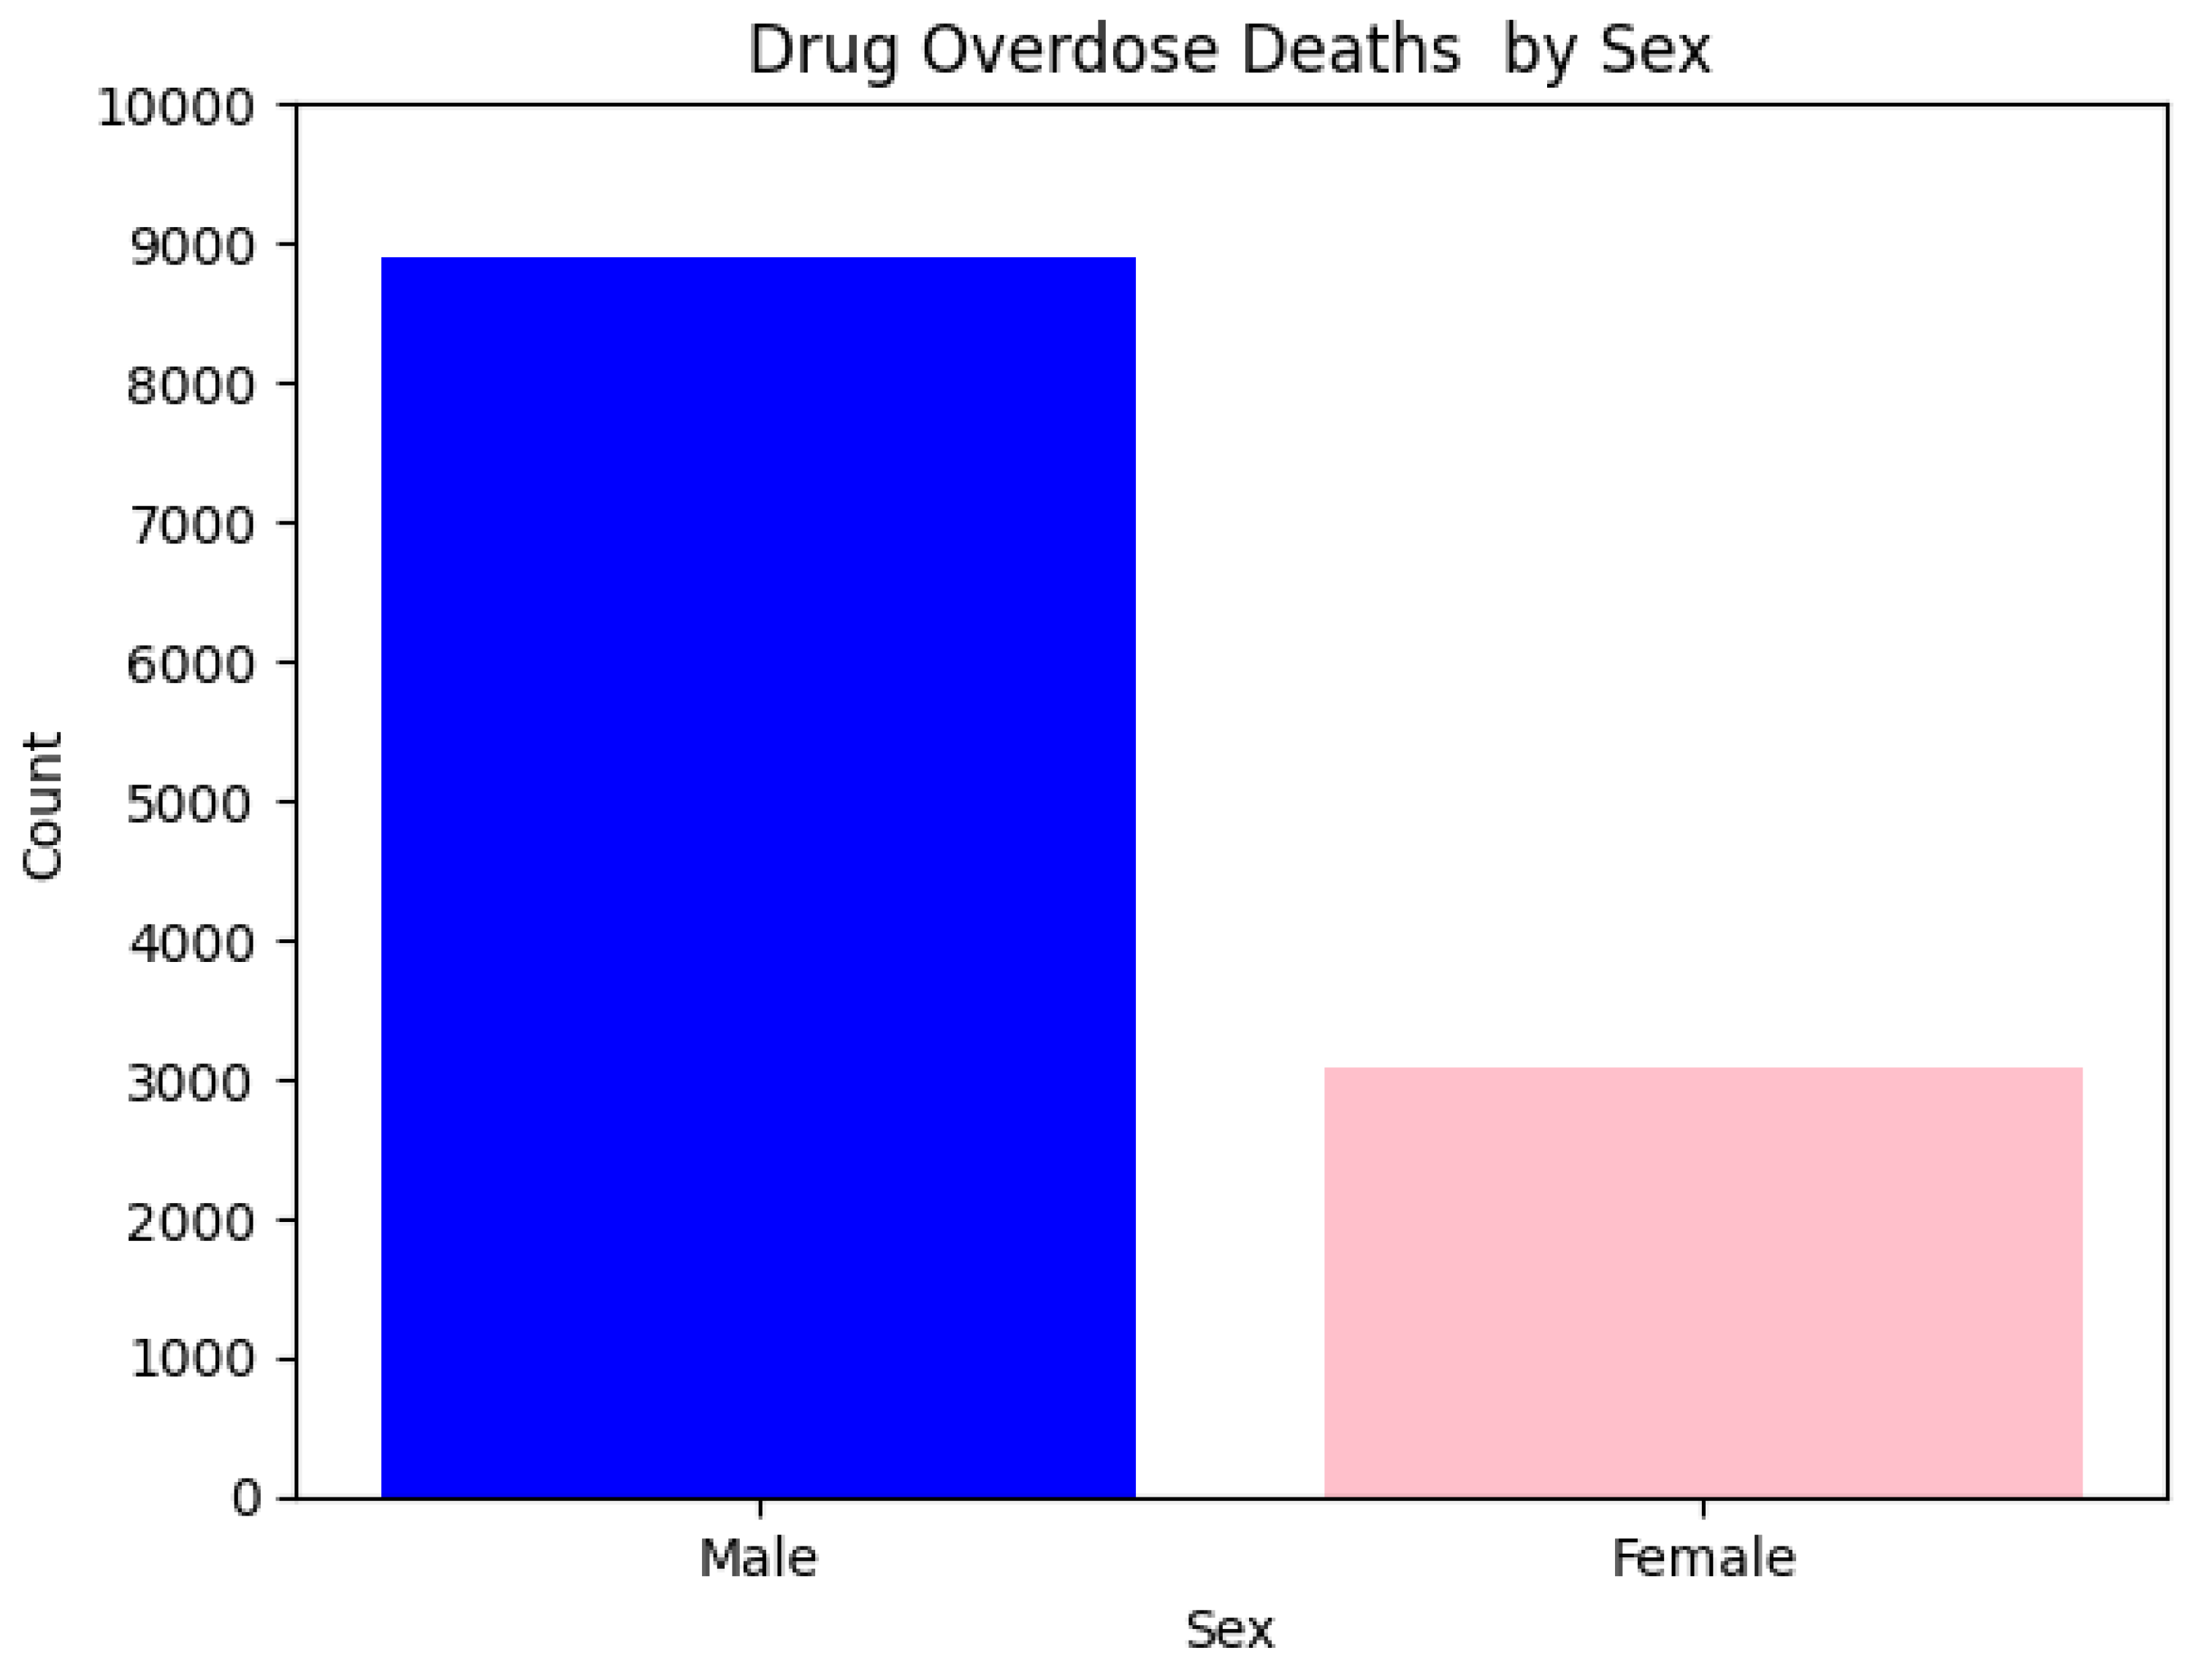
The chart reveals that males represent the majority of overdose deaths. This trend remains consistent even after the preprocessing phase.
Figure 7.
Most Frequently Used Substances in Overdose Cases (Bar Chart).
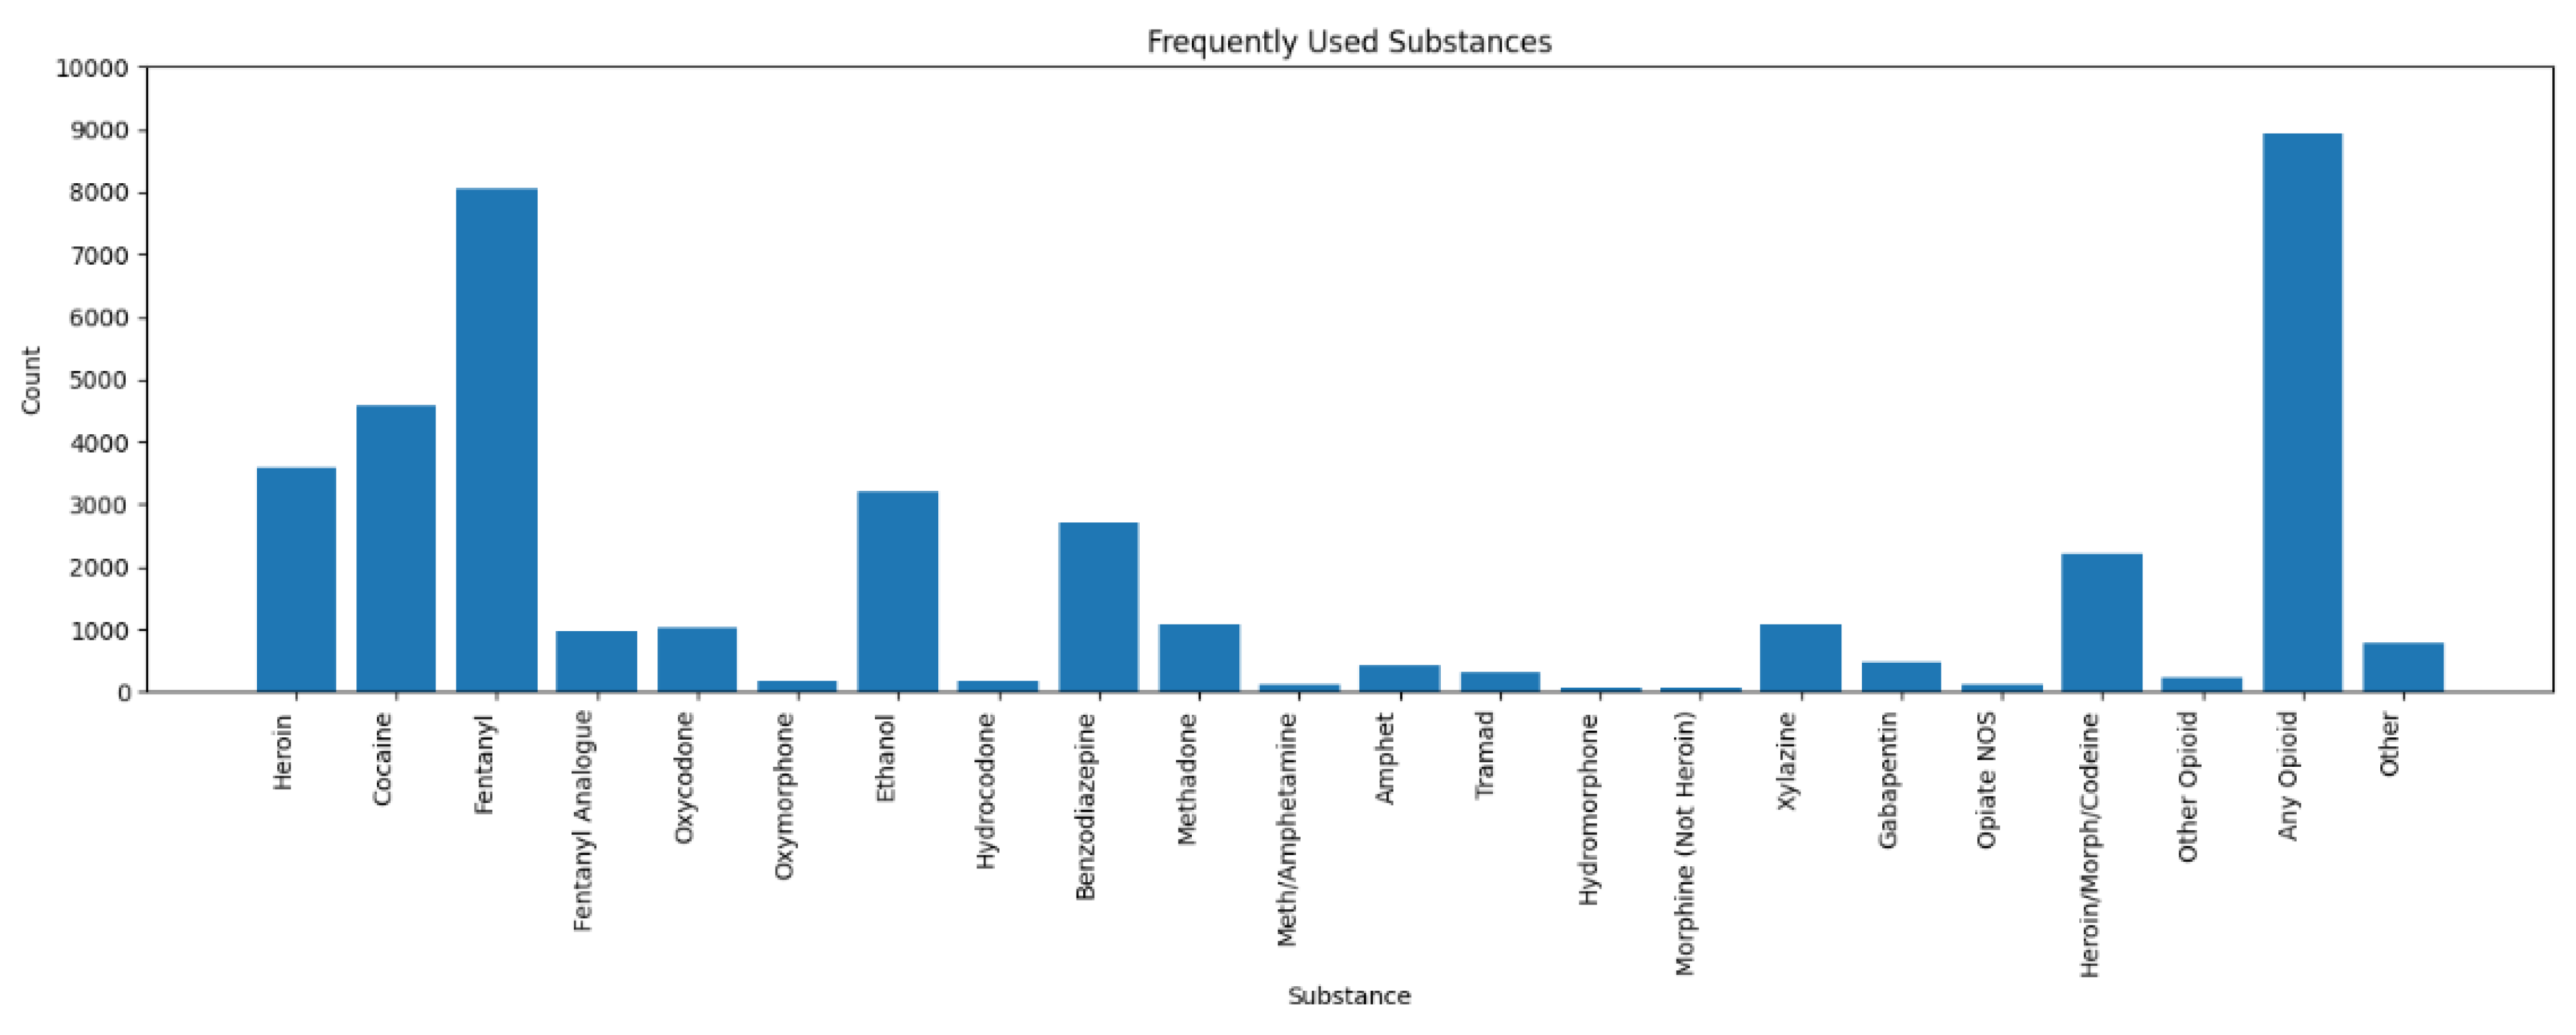
This graphical display shows that Fentanyl and Any Opioid predominated in the number of overdose cases, followed by Cocaine and Heroin. A few substances were also detected but rather infrequently. The Heroin Death Certificate column was omitted from the analysis, as it does not identify anything that could be considered a substance.
Figure 8.
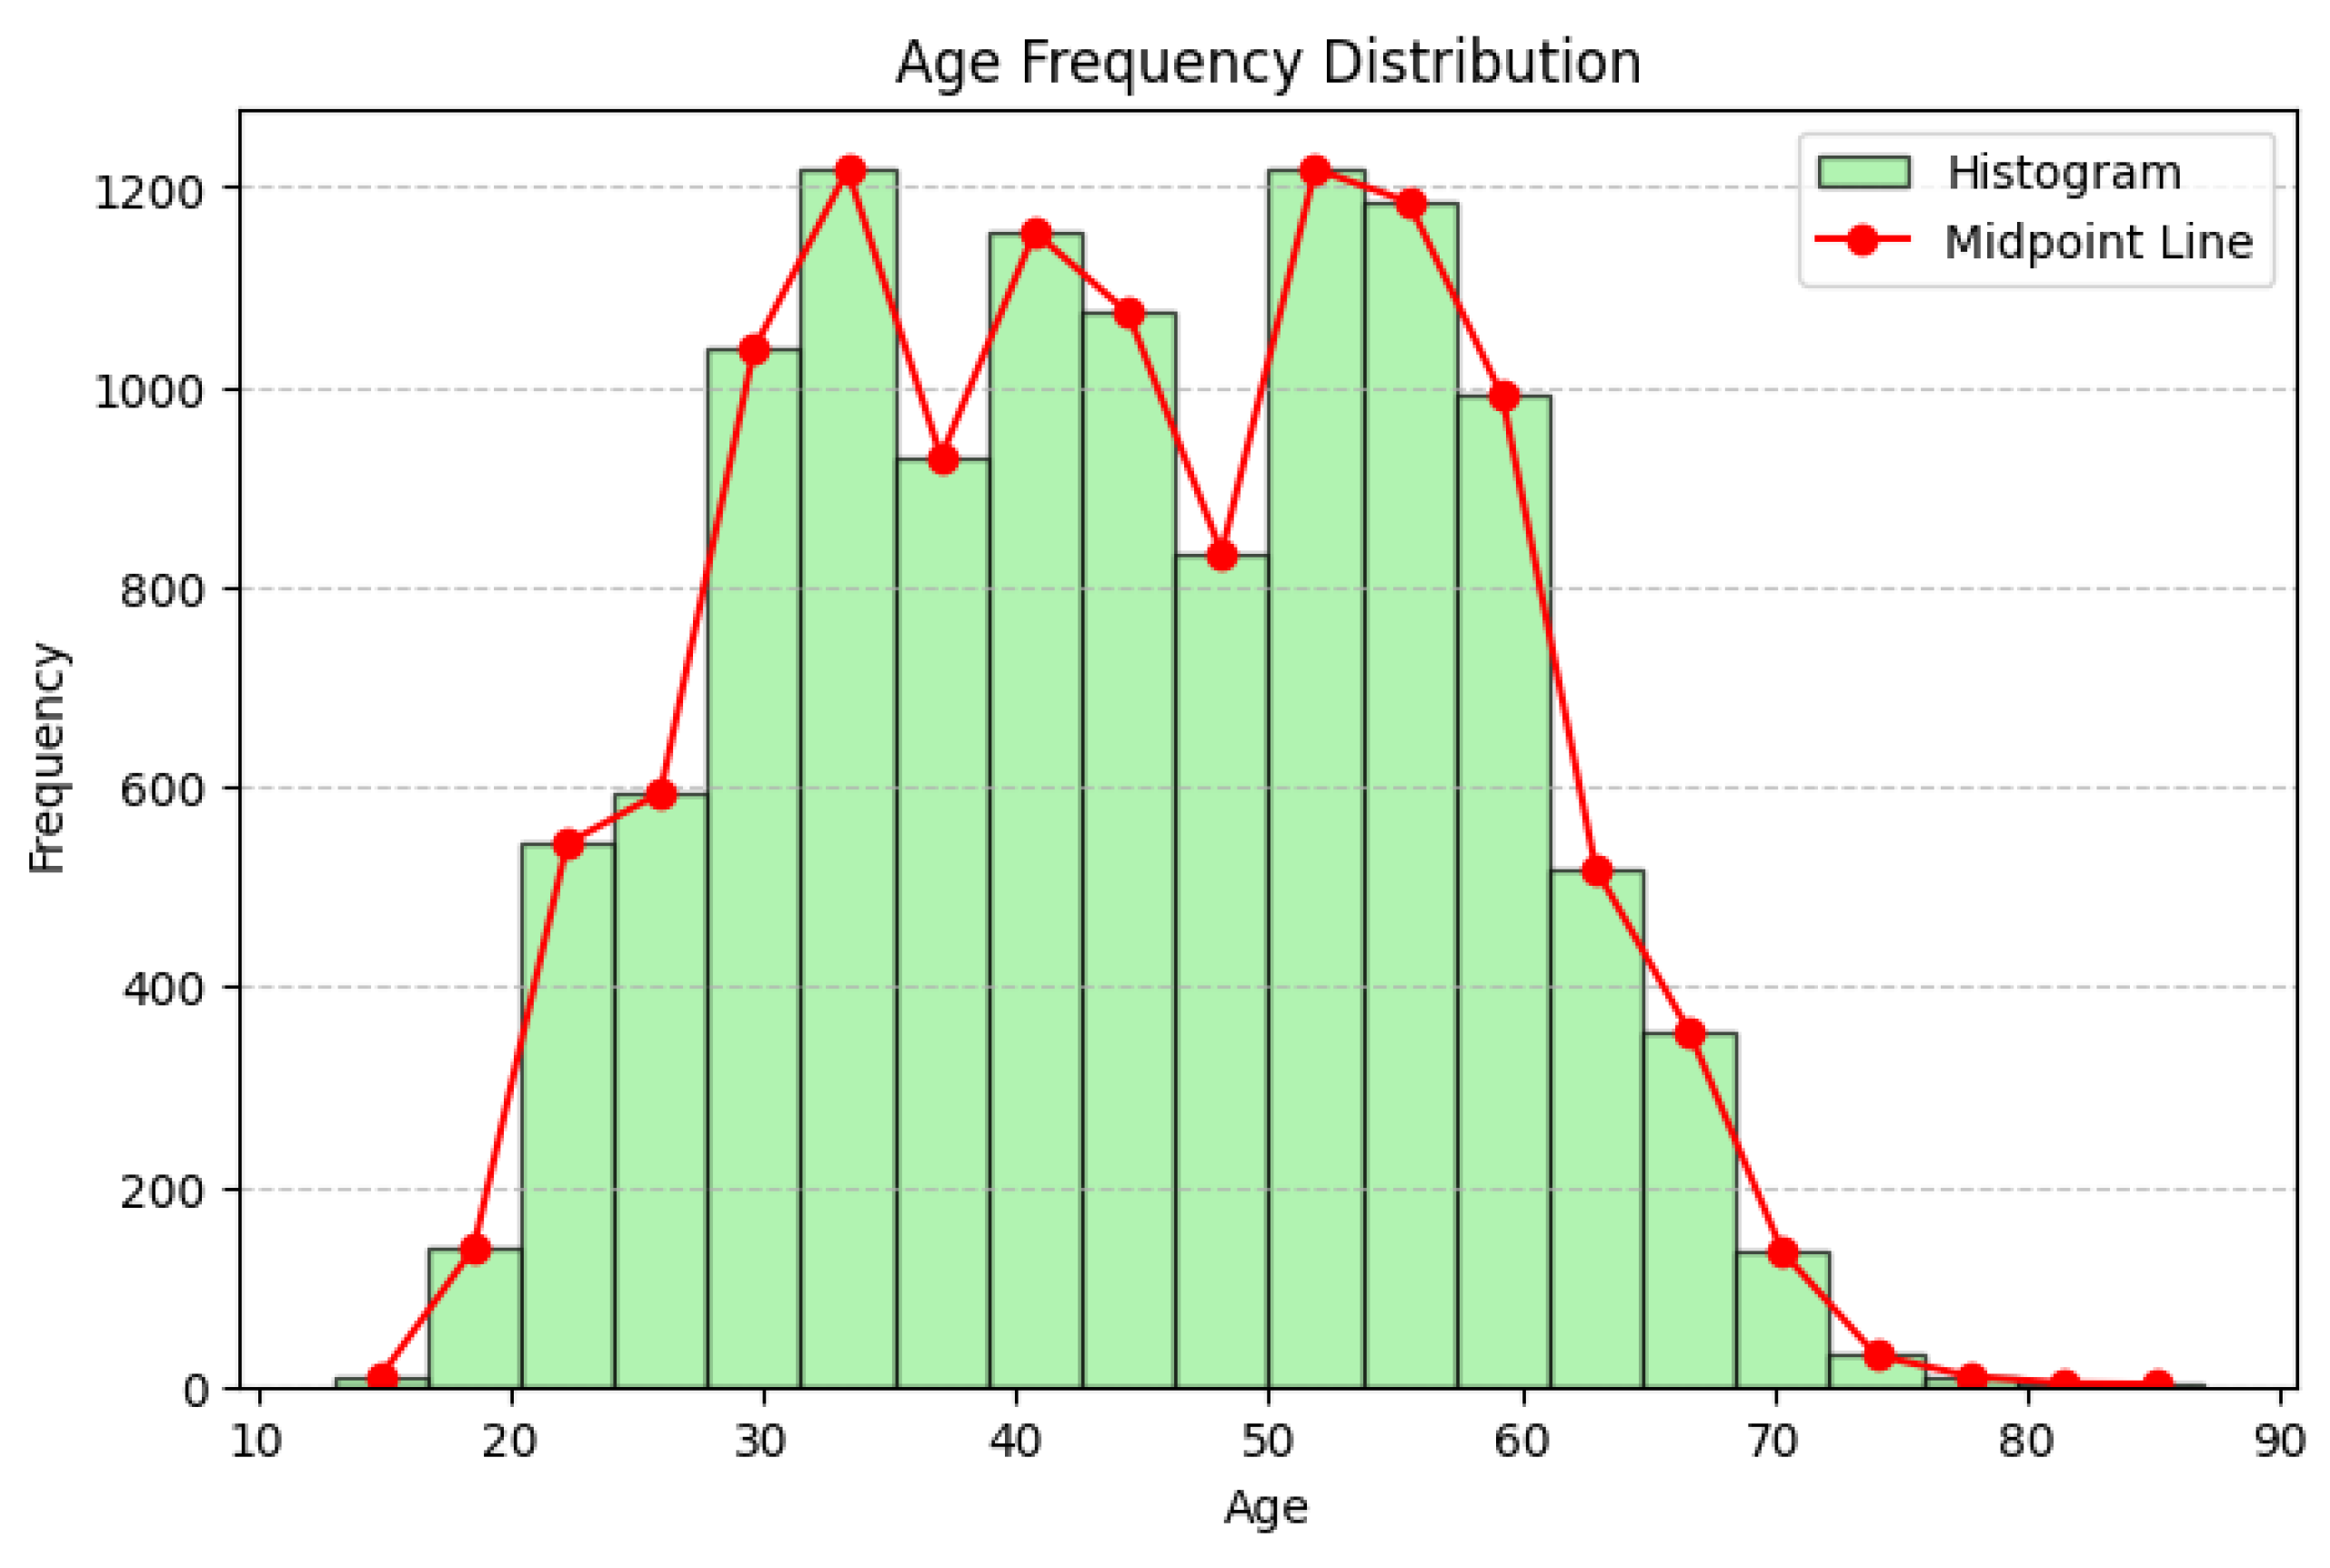
Age Distribution After Preprocessing (Histogram).
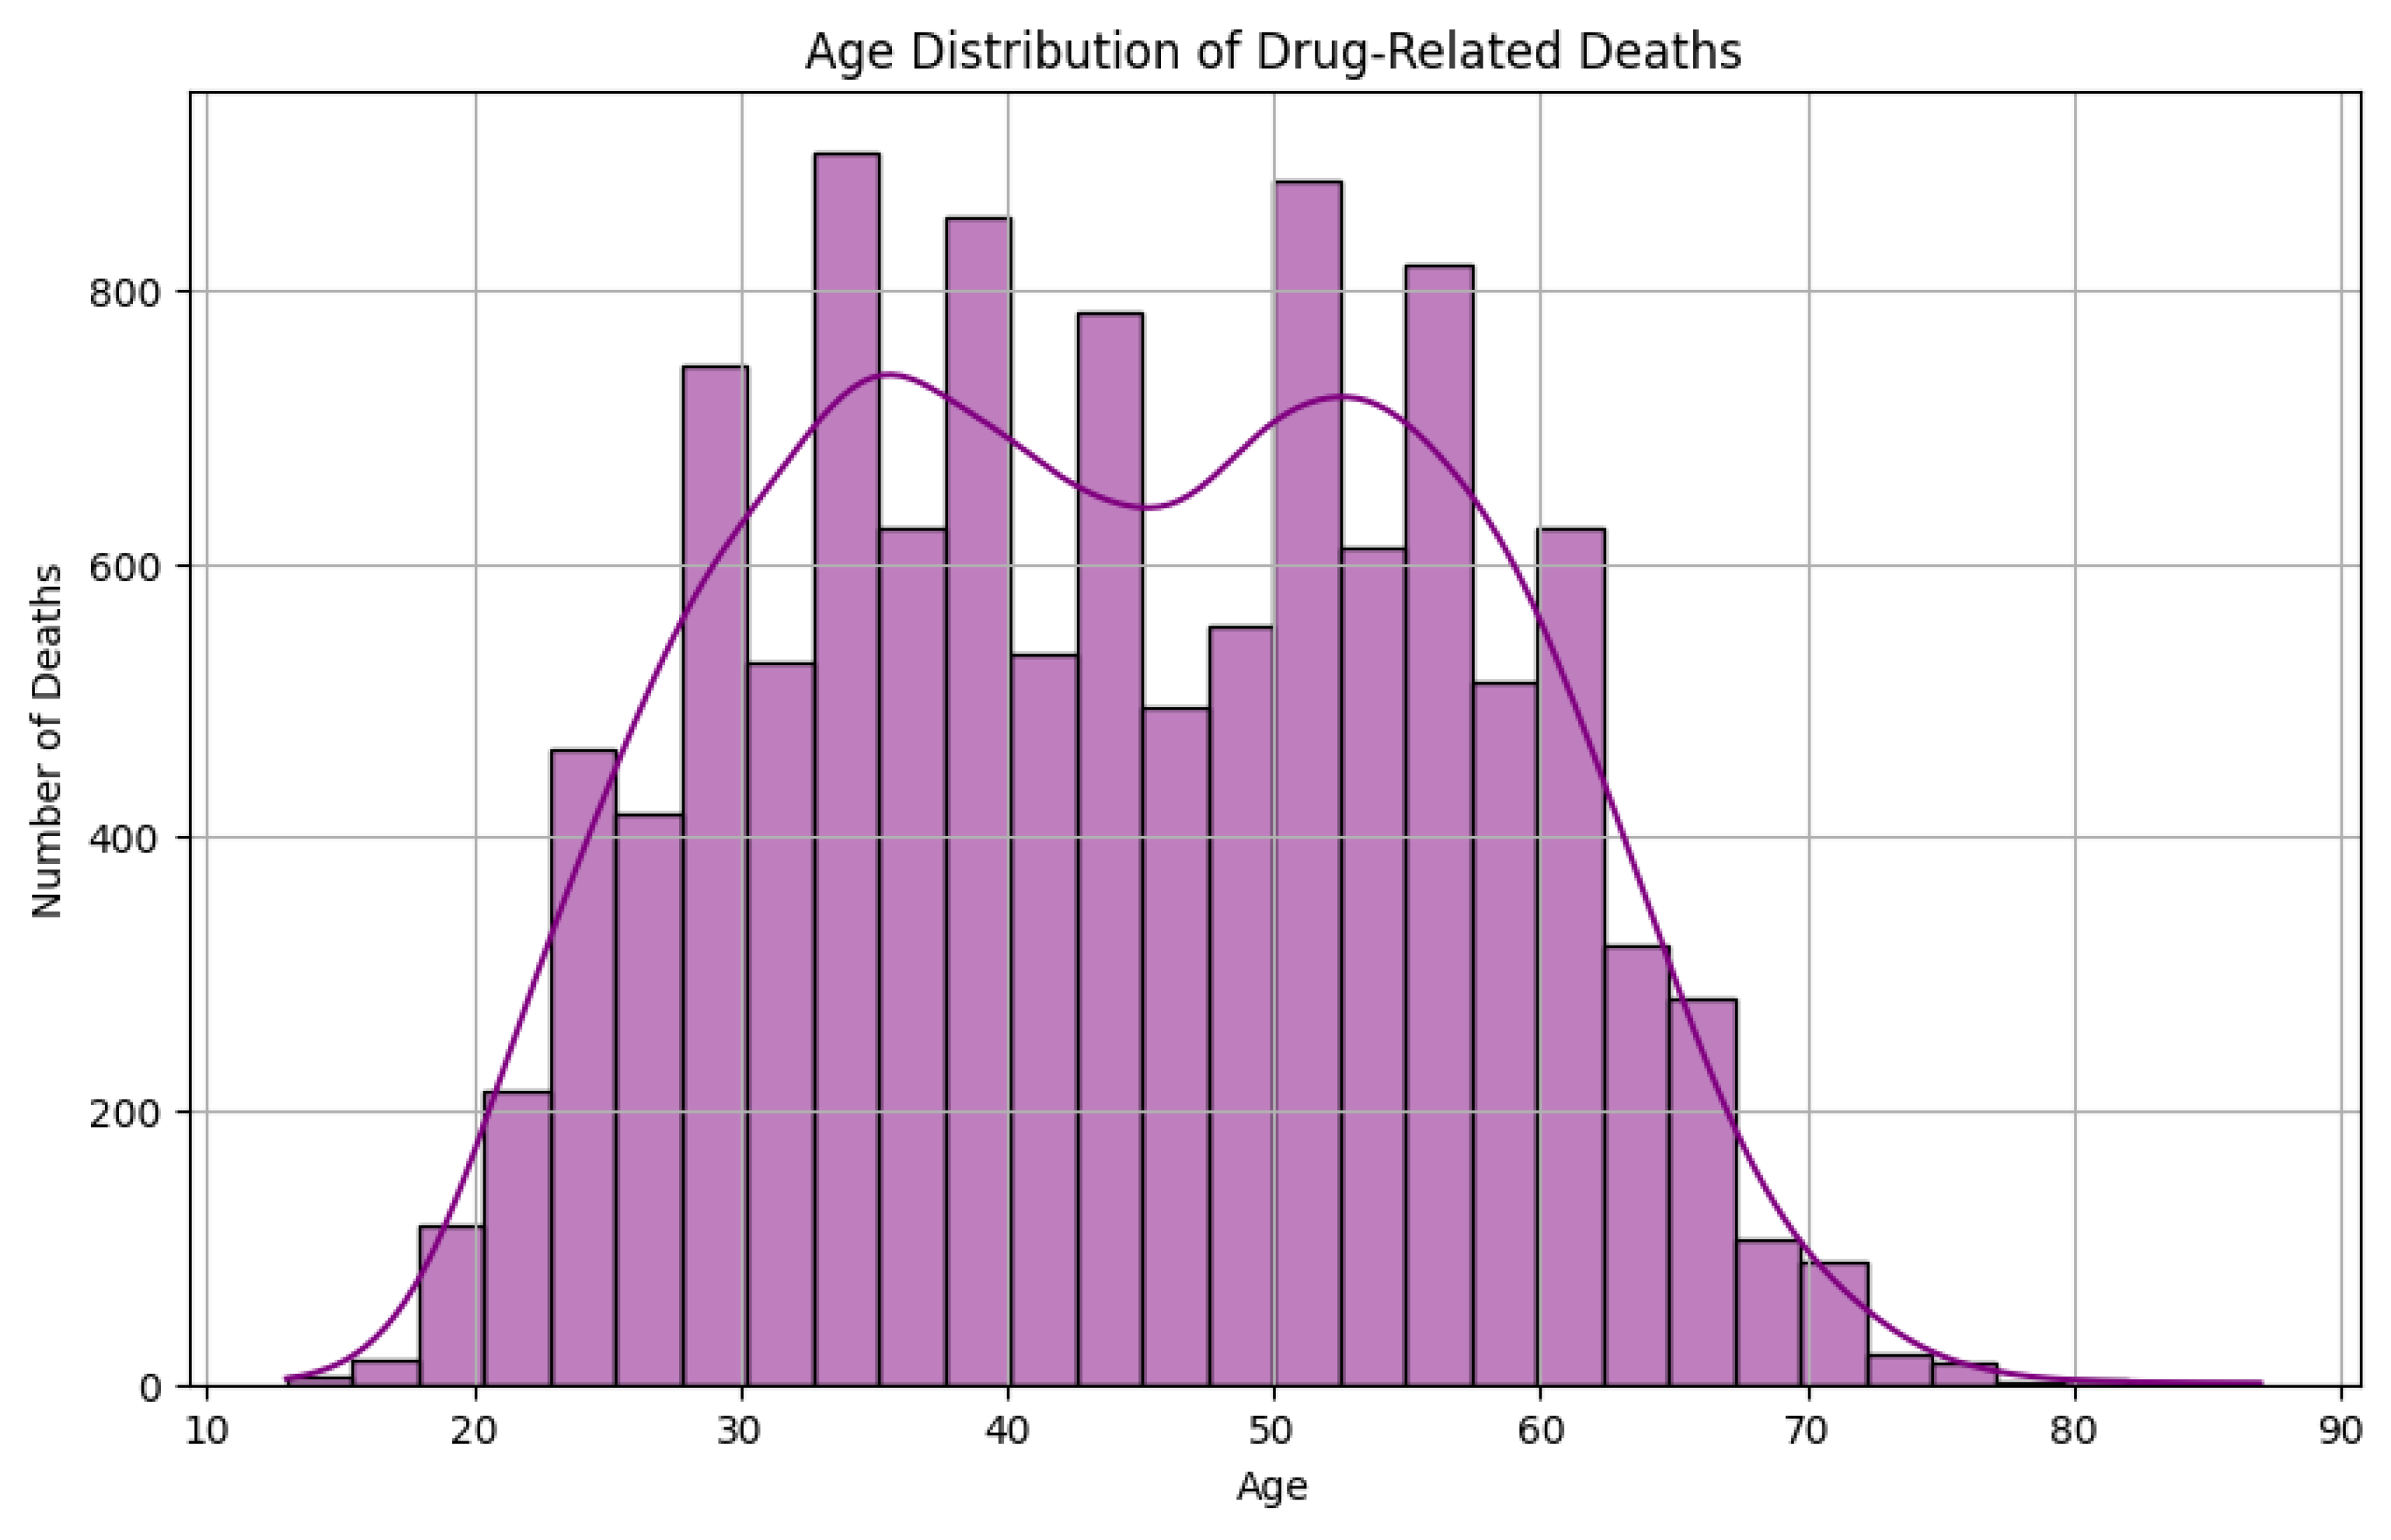
After cleaning, the age distribution shows a strong accumulation of overdose cases among the 20-50 year age range. The younger and older age distributions are smaller, which indicates that the middle-aged group is the most affected population.
Figure 9.
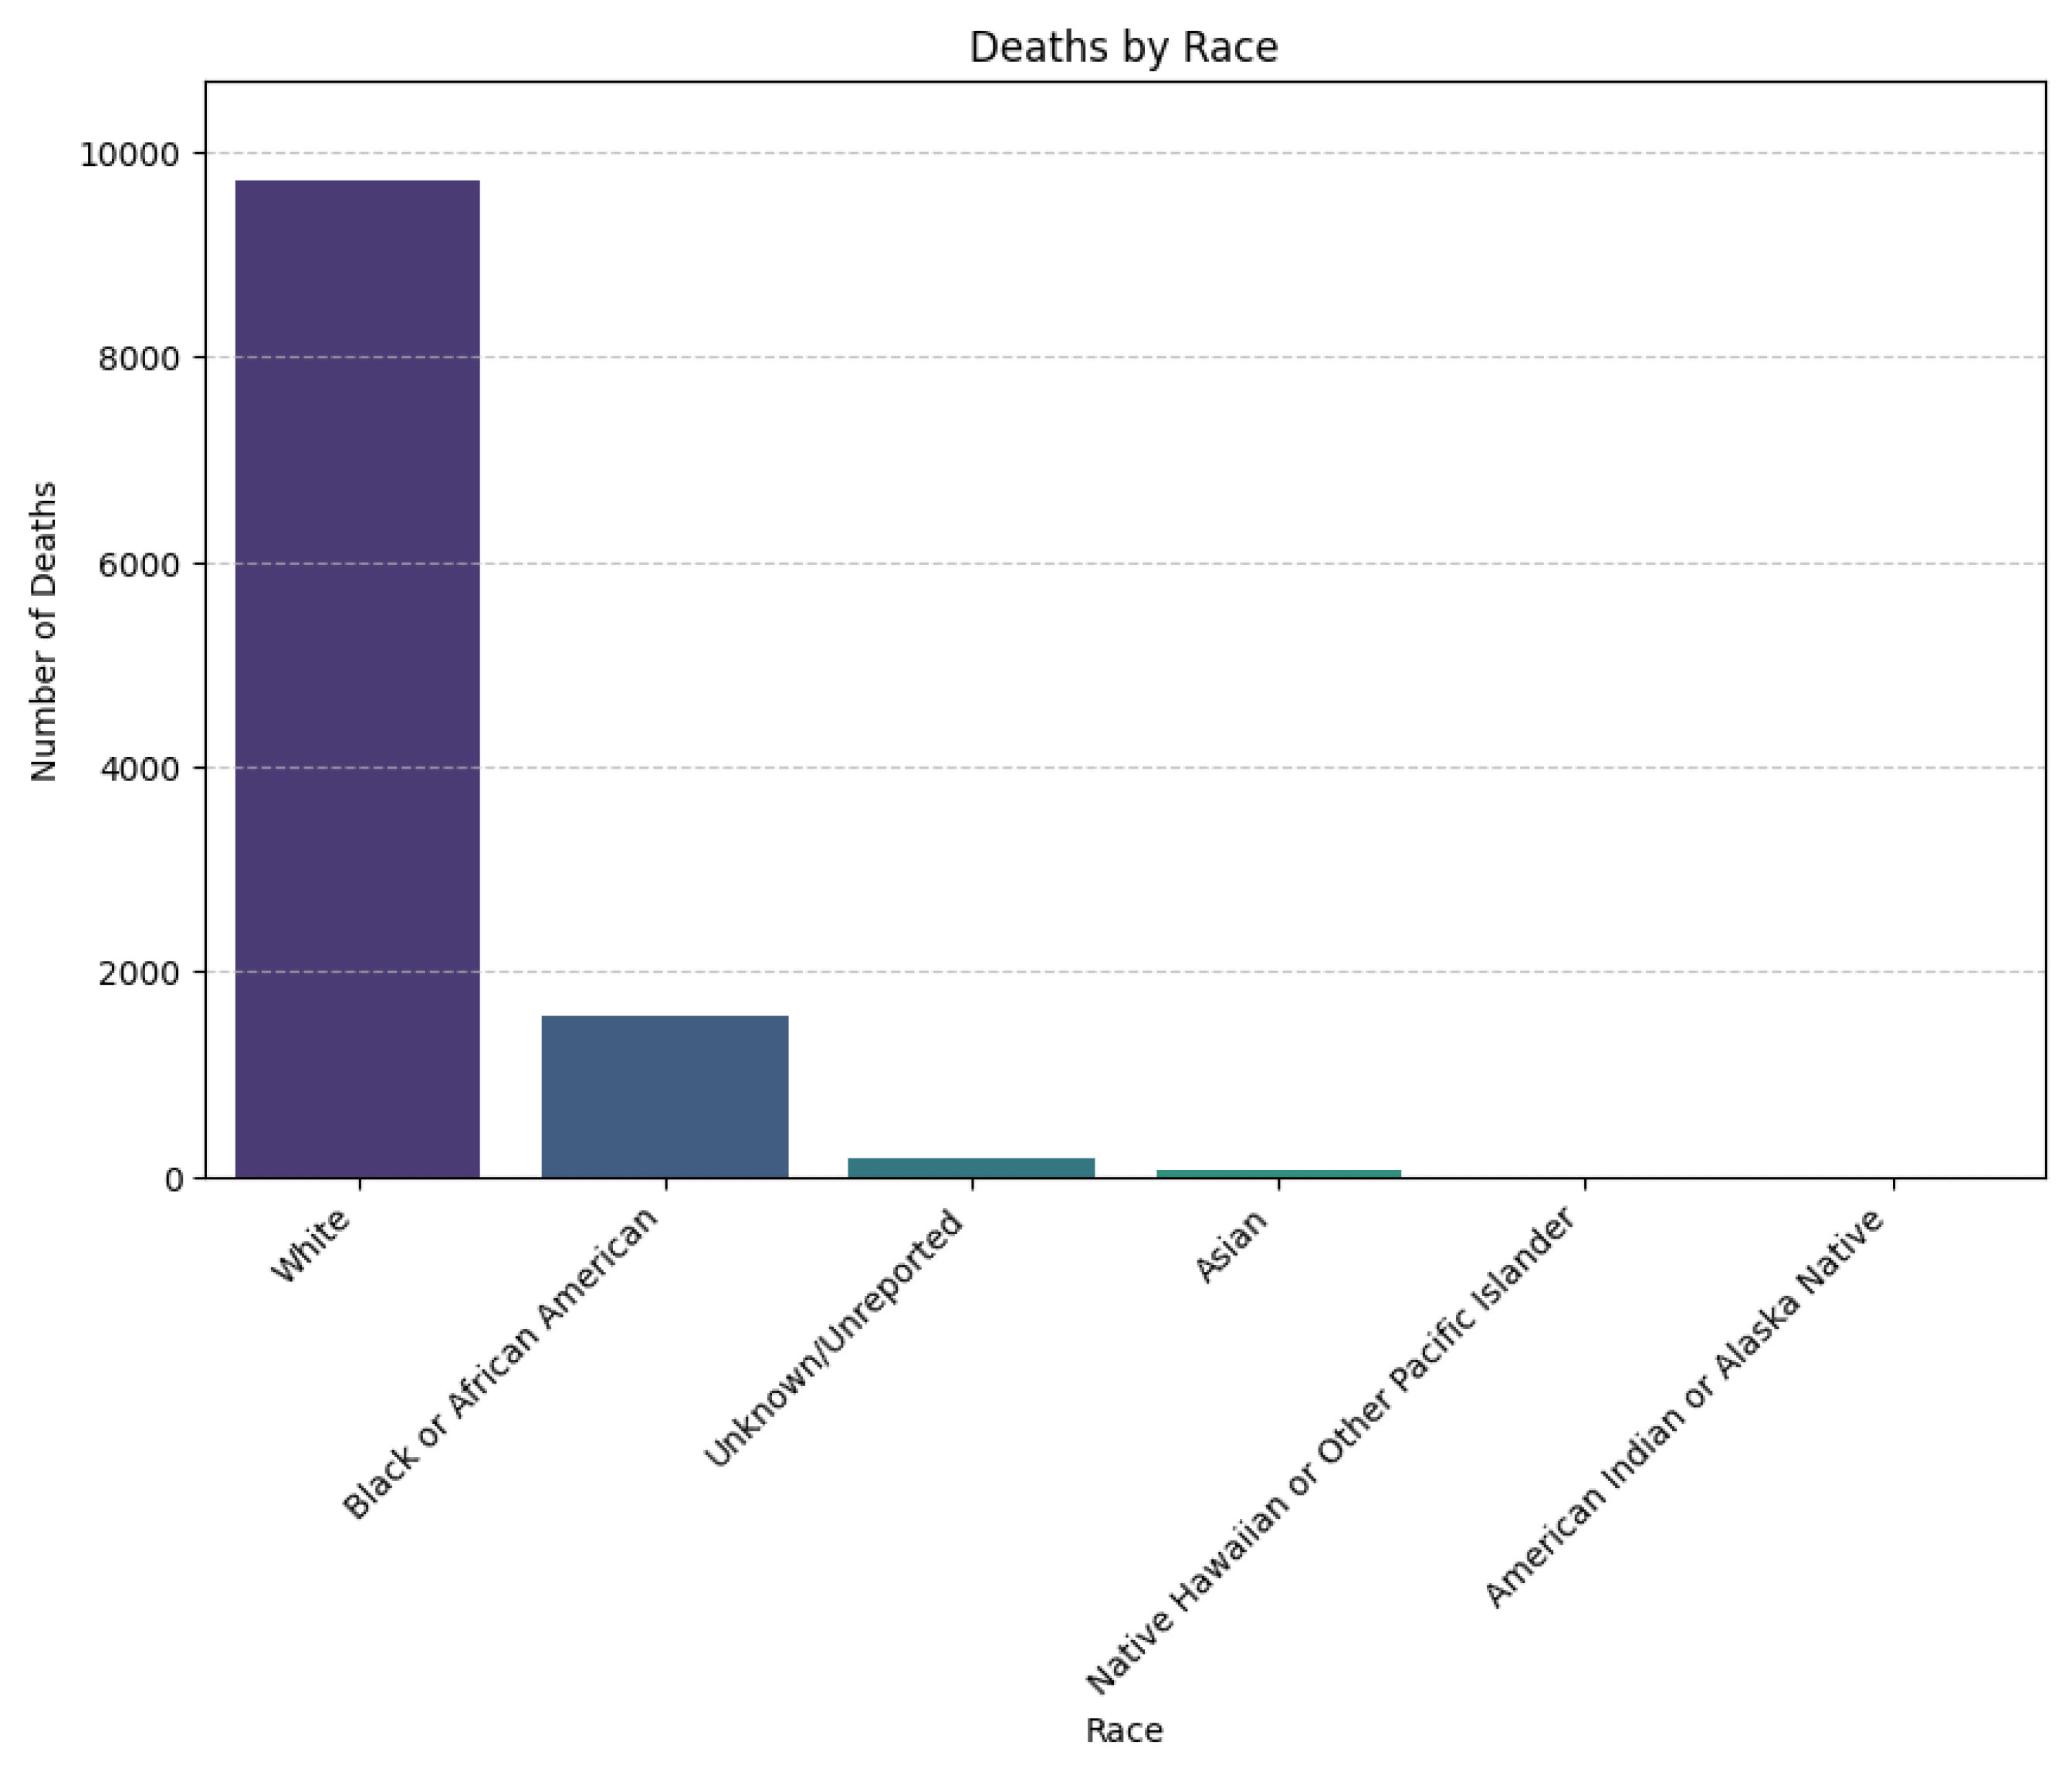
Deaths by Race (Bar Chart).
This chart, generated after preprocessing, shows that White individuals make up the largest proportion of overdose deaths, followed by Black or African Americans, then Unknown, and other racial groups such as Asians.
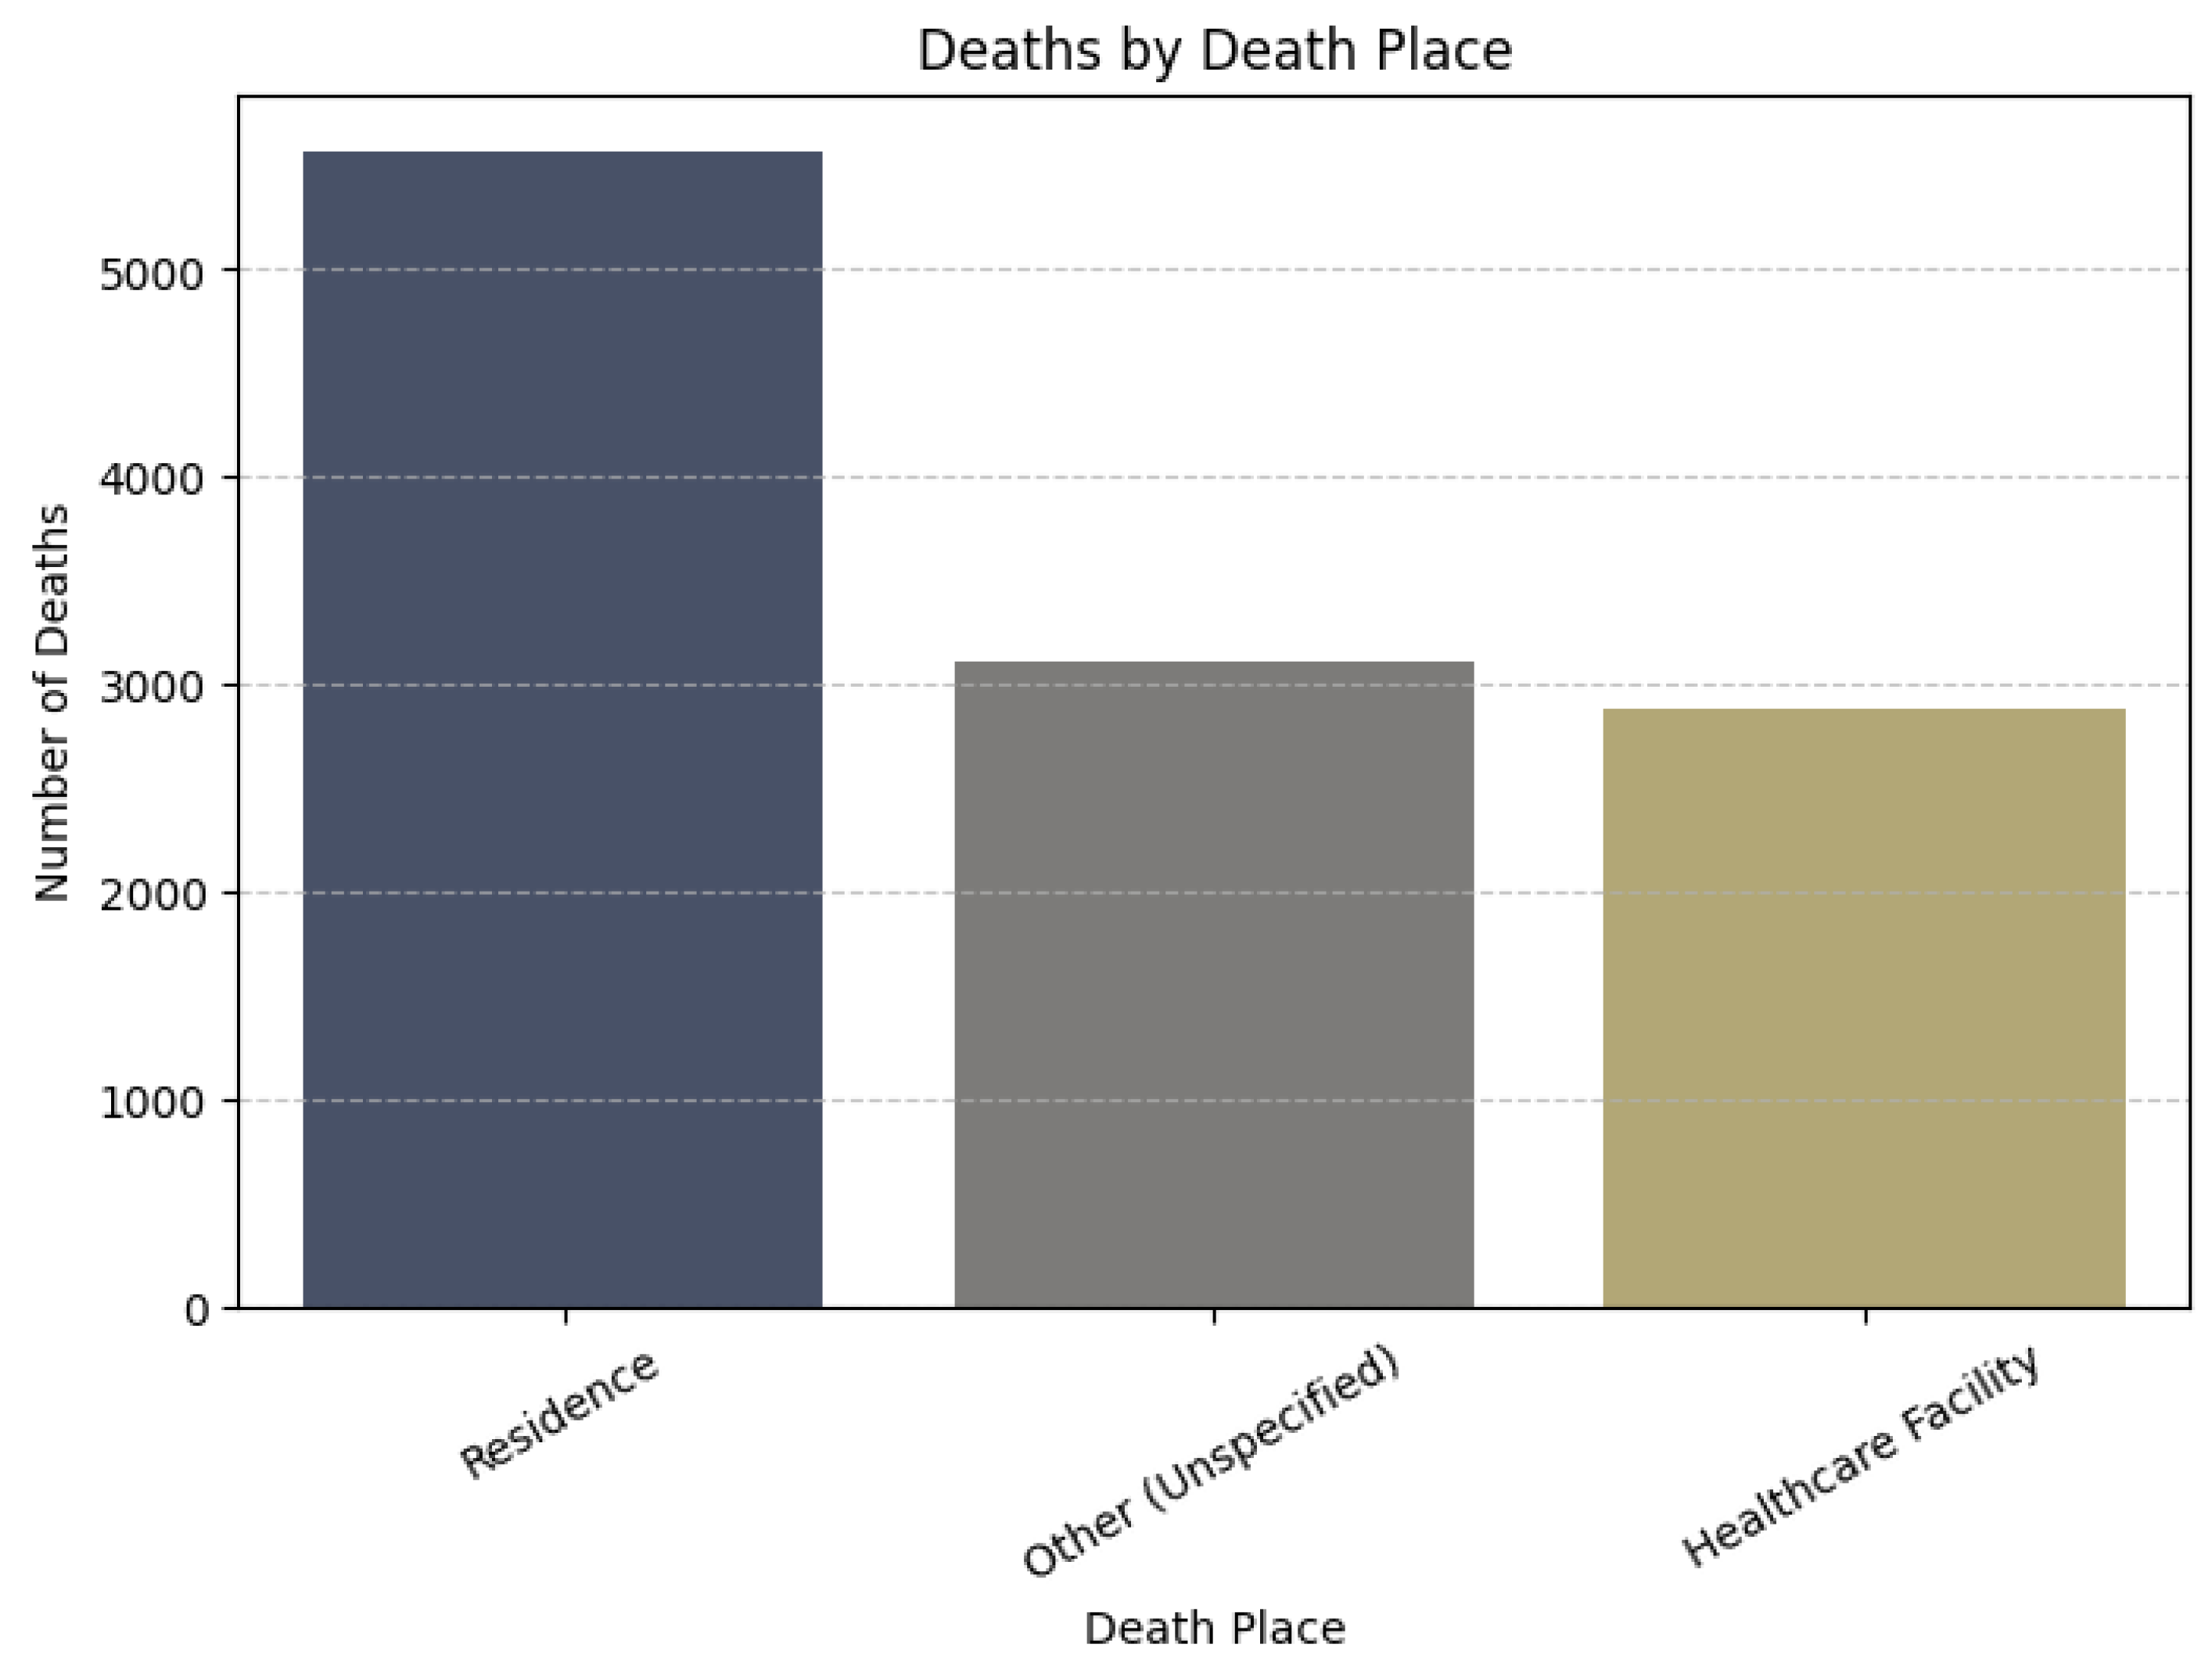
Figure 10.
Deaths by Location (Bar Chart).
The majority of overdose deaths occurred in private residences. This is followed by unspecified or miscellaneous locations, highlighting the need for targeted interventions in home settings.
Figure 11.
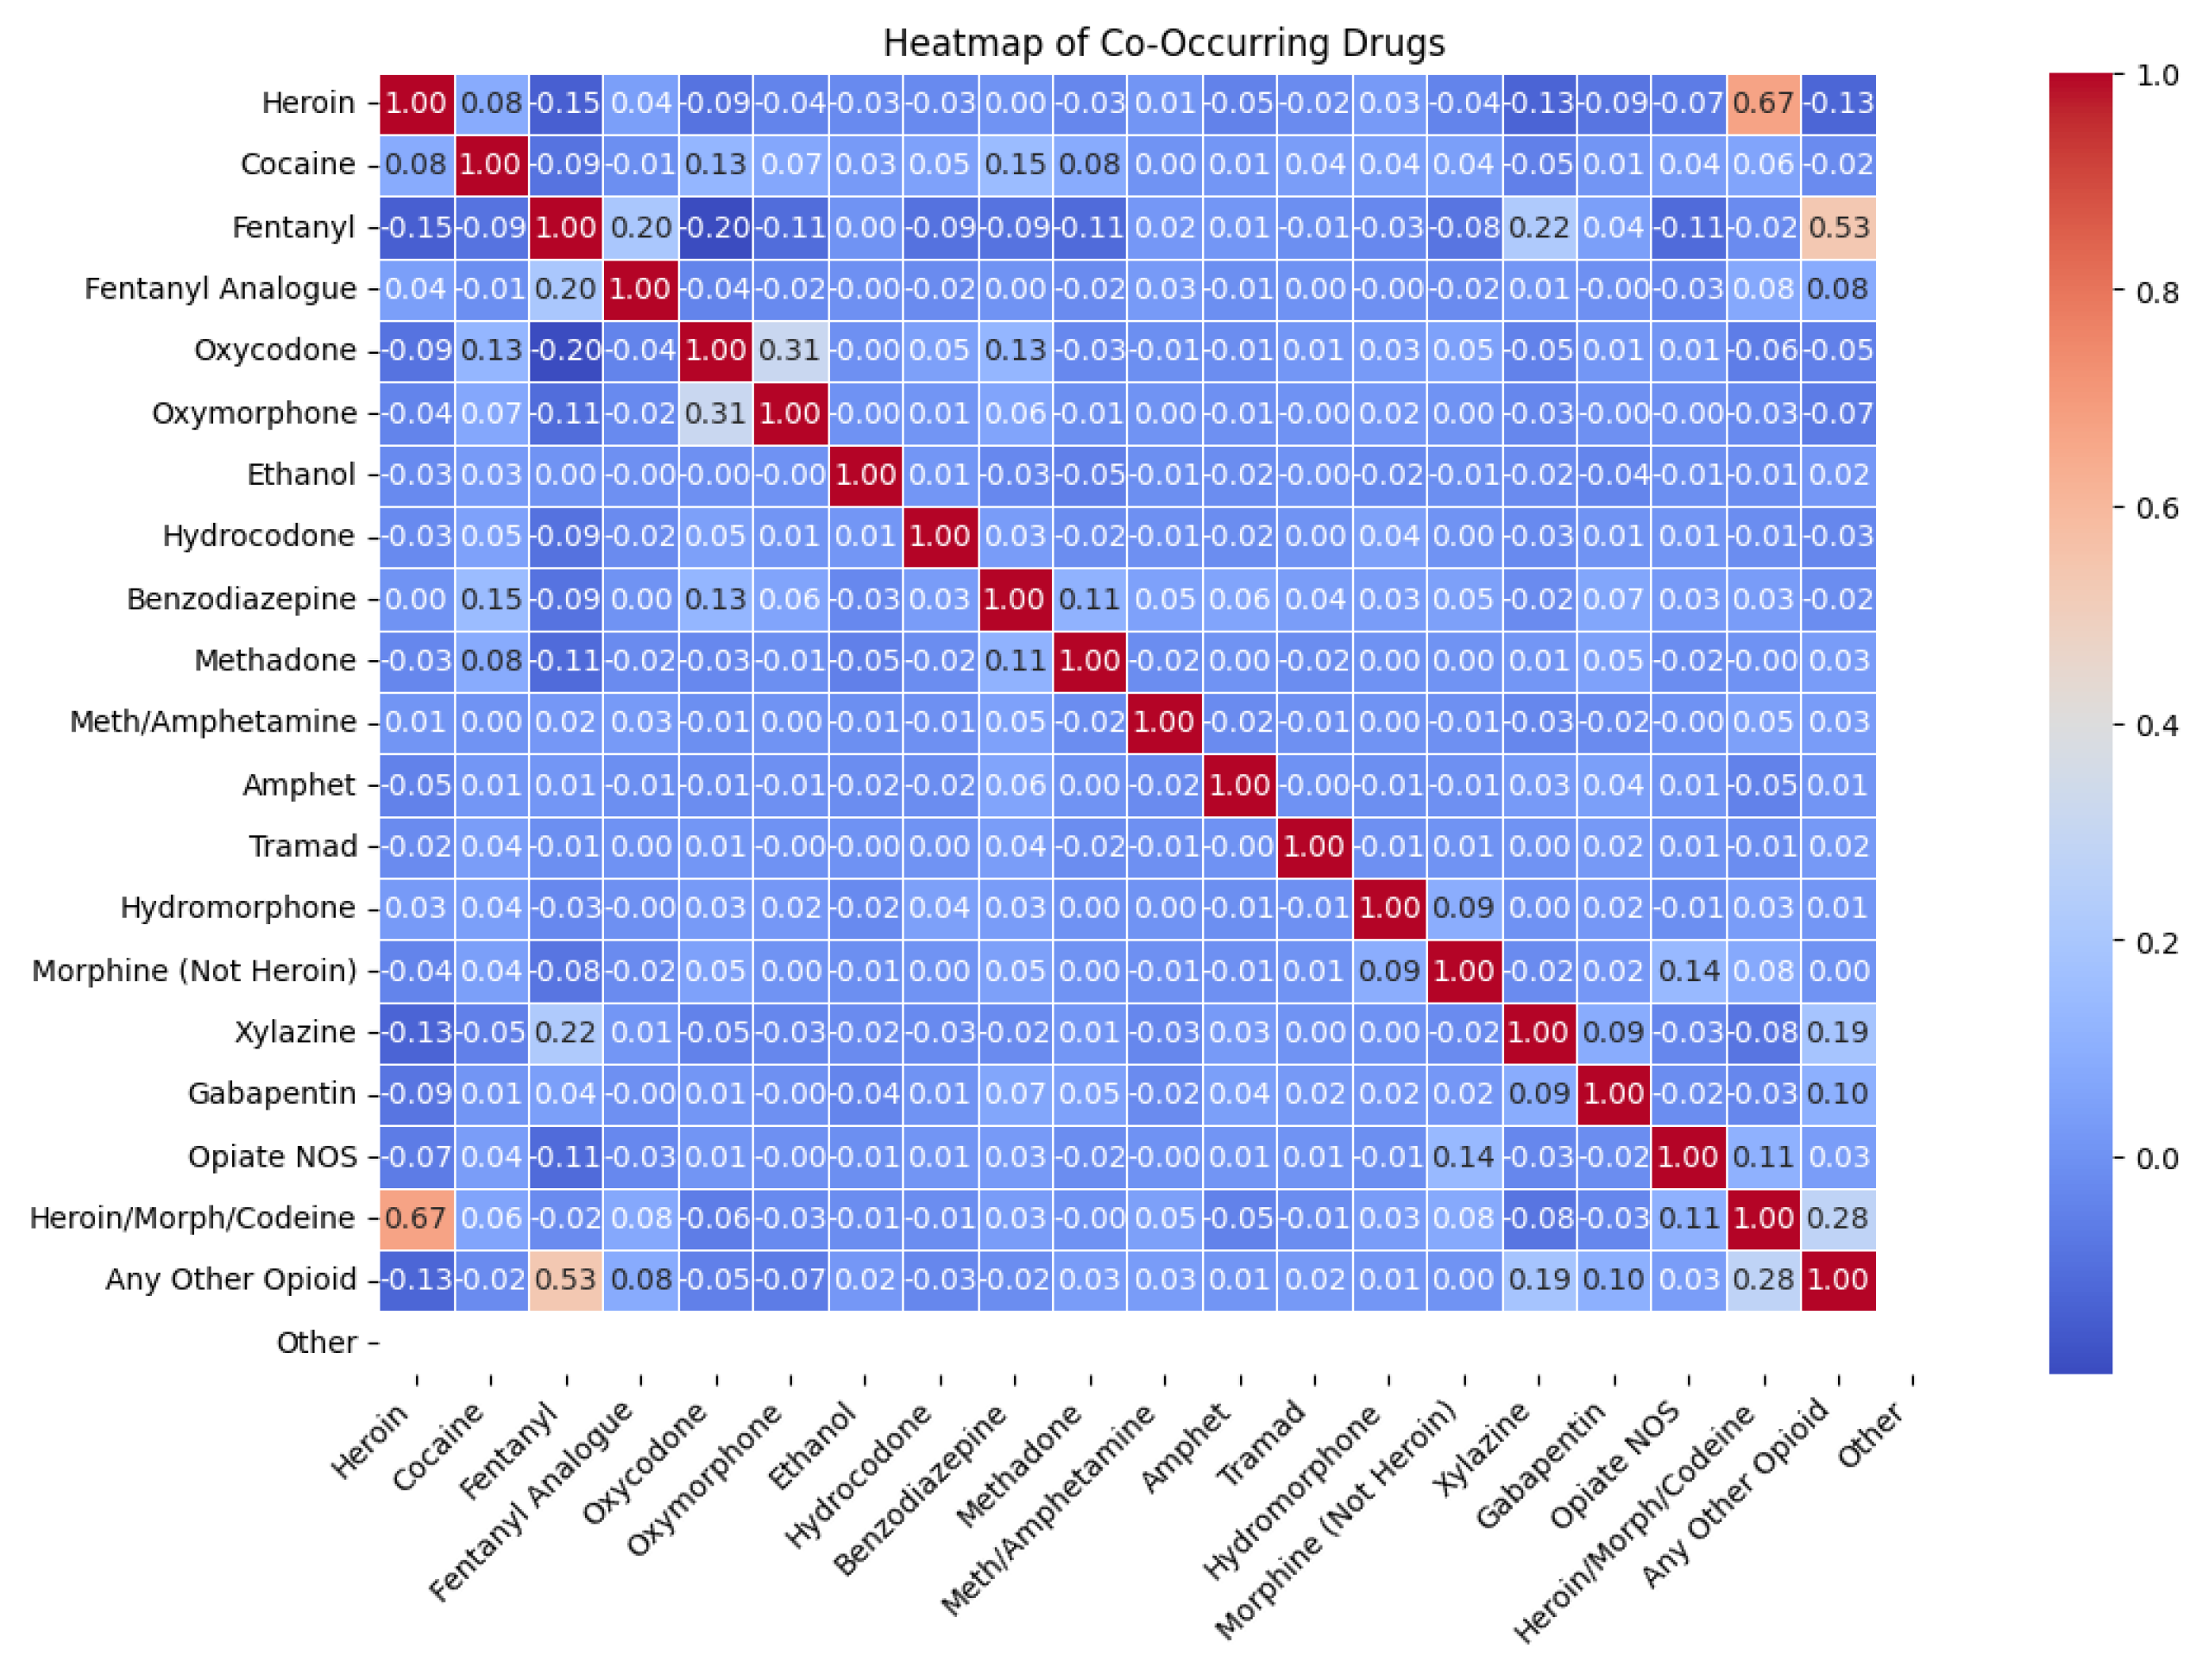
Co-occurrence Heatmap of Substances.
This heatmap shows the relationships between substances used in overdose deaths. A value of 1 indicates a perfect positive correlation (exactly the same substance) and a value of 0 indicates that there is no correlation. This visualization helps illustrate the often noted co-occurrence of multiple substances in fatal overdoses.
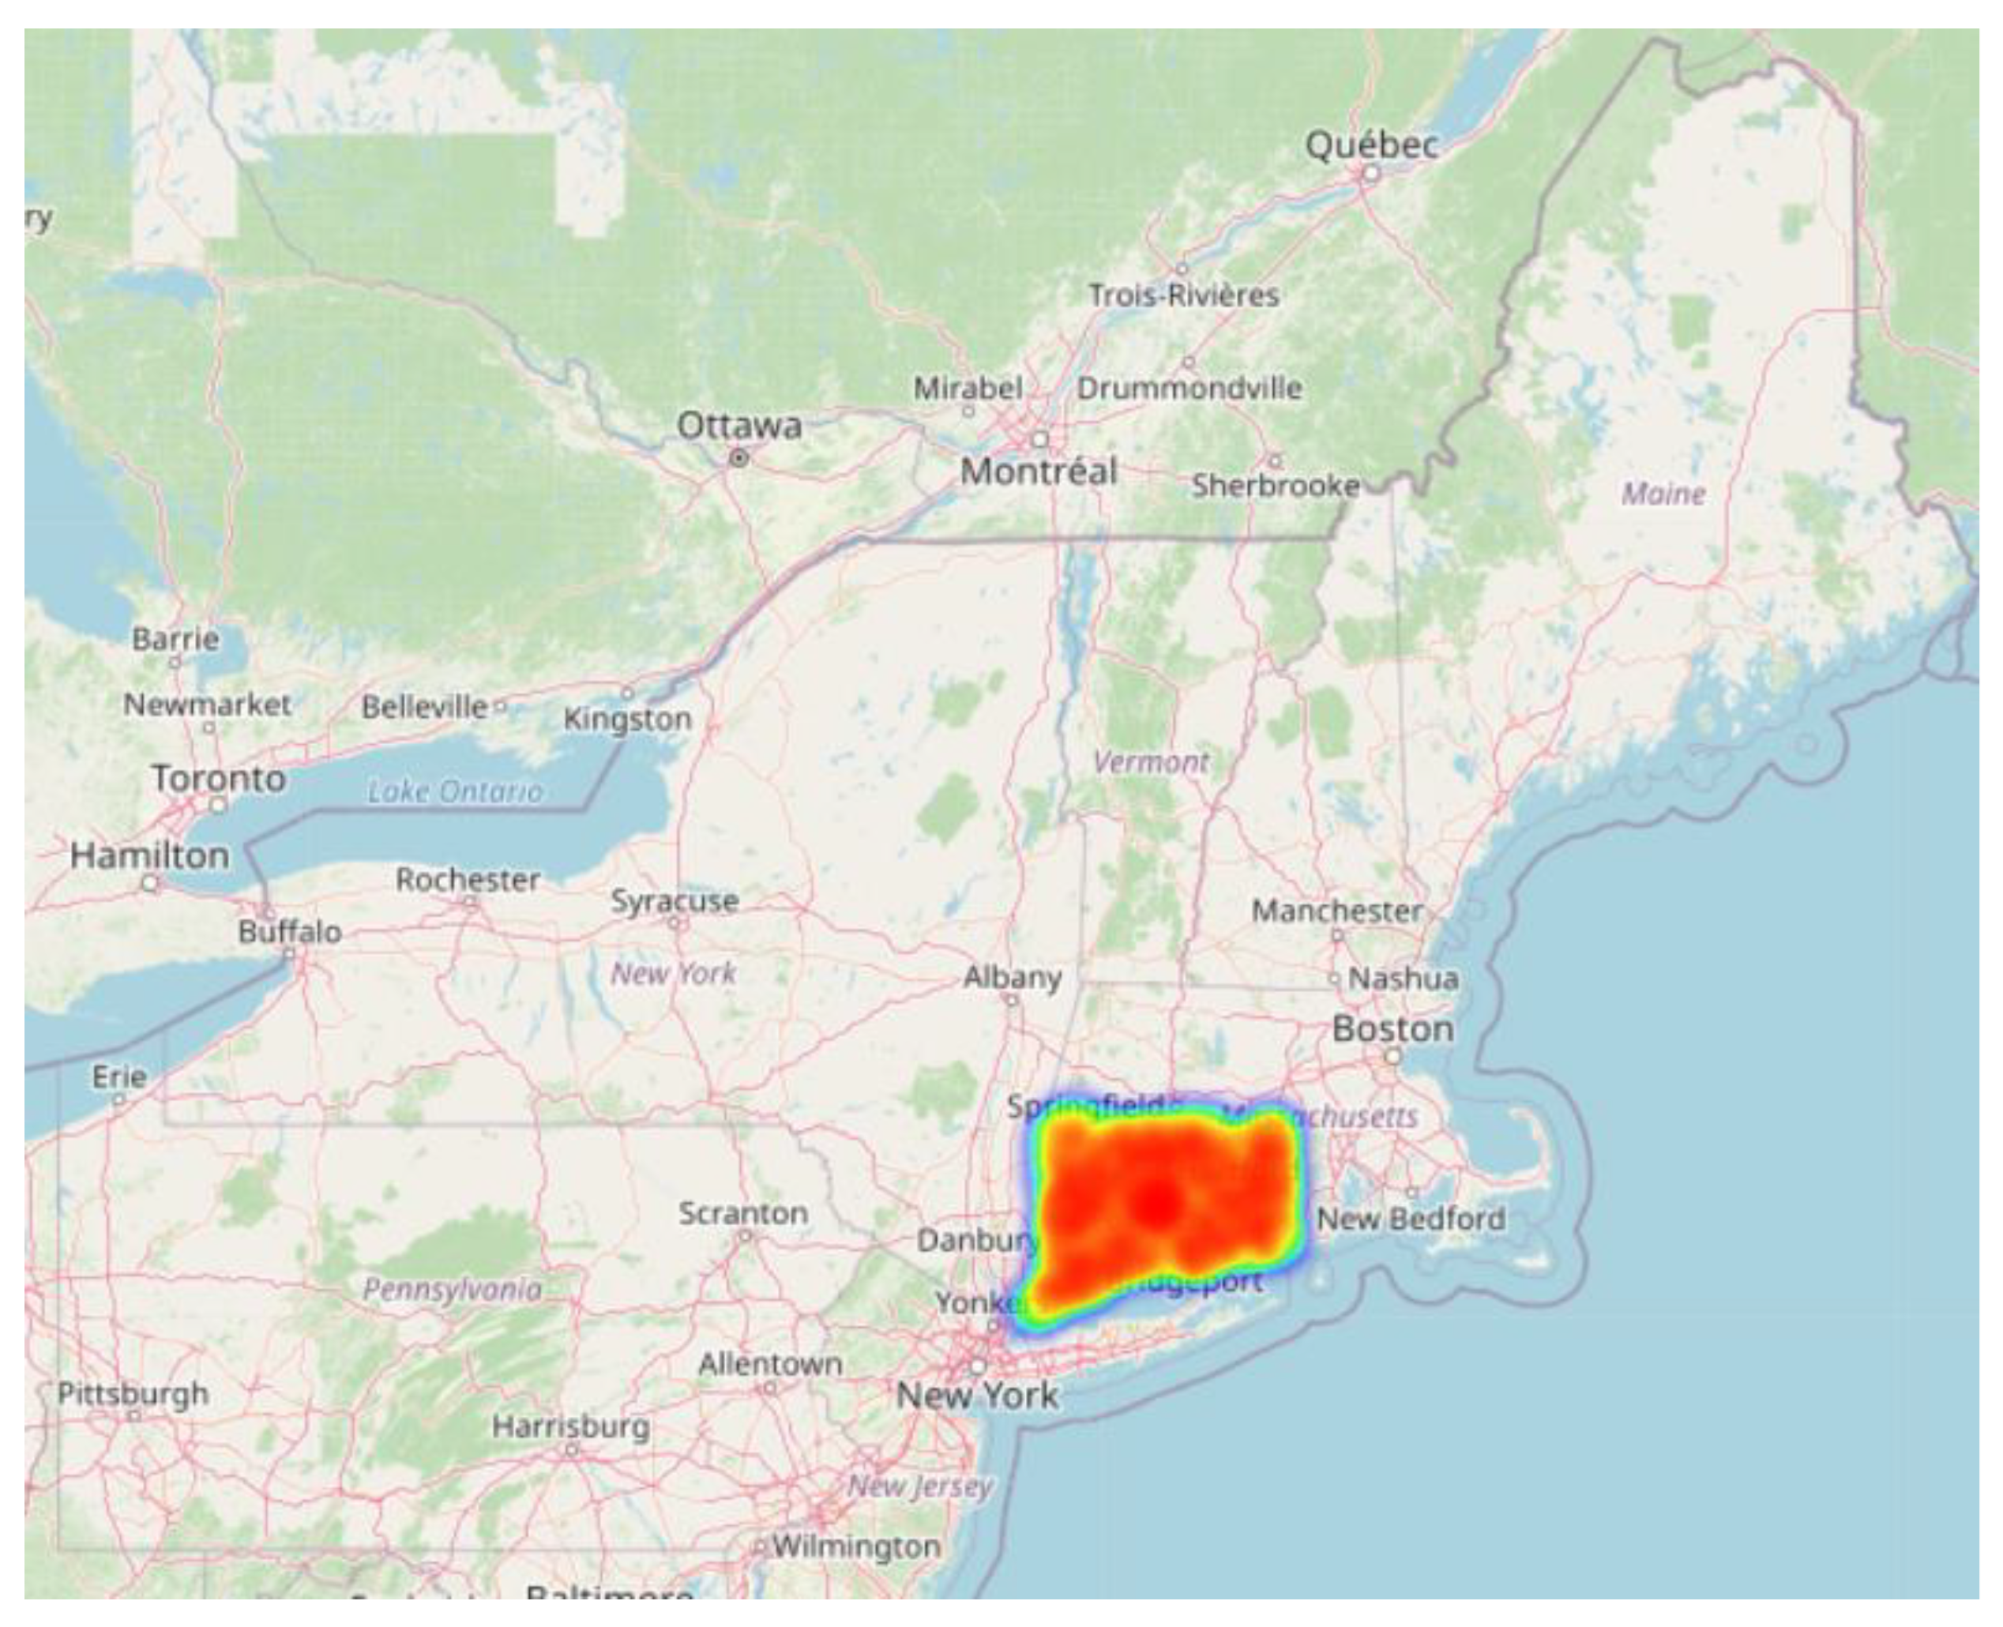
Figure 12.
Geospatial Heatmap of Overdose Clusters (Zoomed View).
This map highlights the concentration of overdose deaths, with a clear hotspot in the eastern United States—specifically in the state of Connecticut.
Figure 13.
Top 20 Cities with Highest Overdose Deaths (Bar Chart).
Middletown had the highest number of overdose deaths, followed by Hartford and New Haven. Derby had the fewest fatal overdose cases among the top 20 cities.
7.9. Ethics of Data Mining
Ethical integrity is highly important in the field of data mining. The data in this study were public health data, which could include personal information, making ethical integrity particularly important. Our study abided by a number of key ethical considerations as to how we handle and analyze data.
7.10. Data Protection and Privacy
All personally identifiable information must be anonymized to ensure privacy. As part of preprocessing, any identifiers that could be used to identify individuals were removed or masked.
7.11. Prevention, Breach Protection and Controlled Access
Data protection and security are a major priority. Sensitive data including public datasets should proactively protect DOS. Sensitive data should also have restricted access and held only by authorized personnel. Sensitive data should be stored securely and if possible in encrypted formats to reduce the risk of unauthorized access, data breaches or any possible compromised data.
7.12. Bias and Accuracy Concerns
It is essential to ensure that the dataset is representative and free from biases. Care was taken to handle missing and inconsistent data appropriately and to avoid introducing skewed results. Machine learning models can unintentionally amplify biases, so transparency in model assumptions and decision-making processes is necessary.
7.13. Transparency Around Data Use
When individuals give data, they deserve to know how that data will be used, who will use it, and what rights they have over the data. Transparent data usage minimizes ethical risks and builds trust in data practices.
7.14. Data Misuse and Abuse
Data should only be used for the purpose it was collected for. Any other use—surveillance, manipulation or potential reputational harm—is unethical.
7.15. Data Ownership
Data ownership needs clear boundaries. When individuals give data they should retain certain controls unless they have voluntarily waived that control through informed consent. Vague or misleading data ownership agreements lead to misuse and exploitation. Lastly, it is critical that the ethical implications of data mining cannot be overlooked. Respecting privacy, accuracy, and responsible usage of data lead to public trust where social good is achieved.
8. Discussion
This research utilized several data mining techniques to examine accidental drug-related deaths in the United States, with goals directed at identifying high-risk demographic groups, substance combinations, and geospatial patterns. The findings from the analysis yield actionable information that could be helpful to improving public health policies and emergency-response structures.
Association rule mining uncovered notable co-occurrence patterns amongst substances, where substance combinations such as fentanyl and heroin, were prevalent within fatal overdose cases. These co-occurrence patterns are consistent with previous literature, confirming the dangerous merging of opioids. The value of being able to identify these types of patterns benefits emergency healthcare responders in predicting possible substance combinations when responding and/or developing treatment approaches.
Classification techniques using decision trees and logistic regression effectively identified high risk demographic groups. Middle-aged men, specifically white and African Americans, were disproportionately impacted by overdose fatalities. This finding is consistent with National Institute on Drug Abuse reported figures and supports the rationale for public health forward-facing advocacy for certain demographic groups.
Clustering methods i.e. K-means, hierarchical clustering, also aided the identification of high-risk areas and the clustering of people in demographic groups. A notable number of deaths occurred in the state of Connecticut, specifically in cities within Connecticut, for example, Middletown, Hartford, and New Haven. The clustering in these areas may signal a greater socio-economic issue, access to substances, or healthcare disparities and can be helpful to regional needs assessments and planning of resources and interventions.
Outlier detection was also performed to find unusual cases, particularly with respect to age. Unusual ages (very high, very low) in overdose data suggest that there may be reporting errors, as well as emerging at-risk groups we have not previously considered. These outliers matter because they may indicate changing drug use or data integrity problems. The report defines a formalized process for data preprocessing from handling missing values, standardizing categorical data and transforming geolocation as well as the substance fields. This degree of cleaning improved the quality of the analysis and the ease of producing different visualizations. Particularly the way ethnicity and race were handled was respectful and consistent with federal standards and protocols. The appropriate handling of these data is important for making valid and ethical demographic comparisons.
Heatmaps, bar plots, and pie charts gave excellent insights into how overdose cases were distributed by factors such as substance, location, race, and age. Such visual tools are able to make clusters and trends more accessible, supporting the interpretation of mining results. As in the preceding cases noted in the ethical consideration, it's a worldwide call for data privacy, responsible usage, and bias mitigation context. Such debate over transparency, ownership of data, and hence misuse has become very fitting in today's data-political milieu. This dataset is being used directly or indirectly with many studies, including [21,22,23,24], for different aspects and findings.
9. Conclusions
This research intends to solidify the role of data mining as a technique to transform raw public health data into actionable knowledge. Through preprocessing and rigorous analysis, significant patterns were identified in the "Accidental_Drug_Related_Deaths.csv" data, revealing certain key risk factors including drug combinations, demographic susceptibilities, and regional hotspots. It was observed that the majority of deaths due to overdose were found to be associated with the use of opioids, mainly fentanyl and its analogs, which tend to affect middle-aged males residing in certain urban areas. These insights can be employed in public health awareness campaigns, improve preparedness for emergencies, and serve as a basis for evidence-based policymaking. Furthermore, it underscores the necessity of data preprocessing of the highest order since without it, mining techniques would provide inferior results. The work attempts to highlight the importance of maintaining ethical standards in relation to the use of data-ethics become especially indispensable when sensitive matters such as healthcare come into question. Future endeavors might consider real-time tracking of overdose trends, integration with socioeconomic factors, and predictive modeling to mitigate risks ahead of time. With ongoing attention to ethical practices and technical precision, data mining can play a pivotal role in combating the drug overdose epidemic.
References
- National Institute on Drug Abuse. (2024, August). Drug Overdose Death Rates. National Institute on Drug Abuse; National Institutes of Health. https://nida.nih.gov/research-topics/trends-statistics/overdose-death-rates.
- Racial Categories. (2025). National Institute of Neurological Disorders and Stroke. https://www.ninds.nih.gov/taxonomy/term/758.
- U.S. Department of the Interior. (2015, July 1). Standards for Maintaining, Collecting, and Presenting Federal Data on Race and Ethnicity. Www.doi.gov. https://www.doi.gov/pmb/eeo/directives/race-data.
- Ogwo-Ude, E., Hasan, R., Ahmad, S., & Mahmood, S. (2024, November). Exploratory Data Analysis and Data Visualization on Accidental Drug Related Deaths. In 2024 2nd International Conference on Computing and Data Analytics (ICCDA) (pp. 1-6). IEEE. [CrossRef]
- Athif, S., & Amin, N. U. (2025). Association Rule Mining for Identifying High-Risk Drug Combinations in Overdose Fatalities: A Comparative Analysis of Apriori and FP-Growth Algorithms.
- Hochstatter, K. R., Rastogi, S., Klein, K., Tait-Ozer, C., El-Bassel, N., & Graham, J. (2022). Predicting accidental drug overdose as the cause of fatality in near real-time using the Suspected Potential Overdose Tracker (SPOT): public health implications. BMC public health, 22(1), 1311. [CrossRef]
- McCue, C. (2014). Data mining and predictive analysis: Intelligence gathering and crime analysis. Butterworth-Heinemann.
- Gopi, R., Sathiyamoorthi, V., Selvakumar, S., et al. (2022). Enhanced method of ANN based model for detection of DDoS attacks on multimedia Internet of Things. Multimedia Tools and Applications, 81(36), 26739-26757. [CrossRef]
- Johnson, M., Albizri, A., Harfouche, A., & Tutun, S. (2023). Digital transformation to mitigate emergency situations: increasing opioid overdose survival rates through explainable artificial intelligence. Industrial Management & Data Systems, 123(1), 324-344. [CrossRef]
- Saeed, S. (2019). Analysis of software development methodologies. IJCDS. Scopus; Publish.
- Saeed, S. (2019). The serverless architecture: Current trends and open issues moving legacy applications. IJCDS. Scopus.
- Saeed, S., & Humayun, M. (2019). Disparaging the barriers of journal citation reports (JCR). IJCSNS: International Journal of Computer Science and Network Security, 19(5), 156-175. ISI-Index: 1.5.
- Saeed, S. (2016). Surveillance system concept due to the uses of face recognition application. Journal of Information Communication Technologies and Robotic Applications, 7(1), 17-22.
- Athif, S., Bhattacharjee, M., & Rozin Khan, N. U. A. (2025). Data Mining and Machine Learning Approaches for Analyzing Drug-Related Overdose Patterns and Risk Factors.
- Chesti, I. A., Humayun, M., Sama, N. U., & Jhanjhi, N. Z. (2020, October). Evolution, mitigation, and prevention of ransomware. In 2020 2nd International Conference on Computer and Information Sciences (ICCIS) (pp. 1-6). IEEE. [CrossRef]
- Alkinani, M. H., Almazroi, A. A., Jhanjhi, N. Z., & Khan, N. A. (2021). 5G and IoT based reporting and accident detection (RAD) system to deliver first aid box using unmanned aerial vehicle. Sensors, 21(20), 6905. [CrossRef]
- Babbar, H., Rani, S., Masud, M., Verma, S., Anand, D., & Jhanjhi, N. (2021). Load balancing algorithm for migrating switches in software-defined vehicular networks. Computational Materials and Continua, 67(1), 1301-1316.
- Hall, O. E., Hall, O. T., Eadie, J. L., Teater, J., Gay, J., Kim, M., ... & Noonan, R. K. (2021). Street-drug lethality index: a novel methodology for predicting unintentional drug overdose fatalities in population research. Drug and alcohol dependence, 221, 108637. [CrossRef]
- Data.gov. (2025, June 14). State of Connecticut - Accidental drug related deaths 2012-2024. https://catalog.data.gov/dataset/accidental-drug-related-deaths-2012-2018.
- Jhanjhi, N.Z. (2025). Investigating the Influence of Loss Functions on the Performance and Interpretability of Machine Learning Models. In: Pal, S., Rocha, Á. (eds) Proceedings of 4th International Conference on Mathematical Modeling and Computational Science. ICMMCS 2025. Lecture Notes in Networks and Systems, vol 1399. Springer, Cham. [CrossRef]
- Humayun, M., Khalil, M. I., Almuayqil, S. N., & Jhanjhi, N. Z. (2023). Framework for detecting breast cancer risk presence using deep learning. Electronics, 12(2), 403. [CrossRef]
- Gill, S. H., Razzaq, M. A., Ahmad, M., Almansour, F. M., Haq, I. U., Jhanjhi, N. Z., ... & Masud, M. (2022). Security and privacy aspects of cloud computing: a smart campus case study. Intelligent Automation & Soft Computing, 31(1), 117-128.
- Aldughayfiq, B., Ashfaq, F., Jhanjhi, N. Z., & Humayun, M. (2023, April). Yolo-based deep learning model for pressure ulcer detection and classification. In Healthcare (Vol. 11, No. 9, p. 1222). MDPI. [CrossRef]
- N. Jhanjhi, "Comparative Analysis of Frequent Pattern Mining Algorithms on Healthcare Data," 2024 IEEE 9th International Conference on Engineering Technologies and Applied Sciences (ICETAS), Bahrain, Bahrain, 2024, pp. 1-10. [CrossRef]
Figure 1.
gives a glimpse of the data set, including all of the columns (attributes). We cannot include all records in Figure 1 due to the large size of the data set (11,981 rows, and 48 columns).
Figure 1.
gives a glimpse of the data set, including all of the columns (attributes). We cannot include all records in Figure 1 due to the large size of the data set (11,981 rows, and 48 columns).
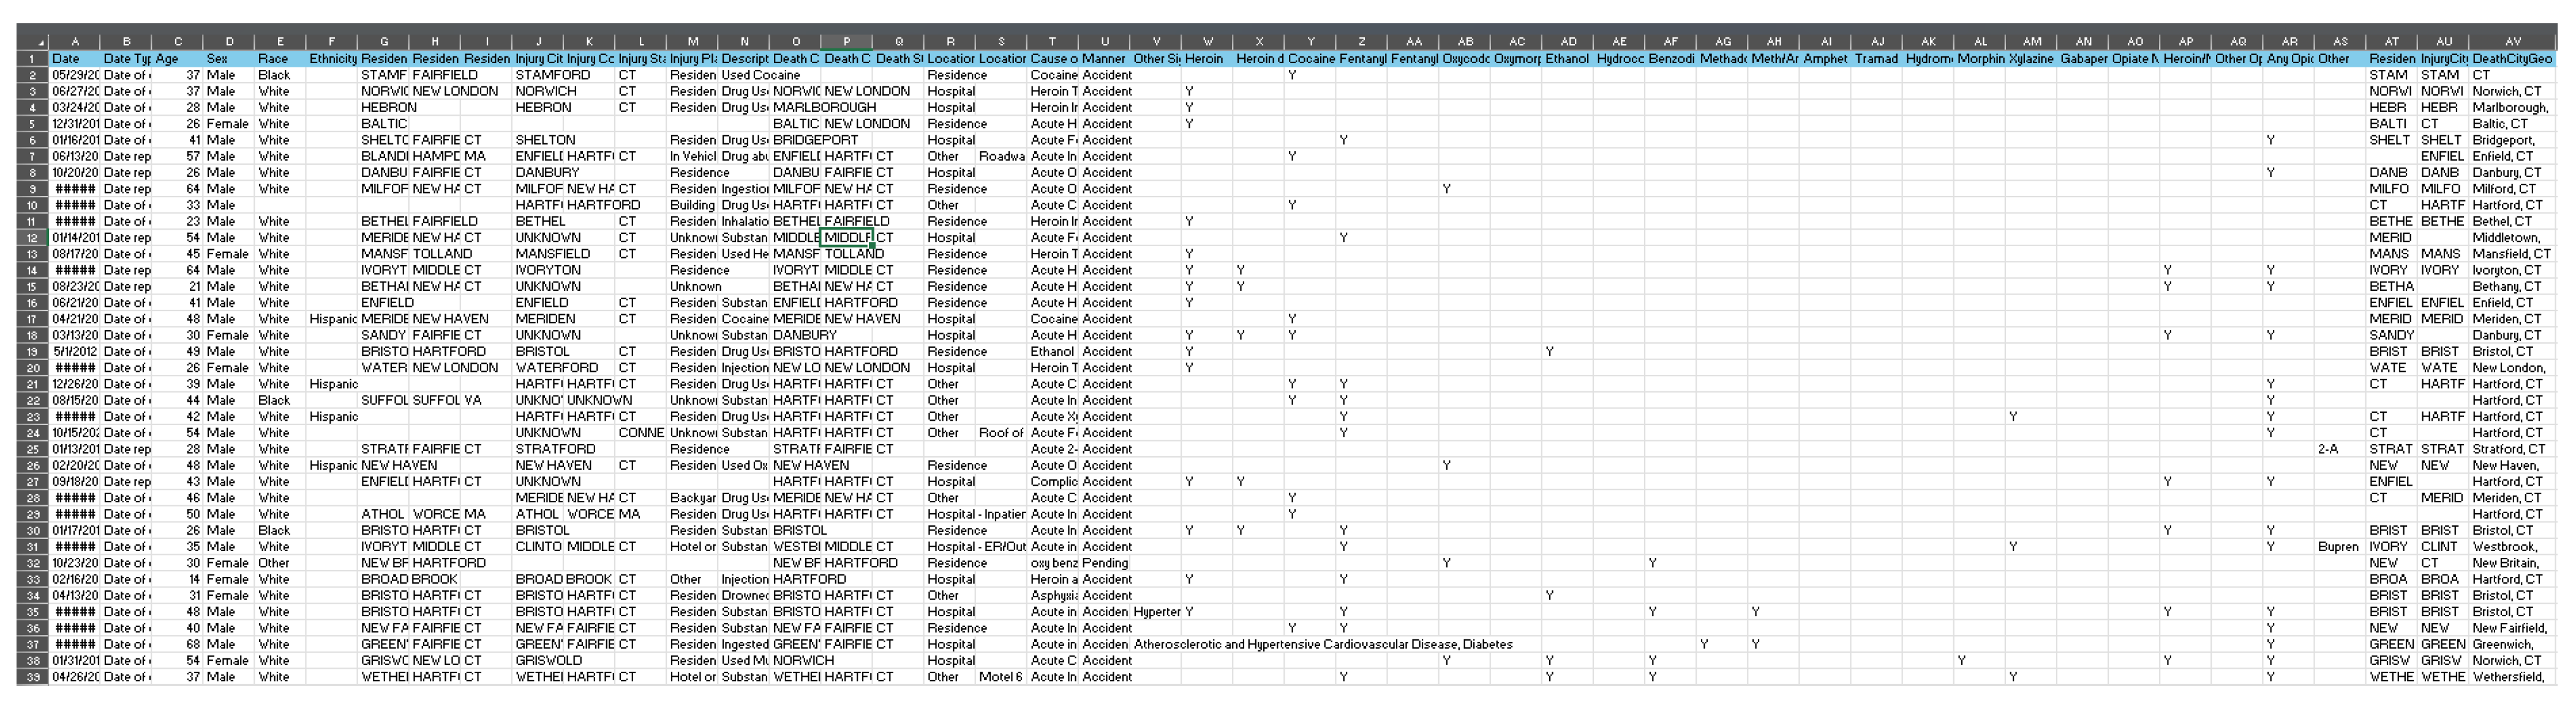
Figure 2.
Deaths by drug overdose in the United States by gender for years 1999-2022 (National Institute on Drug Abuse, 2024).
Figure 2.
Deaths by drug overdose in the United States by gender for years 1999-2022 (National Institute on Drug Abuse, 2024).
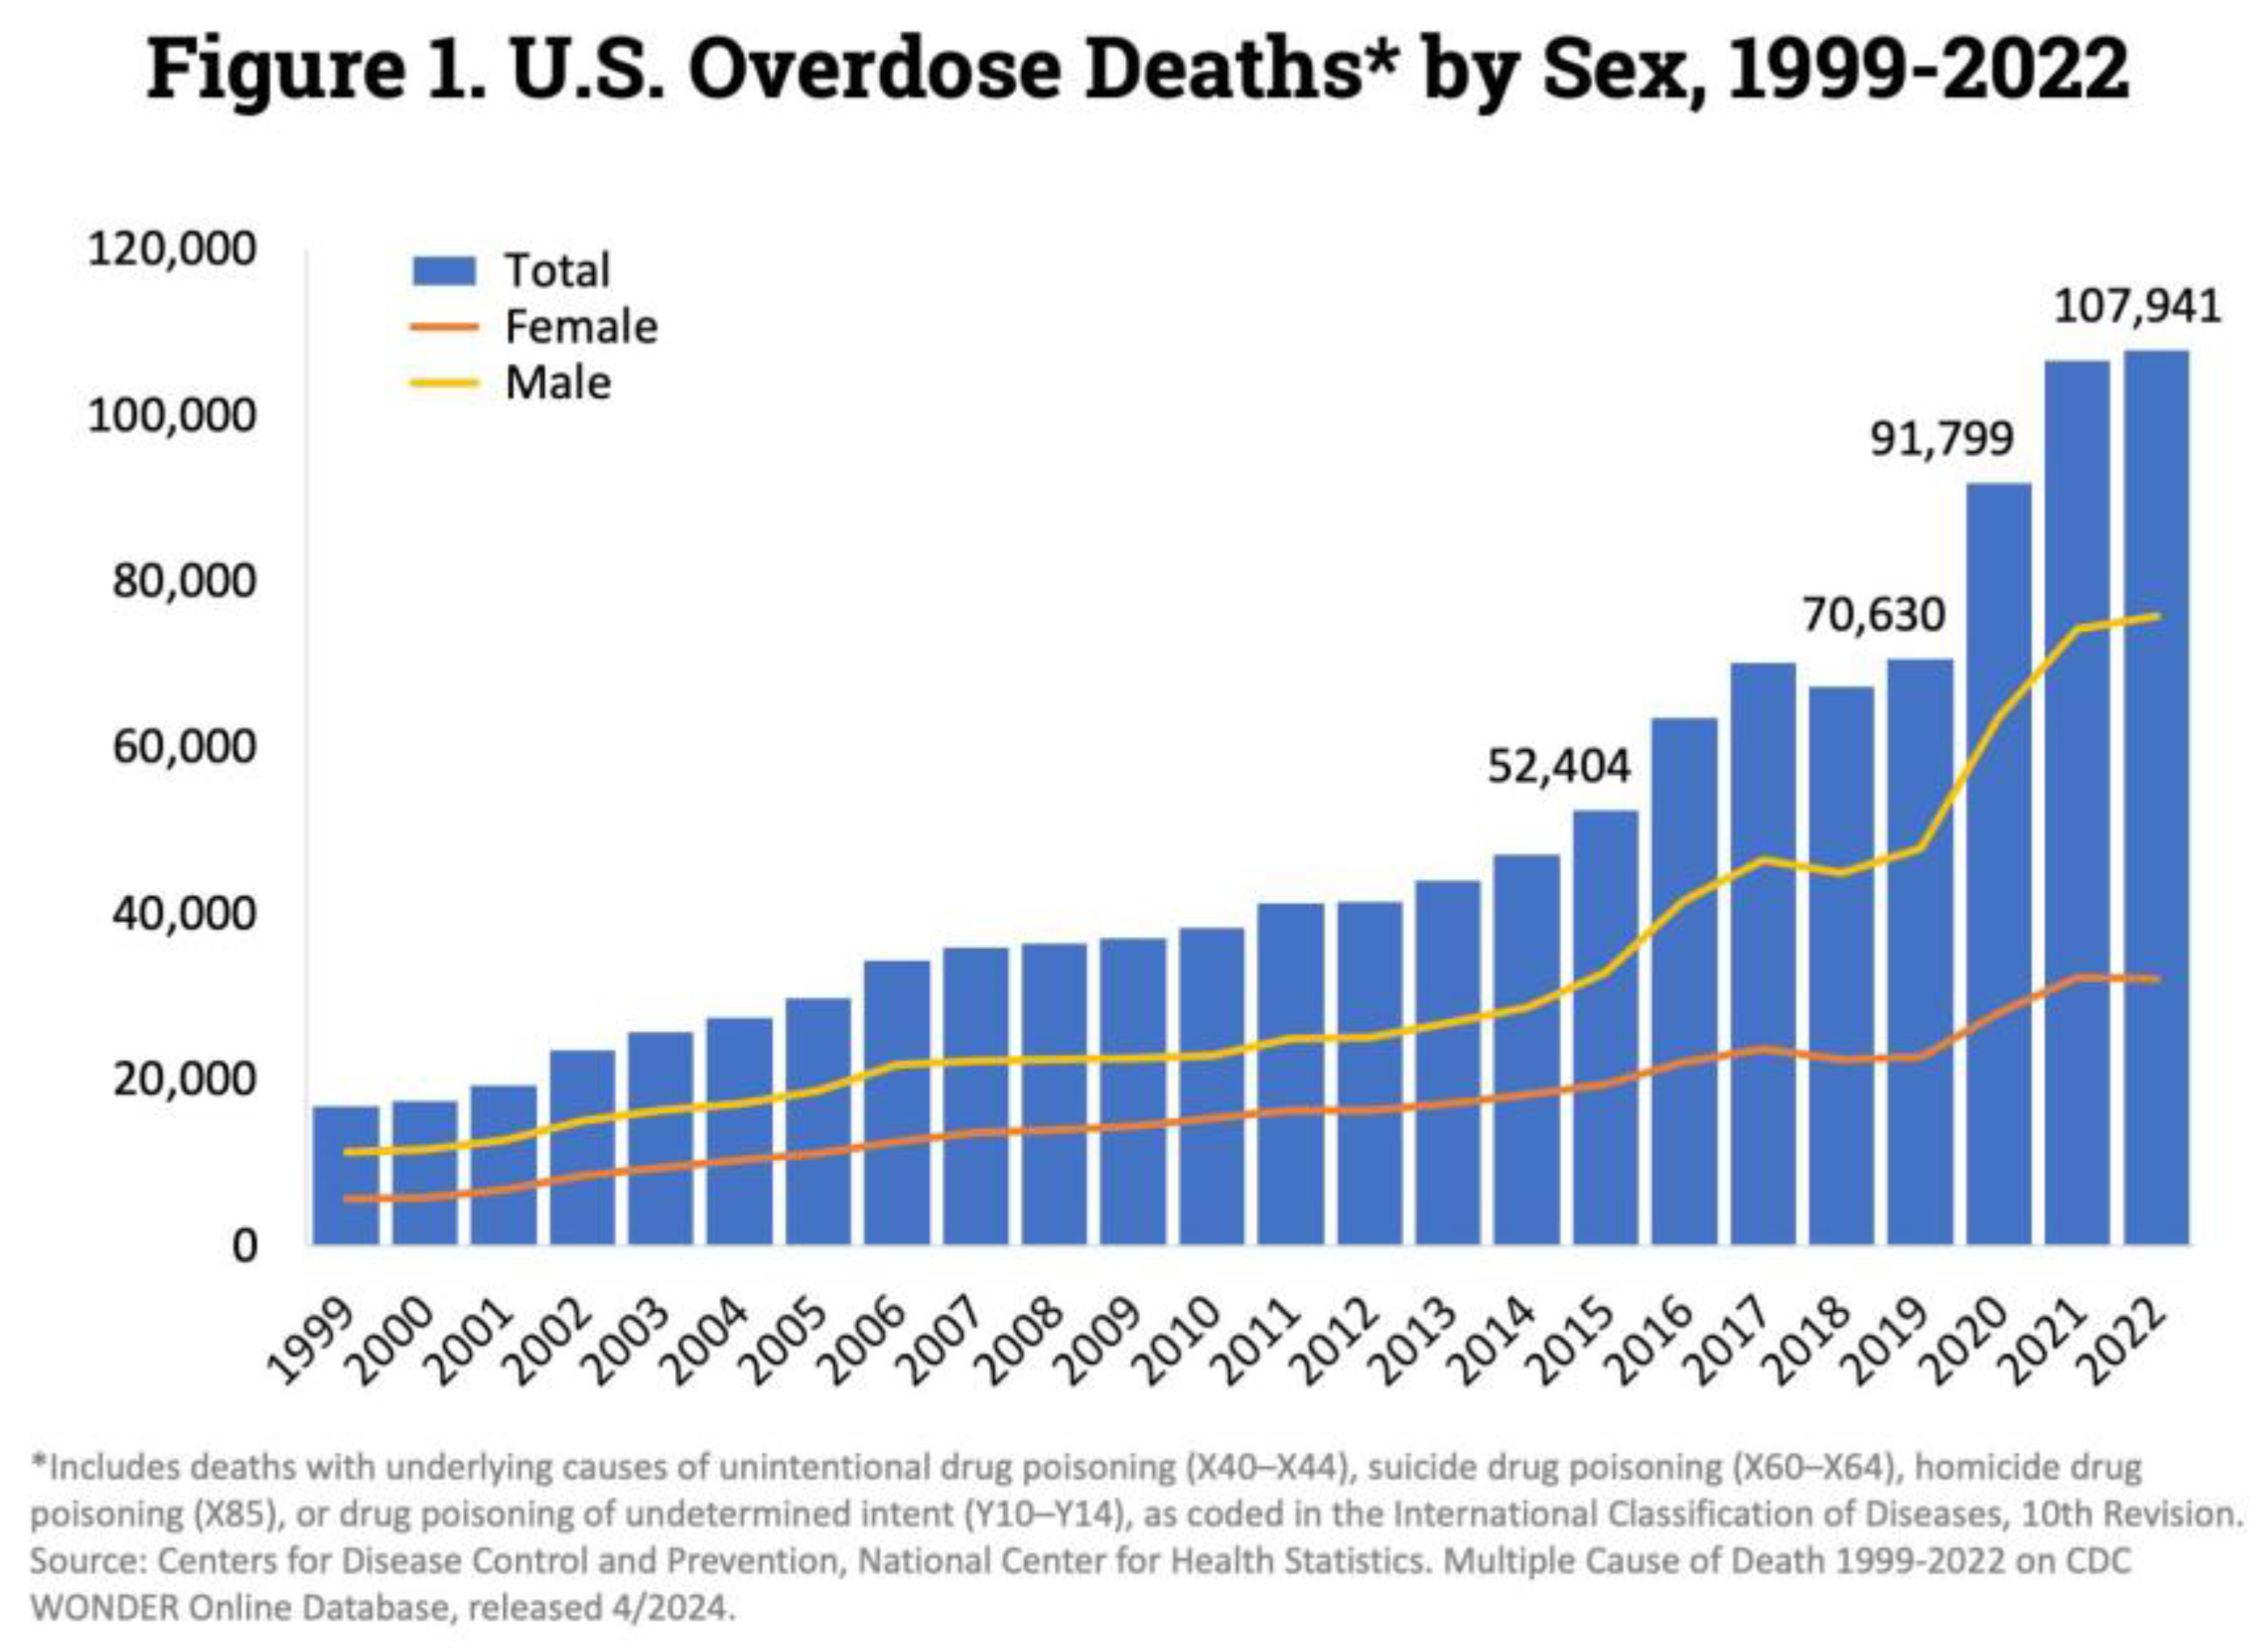
Figure 3.
Deaths by drug overdose in the United States by drug categories for years 1999-2022 (National Institute on Drug Abuse, 2024).
Figure 3.
Deaths by drug overdose in the United States by drug categories for years 1999-2022 (National Institute on Drug Abuse, 2024).
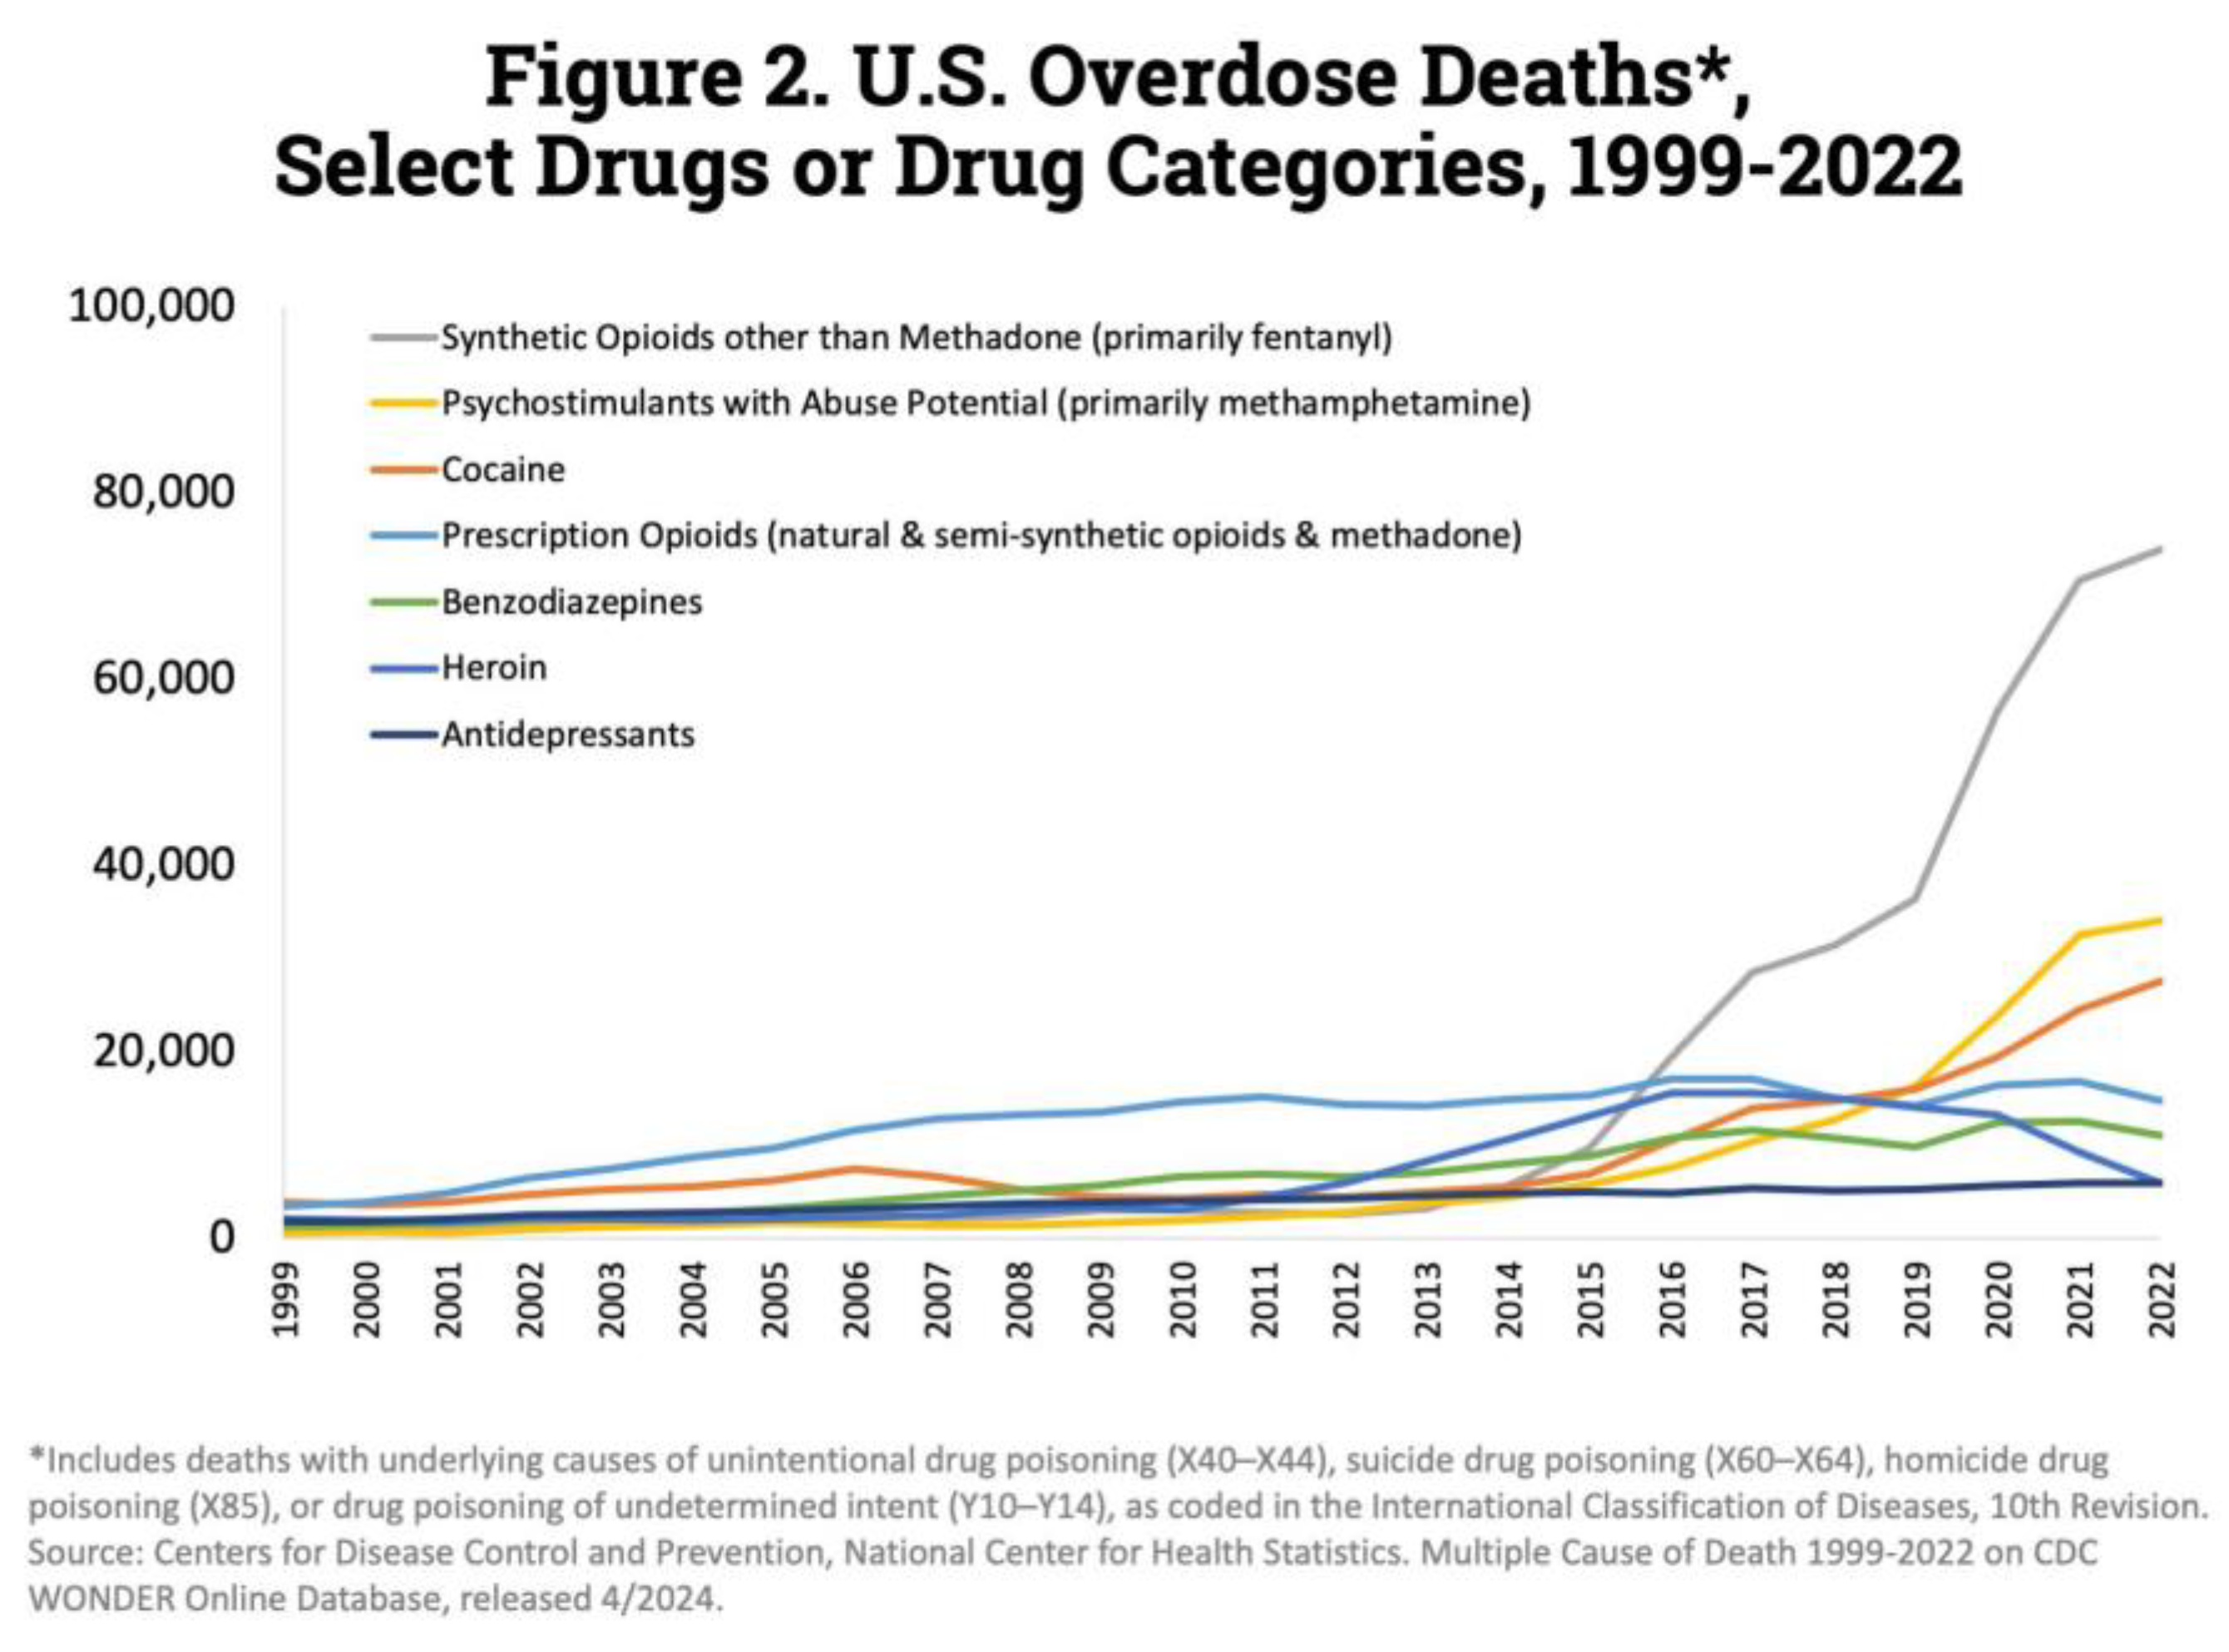

Table 1.
Attributes in our dataset.
| Attribute | Attribute Type | Attribute Description |
| Date | In this context Date is categorical and can be further classified as ordinal because although it is mutually exclusive but ordered | This column mentions the registered date |
| Date Type | Categorical (object). Therefore, we can consider this data to be nominal type because it is not only categorical but also unordered and mutually exclusive that cannot be ordered. | This column tells us what happened on the registered date (i.e. date of death) |
| Age | Numerical (float64). It has numerical value and is discrete as age is not continuous (i.e. you can be 2- or 3-years-old but 2.35 years old) | These columns provide us demographical information about the victims such as what’s their age, gender (sex), race, ethnicity (race and ethnicity are not the same thing - at least not in the American context which we are concerned with in this assignment), and where they live. |
| Sex | Categorical (object). Therefore, we can consider this data to be nominal type because it is not only categorical but also unordered and mutually exclusive that cannot be ordered. | |
| Race | ||
| Ethnicity | ||
| Residence City | ||
| Residence County | ||
| Residence State | ||
| Injury City | Categorical (object). Therefore, we can consider this data to be nominal type because it is not only categorical but also unordered and mutually exclusive that cannot be ordered. | These columns provide us information about the injury as to where it occurred and also give a description of what it was. |
| Injury County | ||
| Injury State | ||
| Injury Place | ||
| Description of Injury | ||
| Death City | Categorical (object). Therefore, we can consider this data to be nominal type because it is not only categorical but also unordered and mutually exclusive that cannot be ordered. | These columns provide us information about the death as to where it occurred and also gives us details of the location (i.e. in house, car, hotel room, etc) |
| Death County | ||
| Death State | ||
| Location | ||
| Location if other | ||
| Cause of Death | All these columns provide us information about the circumstances of the victim’s death like how they died and if there were any other significant conditions that need to be taken into account as well or not (i.e. the victim was a sufferer of some cardiovascular disease for example or suffering from addiction or withdrawal symptoms) | |
| Manner of Death | ||
| Other Significant Conditions | ||
| Heroin | Categorical (object). It only has binary values Y and N which indicate if the substance was found the victim’s system or not. Therefore, we can consider this data to be nominal type because it is not only categorical but also unordered and mutually exclusive that cannot be ordered. | All these columns provide information about the persona’s results for a particular substance (i.e. if it was present in their system or not based on the autopsy tests conducted) |
| Heroin death certificate (DC) | ||
| Cocaine | ||
| Fentanyl | ||
| Fentanyl Analogue | ||
| Oxycodone | ||
| Oxymorphone | ||
| Ethanol | ||
| Hydrocodone | ||
| Benzodiazepine | ||
| Methadone | ||
| Meth/Amphetamine | ||
| Amphet | ||
| Tramad | ||
| Hydromorphone | ||
| Morphine (Not Heroin) | ||
| Xylazine | ||
| Gabapentin | ||
| Opiate NOS | ||
| Heroin/Morph/Codeine | ||
| Other Opioid | ||
| Any Opioid | ||
| Other | ||
| ResidenceCityGeo | Categorical (object). We can also consider this data to be nominal type because it is not only categorical but also unordered and mutually exclusive that cannot be ordered. | Geolocation data of the residence city in which the person concerned lived. |
| InjuryCityGeo | Geolocation data of the city in which the injury took place. | |
| DeathCityGeo | Geolocation data of the city in which the death took place |
Table 2.
The color-coded groups and what they tell us about.
| Group Color | Group |
| Demographical Data | |
| Injury-related information | |
| Death-related information | |
| Substances data | |
| Geolocation data |
Table 3.
Number of null values in each column in our dataset.
| Column | Number of Null values |
| Date | 0 |
| Date Type | 0 |
| Age | 2 |
| Sex | 9 |
| Race | 57 |
| Ethnicity | 9416 |
| Residence City | 596 |
| Residence County | 1260 |
| Residence State | 1988 |
| Injury City | 178 |
| Injury County | 3334 |
| Injury State | 3029 |
| Injury Place | 358 |
| Description of Injury | 807 |
| Death City | 2784 |
| Death County | 3891 |
| Death State | 5108 |
| Location | 1349 |
| Location if other | 10787 |
| Cause of Death | 0 |
| Manner of Death | 9 |
| Other Significant Conditions | 10782 |
| Heroin | 8403 |
| Heroin death certificate (DC) | 11241 |
| Cocaine | 7403 |
| Fentanyl | 3932 |
| Fentanyl Analogue | 11007 |
| Oxycodone | 10965 |
| Oxymorphone | 11819 |
| Ethanol | 8780 |
| Hydrocodone | 11812 |
| Benzodiazepine | 9264 |
| Methadone | 10903 |
| Meth/Amphetamine | 11854 |
| Amphet | 11550 |
| Tramad | 11679 |
| Hydromorphone | 11904 |
| Morphine (Not Heroin) | 11922 |
| Xylazine | 10903 |
| Gabapentin | 11512 |
| Opiate NOS | 11854 |
| Heroin/Morph/Codeine | 9779 |
| Other Opioid | 11759 |
| Any Opioid | 3034 |
| Other | 11195 |
| ResidenceCityGeo | 167 |
| InjuryCityGeo | 257 |
| DeathCityGeo | 1 |
| Unnamed: 48 | 11981 |
| Unnamed: 49 | 11980 |
Table 4.
Unique values in the dataset.
| Column | Number of Unique values |
| Date | 3877 |
| Date Type | 2 |
| Age | 70 |
| Sex | 4 |
| Race | 22 |
| Ethnicity | 13 |
| Residence City | 536 |
| Residence County | 163 |
| Residence State | 35 |
| Injury City | 297 |
| Injury County | 18 |
| Injury State | 7 |
| Injury Place | 99 |
| Description of Injury | 539 |
| Death City | 238 |
| Death County | 10 |
| Death State | 2 |
| Location | 16 |
| Location if other | 543 |
| Cause of Death | 7632 |
| Manner of Death | 6 |
| Other Significant Conditions | 390 |
| Heroin | 1 |
| Heroin death certificate (DC) | 1 |
| Cocaine | 1 |
| Fentanyl | 3 |
| Fentanyl Analogue | 1 |
| Oxycodone | 1 |
| Oxymorphone | 1 |
| Ethanol | 2 |
| Hydrocodone | 1 |
| Benzodiazepine | 1 |
| Methadone | 1 |
| Meth/Amphetamine | 1 |
| Amphet | 1 |
| Tramad | 1 |
| Hydromorphone | 1 |
| Morphine (Not Heroin) | 4 |
| Xylazine | 1 |
| Gabapentin | 2 |
| Opiate NOS | 1 |
| Heroin/Morph/Codeine | 2 |
| Other Opioid | 18 |
| Any Opioid | 2 |
| Other | 153 |
| ResidenceCityGeo | 633 |
| InjuryCityGeo | 492 |
| DeathCityGeo | 240 |
| Unnamed: 48 | 0 |
| Unnamed: 49 | 1 |
Disclaimer/Publisher’s Note: The statements, opinions and data contained in all publications are solely those of the individual author(s) and contributor(s) and not of MDPI and/or the editor(s). MDPI and/or the editor(s) disclaim responsibility for any injury to people or property resulting from any ideas, methods, instructions or products referred to in the content. |
© 2025 by the authors. Licensee MDPI, Basel, Switzerland. This article is an open access article distributed under the terms and conditions of the Creative Commons Attribution (CC BY) license (http://creativecommons.org/licenses/by/4.0/).
Copyright: This open access article is published under a Creative Commons CC BY 4.0 license, which permit the free download, distribution, and reuse, provided that the author and preprint are cited in any reuse.


