Submitted:
29 April 2025
Posted:
30 April 2025
You are already at the latest version
Abstract
The mounting tragedy of drug overdose deaths poses a critical public health issue globally. In this paper, patterns and drivers of fatal accidental overdoses from drugs are explored utilizing an extensive dataset named "Accidental_Drug_Related_Deaths.csv" containing 11,981 observations with demographic and substance factors. Employing exploratory data analysis and data mining methods, the research reveals primary trends in substance abuse, demographic risk, and regional clustering of drug-overdose mortality. Our findings indicate that opioids, including fentanyl, heroin, and cocaine, are among the most lethal drugs with varied impact on varied ages. Of concern is that unusual incidents in very old and young individuals hint at age-based risk due to unintentional intake or misuse of drugs. Besides, frequent patterns of overdose among residential spaces such as Hartford suggest socio-environmental risk and absence of rehab centers. The results of this study aim to inform health authorities, policymakers, and community leaders in how to develop more efficient prevention, treatment, and enforcement strategies to stem the drug overdose crisis.
Keywords:
accidental
; drug
; demographic
; rehab centers
; socio-environmental
1. Introduction
The escalating rate of drug overdose mortality has emerged as a global issue plaguing society indiscriminately. Aside from the irreversible emotional loss to families and individuals, these fatalities impose significant costs on healthcare systems, social services, and law enforcement agencies. The trend of rising overdoses is a reflection of more serious and entrenched issues within society such as drug use, co-occurring mental illness, and socio-economic inequities [1].
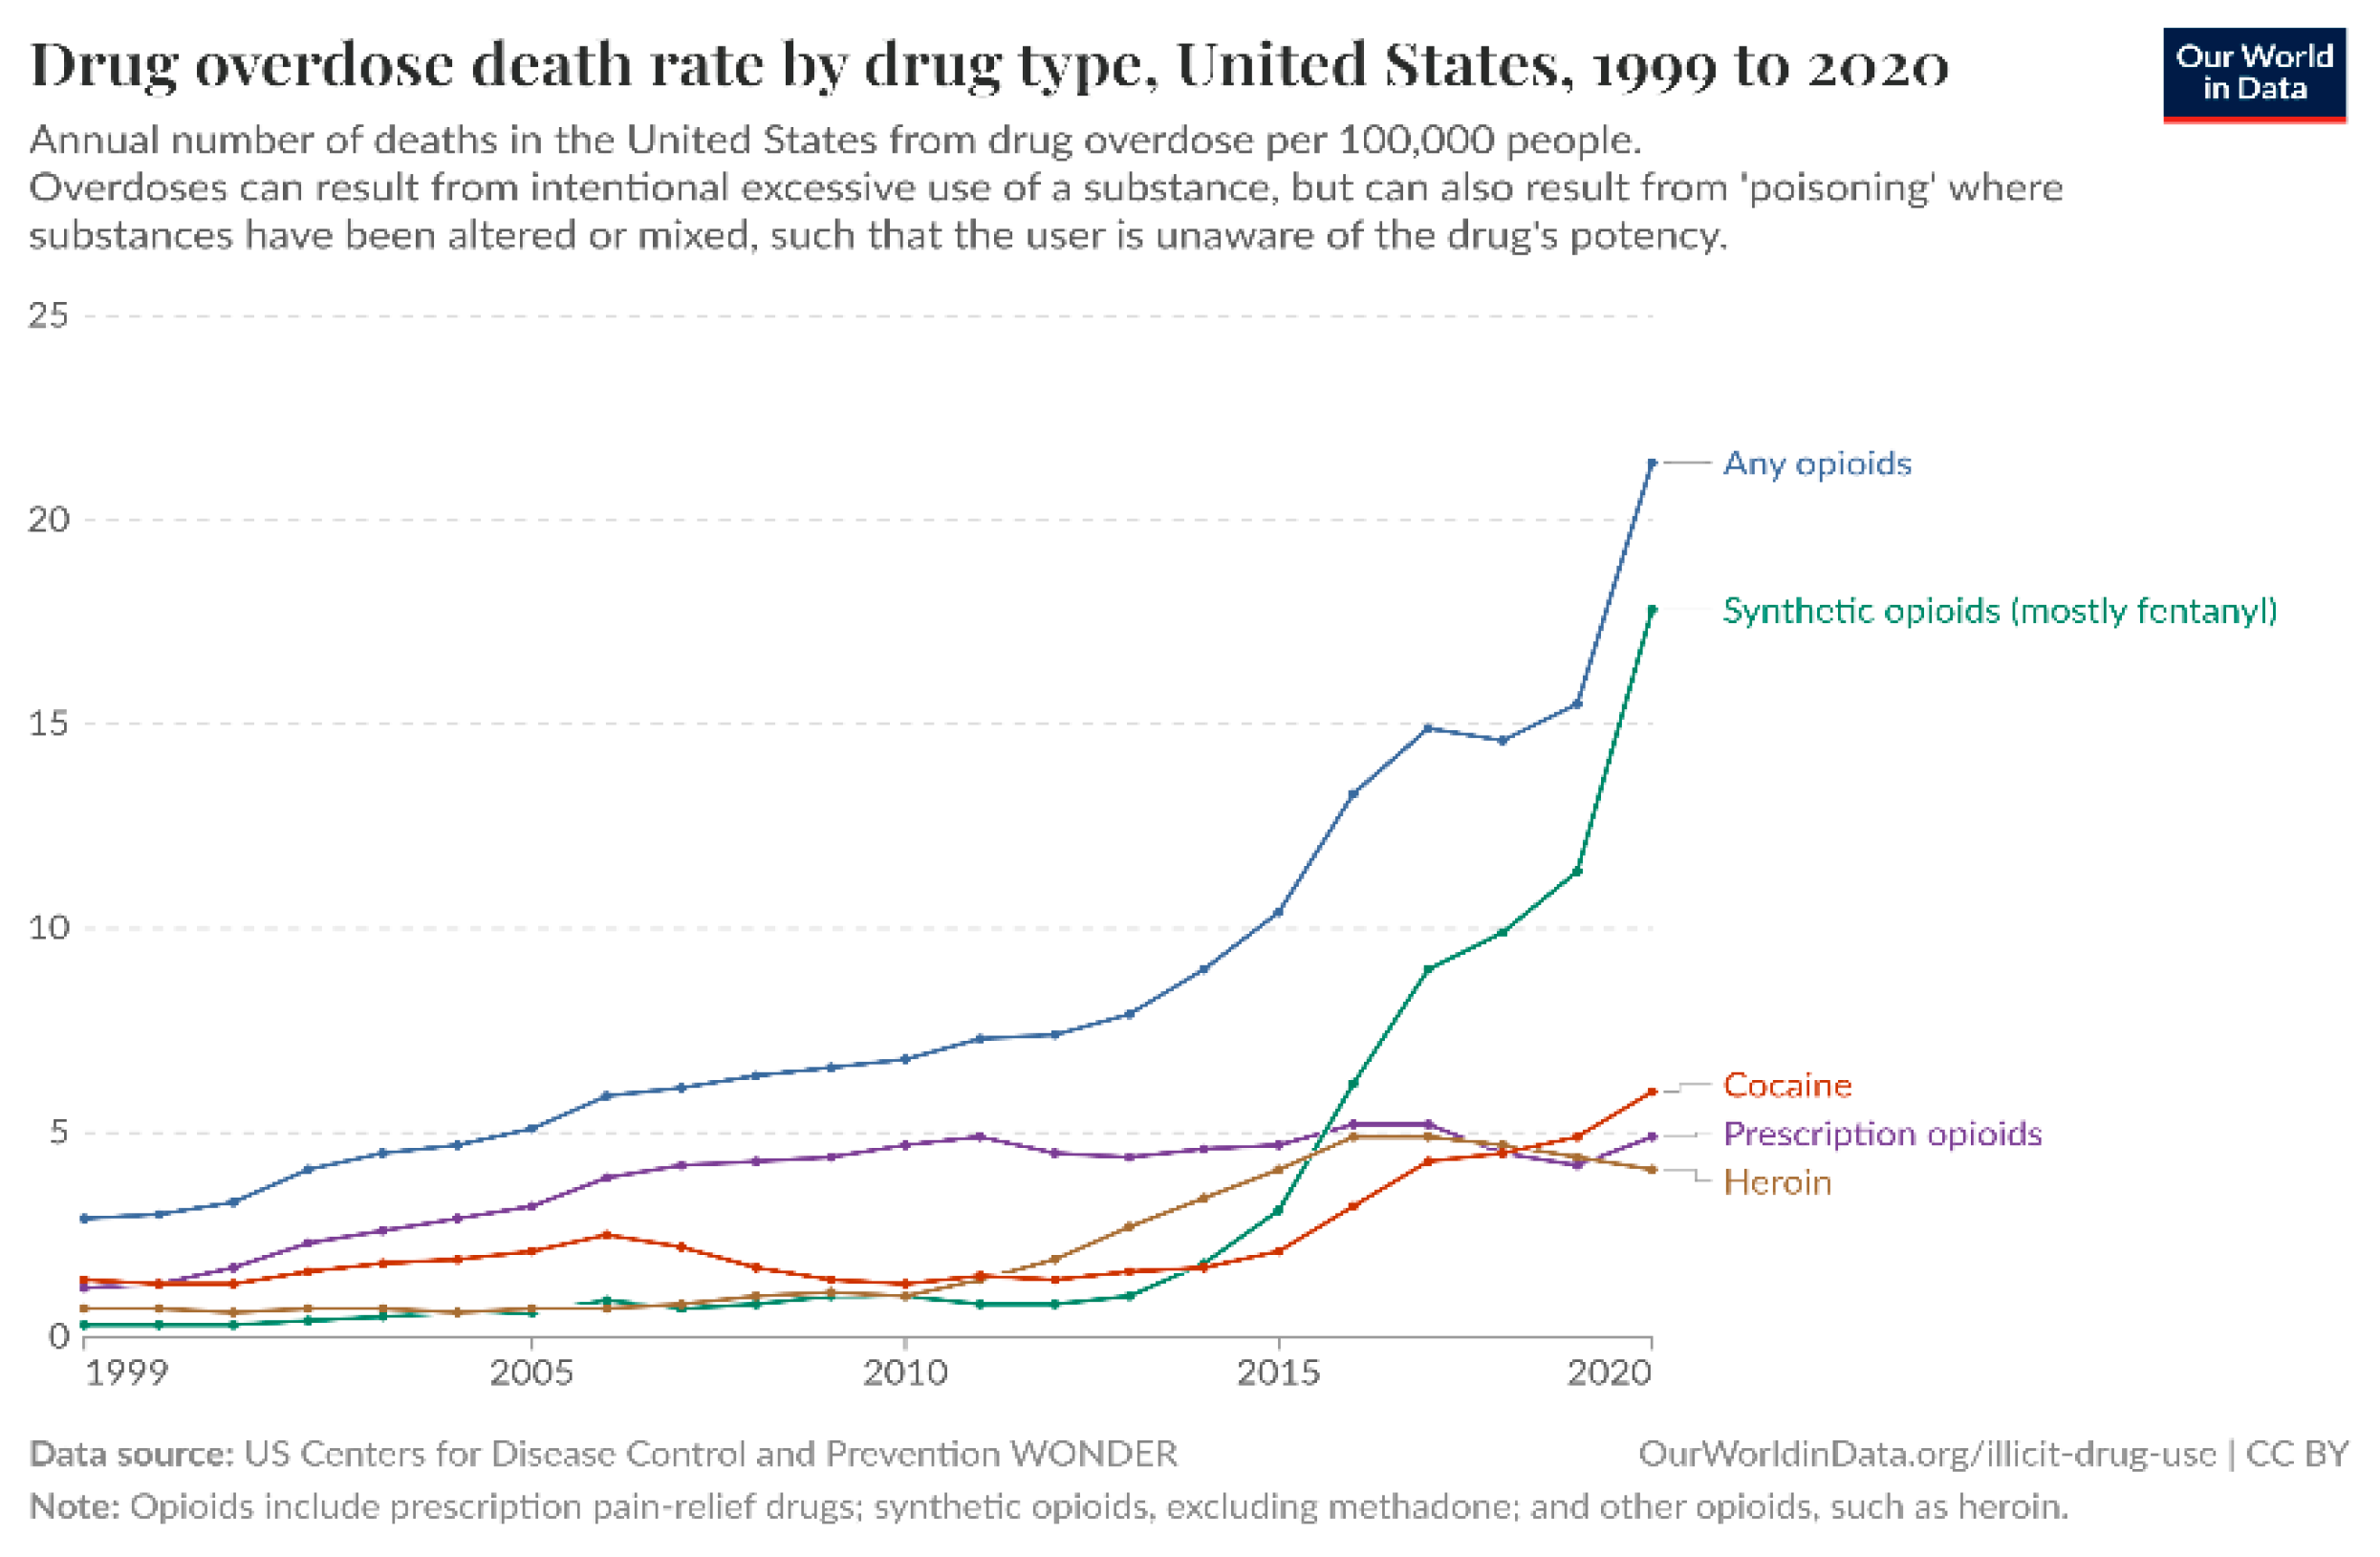
Substance abuse has an impact on not only people but communities themselves. It is associated with increased crime, lower productivity in work, and greater healthcare costs. United States statistics indicate that illicit drugs such as fentanyl, heroin, and cocaine are most frequently involved with drug overdose fatalities that are unintentional, while prescription drugs such as oxycodone, diphenhydramine, hydrocodone, and alprazolam are most frequently responsible for overdose suicides [2](see Figure 1 and Figure 2).
Figure 1.
– Overdose death by drug type, U.S.
Trends in drug use and overdose are worth noting for prevention. Timely and targeted interventions have the potential to reduce mortality significantly. By understanding which drugs are most commonly involved in overdoses that lead to death, treatment resources can be allocated more effectively by health officials and targeted public health awareness campaigns can be launched. Similarly, policymakers can establish proactive policies to buffer vulnerable populations, enhance access to mental health services, and implement more stringent controls on the prescribing of high-risk prescription drugs.
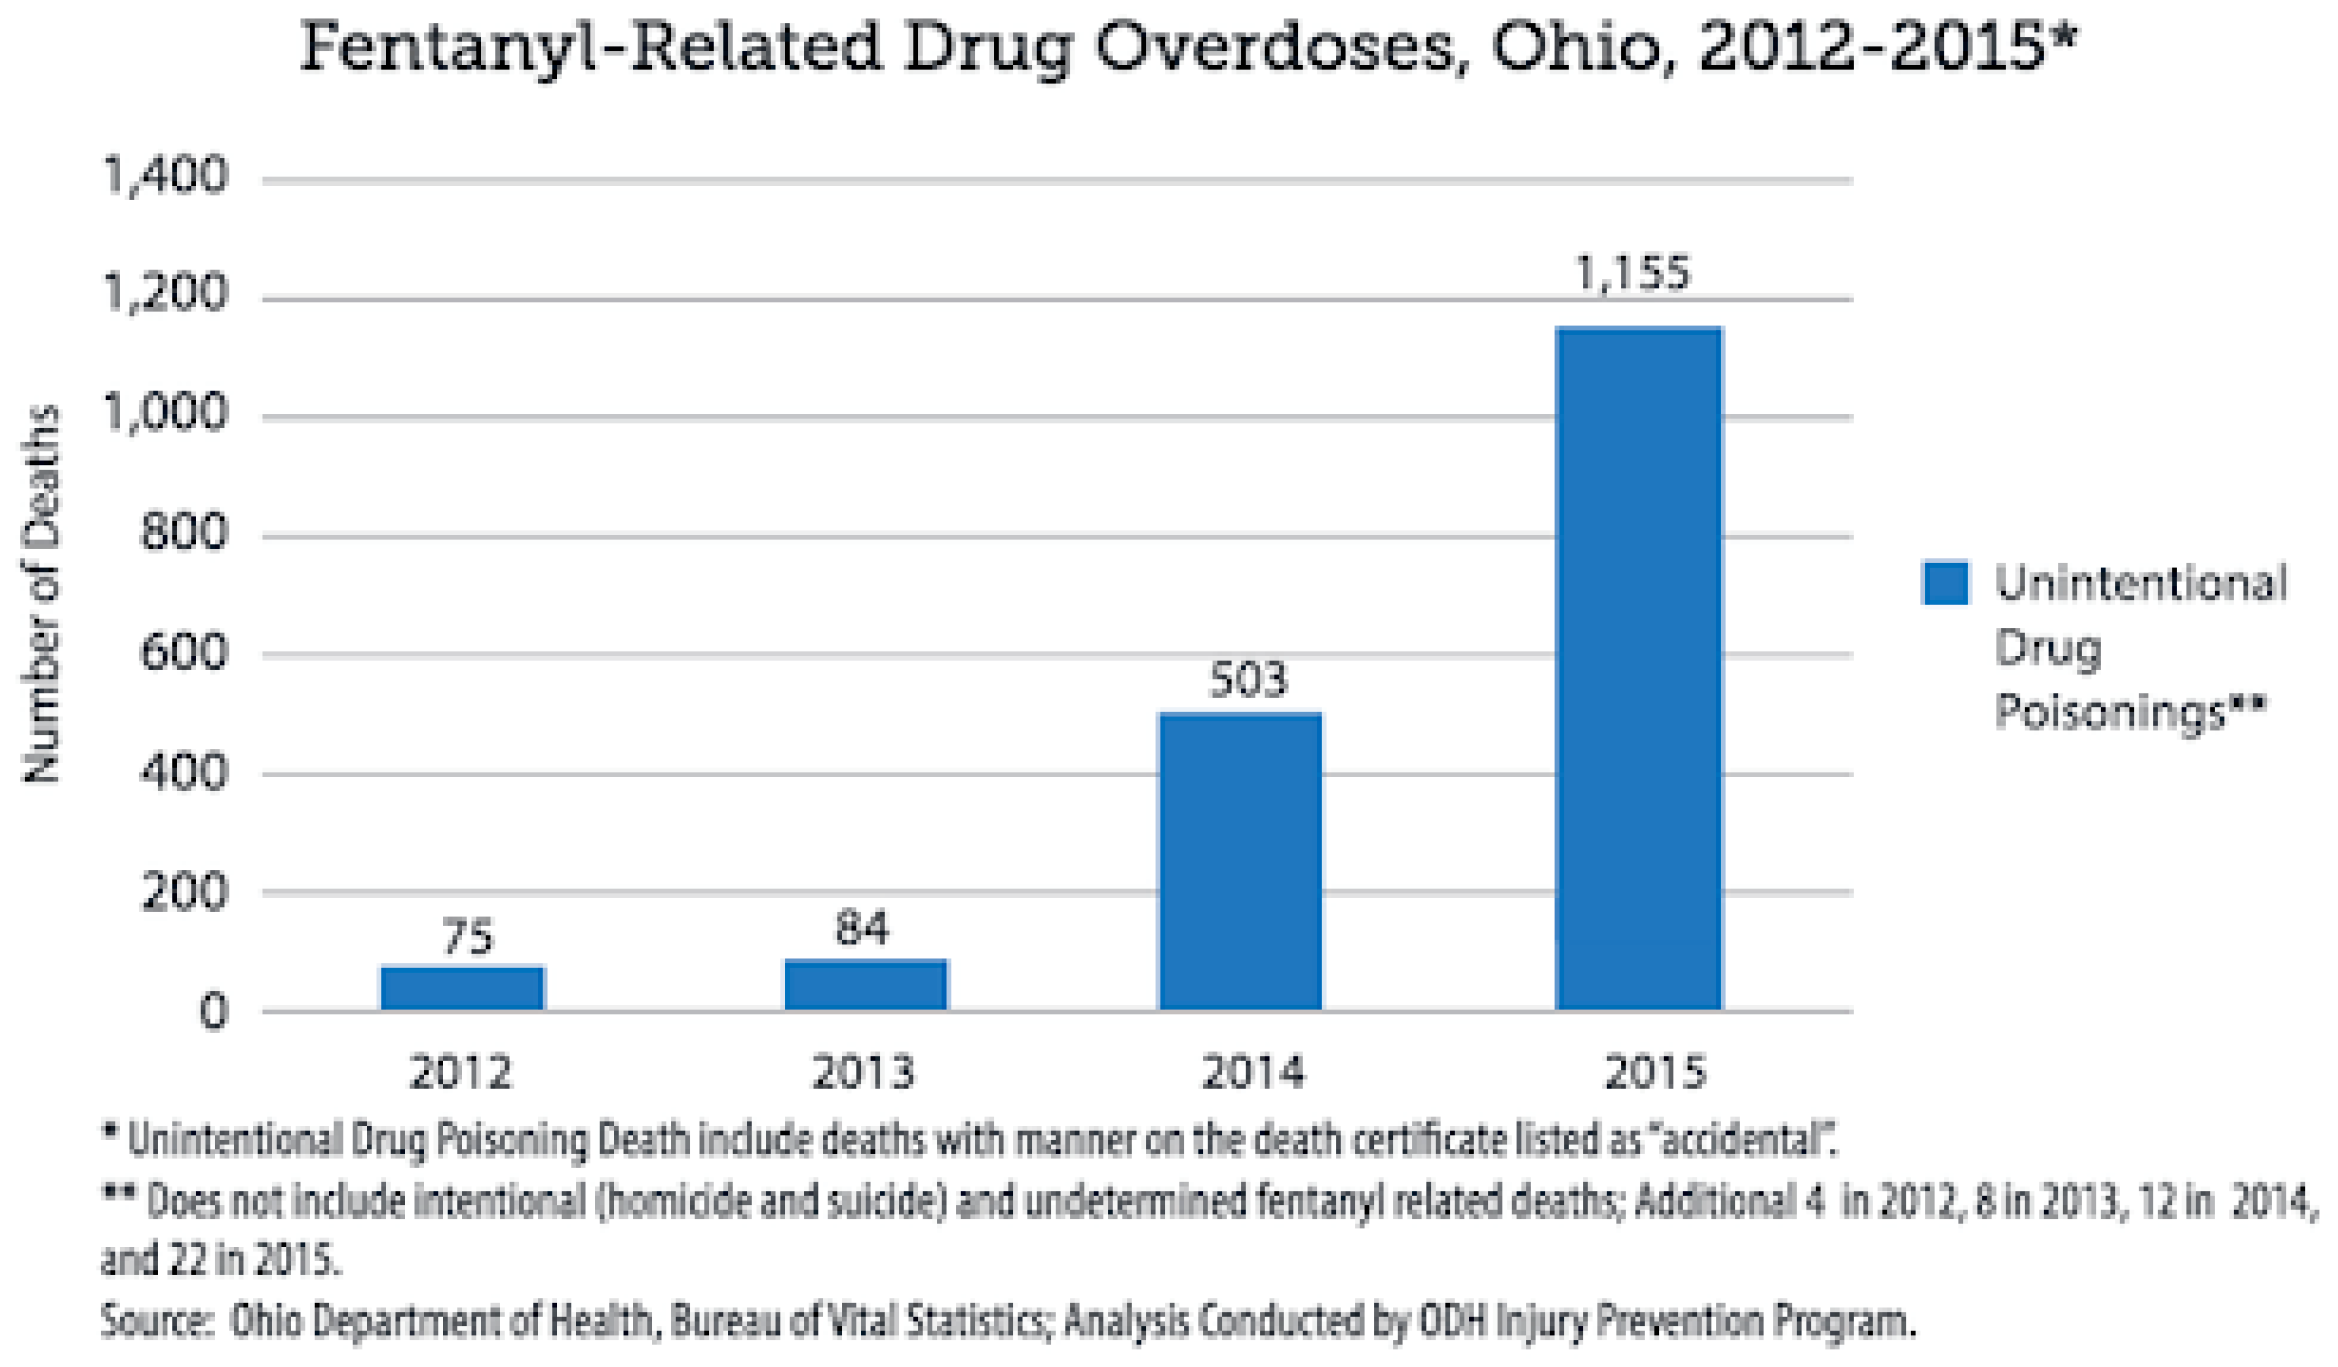
Figure 2.
– Fentanyl related Drug Overdose, Ohio.
Demographics such as age, sex, ethnicity, and geographic location also influence these trends. Middle-aged white males, for example, have been consistently identified as being most at risk of opioid-related death. Such demographic speculation, however, must be supported by rigorous data analysis to avoid misperceptions and foster effective policy reactions. In this regard, the present study applies state-of-the-art data mining techniques to analyze drug overdose patterns. The objective is to uncover useful knowledge that can inform the response to the present crisis and lead to more focused and evidence-based public health and drug policy responses.
2. Literature Review
The increasing epidemic of drug overdose death has been the subject of widespread focus in public health literature, with numerous studies attempting to account for trends and underlying determinants fuelling the epidemic. Strong understanding of demographic and drug-specific trends is paramount for the design of targeted interventions[3].
Monnat (2023) mentions that between 1999 and 2020, US mortality rates from drug overdose increased by 445%, and the number one cause was opioids. Analysis discovers that overdose was highest among young and middle-aged White and American Indian men and middle-aged and older Black men. Geographically, regions such as Appalachia perennially experienced elevated overdose rates, but the epidemic has since penetrated into other locations and infected residents of both rural and urban populations. This means the epidemic was pervasive and called for regional intervention[4,5,6,7].
The nature of drugs responsible for overdose deaths has evolved over time. The crisis was initially dominated by prescription opioids, followed by heroin and then synthetic opioids like fentanyl more recently. Fentanyl’s potency, which is approximately 50 times that of heroin, has been a factor in its contribution to overdose death. Its financial advantage to illegal drug manufacturers has led it to be widely adulterated in the majority of drugs, quite frequently without users being aware, hence their overdoses becoming likely to be fatal [8,9,10,11].
Aside from individual actions, structural determinants are also at the centre of the overdose crisis. Economic recession, unemployment, and decreased social cohesion have been associated with more substance abuse. According to the authors view, points out that localities undergoing economic decline, such as those relying on sectors like mining and manufacturing, are most vulnerable to higher rates of overdose. Such evidence indicates that the reduction of socioeconomic inequalities is part of solving the overdose epidemic[12,13,14,15,16].
3. Dataset Description
The dataset employed in this study, titled “Accidental_Drug_Related_Deaths.csv”, includes 11,981 instances and 48 attributes with extensive details regarding individuals who have lost their lives from accidental overdoses of drugs of various geographic origins. It includes a comprehensive list of demographic attributes such as date of death, age, sex, race, and location, as well as substance-specific information regarding drugs such as heroin, fentanyl, cocaine, and other widely abused drugs. Spreading over many years, the data set is a rich time-series material for investigating trends and finding factors that cause drug-related deaths. Tabular in form, the data set is particularly amenable to Exploratory Data Analysis (EDA) and use of data mining algorithms such as clustering, classification, and association rule mining. These analytical strategies facilitate the detection of nonobvious patterns and substantial associations that assist in contributing to the development of informed public health policy and policymaking decision advice.
The dataset also has some columns relating to the material details that cause drug-related fatalities, for example, Heroin, Cocaine, Fentanyl, Fentanyl Analogue, Oxycodone, Oxymorphone, Ethanol, and so on. In each one of these columns, the indication of a “Y” value indicates that the particular substance was present in the individual’s body at the moment of death, while an empty cell indicates the substance was absent.
3.1. Understanding the Data Type of All the Attributes:
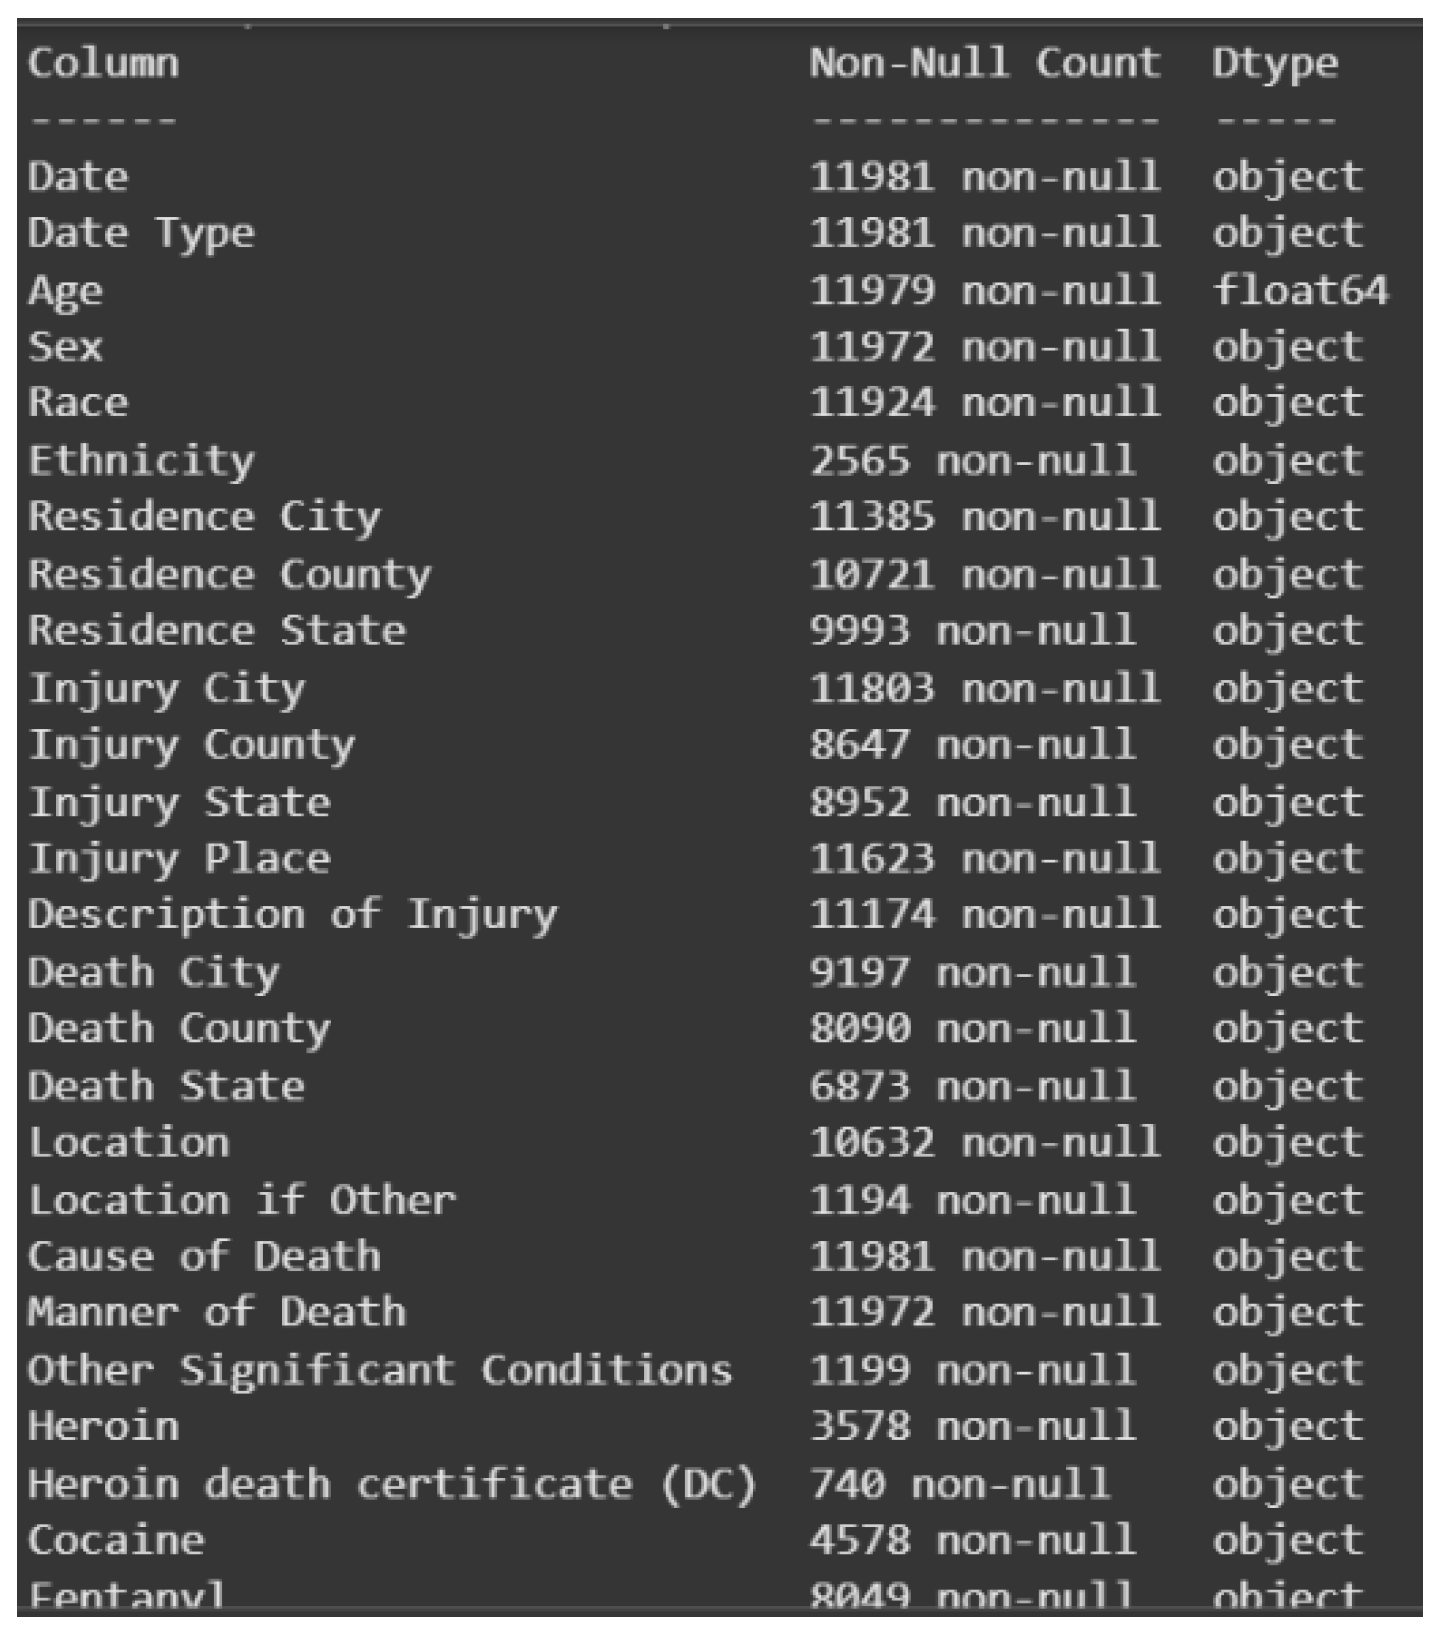
To get a clear view of the structure and composition of the dataset, the data.info() function was run. The function provides a brief overview of all the attributes and their respective data types. Through the analysis, 47 attributes were identified to have the “object” data type, i.e., they are categorical, and only one attribute—Age—with the “float64” data type, i.e., numerical. It is important to distinguish between categorical and numerical data types as it directly affects the selection of data preprocessing methods to be used. Knowledge of data type also makes different data mining algorithms compatible and analysis performance is optimized. Visual summaries of the classification of this attribute are presented in Figures 1.6.1 and 1.6.2.
Figure 1.
Overview on the datatype of attributes.
3.2. Finding Missing Values Of The Attributes:
For further assessment of the quality of the dataset, missing values were identified using data.isnull().sum() function. This counts missing values by each attribute and shows potential data gaps that can affect analysis. Identification and addressal of missing values are essential in data integrity preservation and accuracy of analytical results. Skipping this process will result in skewed outcomes or faulty predictions in data mining. Three of the features—Date, Date Type, and Cause of Death—were observed to have zero missing values in this dataset, as shown in Figure 1.7. Missing values were found in the remaining features, which must be treated appropriately. These missing values would greatly impact follow-up tasks such as data visualization and model training, leading to possibly incorrect patterns, misleading conclusions, or model performance errors if not handled properly through techniques such as imputation or data deletion.
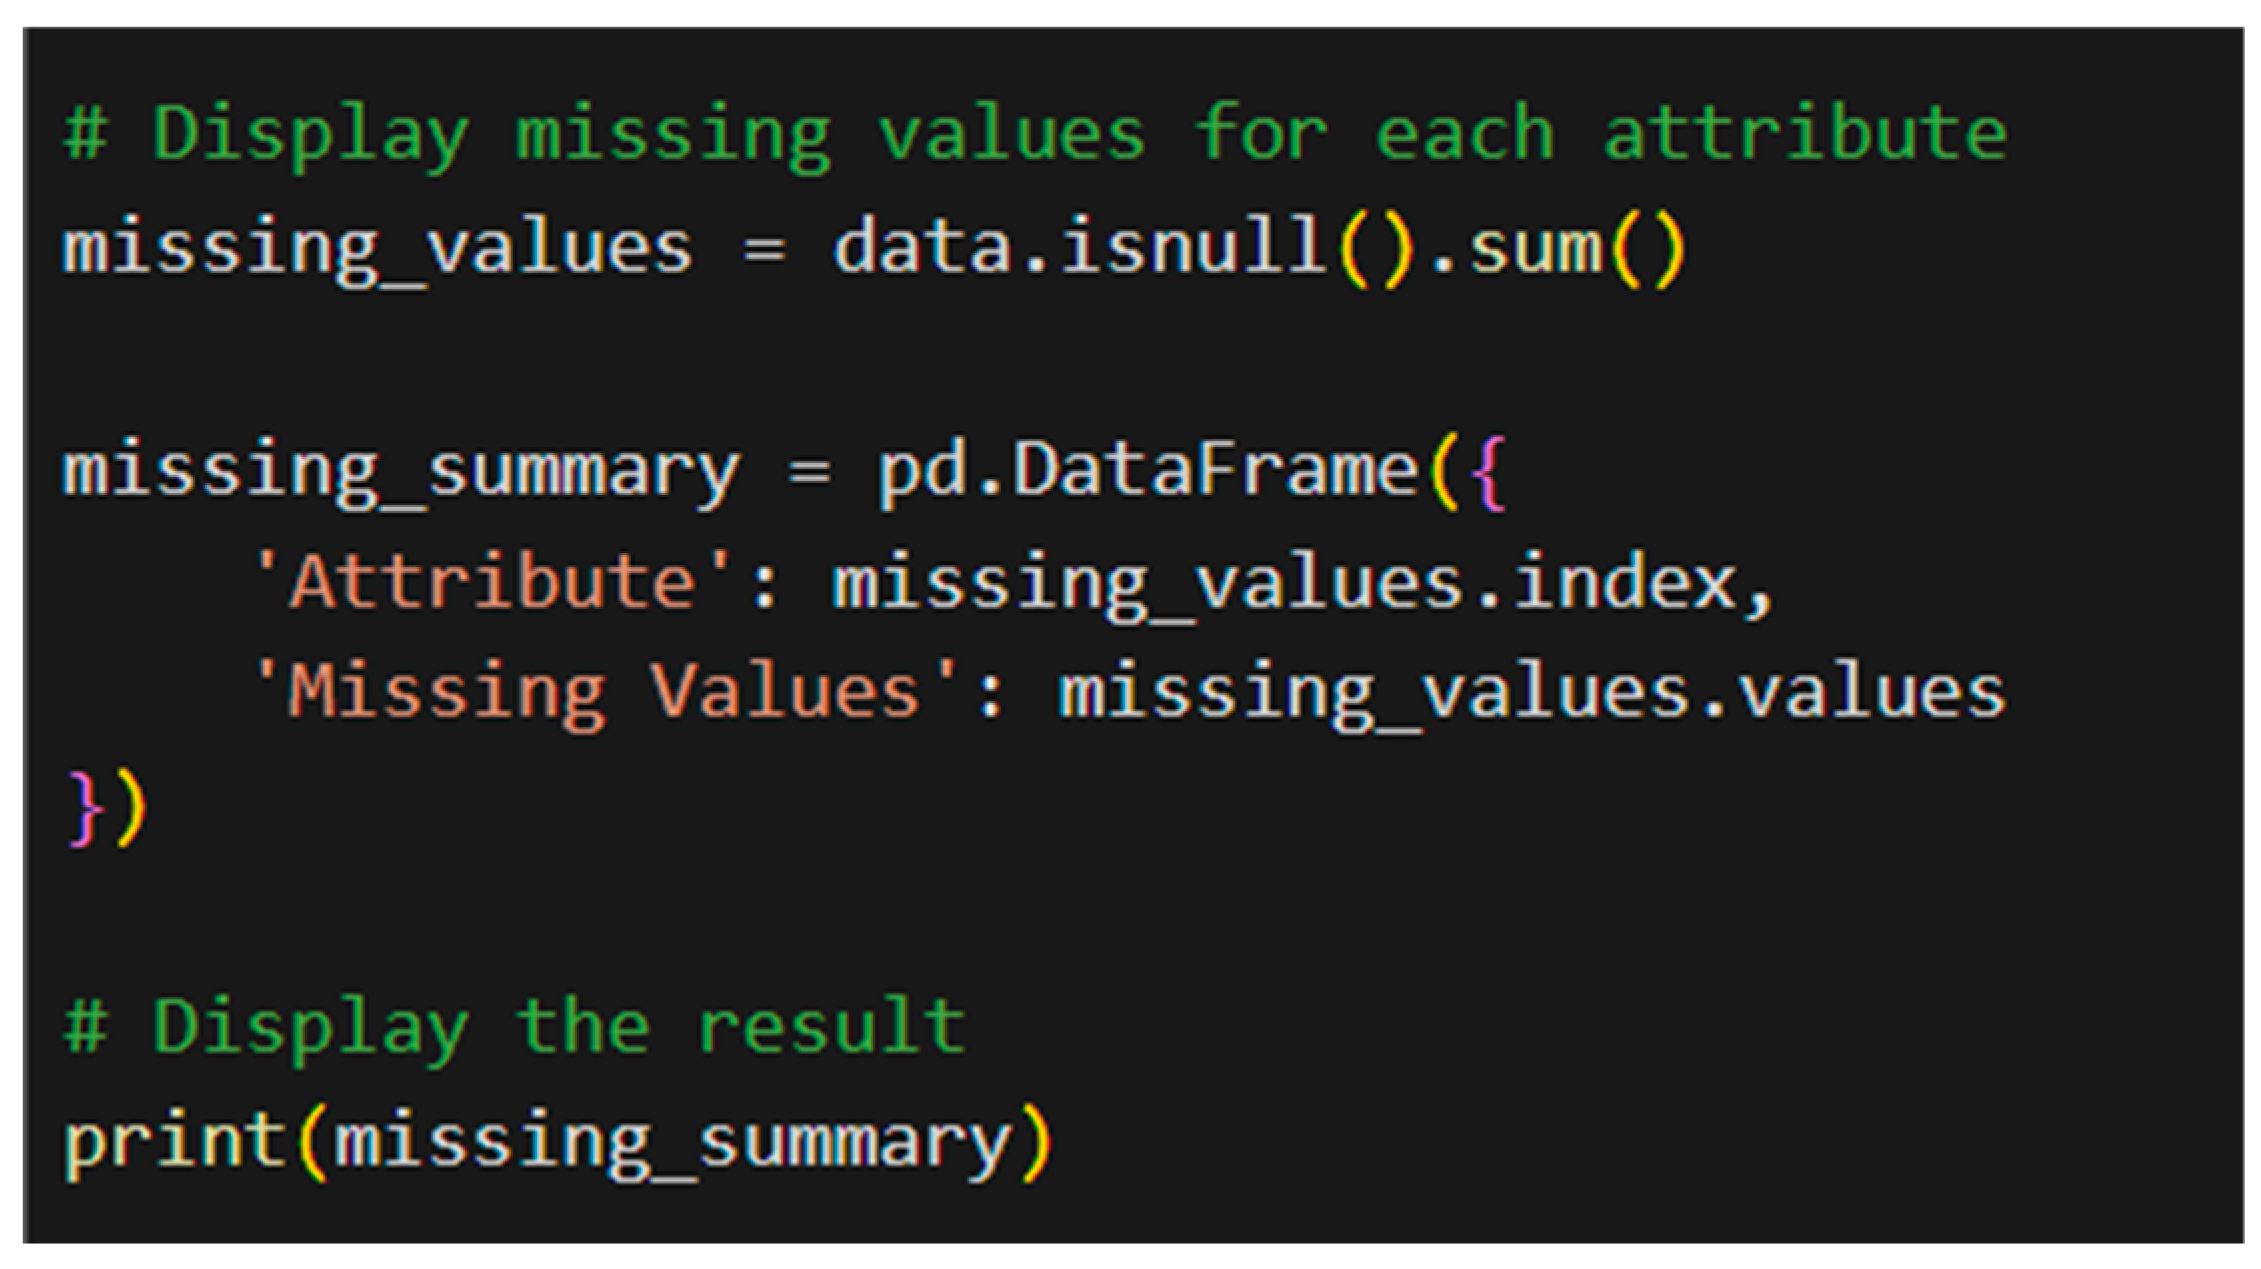
Figure 1.
7 – Python code to display missing values.
| Attributes | Missing Values |
| Date | 0 |
| Date Type | 0 |
| Age | 2 |
| Sex | 9 |
| Race | 57 |
| Ethnicity | 9416 |
| Residence City | 596 |
| Residence County | 1260 |
| Residence State | 1988 |
| Injury City | 178 |
| Injury County | 3334 |
| Injury State | 3029 |
| Injury Place | 358 |
| Description of Injury | 807 |
| Death City | 2784 |
| Death County | 3891 |
| Death State | 5108 |
| Location | 1349 |
| Location if Other | 10787 |
| Cause of Death | 0 |
| Manner of Death | 9 |
| Other Significant Conditions | 10782 |
| Heroin | 8403 |
| Heroin death certificate (DC) | 11241 |
| Cocaine | 7403 |
| Fentanyl | 3932 |
| Fentanyl Analogue | 11007 |
| Oxycodone | 10965 |
| Oxymorphone | 11819 |
| Ethanol | 8780 |
| Hydrocodone | 11812 |
| Benzodiazepine | 9264 |
| Methadone | 10903 |
| Meth/Amphetamine | 11854 |
| Amphet | 11550 |
| Tramad | 11679 |
| Hydromorphone | 11904 |
| Morphine (Not Heroin) | 11922 |
| Xylazine | 10903 |
| Gabapentin | 11512 |
| Opiate NOS | 11854 |
| Heroin/Morph/Codeine | 9779 |
| Other Opioid | 11759 |
| Any Opioid | 3034 |
| Other | 11195 |
| ResidenceCityGeo | 167 |
| InjuryCityGeo | 257 |
| DeathCityGeo | 1 |
To analyze the patterns of distribution of the dataset, the data.describe() method was utilized. This method returns a statistical overview of the dataset, providing vital information regarding its structure and features. It calculates descriptive statistics like count, mean, standard deviation, minimum, maximum, and quartile values. By default, data.describe() gives statistics for numerical attributes only—here, “Age”—because categorical variables do not provide measures like mean or standard deviation. This summary is also utilized in outlier or anomaly detection, as extremely high or low values are emphasized in the presence of unbalanced data.
To find out the shape of the distribution of the “Age” attribute, the data[‘Age’].skew() function was utilized. Skewness is utilized to find out whether the data is normally distributed or skewed. If the skewness is approximately 0, the distribution is normally distributed, while a positive or negative skewness means right and left skewness, respectively. The calculated skewness value of the “Age” attribute is 0.0519, which indicates the data is approximately normally distributed. Such a realization is essential in selecting relevant statistical models and preprocessing techniques to be used for further analysis.
4. Methodology
4.1. Data mining Technique
This method outlines the application of various data mining techniques for analysis of drug overdose cases involving drugs. This enables the identification of the most important patterns, risk factors, and harmful drug interactions that cause overdose occurrences. By the application of various analysis approaches, this technique yields comprehensive insights that can be applied to public health intervention and policy development.
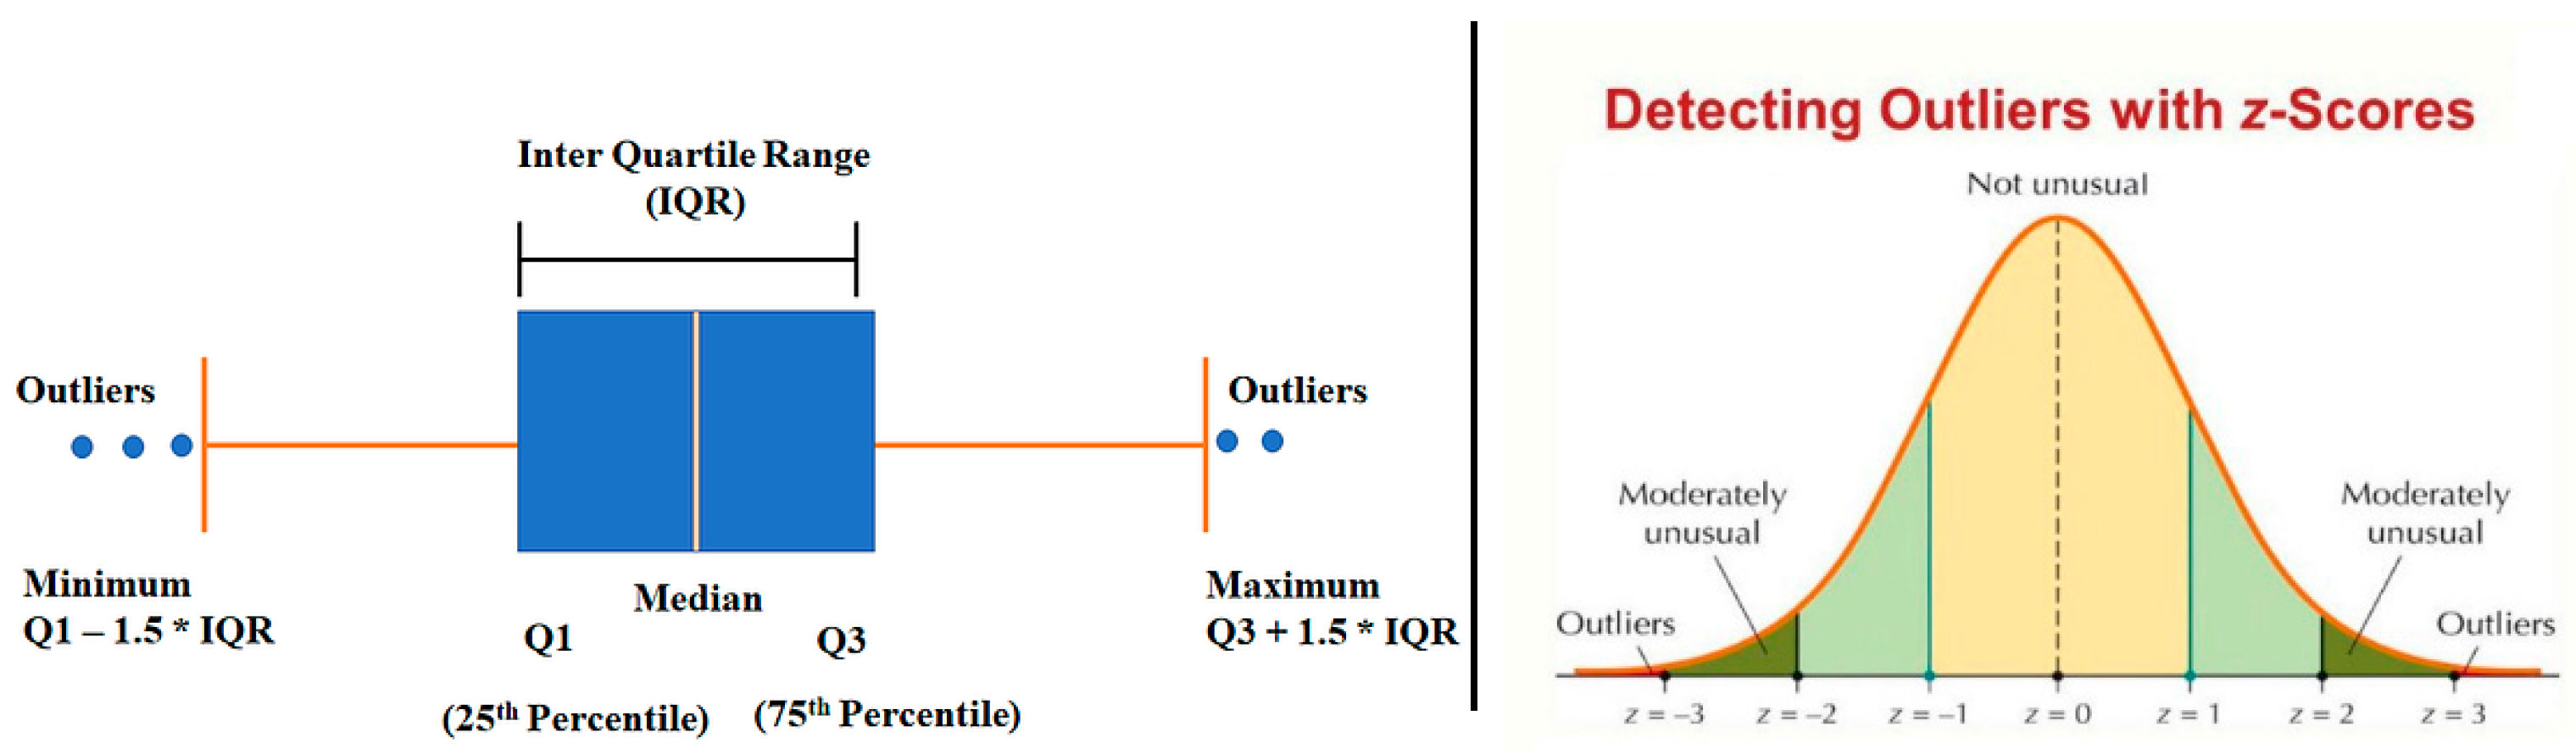
4.2. Outlier Detection
The initial target focuses on identifying the youngest and oldest ages of overdose victims using outlier detection techniques. Such individuals are statistically rare in these datasets and may thus be labeled as outliers. Boxplot analysis and the Z-score technique are the two significant methods used: the former provides a graphical visualization of the distribution of ages and indicates outliers beyond the interquartile range, whereas the latter measures the age values that are distant from the mean quantitatively. These hybrid techniques both visually and statistically present proof of anomalies and, therefore, can be helpful in the identification of outliers in the data.
Figure 2.
0 – Visual representation of Boxplot and Z-score Method.
4.3. Association Rule Mining
The second objective aims to identify the most frequent substances causing overdose deaths by association rule mining. Apriori or FP-Growth algorithm is applied to identify patterns and correlations between drugs in overdose cases. These methods are effective in identifying harmful combinations, such as fentanyl and heroin. The resulting clusters provide valuable information that can be utilized to assist health officials in policy formulation, prioritization of the rehabilitation services, and awareness programs targeting high-risk drugs.
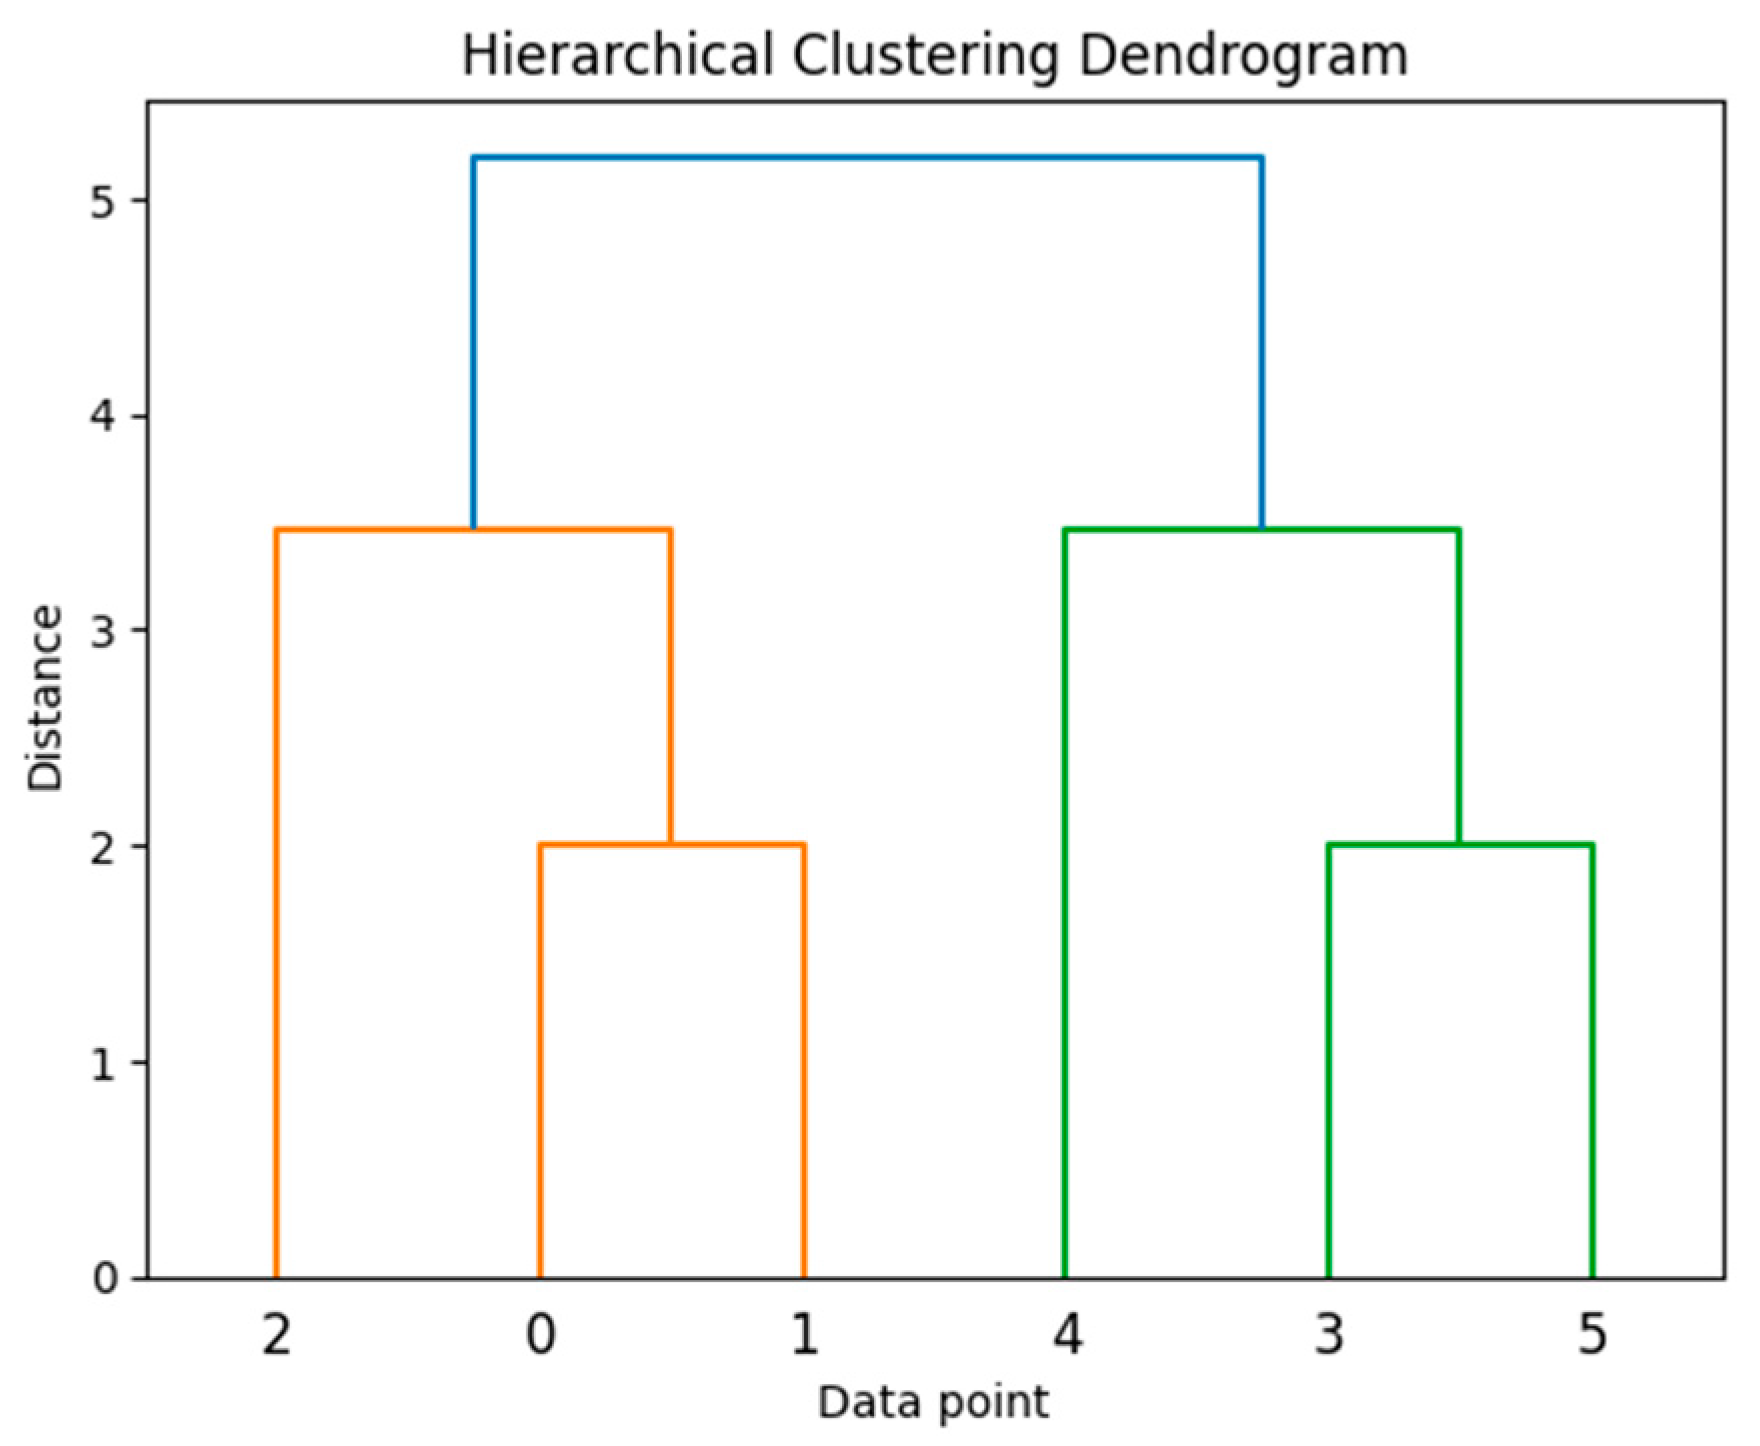
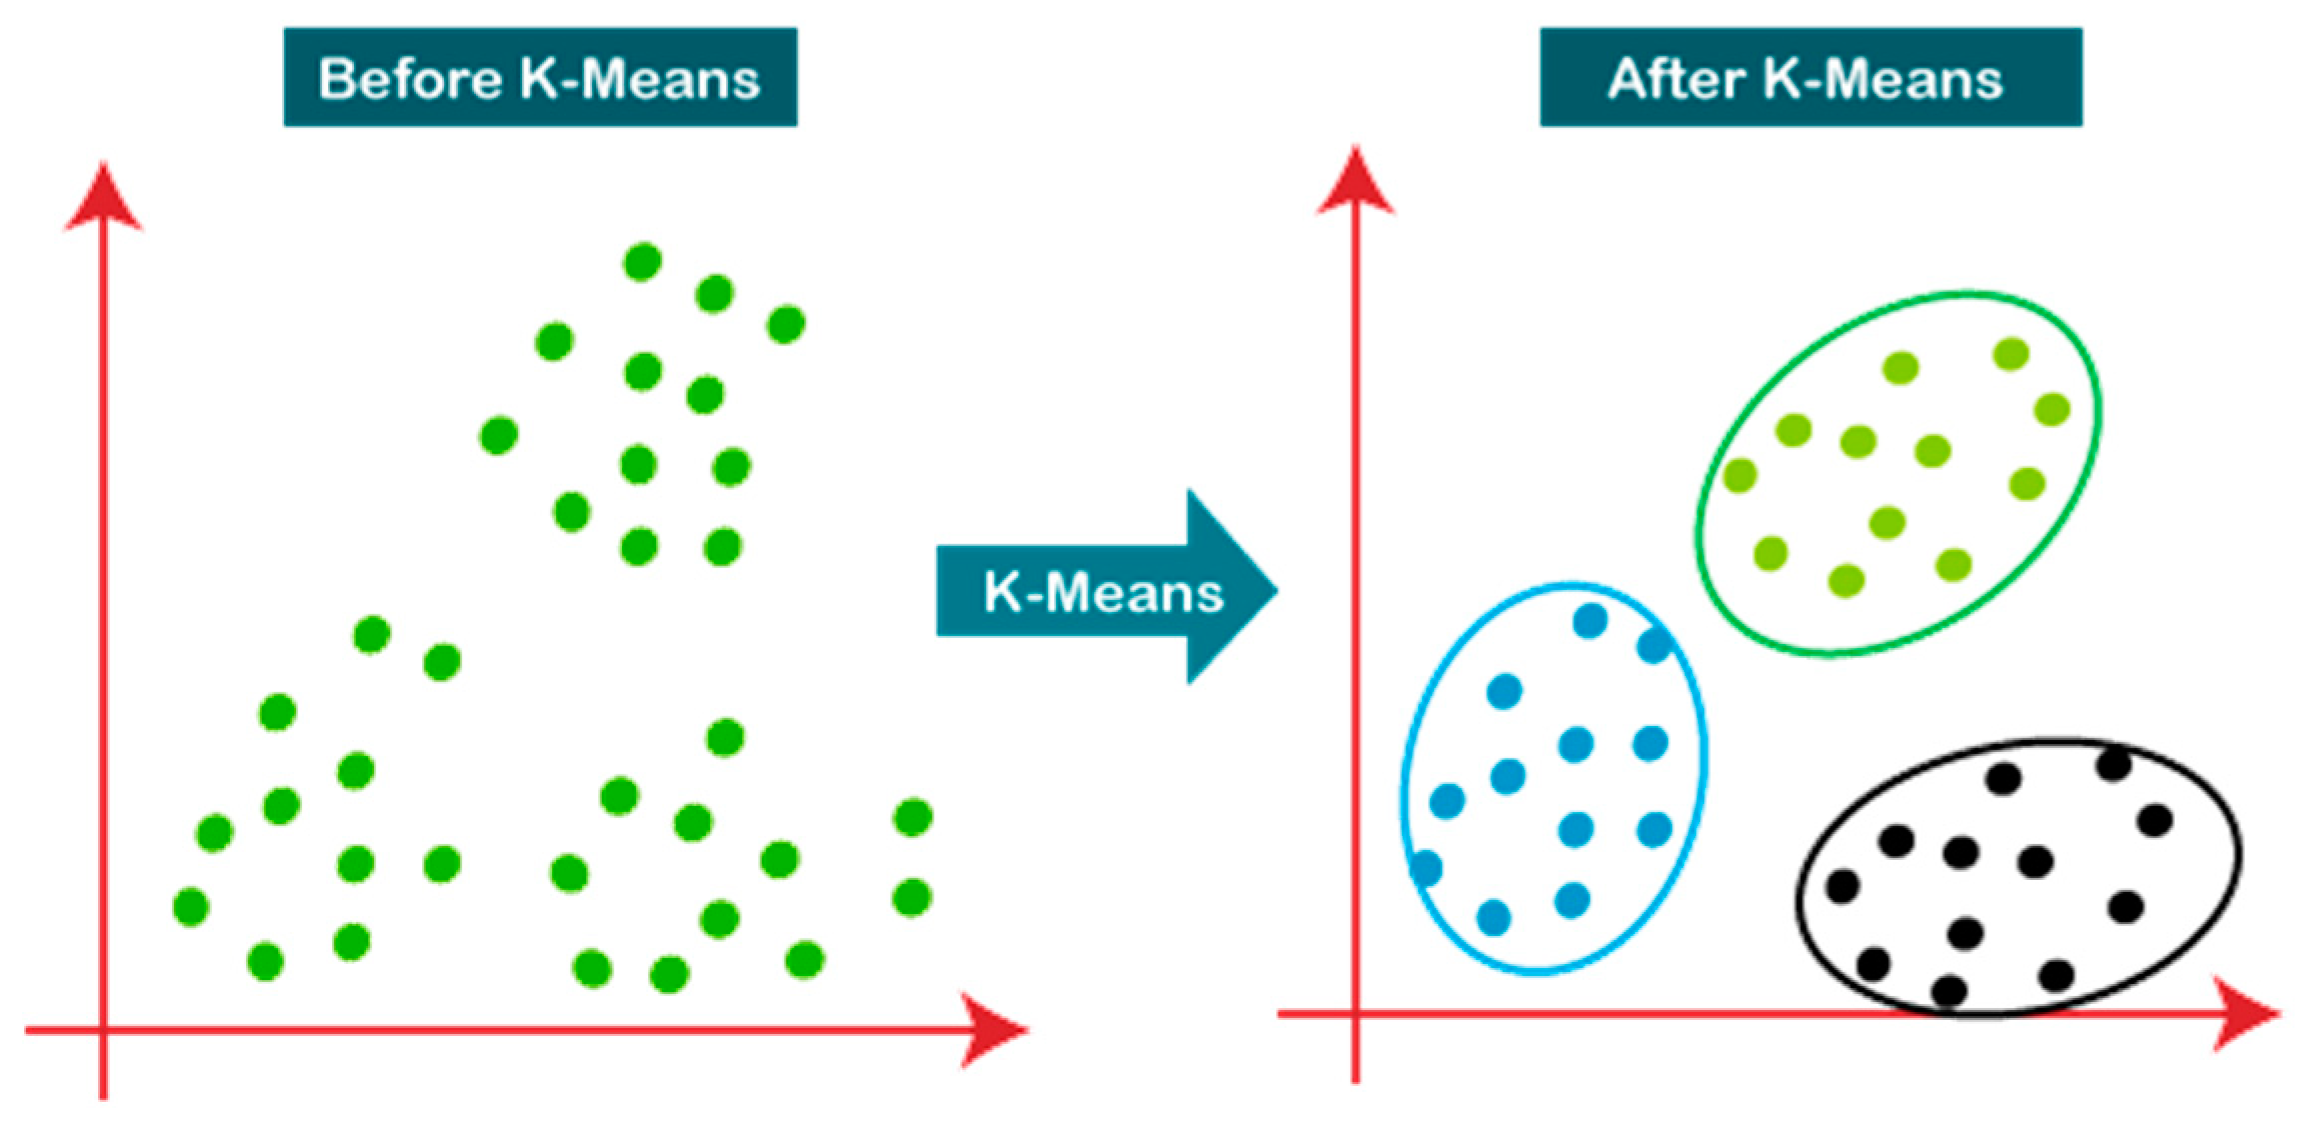
4.4. Clustering
In the third objective, the technique employs clustering algorithms to examine the variations in fentanyl, heroin, and cocaine consumption by age groups. Specifically, K-Means and Hierarchical Clustering algorithms are used to cluster individuals based on age and the drug taken. K-Means allows one to identify independent age-based groups with the same consumption patterns, while Hierarchical Clustering allows one to identify shifting trends and patterns over time. This analysis allows for planning targeted, age-specific interventions aimed at preventing drug abuse.
Figure 2.
1 – Visual representation of Hierarchical Clustering.
The fourth objective expands the use of clustering to identify neighborhoods with high rates of overdose events. K-Means clustering of geospatial data permits areas of high drug overdose rates to be mapped and clustered. This facilitates locating high-risk areas and directing focused public health interventions, strategic law enforcement, and the establishment of rehabilitation centers in areas of greatest need.
A key part of this process is data preprocessing, which ensures maximum data quality and relevance. The process involves several sub-processes. During data cleaning, irrelevant columns with high missing values, such as “Ethnicity” or “Cause of Death,” are eliminated, and missing values are handled accordingly. Duplicate records are eliminated, and columns are renamed or reshaped to be consistent. Data integration entails the application of correlation heatmaps to identify statistically important features of relationships between drug-related and demographic variables with a view to reducing redundancy. Lastly, data transformation comprises feature engineering, i.e., extracting geographic coordinates, and standardization, particularly of the “Age” column, to ensure consistent numerical input across all analyses.
Figure 2.
2 – Visual representation of K-Means Clustering.
Lastly, this methodology provides a systematic and effective drug-related overdose data analysis framework. Through the integration of outlier detection, association rule mining, clustering, and data preprocessing, the framework ensures proper and reliable data. These approaches integrated as a whole shed light on overdose trends, enabling stakeholders to develop well-informed evidence-based interventions for avoiding drug-related fatalities.
5. Implementation Of Data Preprocessing
Data preprocessing is a critical step in any data analysis workflow as it significantly enhances the quality and accuracy of data by removing problems such as faults, outliers, redundancies, and missing values. It further includes generating new features or knowledge that may contribute to improved analysis. It’s one of the main reasons why preprocessing is required, the way that it protects the integrity and usability of the dataset for the task at hand. Poor-quality data can result in biased outcomes, erroneous models, inefficient use of resources, and wasted time spent on corrections much later down the analysis pipeline (LinkedIn, 2024). By preparing and cleansing the dataset, preprocessing sets a strong foundation for good and explainable machine learning and artificial intelligence models.
5.1. Data Cleaning:
Dropping Columns and Handling Missing Values:
(i) Dropping columns:
Figure 2.
3 – Python code for dropping specific columns.
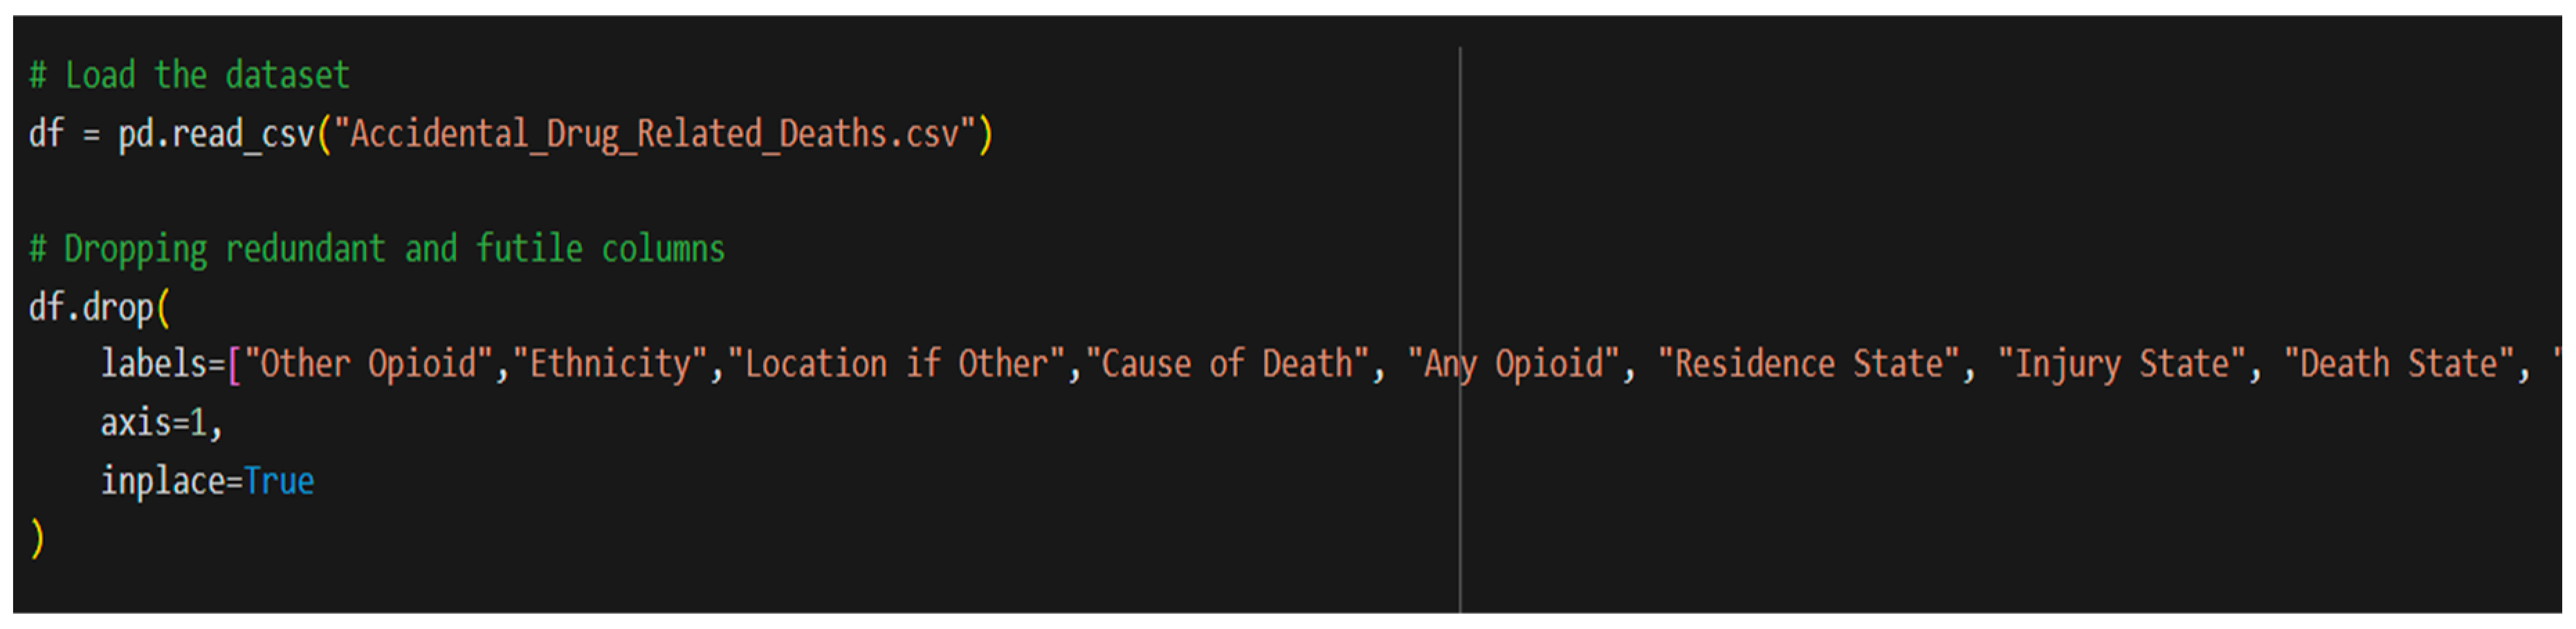
Removing particular columns from a dataset is usually done to get rid of redundant or unnecessary data that can make the analysis or model training process more difficult. Eliminating these columns can improve computational efficiency by drastically reducing the quantity of data that must be processed. From the dataset “Accidental_Drug_Related_Deaths.csv”, certain columns such “Ethnicity”, “Other opioid”, etc contained a lot of missing values and redundant data that had to be dealt with in order to reduce hindrance to the analysis.
Handling missing values:
Figure 2.
4 – Python code for handling missing values.
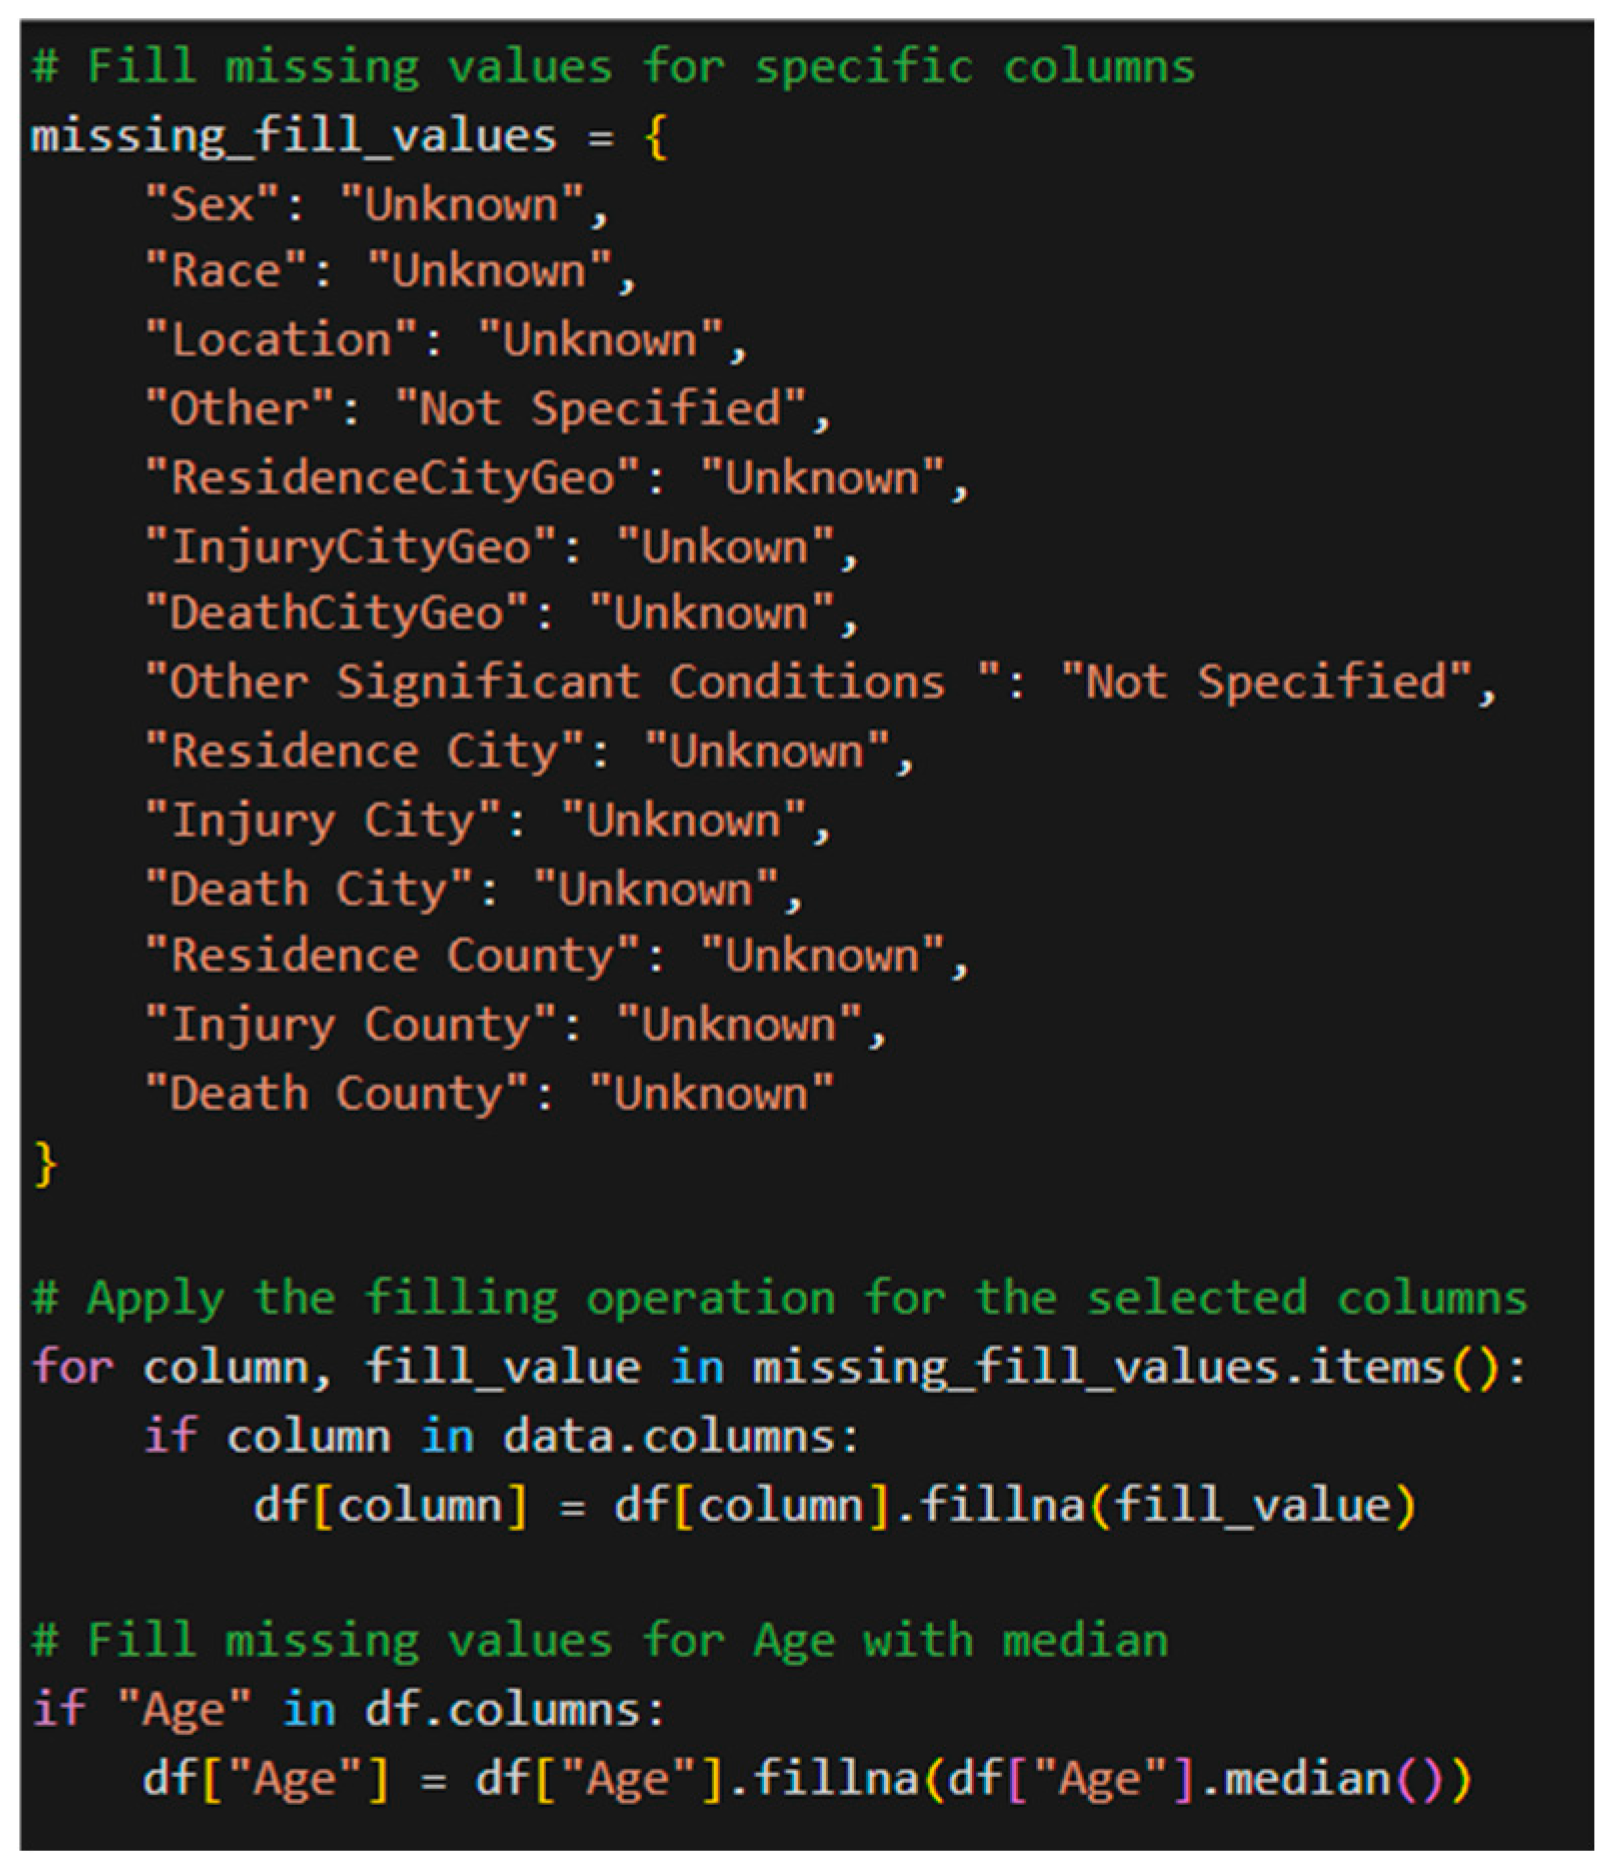
Missing data is feasible as a result of a variety of reasons, which range from human error in gathering the data to limitation in the methodologies of data collection[17,18,19]. Missing data is capable of undermining the accuracy and validity of statistical computation. Proper handling of missing values is required since most machine learning algorithms will stop functioning when the datasets contain missing values. Without addressing missing data, it can result in a biased machine learning model with false conclusions (Tamboli, 2021). Missing values in some columns were filled in with “Unknown” or “Not Specified,” but missing values in column “Age” were filled with the median. This is because the skewness of the “Age” column is nearly symmetric, and therefore the median is a well-balanced and suitable replacement that does not skew the dataset[20,21,22].
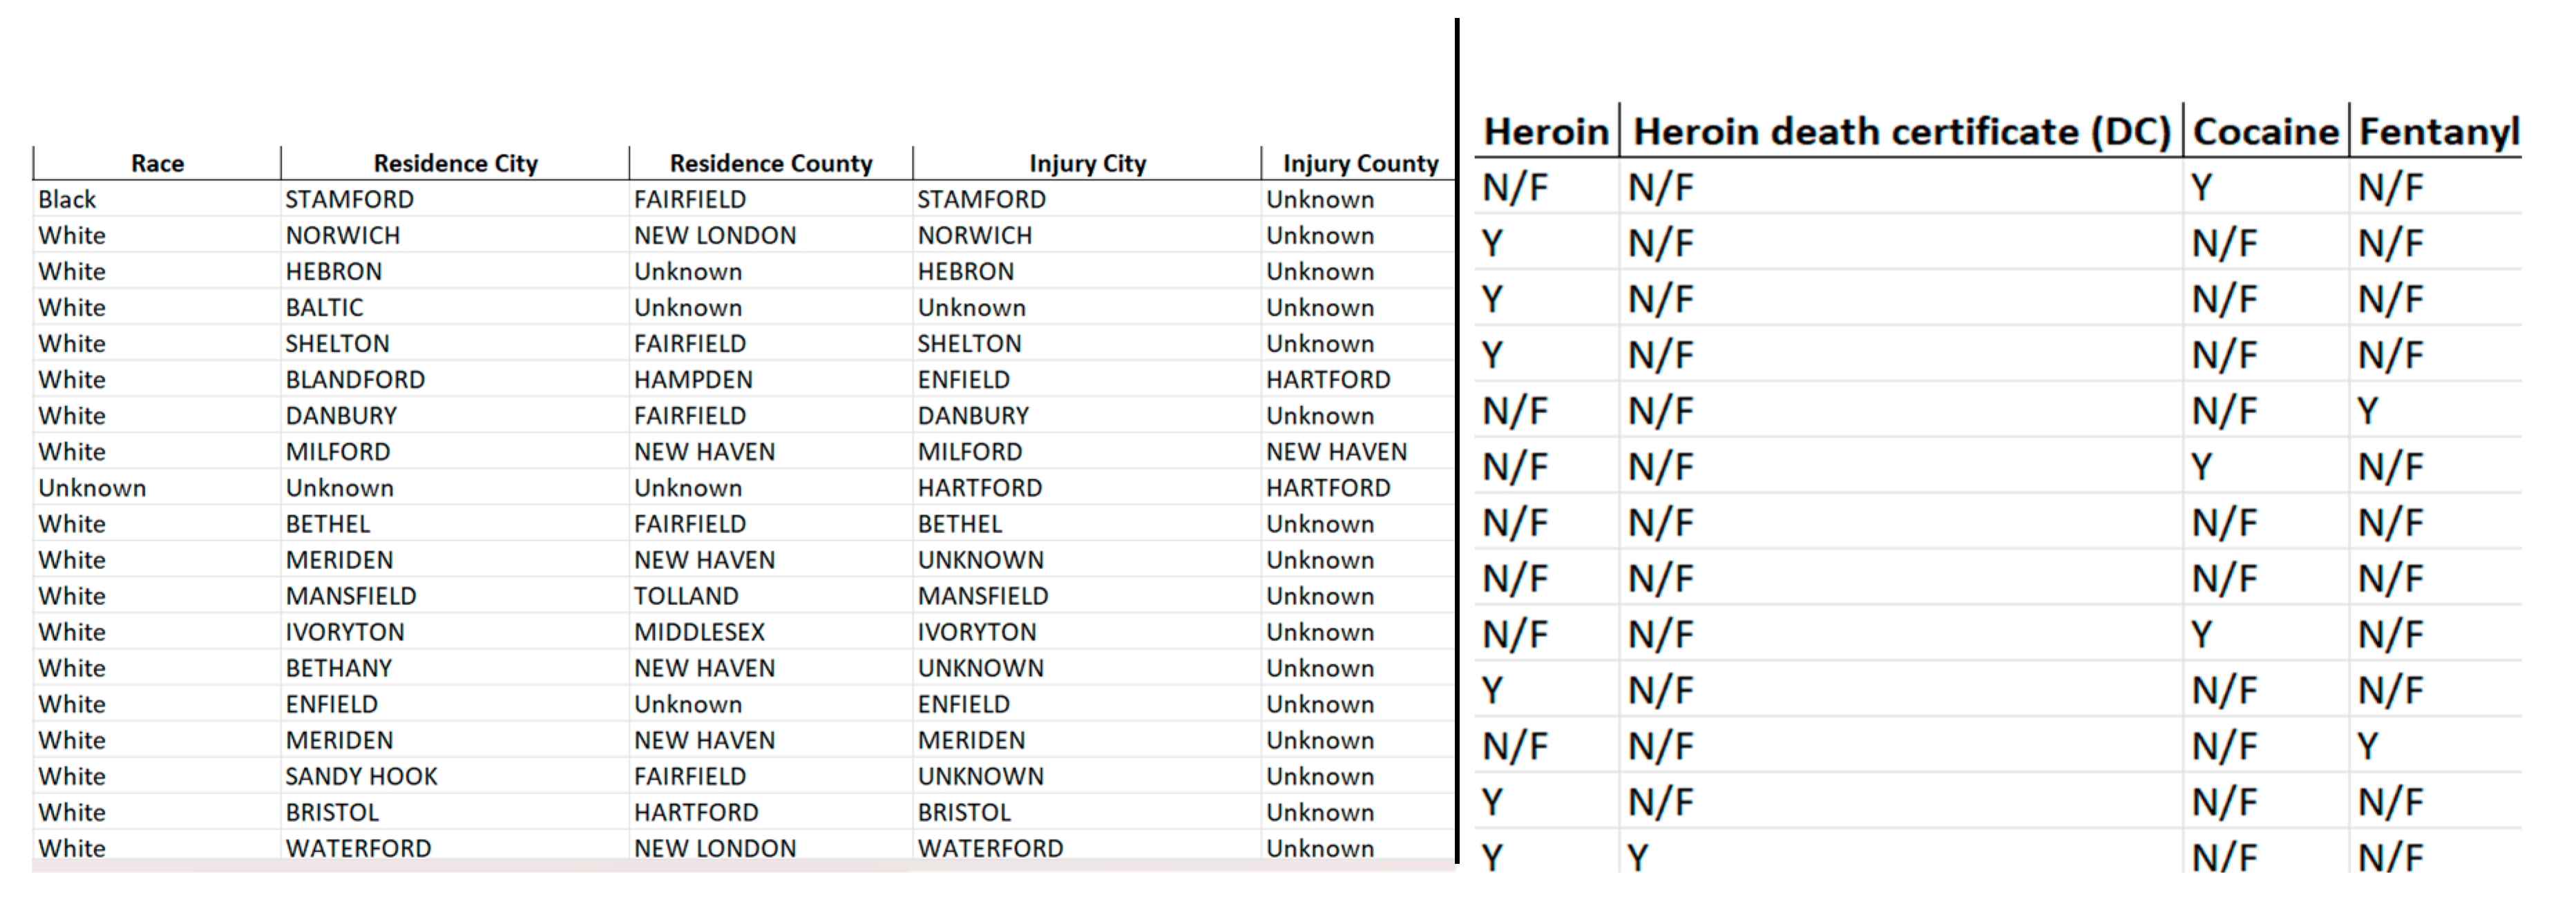
In the substance data, the missing values have been utilized in order to display that a given substance was not available. Missing cells were populated with “N/F” as a way to represent that the substance was lacking in the individual. This way, the information is consistent and complete and there is no disturbance caused by inconsistent and incomplete information.
5.2. Handling Duplicates
Duplicates in the dataset can lead to bias and redundancy, which can skew the analysis and model performance. Duplicates were identified using the duplicated() function, which was used to find and tally any duplicates in the rows. In the case of duplicates found, they would be examined and eliminated in order to provide a purer and more precise dataset. There were no duplicates present in the dataset in this case, which assured its accuracy and eliminated the risk of redundant duplication.
Figure 2.
6 Filled columns after handling missing values.
5.3. Removing Whitespaces
Whitespace in dataset entries leads to errors and discrepancies, especially when comparing values, conducting searches, or merging datasets. In order to eliminate this, regular expressions were applied to replace space characters used in row entries with underscores and remove multiple spaces used in column values[23,24,25]. This yields a cleaner and consistent dataset, which will be easier to compare and process data. Column renaming is one of the most important steps in making the dataset more usable and readable. For instance, the “Location” column has been renamed to “Death Place” to define the meaning of the column clearly. This step simplifies data interpretation and prevents misunderstandings, especially when big datasets are being used in collaborative research or machine learning[26,27,28].
5.3. Detecting Outliers
It is necessary to detect outliers since outliers can skew statistical analysis and create misleading results. The Interquartile Range (IQR) method was used to identify outliers in the “Age” column by calculating the IQR and creating lower and upper thresholds for determining values that fall beyond the expected range. Outliers, such as extremely young or old victims, were recorded, helping to delineate reliable data points from potential anomalies that would require further inspection.
5.4. Data Mapping
Data mapping is an essential preprocessing step which offers consistency and standardization in the dataset. Data mapping consists of resolving variable differences in categorical variables, normalizing inconsistent values, and renaming the columns for clarification. For example, the variations in the “Race” column, i.e., “Asian/Indian” and “Asian Indian,” were standardized to “Asian,” and both “Black” and “African American” were also subsumed under “Black.” Additionally, the “Death Place” column was standardized to “Decedent’s Home.” For number uniformity, missing values in drug details were imputed as 0 for no drug, while drug present was indicated by 1. Non-numerical values were made into integers for simplicity in analysis. These adjustments set the dataset for improved statistical modeling and pattern recognition[29,30,31].
Lastly, the code snippet in the “Description_of_Injury” column described how mapping was employed to normalize categories such that inconsistent descriptions are substituted with normalized labels such as “Reason Unknown” in case of no match or with fixed categories being applied to the descriptions of injuries based on the data available. Such preprocessing renders the dataset clean, formatted, and ready for efficient analysis[31].
5.5. Data Integration
Data integration is the activity of collecting data from disparate sources and realizing consistency between datasets. Among its crucial tasks is handling redundancy in order to improve data quality and minimize the noise that can disrupt analysis.
5.6. Redundancy Management using Correlation Heatmap
A correlation heatmap is a graphical representation that is employed to illustrate the direction and strength of relationships between variables. It represents correlation coefficients in each cell, with values ranging from -1 to 1. A value of 1.0 shows a perfect positive correlation—both variables rise together—while 0.0 shows no correlation, and -1.0 shows a perfect negative correlation—one rises while the other falls. The heatmap helps to identify relationships and patterns in the data and can be used in data summarization as well as a diagnostic tool for more sophisticated analyses.
Diagonal 1.0 values in the correlation heatmap reflect perfect self-correlation. Dark red colors represent strong positive correlations, and dark blue colors represent strong or weak correlations. Of particular interest is strong correlation (0.67) between Heroin and Heroin/Morph/Codeine, which implies that they have a tendency to co-occur. A moderate negative correlation (0.39) between Heroin and heroin-related death certificates reflects the drug’s frequent involvement in overdose fatalities. Cocaine and Fentanyl, however, have a weak negative correlation (-0.15), which reflects a weaker correlation between their occurrences.

5.7. Data Transformation
Feature engineering is the method of creating new variables from existing ones to enhance model performance. Regular expressions are used here to extract latitude and longitude from the ResidenceCityGeo, InjuryCityGeo, and DeathCityGeo columns. These are stored in new columns to facilitate spatial analysis of drug overdose deaths. The process entails handling missing data by making “Unknown” records without geographic data and extracting coordinates where present. This conversion is required for regional trend analysis, refining geolocation-based forecasts, and enabling better data visualization. The dataset is processed and stored for future analysis.
5.8. Standardize “Age” Column
Standardizing the Age column is important to ensure uniformity in numeric data and integrity of the model with accurate figures. It converts the figures in every row in the column to mean 0 and standard deviation 1. Initially, the Age column is converted into numeric format and non-numeric entries replaced with NaN. Missing values are filled with the most common entry (mode) for dataset integrity. The normalized values are then calculated using sklearn’s StandardScaler and inserted into a new column named Standardized_Age without altering the original data. It helps to minimize bias, improve computational speed, and render data easier to interpret for subsequent analysis.
5.9. Data Visualization and Interpretation
Data visualization aids in revealing patterns, insights, and trends not easily seen in raw data sets. This section of the work compares visualizations from the raw data set (“Accidental_Drug_Related_Deaths.csv”) with visualizations from the preprocessed data set (“Final_Accidental_Drug_Deaths.xlsx”), and highlights the benefit of preprocessing.

5.10. Identifying the Youngest and Oldest Victims of Overdose Cases
Before preprocessing, a boxplot was used to see the age distribution and identify outliers. A histogram after preprocessing revealed a more accurate distribution by removing anomalies. The raw data contained one significant outlier (age 87) and some minor anomalies. The cleaned histogram clarified that most overdose victims were between the ages of 40 and 50 years, suggesting middle-aged individuals are most vulnerable. The cleaned data also showed that overdoses in individuals younger than 20 and older than 70 are rare but do occur, highlighting the need for age-inclusive intervention strategies.
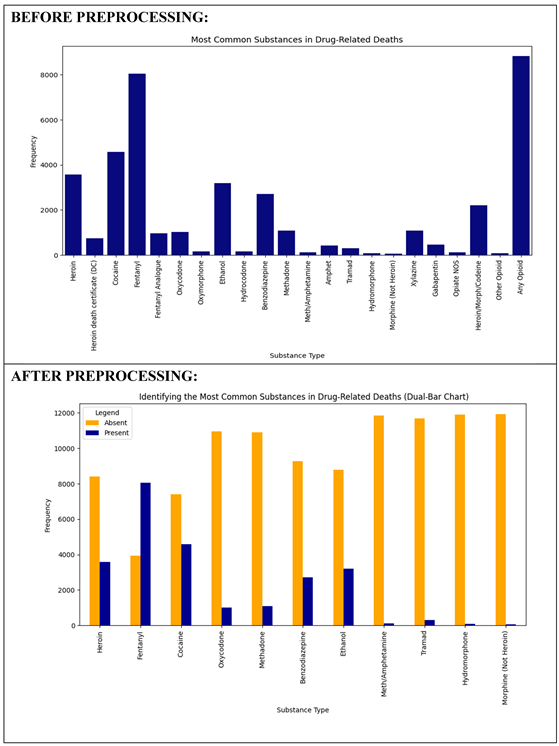
(2) Identifying the Most Common Substances in Drug-Related Deaths
A bar plot of the raw data revealed high frequencies of drugs such as Fentanyl, Heroin, and Cocaine. This plot was tainted by redundant or missing values, however. A dual-bar plot with binary encoding (1 for presence, 0 for absence) following preprocessing gave a clearer visualization of drug frequencies. It reaffirmed that Fentanyl is the most common substance in overdose deaths, followed by Heroin and Cocaine. Prescription drugs like Oxycodone and Benzodiazepines were less common but still figured in many cases.
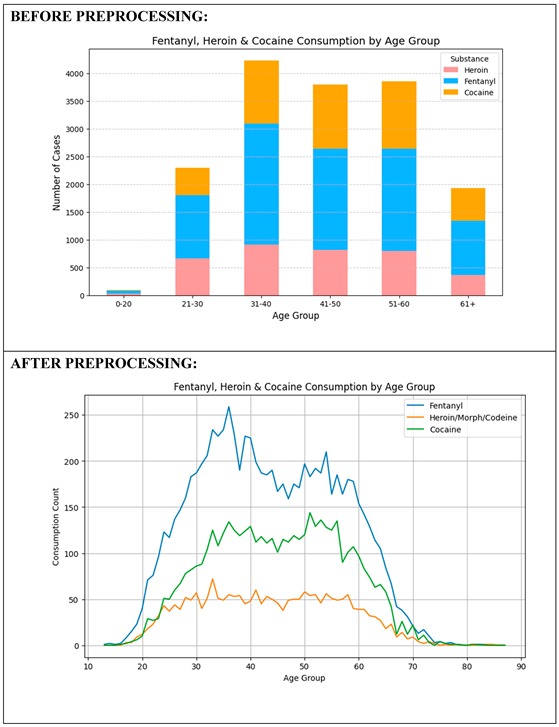
(3) Fentanyl, Heroin & Cocaine Use by Age Group
Before data cleaning, a stacked bar chart had shown that overdose cases were most common in the age bracket 31–60, although discrepancies in age records affected relative reliability. After preprocessing, a line chart provided a better idea of the consumption of substances across age groups. The trend confirmed drug use peaking at the 30-50 age bracket and declining after 60. Fentanyl topped drug use at every age bracket, followed by Heroin and Cocaine, which were popular among young adults. The trend shows that preventing drugs should be targeted towards middle-aged groups.
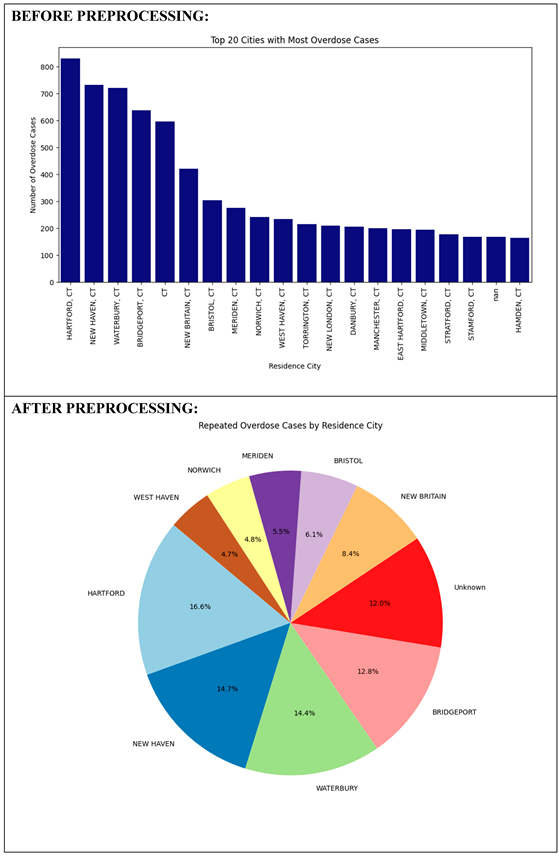
(4) Analysis of Repeated Overdose Cases from Residence Locations
Next, a bar graph with the “Residence City” column revealed the top 20 most populated cities with the greatest number of overdose cases. However, inconsistencies such as missing values and invalid entries like “CT” affected interpretation. After preprocessing, a pie graph gave a general idea of the percentage of overdose cases by city. It further showed clearer geographic spread with even 12% of the information still placed in “Unknown.” The picture reemphasized the relevance of better geography marking to map out high-risk areas and make intervention more geographically targeted.
(4) Examining Repeated Overdose Cases from Residence Locations:
6. Ethical Considerations in Data Mining
Algorithmic discrimination and discriminatory trends pose serious ethical concerns in data mining. Trained in biased data, models can not only reflect but also reinforce systemic prejudice. For example, historical prejudices in drug-related information might lead algorithms to over-identify individuals from marginalized groups as at risk. To be fair and avoid reinforcing these prejudices, researchers must critically evaluate and adjust their models to that effect. The second key concern is data provenance and ownership rights. Questions of who really owns the data and if and when individuals should be responsible for how their demographic or medical data is used in future research arise. Ethical standards must allow individuals to make informed decisions about whether or not their data can be sent, sold, or reused for purposes beyond its initial collection. The future misuse of data by subsequent AI models is also becoming an increasing worry. Data mined today may later find application in ways never envisaged, for example, for automated profiling by law enforcement or discriminatory recruitment. Ethical data mining needs to factor in how datasets can be future proofed to protect against this kind of misuse.
Additionally, frequent demands for personal data by tracking systems, surveys, and feedback forms can lead to data fatigue. In the long term, individuals may begin providing incorrect information or feel compelled to respond. Ethical data practice must avoid excessive data demands and respect individuals’ autonomy and volition to provide.
Predictive analytics, powerful as it is, can have unintended consequences. If used in areas such as law enforcement, insurance, or healthcare, predictive models can falsely label individuals as “high-risk,” resulting in unjust denial of service or unwarranted attention. Ethical concerns, in response, must ensure that such systems have human oversight and error-reducing safeguards built in. Finally, even as big businesses are poised to gain from insights generated by data mining, small businesses and local communities may remain underserved or overlooked. Data mining, for ethical reasons, needs to strive to democratize access to insights in a way that data benefits are not monopolized by powerful stakeholders but shared in a manner that fosters overall economic and social equity.
7. Conclusion
The comprehensive method adopted in the current study includes merging different stages of data transformation, preparation, and visualization to support, reliable, and meaningful analysis of unintentional drug-related death. From the consolidation of data, redundancy was adequately addressed through the use of a correlation heatmap that resulted in the identification of highly correlated variables and overlap potential within the data. Besides eliminating noise, the process enhanced the quality of subsequent analyses by eliminating duplicated or duplicate attributes. At the data transformation phase, processes like feature engineering and standardization were applied in order to refine the dataset even further. Spatial analysis at more detailed levels was enabled through data extraction of geolocation data, while making the “Age” column standardized meant consistent scaling with bias eliminated, greatly improving the performance and readability of models. Finally, visualization and interpretation involved gaining extensive information on patterns and trends associated with drug overdose episodes. Through a series of comparative visualizations—pre and post-preprocessing—more accurate and improved representations of age distribution, drug use, drug use by age groups, and geographical impact were achieved. For instance, Fentanyl, Heroin, and Cocaine were consistently the most prominent drugs in overdose cases. Moreover, middle-aged individuals (30-50 years) were found to be the highest-risk population, and city-wise distribution showed risk city areas where interventions can be targeted. Overall, the structured and multi-tiered methodological framework not only improved data interpretability and quality but also facilitated evidence-based decision-making by providing crucial public health results. The framework is replicable, stable, and robust to be applied to future similar studies on mortality analysis, substance abuse patterns, and geo-spatial public health evaluation.
References
- Hedegaard, H., Miniño, A., & Warner, M. (2020). Drug overdose deaths in the United States, 1999–2018: Key findings from the National Vital Statistics System, Mortality (Data Brief No. 356). Centers for Disease Control and Prevention. https://www.cdc.gov/nchs/data/databriefs/db356-h.pdf.
- Coast to Forest. (2023, February 21). Cocaine fact sheet. https://c2f.oregonstate.edu/understand/fact-sheets/cocaine.
- National Institute on Drug Abuse. (2021, June 1). Fentanyl drug facts. National Institutes of Health. https://nida.nih.gov/publications/drugfacts/fentanyl.
- LinkedIn. (2024). What is the importance of data preprocessing in machine learning? https://www.linkedin.com/advice/3/what-importance-data-preprocessing-machine-learning-6ompe.
- Tamboli, N. (2021, October). Tackling missing value in dataset. Analytics Vidhya. https://www.analyticsvidhya.com/blog/2021/10/handling-missing-value/.
- Monnat, S. M. (2023). Demographic and geographic variation in fatal drug overdoses in the United States, 1999–2020. Population and Development Review. https://pmc.ncbi.nlm.nih.gov/articles/PMC10292656/.
- Saeed, S., Abdullah, A., Jhanjhi, N. Z., Naqvi, M., & Nayyar, A. (2022). New techniques for efficiently k-NN algorithm for brain tumor detection. Multimedia Tools and Applications, 81(13), 18595–18616.
- Dogra, V., Singh, A., Verma, S., Kavita, Jhanjhi, N. Z., & Talib, M. N. (2021). Analyzing DistilBERT for sentiment classification of banking financial news. In S. L. Peng, S. Y. Hsieh, S. Gopalakrishnan, & B. Duraisamy (Eds.), Intelligent computing and innovation on data science (Vol. 248, pp. 665–675). Springer. [CrossRef]
- Gopi, R., Sathiyamoorthi, V., Selvakumar, S., et al. (2022). Enhanced method of ANN based model for detection of DDoS attacks on multimedia Internet of Things. Multimedia Tools and Applications, 81(36), 26739–26757. [CrossRef]
- Chesti, I. A., Humayun, M., Sama, N. U., & Jhanjhi, N. Z. (2020, October). Evolution, mitigation, and prevention of ransomware. In 2020 2nd International Conference on Computer and Information Sciences (ICCIS) (pp. 1–6). IEEE.
- Alkinani, M. H., Almazroi, A. A., Jhanjhi, N. Z., & Khan, N. A. (2021). 5G and IoT based reporting and accident detection (RAD) system to deliver first aid box using unmanned aerial vehicle. Sensors, 21(20), 6905.
- Babbar, H., Rani, S., Masud, M., Verma, S., Anand, D., & Jhanjhi, N. (2021). Load balancing algorithm for migrating switches in software-defined vehicular networks. Computational Materials and Continua, 67(1), 1301–1316.
- O’Donnell, J. K., Gladden, R. M., & Seth, P. (2017). Trends in deaths involving heroin and synthetic opioids excluding methadone, and law enforcement drug product reports, by census region — United States, 2006–2015. Morbidity and Mortality Weekly Report, 66(34), 897–903. [CrossRef]
- Hedegaard, H., Miniño, A. M., & Warner, M. (2020). Drug overdose deaths in the United States, 1999–2019 (NCHS Data Brief No. 394). National Center for Health Statistics. https://www.cdc.gov/nchs/data/databriefs/db394-h.pdf.
- National Institute on Drug Abuse. (2021). Overdose death rates. National Institutes of Health. https://www.drugabuse.gov/drug-topics/trends-statistics/overdose-death-rates.
- Centers for Disease Control and Prevention. (2021). Understanding the epidemic. https://www.cdc.gov/drugoverdose/epidemic/index.html.
- Srinivasan, K., Garg, L., Chen, B. Y., Alaboudi, A. A., Jhanjhi, N. Z., Chang, C. T., ... & Deepa, N. (2021). Expert System for Stable Power Generation Prediction in Microbial Fuel Cell. Intelligent Automation & Soft Computing, 30(1).
- Javed, D., Jhanjhi, N. Z., & Khan, N. A. (2023, July). Explainable Twitter bot detection model for limited features. In IET Conference Proceedings CP837 (Vol. 2023, No. 11, pp. 476-481). Stevenage, UK: The Institution of Engineering and Technology.
- Humayun, M., Jhanjhi, N. Z., Alsayat, A., & Ponnusamy, V. (2021). Internet of things and ransomware: Evolution, mitigation and prevention. Egyptian Informatics Journal, 22(1), 105-117.
- Humayun, M., Sujatha, R., Almuayqil, S. N., & Jhanjhi, N. Z. (2022, June). A transfer learning approach with a convolutional neural network for the classification of lung carcinoma. In Healthcare (Vol. 10, No. 6, p. 1058). MDPI.
- Kumar, A., Kumar, M., Verma, S., Kavita, Jhanjhi, N. Z., & Ghoniem, R. M. (2022). Vbswp-CeaH: vigorous buyer-seller watermarking protocol without trusted certificate authority for copyright Protection in cloud environment through additive homomorphism. Symmetry, 14(11), 2441.
- Sindiramutty, S. R., Jhanjhi, N. Z., Tan, C. E., Lau, S. P., Muniandy, L., Gharib, A. H., ... & Murugesan, R. K. (2024). Industry 4.0: Future Trends and Research Directions. Convergence of Industry 4.0 and Supply Chain Sustainability, 342-405.
- Javed, D., Jhanjhi, N. Z., Khan, N. A., Ray, S. K., Al Mazroa, A., Ashfaq, F., & Das, S. R. (2024). Towards the future of bot detection: A comprehensive taxonomical review and challenges on Twitter/X. Computer Networks, 254, 110808.
- Das, S. R., Jhanjhi, N. Z., Asirvatham, D., Ashfaq, F., & Abdulhussain, Z. N. (2023, February). Proposing a model to enhance the IoMT-based EHR storage system security. In International Conference on Mathematical Modeling and Computational Science (pp. 503-512). Singapore: Springer Nature Singapore.
- Faisal, A., Jhanjhi, N. Z., Ashraf, H., Ray, S. K., & Ashfaq, F. (2025). A Comprehensive Review of Machine Learning Models: Principles, Applications, and Optimal Model Selection. Authorea Preprints.
- JingXuan, C., Tayyab, M., Muzammal, S. M., Jhanjhi, N. Z., Ray, S. K., & Ashfaq, F. (2024, November). Integrating AI with Robotic Process Automation (RPA): Advancing Intelligent Automation Systems. In 2024 IEEE 29th Asia Pacific Conference on Communications (APCC) (pp. 259-265). IEEE.
- Alshudukhi, K. S., Ashfaq, F., Jhanjhi, N., & Humayun, M. (2024). Blockchain-Enabled Federated Learning for Longitudinal Emergency Care. IEEE Access.
- Akila, D., Raja, S. R., Revathi, M., Ashfaq, F., & Khan, A. A. (2024, July). Text Clustering on CCSI System using Canopy and K-Means Algorithm. In 2024 International Conference on Emerging Trends in Networks and Computer Communications (ETNCC) (pp. 1-6). IEEE.
- Akila, D., Raja, S. R., Revathi, M., Ashfaq, F., & Khan, A. A. (2024, July). Text Clustering on CCSI System using Canopy and K-Means Algorithm. In 2024 International Conference on Emerging Trends in Networks and Computer Communications (ETNCC) (pp. 1-6). IEEE.
- Javed, D., Jhanjhi, N. Z., Ashfaq, F., Khan, N. A., Das, S. R., & Singh, S. (2024, July). Student Performance Analysis to Identify the Students at Risk of Failure. In 2024 International Conference on Emerging Trends in Networks and Computer Communications (ETNCC) (pp. 1-6). IEEE.
- Bora, P. S., Sharma, S., Batra, I., Malik, A., & Ashfaq, F. (2024, July). Identification and Classification of Rare Medicinal Plants. In 2024 International Conference on Emerging Trends in Networks and Computer Communications (ETNCC) (pp. 1-6). IEEE.
Disclaimer/Publisher’s Note: The statements, opinions and data contained in all publications are solely those of the individual author(s) and contributor(s) and not of MDPI and/or the editor(s). MDPI and/or the editor(s) disclaim responsibility for any injury to people or property resulting from any ideas, methods, instructions or products referred to in the content. |
© 2025 by the authors. Licensee MDPI, Basel, Switzerland. This article is an open access article distributed under the terms and conditions of the Creative Commons Attribution (CC BY) license (http://creativecommons.org/licenses/by/4.0/).
Copyright: This open access article is published under a Creative Commons CC BY 4.0 license, which permit the free download, distribution, and reuse, provided that the author and preprint are cited in any reuse.


