
Submitted:
01 September 2025
Posted:
03 September 2025
You are already at the latest version
Abstract
In this study, Density Functional Theory (DFT) with Hubbard U correction calculations (DFT+U) were used to examine the ferromagnetic properties of HoM2 Laves phases (M = {Al, Ni}) under external hydrostatic pressure from 0 GPa to 1.0 GPa. The resulting net magnetic moments of 8.61 µB (HoAl2) and 8.12 µB (HoNi2) align with values reported in experiments. Additionally, for both alloys, the ferromagnetic behavior remains unchanged under applied pressures from 0 GPa to 1.0 GPa. The study also confirms that the magnetic properties of the alloys are mainly influenced by the 4f electrons; 3d electrons have a slightly more significant role in HoNi2 Laves phases com-pared to HoAl2. The contribution of electrons in d and f orbitals to the net magnetic moment of each Laves phase alloy within the specified pressure range was examined. Furthermore, the crys-tal geometry optimization and electronic specific heat coefficient were calculated as functions of applied pressures up to 1.0 GPa for both ferromagnetically ordered Laves phases.
Keywords:
HoNi2 and HoAl2 Laves phases
; Density Functional Theory (DFT)
; Hubbard U correction calculations (DFT+U)
; hydrostatic pressure effect on magnetic properties
1. Introduction
Experimental and theoretical research in the field of magnetocaloric-based cooling has grown over the past 25 years due to the higher energy efficiency and environmentally friendly nature of this cooling technology compared to the conventional one based on the expansion and compression of gases [1,2,3,4,5,6]. In the last few years, the interest in developing magnetic refrigerators for hydrogen liquefaction has encouraged important efforts to find, synthesize, and assess the magnetocaloric response of many families of rare earth (R) based alloys due to the significant magnetocaloric response of many compounds below the precooled reference temperature of 77 K [7,8,9]. Among all the alloy systems investigated, the cubic Laves phases in the RM2 systems with M = {Al, Ni} stand out due to the remarkable magnetocaloric properties, especially for the heavy R elements as Ho, and Er [6,7,8,9,10].
Density functional theory (DFT) is a fundamental computational method in materials science, providing atomistic insights into crystals and molecules. By resolving a material’s electronic structure, it enables the investigation and prediction of structure–property relationships and the underlying physicochemical phenomena in solids [11,12,13,14,15]. These compounds crystallize into the MgCu2-type structure (C15, space group: Fd–3m) [10], with a lattice parameter of 7.810 Å for HoAl2 and 7.130 Å for HoNi2 [16,17], and show Weiss-Curie temperatures TC of 29 K and 13.4 K, respectively [18,19]. Two lattice-related characteristics of Laves phases (AB2) are that the relationship between the atomic radii of A and B atoms is between 1.05 and 1.68, and that for an atomic radius ratio (rA/rB) of 1.225, the crystal structures have a higher packing density (around 71%) [10,20,21,22,23,24]. Green hydrogen economy needs the hydrogen storage due to hydriding properties in cell unit of Laves C15 phases. Laves intermetallics can be used to store interstitially the hydrogen by offering different positions (i.e., 3 tetrahedral interstices) [20].
Furthermore, HoAl2 exhibits magnetic anisotropy characterized by the easy magnetization axis being <110> for temperatures below 20 K; above this temperature, the easy axis shifts to the <100> intermediate direction [18,25]. Additionally, a spin reorientation occurs at T = 20 K. The hard magnetizations axis in HoAl2 is <111> crystal direction [19,25]. The directions of the easy, intermediate, and hard magnetization axes of HoNi2 are <100>, <110>, and <111>, respectively [17,25,26,27,28].
The present work investigates, through Density functional theory with Hubbard U correction calculations (DFT+U), the effect of hydrostatic pressure on the electronic and magnetic properties of the ferromagnetically ordered HoAl2 and HoNi2 Laves phases. The spin polarization calculations are performed along <001> crystal direction. We systematically explore how electronic density of states are affected the in the HoAl2 and HoNi2 alloys. The theoretical calculations indicate significant changes in the electronic structure under a small hydrostatic pressure of 0.1 GPa in HoNi2. A multicaloric approach in the solid-state cooling technology based on the magneto-caloric and baro-caloric effects has been used [2,3]. The combination of different external fields (e.g., magnetic field and hydrostatic pressure) allows an enhancement of caloric response by tailoring the magnetic moment (related to electronic density of states) with the pressure during the magnetic phase transition. Our finding is that the net magnetic moment can be modified (drops a 22.5 %) after a 0.1 GPa hydrostatic pressure is applied. To our knowledge, the electronic and magnetic properties from ab-initio calculations under hydrostatic pressure in HoAl2 and HoNi2 have not yet been reported to date.
2. Materials and Methods
The present study was performed using Cambridge Serial Total Energy Package (CASTEP) within density functional theory framework, using BIOVIA-Materials Studio®. For the exchange-correlation, the revised Perdew-Burke-Ernzerhof (RPBE) functional was applied as part of the generalized gradient approximation (GGA). It’s known that the GGA method fails to correctly describe the localized 4f and 3d electrons; therefore, the DFT+U (U-Hubbard) correction was introduced into calculations [29,30,31]. It is important to note that U corrections within the GGA approximation show better accuracy to investigating the magnetic and electronic structures of 4f and 3d compounds compared to the local density approximation (LDA) or hybrid functionals [32,33]. The U values of localized electrons were 2.50 eV and 6.0 eV for Ni and Ho atoms, respectively. The U value was set to 0 eV for Al atoms because the lack of localized electrons. To calculate the electronic density of states (DOS), a 13 × 13 × 13 k-mesh generated by the Monkhorst-Pack scheme was used to integrate the Brillouin zone. For the plane-wave propagation along the crystal, a cut-off energy of 500 eV was applied [34,35,36,37]. The charge convergence criteria was set at 1 × 10⁻⁶ eV for self-consistent field cycles. During the geometric optimization process, the compressive external stress was applied along the a, b, and c axes to consider the effect of external hydrostatic pressure using Broyden–Fletcher–Goldfarb–Shanno (BFGS) algorithm.
The stoichiometric HoM2 with M = {Al, Ni} Laves phases crystallize in a cubic MgCu2-type structure with a space group Fd–3m. Figure 1 schematically shows the crystalline and magnetic structure and primitive cell of HoM₂ (M = {Al, Ni}) Laves phases. In the AB2 structure, the A atom (i.e., Ho) occupies the 8a Wyckoff site at (0 0 0), while the B atoms (i.e., Al and Ni) occupy the 16a Wyckoff site at (5/8 5/8 5/8) positions. For Al, Ni, and Ho, the electronic configuration is described as [Ne] 3s2 3p1, [Ne] 3s2 3p6 3d8 4s2, and [Ne] 3s2 3p6 3d10 4s2 4p6 4d10 5s2 5p6 4f11 6s2, respectively. It is important to note that for simulating HoAl2 and HoNi2 Laves phases, we used experimental lattice parameters instead of those obtained from minimizing the total energy as a function of volume for the crystalline structures. The used lattice parameters a = b = c were 7.810 Å for HoAl2 and 7.130 Å for HoNi2 [16,17]. The ferromagnetic ordering of each compound was modeled assuming that only the rare earth atoms, specifically Ho at 8a positions, possess a magnetic moment aligned along the <001> direction. Zero magnetic moment was assumed for Al and Ni atoms, which are located at 16a positions.
3. Results and Discussion
3.1. Electronic Properties
Table 1 displays the lattice parameter and interatomic distances between Al-Al, Ho-Al, and Ho-Ni in the Laves phases HoM2 with M = {Al, Ni}, under applied hydrostatic pressures from 0 GPa to 1.0 GPa. It is worth noting that HoAl2 is more sensitive to external pressure than the HoNi2 alloys. The structural stability of both HoAl₂ and HoNi₂ remains unchanged across the entire range of applied pressures. Their corresponding formation energy Ef values at P = 0 GPa are –9.485 × 10³ eV (HoAl2) and –13.47 × 10³ eV (HoNi2). For non-zero pressures, the overall magnetic behaviors do not exhibit significant variation due to the minimal compaction in their crystal structures. All formation energy values remained nearly constant with a virtually negligible increase (less than 1%) under external pressures up to 1.0 GPa; details are shown in Figure A1 in the Appendix section. Additionally, substituting Al atoms with Ni atoms leads to a reduction in lattice parameters, resulting in an increase in bulk modulus at applied pressures around 1.0 GPa, as detailed in Table 1.
3.2. Determination of Electronic Coefficient in Specific Heat Capacity
Considering that each atom donates one electron to the Fermi gas in the solid, the free-electron number densities () for HoAl2 and HoNi2 are 1.678 × 1028 m−3 and 2.203 × 1028 m−3, respectively. On the other hand, M(HoAl2) = 218.894 g/mol, ρ(HoAl2) = 6.08 g/cm3 [16], M(HoNi2) = 282.316 g/mol, and ρ(HoNi2) = 10.33 g/cm3 [38] were used.
Bearing in mind that in metals theory at P = 0 GPa and T = 0 K, the Fermi energy EF can be calculated as follows:
where and are the Planck and Boltzmann constants, respectively, and is the electron mass. Using equation (1) and previous values, the Fermi temperature TF can be calculated through the formulae:
The electronic coefficient of specific heat capacity can be calculated using the following equation:
The calculated values of Fermi energy and its temperature, and the electronic coefficient using the equations (1), (2), and (3) are listed in Table 2. The N/V, EF and TF values agree with those obtained for other elements such as K (i.e., 1.40 × 1028 m−3; 2.13 eV; 2.47 × 10⁴ K), Ag (i.e., 5.86 × 1028 m−3; 5.53 eV; 6.41 × 10⁴ K), and Cu (i.e., 8.47 × 1028 m−3; 7.06 eV; 8.19 × 10⁴ K) [39].
) obtained by the equations (1), (2), and (3) for both Laves phases (HoAl2 and HoNi2).
Another way to determine the electronic heat capacity coefficient for alloys is through DFT quantum calculations. The Einstein-Debye model states that at temperatures T << TD, where TD is the Debye temperature, and the terms and represent the electronic and phonon contributions to the specific heat capacity, respectively. From the Sommerfeld approximation [40], the coefficient can be calculated as follows:
where is the density of electrons per eV at the Fermi level. This expression applies when external hydrostatic pressure is considered.
Figure 2 shows how the electronic specific heat capacity coefficients, calculated by eq. (4), change with increasing external hydrostatic pressures up to 1.0 GPa for the studied Laves phases. For HoAl2, the obtained value at P = 0 GPa is 9.43 × 10⁻³ J mol−1 K−2. This result differs from that obtained through the electron gas model in metals (Table 2); the values tend to slightly increase, reaching an average of 10.02 × 10⁻³ J mol−1 K−2 as the applied pressure increases. Conversely, the initial value for the HoNi2 alloys at 0 GPa (i.e., 3.87 × 10⁻³ J mol−1 K−2) is like the value calculated using the gas model in metals; see Table 2 for details (1.231 × 10⁻³ J mol−1 K−2). Later, it increases noticeably to 8.02 × 10⁻³ J mol−1 K−2 with an applied pressure of 0.1 GPa and then remains nearly constant at an average value of 8.05 × 10⁻³ J mol-1 K-2. At non-zero pressures, the obtained values for HoAl2 and HoNi2 are closer to each other, as calculated by DFT+U modelling.
Von Ranke et al. reported electronic specific heat capacity coefficients of 10.6 × 10⁻³, 5.5 × 10⁻³, 4.8 × 10⁻³ and 4.6 × 10⁻³ J mol-1 K-2 for LaAl2, LuAl2, LaNi2.2, and LuNi2, respectively [41]. De Oliveira and colleagues reported a experimental value of 5.4 × 10⁻³ J mol-1 K-2 from the cp(T) curve for non-ferromagnetic LuAl2 stating that this alloy shows the same structure as HoAl2, and a similar value [42]. Campoy et al. experimentally determined a value of = 7.0 × 10⁻³ J mol-1 K-2 for a bulk polycrystalline HoAl2 alloy from cp(T) data [43]. The DFT and Fermi gas approach of values at P = 0 GPa for the Laves phases alloys agree with experimental ones obtained by cp(T) data.
3.3. Electronic Density of States
3.3.1. Total Density of Electronic States at P = 0 GPa
Figure 3 shows the total density of electronic states (DOS) obtained in ferromagnetically ordered crystal structures HoM2 with M = {Al, Ni} Laves phases. The electronic structure for both compounds, s and p orbitals, is nearly symmetric and localized at deeper energies compared to d and f orbitals, which are at the Fermi level. The s orbitals are localized among –49.00 eV and –48.00 eV with a maximum of electronic density of 3.92 e−/eV at –48.59 eV for HoAl2. When the post-transition metal (Al) is replaced by a transition metal (Ni), the localization of s orbitals shifts toward higher energies (i.e., between –47.43 eV and –46.19 eV) with a similar electronic density of 3.87 e−/eV. The p orbitals in HoAl2 are localized in the energy range of –24.30 eV ≤ E – EF ≤ –22.62 eV, while they are positioned between –23.00 eV and –21.32 eV for HoNi2. Our calculations showed that the spin-up channel is shifted to lower energies compared to the spin-down channel while maintaining symmetry between them for both alloys. It is important to note that substituting Al with Ni reduces the maximum value in the DOS of p bands from 9.53 e−/eV to 5.95 e−/eV, and the DOS curve tends to flatten into a double peak, see the Figures 3(a)-3(b).
The d and f orbitals are very close to the Fermi level. Specifically, d bands range from –5.2 eV to 10.0 eV, while f bands range from –5.3 eV to 3.0 eV. Both the DOS of d and f orbitals exhibit a notable asymmetry. Additionally, f bands are the most populated in both compounds. Therefore, the localized f electrons continue to be responsible for ferromagnetic order in HoM2 (M = {Al, Ni}) Laves phases. Replacing the post-transition metal Al with Ni leads to symmetry collapse of d orbitals, causing hybridization among d and f bands. This suggests that the magnetic behavior of HoAl2 arises from localized electrons in f orbitals, and both itinerant and localized electrons in d and f orbitals contribute to ferromagnetism in HoNi2.
The total magnetic moments along the <001> c-axis obtained for ferromagnetically ordered HoAl2 and HoNi2 Laves phases are 8.61 µB/f.u. and 8.12 µB/f.u., respectively. These values, derived from DOS, match the single crystalline data previously reported in scientific literature: 9.15 µB/f.u. to 9.18 µB/f.u. for HoAl2 [18,25] and 8.52 µB/f.u. for HoNi2 [19]. As summarized in Table 3, the net magnetic moment determined for polycrystalline ribbons [16,17], and bulk/massive [44,45] samples is close to that obtained from DFT quantum calculations.
3.3.2. Total Electronic Density of States at 0 GPa < P ≤ 1.0 GPa
Figure 4 shows the calculated DOS for ferromagnetically ordered HoAl2 and HoNi2 Laves phases under external hydrostatic pressures from 0 GPa to 1.0 GPa. For both alloys, a small increase in the external pressure applied to the crystal structure causes a shift to higher energies of the s and p orbitals. The shift is more evident in HoAl2 (Figure 4(a)) than in HoNi2 (Figure 4(b)). Meanwhile, d and f orbitals move closer to the Fermi energy level. For HoNi2, a significant redistribution occurs in the electronic population of f-orbitals at non-zero pressure; the maximum of the spin-up channel increases from 14.26 e−/eV to 23.48 e−/eV, while the initial splitting of the spin-down channel disappears, and a maximum electronic density of –14.35 e−/eV is observed.
Figure 5(a) shows the calculated total magnetic moment versus hydrostatic pressures in the range of 0 GPa ≤ P ≤ 1.0 GPa for ferromagnetically ordered HoM2 (M = {Al, Ni}) crystal structures. For HoAl2, the total magnetic moment remains nearly constant (around a mean value of 8.49 µB/f.u.) as applied pressure increases up to 1 GPa. On the contrary, for HoNi2, the total magnetic moment at P = 0 GPa (8.12 µB/f.u.) decreases to 6.29 µB/f.u. at 0.1 GPa and then remains nearly constant for a non-zero applied pressure. This is a 22.5 % that DOS was modified after a 0.1 GPa, that can be useful in multicaloric approach during the magnetic phase transition [2,3]. Additionally, Figure 5(b) displays the calculated magnetic moment associated with d and f orbitals for both alloys. It is important to note that the magnetic order mainly results from localized f electrons. The itinerant electrons contribute only minimally to the magnetic moment. Moreover, for HoNi2, the magnetic contribution of 4f electrons decreases from 7.45 µB/f.u. to 6.31 µB/f.u. under an applied pressure of 0.1 GPa and then remains nearly constant at a non-zero value pressures.
3.3.3. Electronic Partial Density of States at P = 0 GPa
The obtained partial density of electronic states (PDOS) corresponding to d and f orbitals is shown in Figure 6. Once a transition metal like Ni replaces the post-transition metal Al in the crystalline structure, the electronic population of 3d electrons increases, while the density of electrons in 4f orbitals decreases, resulting in a broadened peak of the DOS curve. The contributions per orbital to the total magnetic moment are listed in Table 4. At P= 0 GPa, electrons localized at d orbitals contributed less to the net magnetic moment in the crystal structure HoAl2 (i.e., 0.28 µB/f.u.) compared to HoNi2 (i.e., 0.57 µB/f.u.). Therefore, the magnetic behavior of the ferromagnetically ordered HoAl2 crystal structure is just due to unpaired electrons localized at f orbitals. When Al is fully replaced by Ni, the number of unpaired electrons in the d orbital increases; as a result, the magnetic moment of HoNi2 arises from 3d and 4f electrons. Moreover, s and p orbitals shift to higher energies when Al is replaced by Ni, and p orbitals tend to decrease their maximum population, resulting in a broadened and flattened peak band. Partial DOS for s and p orbitals is shown in Figure A3. Finally, the contribution of electrons localized at s and p orbitals to the total magnetic moment is almost negligible for both alloys, HoAl2 and HoNi2.
On the one hand, Figure 6(a) shows that the 4d and 3d electrons of Ho in HoAl2 are located very close to the Fermi level with a very low density of states. In contrast, the 4f electrons of Ho in the spin-up channel are situated at –4.77 eV, far from the Fermi level, while the 4f electrons in the spin-down channel are practically at the Fermi level (–0.7 eV); see Figure 6(b). For HoNi2, the 3d electrons in both spin-up and spin-down channels are near the Fermi level (at –1.75 eV). Conversely, the 4f electrons of Ho at the spin-up channel are localized at – 4.03 eV far away from the Fermi level; in the case of the spin-down channel, 4f electrons are very close to the Fermi level (from – 1.16 eV to 0 eV). Noticing that the amount of Ho 4f electrons in HoAl2 has larger peaks in the density of states compared to the broad, lower peaks of Ho 4f electrons in HoNi2. Finally, the Ni 3d electrons have a higher density of states compared to the Ho 4d and 3d electrons.
3.3.4. Electronic Partial Density of States at 0 GPa ≤ P ≤ 1.0 GPa
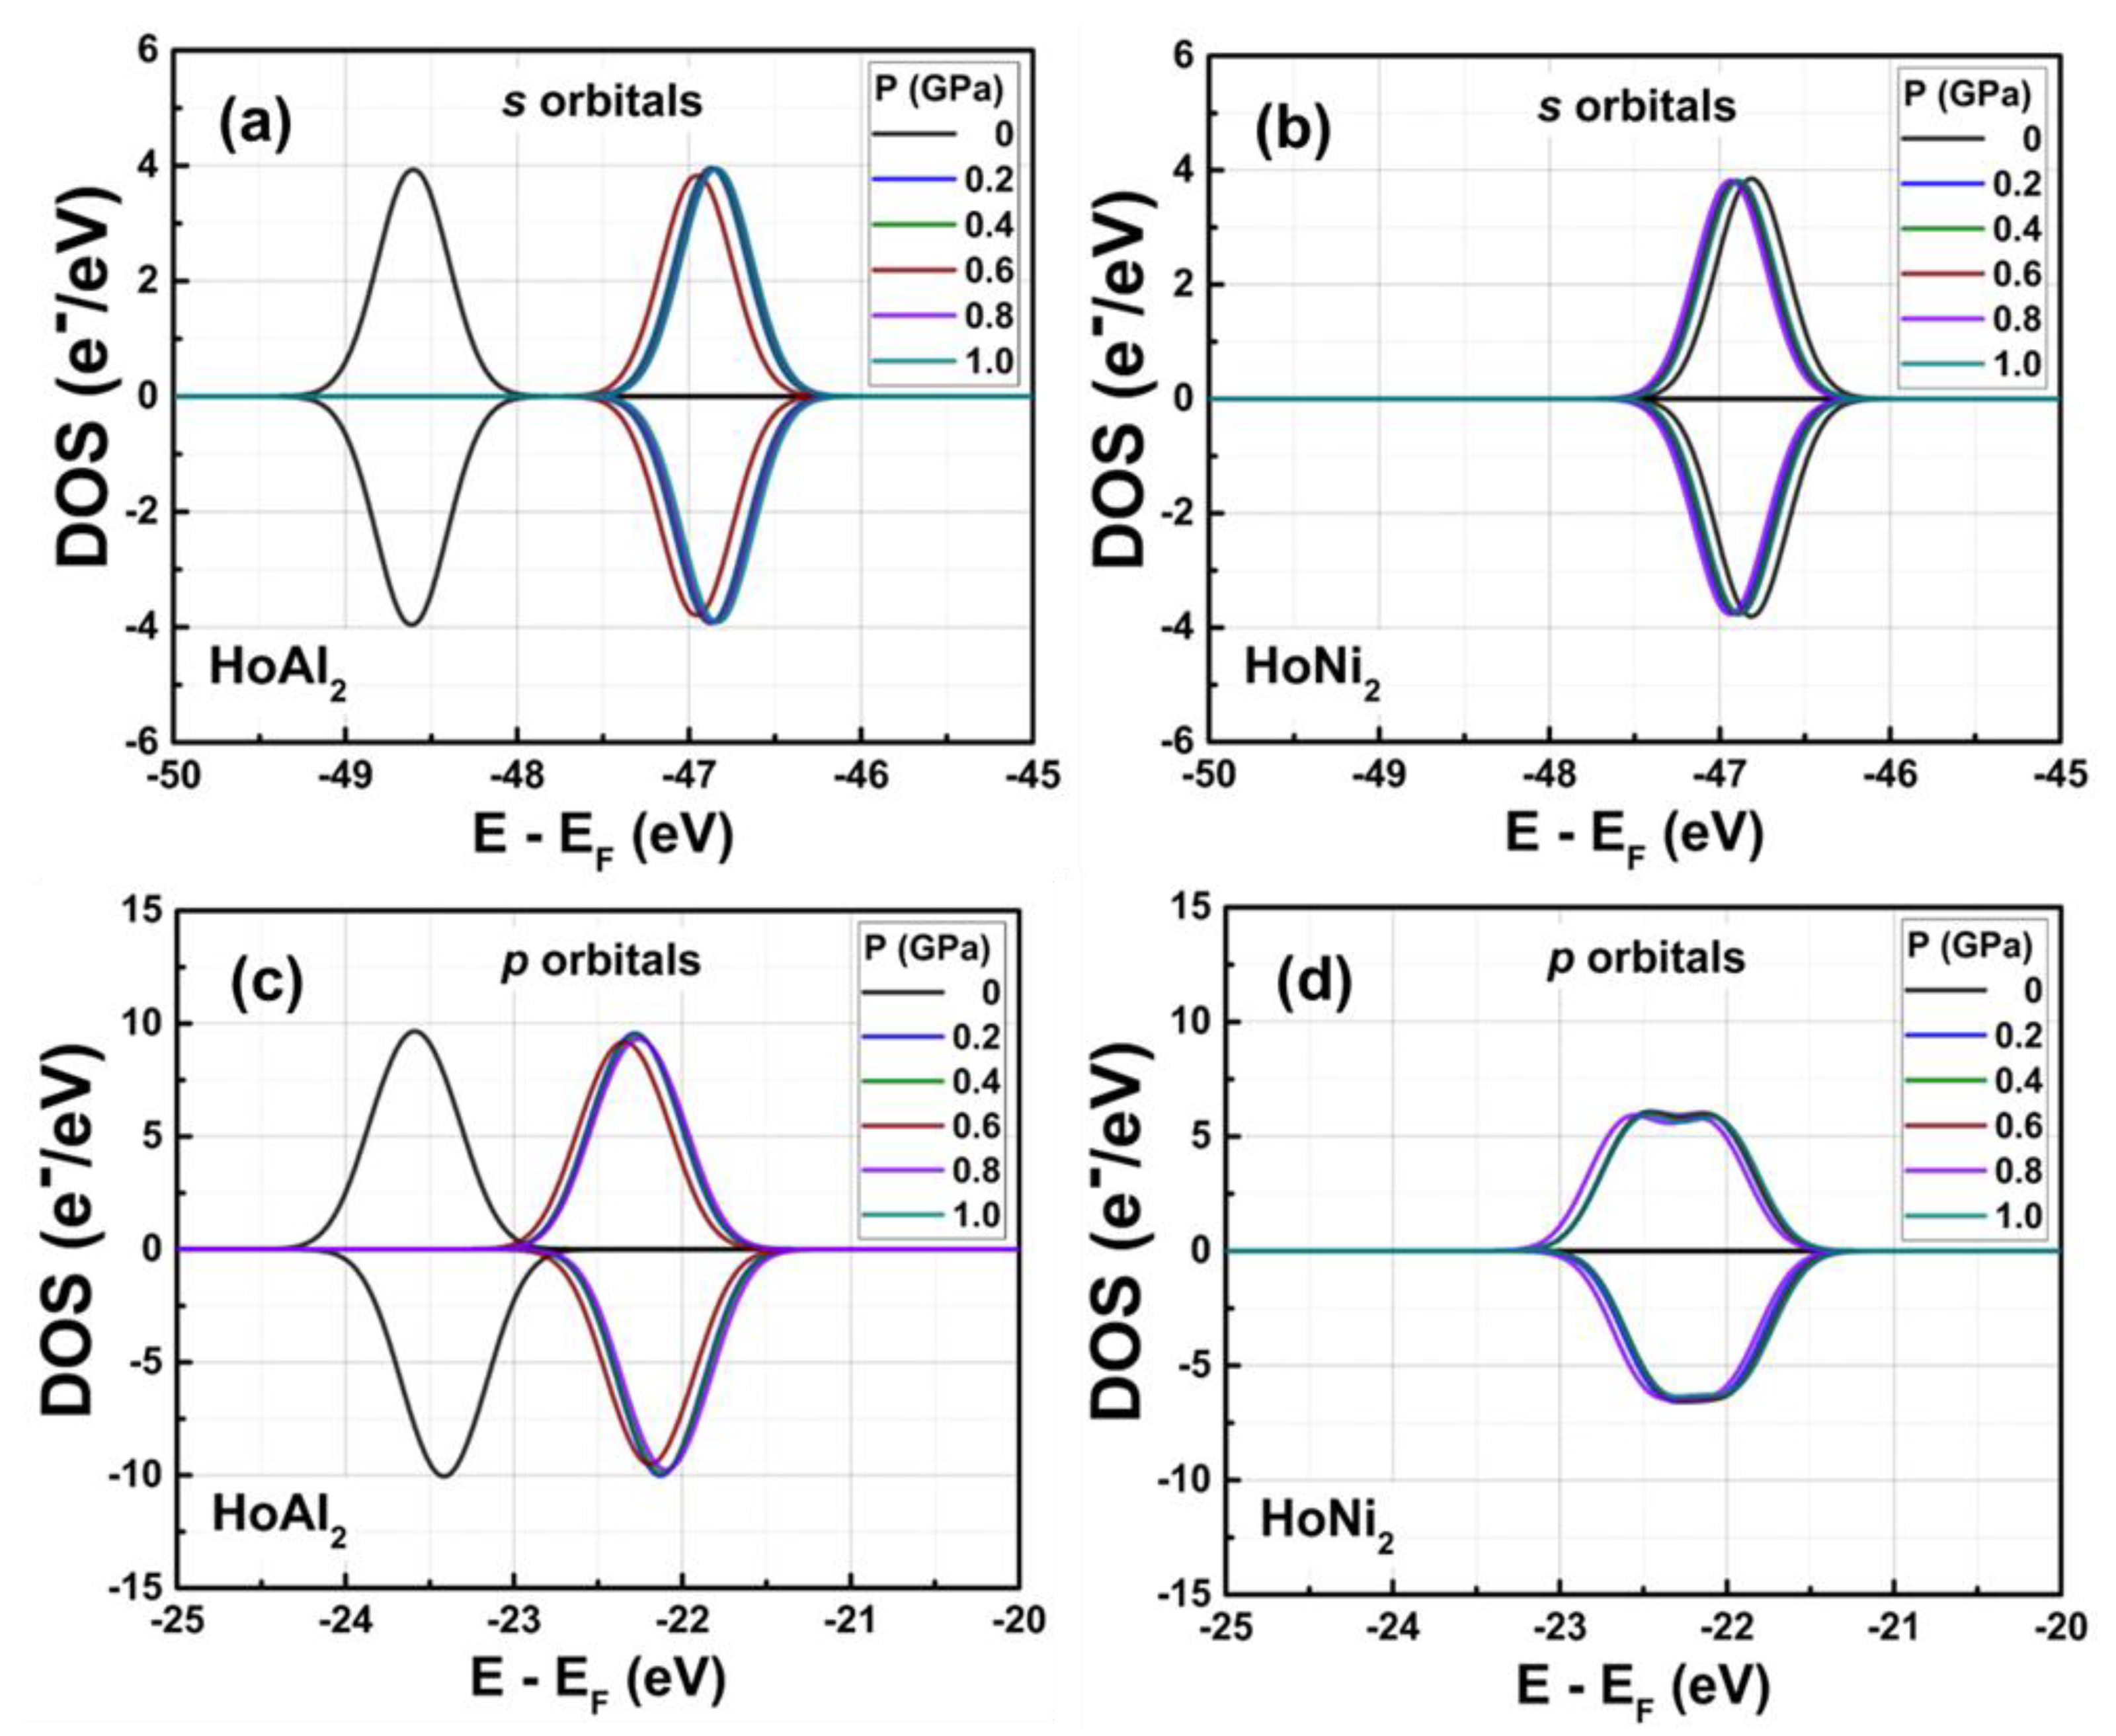
For ferromagnetically ordered HoM2 (M = {Al, Ni}) Laves phases, the applied external hydrostatic pressure induces a shift in the energies of the s, p, d, and f bands. This shift is more noticeable for the s and p bands in HoAl2 than in HoNi2. The PDOS obtained for s and p orbitals are shown in Figure A4 of the Appendix section.
Figure 7 displays the PDOS for the d and f orbitals under external hydrostatic pressures ranging from 0 GPa to 1.0 GPa. In the ferromagnetically ordered HoAl2 Laves phase, the applied pressures (0 GPa to 1.0 GPa) cause a slight rearrangement of the 3d and 4d Ho spin-up and spin-down channel bands. See details in Figure 7 (a). The 4f electrons of Ho in the spin-up channel, initially localized far from the Fermi level at –4.77 eV, move slightly closer to the Fermi level as pressure increases, reaching –4.34 eV at 1.0 GPa (Figure 7 (b)). Meanwhile, the 4f electrons in the spin-down channel, initially localized at –0.70 eV, nearly reach the Fermi level.
Figures 7(c) and 7(d) illustrate that for HoNi2, the 3d electrons of Ni in both spin-up and spin-down channels do not undergo significant changes as the external pressure increases from 0 GPa to 1.0 GPa. Furthermore, the 4f electrons of Ho, a rare earth element, in both spin-up and spin-down channels show an increase in their maximum electronic density under non-zero applied pressure. It is important to note that the initial splitting of the spin-down channel tends to disappear. External pressure causes a redistribution of the electronic population across the orbitals for both alloys, but the most affected orbitals are the 4f orbitals of HoNi2. The maximum population of electrons with spin-up at f orbitals of HoNi2 increases from 14.26 e−/eV to 23.48 e−/eV, and their electronic density of the spin-down channel rises to –14.35 e−/eV near the EF level, as shown in Figure 7(d).
The net magnetic moment [40] was calculated using the following equation:
where E1 and E2 represent the starting energies of electronic states for spin-up and spin-down channels, respectively. Table 4 presents the calculated net magnetic moment computed from the simulated DOS for ferromagnetically ordered HoAl2 and HoNi2 Laves phases, along with the contribution of electrons at s, p, d, and f orbitals to the total magnetic moment. When Al is fully replaced by Ni, the contribution of d electrons to the total magnetic moment slightly increases. Furthermore, the main contributor to magnetic behavior in ferromagnetically ordered HoM2 with M = {Al, Ni} are the f electrons.
4. Conclusions
This study examined how hydrostatic pressures from 0 GPa to 1.0 GPa affect the crystal stability, electronic properties, and magnetic properties of ferromagnetically ordered HoAl2 and HoNi2 Laves phases through DFT+U calculations using the RPBE exchange-correlation functional within the GGA framework. All calculations were performed along the <001> direction, and the net magnetic moment obtained remains nearly constant for ferromagnetically ordered HoAl2, with values of 8.61 µB per formula unit along the intermediate magnetization axis. The ferromagnetically ordered HoNi2 Laves phases experience a reduction in their initial magnetic moment from 8.12 µB/f.u. to 6.29 µB/f.u. in the easy magnetization axis when subjected to non-zero applied pressure. The latter HoNi2 Laves phase is useful for multicaloric approach in solid state cooling by using magneto-caloric and baro-caloric effects. The magnetic moment can be modified a 22.5 % under 0.1 GPa in the range of fully reversible loading and uploading regimes in the alloy when the hydrostatic pressure is applied and released, respectively. The most affected by the applied pressures was the HoAl2 Laves phase, with a compressive stress of –2.88%, while the HoNi2 exhibited a compressive stress of –1.87%. The interatomic distances change very little within the pressure range studied. The ferromagnetic order persists, displaying a reorganization of the electronic states, with the f orbitals of HoNi2 Laves phases being the most affected. The stability of the ferromagnetically ordered HoAl2 and HoNi2 Laves phases' crystal structures remains unaffected across the entire range of applied pressures, and the formation energy stays constant up to 1.0 GPa.
Author Contributions
“Conceptualization, T. López-Solenzal and C.F. Sánchez-Valdés; methodology, T. López-Solenzal and C.F. Sánchez-Valdés; software, T. López-Solenzal, M. Ramos and C.F. Sánchez-Valdés; validation, T. López-Solenzal and C.F. Sánchez-Valdés.; formal analysis, T. López-Solenzal and C.F. Sánchez-Valdés; investigation, T. López-Solenzal, D. Ríos-Jara, Manuel Ramos and C.F. Sánchez-Valdés; resources, C.F. Sánchez-Valdés; data curation, T. López-Solenzal; writing—original draft preparation, T. López-Solenzal and C.F. Sánchez-Valdés; writing—review and editing, T. López-Solenzal, D. Ríos-Jara, M. Ramos, and C.F. Sánchez-Valdés; project administration, D. Ríos-Jara; funding acquisition, D. Ríos-Jara, M. Ramos, and C.F. Sánchez-Valdés. All authors have read and agreed to the published version of the manuscript.”
Data Availability Statement
The data supporting this study's findings are available from the corresponding author upon reasonable request.
Acknowledgments
Authors also thank Instituto de Ingeniería y Tecnología of Universidad Autónoma de Ciudad Juárez for providing BIOVIA Materials Studio® licensing to perform all computational calculations. T. López-Solenzal thanks SECIHTI-México for doctoral scholarship 1072019. D. Ríos-Jara, C.F. Sánchez-Valdés and M. Ramos thank Sistema Nacional de Investigadores e Investigadoras fellowship of SECIHTI-México. APC was partially funded by 2025 Publich Program of Instituto de Innovación y Competividad del Gobierno del Estado de Chihuahua in México.
Conflicts of Interest
All authors declare no conflict of interest. And all the funders had no role in the design of the study; in the collection, analyses, or interpretation of data; in the writing of the manuscript; or in the decision to publish the results.
Appendix A
Figure A1.
Calculated formation energy as a function of the applied hydrostatic pressure for ferromagnetically HoAl2 and HoNi2 Laves phases.
Figure A1.
Calculated formation energy as a function of the applied hydrostatic pressure for ferromagnetically HoAl2 and HoNi2 Laves phases.
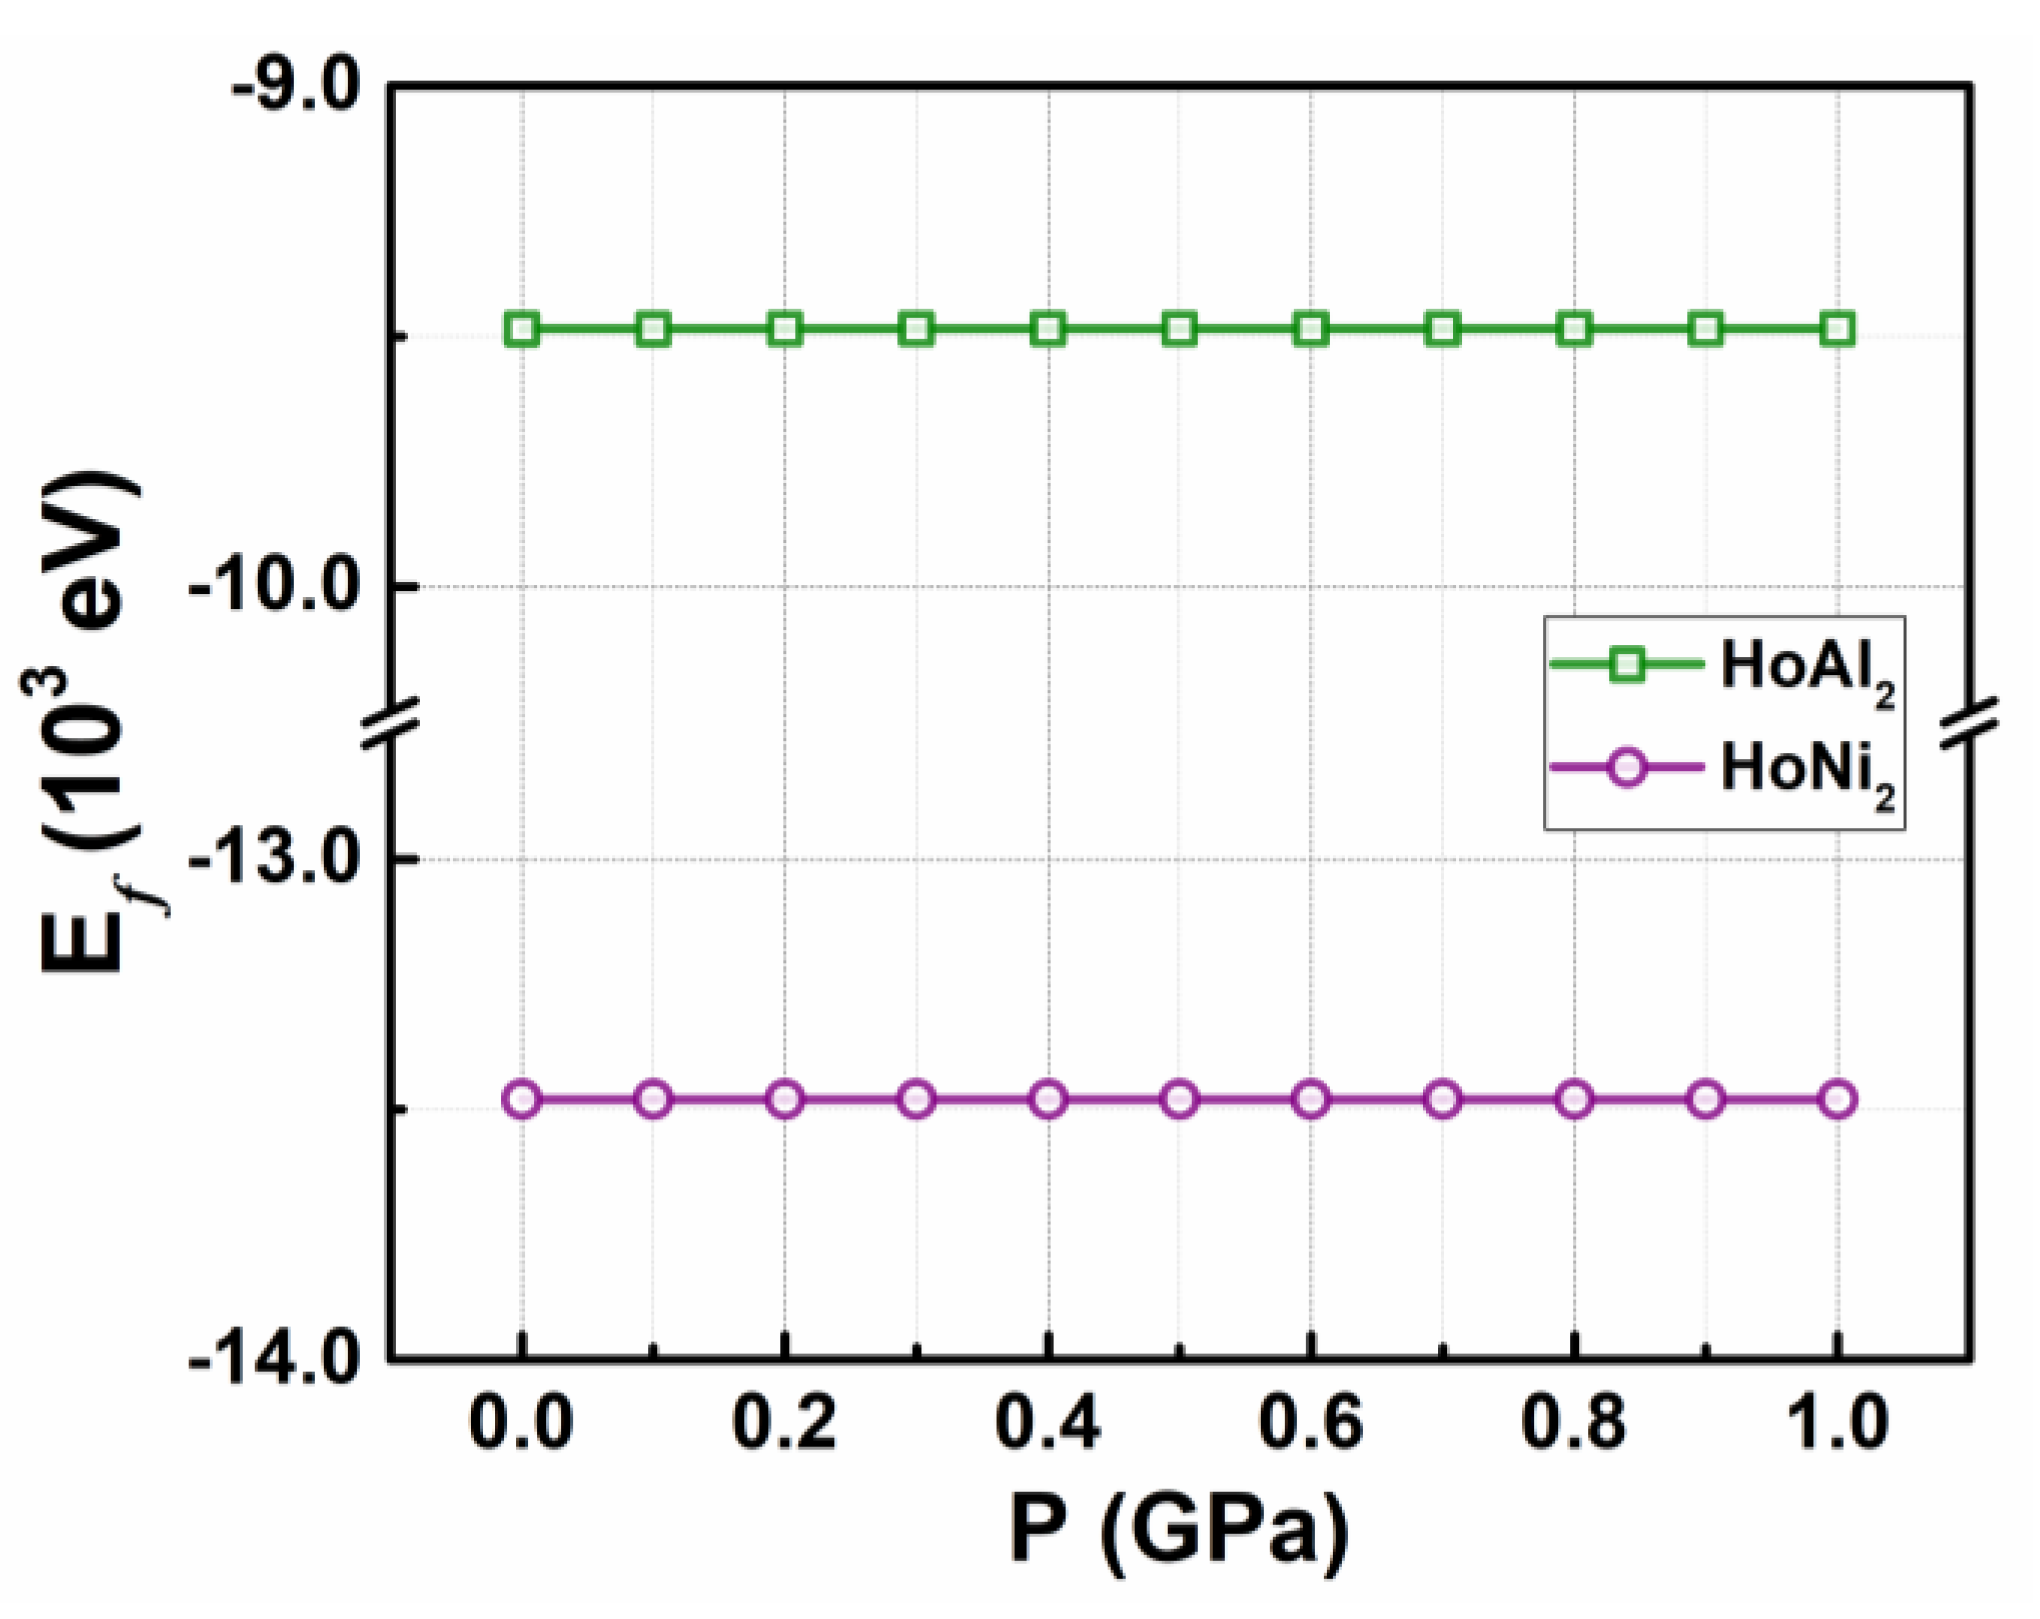
Figure A2.
Magnetization isotherm at 2 K (a) and temperature dependence of magnetization measured under magnetic fields of 5 mT and 5 T (b) for HoAl2 melt spun ribbons. The short-dashed line in (a) indicates the saturation magnetization extrapolated to a zero magnetic field (reported in Table 3). The magnetic moment per formula unit is calculated from the magnetization values. The measurements are performed in-plane along the major axis of the ribbon length using in Dynacool PPMS-VSM magnetometer. As pointed by the vertical arrow in (b), the sample shows TC = 29 K. More experimental details can be found in reference [16].
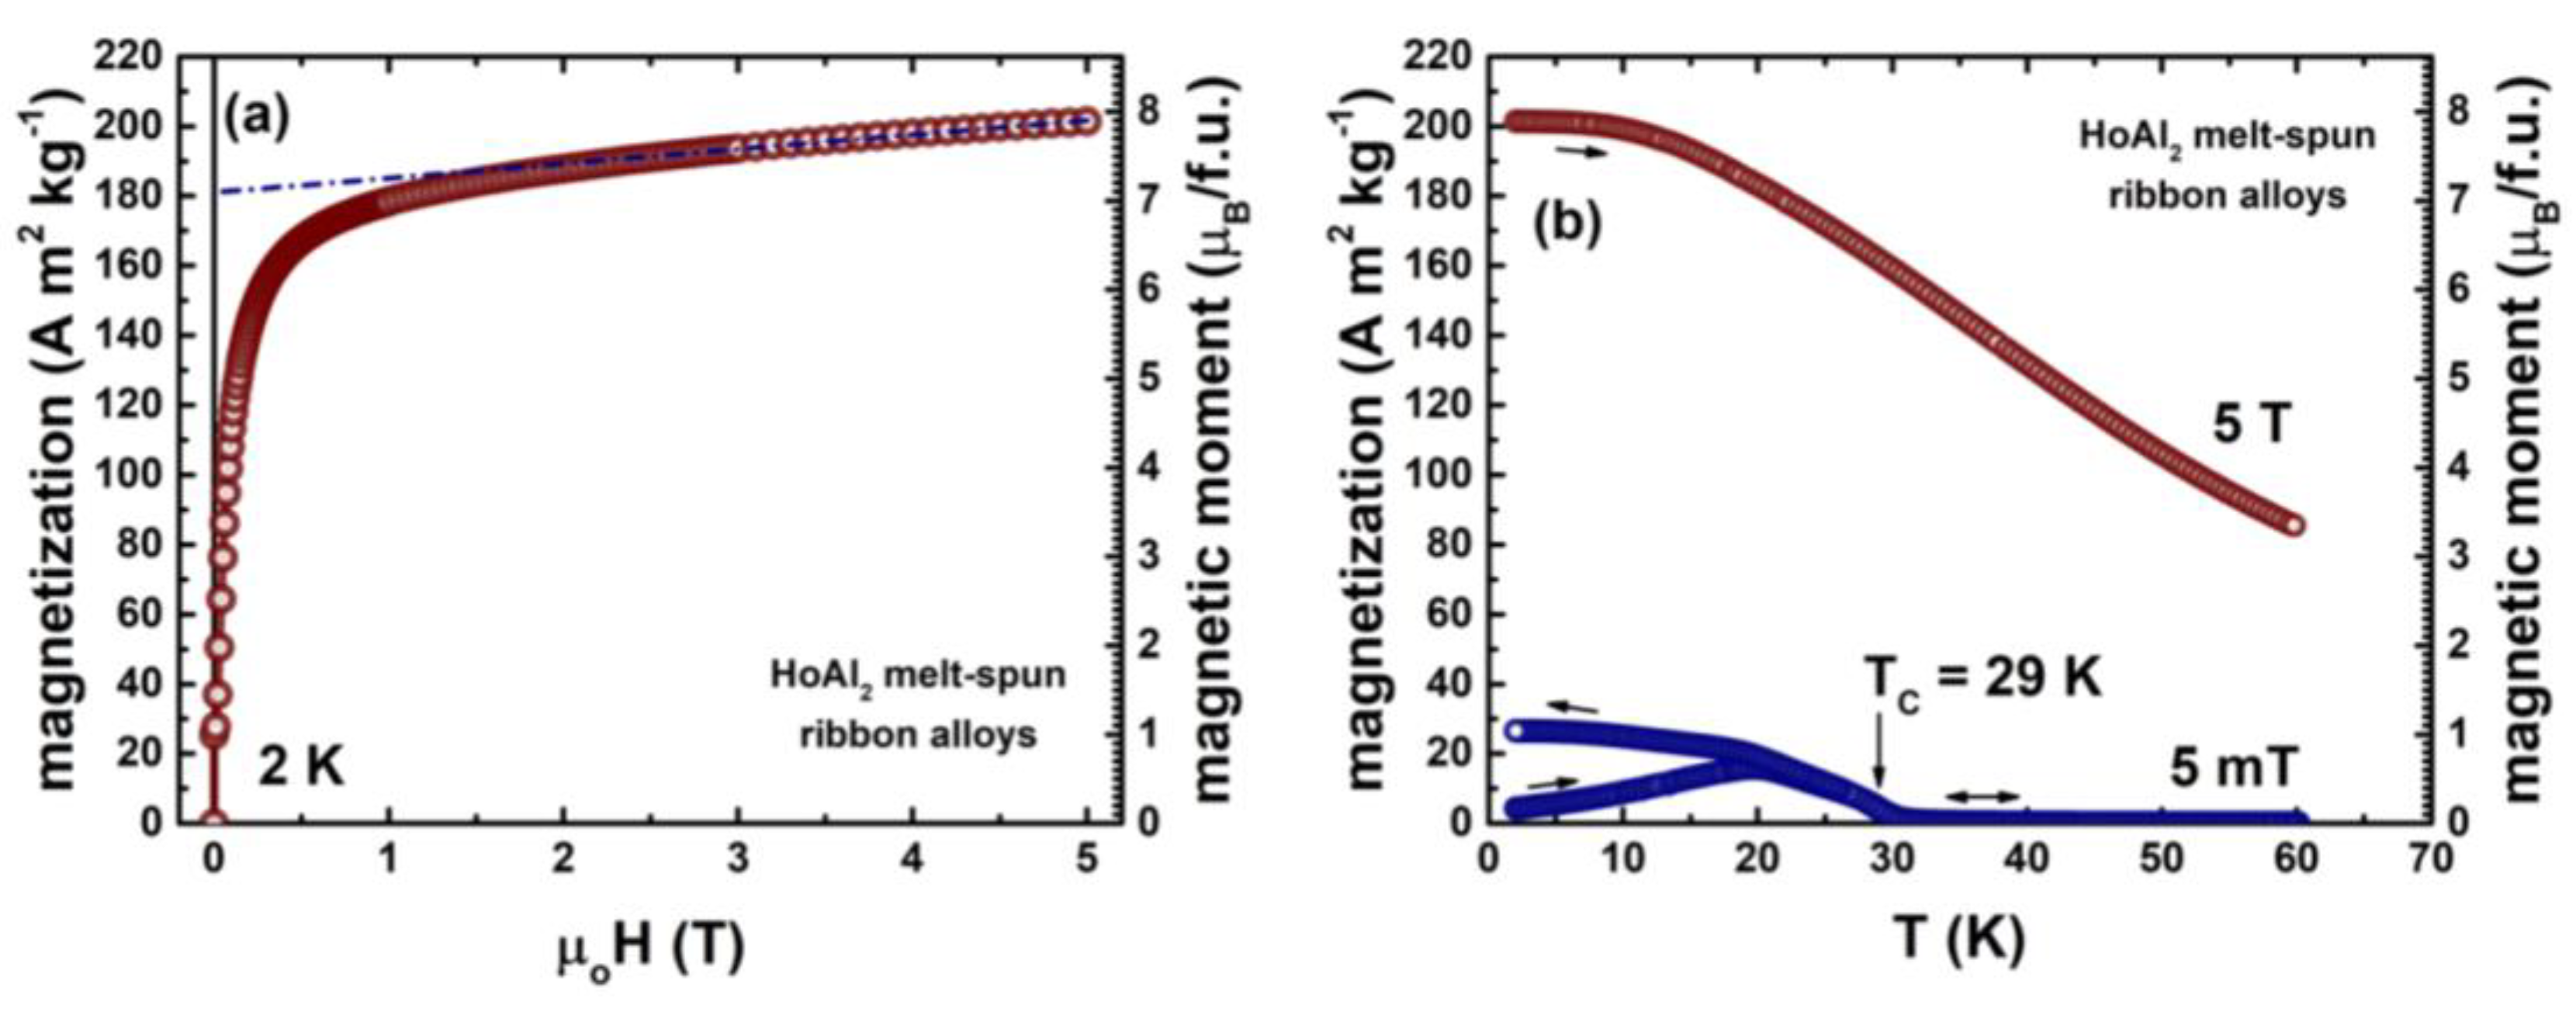
Figure A3.
Partial electronic density of states at P = 0 GPa calculated for (a) s and (b) p orbitals in ferromagnetically ordered HoAl2 and HoNi2 Laves phases..
Figure A3.
Partial electronic density of states at P = 0 GPa calculated for (a) s and (b) p orbitals in ferromagnetically ordered HoAl2 and HoNi2 Laves phases..
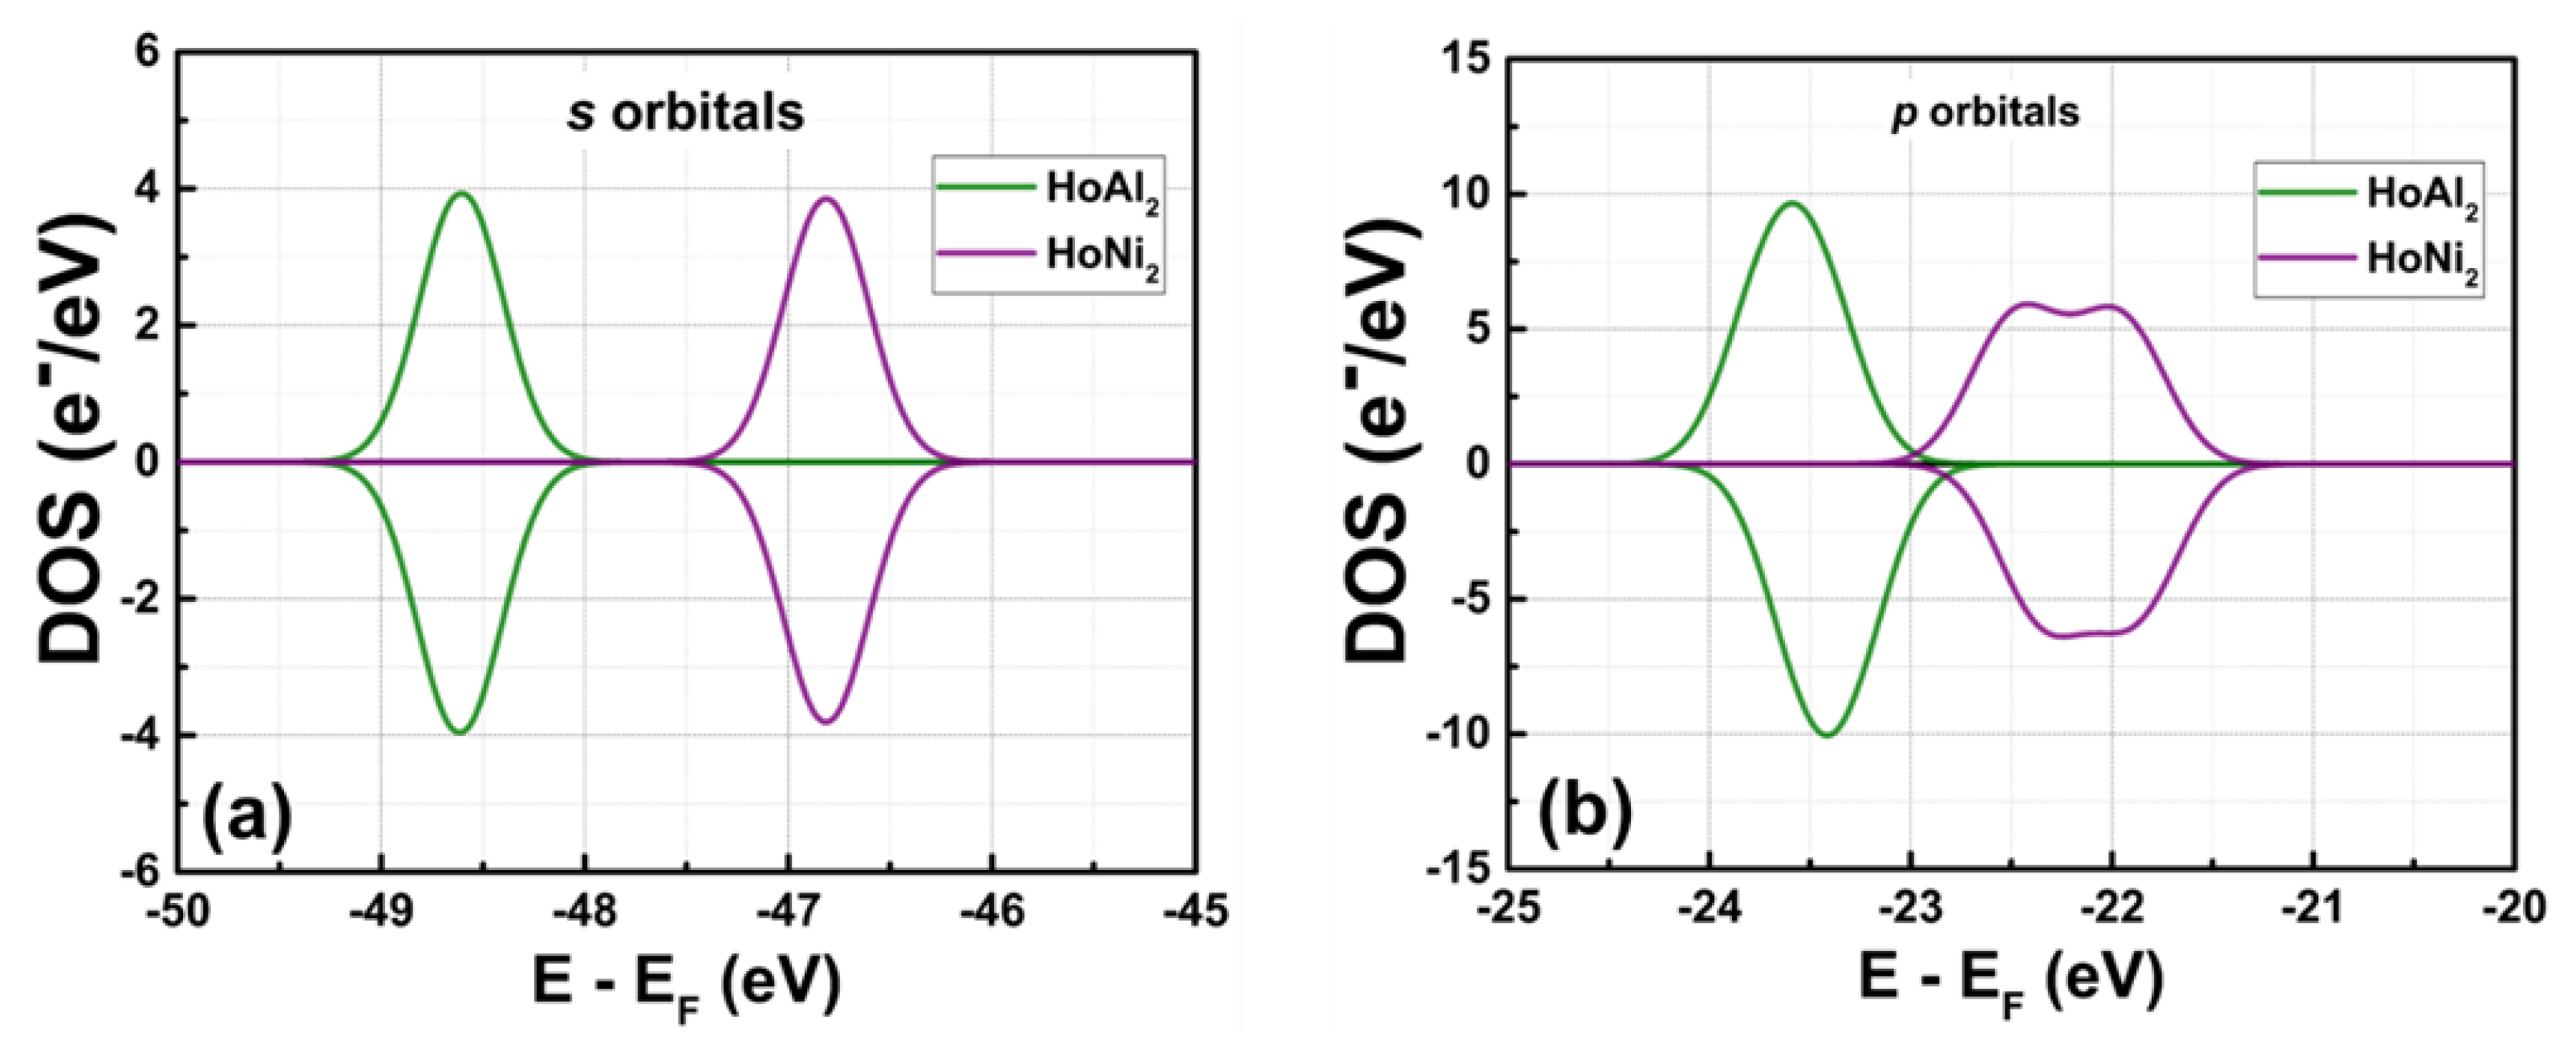
Figure A4.
Partial electronic density of states calculated for s and p orbitals in ferromagnetically ordered HoAl2 ((a), (c)) and HoNi2 ((b), (d)) Laves phases within the pressure range of 0 GPa ≤ P ≤ 1.0 GPa.
Figure A4.
Partial electronic density of states calculated for s and p orbitals in ferromagnetically ordered HoAl2 ((a), (c)) and HoNi2 ((b), (d)) Laves phases within the pressure range of 0 GPa ≤ P ≤ 1.0 GPa.
References
- Pecharsky, V.K.; Gschneider Jr., K. A. Magnetocaloric effect and magnetic refrigeration. J. Magn. Magn. Mater. 1999, 200, 044–56. [Google Scholar] [CrossRef]
- Moya, X.; Mathur, N.D. Caloric materials for cooling and heating. Science. 2020, 370, 797–803. [Google Scholar] [CrossRef]
- Moya, X.; Kar-Narayan, S.; Mathur, N.D. Caloric materials near ferroic phase transitions. Nature Mater, 2014; 14. [Google Scholar] [CrossRef]
- Franco, V.; Blázquez, J.S.; Ipus, J.J.; Law, J.Y.; Moreno-Ramírez, L.M.; Conde, A. Magnetocaloric effect: From materials research to refrigeration devices. Prog. Mater. Sci. 2018, 93, 112–232. [Google Scholar] [CrossRef]
- Smith, A.; Bahl, C.R.H.; Bjørk, R.; Engelbrecht, K.; Nielsen, K.K.; Pryds, N. Materials challenges for high performance magnetocaloric refrigeration devices. Adv. Energy Mater. 2012, 2, 1288–1318. [Google Scholar] [CrossRef]
- Pecharsky, V.K.; Gschneidner Jr., K. A. Giant magnetocaloric effect in Gd5(Si2Ge2). Phys. Rev. Lett. 1997, 78, 4494. [Google Scholar] [CrossRef]
- Kitanovski, A. Energy applications of magnetocaloric materials. Advanced Energy Mater. 2020, 10, 1903741. [Google Scholar] [CrossRef]
- Lyubina, J. Magnetocaloric materials for energy efficient cooling. J. Phys. D. Appl. Phys. 2017, 50, 053002. [Google Scholar] [CrossRef]
- Kotani, Y.; Takeya, H.; Lai, J.; Matsushita, Y.; Ohkubo, T.; Miura, Y.; Nakamura, T.; Hono, K. Magnetic refrigeration material operating at a full temperature range required for hydrogen liquefaction. Nature Comm. 2022, 13, 1817. [Google Scholar] [CrossRef]
- Gschneidner Jr., K. A.; Pecharsky, V.K. Binary rare earth Laves phases - an overview. Z. Kristallogr. 2006, 221, 375–38. [Google Scholar] [CrossRef]
- Aschauer, U.; Braddell, R.; . Brechbuhl, S.A; Derlet, P.M.; Spaldin, N.A. Strain-induced structural instability in FeRh. Phys. Rev. B. 2016, 94, 014109. [Google Scholar] [CrossRef]
- He, L.; Zhu, J.; Zhang, L. First-principles study of Structural phase transition, electronic, elastic and thermodynamic properties of C15-type Laves phases TiCr2 under pressure. Physica B: Condensed Matter. 2018, 531, 79–84. [Google Scholar] [CrossRef]
- Patel, P.D.; Shinde, S.; Gupta, S.D. First principle calculation of structural, electronic and magnetic properties of Mn2RhSi Heusler alloy. AIP Conf. Proc. 2018, 2005, 040004. [Google Scholar] [CrossRef]
- Wang, S. First-principles prediction of ferromagnetism in transition-metal doped monolayer AlN. Superlattices Microstruct. 2019, 122, 171–180. [Google Scholar] [CrossRef]
- Odkhuu, D.; Tsevelmaa, T.; Sangaa, D.; Tsogbadrakh, N.; Rhim, S.H.; Hong, S.C. First-principles study of magnetization reorientation and perpendicular magnetic anisotropy in CuFe2O4/MgO heterostructures. Phys. Rev. B. 2018, 98, 094408. [Google Scholar] [CrossRef]
- Sánchez Llamazares, J.L.; Zamora, J.; Sánchez-Valdés, C.F.; Álvarez-Alonso, P. Design and fabrication of a cryogenic magnetocaloric composite by spark plasma sintering based on the Ral2 Laves phases (R = Ho, Er). J. Alloys Compd., 2020, 831, 154779. [Google Scholar] [CrossRef]
- Sánchez Llamazares, J.L.; Ibarra Gaitán, P.; Sánchez-Valdés, C.F.; Álvarez-Alonso, P.; Varga, R. Enhanced magnetocaloric effect in rapidly solidified HoNi2 melt spun. J. Alloys Compd., 2019, 774, 700–705. [Google Scholar] [CrossRef]
- Schelp, W.; Leson, A.; Drewes, W.; Purwins, H.G. Magnetization and Magnetic Excitations in HoAl2. Z. Phys. B – Condensed Matter, 1983, 51, 41–47. [Google Scholar] [CrossRef]
- Gignoux, D.; Givord, F.; Lemaire, R. Magnetic properties of single crystals of GdCo2, HoNi2, and HoCo2, Phys. Rev. B, 12, 1975, 3878-3884. [CrossRef]
- Stein, F.; Leineweber, A. Laves phases: a review of their functional and structural applications and an improved fundamental understanding of stability and properties. J. Mater. Sci. 2021, 56, 5321–5427. [Google Scholar] [CrossRef]
- Liu, W.; Bykov, E.; Taskaev, S.; Bogush, M.; Khovaylo, V.; Fortunato, N.; Aubert, A.; Zhang, H.; Gottschall, T.; Wosnitza, J.; Scheibel, F.; Skokov, K.; Gutfleisch, O. A study on rare-earth Laves phases for magnetocaloric liquefaction of hydrogen. Appl. Mat. Today. 2022, 29, 101624. [Google Scholar] [CrossRef]
- Gschneidner, K.A. Jr; Pecharsky, V.K.; Tsokol, A.O. Recent developments in magnetocaloric materials. Rep. Prog. Phys. 2005, 68, 1479. [Google Scholar] [CrossRef]
- Kumar, K.S.; Hazzledine, P. M. Polytypic transformations in Laves phases. Intermetallics. 2004, 12, 763–770. [Google Scholar] [CrossRef]
- Biswas, A.; Pathak, A.K.; Zarkevich, N.A.; Liu, X.; Mudryk, Y.; Balema, V.; Johnson, D.D.; Pecharsky, V.K. Designed materials with the giant magnetocaloric effect near room temperature. Acta Materialia. 2019, 180, 341–348. [Google Scholar] [CrossRef]
- Kikugawa, N.; Kato, T.; Hayashi, M.; Yamaguchi, H. Single-Crystal Growth of a Cubic Laves-Phase Ferromagnet HoAl2 by a Laser Floating-Zone Method. Crystals, 2023, 13, 760. [Google Scholar] [CrossRef]
- de Souza, M.V.; Plaza, E.J.R.; Campoy, J.C.P. Anisotropic magnetoresistivity and magnetic entropy change in HoAl2. Intermetallics, 2016, 715, 51–53. [Google Scholar] [CrossRef]
- Gil, L.A.; Campoy, J.C.P.; Plaza, E.J.R.; de Souza, M.V. Conventional and anisotropic magnetic entropy change in HoAl2 ferromagnetic compound. JMMM, 2016, 409, 45–49. [Google Scholar] [CrossRef]
- Ibarra, M.R.; Moze, O.; Algarabel, P.A.; Arnaudas, J.I.; Abell, J.S.; del Moral, A. Magnetoelastic behavior and the spin-reorientation transition in HoAl2. J. Phys. C: Solid State Phys., 1988, 21, 2735–2748. [Google Scholar] [CrossRef]
- Cococcioni, M.; de Gironcoli, S. Linear response approach to the calculation of the effective interaction parameters in the LDA+U method. Phys. Rev. B. 2005, 71, 035105. [Google Scholar] [CrossRef]
- Anisimov, V.I.; Zaanen, J.; Andersen, O.K. Band theory and Mott insulators: Hubbard U instead of Stoner I. Phys. Rev. B. 1991, 44, 943. [Google Scholar] [CrossRef]
- Moroni, E.G.; Kresse, G.; Hafner, J.; Furthmüller, J. Ultrasoft pseudopotentials applied to magnetic Fe, Co, and Ni: From atoms to solids. Phys. Rev. B. 1997, 56, 15629. [Google Scholar] [CrossRef]
- Hafner, J.; Wolverton, C.; Ceder, G. Toward computational materials design: the impact of density functional theory on materials research. MRS Bulletin. 2006, 31, 659–668. [Google Scholar] [CrossRef]
- Staroverov, V. N.; Scuseria, G. E.; Tao, J.; Perdew, J. P. Test of the ladder of density functionals for bulk solids and surfaces. Phys. Rev. B. 2004, 69, 075102. [Google Scholar] [CrossRef]
- Lewars, E. Computational chemistry: introduction to the theory and applications of molecular and quantum mechanics. First edition, 2004. ISBN: 0-306-48391-2, Print ISBN: 1-4020-7285-6.
- Clark, S.J.; Seagall, M.D.; Pickard, C.J.; Hasnip, P.J.; Probert, M.I.J.; Refson, K.; Payne, M.C. First principles methods using CASTEP. Z. Kristallogr. 2005, 220, 567–570. [Google Scholar] [CrossRef]
- Bader, R.F.W. The density in density functional theory. J. Molec. Struct.: THEOCHEM. 2010, 943, 2–18. [Google Scholar] [CrossRef]
- Monkhorst, H.J.; Pack, J.D. Special points for Brillouin-zone integrations, Phys. Rev. B. 1976, 13, 5188. [Google Scholar] [CrossRef]
- Villars, P.; Cenzual, K.; Okamoto, H.; Hulliger, F.; Iwata, S. HoNi2 Crystal Structure: Datasheet from “PAULING FILE MULTINARIES EDITION – 2012”. Springer Materials.
- Tipler, P.A.; Llewellyn, R. Modern Physics, 5th ed.; W.H. Freeman and Company: New York, NY, USA, 2008; ISBN 13. [Google Scholar]
- Cyrot, M.; Lavagna, M. Density of states and magnetic properties of the rare-earth compounds RFe2, RCo2 and RNi2. Le Journal de Physique. 1979, 40, 763. [Google Scholar] [CrossRef]
- von Ranke, P.J.; Pecharsky, V.K.; Gschneidner, K.A. Jr. ; Influence of the crystalline electrical field on the magnetocaloric effect of DyAl2, ErAl2 and DyNi2. Phys. Rev. B. [CrossRef]
- de Oliveira, I.G.; Garcia, D.C.; von Ranke, P.J. ; Spin reorientation and magnetocaloric effect study in HoAl2 by a microscopic model Hamiltonian. J. Appl. Phys. [CrossRef]
- Campoy, J.C.P.; Plaza, E.J.R.; Coelho, A.A.; Gama, S. ; Magnetoresistivity as a probe to the field-induced change of magnetic entropy in RAl2 compounds (R=Pr,Nd,Tb,Dy,Ho,Er). Phys. Rev. B, 74, 2006, 134410. [CrossRef]
- Taylor, K.N.R. ; Intermetallic rare-earth compounds. Advances in Physics, 1971, 20, 551–660. [Google Scholar] [CrossRef]
- Farrell, J.; Wallace, W.E. ; Magnetic properties of intermetallic compounds between the lanthanides and nickel or cobalt. Inorg. Chem., 1966, 5, 1, 105–109. [Google Scholar] [CrossRef]
Figure 1.
Schematic representation of the MgCu2 cubic crystal structure (a) and primitive cell (rhombohedral trigonal) (b) of the ferromagnetically ordered HoAl2 and HoNi2 Laves phases. The silver and brown spheres represent the elements Al or Ni, and the rare earth element Ho, respectively. The black arrows show that the Ho magnetic moment points along the c-axis.
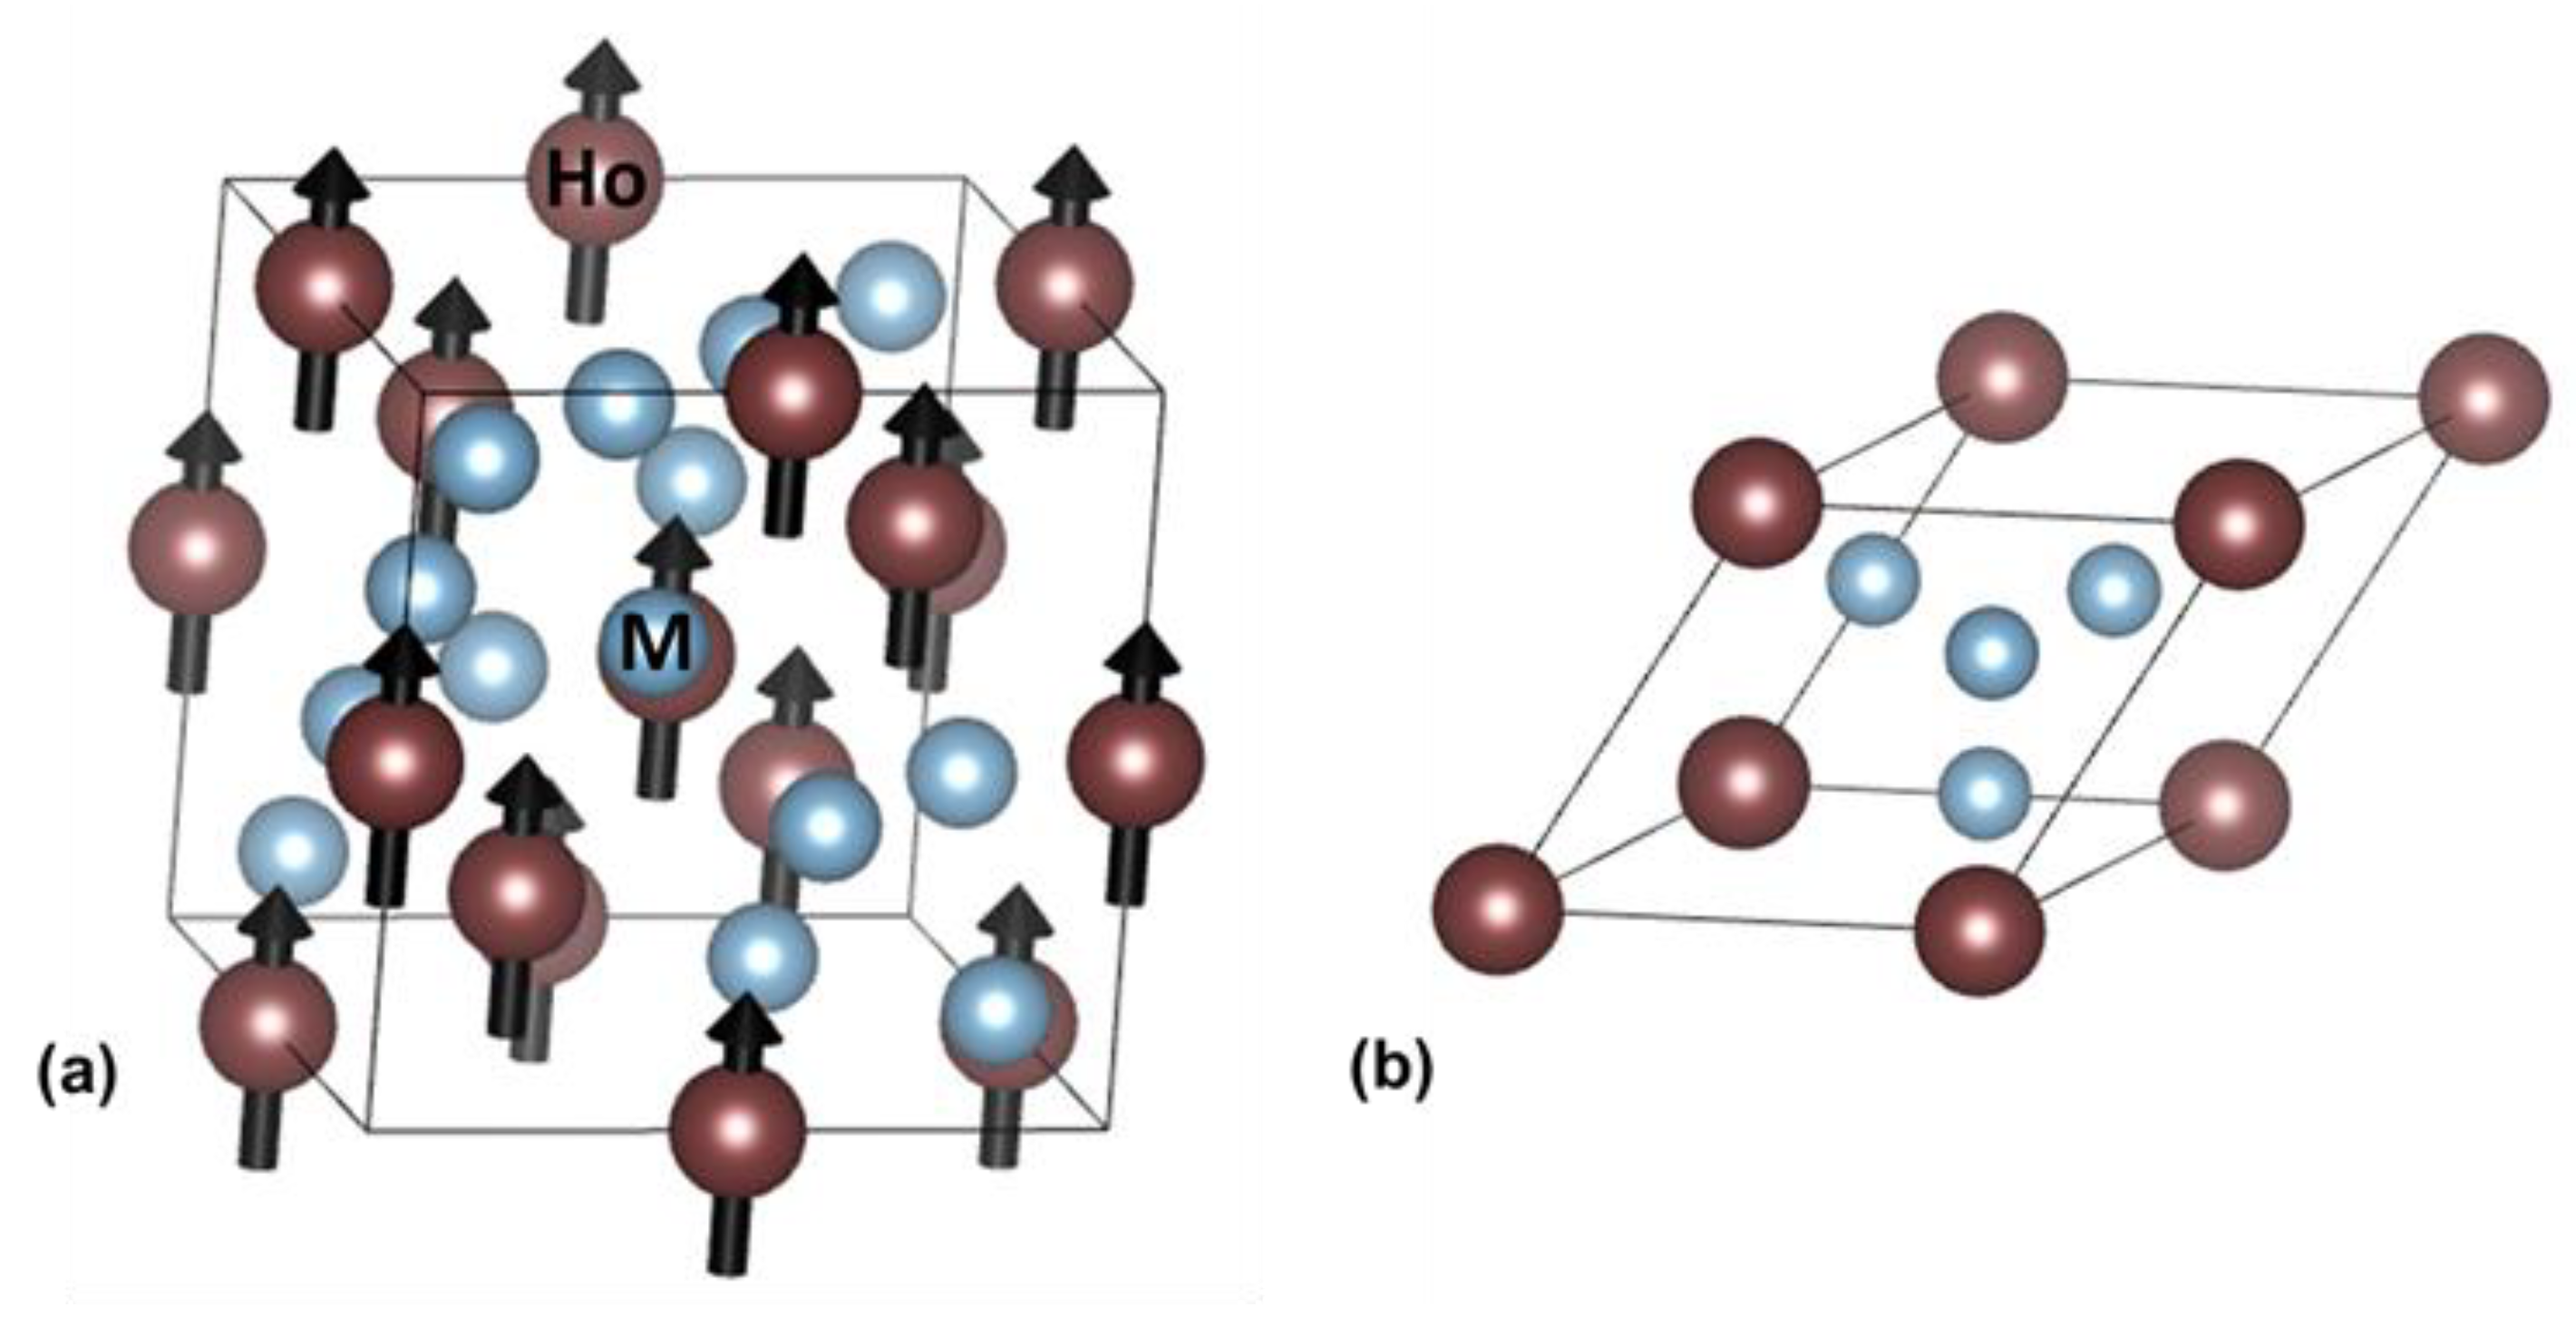
Figure 2.
Electronic specific heat capacity coefficient as a function of the applied hydrostatic pressure for HoAl2 and HoNi2 alloys.
Figure 2.
Electronic specific heat capacity coefficient as a function of the applied hydrostatic pressure for HoAl2 and HoNi2 alloys.
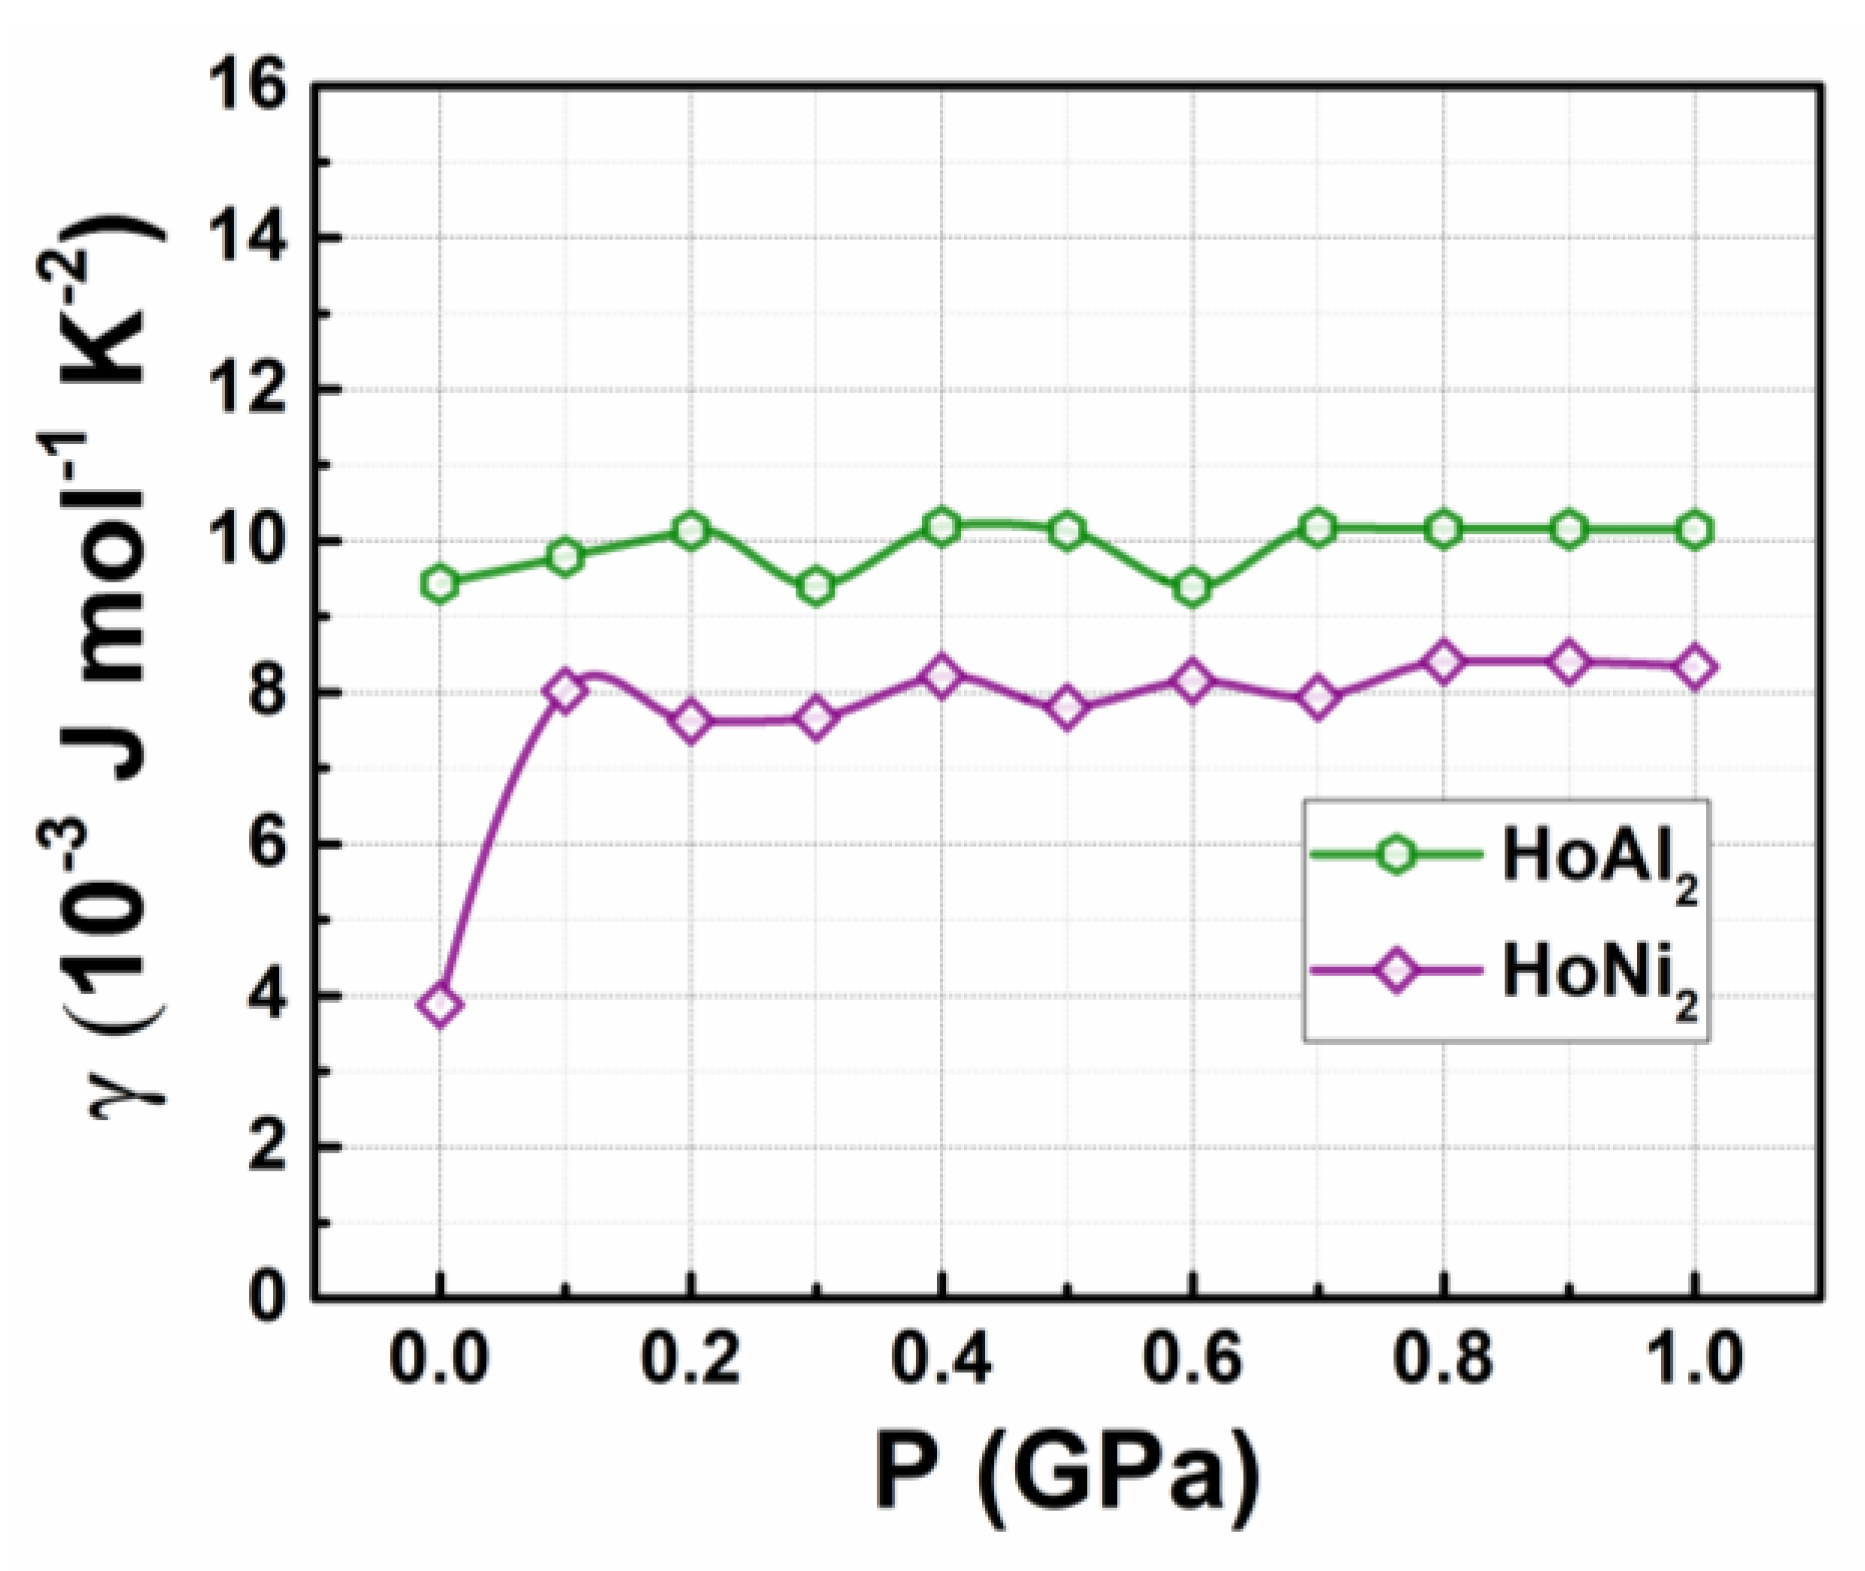
Figure 3.
Total DOS at P = 0 GPa obtained for ferromagnetically ordered (a) HoAl2 and (b) HoNi2 compounds.
Figure 3.
Total DOS at P = 0 GPa obtained for ferromagnetically ordered (a) HoAl2 and (b) HoNi2 compounds.
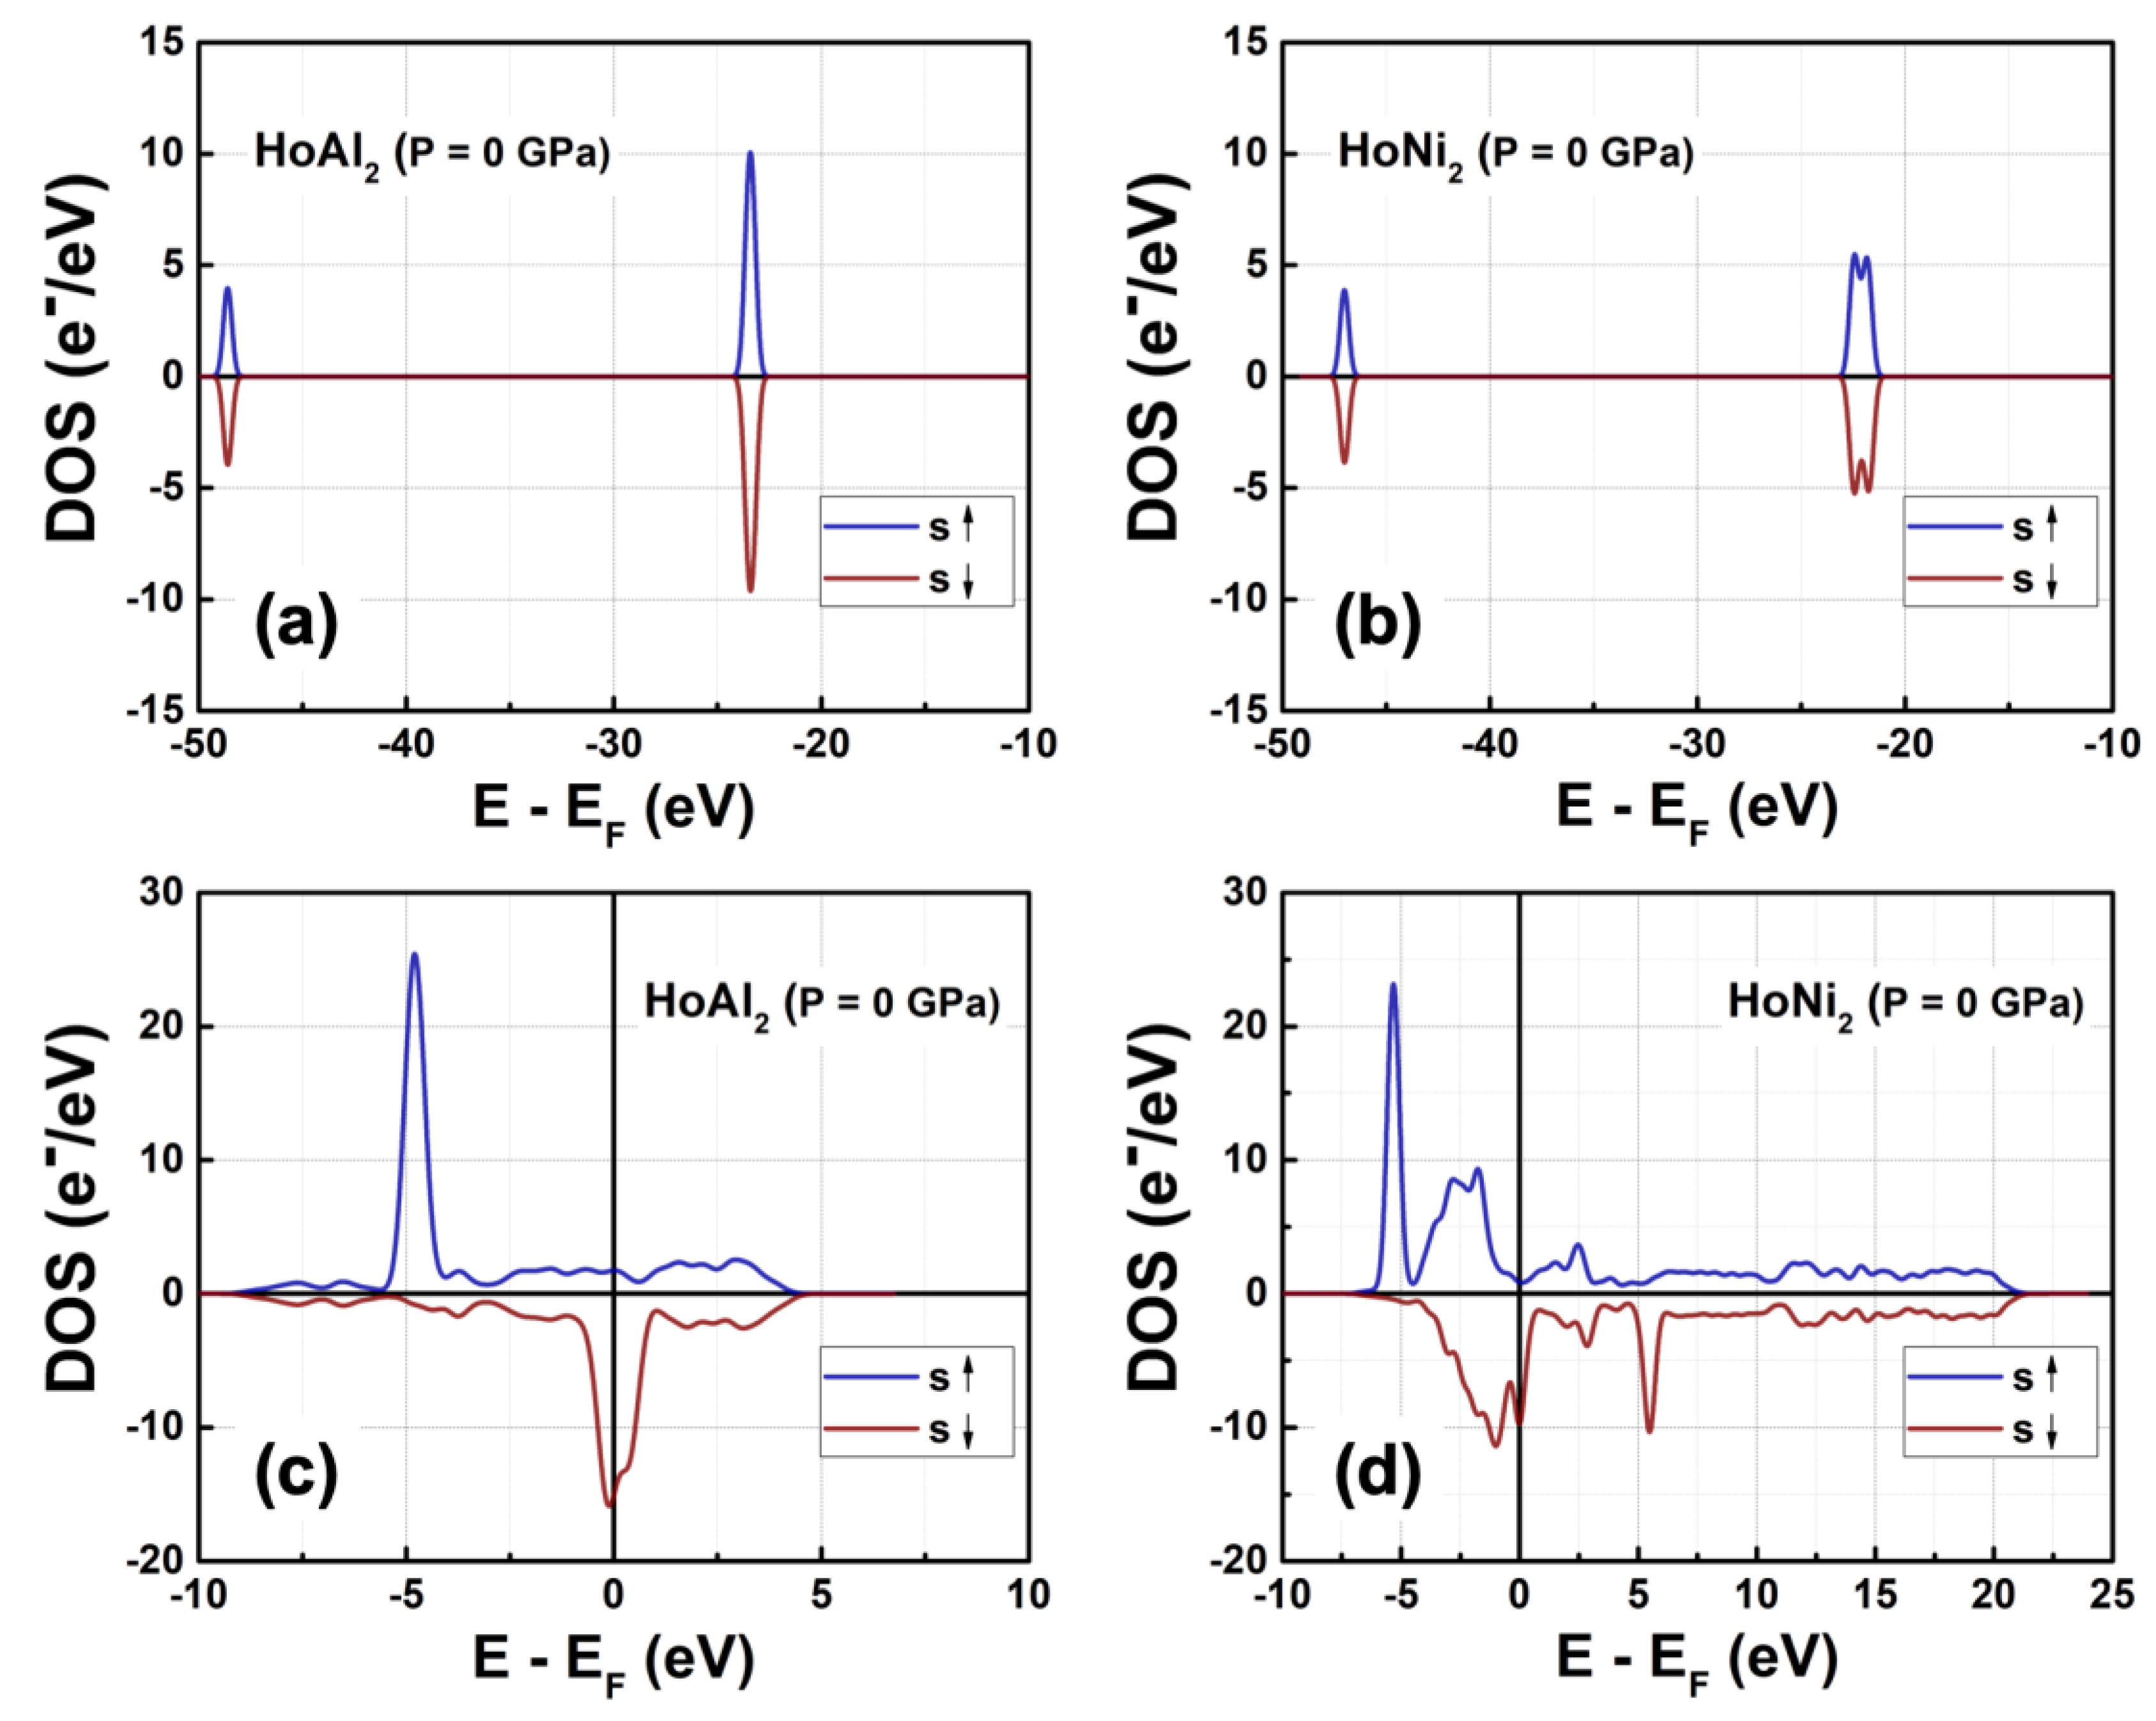
Figure 4.
Total DOS obtained for ferromagnetically ordered (a) HoAl2 and (b) HoNi2 crystal structures under externals hydrostatic pressures between 0 GPa and 1.0 GPa. Selected curves are shown to provide visual insight.
Figure 4.
Total DOS obtained for ferromagnetically ordered (a) HoAl2 and (b) HoNi2 crystal structures under externals hydrostatic pressures between 0 GPa and 1.0 GPa. Selected curves are shown to provide visual insight.
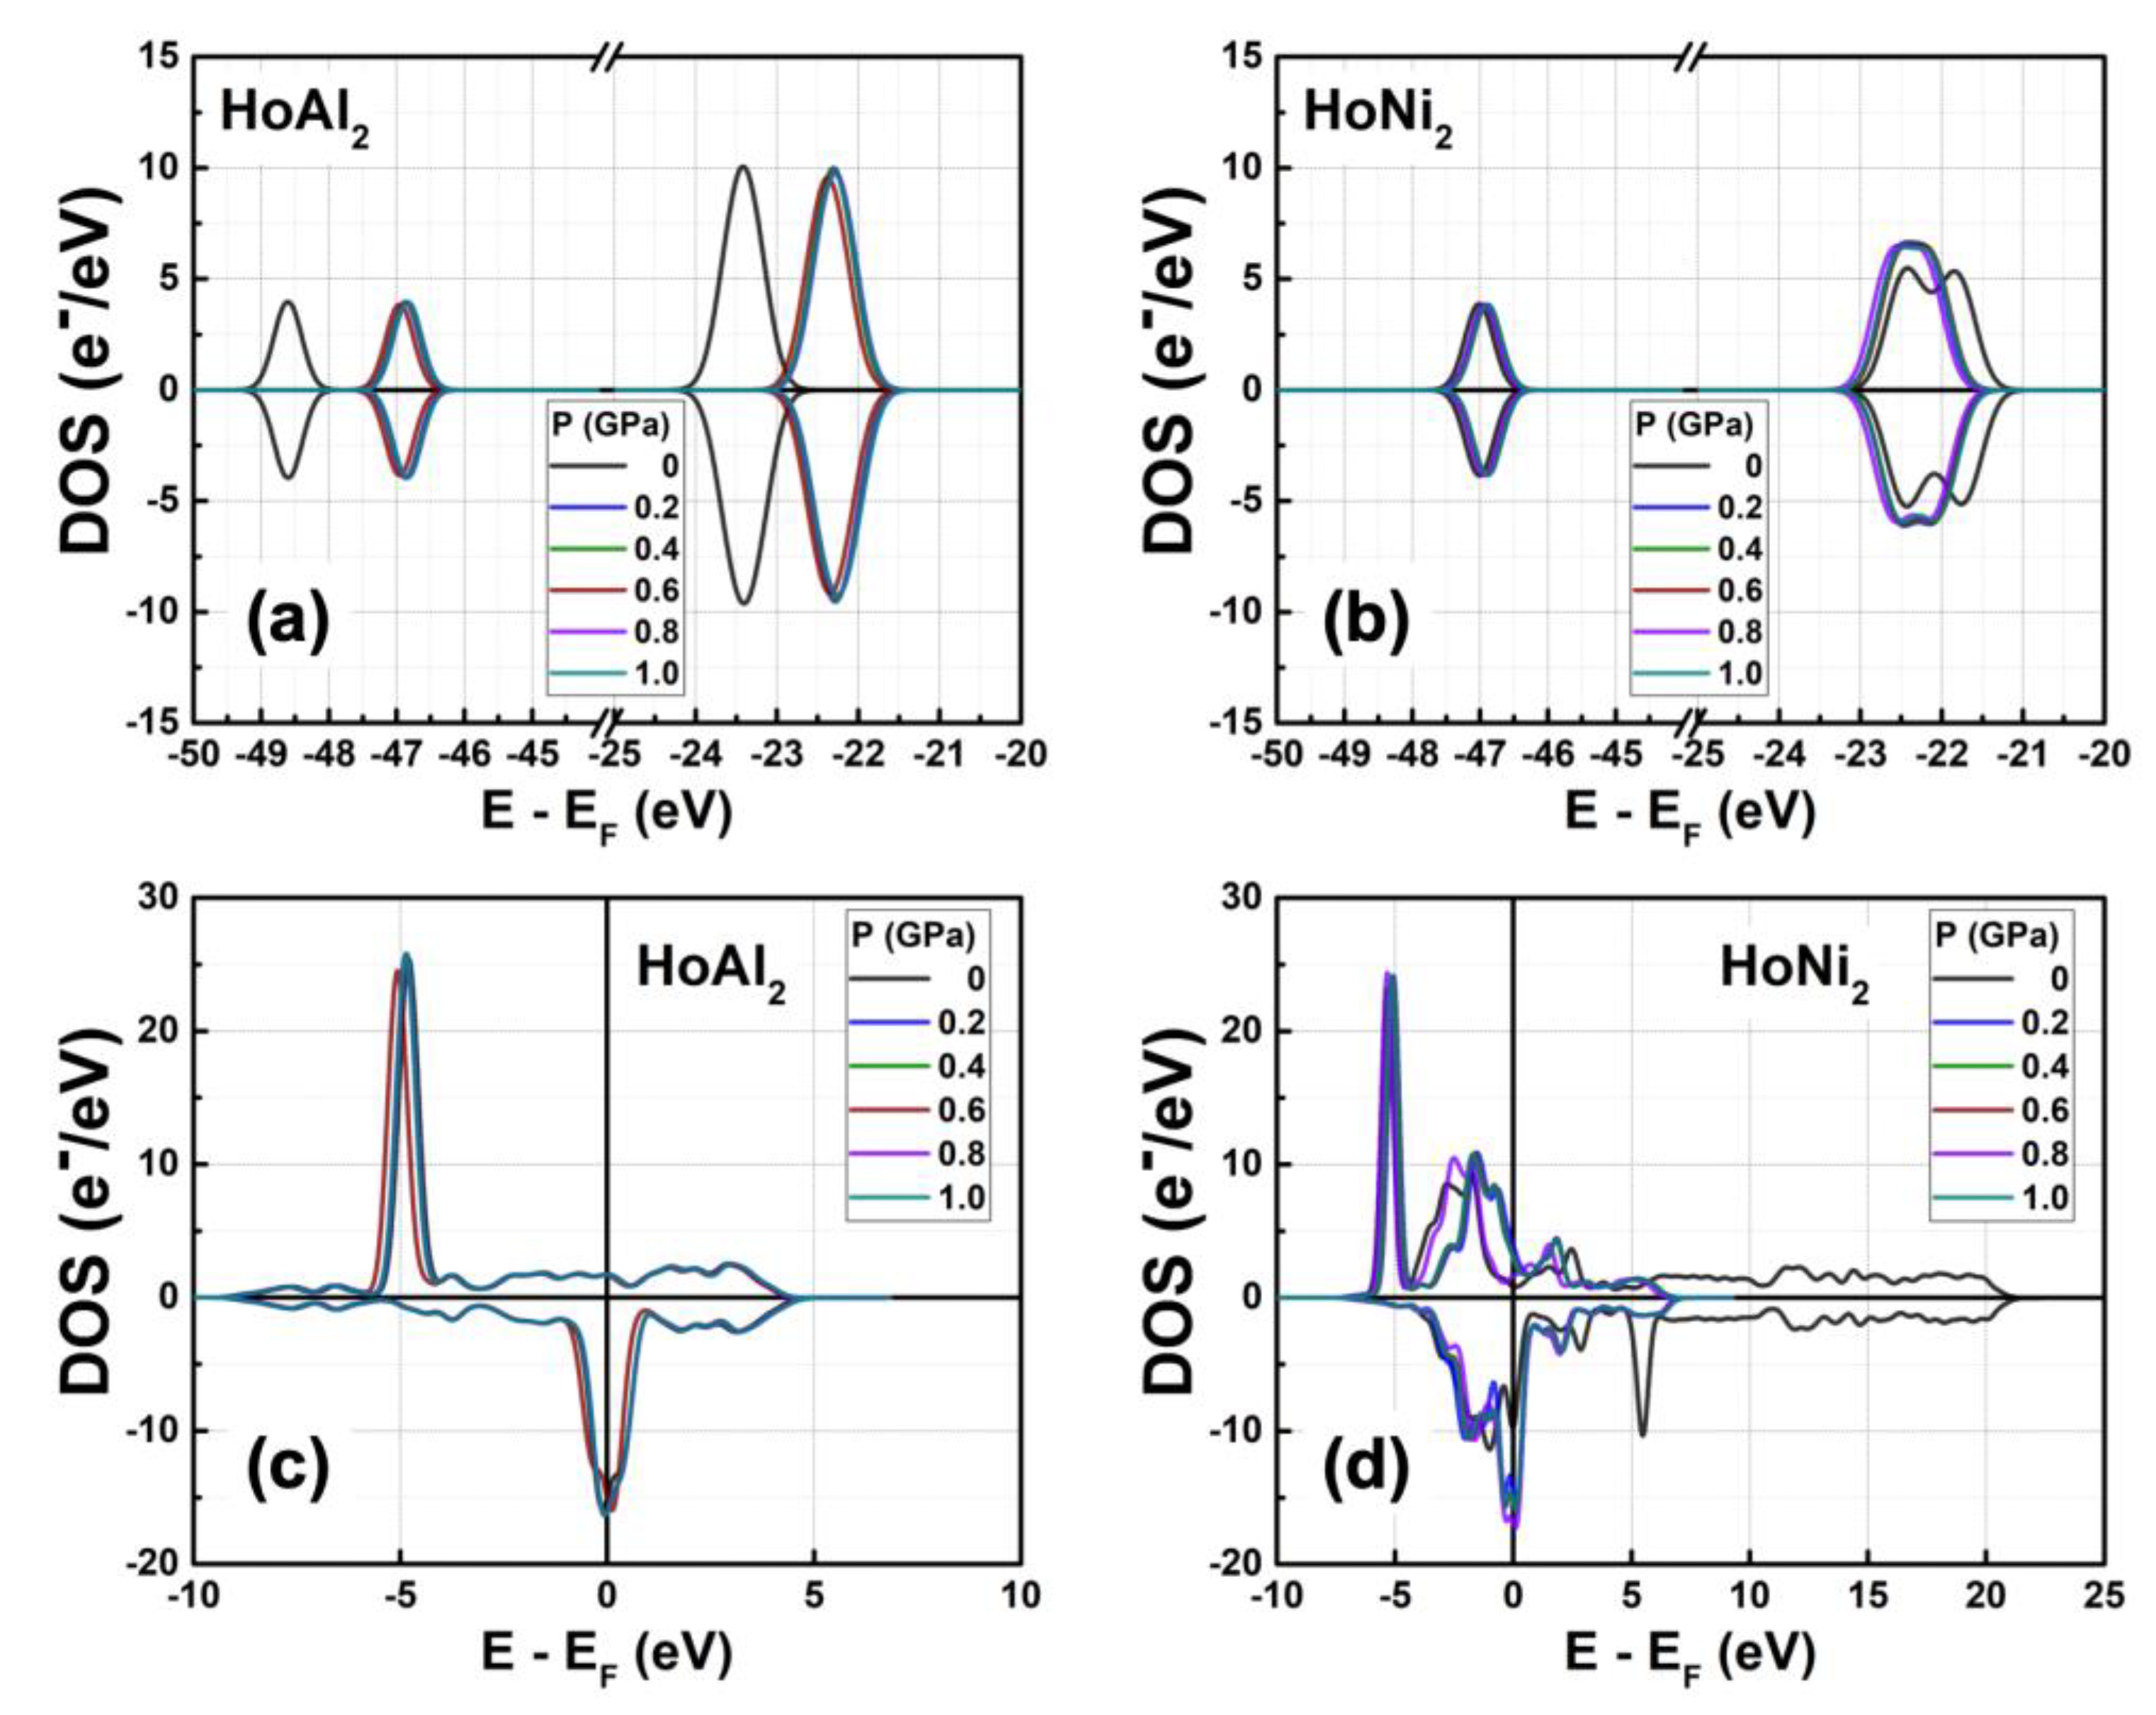
Figure 5.
(a) Total magnetic moment and (b) contributions from electrons in the d and f orbitals to the magnetic moment in ferromagnetically ordered HoAl₂ and HoNi₂ Laves phases, plotted as a function of external hydrostatic pressure (0 GPa ≤ P ≤ 1.0 GPa). The μT and μP values are obtained from the total and partial DOS, respectively.
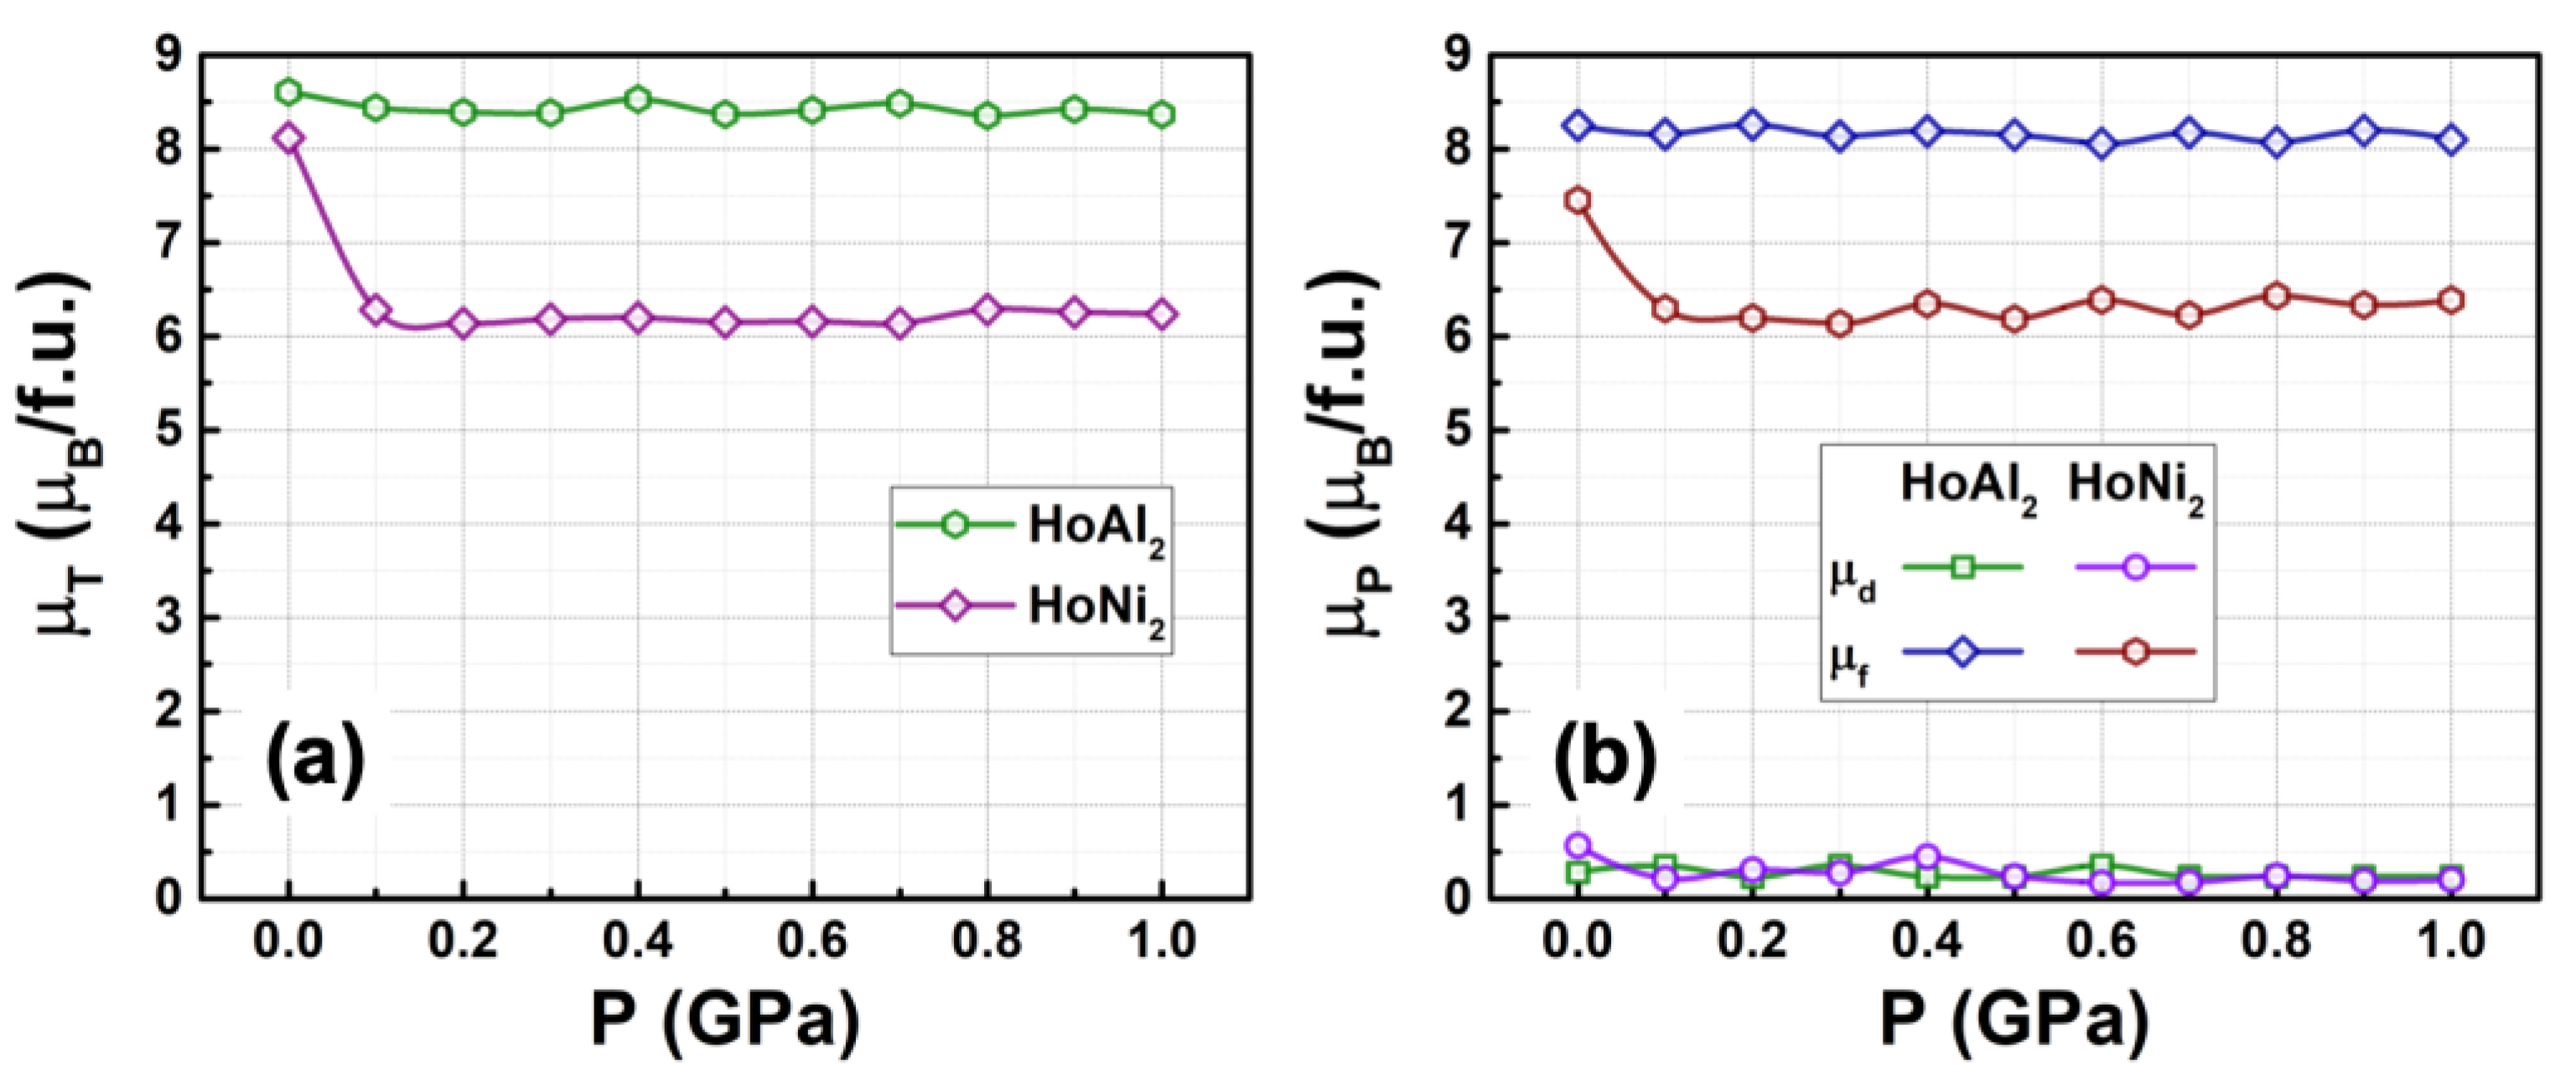
Figure 6.
Partial DOS at P = 0 GPa obtained for (a) d and (b) f orbitals in the ferromagnetically ordered HoM2 with M = {Al, Ni} Laves phases.
Figure 6.
Partial DOS at P = 0 GPa obtained for (a) d and (b) f orbitals in the ferromagnetically ordered HoM2 with M = {Al, Ni} Laves phases.
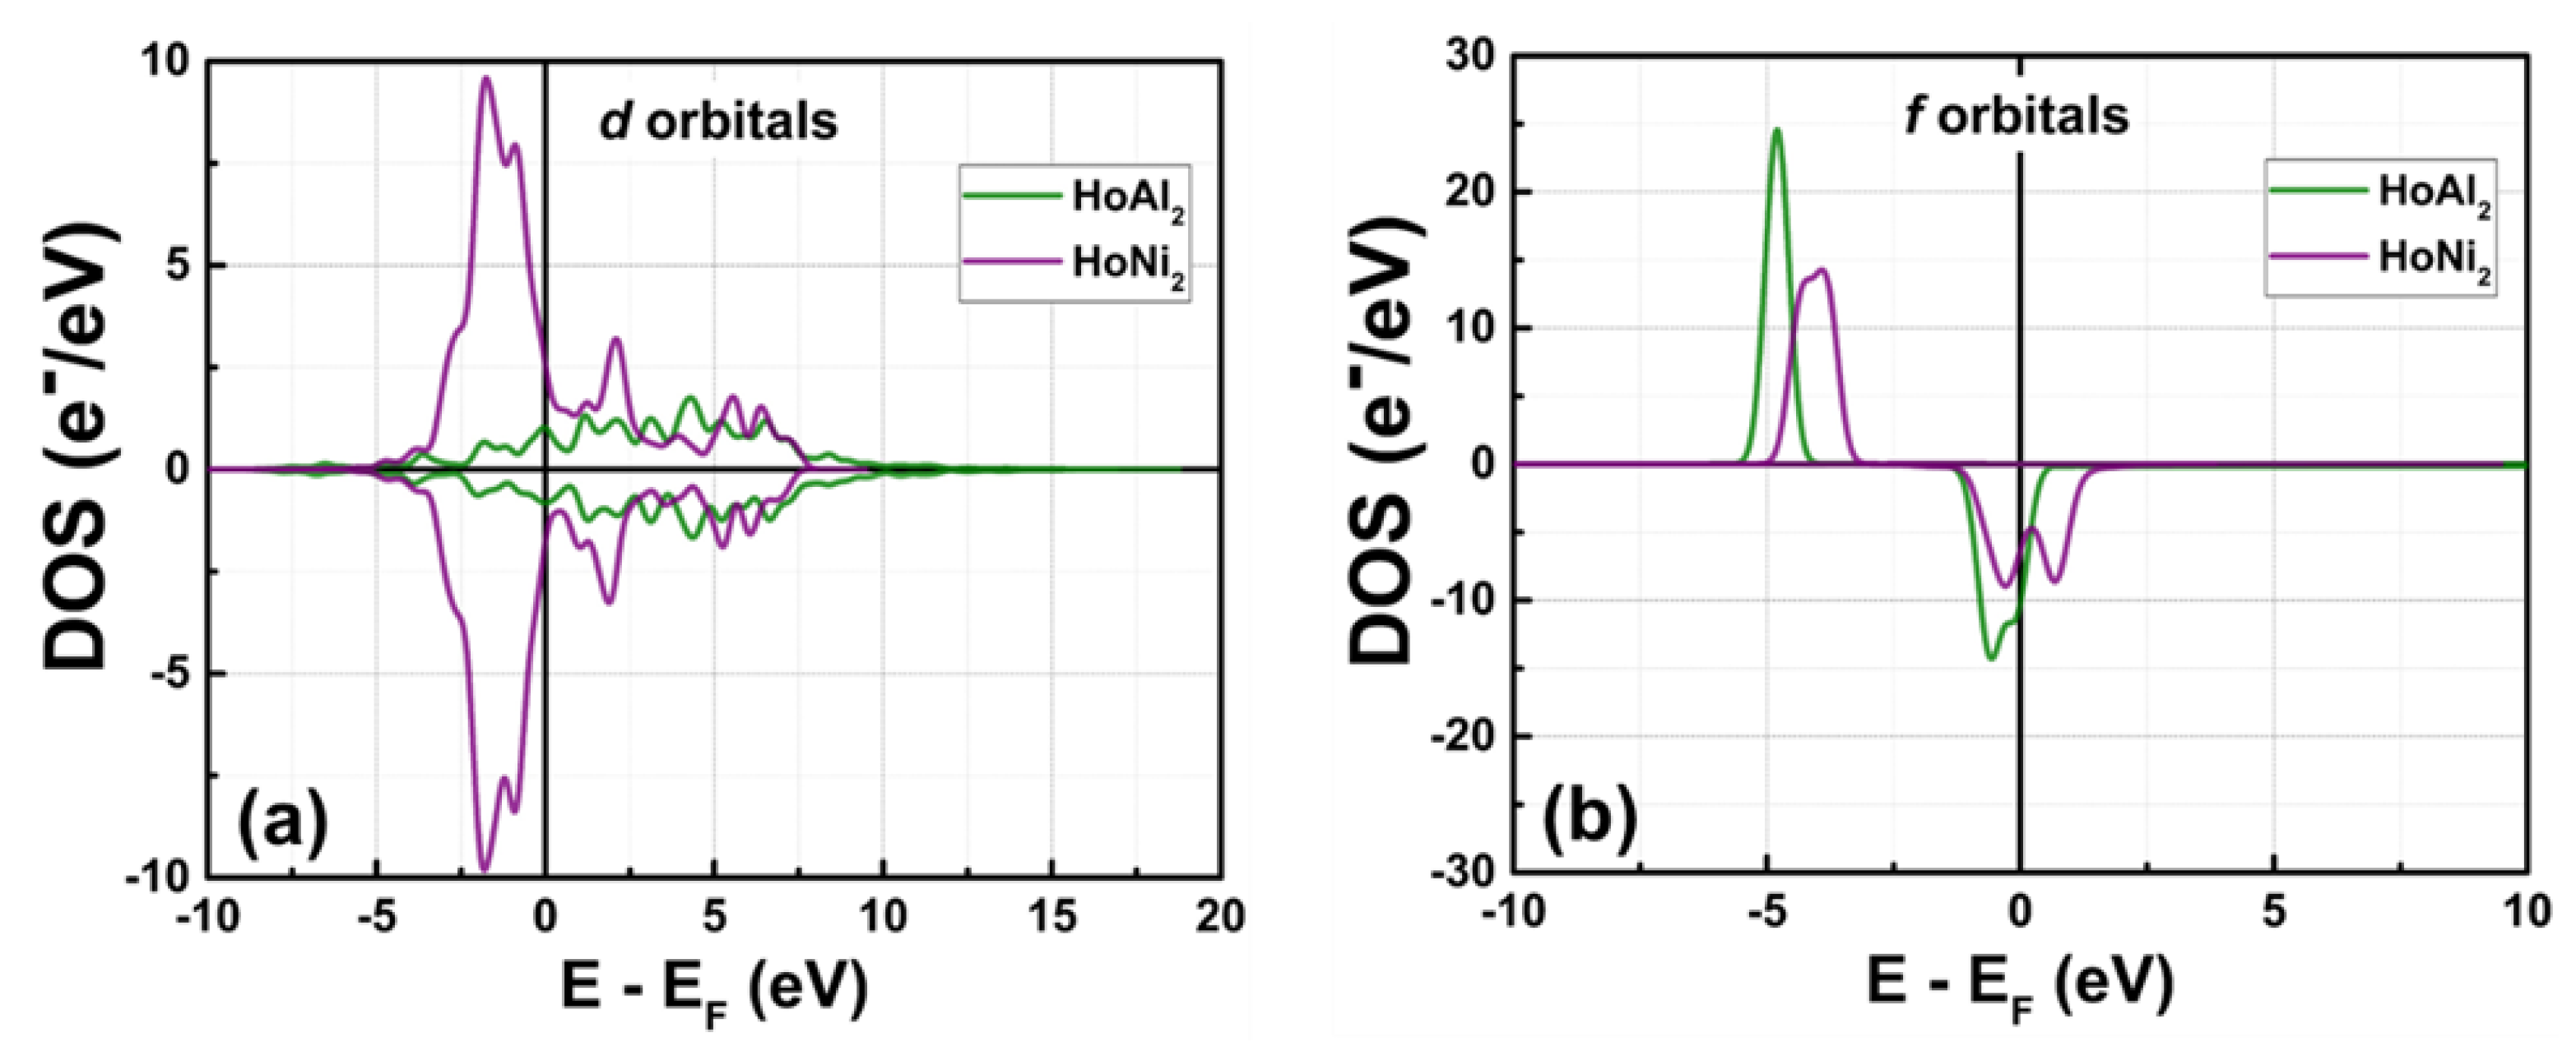
Figure 7.
Partial DOS obtained for (a), (c) d and (b), (d) f orbitals of ferromagnetically ordered HoAl2 and HoNi2 crystal structures, respectively, under external hydrostatic pressures ranging from 0 GPa to 1.0 GPa (selected curves are shown for better visualization).
Figure 7.
Partial DOS obtained for (a), (c) d and (b), (d) f orbitals of ferromagnetically ordered HoAl2 and HoNi2 crystal structures, respectively, under external hydrostatic pressures ranging from 0 GPa to 1.0 GPa (selected curves are shown for better visualization).
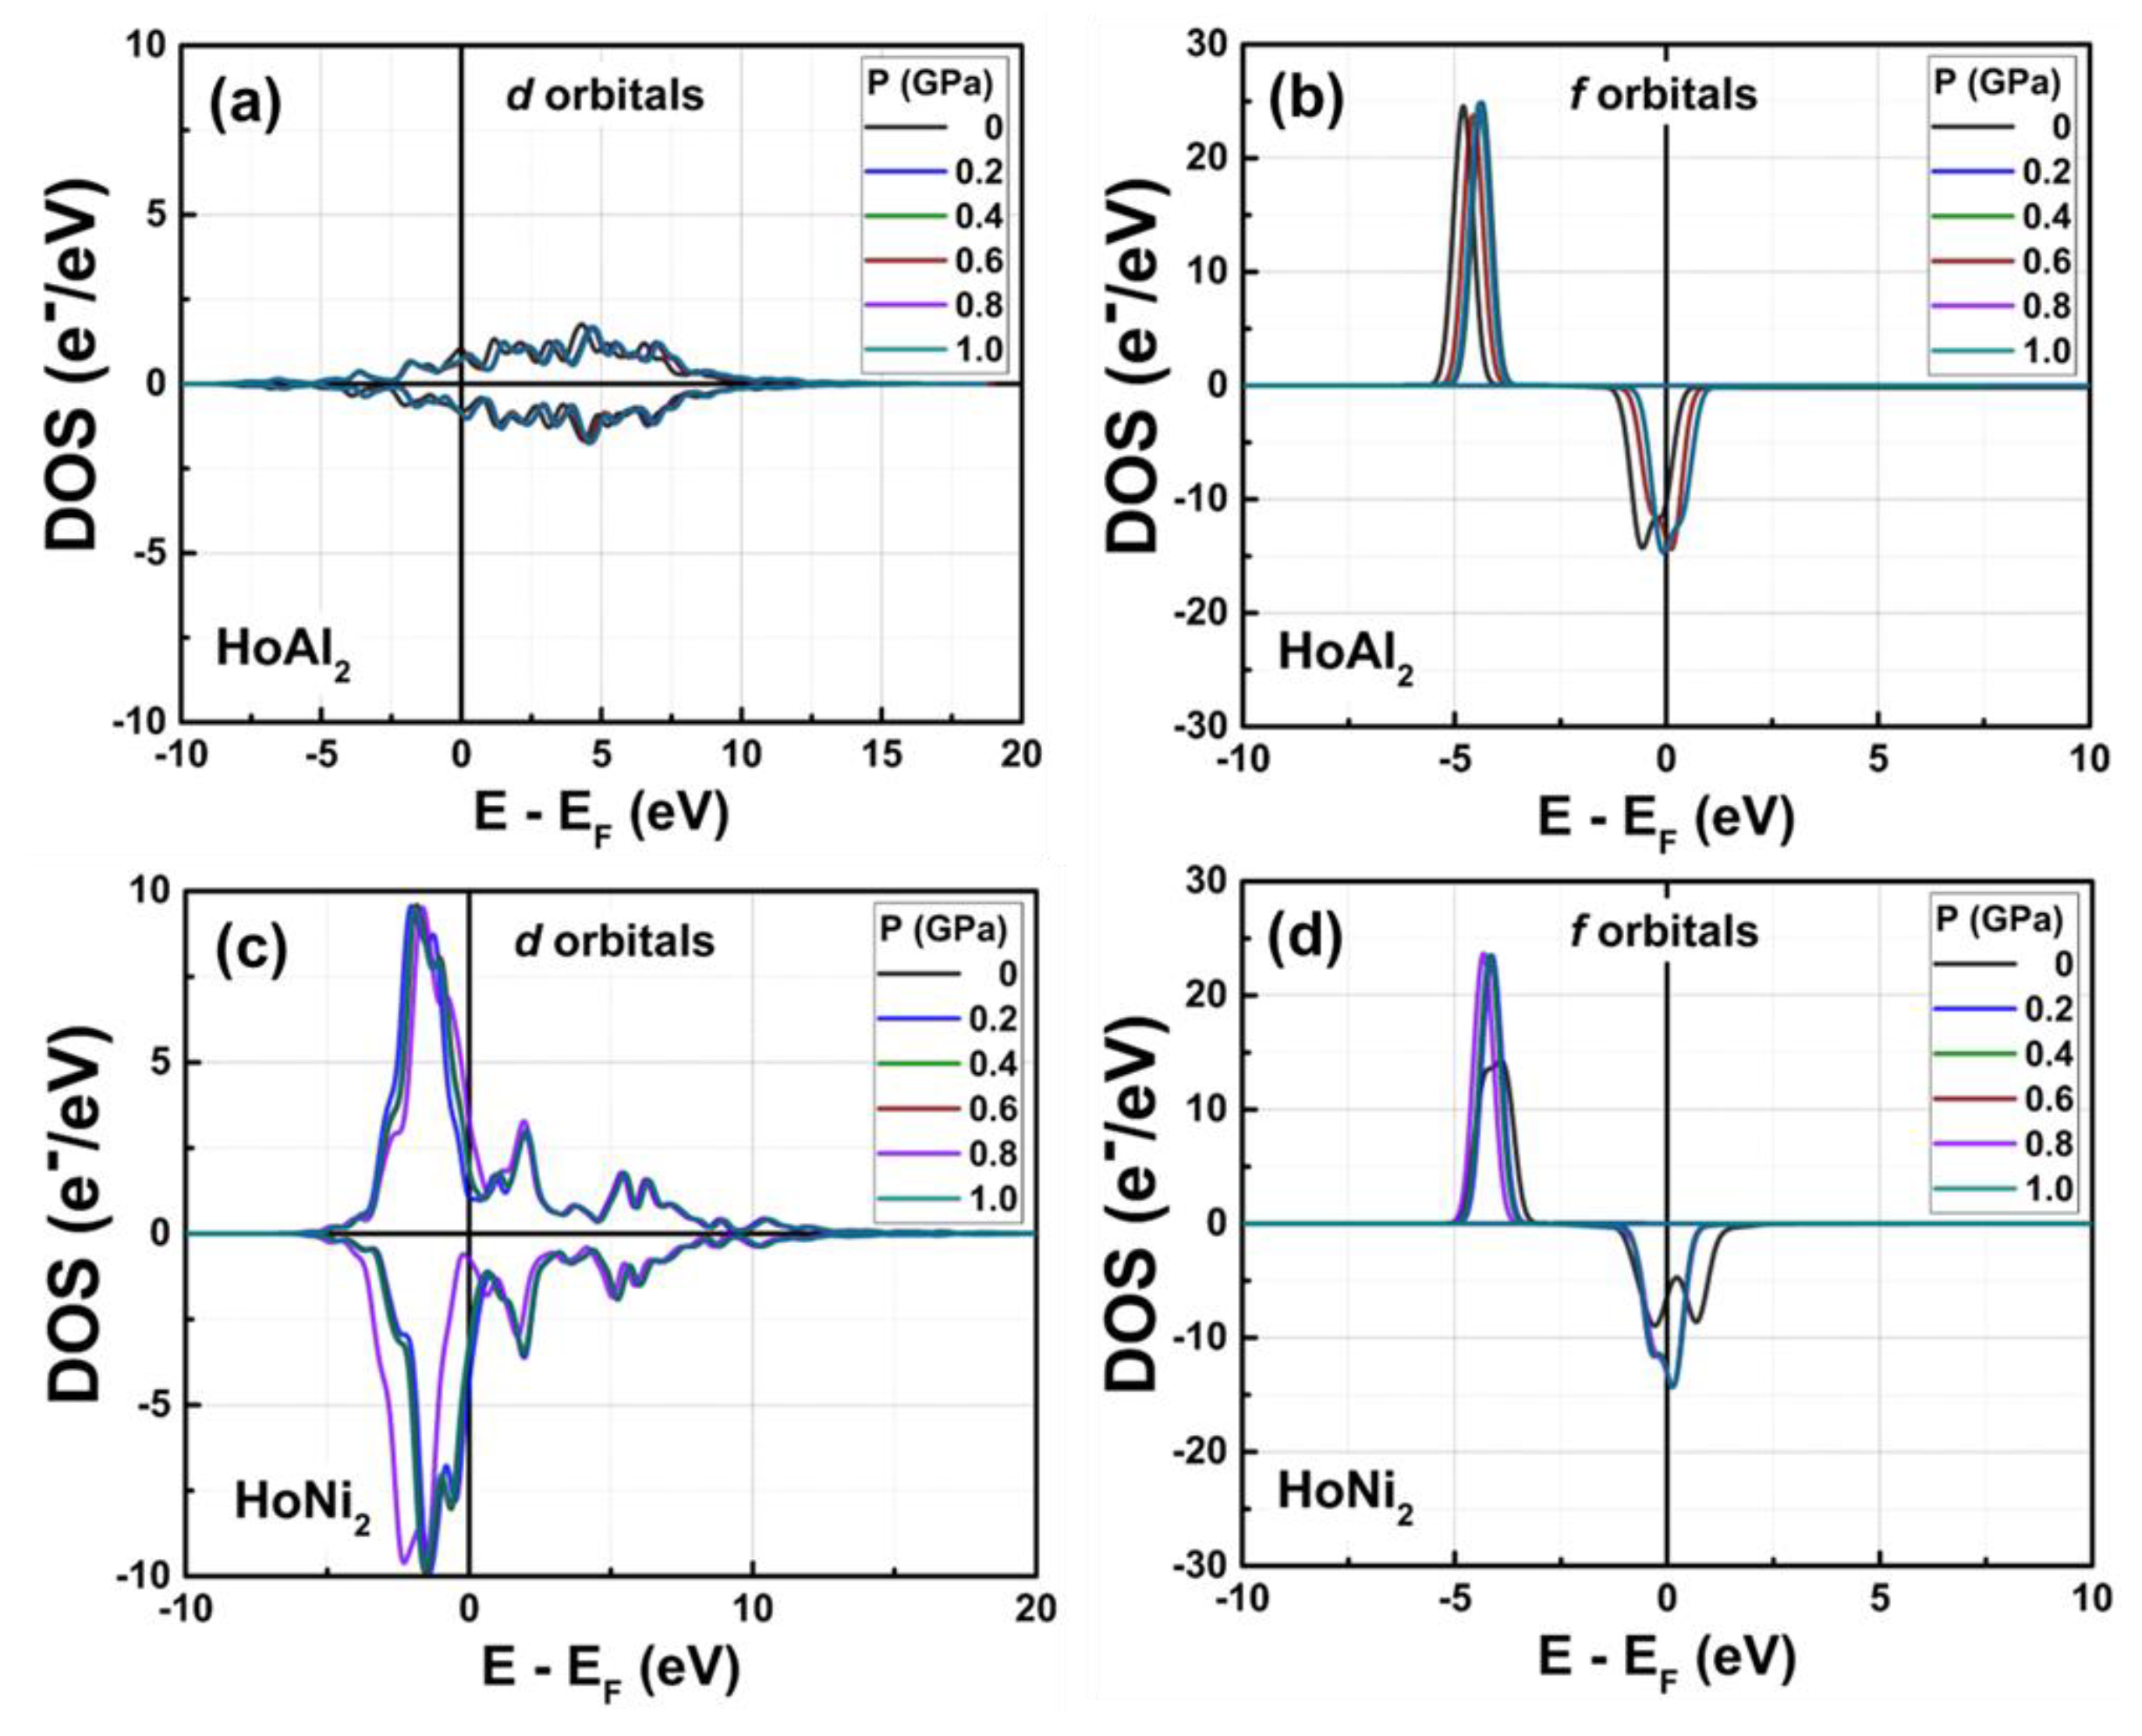

Table 1.
Diagonal component σij of stress tensor, bulk modulus B, primitive unit cell volume VP (i.e., rhombohedral trigonal), the compressive stress Δ, and interatomic Al-Al, Ho-Al, and Ho-Ni distances obtained for the HoAl2 and HoNi2 Laves phases under applied hydrostatic pressures of 0 GPa ≤ P ≤ 1.0 GPa.
| Alloy | HoAl2 | HoNi2 | ||||||||||||
|---|---|---|---|---|---|---|---|---|---|---|---|---|---|---|
| P (GPa) |
B (GPa) |
σij (GPa) |
a (Å) | dAl-Al (Å) |
dHo-Al (Å) |
VP (Å3) | Δ (%) | B (GPa) |
σij (GPa) |
a (Å) | dNi-Ni (Å) |
dHo-Ni (Å) |
VP (Å3) | Δ (%) |
| 0.0 | 40.66 | – 0.00005 | 5.652 | 2.826 | 3.314 | 127.675 | 0.000 | 49.79 | – 0.00115 | 5.262 | 2.631 | 3.086 | 103.066 | 0.000 |
| 0.1 | 45.68 | – 0.10067 | 5.646 | 2.823 | 3.311 | 127.299 | −0.294 | 56.58 | – 0.10030 | 5.258 | 2.629 | 3.083 | 102.840 | −0.219 |
| 0.2 | 52.56 | – 0.19968 | 5.640 | 2.820 | 3.307 | 126.908 | −0.600 | 58.98 | – 0.19724 | 5.255 | 2.628 | 3.081 | 102.655 | −0.399 |
| 0.3 | 56.69 | – 0.29771 | 5.635 | 2.818 | 3.304 | 126.533 | −0.894 | 60.33 | – 0.30162 | 5.252 | 2.626 | 3.080 | 102.480 | −0.569 |
| 0.4 | 58.00 | – 0.39932 | 5.629 | 2.815 | 3.301 | 126.165 | −1.182 | 68.79 | – 0.40011 | 5.248 | 2.624 | 3.077 | 102.241 | −0.801 |
| 0.5 | 60.58 | – 0.49793 | 5.623 | 2.812 | 3.297 | 125.780 | −1.484 | 71.50 | – 0.50638 | 5.245 | 2.623 | 3.076 | 102.072 | −0.964 |
| 0.6 | 64.07 | – 0.60178 | 5.618 | 2.809 | 3.294 | 125.380 | −1.797 | 76.23 | – 0.60287 | 5.242 | 2.621 | 3.074 | 101.868 | −1.162 |
| 0.7 | 65.22 | – 0.70149 | 5.613 | 2.807 | 3.291 | 125.055 | −2.052 | 82.56 | – 0.69933 | 5.239 | 2.620 | 3.072 | 101.703 | −1.322 |
| 0.8 | 66.65 | – 0.80276 | 5.607 | 2.804 | 3.288 | 124.681 | −2.345 | 84.36 | – 0.80034 | 5.235 | 2.618 | 3.070 | 101.479 | −1.540 |
| 0.9 | 68.37 | – 0.89994 | 5.602 | 2.801 | 3.285 | 124.328 | −2.621 | 91.47 | – 0.89917 | 5.232 | 2.616 | 3.068 | 101.321 | −1.693 |
| 1.0 | 70.89 | – 0.99911 | 5.597 | 2.799 | 3.282 | 123.992 | −2.884 | 98.45 | – 0.99998 | 5.229 | 2.615 | 3.066 | 101.132 | −1.876 |
Table 2.
The calculated values of Fermi energy (EF), Fermi temperature (TF) and the electronic specific heat capacity coefficient (
Table 2.
The calculated values of Fermi energy (EF), Fermi temperature (TF) and the electronic specific heat capacity coefficient (
| Laves phases | (eV) | (10–4 K) | (10–3 J mol–1 K–2) |
|---|---|---|---|
| HoAl2 | 2.392 | 2.777 | 1.476 |
| HoNi2 | 2.869 | 3.331 | 1.231 |
Table 3.
Cell parameter a, calculated magnetic moment µT and magnetization of HoAl2 and HoNi2 compared with experimental data reported in the literature.
Table 3.
Cell parameter a, calculated magnetic moment µT and magnetization of HoAl2 and HoNi2 compared with experimental data reported in the literature.
| Laves phase |
Alloy type |
a (Å) |
µT (µB/f.u.) |
(K) | MS (Am2kg-1) |
magnetization axis |
reference |
|---|---|---|---|---|---|---|---|
| HoAl2 | DFT+U framework | 7.810 | 8.61 a | - | 220 a | <001>; intermediate | this work |
| single-crystal | 7.816 c 7.838 |
9.18 b 9.15 c |
31.5 29.0 |
235 b 234 c |
<011>; easy | [18] [25] |
|
| bulk polycrystalline | 7.8024 | 7.86 | 27.0 | 201 | close to <001>; intermediate | [44] | |
| polycrystalline ribbons | 7.8109 | 7.08 c,e | 24.0 | 181 c,e | close to <001>; intermediate | [16] | |
| HoNi2 | DFT+U framework | 7.130 | 8.12 a | - | 161 a | <001>; easy | this work |
| single-crystal | - | 8.52 d | 13.4 | 168 d | <001>; easy | [19] | |
| bulk polycrystalline | 7.1318 | 8.40 | 22.0 | 167 | very close to <001>; easy | [44,45] | |
| polycrystalline ribbons | 7.1497 | 8.02 c | 13.9 | 159 c | close to <001>; easy | [17] | |
| Experimental data measured at temperature: a T = 0 K. b T = 4.2 K. c T = 2.0 K. d T = 1.4 K. e determined from Figure A2. The crystal structure cell unit is reported to room temperature. | |||||||
Table 4.
Net magnetic moment values calculated using eq. (5) from the obtained DOS and compared with experimental data [18,19]. Electronic quantities with spin up and down, along with the difference in electronic states at the Fermi level, are shown for the ferromagnetically ordered HoAl2 and HoNi2 Laves phases along <001> direction.
| Alloy |
nS↑ (EF) (e–/eV) |
nS↓ (EF) (e–/eV) |
Δn(EF) (e–/eV) |
(µB/f.u.) | (µB/f.u.) | (µB/f.u.) |
μs (μB/f.u.) |
μp (μB/f.u.) |
μd (μB/f.u.) |
μf (μB/f.u.) |
μP (μB/f.u.) |
| HoAl2 | 1.76 | –15.10 | –13.34 | 31.30 | –22.69 | 8.61 † | –0.03 | 0.04 | 0.28 | 8.79 | 9.08 |
| HoNi2 | 14.59 | –9.11 | 5.48 | 37.08 | –28.96 | 8.12 ‡ | 0.11 | –0.17 | 0.57 | 7.45 | 7.96 |
| Experimental values of total magnetic moment : † 9.18 µB/f.u. [18], and ‡ 8.52 µB/f.u. [19]. | |||||||||||
Disclaimer/Publisher’s Note: The statements, opinions and data contained in all publications are solely those of the individual author(s) and contributor(s) and not of MDPI and/or the editor(s). MDPI and/or the editor(s) disclaim responsibility for any injury to people or property resulting from any ideas, methods, instructions or products referred to in the content. |
© 2025 by the authors. Licensee MDPI, Basel, Switzerland. This article is an open access article distributed under the terms and conditions of the Creative Commons Attribution (CC BY) license (http://creativecommons.org/licenses/by/4.0/).
Copyright: This open access article is published under a Creative Commons CC BY 4.0 license, which permit the free download, distribution, and reuse, provided that the author and preprint are cited in any reuse.


