
Submitted:
02 September 2025
Posted:
02 September 2025
You are already at the latest version
Abstract
As the world's population ages, the incidence of chronic disorders is on the rise. Active Implantable Medical Devices are therefore evolving to meet the challenge. As the size of these devices decreases to facilitate implantation, the challenge of providing stable, continuous power becomes significant. Lithium batteries provide reliable, stable power to implants, however, their miniaturization leads to a reduction in the stored energy capacity, total lifespan and overall capability. Consequently, there is need for on-body energy harvesting alternatives. This study utilizes literature data on abiotic glucose fuel cells to feed into a Finite Element model incorporating both diffusion and reaction aspects to investigate how the 3D macro architecture of the fuel cell device can be used to optimize the energy output. Accordingly, optimal 3D architectures are determined to enable power outputs ranging from several tens to one hundred microwatts from an implantable package.. This will help with the 3D architecture design of future similar abiotic fuel cell units and speed up the process of figuring out the best settings for key parameters (like shape, size, and separation).
Keywords:
Abiotic
; Fuel cell
; Glucose
; Implantable
1. Introduction
Owing to their capacity to manage chronic conditions, mitigate acute medical events, and enhance patients’ quality of life, the prevalence and clinical significance of Active Implantable Medical Devices (AIMDs) continue to increase[88]. This is particularly the case as the world population ages, thus increasing the rate of chronic ailments. The basic principle of these devices is to use electrical currents to stimulate nerves [1], nerve bundles [2], or muscle tissue [3]. Some devices integrate sensors [4] and/or have drug-release systems [5]. Although the field has been in mature clinical use for decades, bioelectronic medicine continues to evolve thanks to technological advances in multiple disciplines.
Current applications are varied and include pacemakers [6], cochlear implants [7], deep brain stimulators [8], and functional neural modulators such as bladder control [9]. A further application variant is the emerging field of bioelectronic medicine, which aims to stimulate the peripheral nervous system and provide therapeutic benefits to those with chronic disorders such as neuroinflammatory disease and diabetes [10,11].
All these applications are continuously evolving. However, a historic challenge for all implantable devices has been power provision. The average (i.e., pulsed power divided by total time) power requirements for these applications vary from around 10μW for cardiac pacemakers [21] to milliwatts for sensory prosthetics [22], as per Table 1 below and illustrated in Figure 1.
Batteries commonly used in cardiac pacemakers generally have a life expectancy of 7-10 years [33,34]. Once the battery starts to run out, the patient has to undergo surgery for replacement. This poses risks to the patients while increasing the costs to the healthcare systems. Rechargeable medical batteries tend to have a 3x lower per volume capacity than non-rechargeable ones [35]. This means the lifetime of a rechargeable battery is much less than a non-rechargeable battery of the same volume. Furthermore, as part of the medical device risk assessment, a key question is: “What if the patient/clinician forgets to recharge the battery?”
Current implantable electronic medical devices utilize non-rechargeable batteries with volumes between tens of mm3 (µL) to tens of cm3 (mL) and a capacity of ~1041 Wh l-1 (Li/I2 battery system) [32]. However, commercially available implantable and medical-grade batteries typically have a lower capacity of approximately 750 Wh l-1 [71]. Also, there is an edge effect, as the battery needs to be encapsulated in its pressure chamber, which increases the volume.
To provide a comparison, Table 1 summarises different power use cases from less than 10µW to great than 10mW with different battery volumes to explore the impact on lifetime.
Various alternatives to lithium batteries have been explored and/or utilized to address the energy demands of bioelectronics: thermal and mechanical energy scavenging from the human body, fuel cells [23,26], Nuclear Batteries [27,28,29] or direct power transfer [30]), yielding power in the nW - µW range and using local energy storage for when the person is sleeping (no motion, darkness). Amongst these options, biological fuel cells are particularly attractive. For these systems, key fuel sources explored are urea [38] and glucose [26].
In the human body, glucose undergoes a cascade of biocatalytic reactions, until complete oxidation to carbon dioxide and water, releasing a total of 24 electrons. To harvest energy, glucose fuel cells grab a portion of the electrons released from these oxidation reactions with an electrode (the anode) connected through an electrical circuit to a counter electrode (the cathode), as shown in Figure 2. For implantable applications, fuel cells can either use enzymes (enzymatic fuel cells), inorganic catalysts (abiotic fuel cells) or a mix of both (hybrid fuel cells).
Typically a partial oxidation occurs with the release of two electrons at the anode.
With regard to enzymatic and hybrid systems, few in vivo tests of have been reported, including implantation in a living organism such as lobsters [47], clam[46], mice [84] and a female Blaberus [45]. Nonetheless, the instability and short lifespan of enzymes, seriously challenges the use of enzymatic fuel cells in implantable applications, and confine their use to short-term applications, e.g., disposable sensor patches.
On the other hand, the use of an abiotic catalyst can enable longer and stable lifetimes.
In this case, the catalytic activity is a function of the 3D nanostructure of the electrode, which maximises the exposed catalytic active sites per unit area. Typical nanostructures used in abiotic glucose fuel cells, include metals such as Au [62], Pt [60], Pd [61] (pure or combined), carbon-based materials and composite materials including conductive polymers[86]. Particularly effective is the use of gold nanostructures. In 2020, Gonzalez-Solino et al. [40] used porous gold as the anode and a platinum-gold alloy as the cathode in acute experiments, achieving a maximum power output of 143 nW mm-2 (800 nW whole-cell) at a glucose concentration of 6 mmol L-1 in-vitro.
The first in vivo testing of an abiotic glucose fuel cell is dated as back as the 1970s, when Drake et al. [42] successfully operated the fuel cell structure for several weeks in adult dogs. The structure consisted of a noble metal alloy on a Pt screen as the anode and Pt black on a Pt screen as the cathode. Its output power was 22 nW mm-2 of power (5,720nW whole-cell). In 2011, Sharma et al. [43] reported acute testing of an abiotic glucose fuel cell implanted into the right ventricle of a pig. The fuel cell, implementing a platinum thin-film anode and graphene cathode, generated a peak power output up to 100 nW mm-2(5000nW whole-cell).
Figure 3 compares the power density recently reported with both enzyme-based (blue) and abiotic (red) fuel cells(These data include both in vivo and in vitro), however an exhaustive discussion of the literature is beyond the scope of this article.
data are grouped according to the range of power generated : (1) high, 200 nW mm-2; (2) Medium, 20 nW mm-2; (3) Low 2 nW mm-2. As shown, enzymatic fuel cells generate the highest power, given the high specificity of enzymes On the other hand, several studies refer to unpractical glucose concentrations that are up to two orders of magnitude higher than the typical levels in physiological fluids, such as blood.
Based on the power densities of the three scenarios, finite element modelling will be conducted to evaluate the effects of electrode geometry and design on power output in abiotic glucose fuel cells. A “finger-crossed” configuration will be employed to enhance substance transfer between the anode and cathode, thereby improving power generation efficiency. To increase voltage output within thermodynamic constraints, multiple units will be electrically connected in a stacked arrangement. This study will therefore focus on determining the optimal 3D arrangement of such units. The resulting easy-to-manufacture model will also facilitate the optimisation of key design parameters of future similar models, including unit shape, size, with or without hole, and unit separation.
2. Methodology
Simulation Set Up
In this study, COMSOL finite element modelling (FEM) will be used to optimize the design of an abiotic glucose fuel cell unit and the creation of 3D stacks. Our ultimate objective is to determine how different architectures generate different power levels.
The design of the fuel cell unit will consist of shape, electrode dimensions, electrode distance, unit dimensions, and unit center hole dimensions. The specific design will be considered as per Figure 4a-c. In this design process, only parameters such as unit dimensions and hole dimensions will be adjusted within the specified range. In the simulations, the anode will consist of a film of highly porous gold onto gold-plated electrodes on a printed circuit board (PCB) and the cathode of Pt sputtered onto gold plated electrodes on a PCB, as per Figure 4d [40].
The simulation will then consider the arrangement of these fuel cell units into 3D structures as shown in Figure 4a. Factors such as, number of units, separation between units.
In the modelling, the Surface reaction rates are set considering the groups in Figure 5. In the separation between units, the concentrations of glucose and oxygen are determined by the interaction between surface reactions and diffusion. Surface reactions consume concentrations, while diffusion replenishes them, as shown in Figure 5(c).
COMSOL V6.0 was used for the modelling with the Transport of Diluted Species toolbox, with the equation used summarized in Table 2. The following hypotheses were used in the modelling:
- The simulation surface boundaries were defined with fixed concentrations of glucose (fuel) and oxygen (oxidant), following typical interstitial fluid values: glucose 5 mMol L⁻¹ and oxygen 4.5 mMol L⁻¹
- Since fuel cells operate in vascularized interstitial spaces, a 25–30% loss of glucose and oxygen is assumed. [75-77]).
- the fuel cells are operated at body temperature, 310.15k.
- The mesh grid was set to extremely fine.
- The central holes do not act as sources of glucose or oxygen but serve solely as diffusion pathways.
- Surface reaction rate (RR)
As shown in Figure 5(a, b), the 3D structure is assumed to have a single-sided reaction surface.The reaction rate (RR) can then be modeled as a function of glucose and oxygen concentrations, as described in Eq. 4.
and are the ratios of the real-time concentrations of glucose and oxygen to their initial concentrations. At the cathode, and combine to form H₂O as per the abiotic anode-cathode equations in Eq.2. As only 0.5 x molecules are required per glucose molecule, in conjunction with Rate Law (for the basic reaction in which the re[75–77action order is equal to its stoichiometric number), then is defined in the rate equation.
And K can be extrapolated backwards from the current or energy density to Eq 5(K is the reaction constant), which has units of (mol) s-1m-2
From Eq 7 above, it is possible to calculate K for each scenario (S): [S1, S2, S3] = [2,20,200] nW mm-2. Thus, [K1,K2,K3]=[2.5×10−6,2.5×10−7,2.5×10−8] (mol s⁻¹m⁻²) are calculated and inserted into Table 2.
- 7.
- Diffusion
At the boundaries of the simulation model, the concentrations of oxygen and glucose are assumed to be fixed at physiological levels.However, as the surface reactions occur on reaction surface, glucose and oxygen will be consumed, setting up a concentration gradient. This gradient can be modelled as a vector diffusion flu x J (mol s-1.m-2) flowing over a unit area per unit time interval, and defined mathematically by Fick's first law [63], as per Eq.6.
Where dφ (for an ideal mixture) is the concentration gradient between mesh nodes, and dx is the distance between the nodes. D is the diffusion coefficient. The diffusion coefficients were obtained from research papers by Wei Xing et al [65] and Alexey N Bashkatov et al [66] as: D(glucose) = 0.96×10⁻⁹ m²/s (=0.96×10⁻¹⁵ mm²/s), and D(oxygen) = 3×10⁻⁹ m²/s (= 3×10-15 mm²/s). These values have been provided in Table 2.
- 8.
- Matlab
COMSOL simulation takes into account reaction equations, concentration, and diffusion, ultimately leading to the distribution of glucose and oxygen concentrations and thus the distribution of reaction rates. These distributions are used to calculate the total current in Matlab according to Eq 7.
Where q is the charge constant (1.602 x 10⁻¹⁹ C), Av is Avogadro's constant (6.02 x 10²³ mol-1).
Finally, Eq. 8 was used to calculate the power. For the voltage, a value of approximately 0.4 V was referenced from a previous study that employed nanoporous gold as the electrode material in an abiotic glucose fuel cell [85].
Structural Model
The initial niche for implantable fuel cells is expected to be in small, potentially injectable devices where traditional medical batteries may face limitations.
Four medical and veterinary domains can be considered to inform the dimensions for injectable devices. The first is the diameter range of commonly used intravenous catheters. These range from 0.6 mm diameter (26 gauge) to 2 mm diameter (14 gauge) [78]. Increasing in size are laparoscopic tools, which range from 2mm to 12mm diameter (Ø) [79]. Animal radio frequency communication (RFC) tags, which are regularly injected into animals, can also be considered. These range from 1.25 mm Ø × 7 mm long to 3 mm Ø × 16.5 mm long [80]. Additionally, the dimensions of mini catheter-delivered cardiac pacemakers, such as the Abbott Nanostim (6 mm Ø × 42 mm long) and the Medtronic Micra (6.7 mm Ø × 25.9 mm long) [81], can be taken into account. These have been summarised in Figure 6.
Additionally, flat disc- or coin-shaped devices, such as those used for subcutaneous operations, can also be considered. For example, the Neuralink control unit is 23mm Ø x 8mm thick [82]. The Neuralink device consumes relatively high power. However, ultra-low-power applications that could utilize glucose energy scavenging could include drug release and passive biosensing (e.g., glucose and urea sensing).
These two cases are considered as shown in Figure 6 and Table 3. To constrain the range of possibilities, unit areas between 30 and 240 mm² were selected, corresponding to the smallest and largest cases described above. The device length/thickness was fixed at 8 mm to match typical dimensions of disc-shaped devices and injectable tags. For the injectable case, the width was limited to 6 mm, aligning with the smallest and largest laparoscopic diameters. This approach compresses the simulation space while maintaining realistic dimensions.
The next consideration is the optimization of the implant volume. More units packed into the volume would increase total surface area and thus power. However, it would also reduce the distance between units and thus reduce diffusion of glucose and oxygen. As such, each unit is assumed to be 0.1 mm thick, corresponding to the thickness of a typical thin Si wafer while providing sufficient rigidity. Scenarios with unit separations between 0.01 mm and 7.9 mm are then considered.
The final consideration was whether a central hole in the middle of a stack of units would be beneficial in the trade-off of diffusion vs surface area. As such, both coin- and pill-shaped cases with holes occupying 5%, 15%, 25%, and 35% of the total area were considered. These dimensions are illustrated in Figure 6 and detailed in Table 3.
3.Results
The experimental process of this study involved repeated testing under different scenarios, including the size and shape of the unit, the separation between units, and hole sizes, in order to assess their impact on unit energy and stack energy. The data obtained was organised into heat maps and line graphs, as shown in Figure 7 (right). The highlighted areas in the heat map represent more power. The results of this study will identify the optimal parameter combination for the model, which will be easy to manufacture.
a. Individual Units Devices
Figure 8 and Figure 9 (top) show the heat maps of output power vs unit area and separation distance for different reaction rates: [, , ] (mol) s-1m-2 in left, center and right hand sides respectively. (bottom) shows the line graphs for the same data.
As would be expected, the greater the separation and the unit area, the greater the power. Similarly, increasing reaction rate also leads to increased output powers.
As can be seen from the line graphs, the separation area of the generator unit, and power are not linearly related. For higher reaction rates, the benefits of increasing area are sublinear due to diffusion limitations. This is more clearly the case when separation is small as diffusion becomes more challenging.
b. Multistack units Without Holes
Figure 10 and Figure 11 (top) show the heat maps of output power vs unit area and separation distance for different reaction rates: [, ,](mol) s-1m-2 in left, centre and right hand sides respectively. (bottom) shows the line graphs of the same data. More area gives more power, but separation now has a maximum as there is a tradeoff between increased area with more units and decreased diffusion.
From the line graphs in Figure 10 and Figure 11, it can be found that when the separation reaches approximately 60 μm , the total power of the stack reaches the maximum value, which will require 50 units. (An individual unit thickness is assumed 100 µm is assumed.). Obviously, this will be a challenge during the manufacturing and assembly stages. Assembly difficulty, total electrode area, and diffusion supply need to be balanced. In order to control manufacturing and assembly difficulties and ensure sufficient total power, setting the unit limit to 8 pieces (with 0.9 mm separation) is acceptable.
Figure 11 presents the data in terms of power vs length/diameter for different unit separations. The disc shaped device provides more power as the total area can be much larger.
3. The Effect of Adding Central Diffusion Holes
Figure 18 and Figure 19 13 (top) show the heat maps of output power vs unit area and separation distance for both disc and pill shaped devices. (bottom) provide the line graphs for the same data. All data is shown for a reaction rate of 2.5×10⁻⁷(mol) s-1m-2. The prescence of small holes in the middle allows unreacted glucose and oxygen from the upper unit to diffuse to the inner units, increasing the concentration of glucose and oxygen at the inner reactions surfaces. However, the difference is found to be relatively small ~ 2.5% , but positive. This indicates that the inner centres of the units don’t have as frequent reactions due to concentration limitations. For smaller reaction rates, and larger separations, the differences is less, as diffusion becomes less of an issue. As such, this structure might not be worth considering if it significantly complicates the fabrication engineering. However, in this study, the holes function solely as diffusion pathways; if they also acted as additional concentration sources, the results would differ substantially.
4. Discussion
In the unit's design, ideally the surface reaction rate should be as large as possible, but this depends on the quality of the electrode nanostructure. Accordingly, three scenarios were considered based on the current literature. A highly optimistic scenario, in which advances in the surface nano- and microstructure of fuel cells yield an effective reaction rate significantly higher than that simulated in Scenario 1, is not ruled out. Even in such a case, the main principles proposed herein would remain valid.
Another consideration is that, while the cathode–anode exchange area should be maximized, electron leakage due to direct electron transfer through tissue fluid must be prevented when the anode and cathode are in close proximity. That will need to be considered at the engineering and circuit loading stage. Individual fuel cell units can be placed in parallel or in series as per Figure 15 (a), (b), giving more current or more voltage respectively. Given that each unit gives ~0.4V, this is challenging for power management electronics to boost. So putting units in series could help improve the voltage. But conversely increased voltage could increase leakage and possibly electrolytic degradation. As such, a configuration as per Figure 15 (c) is probably optimal.
A further consideration is manufacturability. Separation spaces were simulated down to 0.01 mm, with an optimum identified at approximately 0.1 mm, balancing the surface area of multiple fuel cell units with diffusion. However, achieving this configuration could require several tens of units, posing short-term manufacturing challenges. Increased structural complexity also raises the probability of failure. When the inclusion of a central hole for enhanced diffusion was evaluated, the performance difference compared with a more complex structure was found to be negligible. Therefore, a more constrained configuration of up to eight flat units was explored. Within this range, power outputs of up to ~116 µW for coin-type devices and ~57 µW for pill-shaped devices were achieved (Figure 14, Table 4).
Lithium batteries are stable and have a long regulatory history in medical implants[88]. It is difficult for any novel technology to displace incumbents. As such, it is important to define the niche to which implantable fuel cells could fit and thus provide context to the results. We, therefore, took data from the Contego range of implantable batteries (Data provided by Resonetics Inc) and plotted them into Figure 16. The x-axis was set to represent device volume, and the y-axis was set to represent battery lifetime. The black lines describe non-rechargeable batteries, and the red lines are rechargeable. The diagonal lines represent different power consumption domains for the batteries. The gap is clearly in the top left-hand corner of this graph.
Assuming biofouling is not a limiting factor, abiotic glucose fuel cells can theoretically operate indefinitely. Using the same bottom x-axis to represent volume, the top x-axis was defined in terms of power, as the simulation data indicated that power output scales with volume. Based on these simulations, a general yellow region was highlighted to represent the operational niche of fuel cells, partially overlapping with that of existing batteries. In summary, sustained operation is achievable at current levels of several tens of microamps—potentially up to 100 µA or less. It should be noted here that average power is not continous power – it is the average over multiple sleep and power phases. Usually deep sleep phases are ~100nA and operation is perhaps 1-10 mA. Biofouling remains the biggest challenge for implantable fuel cells. Without protection, tissue proteins or cells can quickly coat the device, hindering catalysis. Anti-biofouling membranes—often made from superhydrophobic materials like PEG, glycosylated, or amphoteric polymers—are being explored. Developing stable, long-lasting anti-biofouling coatings remains a major hurdle. [83].
5. Conclusions
With the development of small electronic medical implants, a long-lasting and stable energy supply module for medical implants becomes more and more important. This study presents a detailed finite element simulation to optimize the 3D structure of abiotic glucose fuel cell for implantable medical devices. By modelling various structural configurations, the effects of surface area, separation, and reaction rate on overall power generation are investigated. The results show that limiting the number of power generating units to 8 with a spacing of about 0.9 mm balances manufacturability and optimal performance when it is practically easy to fabricate.
While introducing central holes can marginally improve diffusion and enhance power output, the gain is minimal and outweighed by the reduction in active electrode area and increased complexity. Simulations show that coin-shaped designs can generate up to ~100 µW, whereas compact, rectangular (pill-shaped) units can achieve ~40 µW—both sufficient for many low-power and ultra-low-power medical applications.
These results support the feasibility of using abiotic glucose fuel cells in subcutaneous or catheter-delivered implants. Future work will address real-world challenges such as biofouling and integration with energy management electronics. Overall, this modeling framework lays the foundation for fabricating practical, long-lasting, and miniaturized power sources for next-generation biomedical implants.
Acknowledgments
In this section, you can acknowledge any support given which is not covered by the author contribution or funding sections. This may include administrative and technical support, or donations in kind (e.g., materials used for experiments). Where GenAI has been used for purposes such as generating text, data, or graphics, or for study design, data collection, analysis, or interpretation of data, please add “During the preparation of this manuscript/study, the author(s) used [tool name, version information] for the purposes of [description of use]. The authors have reviewed and edited the output and take full responsibility for the content of this publication.”
References
- Goggins, E.; Mitani, S.; Tanaka, S. Clinical perspectives on vagus nerve stimulation: present and future. Clin. Sci. 2022, 136, 695–709. [Google Scholar] [CrossRef]
- Brinkman, D.J.; Gupta, I.; Matteucci, P.B.; Ouchouche, S.; de Jonge, W.J.; Coatney, R.W.; Salam, T.; Chew, D.J.; Irwin, E.; Yazicioglu, R.F.; et al. Splenic arterial neurovascular bundle stimulation in esophagectomy: A feasibility and safety prospective cohort study. Front. Neurosci. 2022, 16, 1088628. [Google Scholar] [CrossRef] [PubMed]
- Ito, A.; Yamamoto, Y.; Sato, M.; Ikeda, K.; Yamamoto, M.; Fujita, H.; Nagamori, E.; Kawabe, Y.; Kamihira, M. Induction of functional tissue-engineered skeletal muscle constructs by defined electrical stimulation. Sci. Rep. 2014, 4, 4781. [Google Scholar] [CrossRef]
- Cicha, I.; Priefer, R.; Severino, P.; Souto, E.B.; Jain, S. Biosensor-Integrated Drug Delivery Systems as New Materials for Biomedical Applications. Biomolecules 2022, 12, 1198. [Google Scholar] [CrossRef] [PubMed]
- Khadka, B.; Lee, B.; Kim, K.-T. Drug Delivery Systems for Personal Healthcare by Smart Wearable Patch System. Biomolecules 2023, 13, 929. [Google Scholar] [CrossRef]
- Joung, Y.-H. Development of Implantable Medical Devices: From an Engineering Perspective. Int. Neurourol. J. 2013, 17, 98–106. [Google Scholar] [CrossRef]
- Wilson, B.S.; Dorman, M.F. Cochlear implants: A remarkable past and a brilliant future. Hear. Res. 2008, 242, 3–21. [Google Scholar] [CrossRef]
- Bazaka, K.; Jacob, M.V. Implantable Devices: Issues and Challenges. Electronics 2012, 2, 1–34. [Google Scholar] [CrossRef]
- Noblett, K.L.; Cadish, L.A. Sacral nerve stimulation for the treatment of refractory voiding and bowel dysfunction. Am. J. Obstet. Gynecol. 2014, 210, 99–106. [Google Scholar] [CrossRef]
- Pavlov, V.A.; Tracey, K.J. Bioelectronic medicine: Preclinical insights and clinical advances. Neuron 2022, 110, 3627–3644. [Google Scholar] [CrossRef] [PubMed]
- Fritz, J.R.; Huston, J.M. Advances in Bioelectronic Medicine: Noninvasive Electrical, Ultrasound and Magnetic Nerve Stimulation. Bioelectron. Med. 2019, 2, 143–150. [Google Scholar] [CrossRef]
- Al-Khalili, J. The birth of the electric machines: a commentary on Faraday (1832) ‘Experimental researches in electricity’. Philos. Trans. R. Soc. A: Math. Phys. Eng. Sci. 2015, 373, 20140208. [Google Scholar] [CrossRef] [PubMed]
- Aquilina, O. A brief history of cardiac pacing. Images in paediatric cardiology 2006, 8, 17–81. [Google Scholar] [PubMed]
- LR House “Cochlear implant: the beginning.” Laryngoscope. 1987 Aug;97(8 Pt 1):996-7. [PubMed]
- Shealy, C.N.; Mortimer, J.T.; Reswick, J.B. Electrical inhibition of pain by stimulation of the dorsal columns: preliminary clinical report. . 1967, 46, 489–91. [Google Scholar] [CrossRef] [PubMed]
- Frey, J.; Cagle, J.; Johnson, K.A.; Wong, J.K.; Hilliard, J.D.; Butson, C.R.; Okun, M.S.; de Hemptinne, C. Past, Present, and Future of Deep Brain Stimulation: Hardware, Software, Imaging, Physiology and Novel Approaches. Front. Neurol. 2022, 13, 825178. [Google Scholar] [CrossRef]
- Koopman, F.A.; Chavan, S.S.; Miljko, S.; Grazio, S.; Sokolovic, S.; Schuurman, P.R.; Mehta, A.D.; Levine, Y.A.; Faltys, M.; Zitnik, R.; et al. Vagus nerve stimulation inhibits cytokine production and attenuates disease severity in rheumatoid arthritis. Proc. Natl. Acad. Sci. USA 2016, 113, 8284–8289. [Google Scholar] [CrossRef]
- Bonaz, B.; Sinniger, V.; Pellissier, S. Therapeutic Potential of Vagus Nerve Stimulation for Inflammatory Bowel Diseases. Front. Neurosci. 2021, 15. [Google Scholar] [CrossRef]
- Khalifa, A.; Lee, S.; Molnar, A.C.; Cash, S. Injectable wireless microdevices: challenges and opportunities. Bioelectron. Med. 2021, 7, 1–8. [Google Scholar] [CrossRef]
- Wang, X.; Meng, X.; Zhu, Y.; Ling, H.; Chen, Y.; Li, Z.; Hartel, M.C.; Dokmeci, M.R.; Zhang, S.; Khademhosseini, A. A Sub-1-V, Microwatt Power-Consumption Iontronic Pressure Sensor Based on Organic Electrochemical Transistors. IEEE Electron Device Lett. 2020, 42, 46–49. [Google Scholar] [CrossRef]
- Moerke, C.; Wolff, A.; Ince, H.; Ortak, J.; Öner, A. New strategies for energy supply of cardiac implantable devices. Herzschrittmachertherapie + Elektrophysiologie 2022, 33, 224–231. [Google Scholar] [CrossRef]
- Donati, E.; Valle, G. Neuromorphic hardware for somatosensory neuroprostheses. Nat. Commun. 2024, 15, 1–18. [Google Scholar] [CrossRef] [PubMed]
- A Hannan, M.; Mutashar, S.; A Samad, S.; Hussain, A. Energy harvesting for the implantable biomedical devices: issues and challenges. Biomed. Eng. Online 2014, 13, 79–79. [Google Scholar] [CrossRef]
- Bock, D.C.; Marschilok, A.C.; Takeuchi, K.J.; Takeuchi, E.S. Batteries used to power implantable biomedical devices. Electrochimica Acta 2012, 84, 155–164. [Google Scholar] [CrossRef]
- Mallela, V.S.; Ilankumaran, V.; Rao, N. Trends in Cardiac Pacemaker Batteries. Indian pacing and electrophysiology journal 2004, 4, 201–212. [Google Scholar]
- Kerzenmacher, S.; Ducrée, J.; Zengerle, R.; von Stetten, F. Energy harvesting by implantable abiotically catalyzed glucose fuel cells. J. Power Sources 2008, 182, 1–17. [Google Scholar] [CrossRef]
- Wei, X.; Liu, J. Power sources and electrical recharging strategies for implantable medical devices. Front. Energy Power Eng. China 2008, 2, 1–13. [Google Scholar] [CrossRef]
- Available from: The Complete Guide to Medical Device Batteries (ufinebattery.com).
- Ben Amar, A.; Kouki, A.B.; Cao, H. Power Approaches for Implantable Medical Devices. Sensors 2015, 15, 28889–28914. [Google Scholar] [CrossRef] [PubMed]
- Kurs, A.; Karalis, A.; Moffatt, R.; Joannopoulos, J.D.; Fisher, P.; Soljačić, M. Wireless Power Transfer via Strongly Coupled Magnetic Resonances. Science 2007, 317, 83–86. [Google Scholar] [CrossRef] [PubMed]
- Antfolk, C.; Kopta, V.; Farserotu, J.; Decotignie, J.-D.; Enz, C. The WiseSkin artificial skin for tactile prosthetics: A power budget investigation. in IEEE Conferences, 2014, pp. 1–4.
- Bock, D.C.; Marschilok, A.C.; Takeuchi, K.J.; Takeuchi, E.S. Batteries used to power implantable biomedical devices. Electrochimica Acta 2012, 84, 155–164. [Google Scholar] [CrossRef]
- Katz, D.; Akiyama, T. Pacemaker Longevity: The World's Longest-Lasting VVI Pacemaker. Ann. Noninvasive Electrocardiol. 2007, 12, 223–226. [Google Scholar] [CrossRef]
- Pfenniger, A.; Jonsson, M.; Zurbuchen, A.; Koch, V.M.; Vogel, R. Energy Harvesting from the Cardiovascular System, or How to Get a Little Help from Yourself. Ann. Biomed. Eng. 2013, 41, 2248–2263. [Google Scholar] [CrossRef]
- Bock, D.C.; Marschilok, A.C.; Takeuchi, K.J.; Takeuchi, E.S. Batteries used to power implantable biomedical devices. Electrochimica Acta 2012, 84, 155–164. [Google Scholar] [CrossRef]
- Li, Z.; Zhu, G.; Yang, R.; Wang, A.C.; Wang, Z.L. Muscle-Driven In Vivo Nanogenerator. Adv. Mater. 2010, 22, 2534–2537. [Google Scholar] [CrossRef] [PubMed]
- Ayazian, S.; Hassibi, A. Delivering optical power to subcutaneous implanted devices. in 2011 Annual International Conference of the IEEE Engineering in Medicine and Biology Society, IEEE, 2011, pp. 2874–2877.
- Magotra, V.K.; Kumar, S.; Kang, T.W.; Inamdar, A.I.; Aqueel, A.T.; Im, H.; Ghodake, G.; Shinde, S.; Waghmode, D.P.; Jeon, H.C. Compost Soil Microbial Fuel Cell to Generate Power using Urea as Fuel. Sci. Rep. 2020, 10, 1–9. [Google Scholar] [CrossRef] [PubMed]
- Harris, J.M.; Reyes, C.; Lopez, G.P. Common Causes of Glucose Oxidase Instability in In Vivo Biosensing: A Brief Review. J. Diabetes Sci. Technol. 2013, 7, 1030–1038. [Google Scholar] [CrossRef]
- Gonzalez-Solino, C.; Bernalte, E.; Metcalfe, B.; Moschou, D.; Di Lorenzo, M. Power generation and autonomous glucose detection with an integrated array of abiotic fuel cells on a printed circuit board. J. Power Sources 2020, 472. [Google Scholar] [CrossRef]
- Miyake, T.; Haneda, K.; Nagai, N.; Yatagawa, Y.; Onami, H.; Yoshino, S.; Abe, T.; Nishizawa, M. Enzymatic biofuel cells designed for direct power generation from biofluids in living organisms. Energy Environ. Sci. 2011, 4, 5008–5012. [Google Scholar] [CrossRef]
- Drake, R.F.; Kusserow, B.K.; Messinger, S.; Matsuda, S. A tissue implantable fuel cell power supply. . 1970, 16, 199–205. [Google Scholar]
- Sharma, T.; Hu, Y.; Stoller, M.; Feldman, M.; Ruoff, R.S.; Ferrari, M.; Zhang, X. Mesoporous silica as a membrane for ultra-thin implantable direct glucose fuel cells. Lab a Chip 2011, 11, 2460–2465. [Google Scholar] [CrossRef]
- Zhiani, M.; Barzi, S.; Ahmadi, A.; Vizza, F.; Gharibi, H.; Azhari, A. Ex vivo energy harvesting by a by-pass depletion designed abiotic glucose fuel cell operated with real human blood serum. J. Power Sources 2022, 521. [Google Scholar] [CrossRef]
- Rasmussen, M.; Ritzmann, R.E.; Lee, I.; Pollack, A.J.; Scherson, D. An Implantable Biofuel Cell for a Live Insect. J. Am. Chem. Soc. 2012, 134, 1458–1460. [Google Scholar] [CrossRef] [PubMed]
- Szczupak, A.; Halámek, J.; Halámková, L.; Bocharova, V.; Alfonta, L.; Katz, E. Living battery – biofuel cells operating in vivo in clams. Energy Environ. Sci. 2012, 5, 8891–8895. [Google Scholar] [CrossRef]
- MacVittie, K.; Halámek, J.; Halámková, L.; Southcott, M.; Jemison, W.D.; Lobel, R.; Katz, E. From “cyborg” lobsters to a pacemaker powered by implantable biofuel cells. Energy Environ. Sci. 2012, 6, 81–86. [Google Scholar] [CrossRef]
- Zebda, A.; Cosnier, S.; Alcaraz, J.-P.; Holzinger, M.; Le Goff, A.; Gondran, C.; Boucher, F.; Giroud, F.; Gorgy, K.; Lamraoui, H.; et al. Single Glucose Biofuel Cells Implanted in Rats Power Electronic Devices. Sci. Rep. 2013, 3, 1516. [Google Scholar] [CrossRef]
- Li, Z.; Zhu, G.; Yang, R.; Wang, A.C.; Wang, Z.L. Muscle-Driven In Vivo Nanogenerator. Adv. Mater. 2010, 22, 2534–2537. [Google Scholar] [CrossRef] [PubMed]
- Ayazian, S.; Hassibi, A. Delivering optical power to subcutaneous implanted devices. in 2011 Annual International Conference of the IEEE Engineering in Medicine and Biology Society, IEEE, 2011, pp. 2874–2877.
- Magotra, V.K.; Kumar, S.; Kang, T.W.; Inamdar, A.I.; Aqueel, A.T.; Im, H.; Ghodake, G.; Shinde, S.; Waghmode, D.P.; Jeon, H.C. Compost Soil Microbial Fuel Cell to Generate Power using Urea as Fuel. Sci. Rep. 2020, 10, 1–9. [Google Scholar] [CrossRef]
- Harris, J.M.; Reyes, C.; Lopez, G.P. Common Causes of Glucose Oxidase Instability in In Vivo Biosensing: A Brief Review. J. Diabetes Sci. Technol. 2013, 7, 1030–1038. [Google Scholar] [CrossRef]
- Stetten, F.; Kerzenmacher, S.; Lorenz, A.; Chokkalingam, V.; Miyakawa, N.; Zengerle, R.; Ducree, J. A One-Compartment, Direct Glucose Fuel Cell for Powering Long-Term Medical Implants. 19th IEEE International Conference on Micro Electro Mechanical Systems. 2006, vol. 2006, pp. 934–937. [CrossRef]
- Miyake, T.; Haneda, K.; Nagai, N.; Yatagawa, Y.; Onami, H.; Yoshino, S.; Abe, T.; Nishizawa, M. Enzymatic biofuel cells designed for direct power generation from biofluids in living organisms. Energy Environ. Sci. 2011, 4, 5008–5012. [Google Scholar] [CrossRef]
- Drake, R.F.; Kusserow, B.K.; Messinger, S.; Matsuda, S. A tissue implantable fuel cell power supply. ASAIO Journal 1970, 16, 199–205. [Google Scholar]
- Sharma, T.; Hu, Y.; Stoller, M.; Feldman, M.; Ruoff, R.S.; Ferrari, M.; Zhang, X. Mesoporous silica as a membrane for ultra-thin implantable direct glucose fuel cells. Lab a Chip 2011, 11, 2460–2465. [Google Scholar] [CrossRef] [PubMed]
- Zhiani, M.; Barzi, S.; Gholamian, M.; Ahmadi, A. Synthesis and evaluation of Pt/rGO as the anode electrode in abiotic glucose fuel cell: Near to the human body physiological condition. Int. J. Hydrogen Energy 2020, 45, 13496–13507. [Google Scholar] [CrossRef]
- Torigoe, K.; Takahashi, M.; Tsuchiya, K.; Iwabata, K.; Ichihashi, T.; Sakaguchi, K.; Sugawara, F.; Abe, M. High-Power Abiotic Direct Glucose Fuel Cell Using a Gold–Platinum Bimetallic Anode Catalyst. ACS Omega 2018, 3, 18323–18333. [Google Scholar] [CrossRef]
- Holade, Y.; Tingry, S.; Servat, K.; Napporn, T.W.; Cornu, D.; Kokoh, K.B. Nanostructured Inorganic Materials at Work in Electrochemical Sensing and Biofuel Cells. Catalysts 2017, 7, 31. [Google Scholar] [CrossRef]
- Kloke, A.; Köhler, C.; Zengerle, R.; Kerzenmacher, S. Porous Platinum Electrodes Fabricated by Cyclic Electrodeposition of PtCu Alloy: Application to Implantable Glucose Fuel Cells. J. Phys. Chem. C 2012, 116, 19689–19698. [Google Scholar] [CrossRef]
- Zhao, Y.; Fan, L.; Hong, B.; Zhang, Y.; Zhang, M.; Que, Q.; Ji, J. Three-dimensional Porous Palladium Foam-like Nanostructures as Electrocatalysts for Glucose Biofuel Cells. Energy Technol. 2016, 4, 249–255. [Google Scholar] [CrossRef]
- Yang, L.; Zhang, Y.; Chu, M.; Deng, W.; Tan, Y.; Ma, M.; Su, X.; Xie, Q.; Yao, S. Facile fabrication of network film electrodes with ultrathin Au nanowires for nonenzymatic glucose sensing and glucose/O2 fuel cell. Biosens. Bioelectron. 2013, 52, 105–110. [Google Scholar] [CrossRef]
- Lewis, P.M.; Ackland, H.M.; Lowery, A.J.; Rosenfeld, J.V. Restoration of vision in blind individuals using bionic devices: A review with a focus on cortical visual prostheses. Brain Res. 2015, 1595, 51–73. [Google Scholar] [CrossRef]
- WeidlichE, RichterG, vonSturmF. Animal experimental with biogalvanic and biofuel lcells[J].Biomaterials, MedicalDevices,andArtificialOrgans,1979,4:3-4.
- X. Wei, Y. X. Wei, Y. Min. et al. “Oxygen Solubility, Diffusion Coefficient, and Solution Viscosity” Rotating Electrode Methods and Oxygen Reduction Electrocatalysts,2014.
- Bashkatov, A.N.; Genina, E.A.; Sinichkin, Y.P.; Kochubey, V.I.; Lakodina, N.A.; Tuchin, V.V. Glucose and Mannitol Diffusion in Human Dura Mater. Biophys. J. 2003, 85, 3310–3318. [Google Scholar] [CrossRef]
- Mallela, V.S.; Ilankumaran, V.; Rao, N. Trends in Cardiac Pacemaker Batteries. 2004, 4, 201–212.
- Katz, D.; Akiyama, T. Pacemaker Longevity: The World's Longest-Lasting VVI Pacemaker. Ann. Noninvasive Electrocardiol. 2007, 12, 223–226. [Google Scholar] [CrossRef] [PubMed]
- Kutbee, A.T.; Bahabry, R.R.; Alamoudi, K.O.; Ghoneim, M.T.; Cordero, M.D.; Almuslem, A.S.; Gumus, A.; Diallo, E.M.; Nassar, J.M.; Hussain, A.M.; et al. Flexible and biocompatible high-performance solid-state micro-battery for implantable orthodontic system. npj Flex. Electron. 2017, 1, 1–8. [Google Scholar] [CrossRef]
- A.L.Benabid, et al. “Combined (Thalamotomy and Stimulation) Stereotactic Surgery of the VIM Thalamic Nucleus for Bilateral Parkinson Disease”. 1159. [CrossRef]
- Available from: https://resonetics.com/sensor-technology-medical-power/medical-batteries/.
- Adeva-Andany, M.M.; González-Lucán, M.; Donapetry-García, C.; Fernández-Fernández, C.; Ameneiros-Rodríguez, E. Glycogen metabolism in humans. BBA Clin. 2016, 5, 85–100. [Google Scholar] [CrossRef] [PubMed]
- Cosnier, S.; Le Goff, A.; Holzinger, M. Towards glucose biofuel cells implanted in human body for powering artificial organs: Review. Electrochem. Commun. 2013, 38, 19–23. [Google Scholar] [CrossRef]
- Chung, Y.; Tannia, D.C.; Kwon, Y. Glucose biofuel cells using bi-enzyme catalysts including glucose oxidase, horseradish peroxidase and terephthalaldehyde crosslinker. Chem. Eng. J. 2018, 334, 1085–1092. [Google Scholar] [CrossRef]
- Available from: https://medlineplus.gov/ency/article/003482.htm.
- Collins, J.-A.; Rudenski, A.; Gibson, J.; Howard, L.; O’dRiscoll, R. Relating oxygen partial pressure, saturation and content: the haemoglobin–oxygen dissociation curve. Breathe 2015, 11, 194–201. [Google Scholar] [CrossRef] [PubMed]
- Available from: https://www.cosinuss.com/en/measured-data/vital-signs/oxygen-saturation/.
- Available from: https://www.ciamedical.com/insights/iv-catheter-sizes/.
- Limperg, T.B.; Novoa, V.Y.; Curlin, H.L.; Veersema, S. Laparoscopic Trocars: Marketed Versus True Dimensions–A Descriptive Study. J. Minim. Invasive Gynecol. 2024, 31, 304–308. [Google Scholar] [CrossRef]
- Available from: https://www.dipolerfid.com/product/rfid-tags-for-animal-identification.
- Beurskens, N.E.; Tjong, F.V.; E Knops, R. End-of-life Management of Leadless Cardiac Pacemaker Therapy. Arrhythmia Electrophysiol. Rev. 2017, 6, 129–133. [Google Scholar] [CrossRef]
- Available from: https://newatlas.com/computers/mibmi-text-accuracy/.
- He, Z.; Yang, X.; Wang, N.; Mu, L.; Pan, J.; Lan, X.; Li, H.; Deng, F. Anti-Biofouling Polymers with Special Surface Wettability for Biomedical Applications. Front. Bioeng. Biotechnol. 2021, 9, 807357. [Google Scholar] [CrossRef]
- Lee, D.Y.; Yun, J.-H.; Bin Park, Y.; Hyeon, J.S.; Jang, Y.; Choi, Y.-B.; Kim, H.-H.; Kang, T.M.; Ovalle, R.; Baughman, R.H.; et al. Two-Ply Carbon Nanotube Fiber-Typed Enzymatic Biofuel Cell Implanted in Mice. IEEE Trans. NanoBioscience 2020, 19, 333–338. [Google Scholar] [CrossRef]
- Desmaële, D.; La Malfa, F.; Rizzi, F.; Qualtieri, A.; Di Lorenzo, M.; De Vittorio, M. A novel flexible conductive sponge-like electrode capable of generating electrical energy from the direct oxidation of aqueous glucose. Journal of Physics: Conference Series 2019, 1407, 1. [Google Scholar] [CrossRef]
- Niyazi, A.; Metcalfe, B.; Leese, H.S.; Di Lorenzo, M. One-step polyaniline-platinum nanoparticles grafting on porous gold anode electrodes for high-performance glucose fuel cells. J. Power Sources 2025, 654. [Google Scholar] [CrossRef]
- Yogev, D.; Goldberg, T.; Arami, A.; Tejman-Yarden, S.; Winkler, T.E.; Maoz, B.M. Current state of the art and future directions for implantable sensors in medical technology: Clinical needs and engineering challenges. APL Bioeng. 2023, 7, 031506. [Google Scholar] [CrossRef] [PubMed]
- Yang, S.; Sencadas, V.; You, S.S.; Jia, N.Z.; Srinivasan, S.S.; Huang, H.; Ahmed, A.E.; Liang, J.Y.; Traverso, G. Powering Implantable and Ingestible Electronics. Adv. Funct. Mater. 2021, 31, 2009289. [Google Scholar] [CrossRef] [PubMed]
Figure 1.
The concept of power provision for Active Implantable Medical Devices. Left: how a conceptual fuel cell could replace the battery section of an existing implant. Right: The range of power requirements for different types of implants.
Figure 1.
The concept of power provision for Active Implantable Medical Devices. Left: how a conceptual fuel cell could replace the battery section of an existing implant. Right: The range of power requirements for different types of implants.
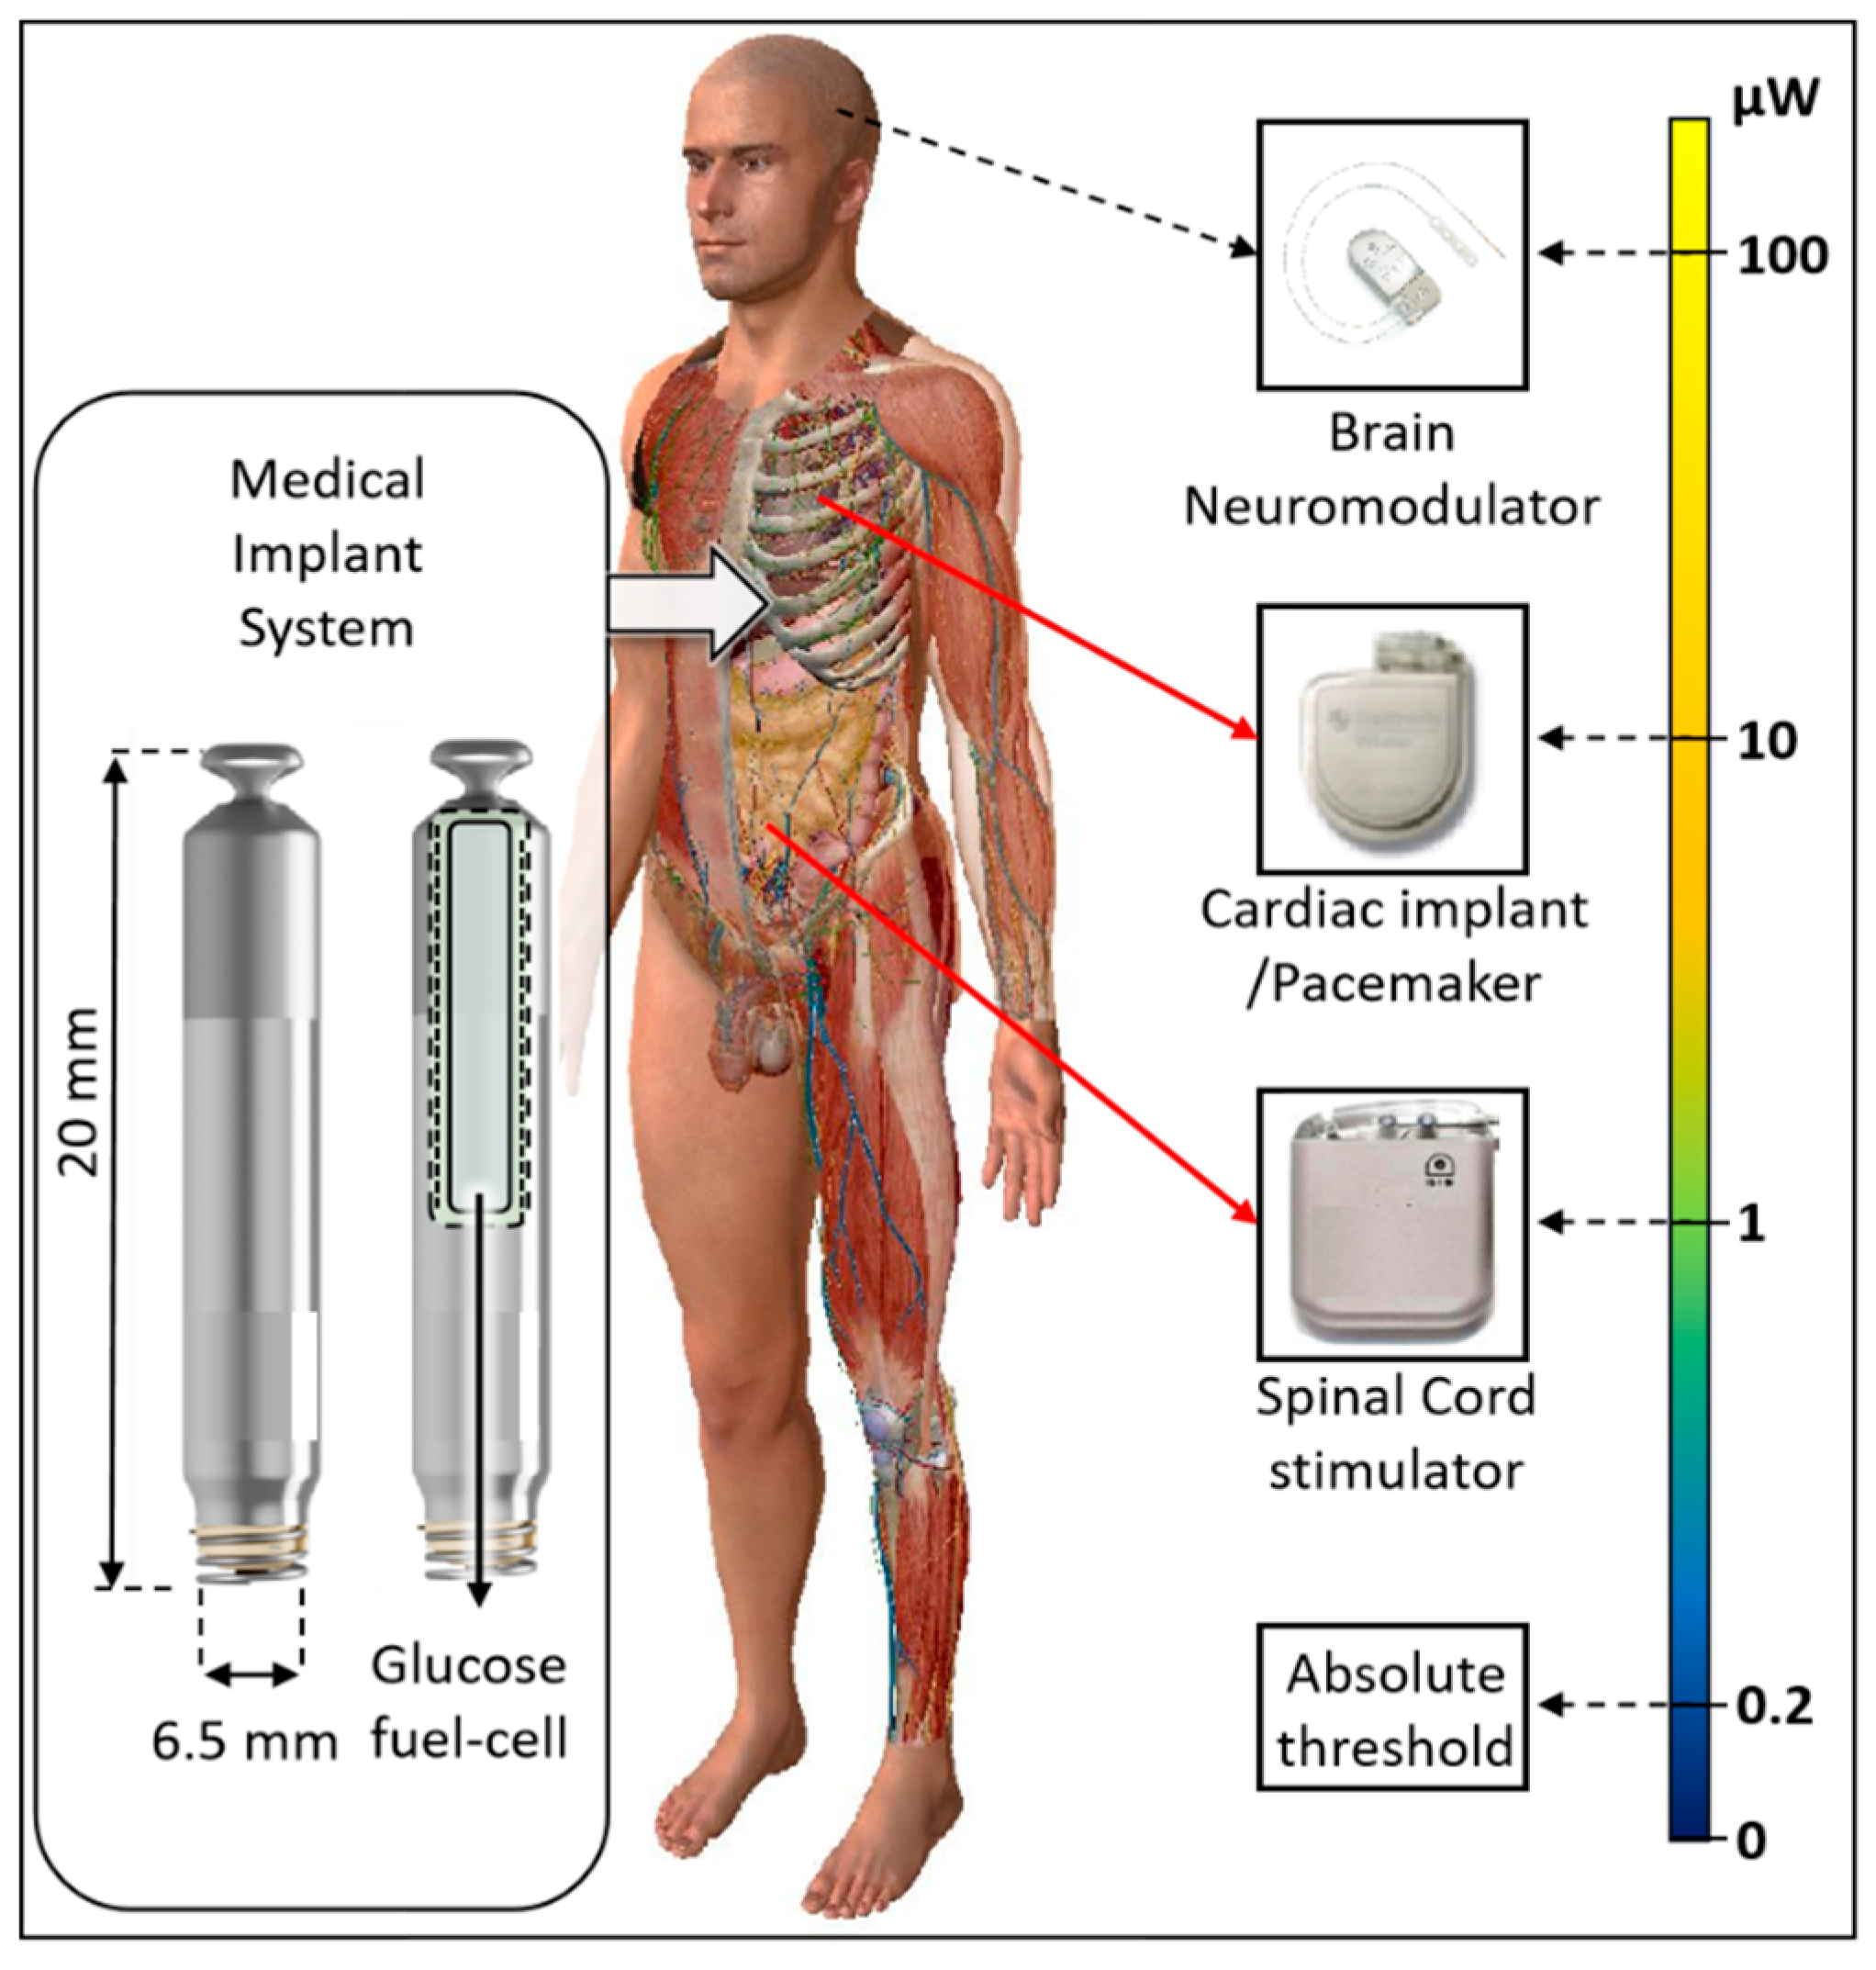
Figure 2.
The chemical reaction facilitating the fuel cell.
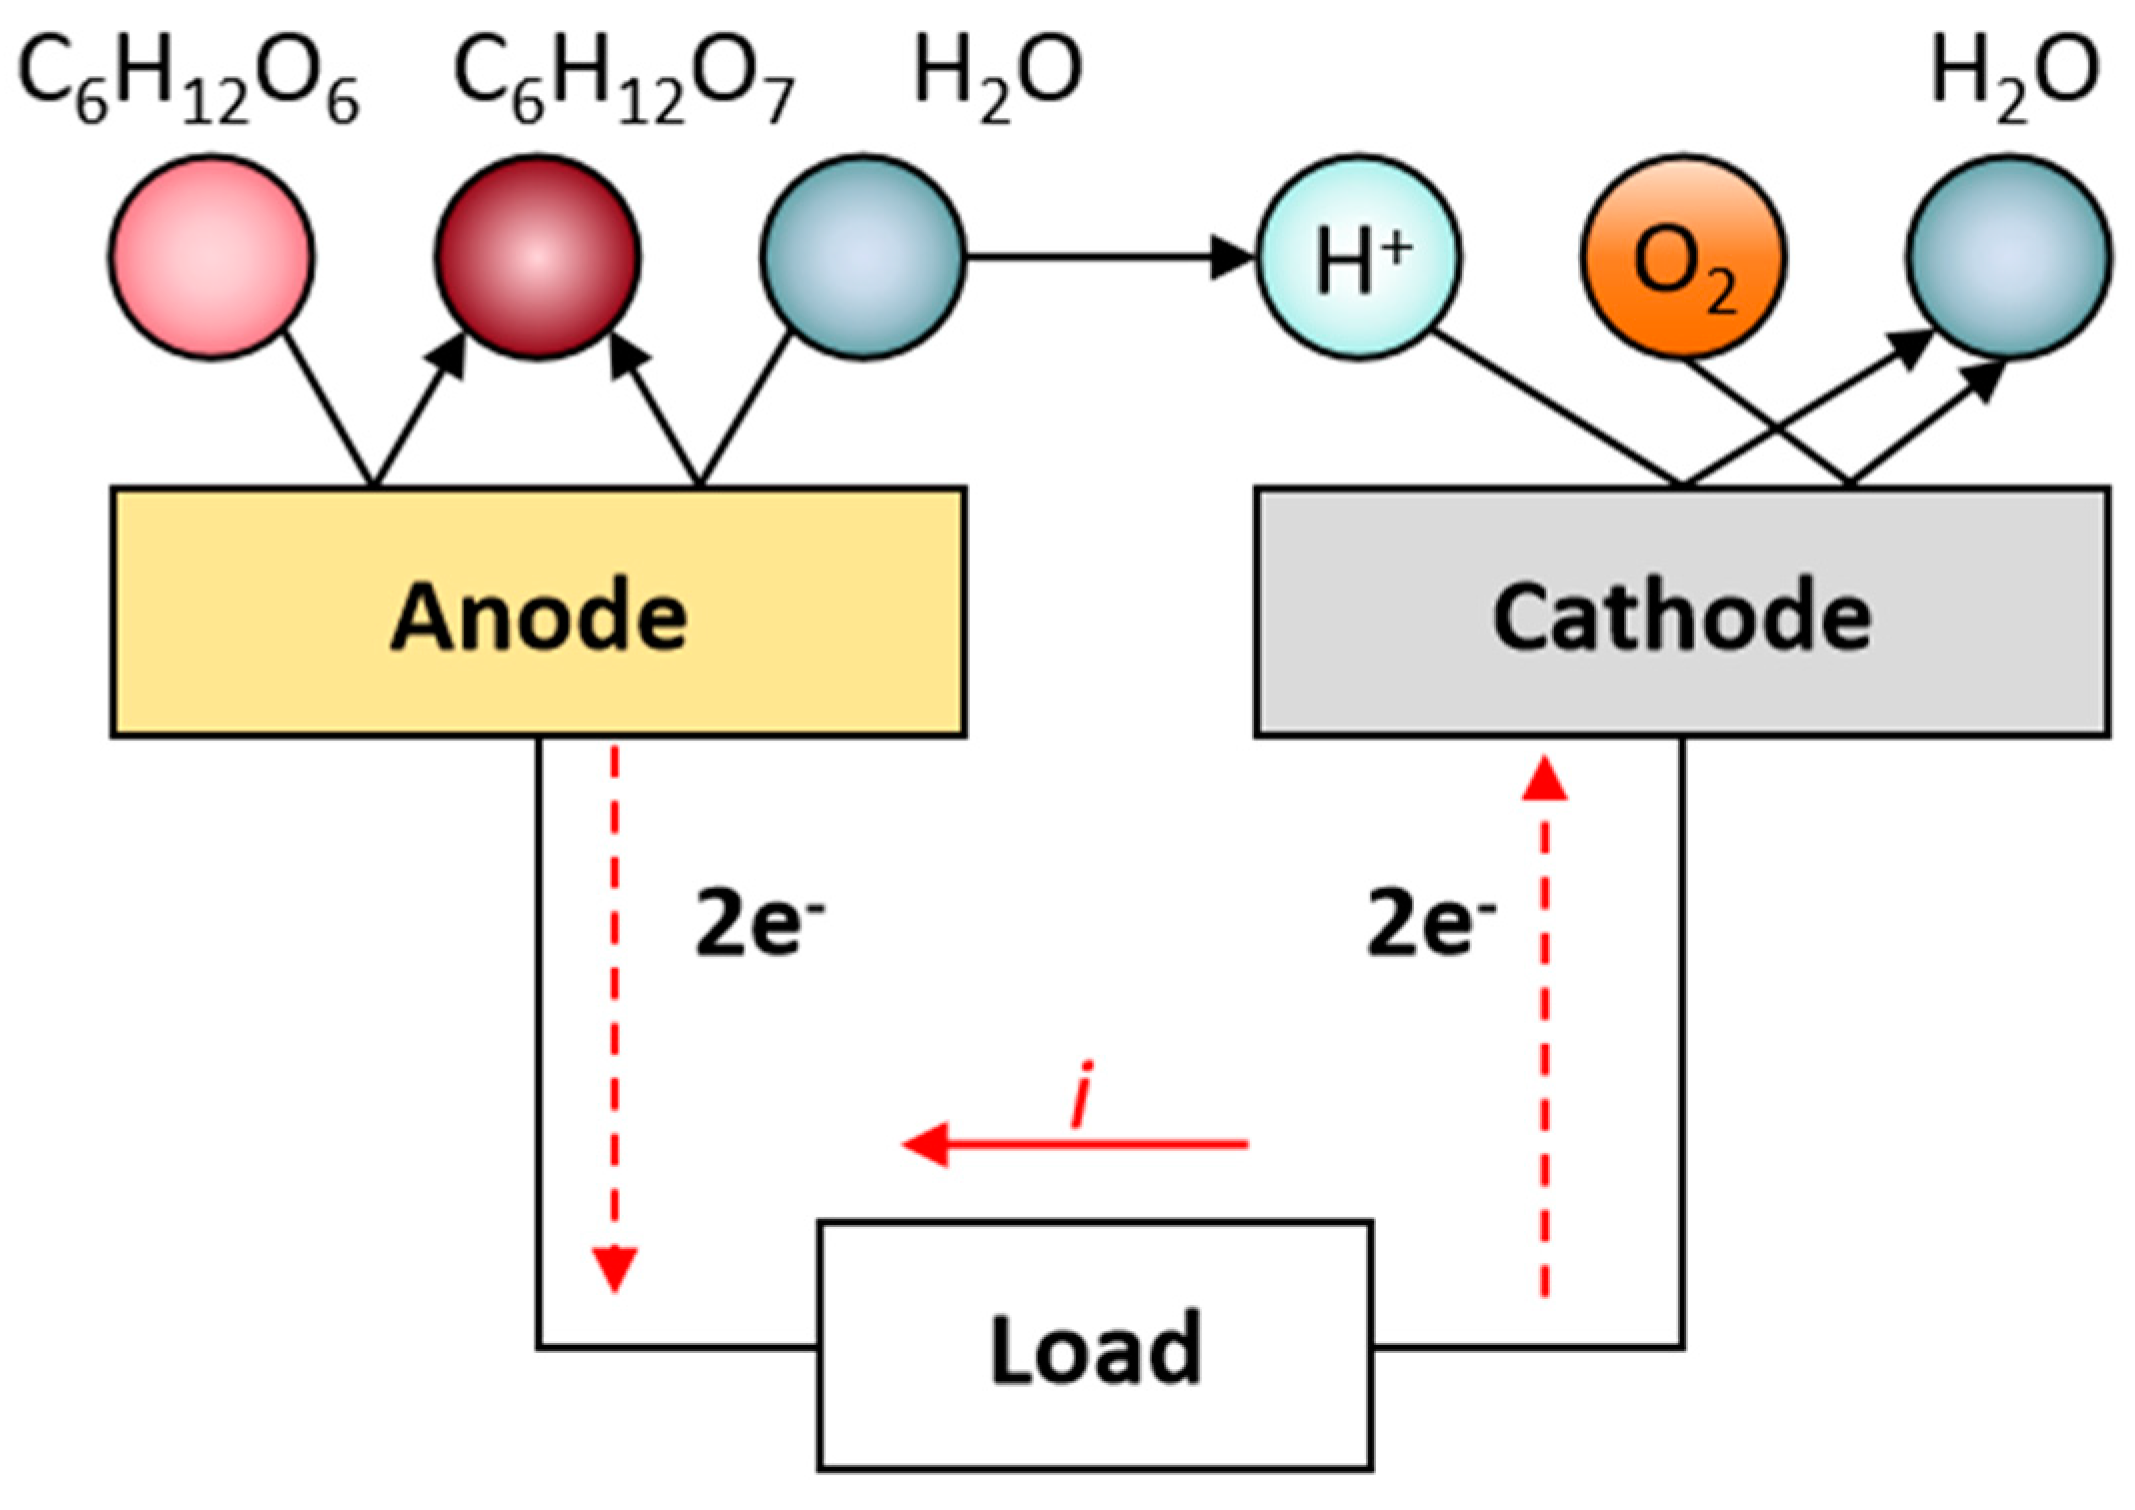
Figure 3.
Comparison of power density of glucose enzymatic and abiotic fuel cells. Three scenarios were established corresponding to three base response rates. Scenario 1 refers to a past research paper that did not involve in vivo experimentation and is therefore considered the ideal result. [40], Scenario 2 is the hypothetical real-world result, i.e., 10 per cent of Scenario 1, and Scenario 3 is the worst possible result, i.e., 1 per cent of Scenario 1.
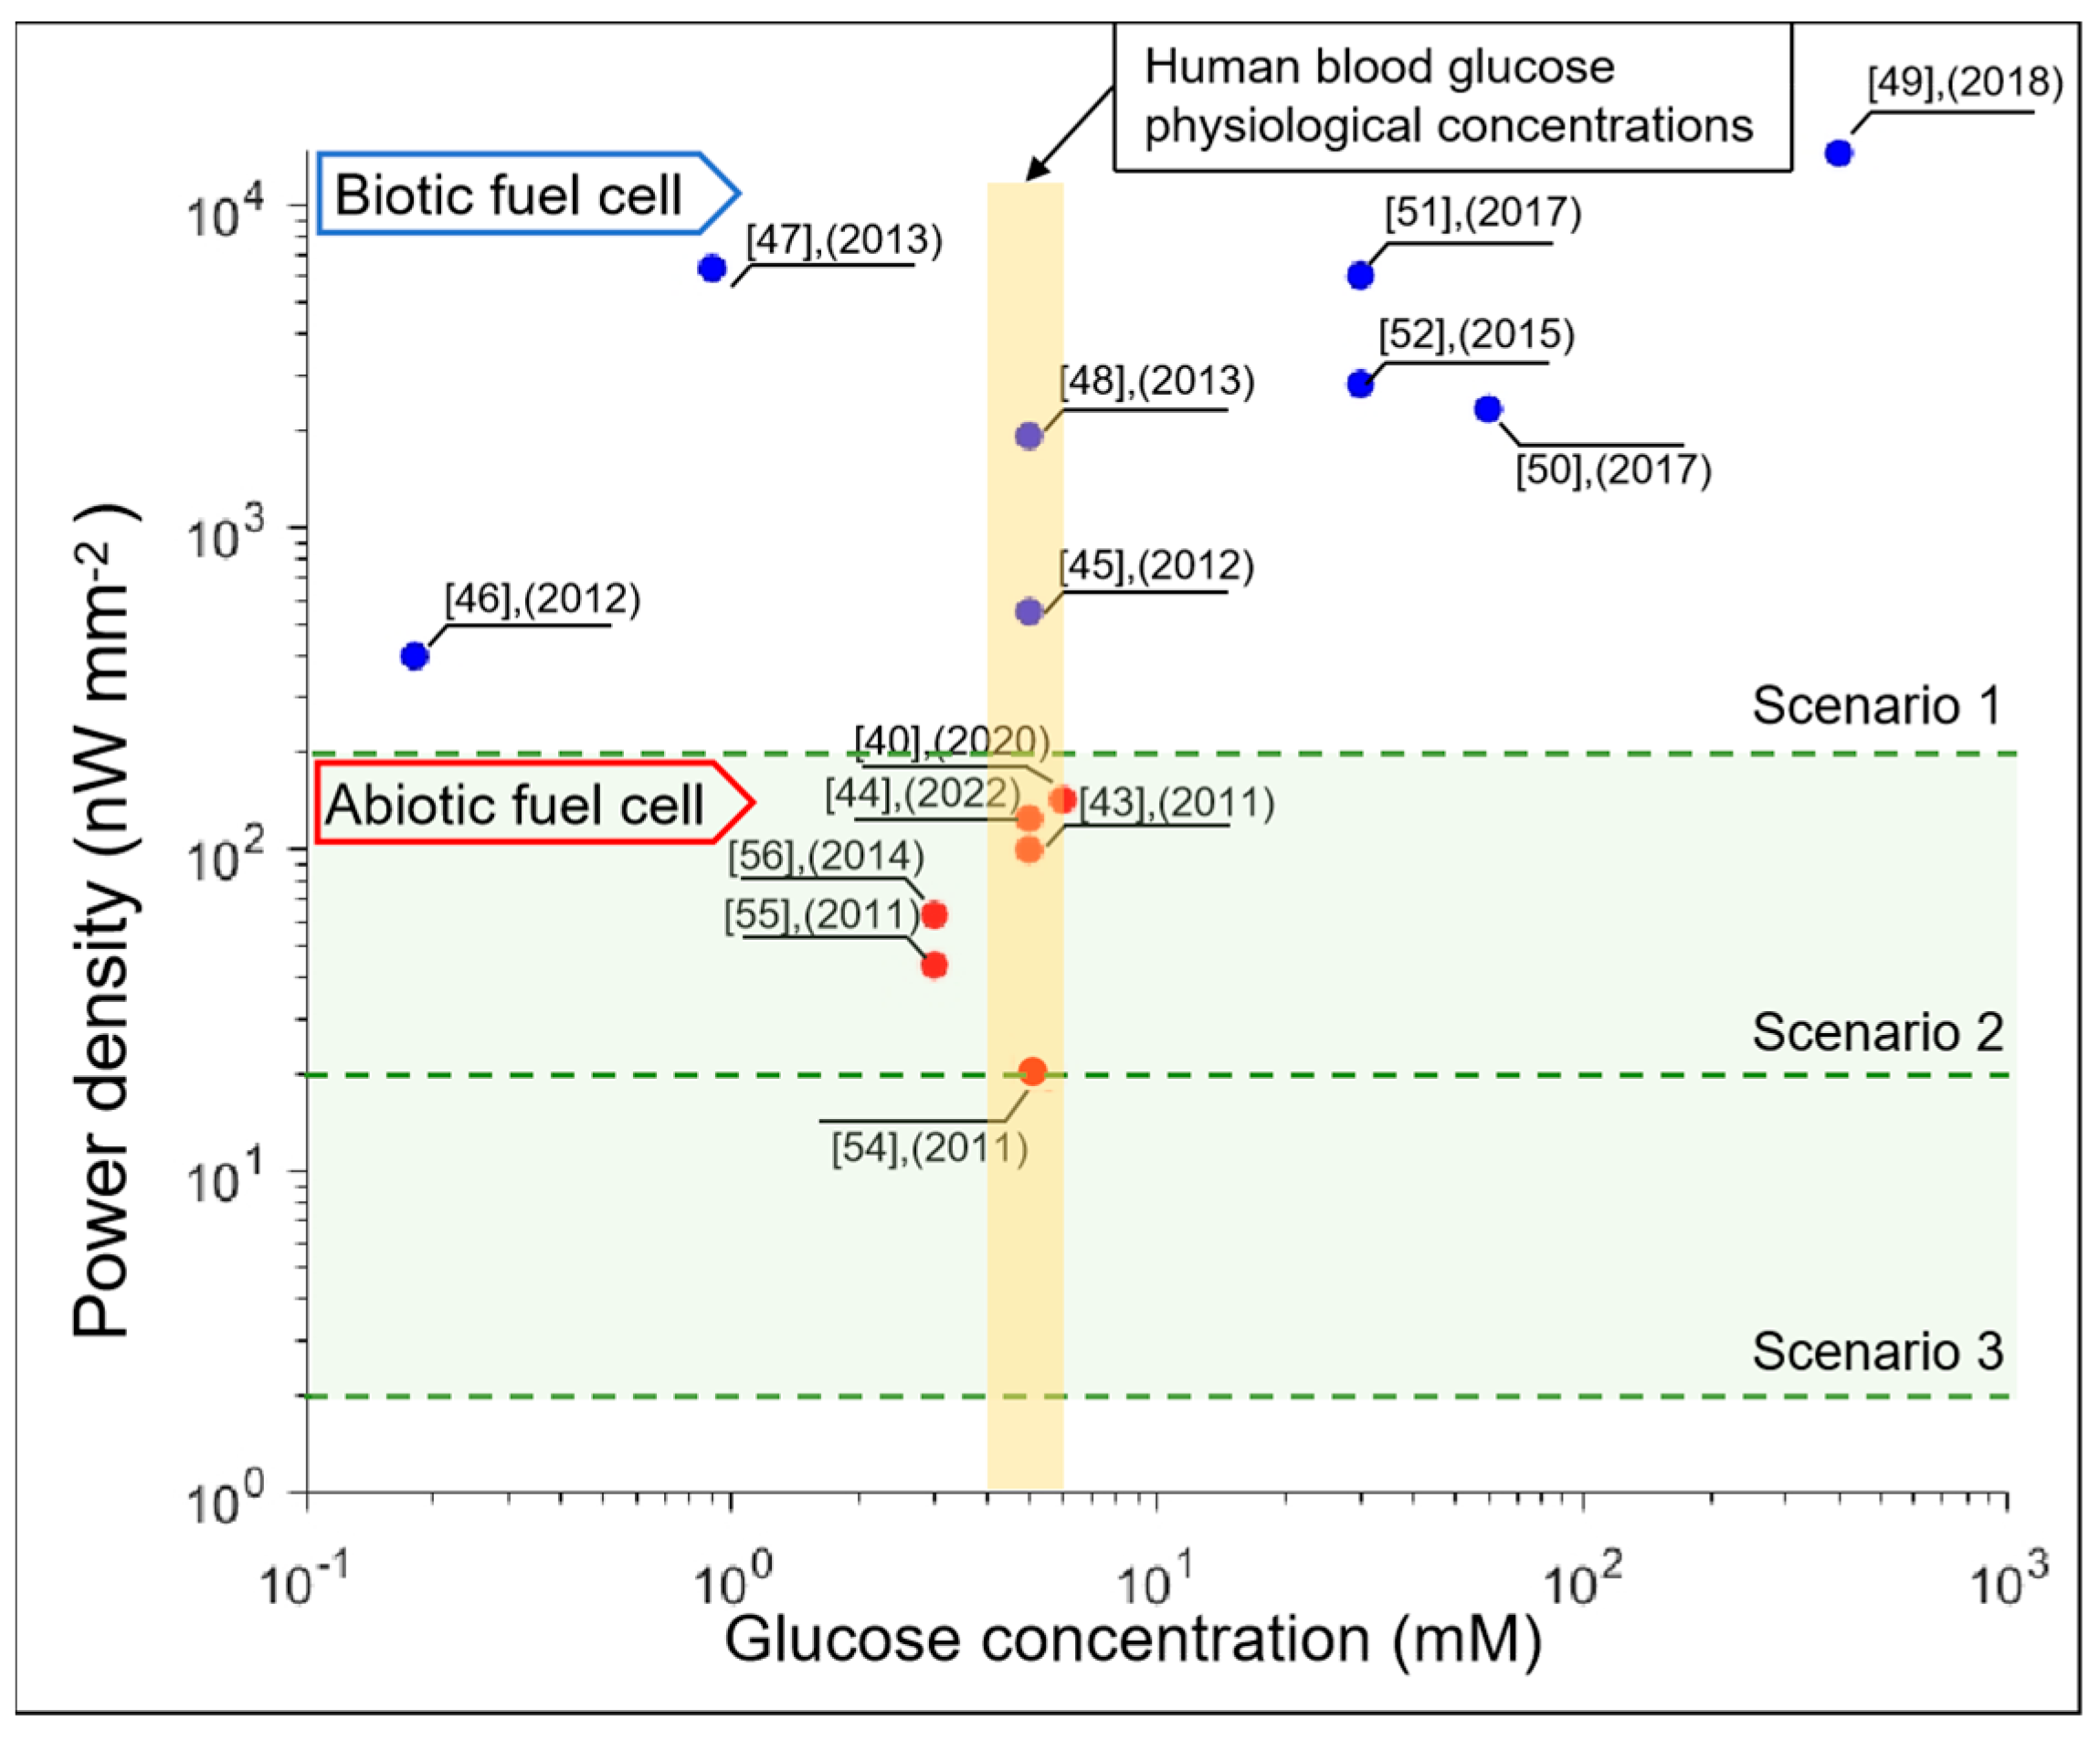
Figure 4.
The structure of an abiotic fuel cell. (a) The global 3D architecture with multipanels, and the basis of this work. (b) The topology of a single panel (c) The surface structure of individual fuel cell electrodes (d) The fuel cell electrode nanostructure.
Figure 4.
The structure of an abiotic fuel cell. (a) The global 3D architecture with multipanels, and the basis of this work. (b) The topology of a single panel (c) The surface structure of individual fuel cell electrodes (d) The fuel cell electrode nanostructure.
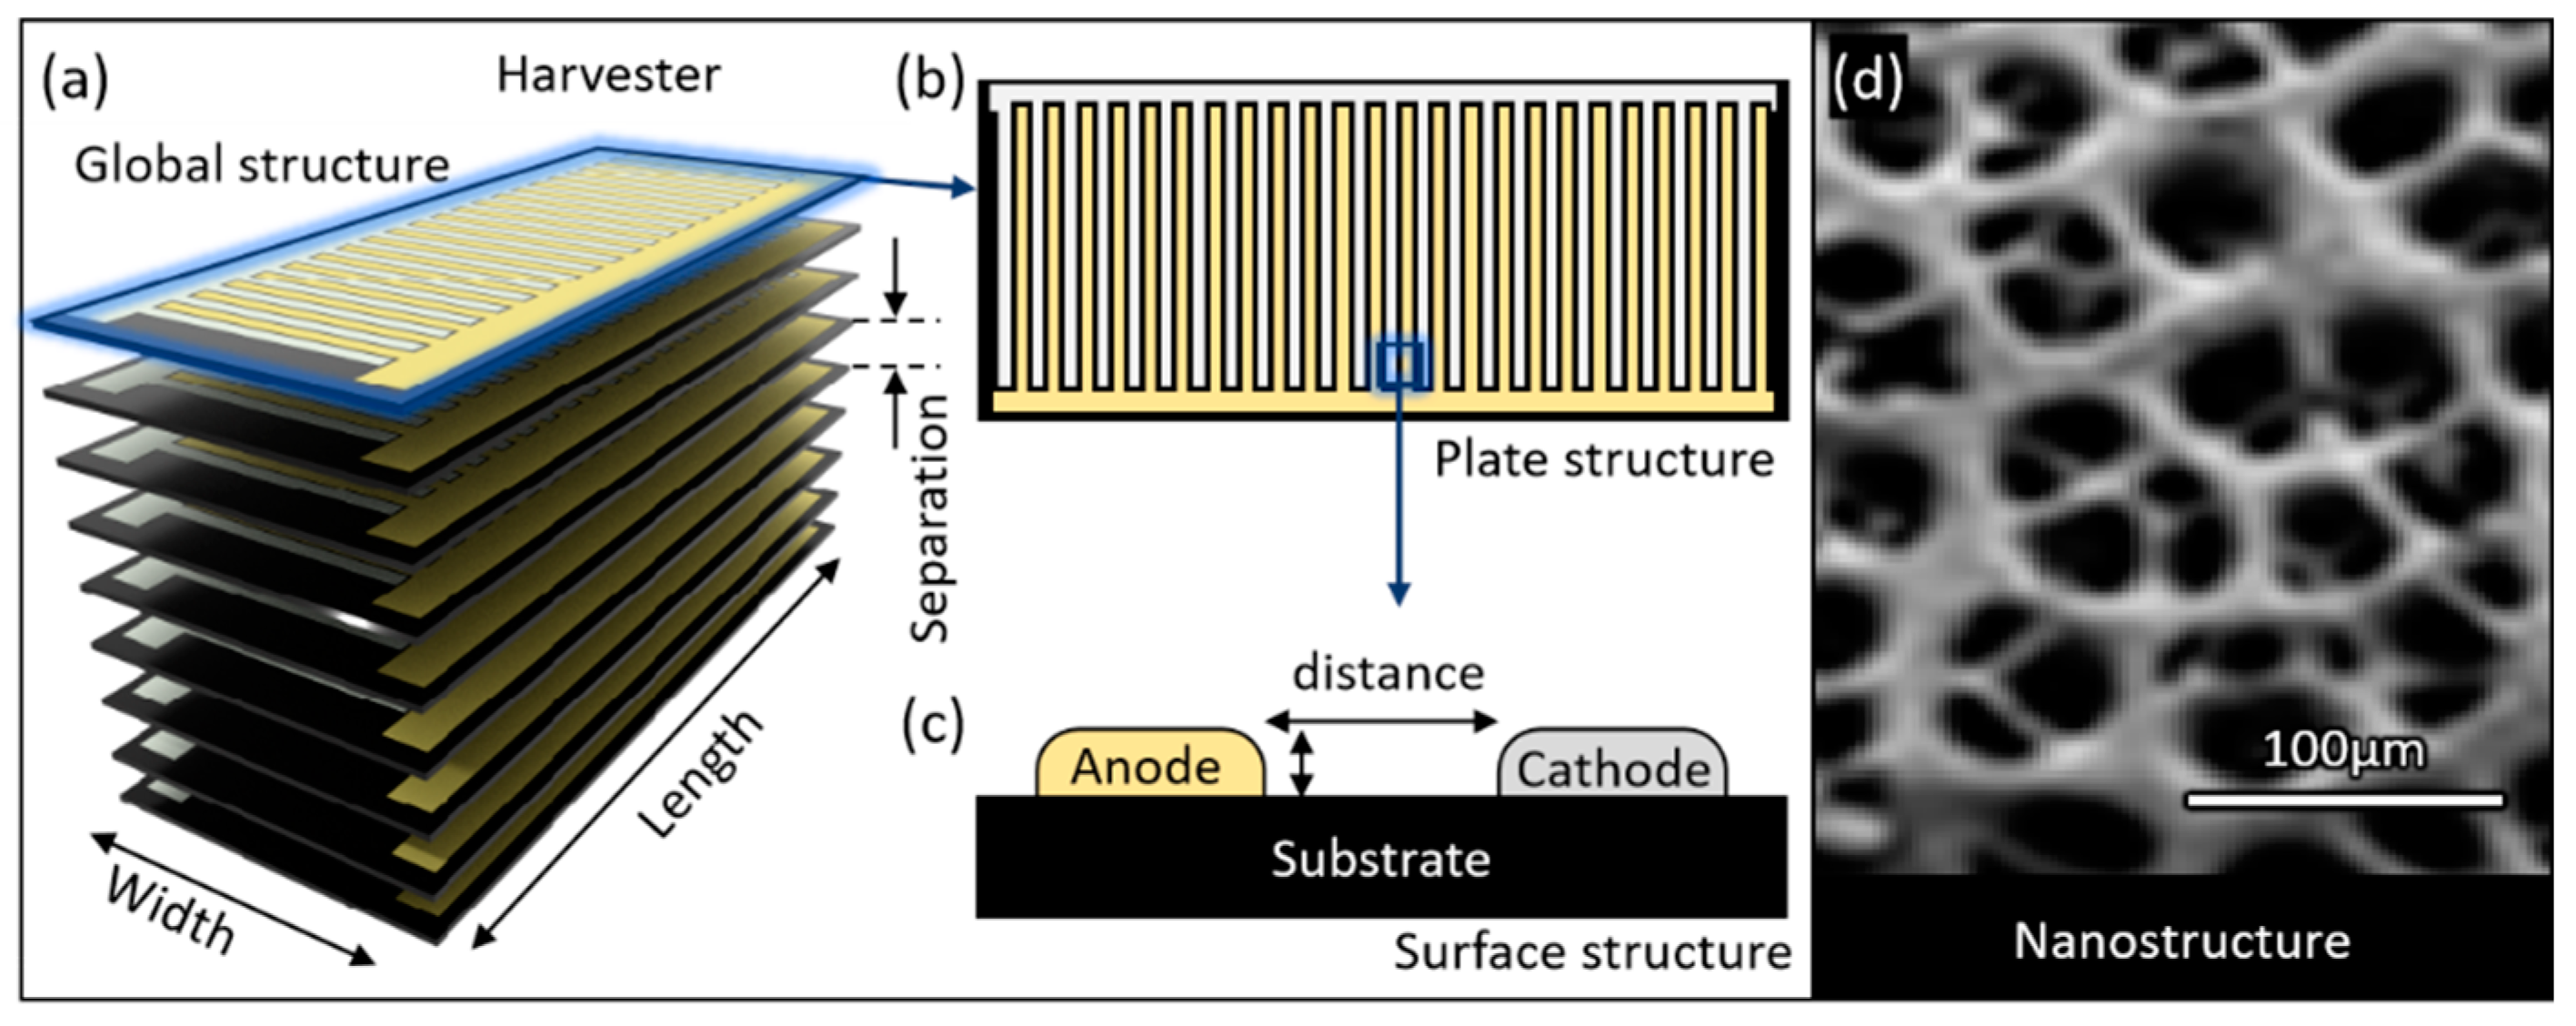
Figure 5.
Schematic of a 4-unit abiotic fuel cell system with hole. b. Schematic of a 4-unit abiotic fuel cell system without hole. c. 3D and 2D demonstration of diffusion and surface reactions in separation in COMSOL.
Figure 5.
Schematic of a 4-unit abiotic fuel cell system with hole. b. Schematic of a 4-unit abiotic fuel cell system without hole. c. 3D and 2D demonstration of diffusion and surface reactions in separation in COMSOL.
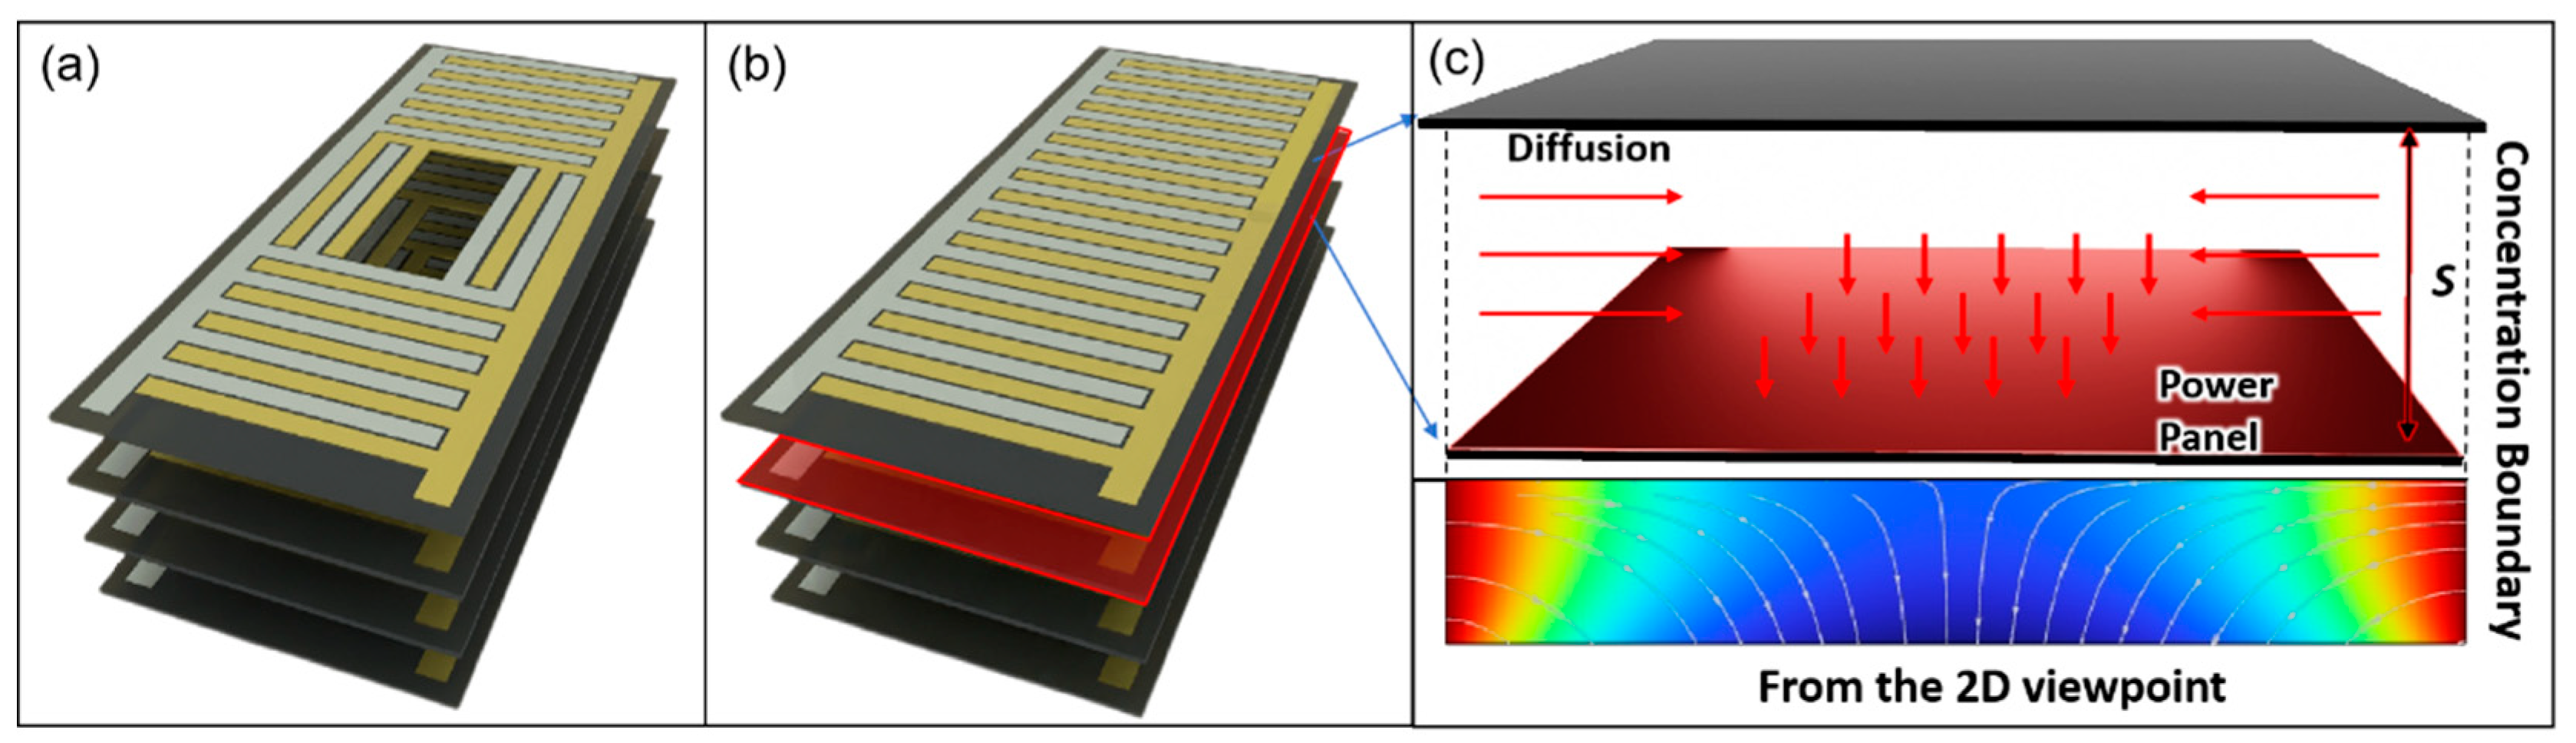
Figure 6.
(a). A dog radio frequency identification (RFID) tag. (b). Typical 12-16 guage RFID insertion syringe. (c). A catheter-delivered cardiac pacemaker unit (Medtronic Micra). (d). The Neuralink control unit. (e). 3D rendering of pill-shaped and coin-shaped implantable fuel cell used for simulation. The key parameter is the separation (S) between units. (f, g). Schematic diagrams of individual unit of coin-shaped and pill-shaped fuel cells used for simulation. Their key parameters are unit size and hole size.
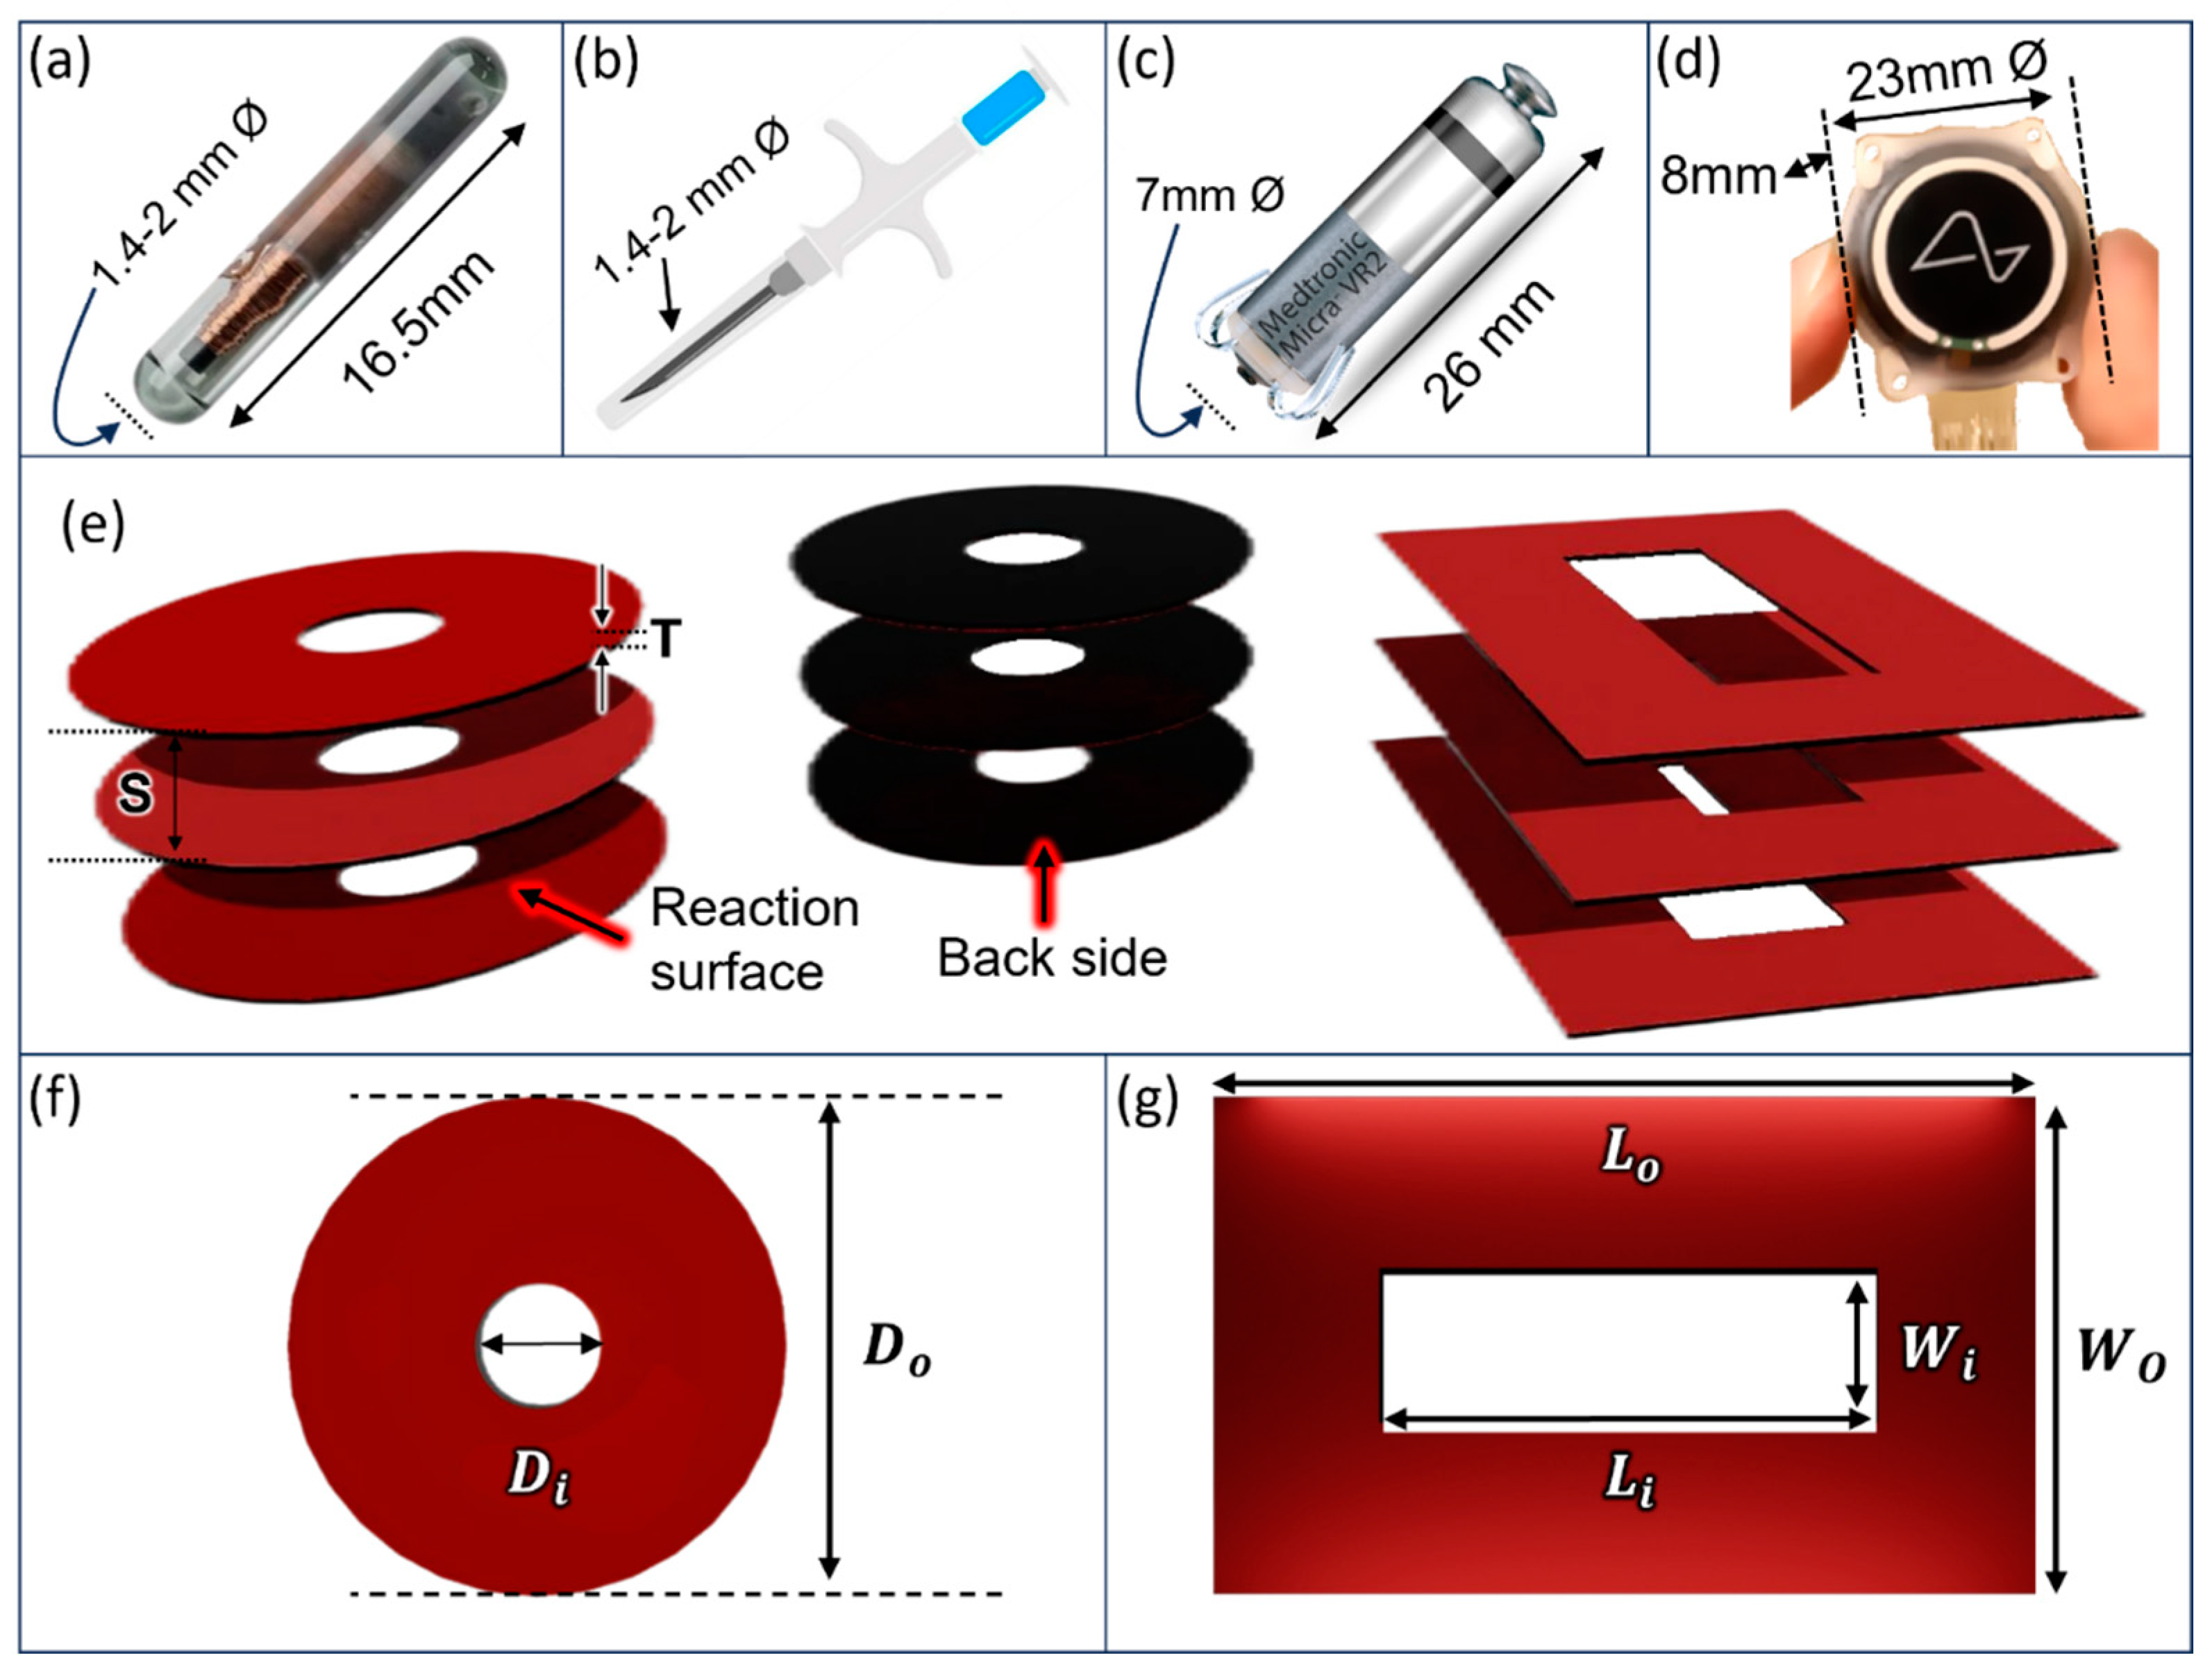
Figure 7.
The simulation method. The concentration gradient of glucose is calculated across the surface of the different structures. The power generation is then calculated and integrated for different parameters of area and separation. .
Figure 7.
The simulation method. The concentration gradient of glucose is calculated across the surface of the different structures. The power generation is then calculated and integrated for different parameters of area and separation. .
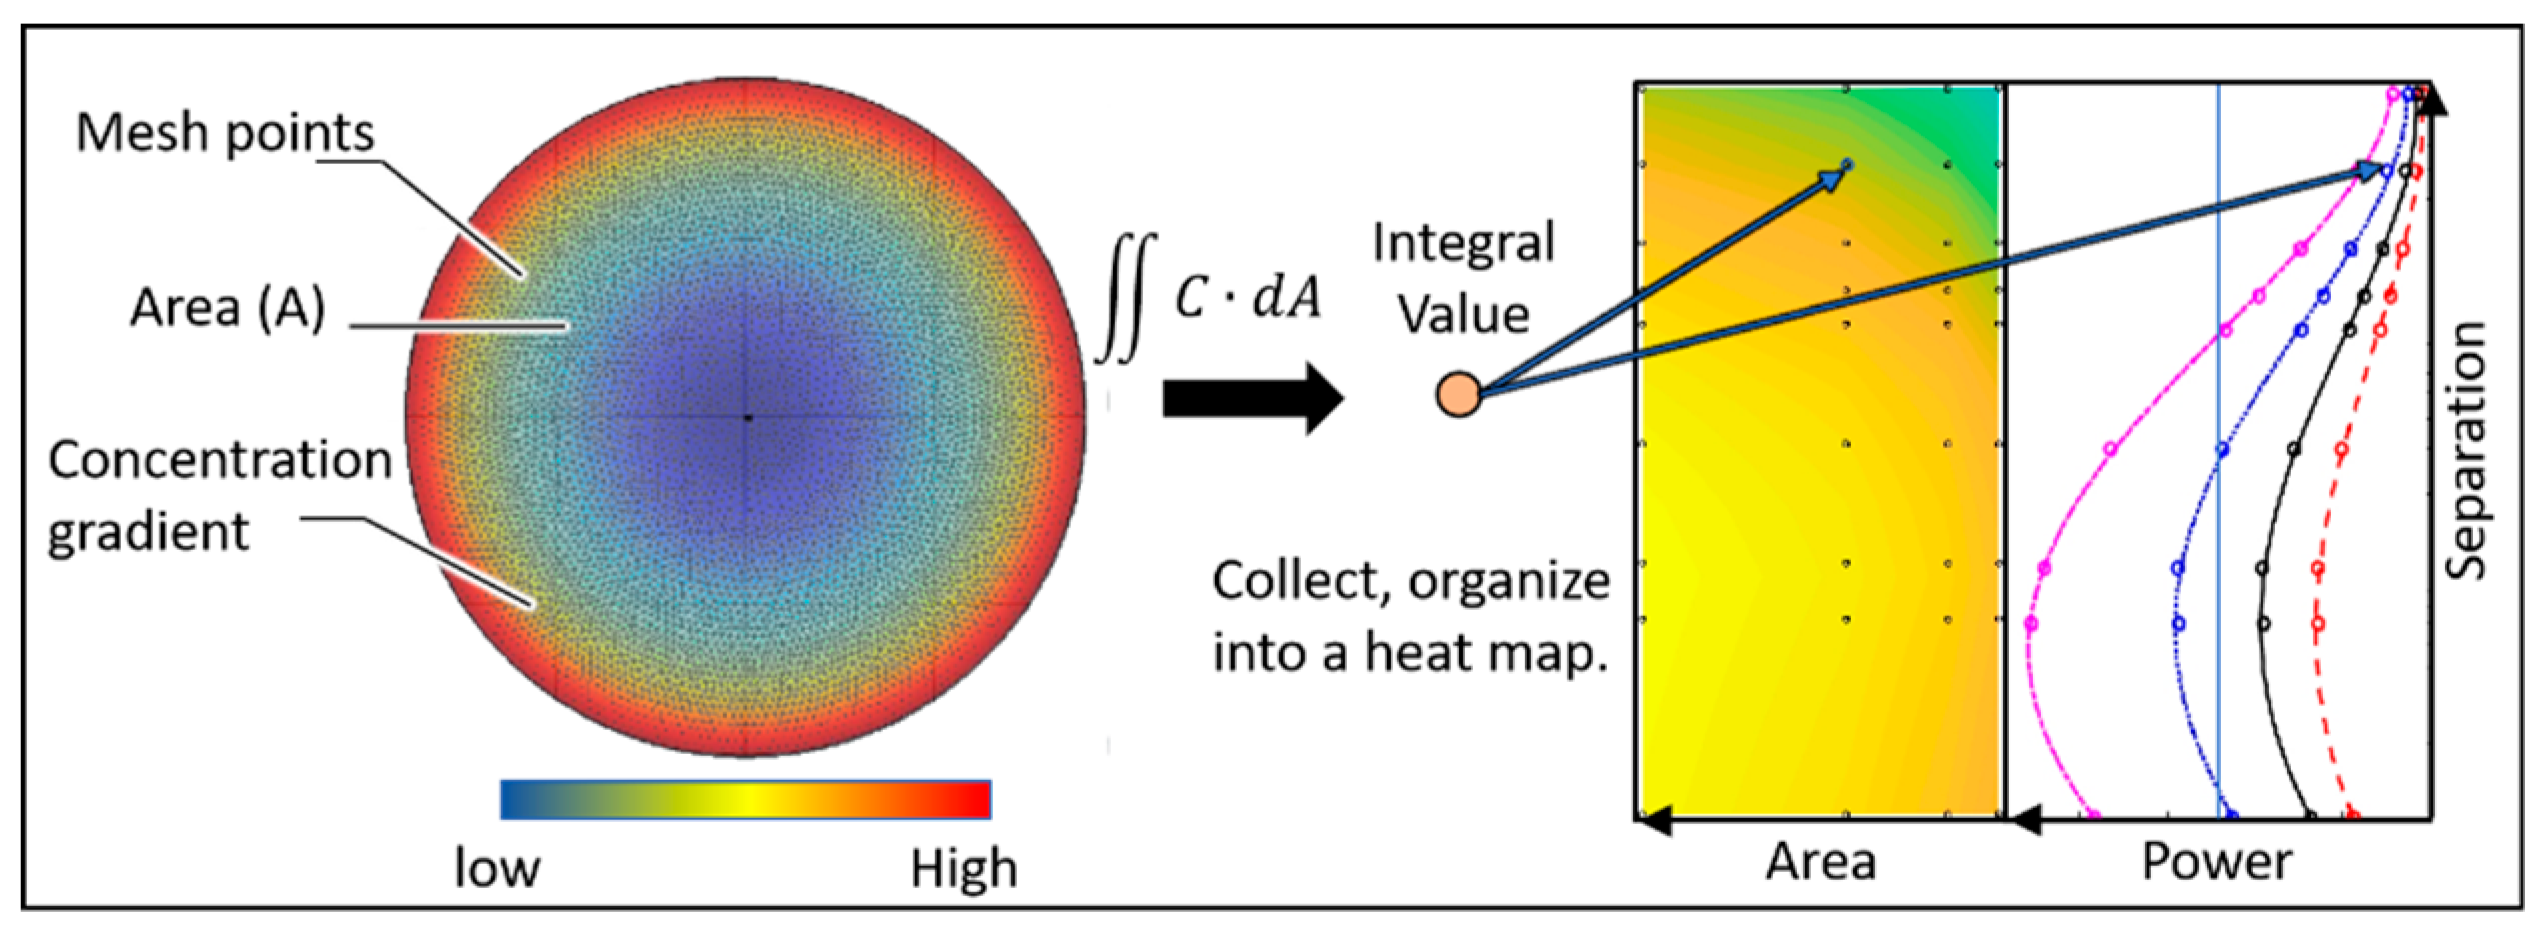
Figure 8.
From left to right are the power on cylinder model single power unit when the reaction rate is 2.5×10⁻⁶, 2.5×10⁻⁷, 2.5×10⁻⁸(mol) s-1m-2. The line graphs below clearly show the trend of single unit Power at different areas with different separations.
Figure 8.
From left to right are the power on cylinder model single power unit when the reaction rate is 2.5×10⁻⁶, 2.5×10⁻⁷, 2.5×10⁻⁸(mol) s-1m-2. The line graphs below clearly show the trend of single unit Power at different areas with different separations.
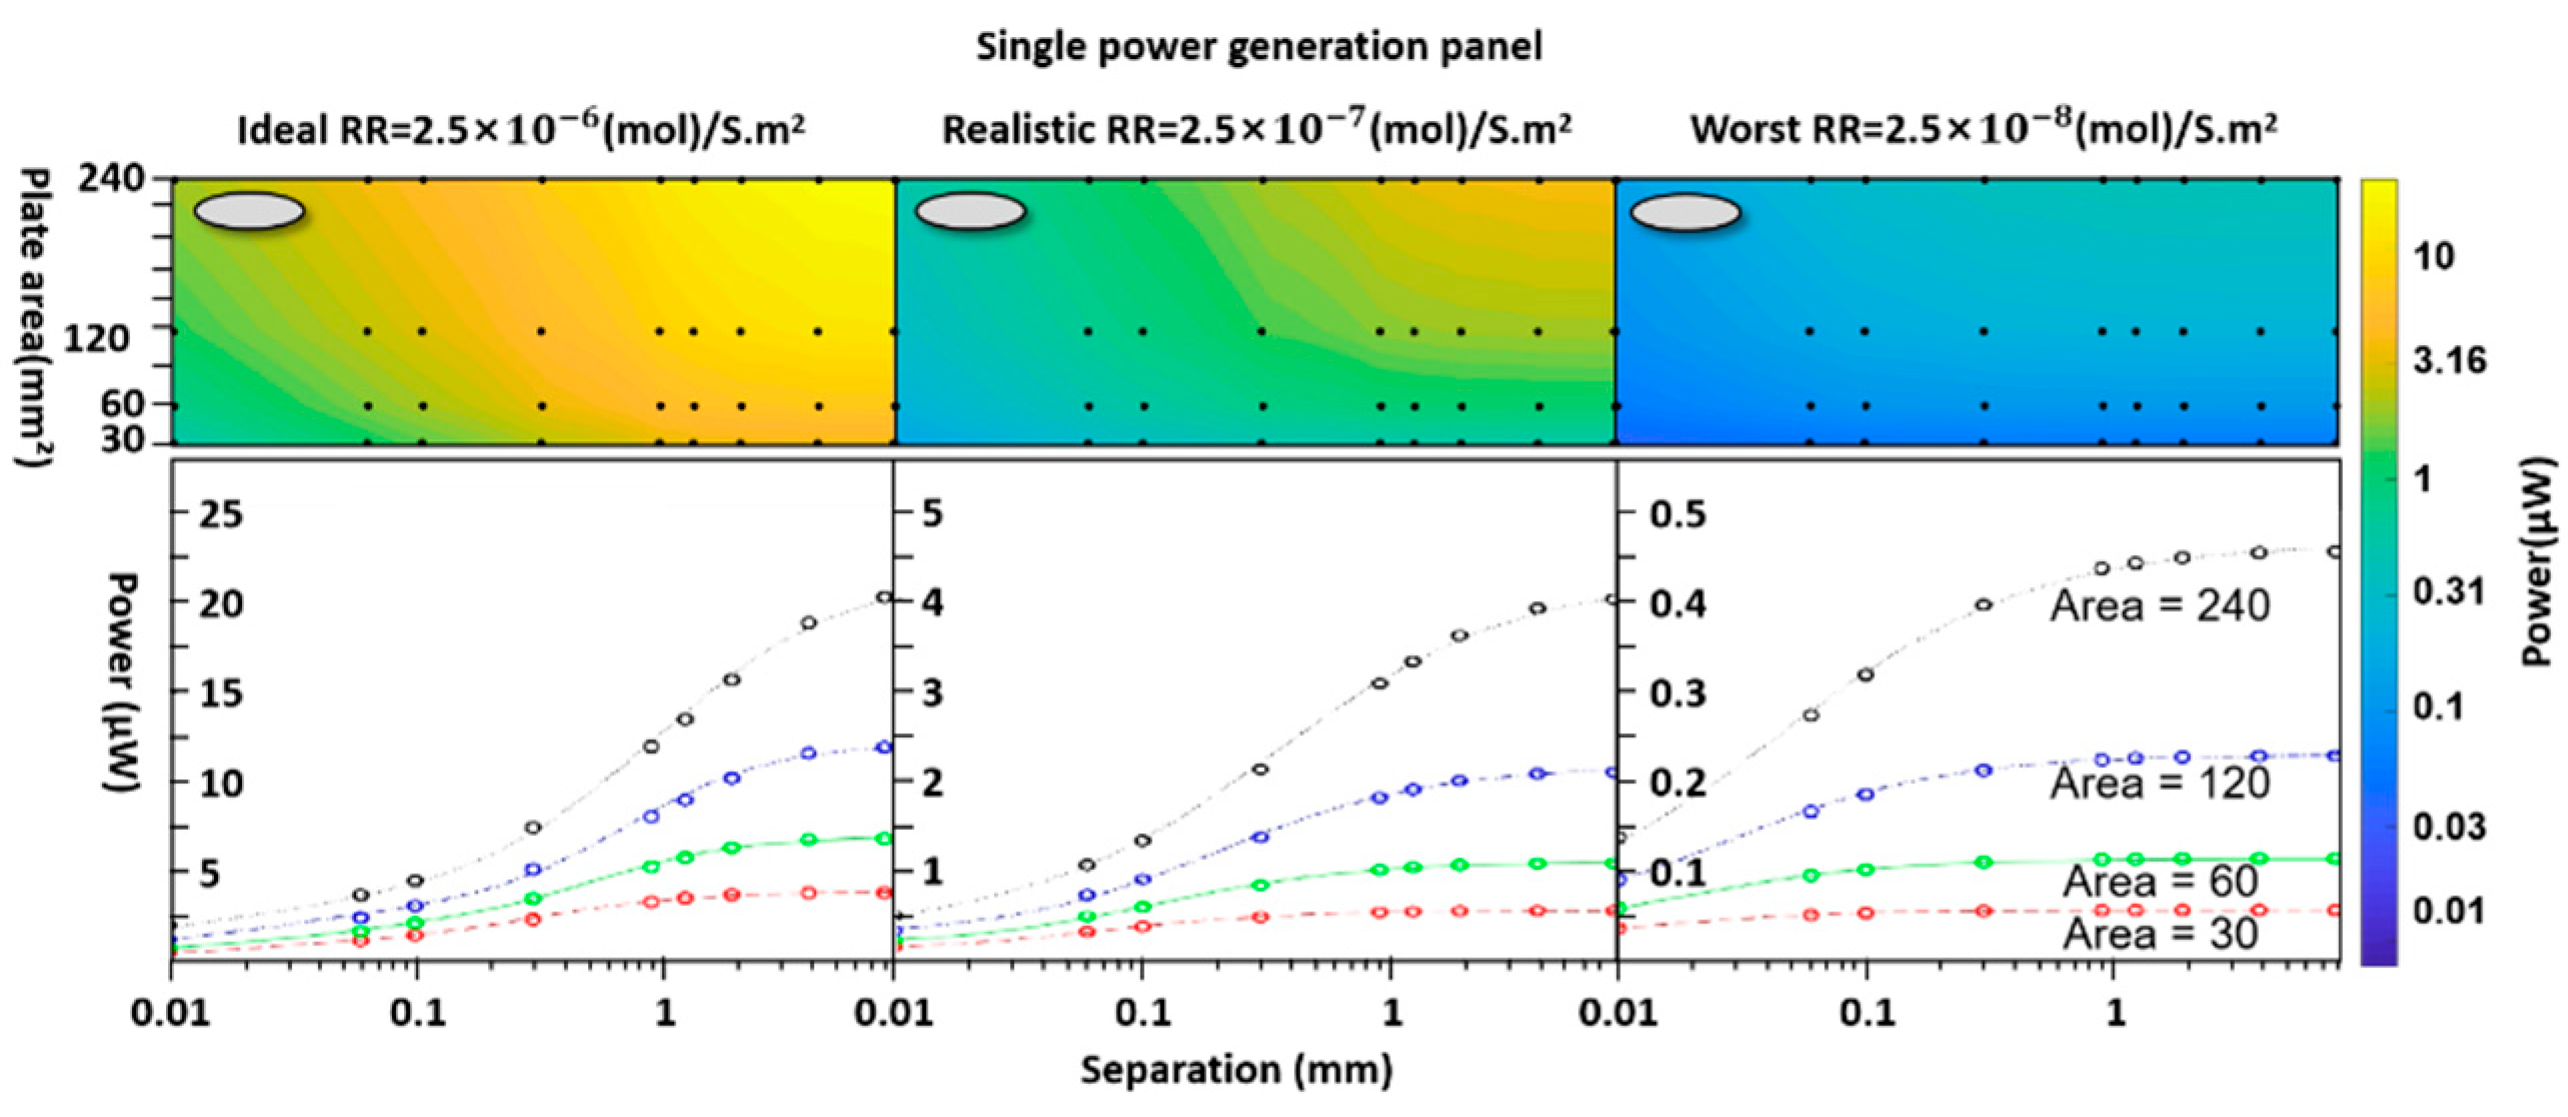
Figure 9.
From left to right are the power on rectangular unit model single power unit when the reaction rate is 2.5×10⁻⁶, 2.5×10⁻⁷, 2.5×10⁻⁸(mol) s-1m-2. The line graphs below clearly show the trend of single unit Power at different areas with different separations.
Figure 9.
From left to right are the power on rectangular unit model single power unit when the reaction rate is 2.5×10⁻⁶, 2.5×10⁻⁷, 2.5×10⁻⁸(mol) s-1m-2. The line graphs below clearly show the trend of single unit Power at different areas with different separations.
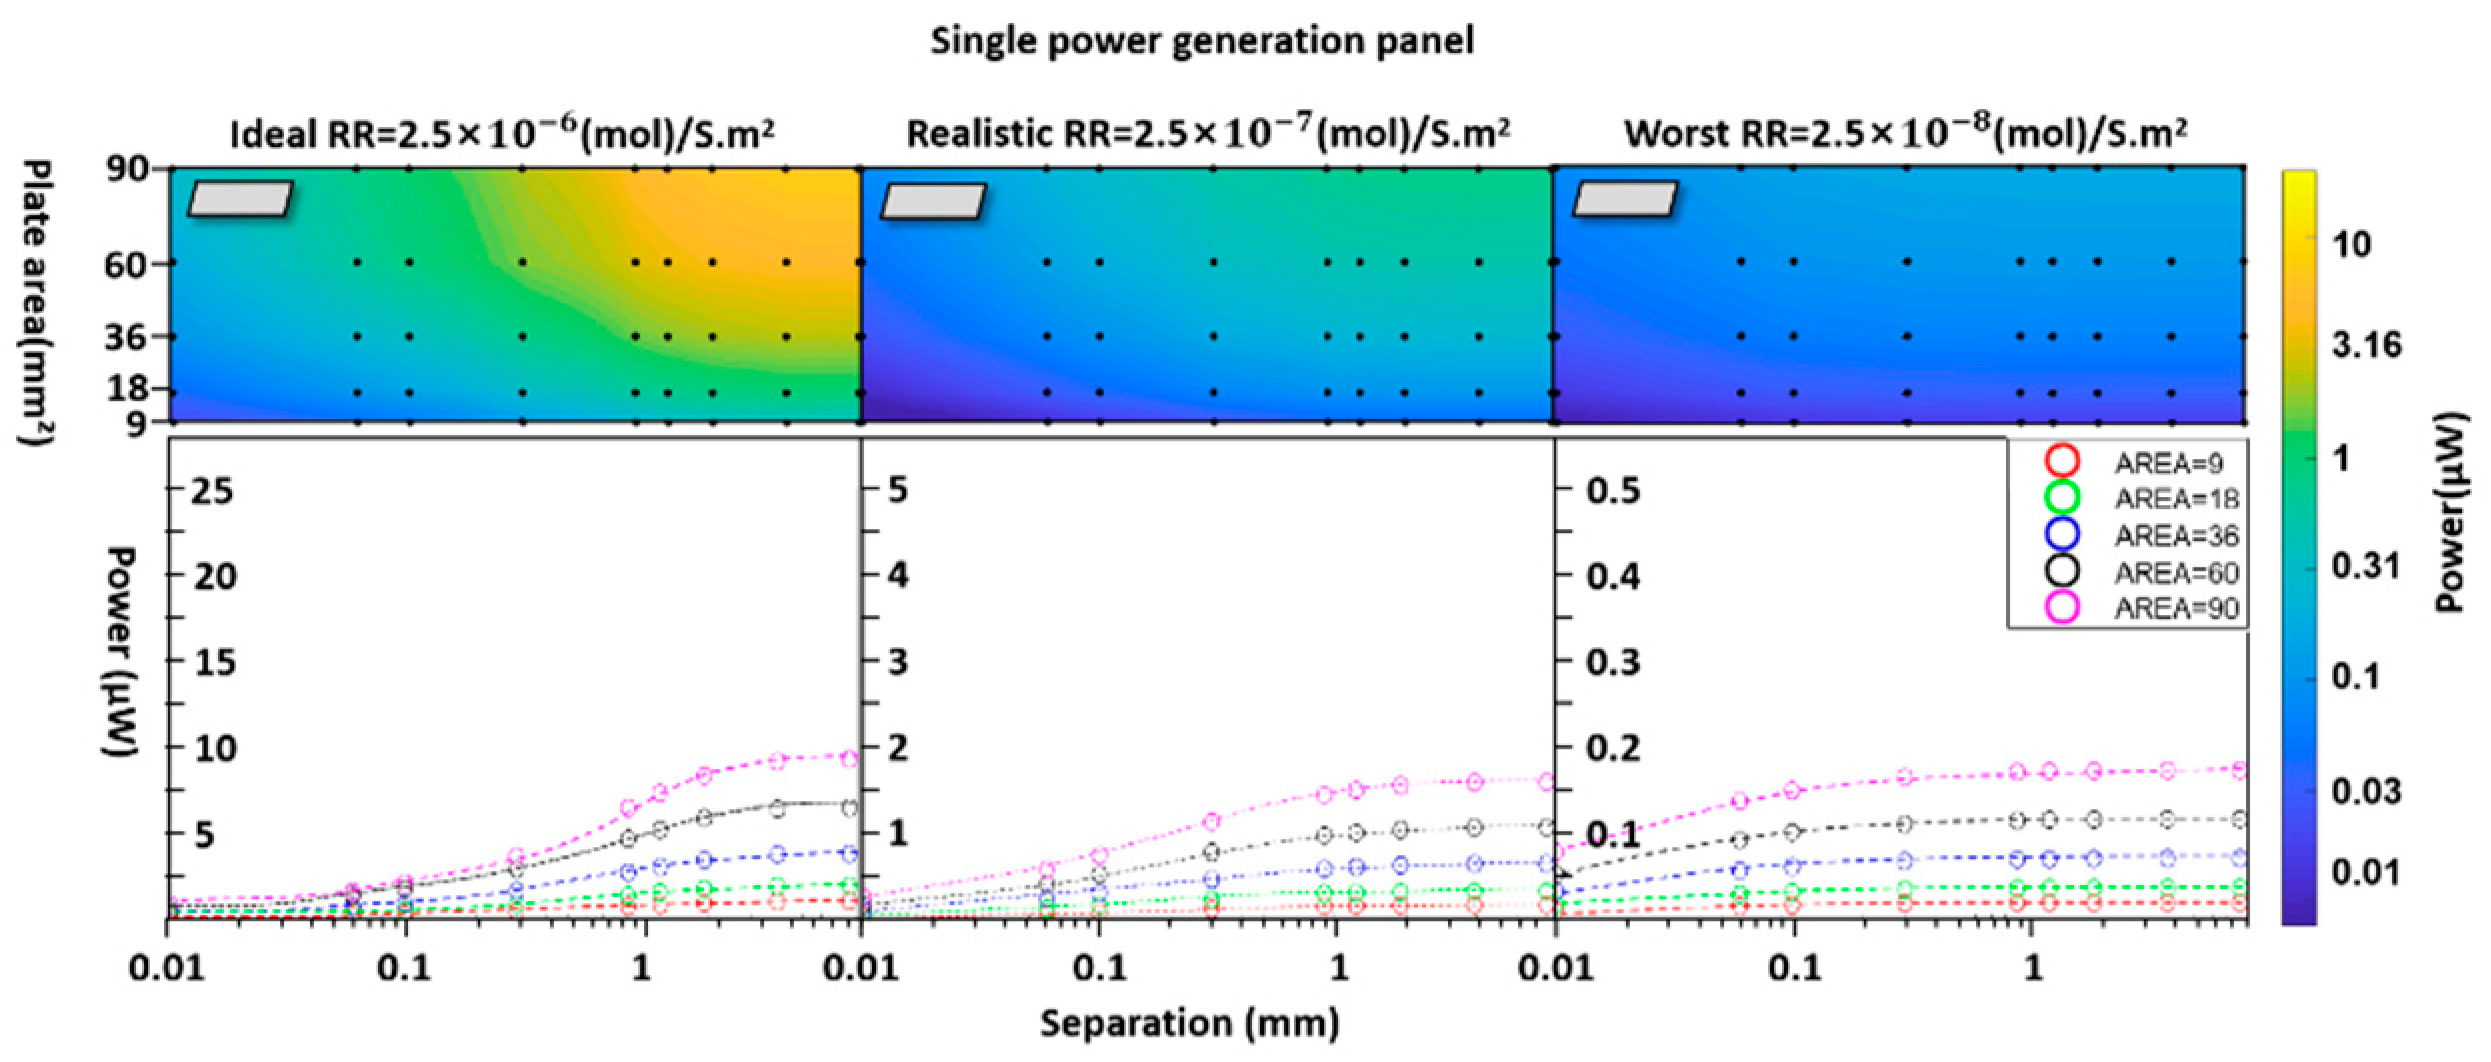
Figure 10.
From left to right are the total power of the cylinder model when the reaction rate is 2.5×10⁻⁶, 2.5×10⁻⁷, 2.5×10⁻⁸(mol) s-1m-2 . The line graphs below clearly show the trend of multiunit Power at different areas with different separations. The maximum power is when the separation is close to 60 μm.
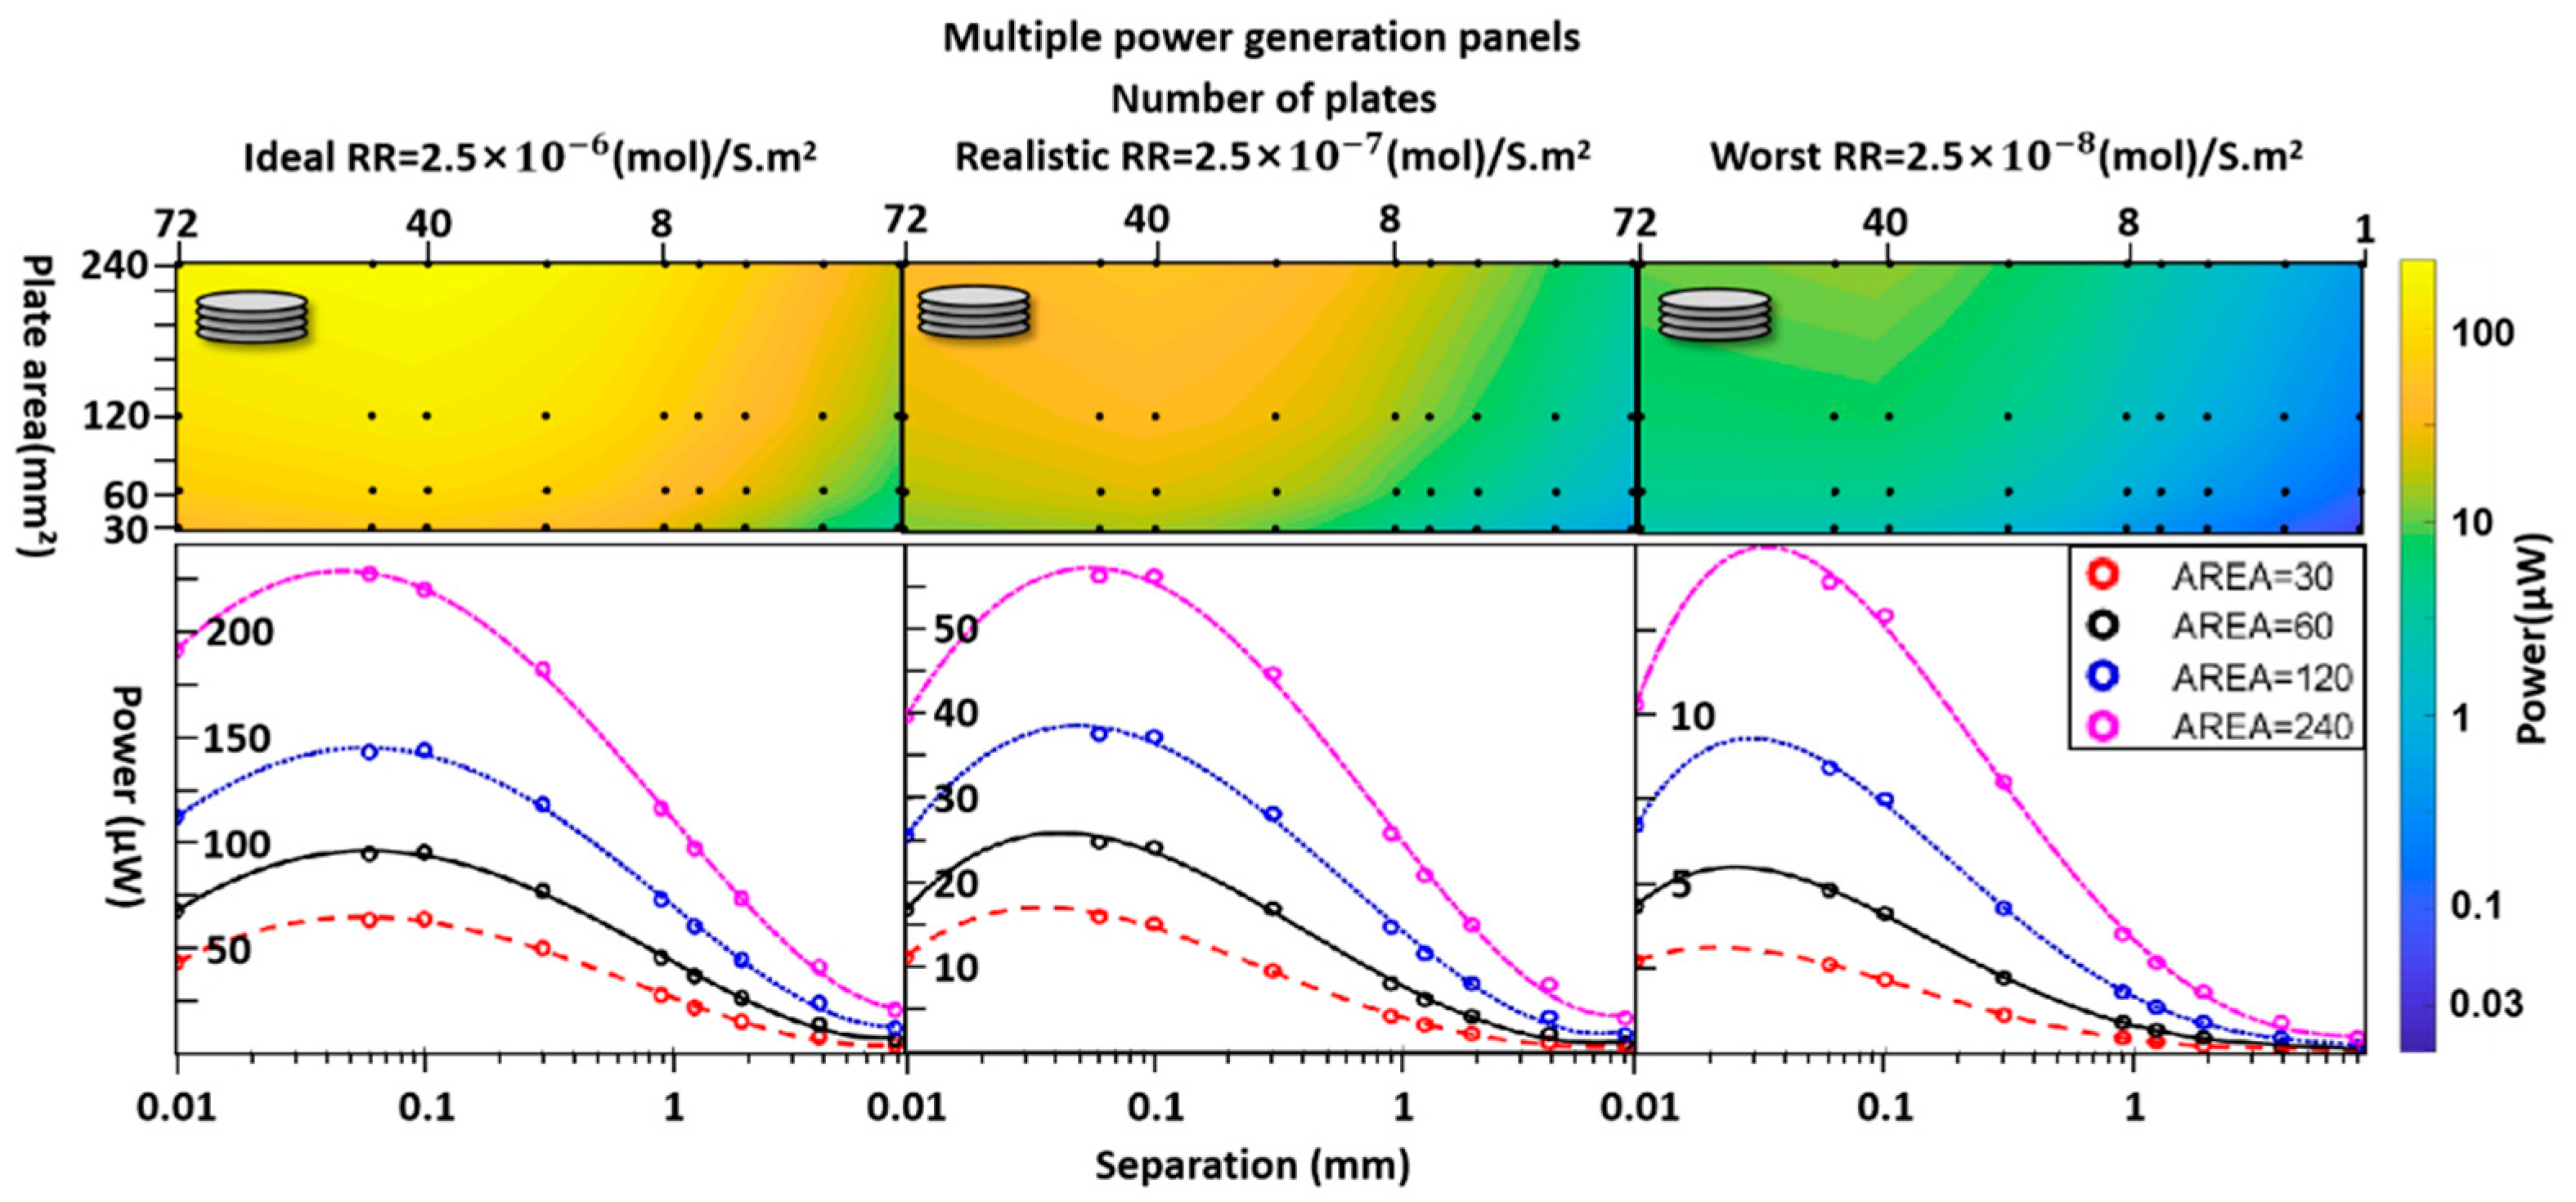
Figure 11.
From left to right are the total power of the rectangular unit model when the reaction rate is 2.5×10⁻⁶, 2.5×10⁻⁷, 2.5×10⁻⁸(mol) s-1m-2. The red arrow points to the maximum power. The line graphs below clearly show the trend of multiunit Power at different areas with different separations. The maximum power is when the separation is close to 60 μm.
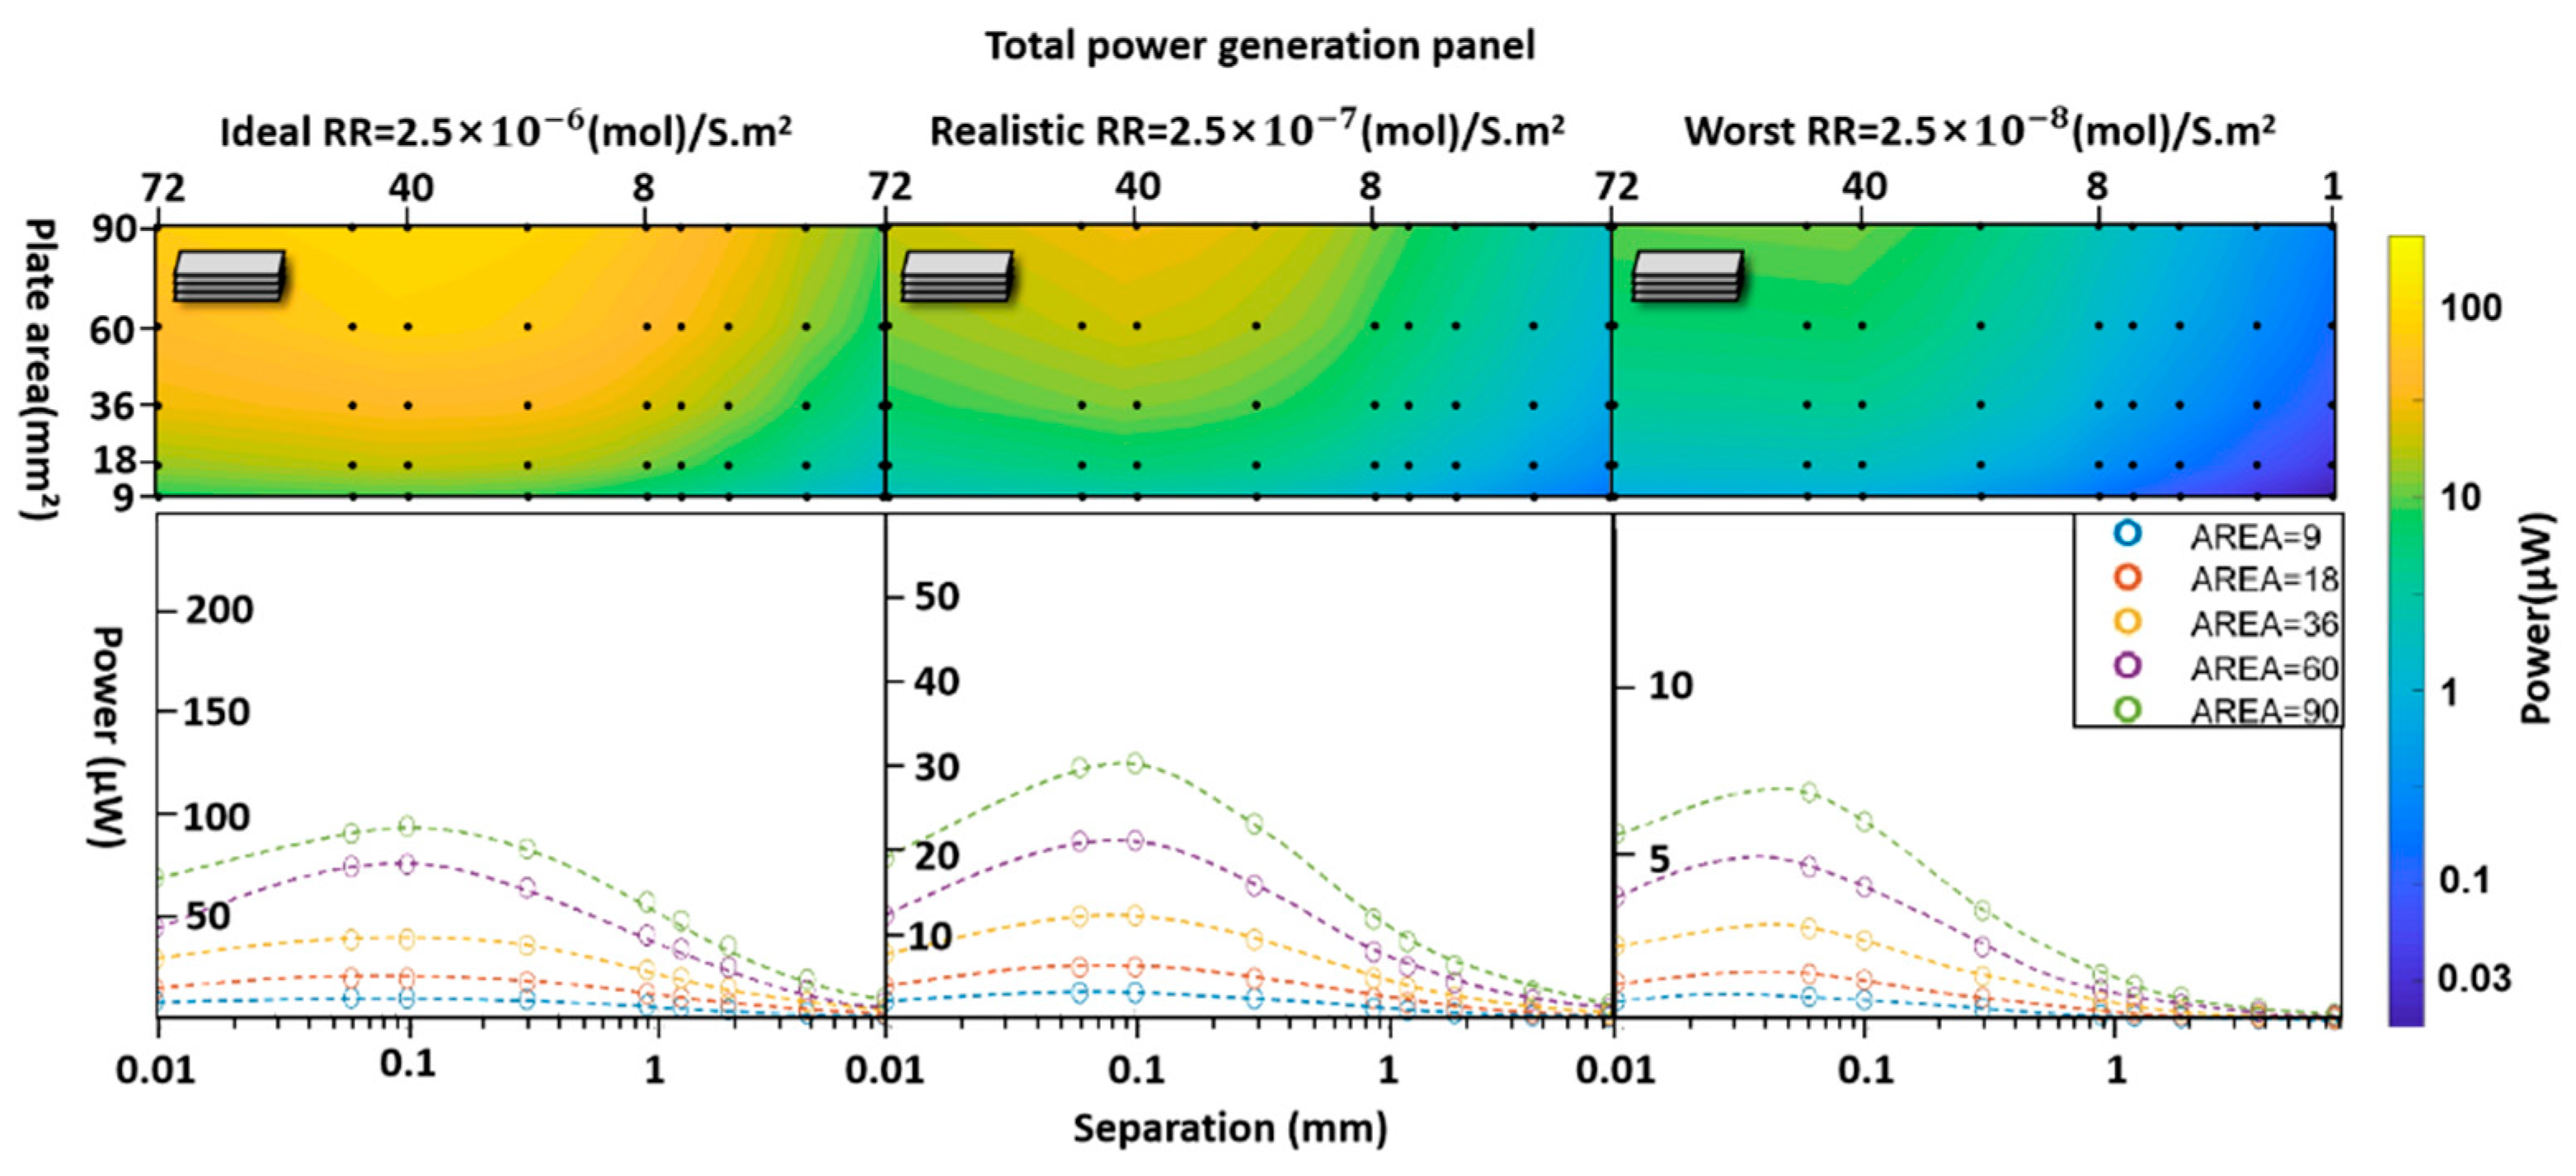
Figure 12.
Shows the relationship between total energy and size when the reaction rate is 2.5x10⁻⁷ (mol) s-1m-2,with the pill-type generator unit without hole on the left and the coin-type generator unit without hole on the right. It is found that the total power and size are not linearly related.
Figure 12.
Shows the relationship between total energy and size when the reaction rate is 2.5x10⁻⁷ (mol) s-1m-2,with the pill-type generator unit without hole on the left and the coin-type generator unit without hole on the right. It is found that the total power and size are not linearly related.
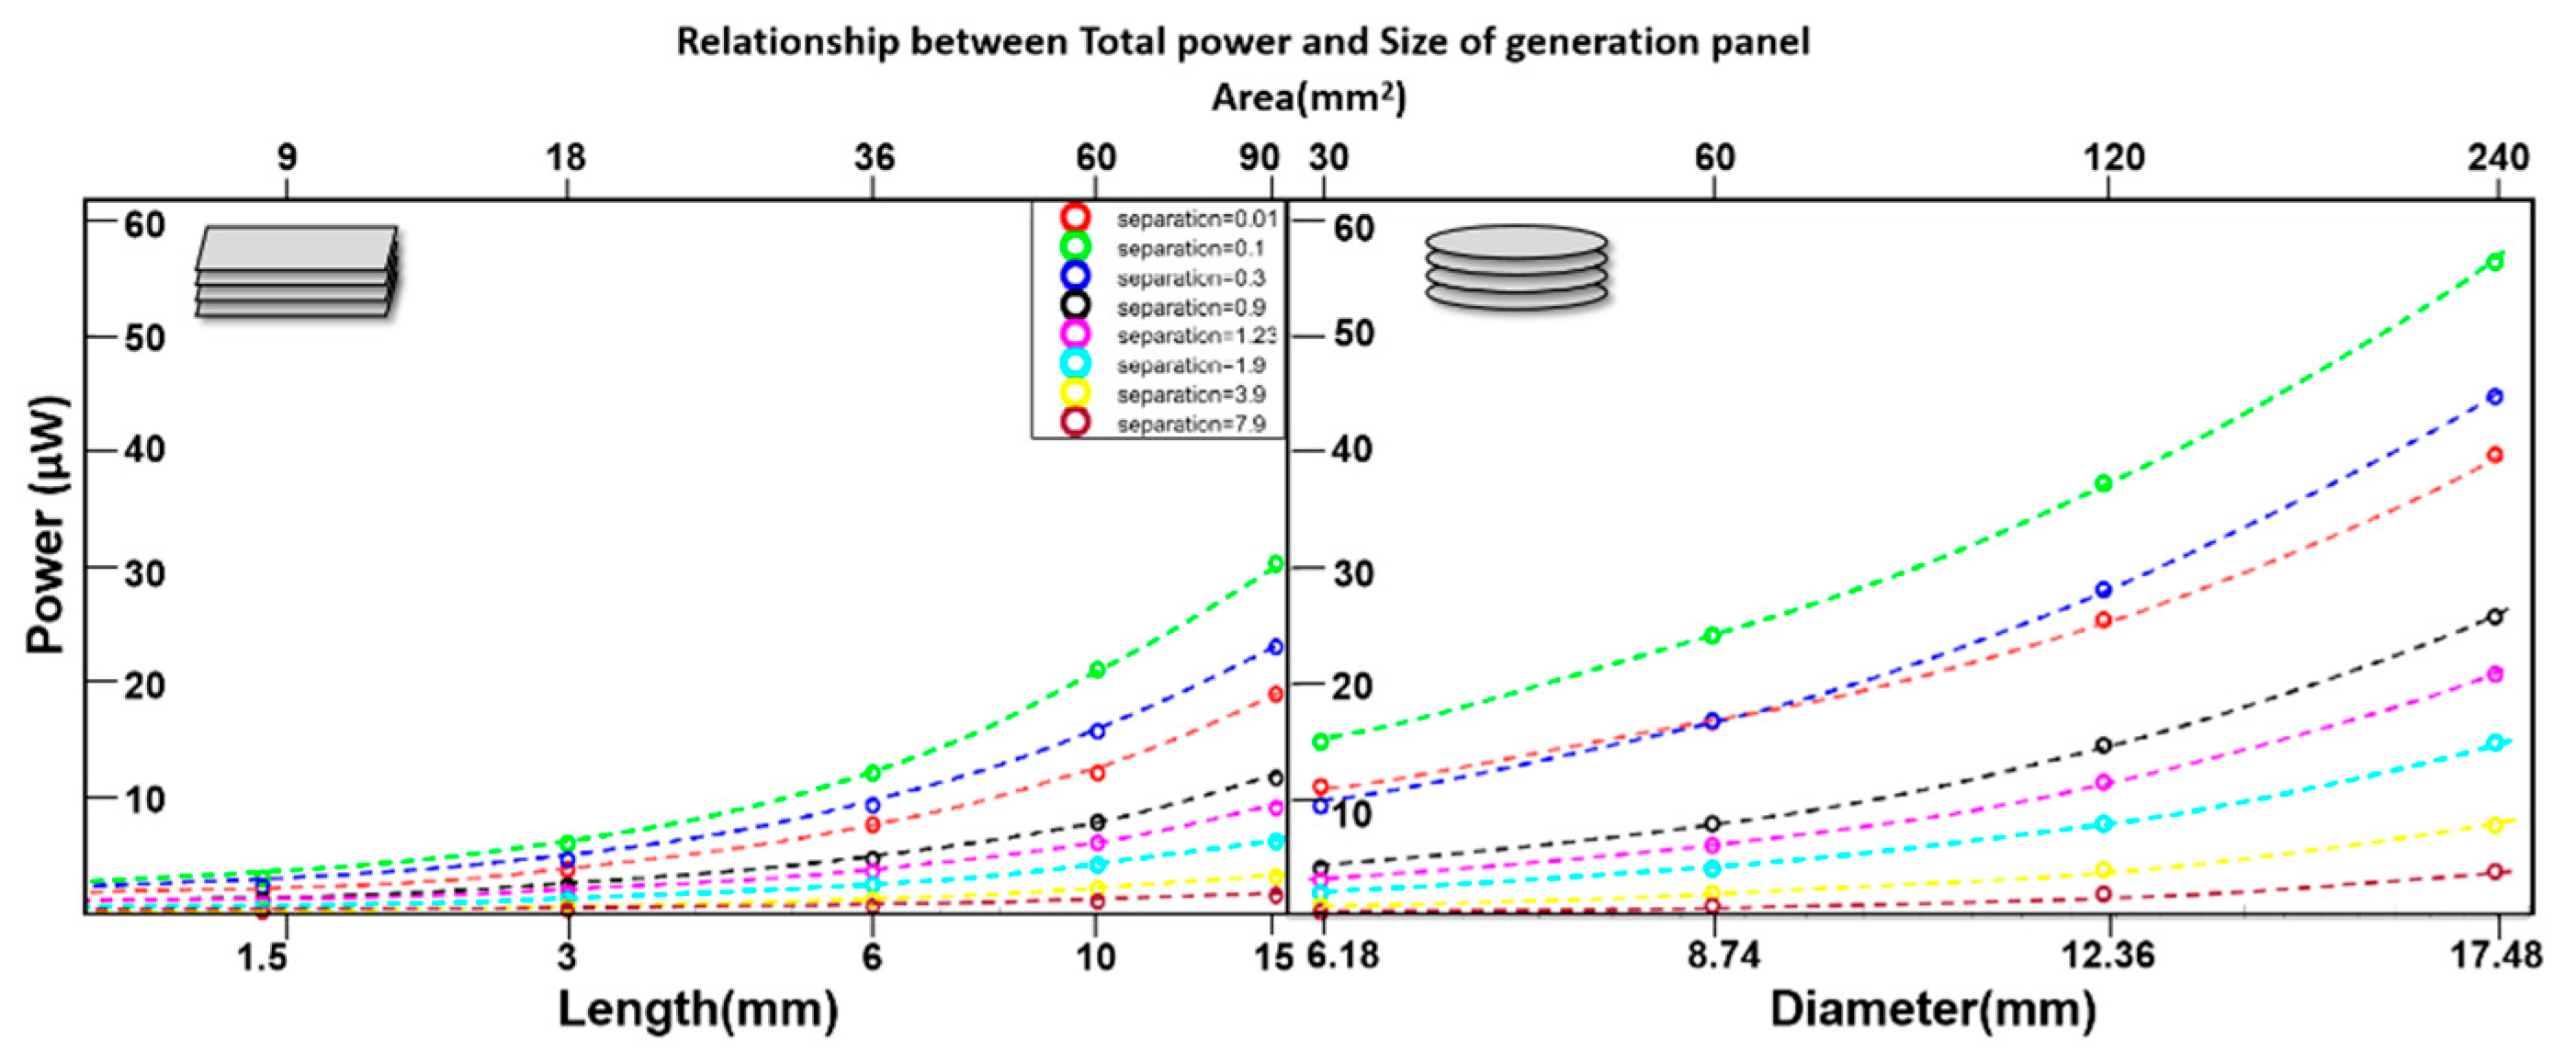
Figure 13.
Shows the power generated by a single generating unit and multiple generating units when the base rate is 2.5×10⁻⁷, (mol) s-1m-2. The red arrows show the maximum power at each separation. The line graphs below clearly show the trend of single unit and multiple units Power at different areas with different separations. Below the red line(1μW) is can’t work, between the red and green lines is may work, and above the green line(10μW) is working.
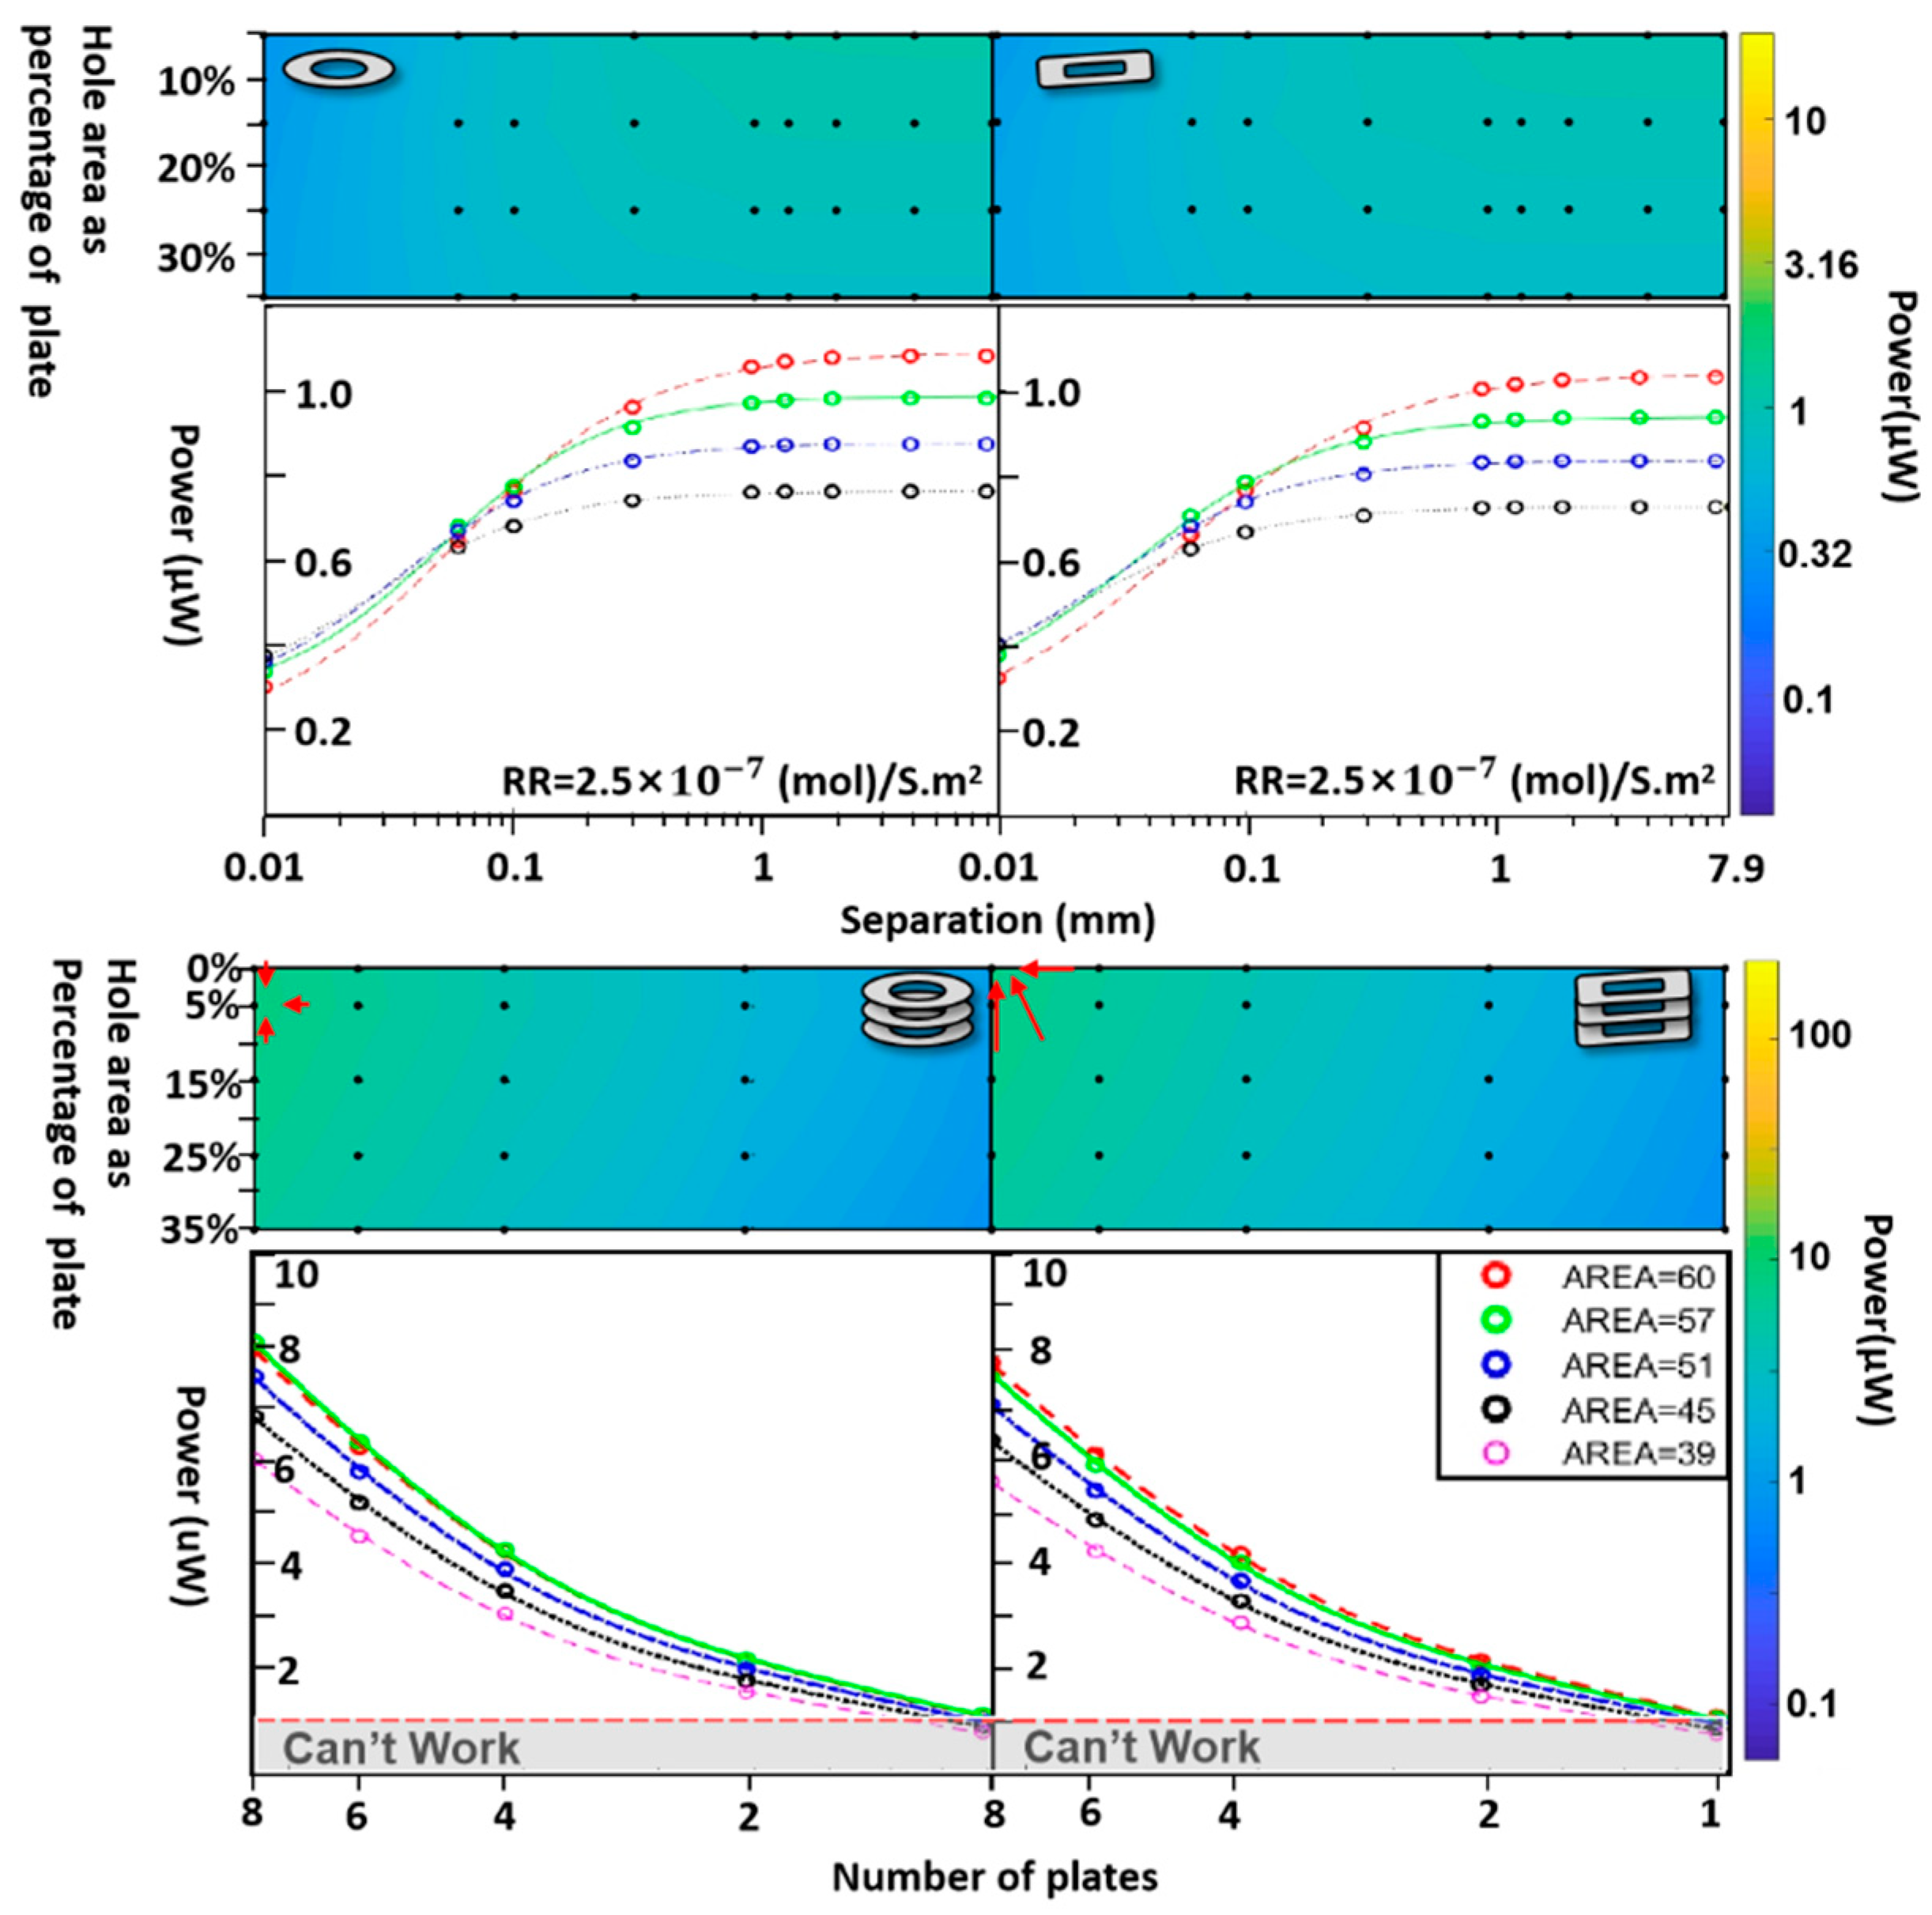
Figure 14.
is a manufacturable ideal model. It represents the broad pill-shaped unit’s size is 1.5-15×6mm(with power ~ 9 - 57 μW), and the coin-shaped unit’s diameter is 6.18-17.48mm(with power ~ 28 -116 μW), and there are 8 power-generating units. Their anode material is gold and their cathode material is platinum.
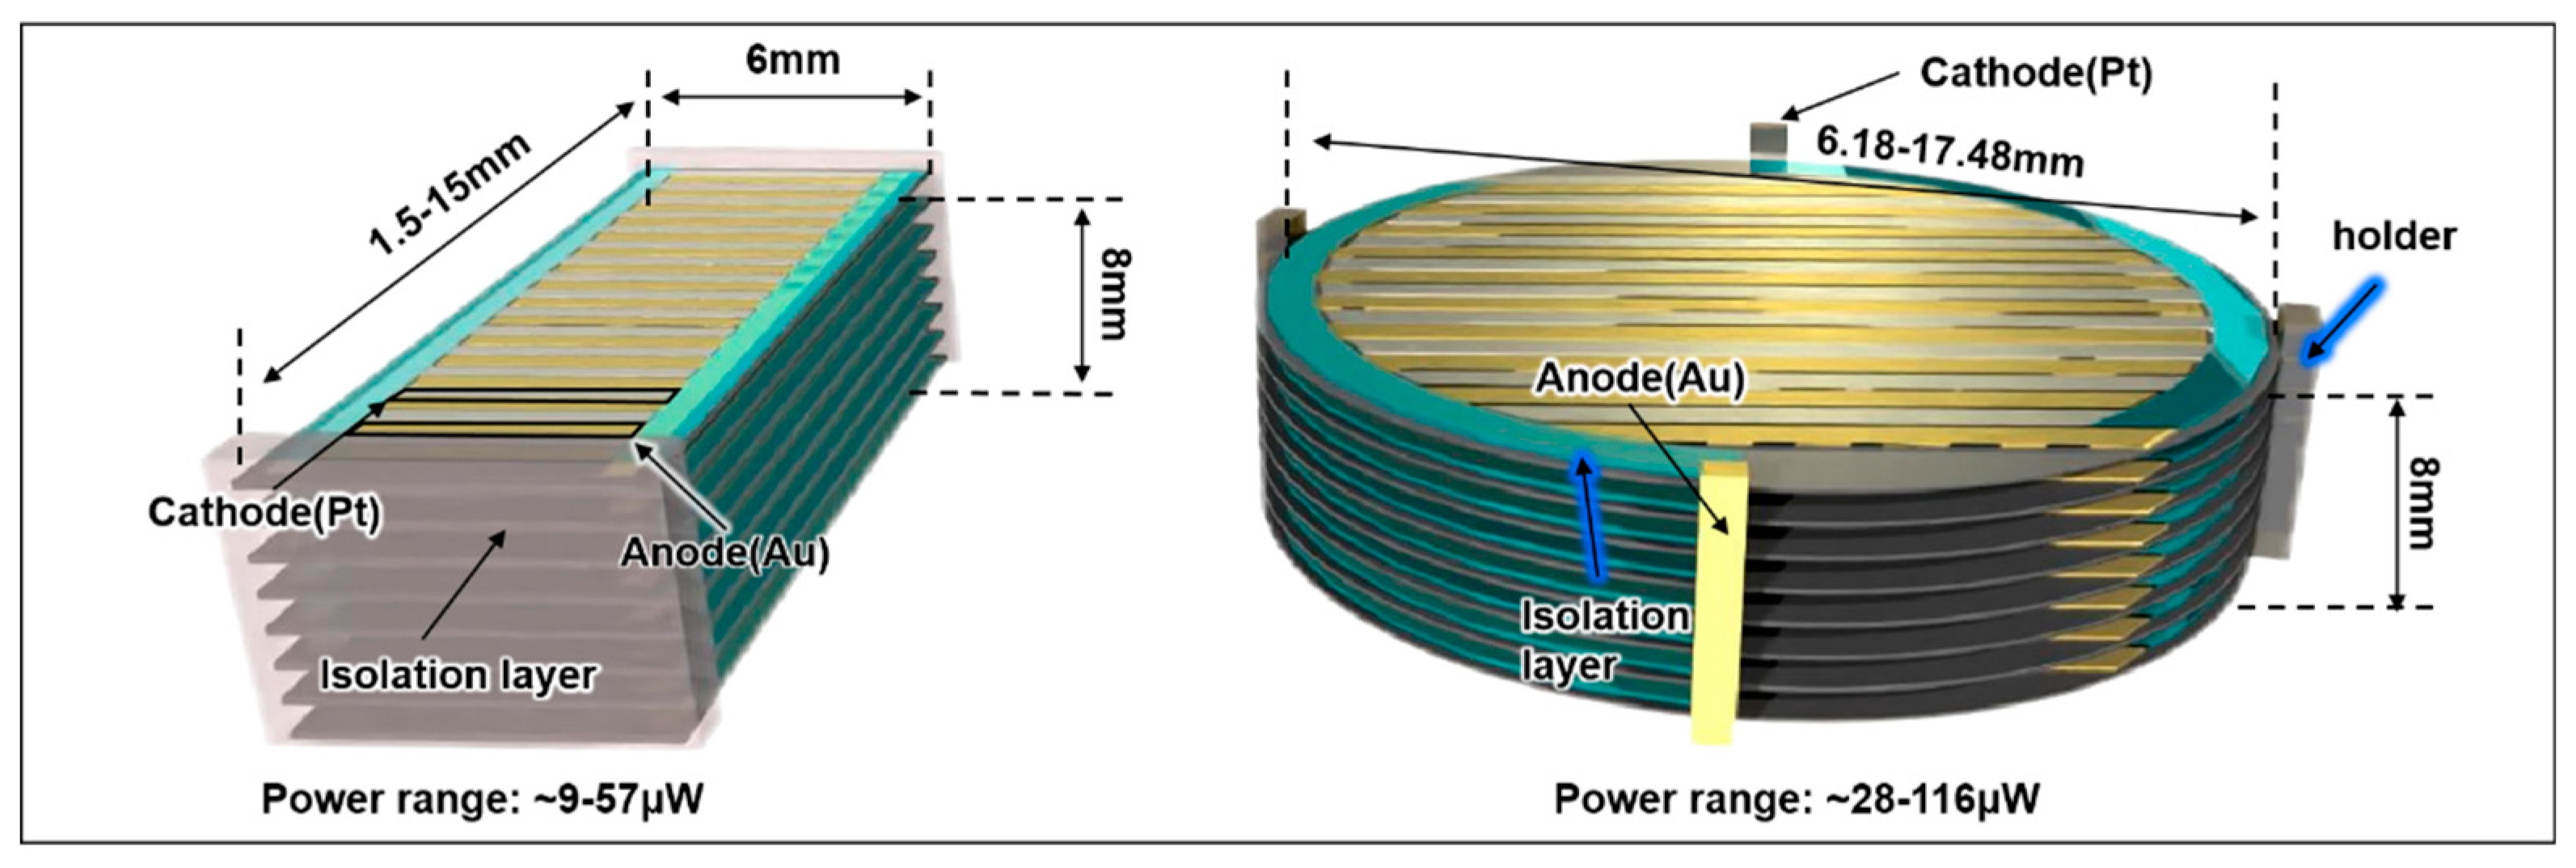
Figure 15.
a. is to view the fuel cell as a series connection of Thevenin equivalent circuit, i.e., a voltage source, with higher voltage but lower current , ZT is Thevenin impedance; b. is to view the fuel cell as a parallel connection of Norton equivalent circuit, i.e., a current source, with higher current but lower voltage, ZN is Norton impedance; and c. is a combination of the two, which is probably the best choice.
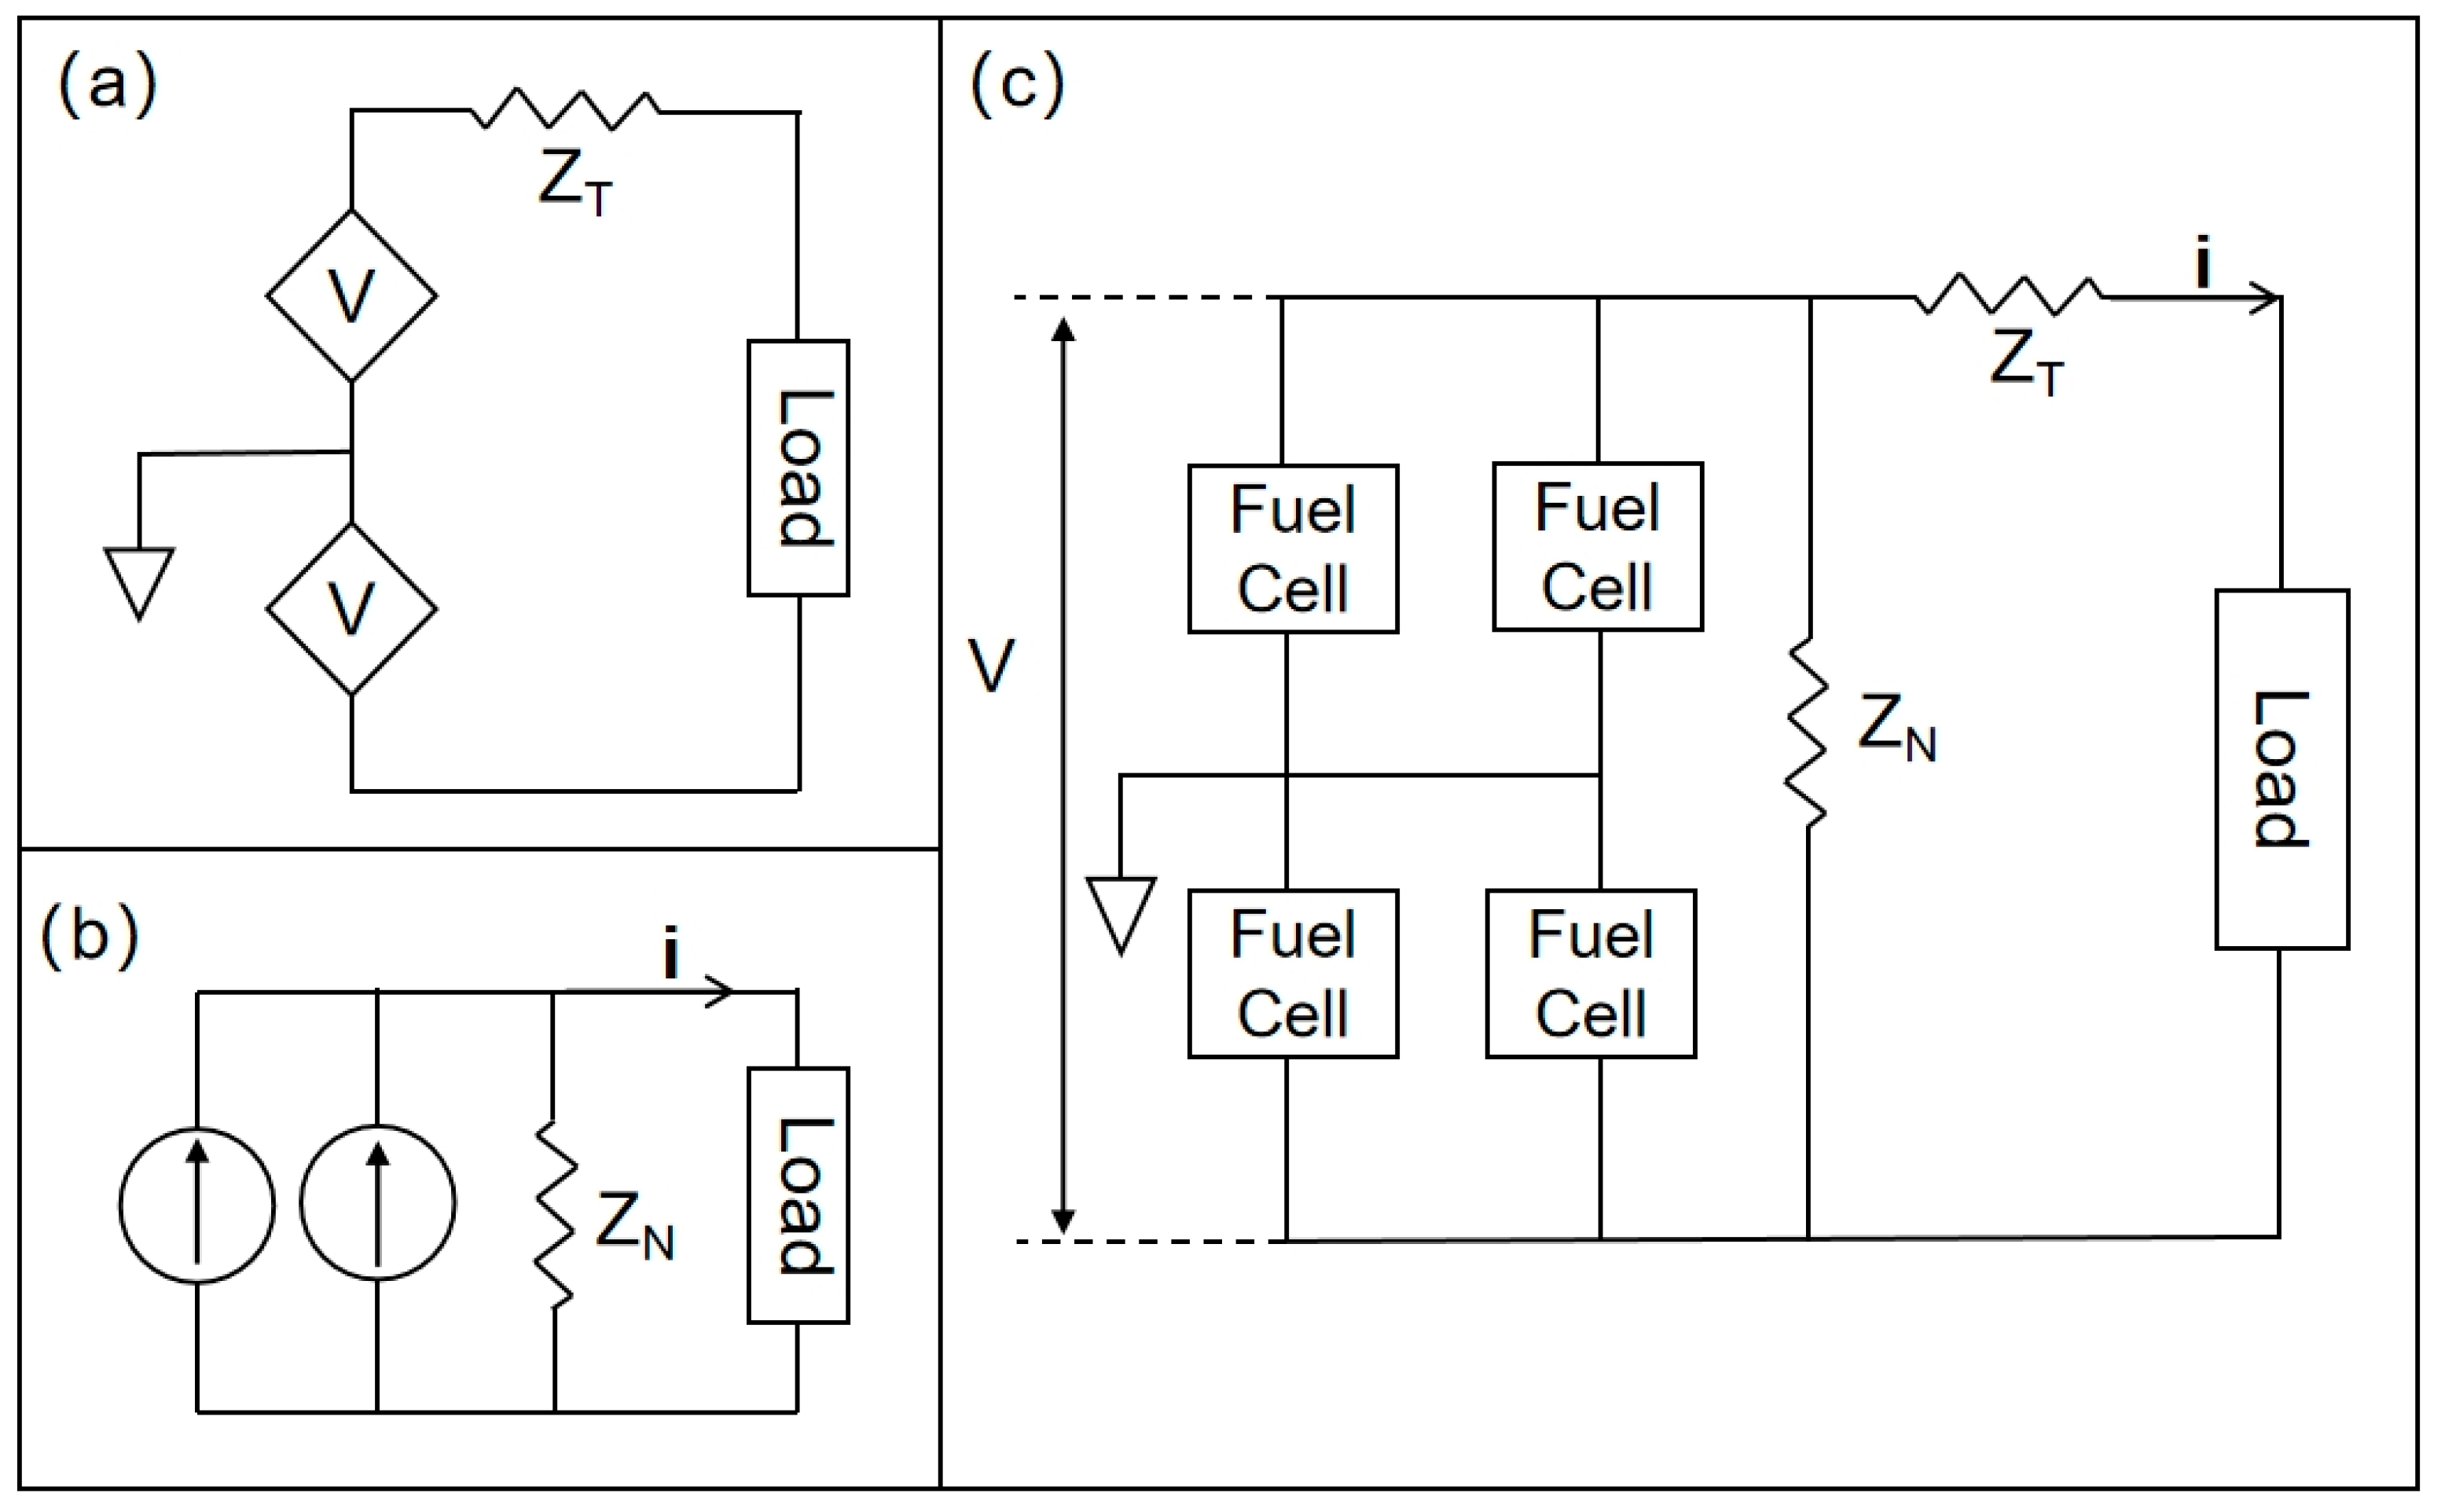
Figure 16.
Comparison of an abiotic glucose fuel cell with existing medical implantable batteries: the red and black points indicate the lifetimes of existing batteries, calculated based on varying power consumption and curve fitting. Given the long projected lifetime of an abiotic glucose fuel cell, the yellow region of the graph represents the area considered advantageous. In addition, size will be limited due to the presence of factors such as encapsulation.
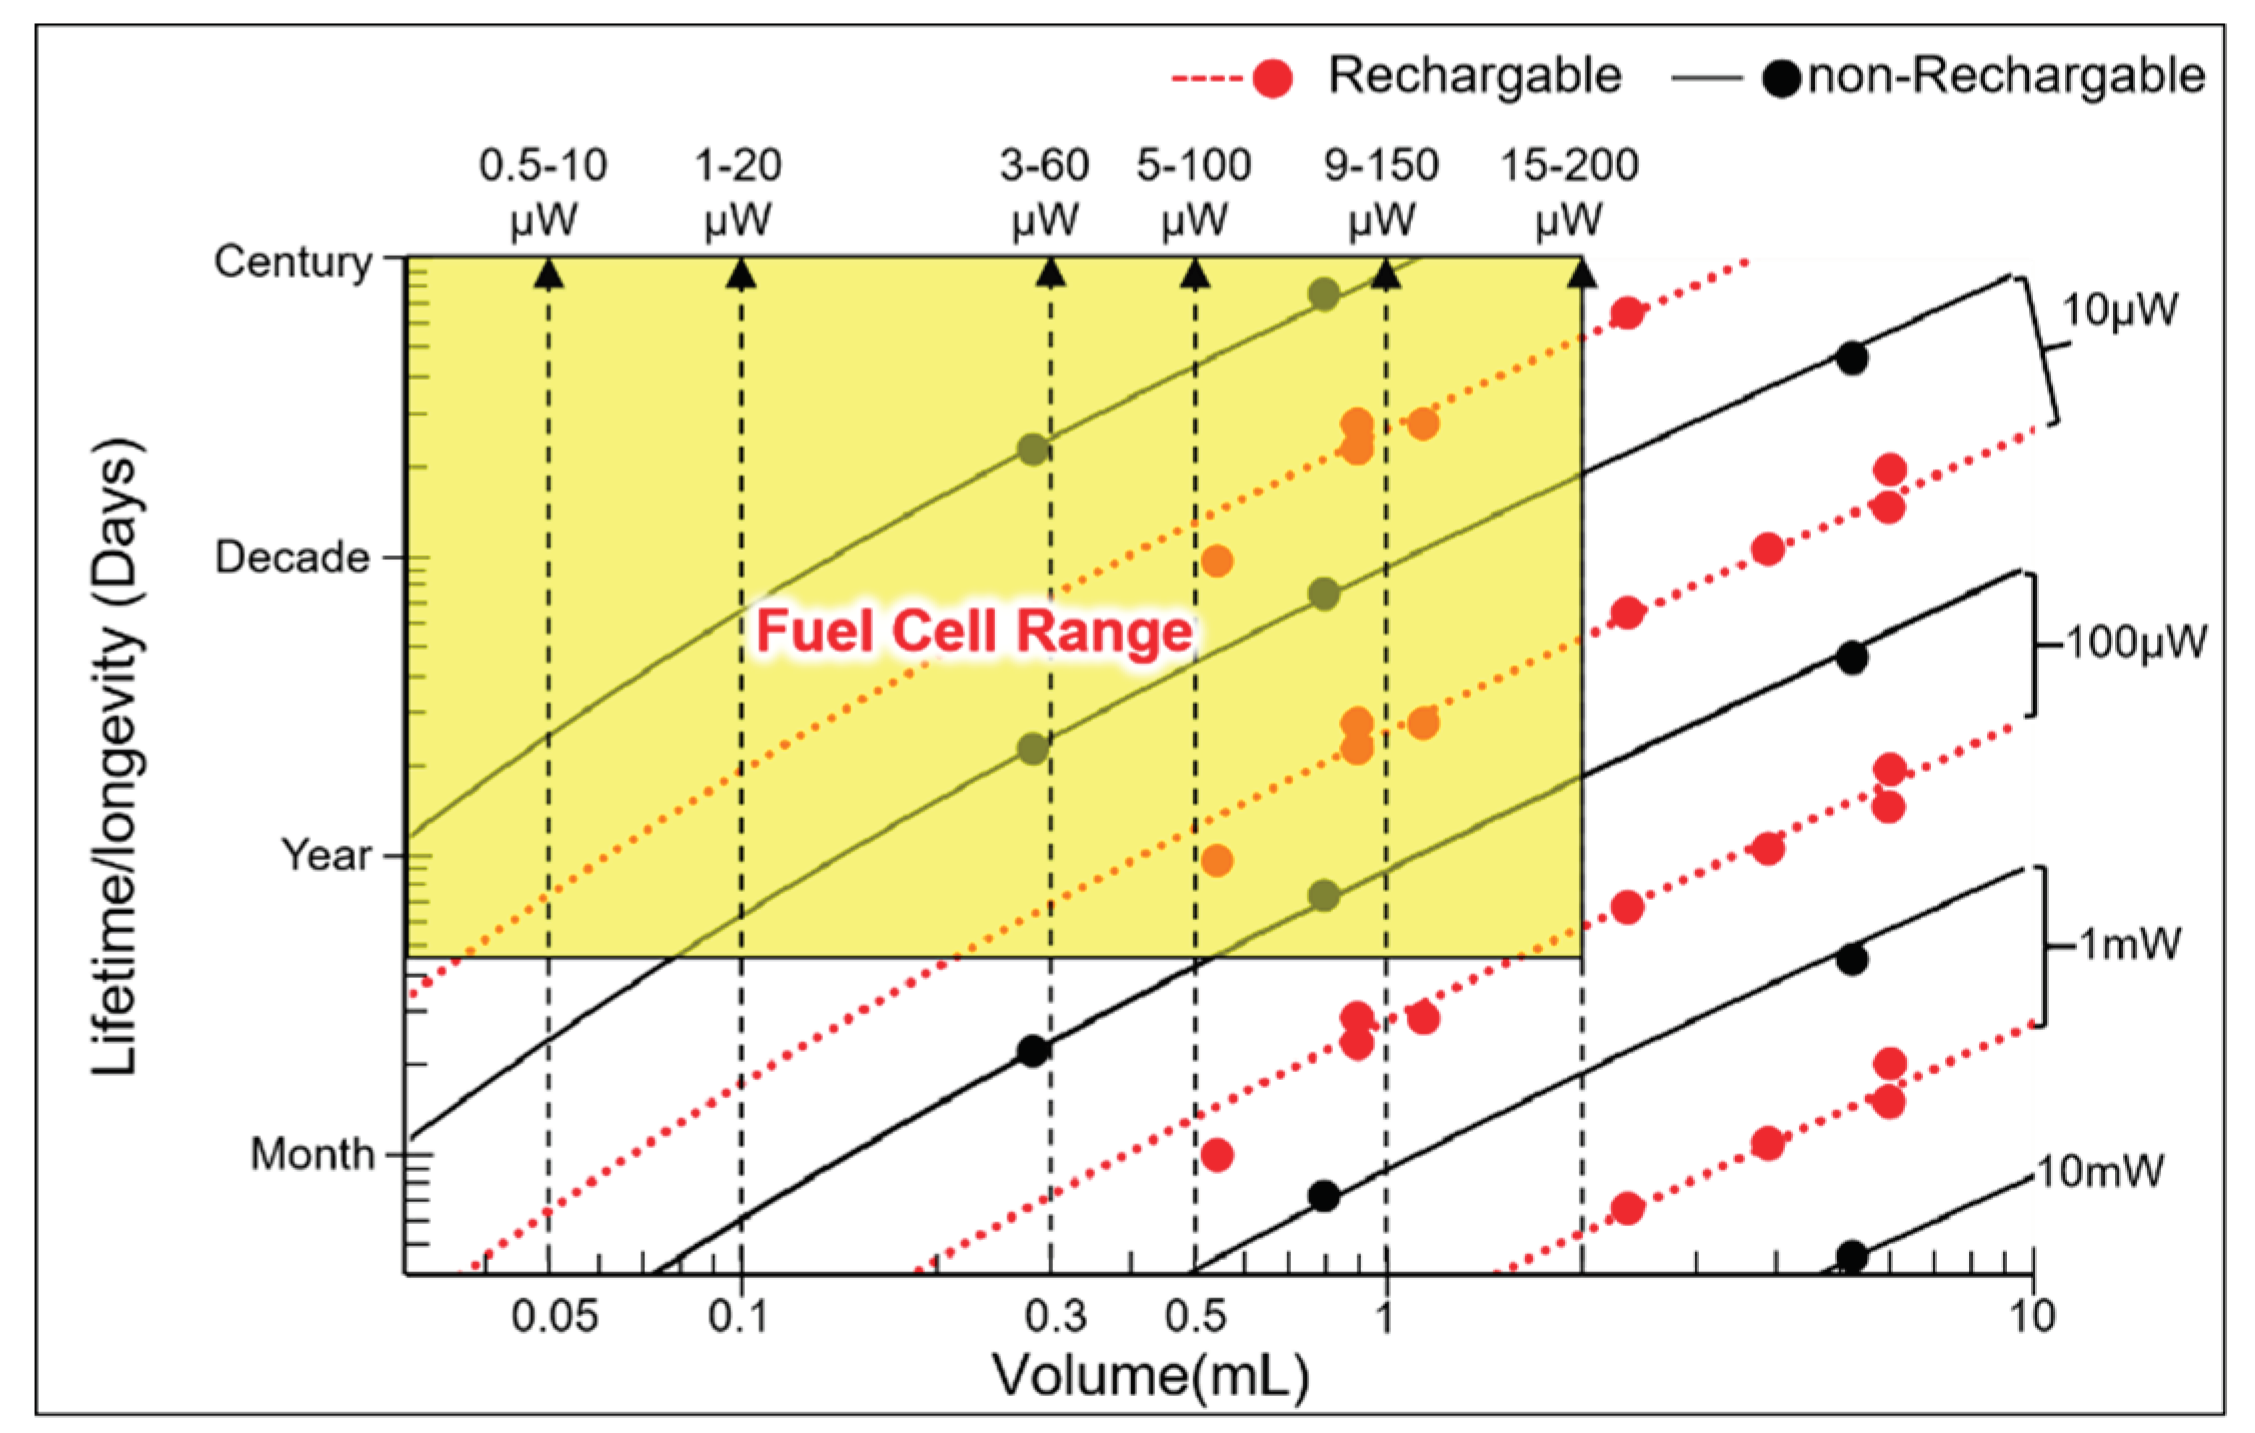

Table 1.
Range of power consumption for different medical implants.
| Implant | Power range | Lifetime when powered by a 10 mL battery | Lifetime when powered by a 1 mL battery | Lifetime when powered by a 50 µL battery | Ref |
|---|---|---|---|---|---|
| Bioelectronic medicine | <10 μW |
>118 years | >11 years | >7 months | [19,20] |
| Pacemaker | ~10-100 μW | ~11-118years | ~1-11 years | ~21days- 7months |
[21] |
| Neurostimulator | ~100-400 μW |
~3-11 years | ~108 days -1 year | ~5-21days | [22] |
| Sensory prosthetics | >10 mW | Wireless power | Wireless power | Wireless power | [31] |
Table 2.
Chemical parameters used in the model.
| Module parameters | Value | Unit |
|---|---|---|
| Diffusion coefficient | Glucose:0.9 x 10⁻⁹ Oxygen: 3 x 10⁻⁹ |
m² s-1 |
| Boundary glucose concentration | 5 | mMol L-1 |
| Boundary oxygen concentration | 4.5 | mMol L-1 |
| Basic surface reaction rate | 2.5 x 10⁻⁶ 2.5 x 10⁻⁷ 2.5 x 10⁻⁸ ; |
(mol) s-1m-2 |
Table 3.
Physical parameters of the models.
| Parameter | Values | Unit | ||
|---|---|---|---|---|
| Thickness | T | 0.1 | mm | |
| Separation | S | 0.01,0.06,0.1 ,0.3, 0.9,1.23,1.9,3.9,7.9 | mm | |
| Cylinder | ||||
| Outer diameter | 6.18, 8.74,12.36,17.48 | mm | ||
| Area | A | 30, 60,120,240 | mm² | |
| Block without hole | ||||
| Width | W | 6 | mm | |
| Length | L | 1.5,3,6,10,15 | mm | |
| Area | A | 9,18,36,60,90 | mm2 | |
| Cylinder with hole | ||||
| Outer diameter | 8.74 | mm | ||
| Inner diameter (hole) | 1.994, 3.384, 4.37, 5.17 | mm | ||
| Area | A | 57, 51,45, 39, | mm² | |
| Blockwith hole | ||||
| Outer length | 10 | mm | ||
| Inner length (hole) | 3,6,7.5,7 | mm | ||
| Outer width | 6 | mm | ||
| Inner width (hole) | 1,1.5,2,3 | mm | ||
| Area | A | 57, 51,45, 39 | mm² | |
Table 4.
Parameters of final model.
| Module parameters | Value | Unit |
| Separation | 0.9 | mm |
| Thickness of generator unit | 0.1 | mm |
| Number of generation units | 8 | |
| Basic surface reaction rate | 2.5 | (mol) s-1m-2 |
| Pill shaped device | ||
| Length | 1.5-15 | mm |
| Width | 6 | mm |
| Area | 9-90 | mm² |
| Total Power (range) | ~9-57 | μW |
| Disc shaped device | ||
| Diameter | 6.18-17.48 | mm |
| Area | 30-240 | mm2 |
| Total Power range | ~28-116 | μW |
Disclaimer/Publisher’s Note: The statements, opinions and data contained in all publications are solely those of the individual author(s) and contributor(s) and not of MDPI and/or the editor(s). MDPI and/or the editor(s) disclaim responsibility for any injury to people or property resulting from any ideas, methods, instructions or products referred to in the content. |
© 2025 by the authors. Licensee MDPI, Basel, Switzerland. This article is an open access article distributed under the terms and conditions of the Creative Commons Attribution (CC BY) license (http://creativecommons.org/licenses/by/4.0/).
Copyright: This open access article is published under a Creative Commons CC BY 4.0 license, which permit the free download, distribution, and reuse, provided that the author and preprint are cited in any reuse.


