
Submitted:
01 September 2025
Posted:
03 September 2025
You are already at the latest version
Abstract
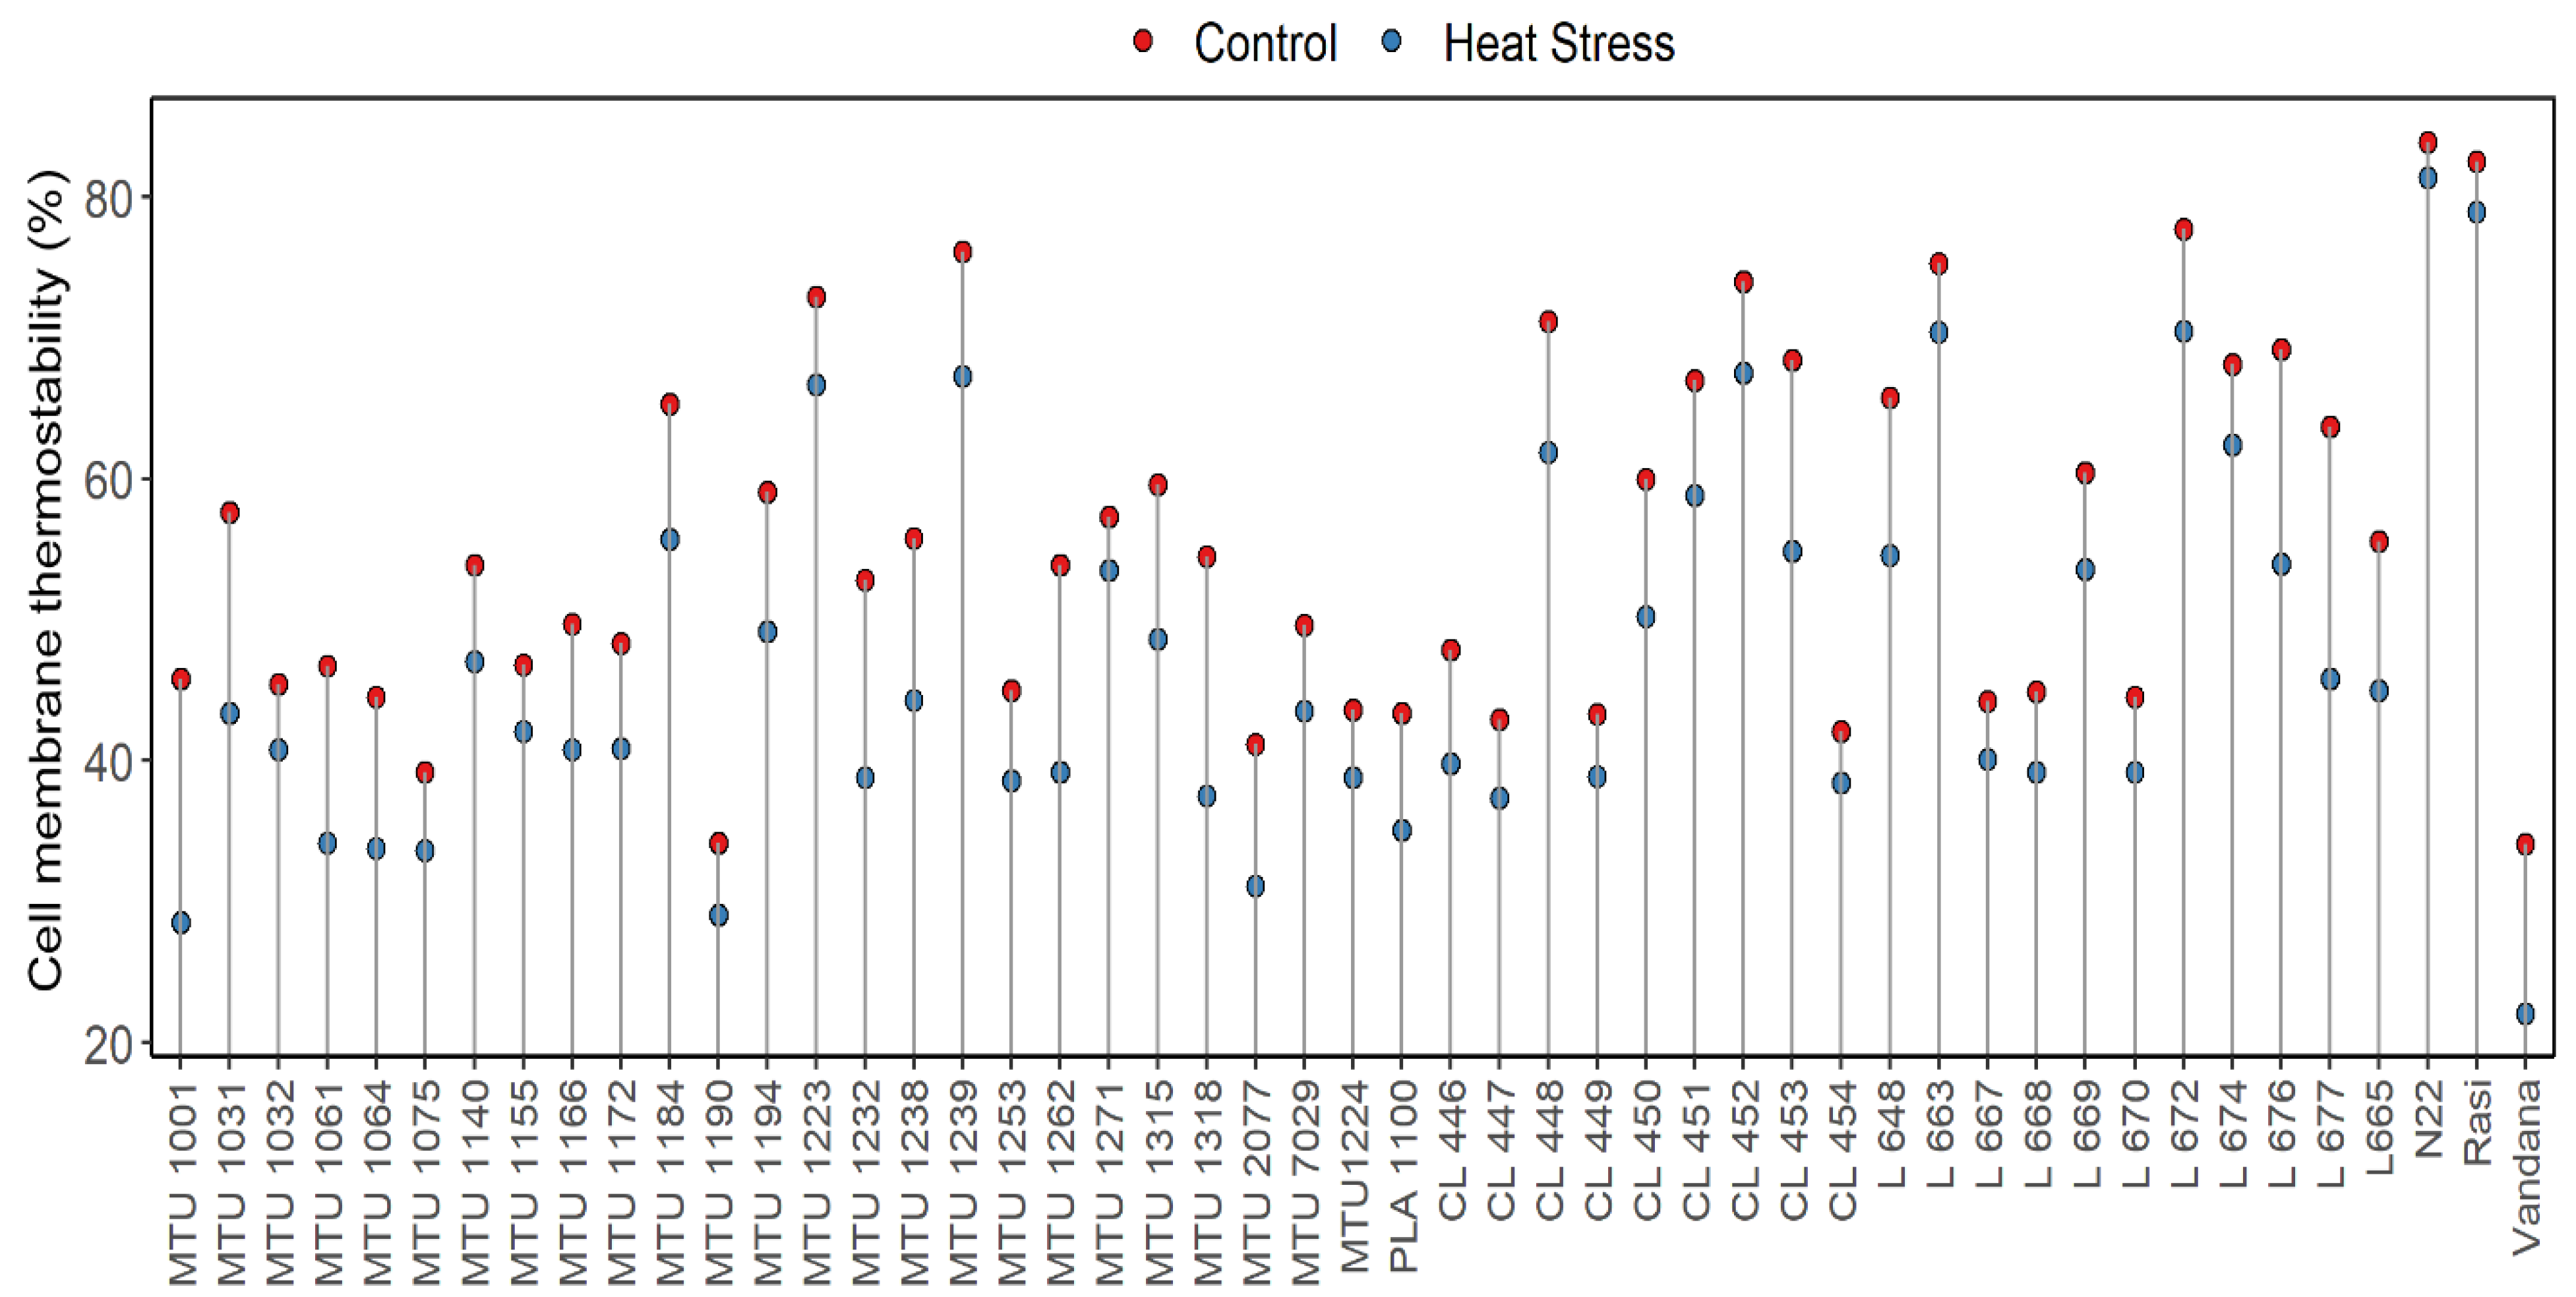
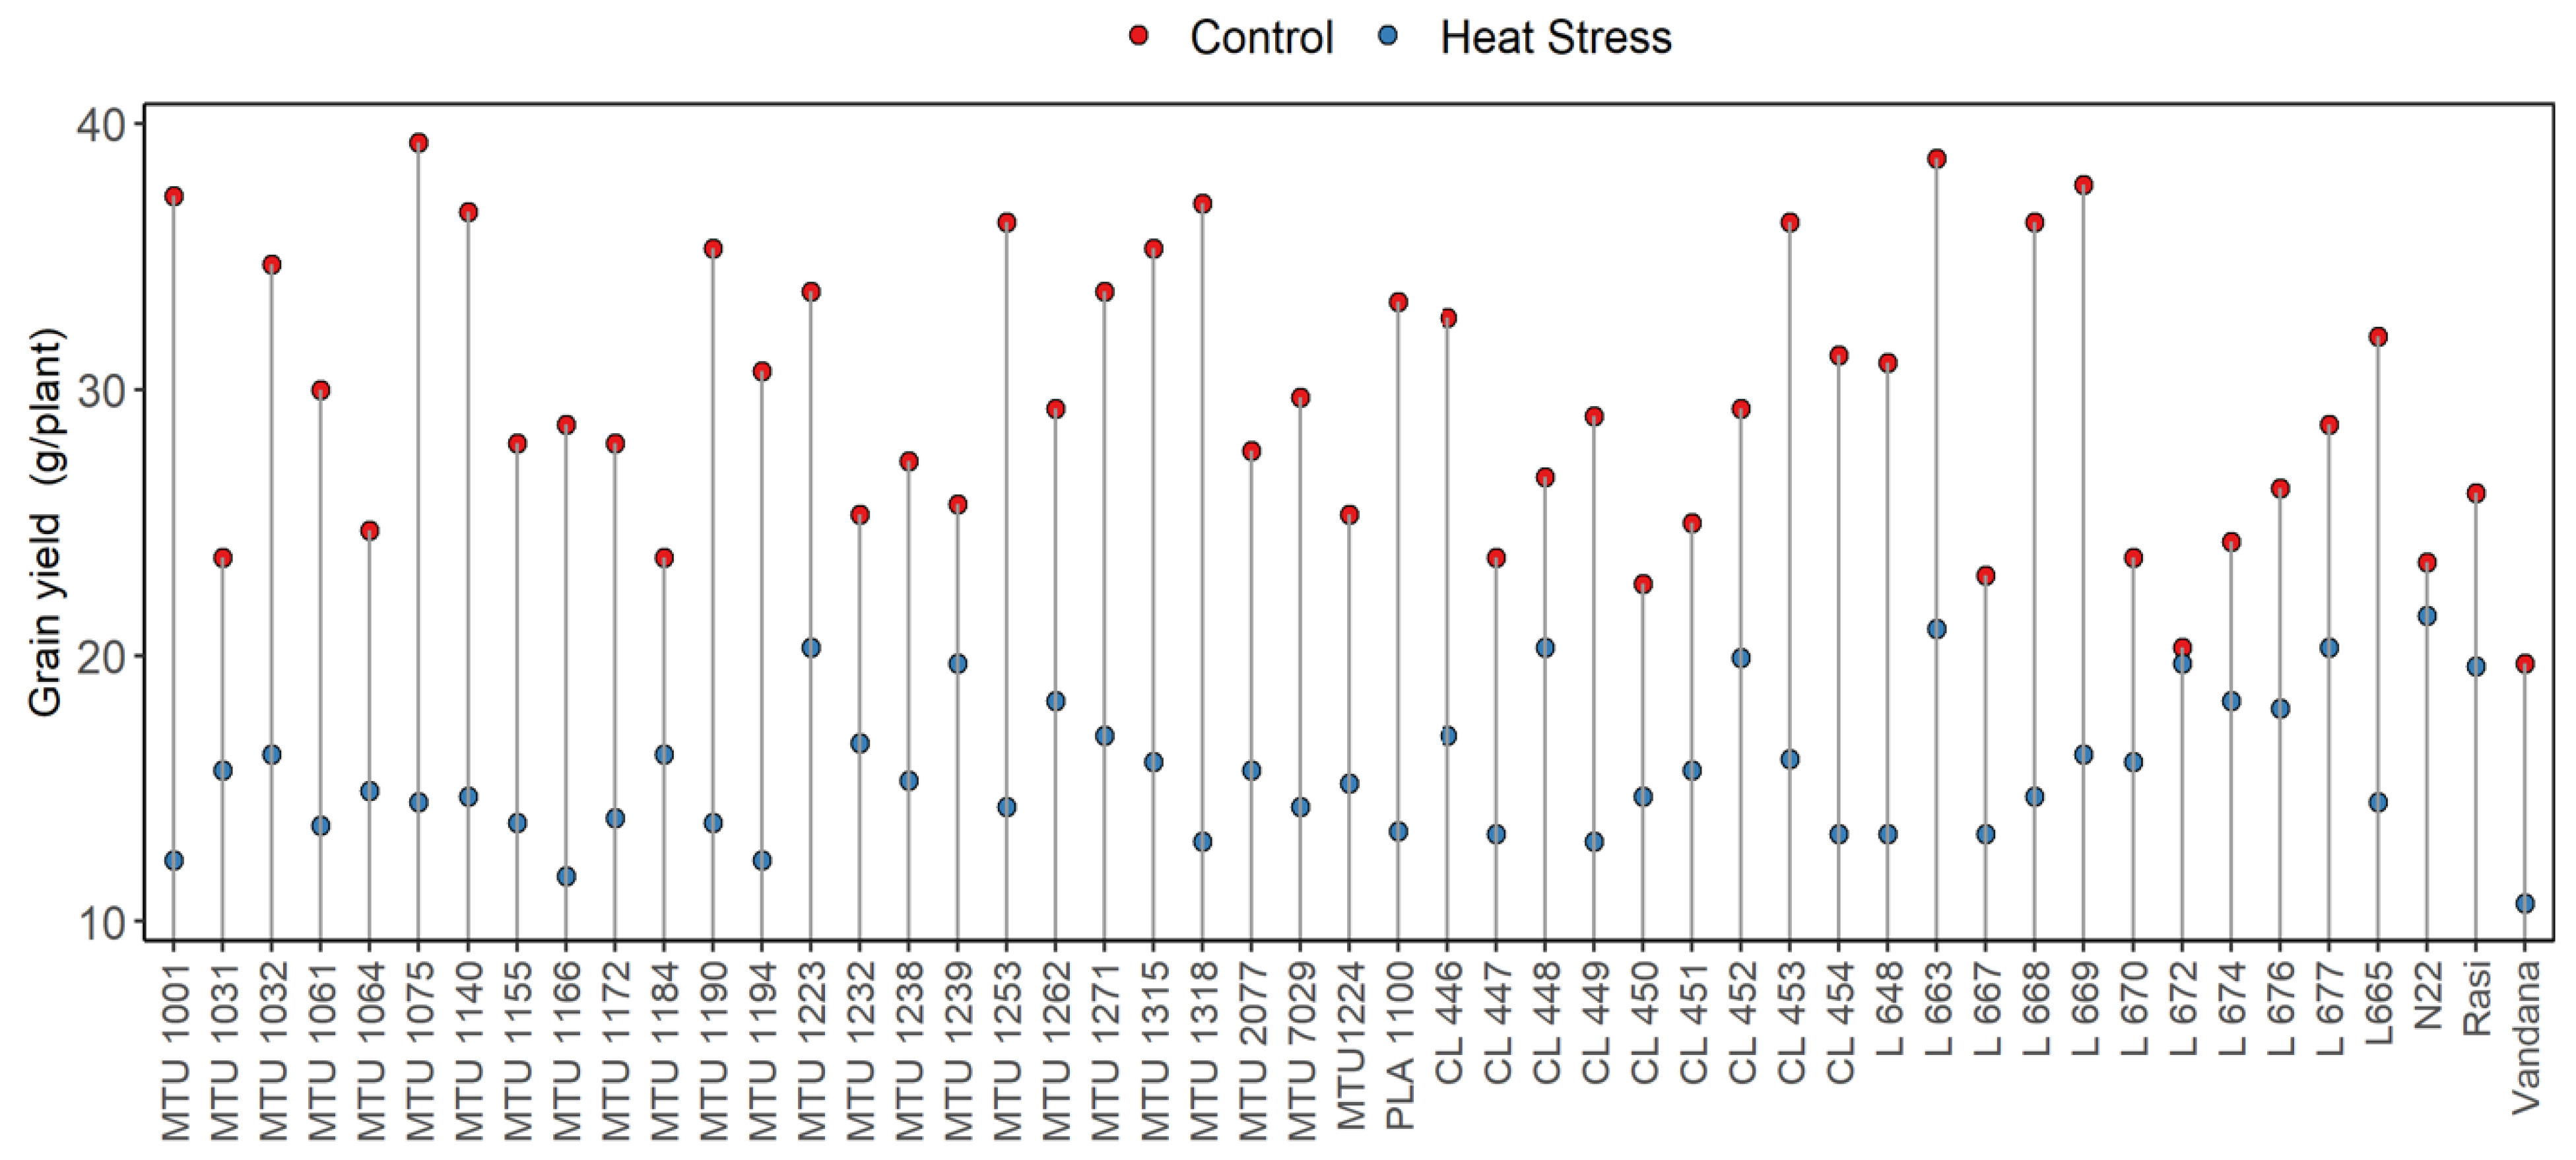
Rice (Oryza sativa L.), a global staple crop, is sensitive to elevated temperatures, particularly during reproductive and grain-filling stages. With climate change projections forecasting significant rises in mean temperature, sustaining rice productivity under heat stress has become a critical challenge. The present study evaluated forty-nine rice genotypes, comprising released varieties and advanced breeding lines, under control and heat-stress conditions. Phenological, morpho-physiological, and yield-related traits, were assessed to identify tolerant genotypes. Results revealed substantial variability among genotypes for chlorophyll content, membrane stability, spikelet fertility, and grain yield under stress. Heat-tolerant checks N22 and Rasi, along with genotypes L 663, L 672, MTU 1239, and CL 448, maintained higher chlorophyll levels, superior membrane integrity, and stable yields. In contrast, genotypes such as Vandana, MTU 1166, and MTU 1001 were highly susceptible, exhibiting severe reductions in chlorophyll content, spikelet fertility, and grain yield. Overall, traits such as minimal chlorophyll degradation, higher membrane thermostability, sustained spikelet fertility, and stable grain yield were strongly associated with heat tolerance. These findings highlight promising donor genotypes and key physiological traits that can be exploited in breeding programs to develop climate-resilient rice cultivars.
Keywords:
Introduction
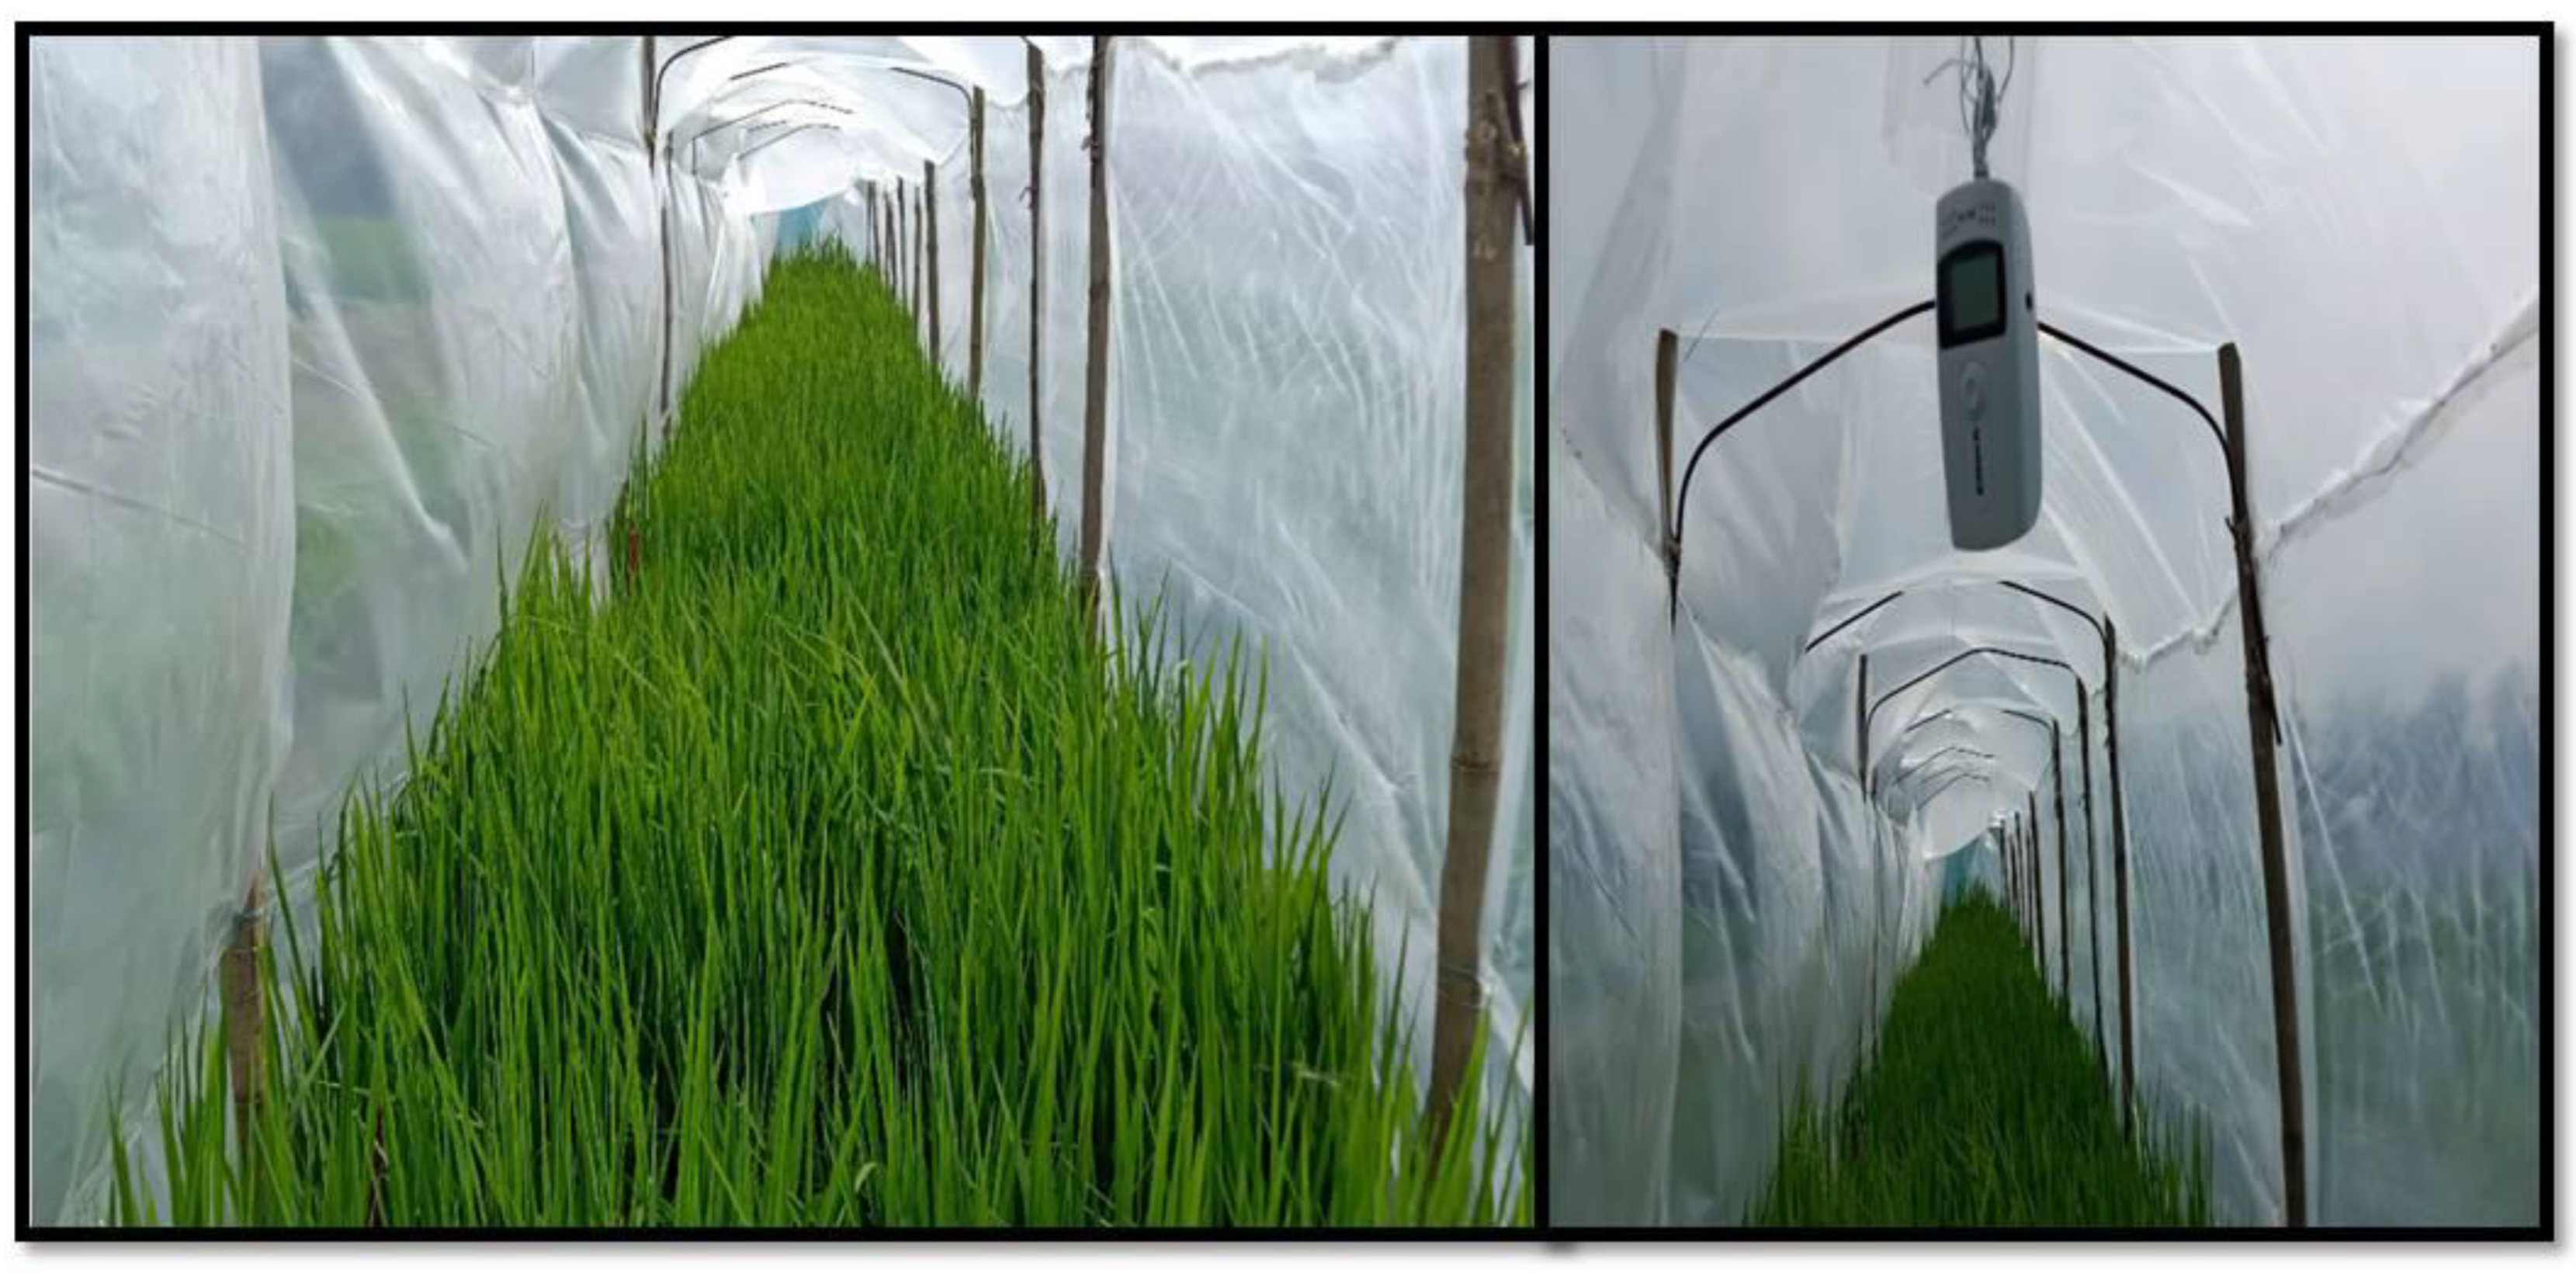
Materials and Methods
- Plant materials
- Chlorophyll estimation
- Cell membrane thermostability (CMS) analysis
- Spikelet fertility (%)
- Grain yield (g/plant)
- Data
- ata analysis
Results and Discussion
- Chlorophyll ‘a’ and Chlorophyll ‘b’
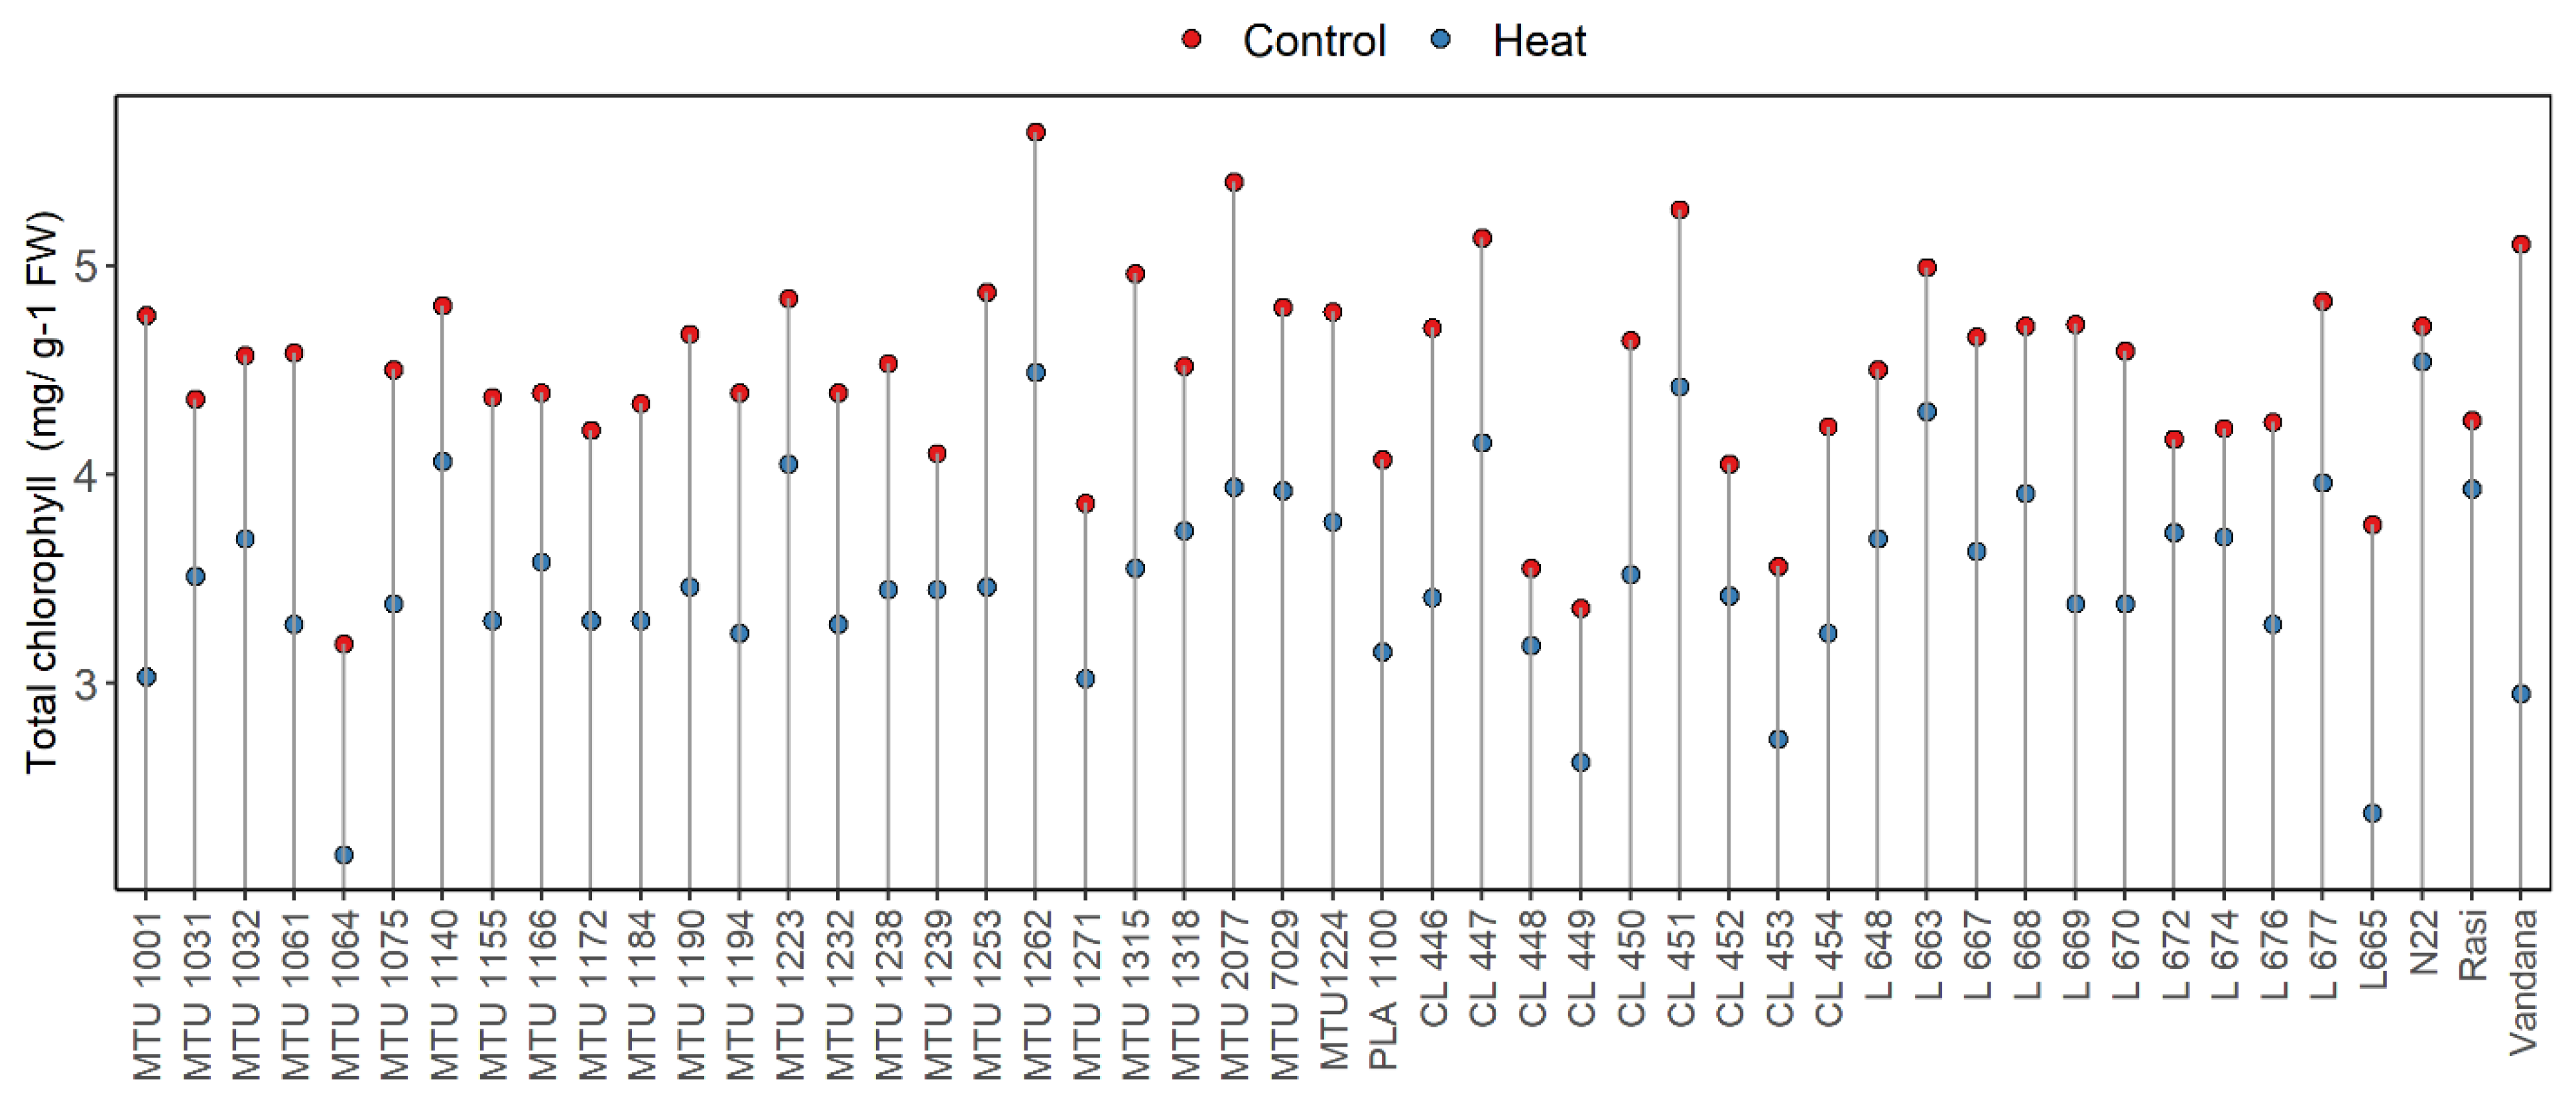
- Total Chlorophyll Content

| S. No. | Genotypes | Days to 50% flowering | Plant height (cm) | Ear bearing tillers number/plant | |||||||
|---|---|---|---|---|---|---|---|---|---|---|---|
| Control | Heat stress | Mean | Control | Heat stress | Mean | Control | Heat Stress | Mean | |||
| 1 | MTU 7029 | 107 | 107 | 107 | 124 | 121 | 123 | 16 | 12 | 14 | |
| 2 | MTU 2077 | 113 | 113 | 113 | 120 | 118 | 119 | 12 | 10 | 11 | |
| 3 | MTU 1061 | 122 | 121 | 121 | 123 | 128 | 125 | 11 | 10 | 11 | |
| 4 | MTU 1064 | 119 | 119 | 119 | 126 | 124 | 125 | 12 | 11 | 11 | |
| 5 | PLA 1100 | 121 | 120 | 121 | 133 | 122 | 128 | 11 | 9 | 10 | |
| 6 | MTU 1140 | 119 | 118 | 119 | 135 | 119 | 127 | 13 | 11 | 12 | |
| 7 | MTU 1172 | 119 | 119 | 119 | 128 | 130 | 129 | 12 | 10 | 11 | |
| 8 | MTU 1075 | 113 | 110 | 112 | 144 | 137 | 141 | 14 | 12 | 13 | |
| 9 | MTU 1223 | 127 | 120 | 124 | 139 | 132 | 136 | 13 | 10 | 12 | |
| 10 | MTU 1155 | 110 | 109 | 110 | 147 | 137 | 142 | 11 | 10 | 11 | |
| 11 | MTU1224 | 109 | 108 | 109 | 125 | 114 | 120 | 11 | 10 | 11 | |
| 12 | MTU 1031 | 127 | 121 | 124 | 123 | 108 | 116 | 12 | 10 | 11 | |
| 13 | MTU 1032 | 112 | 108 | 110 | 142 | 131 | 137 | 11 | 10 | 10 | |
| 14 | MTU 1190 | 108 | 107 | 108 | 145 | 139 | 142 | 13 | 11 | 12 | |
| 15 | MTU 1239 | 115 | 111 | 113 | 136 | 129 | 132 | 12 | 8 | 10 | |
| 16 | MTU 1262 | 129 | 127 | 128 | 132 | 121 | 126 | 13 | 10 | 11 | |
| 17 | MTU 1184 | 128 | 124 | 126 | 163 | 152 | 157 | 12 | 11 | 12 | |
| 18 | MTU 1194 | 122 | 121 | 122 | 137 | 138 | 138 | 11 | 10 | 10 | |
| 19 | MTU 1238 | 112 | 112 | 112 | 146 | 133 | 140 | 12 | 10 | 11 | |
| S. No. | Genotypes | Days to 50% flowering | Plant height (cm) |
Ear bearing tillers number/plant |
|||||||
| Control | Heat stress | Mean | Control | Heat stress | Mean | Control | Heat Stress | Mean | |||
| 20 | MTU 1253 | 115 | 113 | 114 | 147 | 138 | 142 | 13 | 11 | 12 | |
| 21 | MTU 1271 | 118 | 114 | 116 | 142 | 133 | 138 | 12 | 10 | 11 | |
| 22 | MTU 1315 | 121 | 118 | 120 | 139 | 132 | 135 | 12 | 9 | 11 | |
| 23 | MTU 1318 | 127 | 127 | 127 | 128 | 122 | 125 | 11 | 9 | 10 | |
| 24 | MTU 1166 | 129 | 127 | 128 | 151 | 144 | 148 | 12 | 11 | 12 | |
| 25 | MTU 1232 | 121 | 115 | 118 | 122 | 118 | 120 | 10 | 9 | 10 | |
| 26 | L648 | 129 | 127 | 128 | 142 | 135 | 139 | 10 | 9 | 10 | |
| 27 | L 663 | 112 | 112 | 112 | 149 | 152 | 150 | 12 | 11 | 12 | |
| 28 | L 665 | 118 | 116 | 117 | 140 | 138 | 139 | 13 | 11 | 12 | |
| 29 | L 667 | 124 | 120 | 122 | 152 | 143 | 148 | 14 | 10 | 12 | |
| 30 | L 668 | 124 | 122 | 123 | 151 | 145 | 148 | 12 | 11 | 12 | |
| 31 | L 669 | 122 | 121 | 122 | 151 | 144 | 148 | 13 | 10 | 12 | |
| 32 | L 670 | 120 | 120 | 120 | 145 | 143 | 144 | 12 | 10 | 11 | |
| 33 | L 672 | 121 | 120 | 121 | 146 | 140 | 143 | 10 | 9 | 10 | |
| 34 | L 674 | 117 | 116 | 117 | 149 | 142 | 146 | 10 | 9 | 10 | |
| 35 | L 676 | 112 | 111 | 112 | 143 | 131 | 137 | 10 | 9 | 10 | |
| 36 | L 677 | 112 | 111 | 112 | 140 | 126 | 133 | 12 | 10 | 11 | |
| 37 | CL 446 | 115 | 109 | 112 | 130 | 126 | 128 | 11 | 8 | 10 | |
| 38 | CL 447 | 110 | 108 | 109 | 150 | 132 | 141 | 10 | 10 | 10 | |
| S. No. | Genotypes | Days to 50% flowering | Plant height (cm) | Ear bearing tillers number/plant | |||||||
| Control | Heat stress | Mean | Control | Heat stress | Mean | Control | Heat Stress | Mean | |||
| 39 | CL 448 | 117 | 117 | 117 | 115 | 118 | 117 | 11 | 10 | 10 | |
| 40 | CL 449 | 114 | 112 | 113 | 154 | 144 | 149 | 11 | 10 | 11 | |
| 41 | CL 450 | 114 | 112 | 113 | 144 | 139 | 142 | 11 | 10 | 11 | |
| 42 | CL 451 | 122 | 121 | 122 | 130 | 121 | 126 | 12 | 10 | 11 | |
| 43 | CL 452 | 122 | 117 | 120 | 107 | 113 | 110 | 12 | 10 | 11 | |
| 44 | CL 453 | 117 | 115 | 116 | 134 | 121 | 127 | 16 | 11 | 14 | |
| 45 | CL 454 | 101 | 101 | 101 | 137 | 140 | 138 | 14 | 11 | 12 | |
| 46 | N22 | 87 | 87 | 87 | 115 | 114 | 115 | 10 | 7 | 9 | |
| 47 | Vandana | 89 | 86 | 89 | 106 | 100 | 103 | 18 | 11 | 14 | |
| 48 | Rasi | 92 | 90 | 86 | 100 | 103 | 101 | 21 | 16 | 18 | |
| 49 | MTU 1001 | 106 | 104 | 105 | 131 | 121 | 126 | 15 | 10 | 12 | |
| Mean | 116.0 | 114.0 | 135.9 | 129.7 | 12.0 | 10.0 | |||||
| Maximum | 129.0 | 127.0 | 163.0 | 152.0 | 21.0 | 16.0 | |||||
| Minimum | 87.0 | 86.0 | 100.0 | 100.0 | 10.0 | 7.0 | |||||
| CD (5%) | 2.065 | 1.381 | 3.169 | 1.172 | 1.143 | 0.844 | |||||
| CV % | 9.04 | 7.40 | 4.26 | 4.91 | 15.88 | 14.18 | |||||
- Cell Membrane Thermostability (CMS)
- Days to 50% Flowering
- Plant Height
- Ear-BearingTillers per Plant
- Spikelet Fertility (%)
| S. No. | Score | Genotypes |
|---|---|---|
| 1 | Tolerant (>65 % spikelet fertility, > 19 grams of grain yield, > 65 % MTS) | MTU 1223, MTU 1239, L 663, L 672, L 674, CL 448, CL 452, N22, Rasi. |
| 2 | Moderately tolerant (30-65 %spikelet fertility, 12-19 grams of grain yield, 30- 65 % MTS) | MTU 7029, MTU 2077, MTU 1061, MTU 1064, PLA 1100, MTU 1140, MTU 1172, MTU 1075, MTU 1155, MTU 1224, MTU 1031, MTU 1032, MTU 1190, MTU 1262, MTU 1184, MTU 1194, MTU 1238, MTU 1271, MTU 1315, MTU 1318, MTU 1232, L 648, L 665, L 667, L 668, L 669, L 670, L 676, L 677, CL 446, CL 447, CL 449, CL 450, CL 451, CL 453, CL 454 |
| 4 | Susceptible (<30 % spikelet fertility, <12 grams of grain yield, <30 % MTS) | MTU 1253, MTU 1166, Vandana, MTU 1001 |

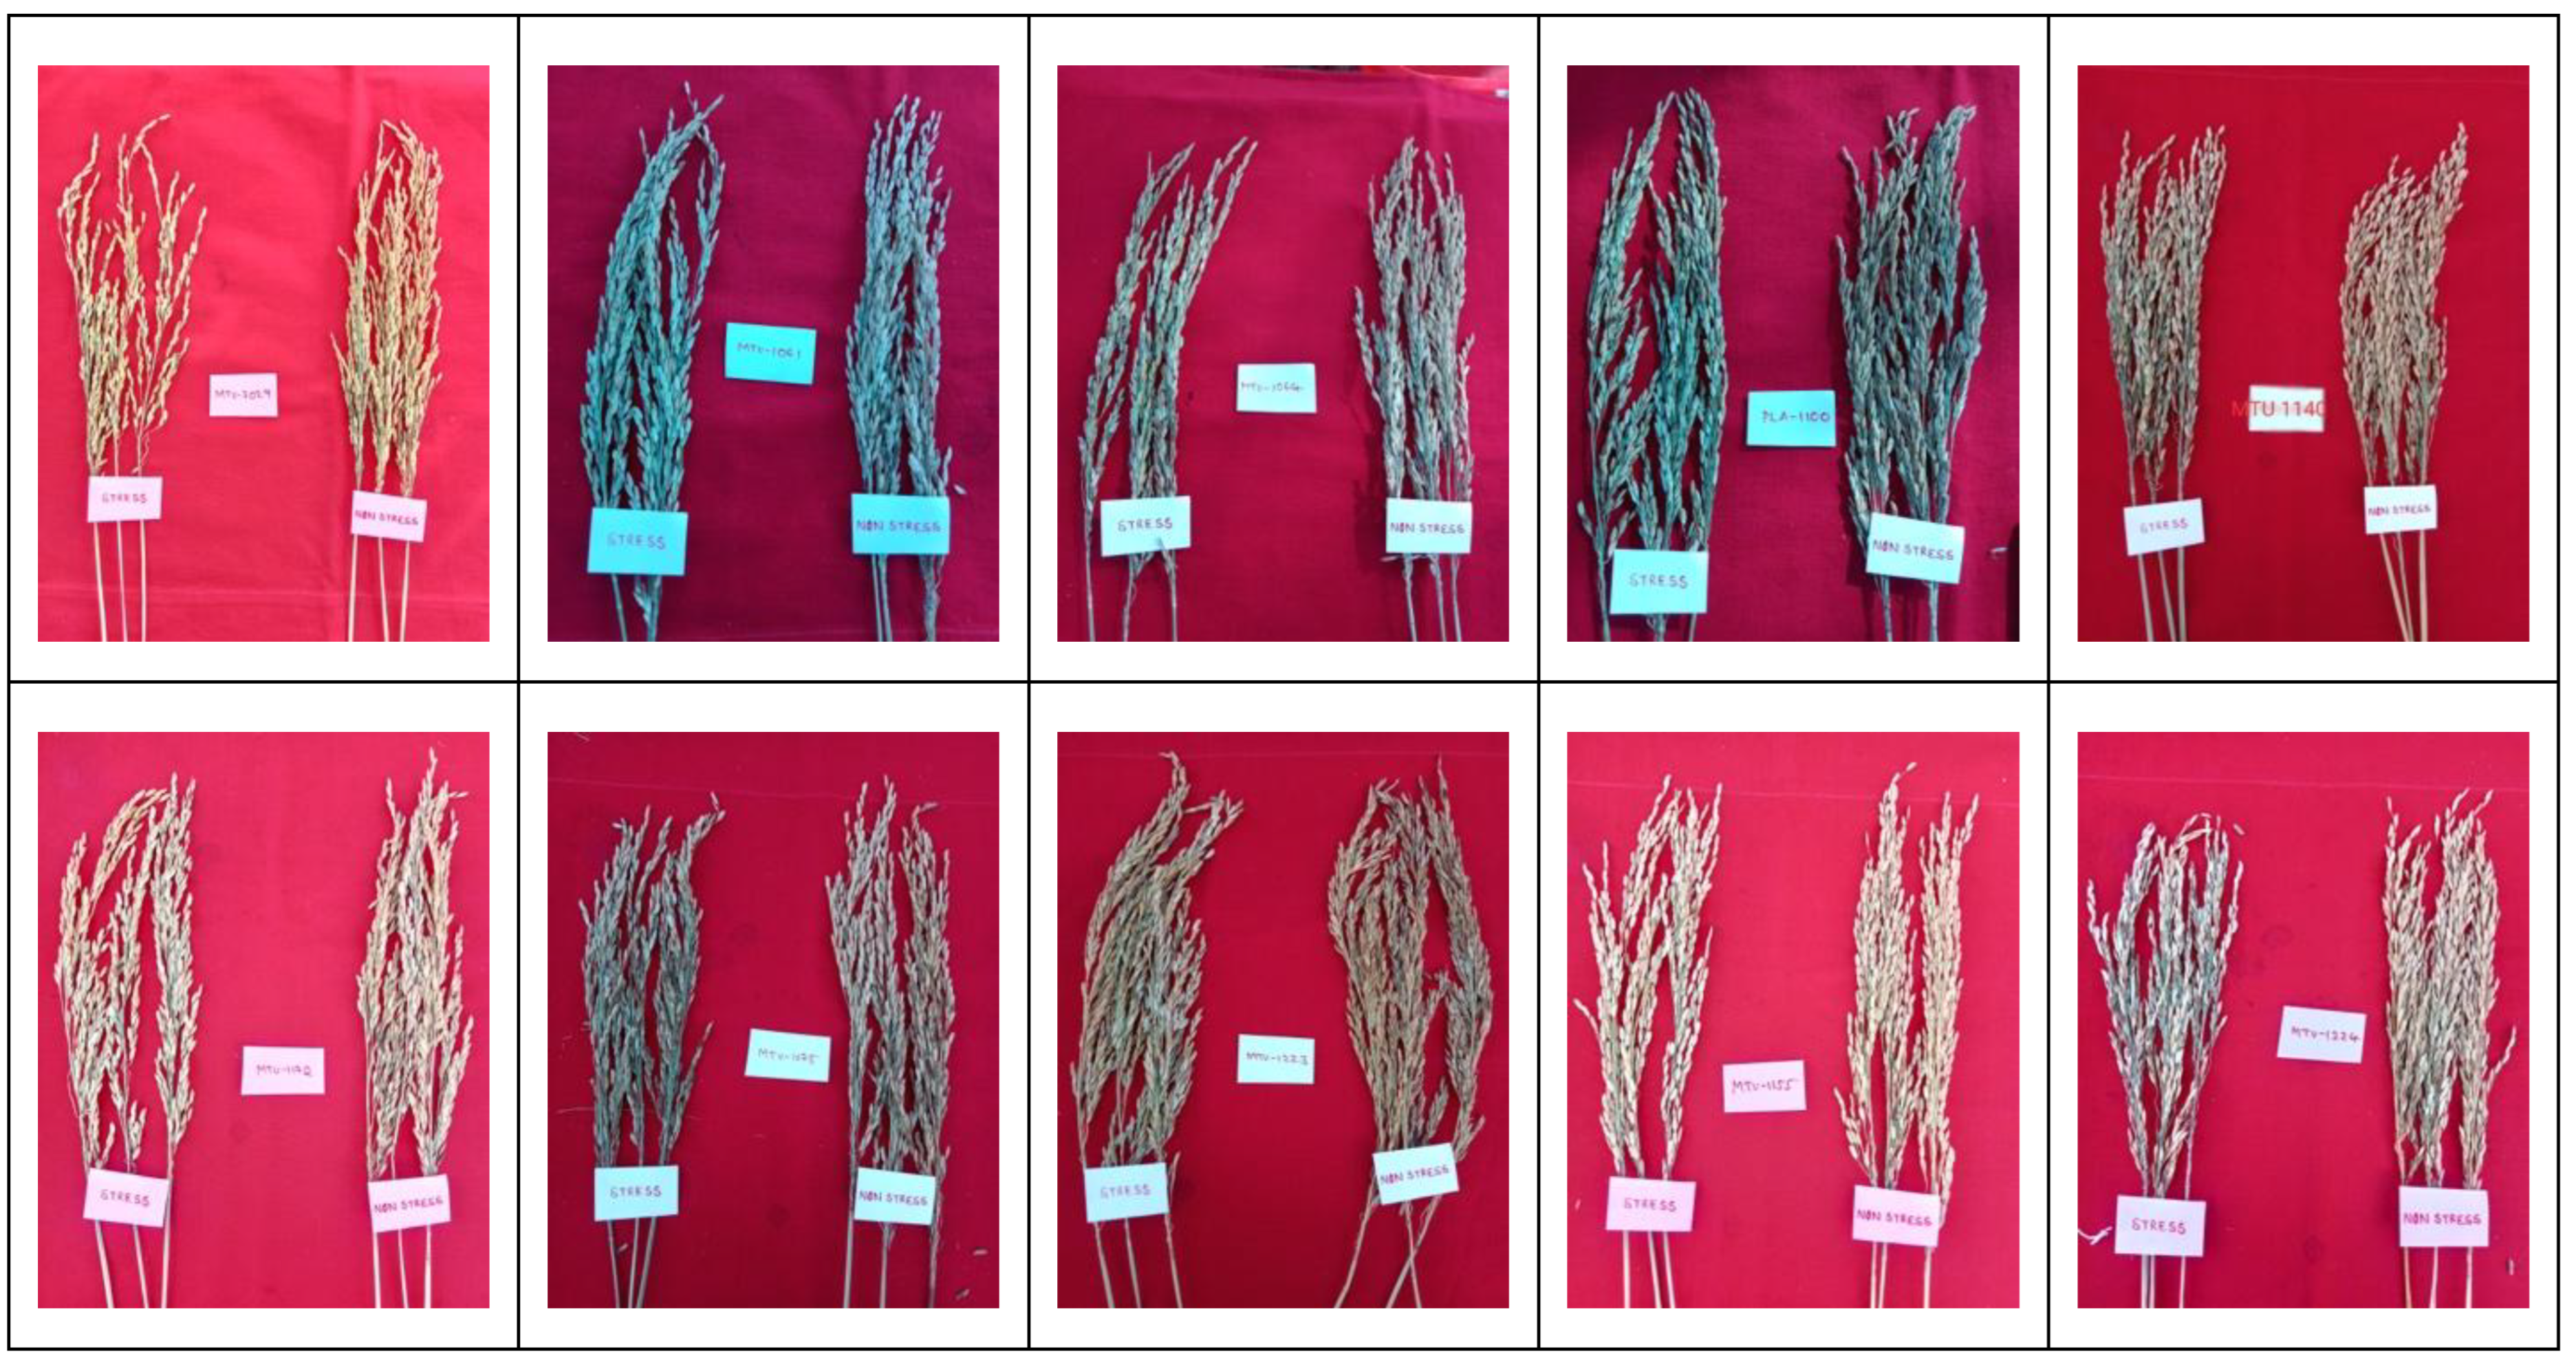
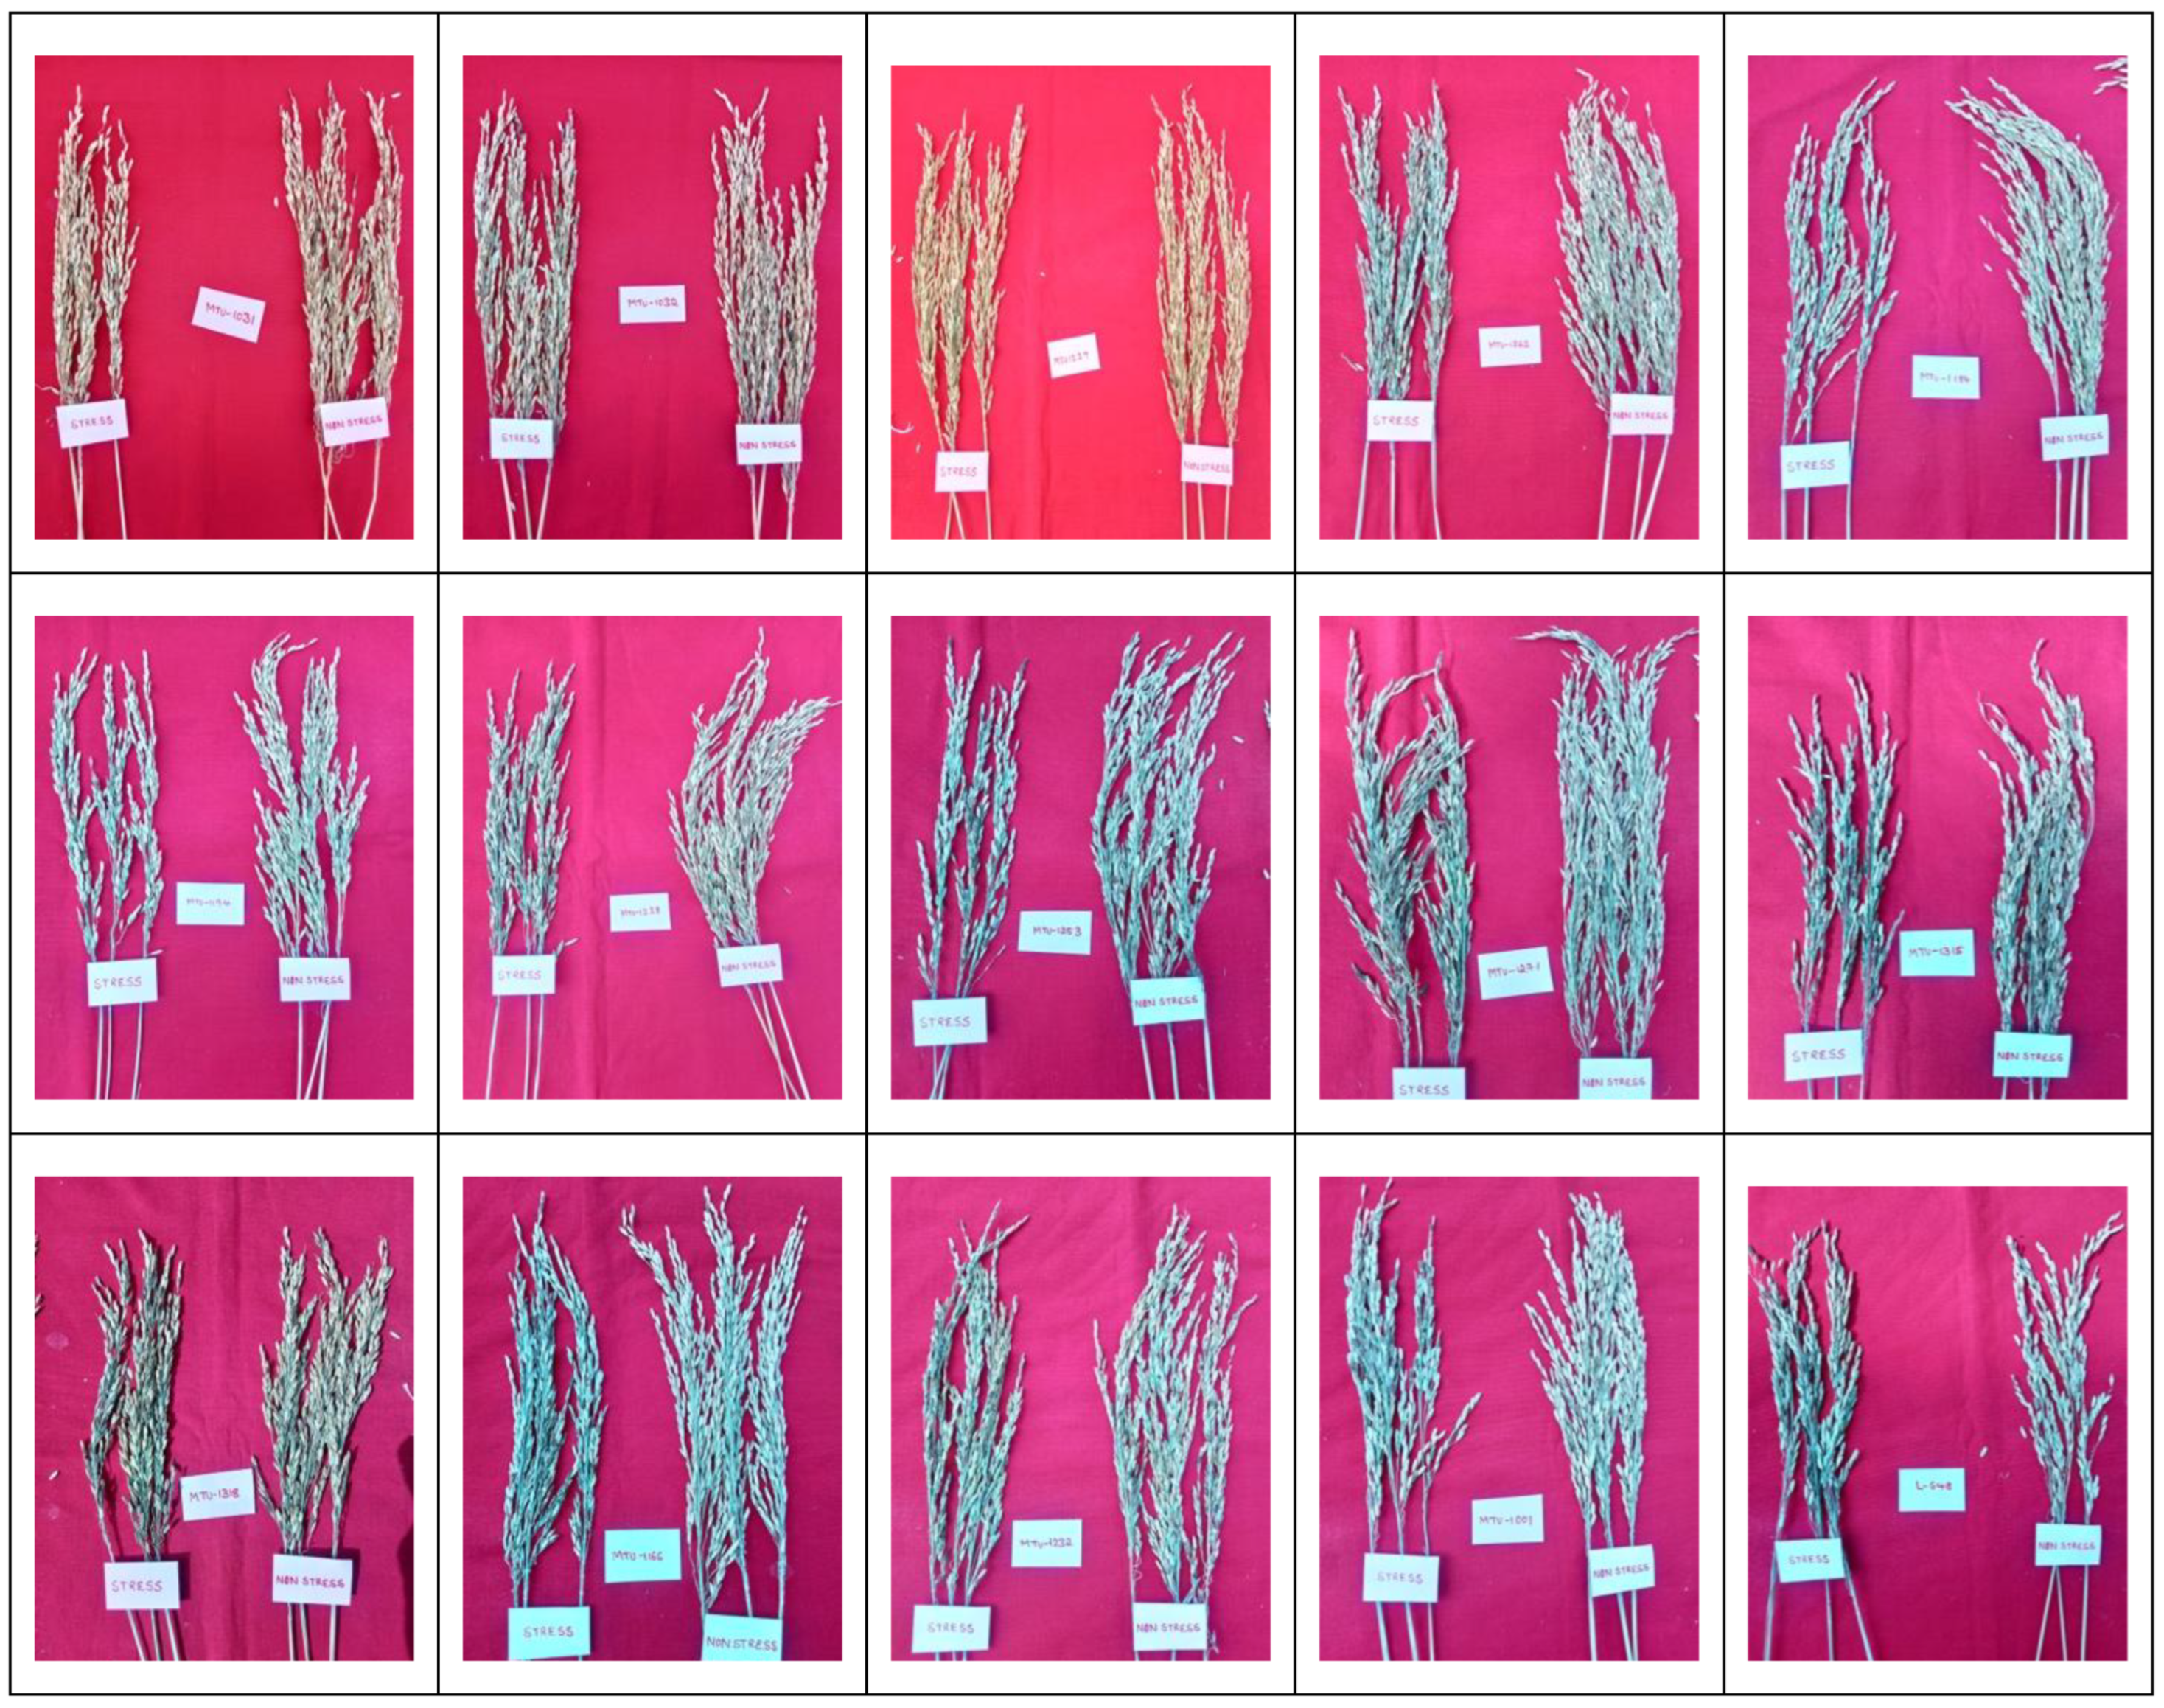
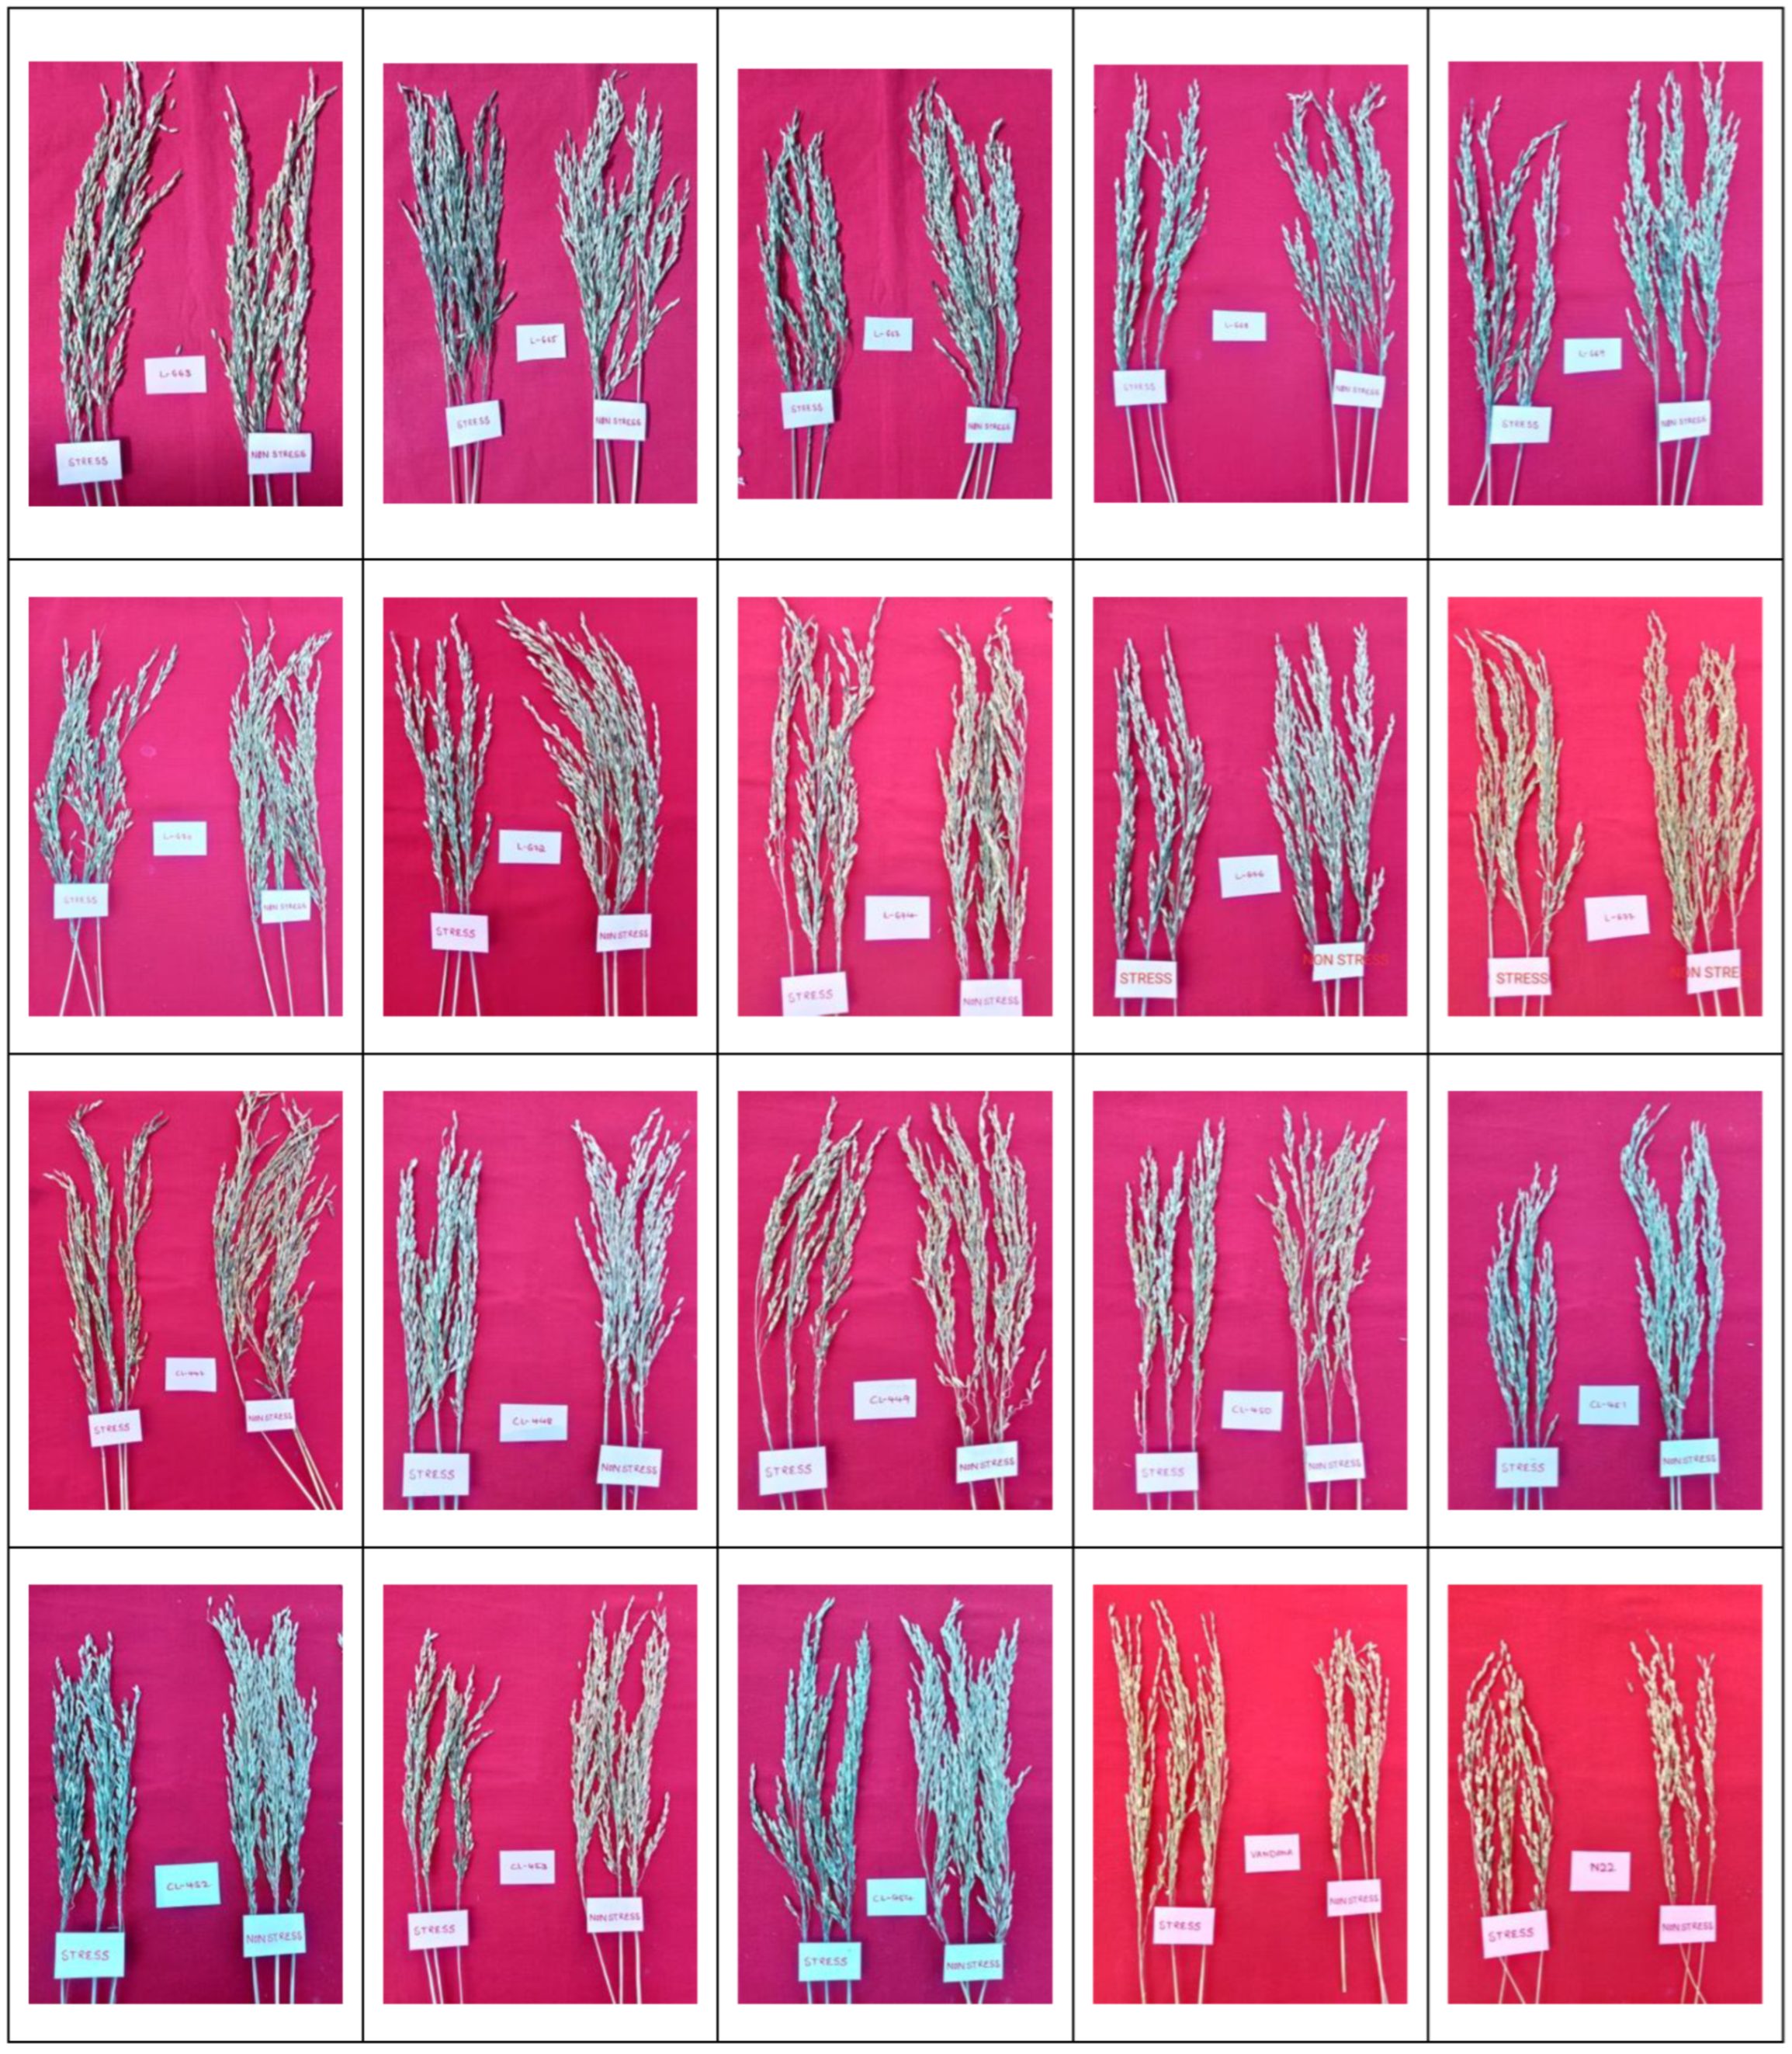
- Grain Yield(g/plant)
Conclusions
Supplementary Materials
References
- IPCC (2013) Climate change 2013: the physical science basis. Cambridge University Press, Cambridge; New York, NY.
- Ministry of Agriculture. Government of India. Agricultural census Statistics. 2019-2020. http://agcensus.nic.in/agriculturecensus.html.
- Allakhverdiev, S.I.; Kreslavski, V.D.; Klimov, V.V.; Los, D.A.; Carpentier, R.; Mohanty, P. Heat stress: an overview of molecular responses in photosynthesis. Photosynthesis research 2008, 98, 541–550. [Google Scholar] [CrossRef]
- Bahuguna, R.N.; Jha, J.; Pal, M.; Shah, D.; Lawas, L.M.; Khetarpal, S.; Jagadish, K.S. Physiological and biochemical characterization of NERICA-L-44: a novel source of heat tolerance at the vegetative and reproductive stages in rice. Physiologia Plantarum 2015, 154, 543–559. [Google Scholar] [CrossRef]
- Blum, A.; Ebercon, A. Cell membrane stability as a measure of drought and heat tolerance in wheat 1. Crop Science 1981, 21, 43–47. [Google Scholar] [CrossRef]
- Calatayud, A.; Barreno, E. Response to ozone in two lettuce varieties on chlorophyll a fluorescence, photosynthetic pigments and lipid peroxidation. Plant Physiology and Biochemistry 2004, 42, 549–555. [Google Scholar] [CrossRef] [PubMed]
- Cao YunYing, C.Y.; Duan Hua, D.H.; Yang LiNian, Y.L.; Wang ZhiQing, W.Z.; Zhou ShaoChuan, Z.S.; Yang JianChang, Y.J. (2008). Effect of heat-stress during meiosis on grain yield of rice cultivars differing in heat-tolerance and its physiological mechanism.
- Fageria, N. Yield physiology of rice. Journal of plant nutrition 2007, 30, 843–879. [Google Scholar] [CrossRef]
- Fahad, S.; Hussain, S.; Saud, S.; Hassan, S.; Ihsan, Z.; Shah, A.N.; Wu, C.; Yousaf, M.; Nasim, W.; Alharby, H. Exogenously applied plant growth regulators enhance the morpho-physiological growth and yield of rice under high temperature. Frontiers in Plant Science 2016, 7, 1250. [Google Scholar] [CrossRef]
- Fahad, S.; Hussain, S.; Saud, S.; Tanveer, M.; Bajwa, A.A.; Hassan, S.; Shah, A.N.; Ullah, A.; Wu, C.; Khan, F.A. A biochar application protects rice pollen from high-temperature stress. Plant Physiology and Biochemistry 2015, 96, 281–287. [Google Scholar] [CrossRef] [PubMed]
- Farooq, M.; Aziz, T.; Wahid, A.; Lee, D.-J.; Siddique, K.H. Chilling tolerance in maize: agronomic and physiological approaches. Crop and Pasture Science 2009, 60, 501–516. [Google Scholar] [CrossRef]
- Federer, W. Augmented designs,“Hawain Planters”. Record 1956, 55, 191–208. [Google Scholar]
- Fu, G.; Feng, B.; Zhang, C.; Yang, Y.; Yang, X.; Chen, T.; Zhao, X.; Zhang, X.; Jin, Q.; Tao, L. Heat stress is more damaging to superior spikelets than inferiors of rice (Oryza sativa L.) due to their different organ temperatures. Frontiers in Plant Science 2016, 7, 1637. [Google Scholar] [CrossRef]
- Haque, M.; Hasan, M.; Rajib, M. Identification of cultivable heat tolerant wheat genotypes suitable for Patuakhali district in Bangladesh. Journal of the Bangladesh Agricultural University 2009, 7. [Google Scholar] [CrossRef]
- Hemantaranjan, A.; Bhanu, A.N.; Singh, M.; Yadav, D.; Patel, P.; Singh, R.; Katiyar, D. Heat stress responses and thermotolerance. Adv. Plants Agric. Res 2014, 1, 1–10. [Google Scholar] [CrossRef]
- Hu, L.; Bi, A.; Hu, Z.; Amombo, E.; Li, H.; Fu, J. Antioxidant metabolism, photosystem II, and fatty acid composition of two tall fescue genotypes with different heat tolerance under high temperature stress. Frontiers in Plant Science 2018, 9, 1242. [Google Scholar] [CrossRef]
- Hurkman, W.J.; Vensel, W.H.; Tanaka, C.K.; Whitehand, L.; Altenbach, S.B. Effect of high temperature on albumin and globulin accumulation in the endosperm proteome of the developing wheat grain. Journal of Cereal Science 2009, 49, 12–23. [Google Scholar] [CrossRef]
- Kadam, N.N.; Xiao, G.; Melgar, R.J.; Bahuguna, R.N.; Quinones, C.; Tamilselvan, A.; Prasad, P.V.V.; Jagadish, K.S. Agronomic and physiological responses to high temperature, drought, and elevated CO2 interactions in cereals. Advances in Agronomy 2014, 127, 111–156. [Google Scholar]
- Lichtenthaler, H.K.; Wellburn, A.R. (1983). Determinations of total carotenoids and chlorophylls a and b of leaf extracts in different solvents. In: Portland Press Ltd.
- Liu, X.; Huang, B. Changes in fatty acid composition and saturation in leaves and roots of creeping bentgrass exposed to high soil temperature. Journal of the American Society for Horticultural Science 2004, 129, 795–801. [Google Scholar] [CrossRef]
- Ma QiLin, M.Q.; Li YangSheng, L.Y.; Tian XiaoHai, T.X.; Yan ShengZhi, Y.S.; Lei WeiCi, L.W.; Nakata, N. (2009). Influence of high temperature stress on composition and accumulation configuration of storage protein in rice.
- Makino, A. Photosynthesis, grain yield, and nitrogen utilization in rice and wheat. Plant Physiology 2011, 155, 125–129. [Google Scholar] [CrossRef]
- Matsui, T.; Omasa, K.; Horie, T. The difference in sterility due to high temperatures during the flowering period among japonica-rice varieties. Plant Production Science 2001, 4, 90–93. [Google Scholar] [CrossRef]
- Mohammed, A.R.; Tarpley, L. Differential response of two important Southern US rice ('Oryza sativa'L.) cultivars to high night temperature. Australian Journal of Crop Science 2014, 8, 191–199. [Google Scholar]
- Mthiyane, P.; Aycan, M.; Mitsui, T. Strategic advancements in rice cultivation: Combating heat stress through genetic innovation and sustainable practices—A review. Stresses 2024, 4, 452–480. [Google Scholar] [CrossRef]
- Narayanan, S.; Tamura, P.J.; Roth, M.R.; Prasad, P.V.; Welti, R. Wheat leaf lipids during heat stress: I. High day and night temperatures result in major lipid alterations. Plant, cell & environment 2016, 39, 787–803. [Google Scholar]
- Oh-e, I.; Saitoh, K.; Kuroda, T. Effects of high temperature on growth, yield and dry-matter production of rice grown in the paddy field. Plant Production Science 2007, 10, 412–422. [Google Scholar] [CrossRef]
- Paterson, A.H.; Freeling, M.; Sasaki, T. Grains of knowledge: genomics of model cereals. Genome research 2005, 15, 1643–1650. [Google Scholar] [CrossRef] [PubMed]
- Pearcy, R.W. Effect of growth temperature on the fatty acid composition of the leaf lipids in Atriplex lentiformis (Torr.) wats. Plant Physiology 1978, 61, 484–486. [Google Scholar] [CrossRef]
- Peng, S.; Huang, J.; Sheehy, J.E.; Laza, R.C.; Visperas, R.M.; Zhong, X.; Centeno, G.S.; Khush, G.S.; Cassman, K.G. Rice yields decline with higher night temperature from global warming. Proceedings of the National Academy of Sciences 2004, 101, 9971–9975. [Google Scholar] [CrossRef]
- Peraudeau, S.; Roques, S.; Quiñones, C.O.; Fabre, D.; Van Rie, J.; Ouwerkerk, P.B.; Jagadish, K.S.; Dingkuhn, M.; Lafarge, T. Increase in night temperature in rice enhances respiration rate without significant impact on biomass accumulation. Field Crops Research 2015, 171, 67–78. [Google Scholar] [CrossRef]
- Poli, Y.; Basava, R.K.; Panigrahy, M.; Vinukonda, V.P.; Dokula, N.R.; Voleti, S.R.; Desiraju, S.; Neelamraju, S. Characterization of a Nagina22 rice mutant for heat tolerance and mapping of yield traits. Rice 2013, 6, 36. [Google Scholar] [CrossRef]
- Porra, R.J.; Thompson, W.A.; Kriedemann, P.E. Determination of accurate extinction coefficients and simultaneous equations for assaying chlorophylls a and b extracted with four different solvents: verification of the concentration of chlorophyll standards by atomic absorption spectroscopy. Biochimica et Biophysica Acta (BBA)-Bioenergetics 1989, 975, 384–394. [Google Scholar] [CrossRef]
- Prasad, P.; Boote, K.; Allen Jr, L.; Sheehy, J.; Thomas, J. Species, ecotype and cultivar differences in spikelet fertility and harvest index of rice in response to high temperature stress. Field Crops Research 2006, 95, 398–411. [Google Scholar] [CrossRef]
- Sailaja, B.; Subrahmanyam, D.; Neelamraju, S.; Vishnukiran, T.; Rao, Y.V.; Vijayalakshmi, P.; Voleti, S.R.; Bhadana, V.P.; Mangrauthia, S.K. Integrated physiological, biochemical, and molecular analysis identifies important traits and mechanisms associated with differential response of rice genotypes to elevated temperature. Frontiers in Plant Science 2015, 6, 1044. [Google Scholar] [CrossRef]
- Samol, P.; Umponstira, C.; Klomjek, P.; Thongsanit, P. Responses of rice yield and grain quality to high temperature in open-top chamber to predict impact of future global warming in Thailand. Australian Journal of Crop Science 2015, 9, 886–894. [Google Scholar]
- Seelam, R.T.; Puram, V.R.R.; Nallamothu, V.; Injeti, S.K.; Madhunapantula, V.P. (2024). Unlocking the potential of rice for thermotolerance using simple sequence repeat (SSR) marker-based assessment of genetic variability and population structure. Genetic Resources and Crop Evolution. [CrossRef]
- Shalini, P.; Tulsi, T. Production potential and nutrient use efficiency of basmati rice (Oryza sativa L.) under integrated nutrient management. Green Farming 2008, 1, 11–13. [Google Scholar]
- Sharkey, T.D. Effects of moderate heat stress on photosynthesis: importance of thylakoid reactions, rubisco deactivation, reactive oxygen species, and thermotolerance provided by isoprene. Plant, cell & environment 2005, 28, 269–277. [Google Scholar]
- Shimono, H.; Okada, M.; Yamakawa, Y.; Nakamura, H.; Kobayashi, K.; Hasegawa, T. Genotypic variation in rice yield enhancement by elevated CO2 relates to growth before heading, and not to maturity group. Journal of Experimental Botany 2009, 60, 523–532. [Google Scholar] [CrossRef] [PubMed]
- Su, Q.; Rohila, J.S.; Ranganathan, S.; Karthikeyan, R. Rice yield and quality in response to daytime and nighttime temperature increase–a meta-analysis perspective. Science of The Total Environment 2023, 898, 165256. [Google Scholar] [CrossRef] [PubMed]
- Sun, A.-Z.; Guo, F.-Q. Chloroplast retrograde regulation of heat stress responses in plants. Frontiers in Plant Science 2016, 7, 398. [Google Scholar] [CrossRef] [PubMed]
- Thussagunpanit, J.; Jutamanee, K.; Kaveeta, L.; Chai-arree, W.; Pankean, P.; Homvisasevongsa, S.; Suksamrarn, A. Comparative effects of brassinosteroid and brassinosteroid mimic on improving photosynthesis, lipid peroxidation, and rice seed set under heat stress. Journal of Plant Growth Regulation 2015, 34, 320–331. [Google Scholar] [CrossRef]
- Van Nguyen, N.; Ferrero, A. Meeting the challenges of global rice production. Paddy and Water Environment 2006, 4, 1–9. [Google Scholar] [CrossRef]
- Vishnu Prasanth, V.; Suchandranath Babu, M.; Vgn, T.V.; Vishnu Kiran, T.; Swamy, K.; Ravindra Babu, V.; Mangrauthia, S.K.; Subrahmanyam, D.; Voleti, S.; Sarla, N. Response of popular rice varieties to late sown high temperature conditions in field. Indian Journal of Plant Physiology 2017, 22, 156–163. [Google Scholar] [CrossRef]
- Wang, Q.-L.; Chen, J.-H.; He, N.-Y.; Guo, F.-Q. Metabolic reprogramming in chloroplasts under heat stress in plants. International Journal of Molecular Sciences 2018, 19, 849. [Google Scholar] [CrossRef]
- Wu, C.; Cui, K.; Fahad, S. Heat stress decreases rice grain weight: Evidence and physiological mechanisms of heat effects prior to flowering. International Journal of Molecular Sciences 2022, 23, 10922. [Google Scholar] [CrossRef]
- Zafar, S.A.; Hameed, A.; Khan, A.S.; Ashraf, M. Heat shock induced morpho-physiological response in indica rice (Oryza sativa L.) at early seedling stage. Pak. J. Bot 2017, 49, 453–463. [Google Scholar]
- Zhou, R.; Wu, Z.; Wang, X.; Rosenqvist, E.; Wang, Y.; Zhao, T.; Ottosen, C.-O. Evaluation of temperature stress tolerance in cultivated and wild tomatoes using photosynthesis and chlorophyll fluorescence. Horticulture, Environment, and Biotechnology 2018, 59, 499–509. [Google Scholar] [CrossRef]
- Zhu, X.-C.; Song, F.-B.; Liu, S.-Q.; Liu, T.-D. Effects of arbuscular mycorrhizal fungus on photosynthesis and water status of maize under high temperature stress. Plant and Soil 2011, 346, 189–199. [Google Scholar] [CrossRef]
Disclaimer/Publisher’s Note: The statements, opinions and data contained in all publications are solely those of the individual author(s) and contributor(s) and not of MDPI and/or the editor(s). MDPI and/or the editor(s) disclaim responsibility for any injury to people or property resulting from any ideas, methods, instructions or products referred to in the content. |
© 2025 by the authors. Licensee MDPI, Basel, Switzerland. This article is an open access article distributed under the terms and conditions of the Creative Commons Attribution (CC BY) license (https://creativecommons.org/licenses/by/4.0/).


