
Submitted:
02 September 2025
Posted:
03 September 2025
You are already at the latest version
Abstract
This study evaluated the suitability of three floodplain environments near Iquitos for cowpea cultivar recommendation. It also estimated the adaptability and phenotypic stability of 12 cowpea lines evaluated in 2004 and compared the climatic conditions between 2004 and the period of 2020–2024. Field trials were conducted using a randomized complete block design with 12 treatments and two replications. Five traits were assessed: grain yield, number of pods per plant, days to flowering, days to physiological maturity, and days to harvest. Combined ANOVA revealed significant environmental effects for all traits. Analyses using Duncan’s means test, GGE biplot, and AMMI indicated that the three sites are contrasting. The Annicchiarico index, GGE biplot, and AMMI analyses identified line CAR 3010 as having superior adaptability and stability. Paired t-tests showed that the conditions in 2020-2024 were warmer and drier than those in 2004. Therefore, Muyuy, Rafael Belaunde, and San Miguel are suitable locations for testing new cowpea lines, and CAR 3010 line is recommended for inclusion in cowpea breeding programs in the Peruvian Amazon in response to ongoing climate change.
Keywords:
GxE interaction
; yield stability
; Annicchiarico index
; GGE biplot
; AMMI
; tropical agriculture
; multi-environmental trials
1. Introduction
Cowpea (Vigna unguiculata (L.) Walp.) is a legume of significant socioeconomic and nutritional value in semi-arid tropical regions of Africa, Asia, Latin America and southern Europe, owing to its low production costs, drought tolerance, adaptability to low-fertility soils, and high protein content [1,2]. The crop is particularly important in areas where water availability limits the production of other staple crops, as it provides a crucial source of dietary protein and income for smallholder farmers [3]. Its ability to perform under diverse climatic conditions makes cowpea a valuable component of food-security strategies in resource-constrained environments.
Dry cowpea grains, with a moisture content of 12.7%, provide approximately 20.2% protein, 61.2% carbohydrates, 2.9% lipids, 23.6% fiber, and 3.5% ash. They are particularly rich in potassium, phosphorus, magnesium, and vitamins B1, B2, and B6 [4]. This nutritional composition supports the inclusion of cowpea in balanced diets, especially in contexts where alternative protein sources are limited.
Globally, Nigeria, Niger, Burkina Faso, Brazil, Ghana, and Mali are the leading producers, while the highest grain yield was reported in Qatar (13.2 t ha⁻¹) and Egypt (3.8 t ha⁻¹) (FAOSTAT, 2025). In contrast, the average yield in Peru is only 1.4 t ha⁻¹ [5]. In 2020, national legume production reached 270,000 tons on 202,000 hectares, with the Loreto region contributing 4,932 tons [6]. Despite these outputs, domestic supply remains insufficient to meet the rising demand: per-capita legume consumption increased from 2.2 kg in 2009 to 8.2 kg in 2024, and imports exceeded 147,000 t (≈USD 92 million) [6].
Cowpea cultivation in the Peruvian Amazon typically occurs on floodplains (locally known as " restingas") during the low-water season (May–October). However, productivity is constrained by several factors, including climate variability, genotype-by-environment interactions (GxE), and the limited availability of improved varieties adapted to local conditions. Because GxE significantly affects crop performance, multi-environment testing is required to identify stable, high-yielding genotypes [7].
Several studies have evaluated the adaptability and stability of grain yield in cowpea, with the aim of recommending new cultivars. These studies have primarily been conducted in Zimbabwe [8], Ethiopia [9-11], Uganda [12,13], Ghana [14], Nigeria [15], Colombia [16], and Brazil [3,17-24], mostly in semi-arid or tropical environments. However, there is a significant research gap on cowpea adaptability and yield stability in the unique floodplain ecosystems of the Peruvian Amazon, which present distinct environmental challenges, including periodic flooding and highly variable soil compositions. Various methods have been successfully employed to evaluate adaptability and stability in cowpea, such as the GGE biplot, AMMI, Eberhart and Russell, Lin and Binns, Annicchiarico, and REML/BLUP approaches. These investigations highlight the importance of characterizing genotype-by-environment interactions to enhance cowpea productivity and strengthen food security in diverse agroecological zones [10,19]. Consequently, multi-environment trials are essential for quantifying G×E and for recommending cultivars tailored to specific target regions [7].
One of the main efforts to breed cowpeas in the Peruvian Amazon was carried out by the Instituto Nacional de Innovación Agraria (INIA)/EEA San Roque Experimental Station (Iquitos, Loreto). In 2000, several lines originating from INIA/EEA Vista Florida Experimental Station (Chiclayo, Lambayeque) were introduced in the Amazon. These lines were evaluated in floodplain areas near Iquitos for several years, leading to the selection of 10 promising lines. In 2004, an adaptability and stability trial was conducted with these 10 lines and two checks in three floodplain environments near Iquitos (Muyuy, Rafael Belaunde, and San Miguel). However, the data were not analyzed at the time due to financial constraints within the breeding program.
With the program now reinitiated, it is critical to leverage the 2004 experiments to identify superior parents and define appropriate breeding methods. Consequently, the objectives of this study were to: (i) determine whether the three locations constitute contrasting test environments; (ii) analyze the adaptability and stability of the twelve lines evaluated in 2004; and (iii) assess whether these findings remain valid under current production conditions. This work will guide future cowpea improvement and support food security in the Peruvian Amazon amid a changing climate and rising demand.
2. Materials and Methods
The experiments were conducted during the 2004 growing season in three locations in the San Juan Bautista district, Maynas Province, Loreto region, Peru: Muyuy, San Miguel, and San Rafael, located between 6 and 12 km from Iquitos (Figure 1). Climate data were obtained from the SENAMHI/San Roque weather station (Table 1).
To characterize the edaphic environments, twenty soil cores (0–30 cm depth) were collected and combined to form a single composite sample per environment. Analyses were performed at the INIA-EEA Pucallpa Soil Laboratory (Ucayali, Peru) to determine the following properties: texture (hydrometer method), pH (1:2.5 in water), available phosphorus (modified Olsen method), available potassium (NaHCO₃-EDTA-SUPERFLOC extraction), exchangeable cations (K, Ca, Mg extracted with 1N KCl), cation exchange capacity (sum of bases plus total acidity, SMP buffer), and organic carbon (Walkley-Black modified method, according to Nelson and Sommers [25]). The results are shown in Table 2.
Ten early-maturing lines (CAR series, black-eye type) and two controls (cv. CAU 9 (TM) and cv. Vaina Blanca (TL)) were evaluated (Table 3). All materials were obtained from INIA-EEA Vista Florida, Chiclayo, Peru (6°43'38.2''S, 79°46'52.1'' W) except cv. CAU 9 (TM), which is a local cultivar. The CAR series consists of lines developed through breeding for improved performance in tropical environments.
The experiments were conducted using a randomized complete block design (RCBD) with two replications and twelve treatments (lines). Each plot consisted of eight rows, each 9.6 m long, with 0.70 m between rows and 0.30 m between plants. Sowing was carried out at all three locations between 25 and 30 May 2004, with three seeds placed per hill at a depth of 3 cm.
Before sowing, seeds were treated with Rhyzolex (tolclofos-methyl 75 WP) at 4 g/kg and Orthene (acephate 75 WP) at 5 g/kg to prevent soil-borne pathogens. Additionally, chlorpyrifos 5% (20 mL per 15 L water plus Pegasol® adjuvant) was applied at 10, 20, and 30 days after sowing as a preventive measure against insect pests.
Five agro-morphological traits were evaluated:
-Yield grain (GY): assessed in balance after harvest.
-Number of pods per plant (NPP): counted on ten randomly selected plants per plot at harvest
-Days to flowering (DF): days from sowing to the point when 50% of plants had at least one open flower.
-Days to physiological maturity (DPM): days from sowing until 50% of pods changed color from green to light green.
-Days to harvest (DH): days from sowing until 95% of pods were fully dry.
Analyses of variance (ANOVA) were performed separately for each environment. The homogeneity of the variances in the three experiments was then assessed according to the criterion proposed by Pimentel-Gomes [26], which states that the ratio of the maximum to the minimum error mean square should be less than seven. Based on this assessment, a combined ANOVA was conducted to evaluate the effects of the interaction between the environment, genotype, and genotype × environment (G×E).
Mean comparisons were carried out using Duncan’s multiple range test at a significance level of p < 0.05. Subsequently, the environmental indices (Ij) and the genotypic confidence indices (Wi) were estimated according to the method of Annicchiarico [27].
The additive linear model used for the combined ANOVA was:
Yijk = µ + (B/A) jk + Gi + Aj + (GA)ij + eijk
Where:
- Yijk= observation of genotype i in environment j and block k;
- µ= overall mean
- (B/A)jk= effect of block k within environment j
- Gi= fixed effect of genotype i
- Aj = fixed effect of the environment j
- (GA)ij = interaction effect of genotype i and environment j
- eijk= random error associated with Yijk, with normal distribution N(0, σ2)
The environmental index of Annicchiarico [27] was estimated as:
where:
Ij=Xj-X(..)
- Ij= Index of environment j
- Xj= Mean of the environment j
- X(..)= Overall mean
The confidence index of Annicchiarico for GY and PNP was estimated as:
Wi=Y(i.) (%)-Z(1-α) (σi)
Where:
- Wi = Genotypic confidence index of genotype i
- Y(i.) (%) = Relative mean of genotype i across the evaluated environments
- Z(1-α) = Quantile of the Z distribution at α=0.95
- σi= Relative standard deviation of genotype i across the evaluated environments
As early-maturing line recommendation is important in plant breeding, the confidence indices for DF, DPM, and DH were estimated as follows:
Wi=Y(i.) (%)+Z(1-α) (σi)
Additionally, to evaluate the environments and lines’ adaptability and stability for GY, both the GGE Biplot (Genotype + Genotype × Environment interaction) and AMMI (Additive Main effects and Multiplicative Interaction) methods were employed [7,28]. The GGE biplot analysis was performed using a matrix of genotype and environment means, with each value adjusted by subtracting the corresponding environment mean (Gi+(GxE)ij= Yij-Ej). For the AMMI analysis, each value of the genotype-by-environment mean matrix was adjusted according to the following model: GixEj= Yij-Gi-Ej+overall mean. Both matrices were subjected to principal component analysis (PCA) based on the covariance matrix.
ANOVA and Duncan’s multiple range test were performed using SAS 9.4 (PROC GLM; SAS Institute Inc., Cary, NC, USA). Annicchiarico analysis was performed in GENES [28]. PCA for the GGE biplot and AMMI was performed in JMP 14 (SAS Institute Inc., Cary, NC, USA) and Metan package of R software [29].
To assess whether environmental conditions in 2004 were comparable to those in 2020–2024, we retrieved daily meteorological data (June to August) from the San Roque SENAMHI weather station (Iquitos, Peru). Paired t-tests compared 2004 versus 2020-2024 for daily mean, minimum, and maximum temperature; sunshine hours; precipitation; and relative humidity, using Statistica 64 (StatSoft, Inc., Tulsa, OK, USA).
3. Results
3.1. Environmental Effects
In this study, three floodplain environments near Iquitos were analyzed. ANOVA results indicated that the environment significantly affected all traits (Table 2). According to Duncan’s means test, Muyuy presented the highest GY, with reductions of 14% in San Miguel and 48% in Rafael Belaunde compared to Muyuy (Table 3). Similarly, the NPP was highest in Muyuy, but was 18% lower in San Miguel and 34% lower in Rafael. Belaunde. The GGE biplot and AMMI biplot analysis for GY showed that Muyuy, San Miguel and Rafael Belaunde are contrasting environments (Figure 2). These results suggest that the three environments provide complementary conditions and should all be included in cowpea (Vigna unguiculata) grain yield trials.
For DF, DPM, and DH, the mean comparisons (Table 3) also showed higher values in Muyuy. Although the differences among locations were statistically significant (p<0.05), the maximum difference between sites for these traits was only two days.
On the other hand, analyses according to Annicchiarico [27] showed that for GY and NPP, Muyuy was identified as the favorable environment, while Rafael Belaunde was unfavorable (Table 4). However, for DF, DPM, and DH, San Miguel was identified as the favorable environment for earliness, whereas Muyuy was the least favorable.
3.2. Adaptability and Stability Analyses
The G×E interaction was not significant for GY and NPP, but was significant for DF, DPM, and DH (Table 2). This indicates that the G×E interaction did not affect GY, and selection can therefore be based on means of the the genotype. However, DF, DPM, and DH require further analysis of stability and adaptability.
Duncan's mean test did not detect significant differences for GY and NPP, but it detected significant differences for DF, DPM and DH (Table 5). The lines with the highest GY values were CAR 3010, CAR 3013, and CAR 3009 (Table 5).
However, for GY, Annicchiarico confidence index (Wi), GGE biplot, and AMMI analysis, all identified line CAR 3010 as having high adaptability and stability. The confidence index Wi was 103.54% (Table 6), the only value exceeding 100%. Similarly, the GGE biplot positioned CAR 3010 close to the abscissa of the Average Environment Axis (AEA) and near the ideal genotype, indicating strong adaptability and stability (Figure 2A). The AMMI analysis further supported these findings, showing that CAR 3010 had a principal component 1 (PC1) score close to zero and high GY (Figure 3), confirming the previous results. Together, these results demonstrate the wide adaptability and phenotypic stability of CAR 3010 across diverse environments. Therefore, CAR 3010 could be recommended for cultivation in the floodplains of the Peruvian, provided that the current climate remains comparable to that of 2004.
For NPP, the lines CAR 3010, cv. CAU 9 (TM), and CAR 3002 had Wi values greater than 100% (Table 6). Once again, line CAR 3010 exhibited the highest index (Wi=101.86%), indicating that this line has adaptability and stability for this trait.
Considering the recommendation of early-maturing lines, Wi values for DF, DPM, and DH should be less than 100% (Table 6). For DF, the lines with Wi < 100% were CAR 3003 and CAR 3006; for DPM, CAR 3003, CAR 3009, and cv. CAU 9 (TM); and for DH, CAR 3003 and cv. CAU 9 (TM) (Table 6). Thus, CAR 3003 stood out for its stable earliness.
However, although CAR 3010 exhibited high adaptability and stability for GY and NPP, it had Wi values greater than 100% for DF, DPM, and DH, indicating a lack of adaptability and stability for earliness.
3.3. Comparison of Climate Data Between 2004 and 2020-2024
Paired t-tests were performed to compare daily climatic variables between identical calendar dates from June to August in 2004 and the 2020–2024 period. The analyses revealed significant differences (p<0.01) for mean, maximum, and minimum temperatures, precipitation, and relative humidity (Table 7).
Among the variables analyzed, only the daily sunshine hours did not differ significantly between 2004 and 2020–2024. This indicates that the observed temperature increase is not attributable to changes in daily sunshine hours. Therefore, these results across six climatic variables demonstrate that the recent climate is warmer and dryer, yet with more precipitation.
4. Discussion
This study on adaptability and stability in cowpea revealed that the three floodplain environments near Iquitos (Peru) were contrasting for the five traits evaluated. Line CAR 3010 exhibited the highest Wi index for GY and NPP. Additionally, the current climate near Iquitos is warmer and drier, yet characterized by greater precipitation compared to 2004.
4.1. Importance of Muyuy, Rafael Belaunde, and San Miguel
Evaluating genotypes in diverse and representative environments is critical for identifying broadly adapted lines [7]. In this study, environmental effects significantly influenced all five traits, indicating substantial heterogeneity among the environments near Iquitos. Although the three soils are classified as floodplain and are separated by up to 16.5 km, they differ in their physical and chemical properties (Table 1).
Several statistical approaches, including ANOVA, Duncan’s means tests, GGE biplot, and AMMI biplot, showed marked environmental differences among the three sites, with Muyuy and Rafael Belaunde identified as the most contrasting environments. These variations are primarily attributed to the different edaphic properties described in Table 1. Muyuy exhibited a higher silt fraction (52.6%) and lower sand content (12.8%), which contributed to better water retention. Furthermore, Muyuy presented the highest Ca²⁺ (18.2 cmolc/dm³) and Mg²⁺ (3.0 cmolc/dm³) concentrations, indicating greater base saturation and nutrient availability. Organic carbon (0.8%) and total ECEC (21.6 cmolc/dm³) were also higher in Muyuy, enhancing soil fertility. Lower pH (5.5) combined with low aluminum saturation (m = 1.4%) further reduce toxicity risks, enabling better nutrient uptake. These results corroborate previous studies indicating that elevated levels of exchangeable Ca²⁺, Mg²⁺, and organic matter are essential for optimizing legume productivity in acidic tropical soils [30].
San Miguel and Rafael Belaunde showed marked differences in soil properties that influenced cowpea performance (Table 1). San Miguel has a silty clay texture, higher fertility, and higher organic carbon and nutrient content, supporting intermediate yields. In contrast, Rafael Belaunde’s sandy loam texture, low nutrient reserves, and minimal organic matter limited water and nutrient retention, resulting in the lowest productivity. Consequently, Muyuy, Rafael Belaunde, and San Miguel represent suitable environments for conducting adaptability and stability trials for cowpea and other short-cycle crops.
4.2. GxE Interaction and Adaptability and Stability Analysis
The GxE interaction was significant for DF, DPM, and DH, which confirms the environmental heterogeneity of the region, as observed in other tropical settings [18,21,31]. In particular, phenological traits were more sensitive to interaction, while GY and NPP were relatively stable, a pattern consistent with earlier findings in cowpea [32].
The Annicchiarico confidence index (Wi), GGE biplot, and AMMI were powerful tools for identifying adaptability and stability of the cowpea lines. The CAR 3010 line exhibited the highest Wi for both GY (897,5 kg/ha) and NPP (34,2), indicating wide adaptability in all environments. This aligns with previous studies that emphasize the importance of environmental factors in influencing cowpea yield and the need for robust statistical methods to account for genotype-environment interactions [11,14,20]
In contrast, Wi values below 100% for DF, DPM, and DH indicate lower relative means and standard deviations, which are desirable when selecting early-maturing lines. In this regard, lines CAR 3003 and cv. CAU 9 (TM) were noteworthy. CAR 3003 showed Wi values below 100% for all three phenological traits, while cv. CAU 9 (TM) had the lowest Wi for DH, suggesting that this local cultivar maintains a consistently short cycle (66 days to harvest).
4.3. Climate Change in the Amazon Region
Climatic comparisons between 2004 and 2020–2024 revealed significant warming trends, increased precipitation, and reductions in relative humidity (Table 7). These changes are consistent with IPCC projections [33] and highlight the urgent need to develop climate-resilient cowpea cultivars [9] for environments characterized by higher temperatures (mean=27°C, min=22.7°C, max=27,0°C), greater precipitation (5.38 mm day⁻¹), and lower relative humidity (87%). Consequently, the GY of CAR 3010 under these new environmental conditions remains uncertain.
Additional multi-year trials conducted with CAR 3010 and three other lines from June to August 2005-2007 in San Miguel and Muyuy demonstrated superior GY for CAR 3010 ranging from 1,089 to 1,263 kg ha-1 (personal communication, Rodrigo Gonzales). However, the climate during 2005–2007 also differed significantly from that observed in 2020–2024 (Table 8). In particular, the minimum temperature during 2020–2024 increased by 0.7°C, while the sunshine hours decreased by 1.4 hours compared to previous years. Elevated minimum temperatures, indicative of higher night temperatures, have been shown to accelerate respiration, increase energy expenditure, and ultimately reduce GY in cowpea [34]. In addition, day/night temperatures of 33/30°C induced male sterility in cowpea [35].
Therefore, CAR 3010 should be incorporated into genetic improvement programs in the Peruvian Amazon in all three locations and evaluated for at least two consecutive years in the context of ongoing climate change.
4.4. Limitations and Future Research
In this study, Duncan’s mean test did not detect significant differences in GY or NPP among the lines. These results could potentially be improved by increasing the number of blocks and reducing the size of the experimental plot. In the present experiment, each plot consisted of 256 plants (spacing 0.7 × 0.3 m) with two blocks and produced a coefficient of variation (CV) of 18.8%. In similar studies, however, it has been observed that plot with 16 plants (spacing 0.5 × 1 m) and four blocks resulted in CV of 31% [3], or that plots with 10 plants (spacing 0.7 × 0.4 m) and three blocks produced a CV of 33% [20]. These observations suggest that plot size can be reduced and the number of blocks increased to allow the evaluation of a greater number of genotypes within the same total area.
In addition, alternative methodologies can be utilized to assess adaptability and stability. Specifically, this study found that the Annicchiarico method, the GGE biplot and AMMI effectively differentiated CAR 3010, likely due to their efficient use of genotype means across environments and consideration of genotype variation within the context of all environments. More research is needed to evaluate the effectiveness of these and other approaches in the Peruvian Amazon in different years [15,20].
5. Conclusions
Breeding strategies for cowpea and other short-cycle crops in the floodplains of the Peruvian Amazon should include a core testing network comprising Muyuy, Rafael Belaunde, and San Miguel, as these sites represent contrasting edaphic conditions.
Line CAR 3010 is recommended for inclusion in cowpea breeding programs in the Peruvian Amazon due to its superior adaptability and stability.
As the climate in the Peruvian Amazon continues to shift toward warmer and drier conditions, yet with greater precipitations, sustaining and enhancing cowpea breeding programs is essential to secure long-term food security in the region.
Author Contributions
Conceptualization, R.G.; investigation, R.G.; data analysis, C.A.T.B.; writing—original draft preparation, C.A.T.B. and J.R.C.; writing—review and editing, C.A.T.B., J.R.C., J.C.C., and J.J.T.A.; data review, R.G. and J.C.C.; figure formatting, J.J.T.A. All authors have read and agreed to the published version of the manuscript.
Funding
Legume project of Instituto Nacional de Innovación Agraria (INIA).
Data Availability Statement
The original contributions presented in this study are included in the article. Further inquiries can be directed to the corresponding author.
Acknowledgments
The authors would like to thank the INIA for its logistical and institutional support.
Conflicts of Interest
The authors declare that they have no conflicts of interest.
Abbreviations
The following abbreviations are used in this manuscript:
| GY | Grain yield |
| NPP | Number of pods per plant |
| DF | Days to flowering |
| DPM | Days to physiological maturity |
| DH | Days to harvest |
| GGE | Genotype + Genotype-by-Environment interaction |
| AMMI | Additive Main effects and Multiplicative Interaction |
References
- Gondwe, T.; Alamu, E.O.; Mdziniso, P.; Maziya-Dixon, B. Cowpea (Vigna unguiculata (L.) Walp) for food security: an evaluation of end-user traits of improved varieties in Swaziland. Sci. Rep. 2019, 9. [Google Scholar] [CrossRef] [PubMed]
- Singh, B.B. Cowpea [Vigna unguiculata (L.) Walp.]. In Genetic Resources, Chromosome Engineering and Crop Improvement, Singh, R.J.J.P.P., Ed.; CRC Press: Boca Raton, 2005; pp. 138–196. [Google Scholar]
- Cruz, D.P.d.; Gravina, G.d.A.; Vivas, M.; Entringer, G.C.; Rocha, R.S.; Jaeggi, M.E.P.d.C.; Gravina, L.M.; Pereira, I.M.; Júnior, A.T.d.A.; Moraes, R.d.; et al. Analysis of the phenotypic adaptability and stability of strains of cowpea through the GGE Biplot approach. Euphytica 2020, 216. [Google Scholar] [CrossRef]
- UNICAMP. Tabela Brasileira de Composição de Alimentos; NEPA–UNICAMP: Campinas, 2011. [Google Scholar]
- FAOSTAT. Crops and livestock products. Available online: https://www.fao.org/faostat/en/#data/QCL (accessed on 05/01/2025).
- MIDAGRI. Importación de legumbres creció 67.3 % en valor y 56.4 % en volumen en 2020. Available online: https://agraria.pe/noticias/midagri-importacion-de-legumbres-crecio-67-3-en-valor-y-56-4-23661#:~:text=a%20la%20pandemia-,Midagri%3A%20Importaci%C3%B3n%20de%20legumbres%20creci%C3%B3%2067.3%25%20en%20valor%20y,56.4%25%20en%20volumen%20en%202020&text=Por%20su%20parte%2C%20las%20exportaciones,en%20volumen%20de%20%2D9.1%25. (accessed on 07/01/2025).
- Yan, W.; Kang, M.S. GGE Biplot Analysis: A Graphical Tool for Breeders, Geneticists, and Agronomists; CRC Press: Boca Raton, 2002. [Google Scholar]
- Matova, P.M.; Gasura, E. Yield and stability of new cowpea varieties in Zimbabwe. Afr. Crop Sci. J. 2018, 26, 277–277. [Google Scholar] [CrossRef]
- Goa, Y.; Mohammed, H.; Worku, W.; Urage, E. Genotype by environment interaction and yield stability of cowpea (Vigna unguiculata (L.) Walp.) genotypes in moisture limited areas of Southern Ethiopia. Heliyon 2022, 8. [Google Scholar] [CrossRef]
- Mekonnen, T.W.; Mekbib, F.; Amsalu, B.; Gedil, M.; Labuschagne, M. Genotype by environment interaction and grain yield stability of drought tolerant cowpea landraces in Ethiopia. Euphytica 2022, 218. [Google Scholar] [CrossRef]
- Aleme, M.; Mengistu, G.; Tulu, D.; Dejene, M.; Temteme, S.; Feyissa, F. Stability analysis of dry matter and seed yield of cowpea [Vigna unguiculata (L.) walp.] genotypes in humid and lowland areas of southwestern Ethiopia. Ecol. Genet. Genomics 2024, 33, 100295. [Google Scholar] [CrossRef]
- Mbeyagala, E.K.; Ariko, J.B.; Atimango, A.O.; Amuge, E.S. Yield stability among cowpea genotypes evaluated in different environments in Uganda. Cogent Food Agric. 2021, 7. [Google Scholar] [CrossRef]
- Abiriga, F.; Ongom, P.O.; Rubaihayo, P.; Edema, R.; Thanmai, P.; Dramadri, I.; Orawu, M. Harnessing genotype-by-environment interaction to determine adaptability of advanced cowpea lines to multiple environments in Uganda. J. Plant Breed. Crop Sci. 2020, 12, 131–145. [Google Scholar] [CrossRef]
- Kusi, F.; Amoah, R.A.; Attamah, P.; Alhassan, S.N.; Yahaya, D.; Awuku, F.J.; Nbonyine, J.A.; Amegbor, I.K.; Mensah, G.; Sugri, I.; et al. Genotype x environment interaction effect on grain yield of cowpea (Vigna unguiculata (L.) Walp) in Deciduous forest and Sudan savanna ecologies of Ghana. PLoS ONE 2025, 20. [Google Scholar] [CrossRef] [PubMed]
- Nassir, A.L.; Olayiwola, M.O.; Olagunju, S.O.; Adewusi, K.M.; Jinadu, S.S. Genotype × environment analysis of cowpea grain production in the forest and derived savannah cultivation ecologies. Agro-Science 2021, 20, 20–24. [Google Scholar] [CrossRef]
- Araméndiz-Tatis, H.; Camacho, M.M.E.; Ayala, C. Adaptation and stability of cowpea (Vigna unguiculata (L.) Walp) bean cultivars in the tropical dry forest of Colombia. Aust. J. Crop Sci. 2019. [Google Scholar] [CrossRef]
- Araújo, M.d.S.; Aragão, W.F.L.d.; Santos, S.P.d.; Freitas, T.K.T.; Saraiva, V.d.C.; Damasceno-Silva, K.J.; Dias, L.A.d.S.; Rocha, M.d.M. Evaluation of adaptability and stability for iron, zinc and protein content in cowpea genotypes using GGE biplot approach. Heliyon 2022, 8. [Google Scholar] [CrossRef]
- Alves, S.M.; Júnior, J.Â.N.M.; Marques, M.R.; Silva, K.J.D.; Olibone, D. Adaptability, stability, and agronomic performance of cowpea lines in Mato Grosso, Brazil. Rev. Bras. Cienc. Agrar. 2020, 15, 1–7. [Google Scholar] [CrossRef]
- Hendrie, F.N.; Francisco, R.F.F.; Valdenir, Q.R.; Regina, L.F.G. Grain yield adaptability and stability of blackeyed cowpea genotypes under rainfed agriculture in Brazil. Afr. J. Agric. Res. 2014, 9, 255–261. [Google Scholar] [CrossRef]
- Rolim, R.R.; Nascimento, N.F.F.d.; Nascimento, M.F.; Araújo, H.F.P.d. Genotype x environment interaction and stability in landraces of cowpea under dryland conditions. Rev. Caatinga 2023, 36, 339–348. [Google Scholar] [CrossRef]
- Arguelho, S.B.D.; Silva, M.L.d.; Teodoro, P.E.; Teodoro, L.P.R.; Arevalo, A.C.M.; Ceccon, G. Adaptability and yield stability of cowpea genotypes in Mato Grosso do Sul. Crop Breed. Appl. Biotechnol. 2023, 23. [Google Scholar] [CrossRef]
- Santos, A.d.; Ceccon, G.; Rodrigues, E.V.; Teodoro, P.E.; Corrêa, A.M.; Torres, F.E.; Alvarez, R.d.C.F. Selection of cowpea genotypes for Mato Grosso do Sul viaGGE Biplot and linear regression. Biosci. J. 2017, 631–638. [Google Scholar] [CrossRef]
- Sousa, M.B.e.; Damasceno-Silva, K.J.; Rocha, M.d.M.; Júnior, J.Â.N.d.M.; Lima, L.R.L. Genotype by environment interaction in cowpea lines using gge biplot method. Rev. Caatinga 2018, 31, 64–71. [Google Scholar] [CrossRef]
- Santos, A.d.; Torres, F.E.; Rodrigues, E.V.; Pantaleão, A.d.A.; Teodoro, L.P.R.; Bhering, L.L.; Teodoro, P.E. Nonlinear Regression and Multivariate Analysis Used to Study the Phenotypic Stability of Cowpea Genotypes. HortScience 2019, 54, 1682–1685. [Google Scholar] [CrossRef]
- Nelson, D.W.; Sommers, L.E. Total Carbon, Organic Carbon, and Organic Matter. In Methods of Soil Analysis; Page, A.L., Ed.; 1982. [Google Scholar]
- Pimentel-Gomes, F. Curso de Estatística Experimental; FEALQ: Piracicaba, 2023; p. 451. [Google Scholar]
- Annicchiarico, P. Cultivar adaptation and recommendation from alfalfa trials in Northern Italy. J. Genet. Breed. 1992, 46, 269–278. [Google Scholar]
- Cruz, C.D. GENES: a software package for analysis in experimental statistics and quantitative genetics. Acta Sci. Agron. 2013, 35, 271–276. [Google Scholar] [CrossRef]
- Olivoto, T.; Lúcio, A.D.C. metan: An R package for multi-environment trial analysis. Methods Ecol. Evol. 2020, 11, 783–789. [Google Scholar] [CrossRef]
- Almeida, A.L.G.; Mingotte, F.L.C.; Coelho, A.P.; Lemos, L.B.; Melo, F.B.; Prado, R.M. Agronomic performance of cowpea cultivars (Vigna unguiculata (L.) Walp) under application of limestone doses. Rev. Bras. Cienc. Agrar. 2021, 16, 1–10. [Google Scholar] [CrossRef]
- Santos, A.d.; Ceccon, G.; Teodoro, P.E.; Corrêa, A.M.; Alvarez, R.d.C.F.; Silva, J.F.d.; Alves, V.B. Adaptability and stability of erect cowpea genotypes via REML/BLUP and GGE Biplot. Bragantia 2016, 75, 299–306. [Google Scholar] [CrossRef]
- Owusu, E.Y.; Karikari, B.; Kusi, F.; Haruna, M.; Amoah, R.A.; Attamah, P.; Adazebra, G.; Sie, E.K.; Issahaku, M. Genetic variability, heritability and correlation analysis among maturity and yield traits in Cowpea (Vigna unguiculata (L) Walp) in Northern Ghana. Heliyon 2021, 7. [Google Scholar] [CrossRef]
- IPCC. Policymakers. In Climate Change 2023: Synthesis Report. Contribution of Working Groups I, II and III to the Sixth Assessment Report of the Intergovernmental Panel on Climate Change, Lee, H., Romero, J., Eds.; IPCC: Geneva, 2023; pp. 1–34. [Google Scholar]
- Mohammed, S.B.; Ongom, P.O.; Togola, A.; Boukar, O. Enhancing cowpea tolerance to elevated temperature: achievements, challenges and future directions. Agron. 2024, 14, 513. [Google Scholar] [CrossRef]
- Warrag, M.O.A.; Hall, A.E. Reproductive responses of cowpea (Vigna unguiculata (L.) Walp.) to heat stress. II. Responses to night air temperature. Field Crops Res. 1984, 8, 17–33. [Google Scholar] [CrossRef]
Figure 1.
Location of field experiments in three locations near Iquitos, Loreto.
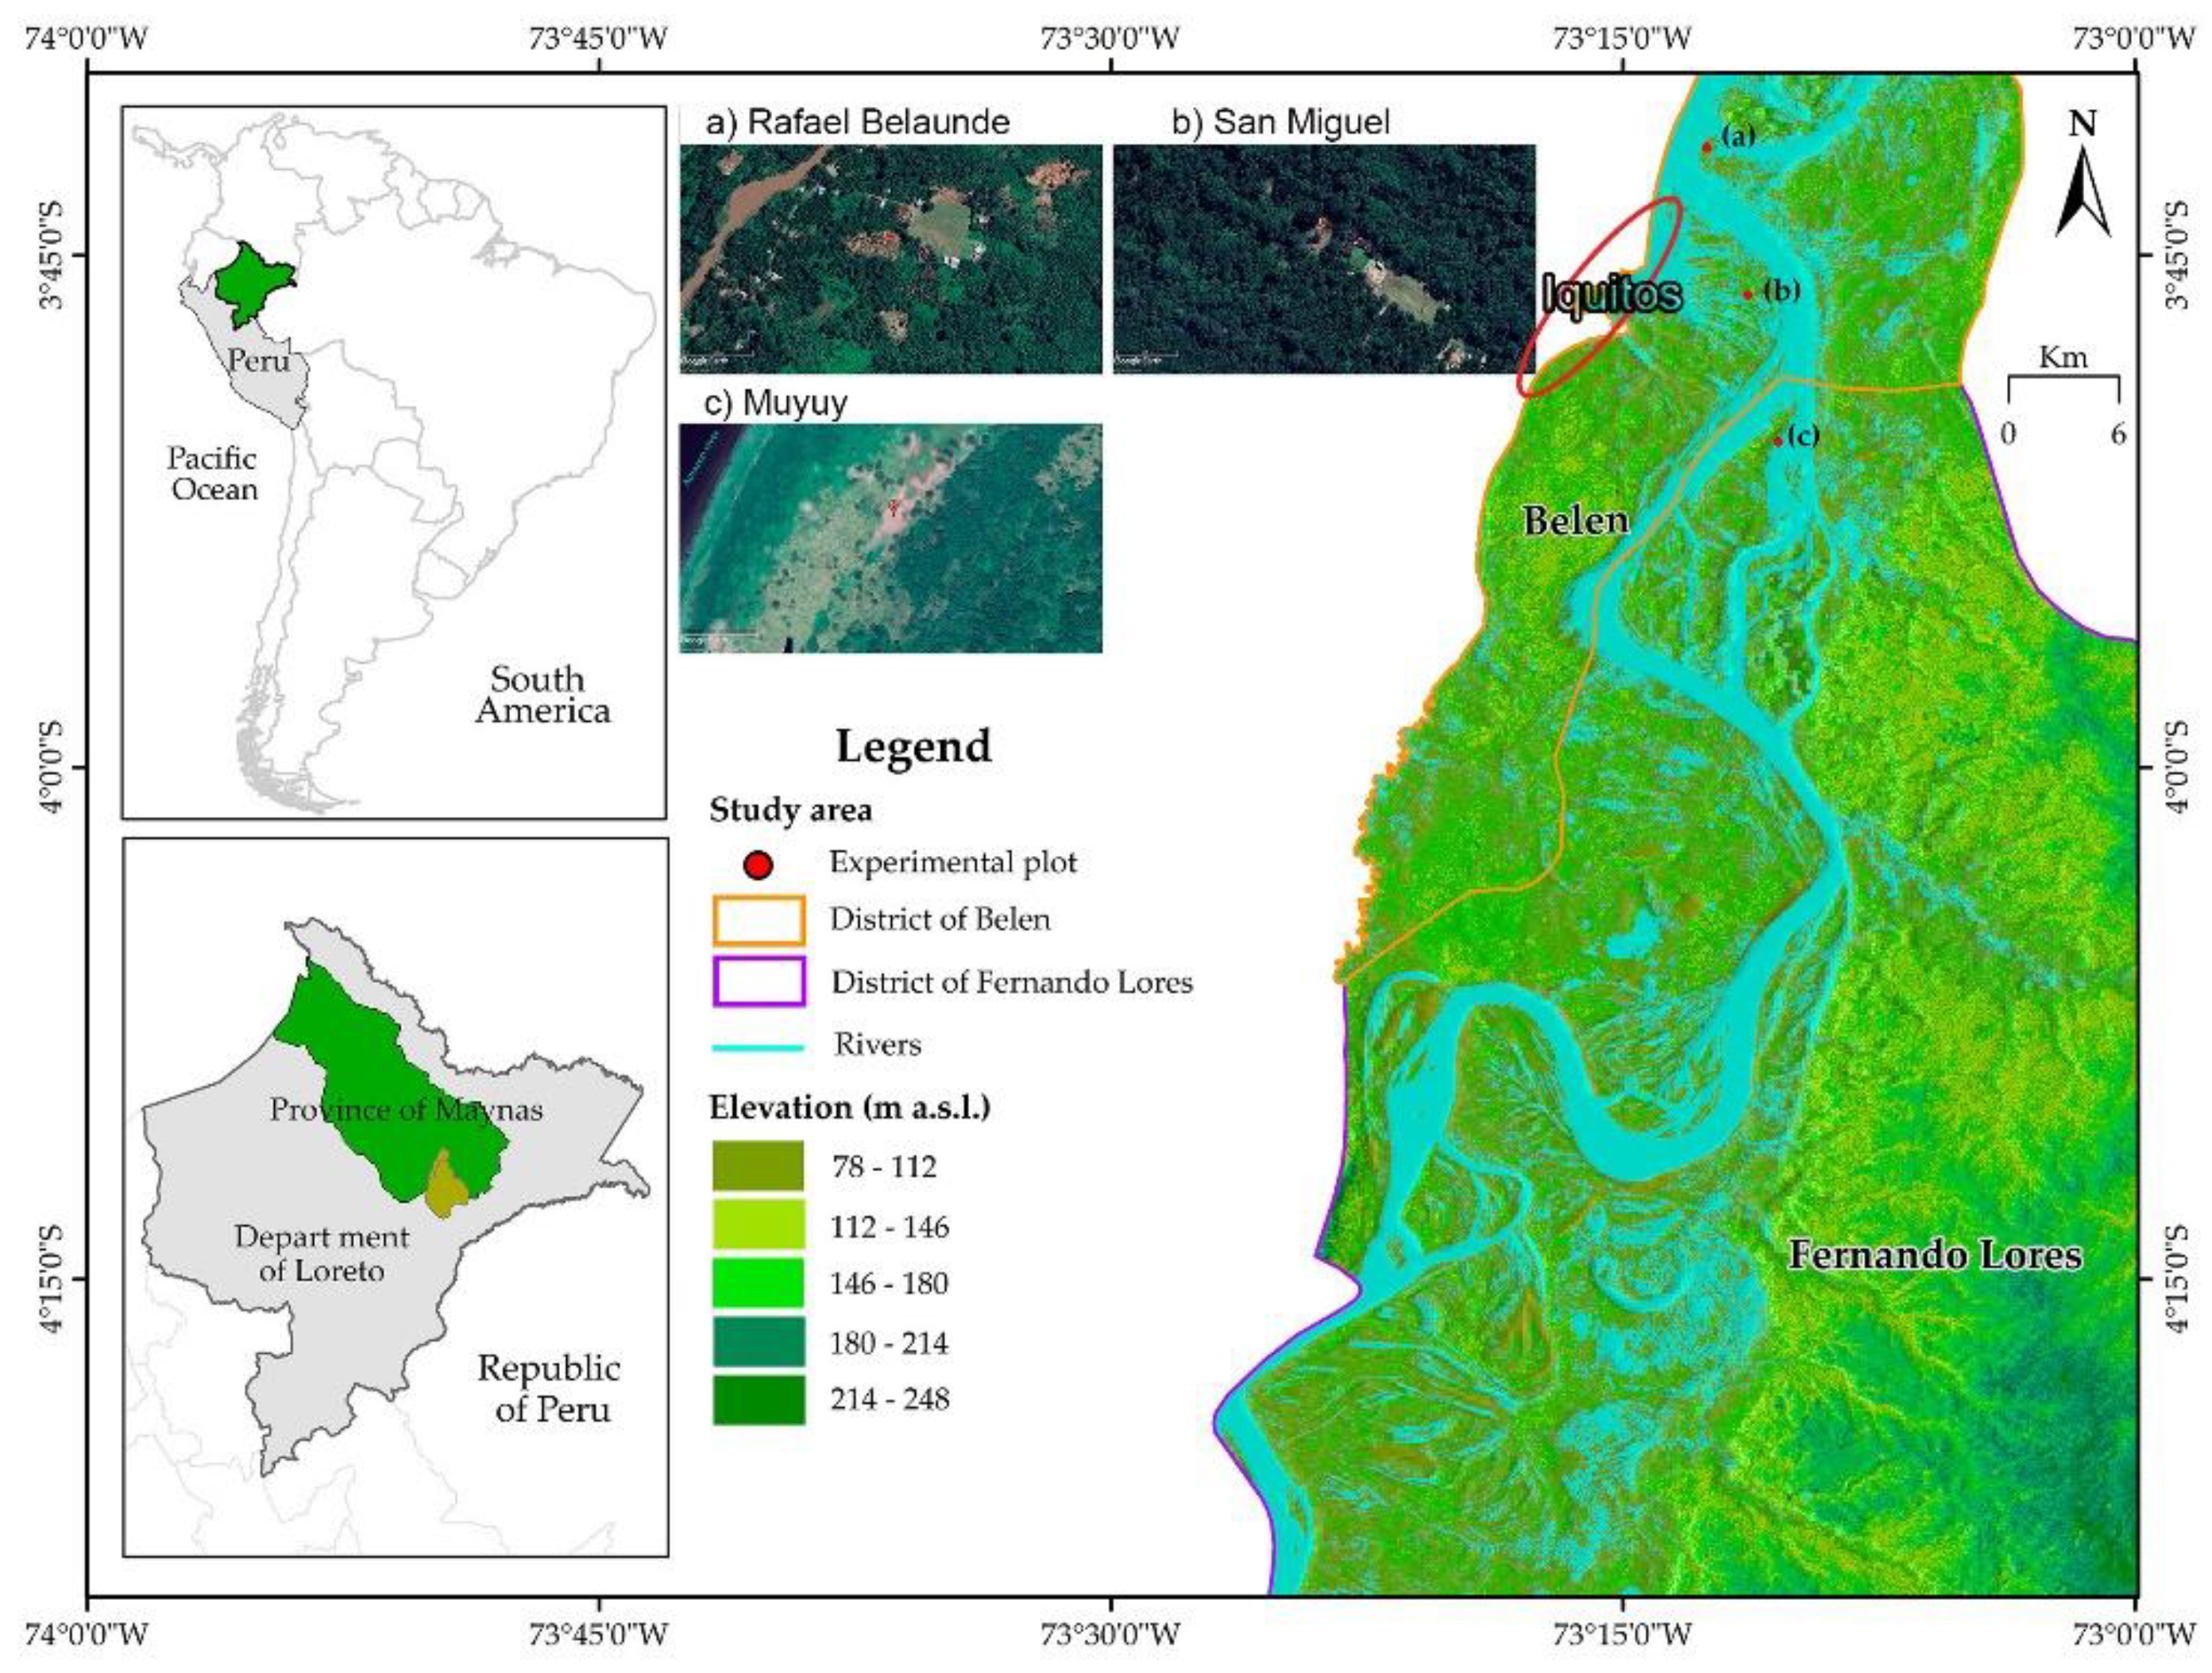
Figure 2.
The GGE (A) and AMMI (B) biplots for cowpea (Vigna unguiculata L. Walp.) grain yield (GY) illustrate the contrasts among the three test environments. The GGE biplot places the CAR 3010 line close to the abscissa of the Average Environment Axis (blue line) and near the ideotype, indicating high adaptability and stability. The AMMI biplot shows that the orthogonal projection of CAR 3010 onto PC1 is close to zero, suggesting the stability of this line.
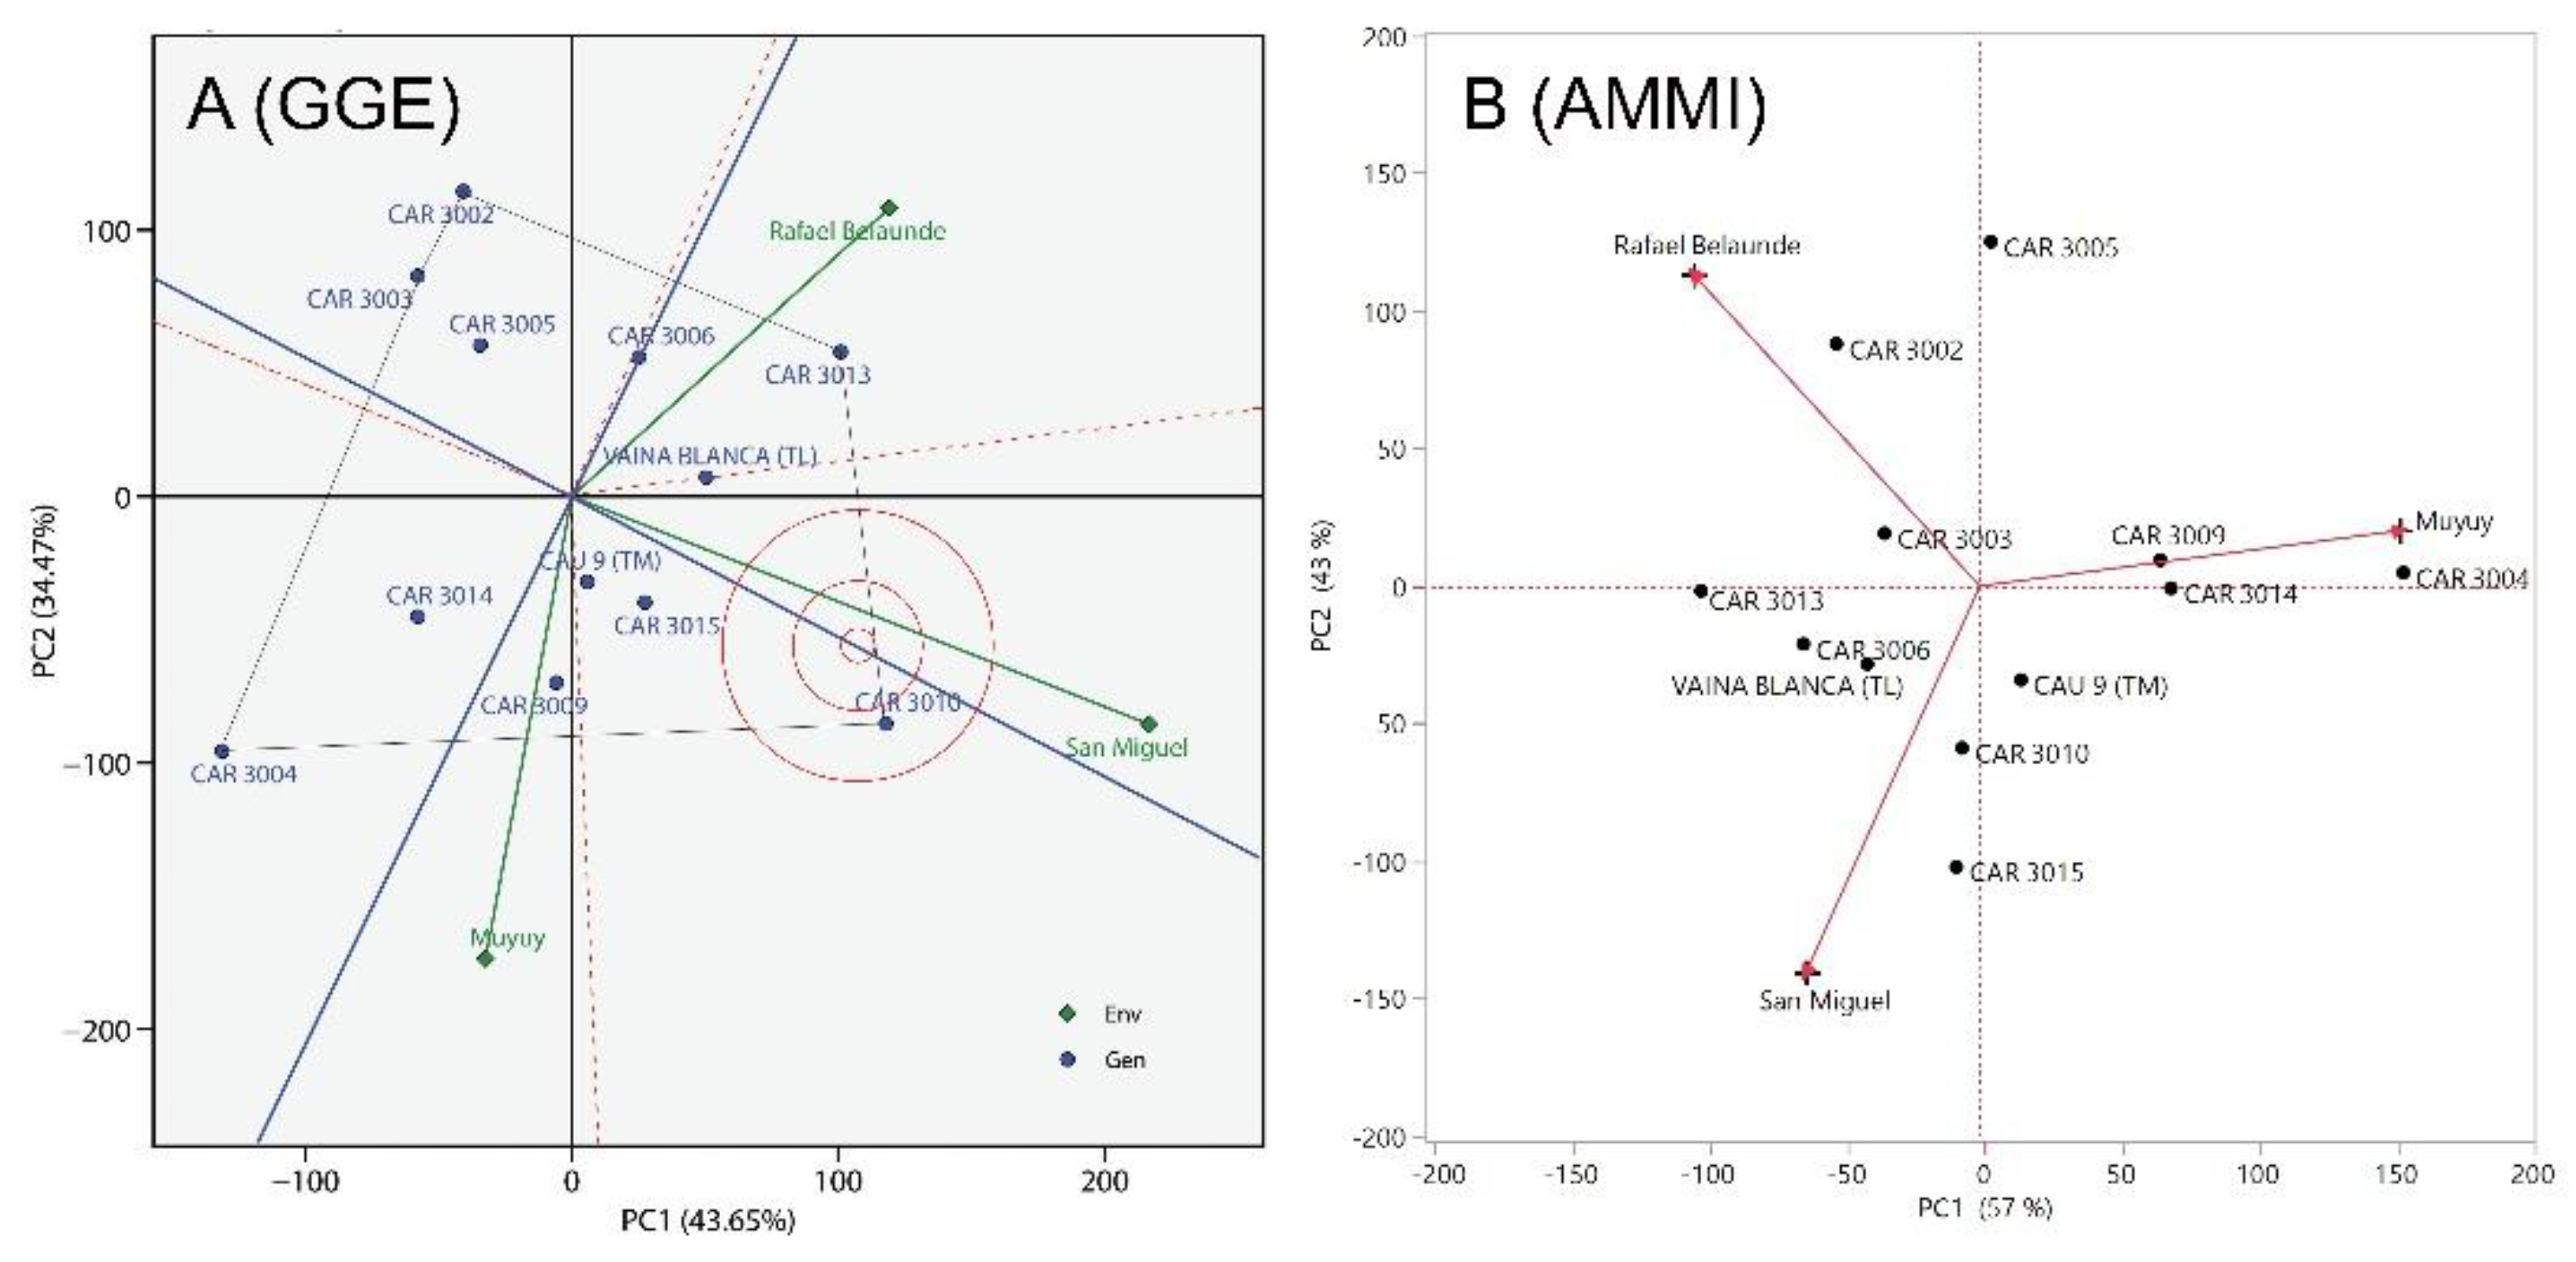
Figure 3.
Scatter plot of PC1 scores from the AMMI analysis versus grain yield (GY). The dashed vertical line represents the PC1 score of zero, and the dashed horizontal line represents the mean GY.
Figure 3.
Scatter plot of PC1 scores from the AMMI analysis versus grain yield (GY). The dashed vertical line represents the PC1 score of zero, and the dashed horizontal line represents the mean GY.
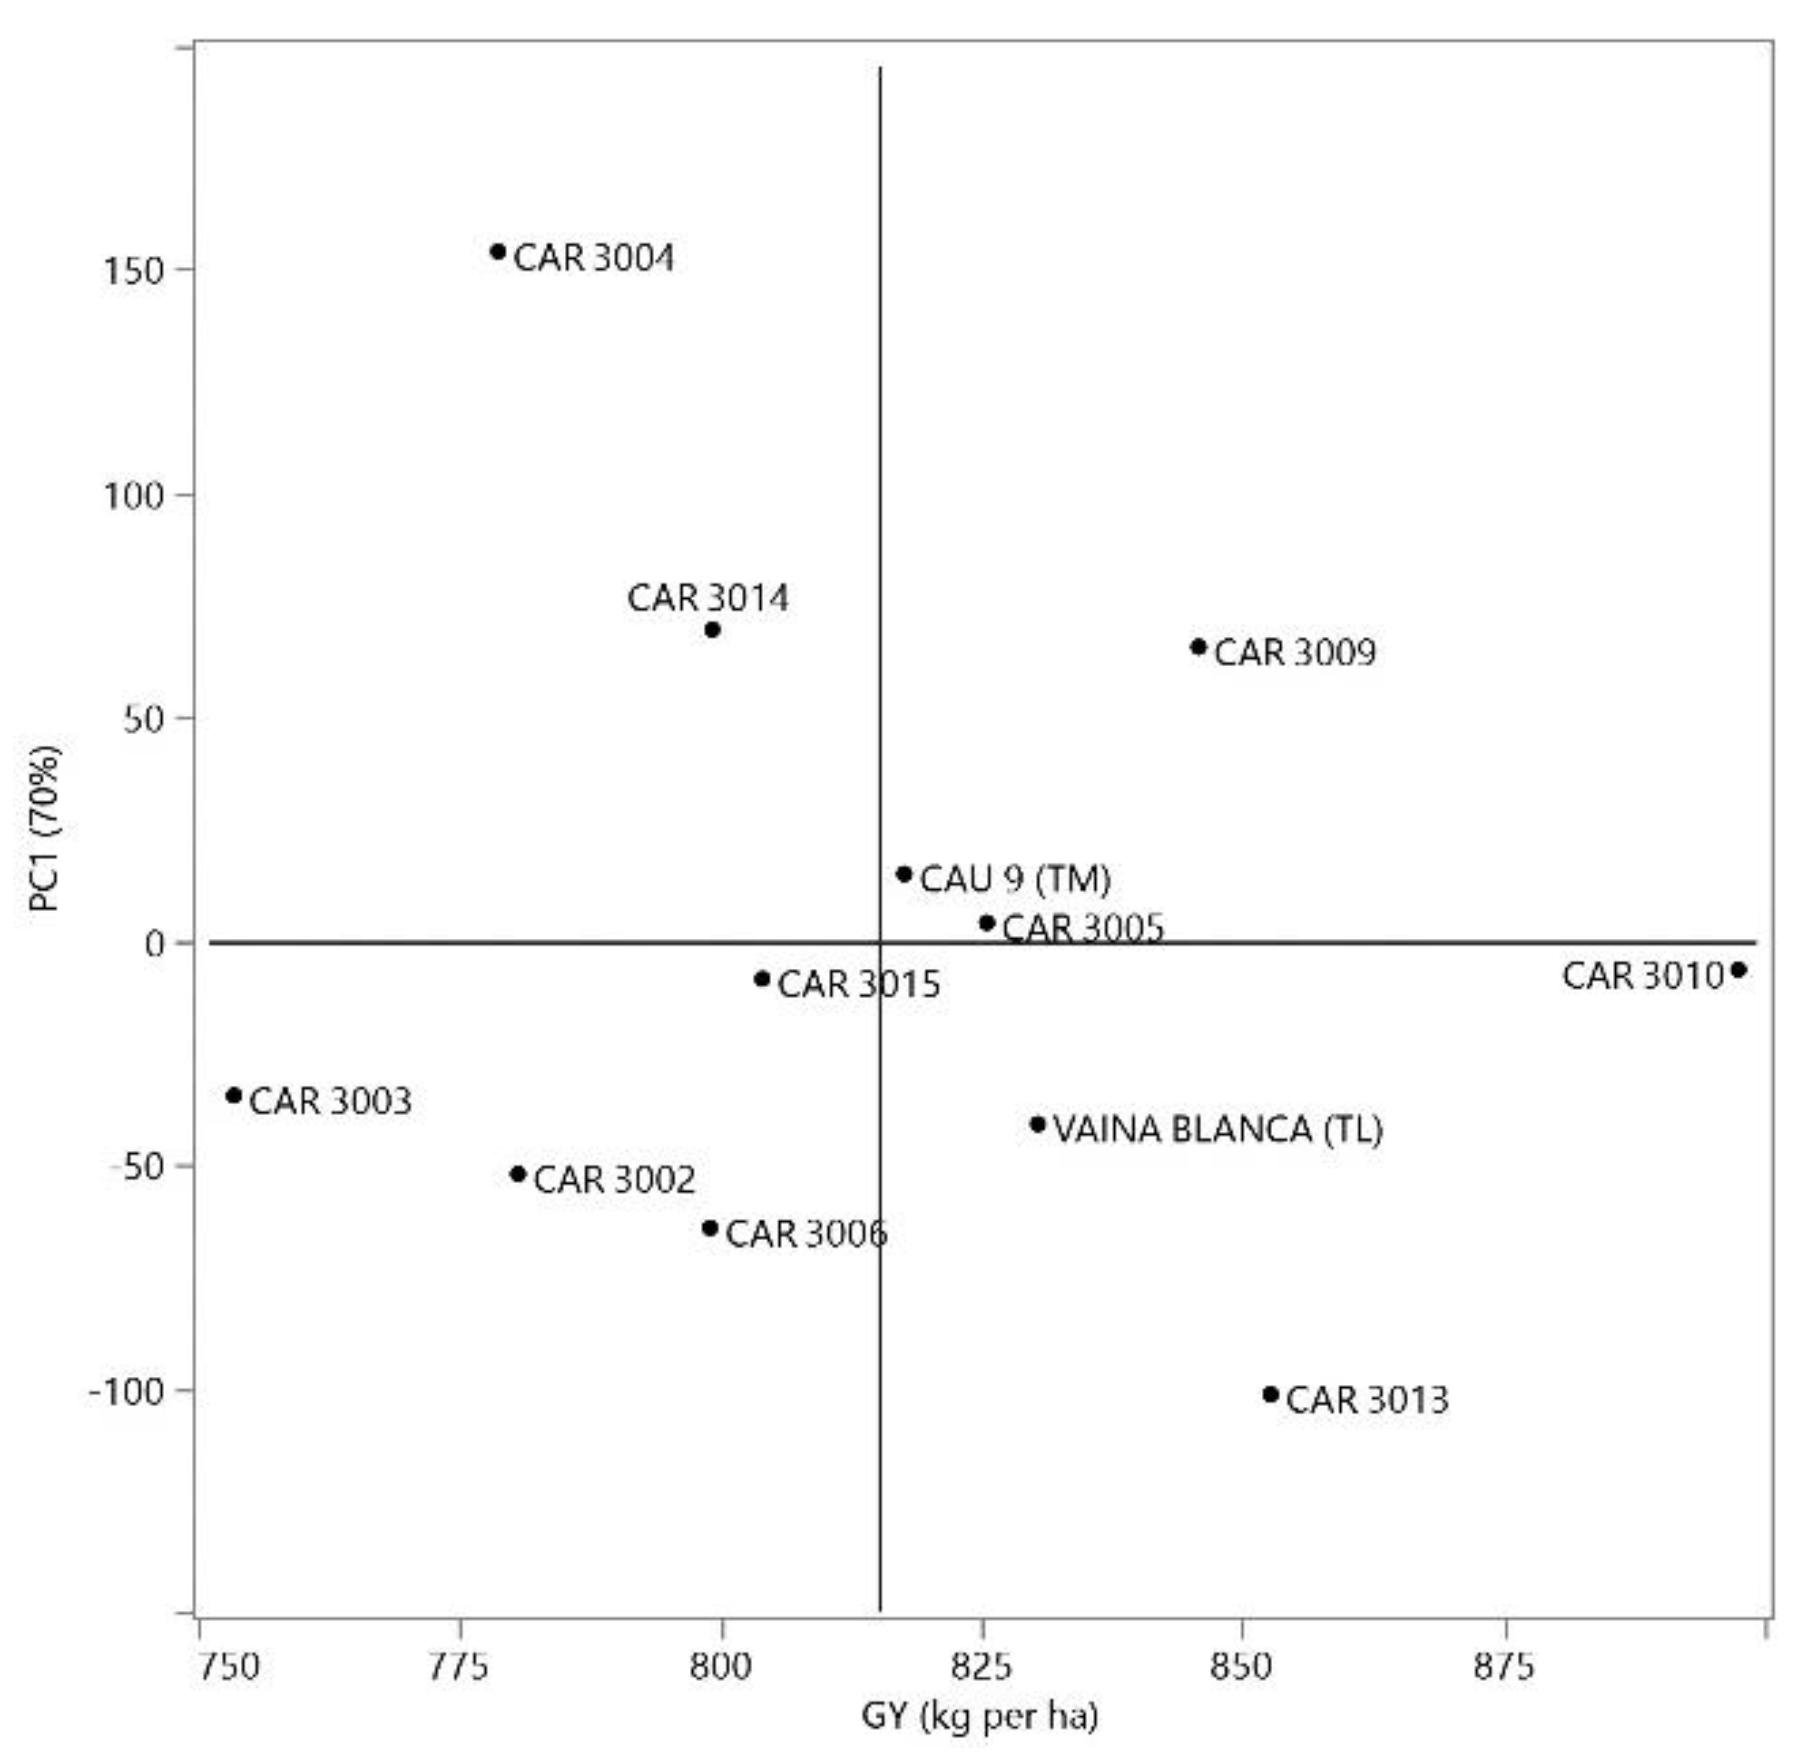

Table 1.
Physical and chemical characteristics of the soils of the three environments near Iquitos. Loreto, 2004.
Table 1.
Physical and chemical characteristics of the soils of the three environments near Iquitos. Loreto, 2004.
| Characteristics | Unit | Environments | ||
| San Miguel | Rafael Belaunde |
Muyuy | ||
| Clay | (%) | 34.1 | 16.1 | 34.6 |
| Silt | (%) | 57.3 | 23.3 | 52.6 |
| Sand | (%) | 8.6 | 60.6 | 12.8 |
| pH H2O | 5.7 | 7.2 | 5.5 | |
| P | mg/kg | 18.2 | 7.5 | 13.9 |
| H⁺ + Al³⁺ | cmolc/dm³ | 0.5 | 0.3 | 0.3 |
| K+ | cmolc/dm³ | 0.2 | 0.1 | 0.1 |
| Ca2+ | cmolc/dm³ | 9.3 | 5.1 | 18.2 |
| Mg2+ | cmolc/dm³ | 2.9 | 0.5 | 3.0 |
| ECEC | cmolc/dm³ | 12.8 | 6.0 | 21.6 |
| m | % | 3.9 | 5.0 | 1.4 |
| Organic Carbon | % | 0.9 | 0.3 | 0.8 |
| N | % | 0.1 | 0.0 | 0.1 |
| Bulk density | g/cm3 | 1.3 | 1.5 | 0.0 |
Table 2.
ANOVA for agronomic characteristics of cowpea lines in three environments of the Peruvian Amazon: Muyuy, San Rafael, and San Miguel. Loreto, 2004.
Table 2.
ANOVA for agronomic characteristics of cowpea lines in three environments of the Peruvian Amazon: Muyuy, San Rafael, and San Miguel. Loreto, 2004.
| Mean Square | ||||||
| FV | GL | Yield grain (kg/ha) |
Number of pods per plant |
Days to flowering | Days to Physiological maturity |
Days to harvest |
| Environment (E) | 2 | 1564786.7** | 1109.9** | 1.7** | 30.5** | 27.7** |
| Block/E | 3 | 24993.0ns | 73.9* | 1.4* | 4.0* | 18.0** |
| Genotype (G) | 11 | 8971.4ns | 34.0ns | 9.9** | 25.0** | 10.1** |
| GxE | 22 | 8490.9ns | 15.2ns | 0.8* | 3.6** | 2.2* |
| Error | 33 | 22705.7 | 17.7 | 0.4 | 1.1 | 1.1 |
| Total | 71 | |||||
| Mean | 815.38 | 33.25 | 43.19 | 62.32 | 69.47 | |
| CV (%) | 18.82 | 12.66 | 1.39 | 1.66 | 1.50 | |
Table 3.
Duncan’s multiple range test (p < 0.05) for three environments near Iquitos where cowpea was grown. Loreto, 2004.
Table 3.
Duncan’s multiple range test (p < 0.05) for three environments near Iquitos where cowpea was grown. Loreto, 2004.
| Environment | Yield grain (kg/ha) | Number of pods per plant | Days to flowering | Days to physiological maturity | Days to harvest |
| Muyuy | 1027.8a | 40.2a | 43.5a | 63.3a | 70.7a |
| Rafael Belaunde | 532.1c | 26.6c | 43.1b | 62.6b | 69.2b |
| San Miguel | 886.3b | 33.0b | 43.0b | 61.1c | 68.6b |
Table 4.
Environmental indices (Ij) for three sites near Iquitos, where 12 cowpea (Vigna unguiculata (L.) Walp.) lines were cultivated.
Table 4.
Environmental indices (Ij) for three sites near Iquitos, where 12 cowpea (Vigna unguiculata (L.) Walp.) lines were cultivated.
| Site | Mean | Ij | Class |
| Grain yield - GY (kg ha-1) | |||
| San Miguel | 886.25 | 70.87 | Favorable |
| Rafael Belaunde | 532.08 | -283.29 | Unfavorable |
| Muyuy | 1027.79 | 212.41 | Favorable |
| Number of pods per plant - NPP | |||
| San Miguel | 32.96 | -0.29 | Unfavorable |
| Rafael Belaunde | 26.60 | -6.65 | Unfavorable |
| Muyuy | 40.19 | 6.94 | Favorable |
| Days to flowering - DF† | |||
| San Miguel | 43.00 | -0.19 | Favorable |
| Rafael Belaunde | 43.08 | -0.11 | Favorable |
| Muyuy | 43.50 | 0.31 | Unfavorable |
| Days to physiological maturity - DPM† | |||
| San Miguel | 61.08 | -1.24 | Favorable |
| Rafael Belaunde | 62.58 | 0.26 | Unfavorable |
| Muyuy | 63.29 | 0.97 | Unfavorable |
| Days to harvest - DH† | |||
| San Miguel | 68.58 | -0.89 | Favorable |
| Rafael Belaunde | 69.17 | -0.31 | Favorable |
| Muyuy | 70.67 | 1.19 | Unfavorable |
† Consider early development as a favorable environment.
Table 5.
Duncan’s means tests (p<0.05) of cowpea lines evaluated in three environments near Iquitos, Peru.
Table 5.
Duncan’s means tests (p<0.05) of cowpea lines evaluated in three environments near Iquitos, Peru.
| Lines | Yield grain (kg ha-1)† | Number of pods per plant | Days to flowering | Days to physiological maturity | Days to harvest |
| CAR 3002 | 780. 6 | 35.2 | 42.5de | 62.3c | 69.8a |
| CAR 3003 | 753.4 | 36.2 | 40.7f | 60.5e | 68.0b |
| CAR 3004 | 778.6 | 34.0 | 42.2e | 61.0de | 70.3a |
| CAR 3005 | 825.5 | 35.3 | 45.0a | 65.0ab | 70.0a |
| CAR 3006 | 799.0 | 31.9 | 42.0e | 64.3b | 68.0b |
| CAR 3009 | 845.7 | 31.3 | 45.0a | 62.0cd | 70.3a |
| CAR 3010 | 897.5 | 34.2 | 43.3c | 61.0de | 70.3a |
| CAR 3013 | 852.7 | 33.2 | 44.2b | 64.7ab | 70.2a |
| CAR 3014 | 799.2 | 27.4 | 44.3ab | 65.7a | 70.2a |
| CAR 3015 | 804.0 | 31.9 | 43.0cd | 60.0e | 70.2a |
| cv. CAU 9 (TM) | 817.6 | 34.9 | 43.2cd | 60.8de | 66.3c |
| cv. Vaina Blanca (TL) | 830.4 | 33.5 | 43.0cd | 60.5e | 70.0a |
†Values within a column followed by different letters differ significantly.
Table 6.
The confidence index (Wi) estimated by the method of Annicchiarico (1992) for grain yield (GY), Number of pods per plant (PNP), days to flowering (DF), days to physiological maturity (DPM), and days to harvest (DH) of cowpea.
Table 6.
The confidence index (Wi) estimated by the method of Annicchiarico (1992) for grain yield (GY), Number of pods per plant (PNP), days to flowering (DF), days to physiological maturity (DPM), and days to harvest (DH) of cowpea.
| Wi(%)† | ||||||
| N° | Genotype | GY | NPP | DF* | DPM* | DH* |
| 1 | CAR 3002 | 81.16 | 100.56 | 100.69 | 102.57 | 104.66 |
| 2 | CAR 3003 | 90.61 | 84.57 | 97.58 | 99.03 | 99.70 |
| 3 | CAR 3004 | 67.98 | 86.25 | 101.41 | 100.16 | 102.57 |
| 4 | CAR 3005 | 81.59 | 98.41 | 105.23 | 107.45 | 103.33 |
| 5 | CAR 3006 | 90.68 | 87.96 | 98.23 | 105.68 | 100.27 |
| 6 | CAR 3009 | 95.71 | 88.22 | 105.23 | 99.03 | 102.57 |
| 7 | CAR 3010 | 103.54 | 101.86 | 101.52 | 102.49 | 102.57 |
| 8 | CAR 3013 | 89.40 | 91.62 | 106.02 | 100.94 | 103.83 |
| 9 | CAR 3014 | 85.37 | 53.19 | 106.46 | 111.59 | 102.92 |
| 10 | CAR 3015 | 79.55 | 86.97 | 100.57 | 107.80 | 102.92 |
| 11 | cv. CAU 9 (TM) | 92.80 | 100.80 | 100.12 | 99.18 | 98.63 |
| 12 | cv. Vaina Blanca (TL) | 95.82 | 91.61 | 100.69 | 100.14 | 103.33 |
|
† alpha=0.05, z=1.645 * Wi was estimated by adapting the Annicchiarico index as described in formula 4. Lines with Wi values less than 100% were considered suitable for earliness. | ||||||
Table 7.
Paired t-test for daily climatic variables between June and August 2004 and the period 2020-2024 in Iquitos, Peru. Source: SENAMHI San Roque.
Table 7.
Paired t-test for daily climatic variables between June and August 2004 and the period 2020-2024 in Iquitos, Peru. Source: SENAMHI San Roque.
| Variable | n | Mean (2004) | Mean (2020-2024) |
Difference | t | p-value |
| Mean Temperature (°C) | 90 | 26.39 | 26.96 | 0.57 | -3.42 | 0.0009 |
| Max. Temperature (°C) | 90 | 30.96 | 32.18 | 1.21 | -4.98 | <0.0001 |
| Min. Temperature (°C) | 90 | 21.96 | 22.71 | 0.75 | -6.66 | <0.0001 |
| Sunshine Hours | 92 | 3.72 | 3.96 | 0.25 | -0.73 | 0.4699 |
| Precipitation (mm) | 92 | 3.12 | 5.38 | 2.26 | -2.71 | 0.0081 |
| Relative Humidity (%) | 90 | 93.63 | 87.03 | -6.60 | 20.85 | <0.0001 |
Table 8.
Paired t-test for daily climatic variables between June and August 2005-2007 and 2020-2024 in Iquitos, Peru. Source: SENAMHI San Roque.
Table 8.
Paired t-test for daily climatic variables between June and August 2005-2007 and 2020-2024 in Iquitos, Peru. Source: SENAMHI San Roque.
| Variable | n | Mean (2005-2007) |
Mean (2020-2024) |
Difference | t | p-value |
| Mean Temperature (°C) | 92 | 27.07 | 26.96 | -0.11 | 0.98 | 0.3277 |
| Max. Temperature (°C) | 92 | 32.04 | 32.15 | 0.12 | -0.88 | 0.3817 |
| Min. Temperature (°C) | 92 | 22.01 | 22.72 | 0.71 | -8.73 | <0.0001 |
| Sunshine Hours | 92 | 5.38 | 3.96 | -1.41 | 5.80 | <0.0001 |
| Precipitation (mm) | 92 | 4.26 | 5.38 | 1.12 | -1.44 | 0.1538 |
| Relative Humidity (%) | 92 | 87.23 | 87.04 | -0.19 | 0.66 | 0.5131 |
Disclaimer/Publisher’s Note: The statements, opinions and data contained in all publications are solely those of the individual author(s) and contributor(s) and not of MDPI and/or the editor(s). MDPI and/or the editor(s) disclaim responsibility for any injury to people or property resulting from any ideas, methods, instructions or products referred to in the content. |
© 2025 by the authors. Licensee MDPI, Basel, Switzerland. This article is an open access article distributed under the terms and conditions of the Creative Commons Attribution (CC BY) license (http://creativecommons.org/licenses/by/4.0/).
Copyright: This open access article is published under a Creative Commons CC BY 4.0 license, which permit the free download, distribution, and reuse, provided that the author and preprint are cited in any reuse.


