1. Introduction
Cowpea Vigna unguiculata (L.) is the fourth most essential oil seed producer and the fifteenth most important and widely cultivated grain crop in the world [
1,
2]. The primary reason cowpea is grown is because they are significant sources of plant protein and energy for both human and animal nutrition, making them an essential plant in the global food security. cowpea is also notable for its capacity to fix atmospheric nitrogen, utilizing part of it for its own development and growth while returning some of it into the soil for the interest of the following crop in rotation with it. Cowpea have a protein value of 23-25%, which is usually equivalent to dry beans 15-24%, chickpeas 20-25%, lentils 9-15%, and spotted sugar beans 9.8%. Despite its capacity to support food security and its potential to solve starvation of the enormous increasing population which is predicted will be 50 billons by 2050, cowpea is ignored and neglected in many countries. Cowpea is sown in Southern African countries for its grain, pods, and leaves. However, it makes a good source of feed for livestock and is essential to agricultural schemes for crop output and exportation. It improves the of soil in the agricultural system by making up for the loss of nitrogen received by cereals. cowpea repairs about 70 and 344 kg per hectare of nitrogen yearly by biological means. Unfortunately, due to poor agronomic systems and insufficient soil fertility farmers are unable to do this. It is a potential food source and foraging species in a conventional tropical lowland climate since it is a drought-resistant and warm-season crop.
There are 6.2 million metric tons of cowpea produced yearly on an approximate 14.5 million ha of cultivated land worldwide. Global cowpea production increased by 7% yearly on average over the last four decades, with annual area growth of 4.5% and productivity growth of 1.9%, with elongated contributing of 60%. Over 80% of African supply is concentrated in West Africa, which also accounts for over 84% of the world’s total production of cowpeas. Although cowpea development has been effective across so many countries and in the key producing regions, very little is documented about its productivity, yield, storage, distribution, significance, and use. Cowpea yields have consistently lagged behind global standards and have regularly not reached their full potential. Inadequate information and inconsistent performance are signs that small-scale farming predominates in the production of cowpea. The inaccessibility to advanced technologies, such as improved varieties and the crop and pest management strategies that go along with them, inputs like fertilizers (both mineral and biofertilizers), seeds of improved varieties, and inadequate input and output market access limit the production and productivity of cowpea. In view of their excellent ability in utilizing soil water, they can tolerate drought stress and recover quickly throughout the vegetative development phase by re-watering. Competition is a continuous process that is influenced by the number of resources obtained by various species as well as their ability in utilizing those resources for biomass. Competition might well be influenced by rates of growth and other aspects of plant density and function. Understanding the factors that influence crop, weed development, and competition interaction could contribute to the emergence of production strategies that optimize crop development by reducing weed competition. Mpumalanga’s yearly rainfall is unusually low, and severe agricultural water shortages. Additionally, in moderate areas, soil water is the major limiting factor.
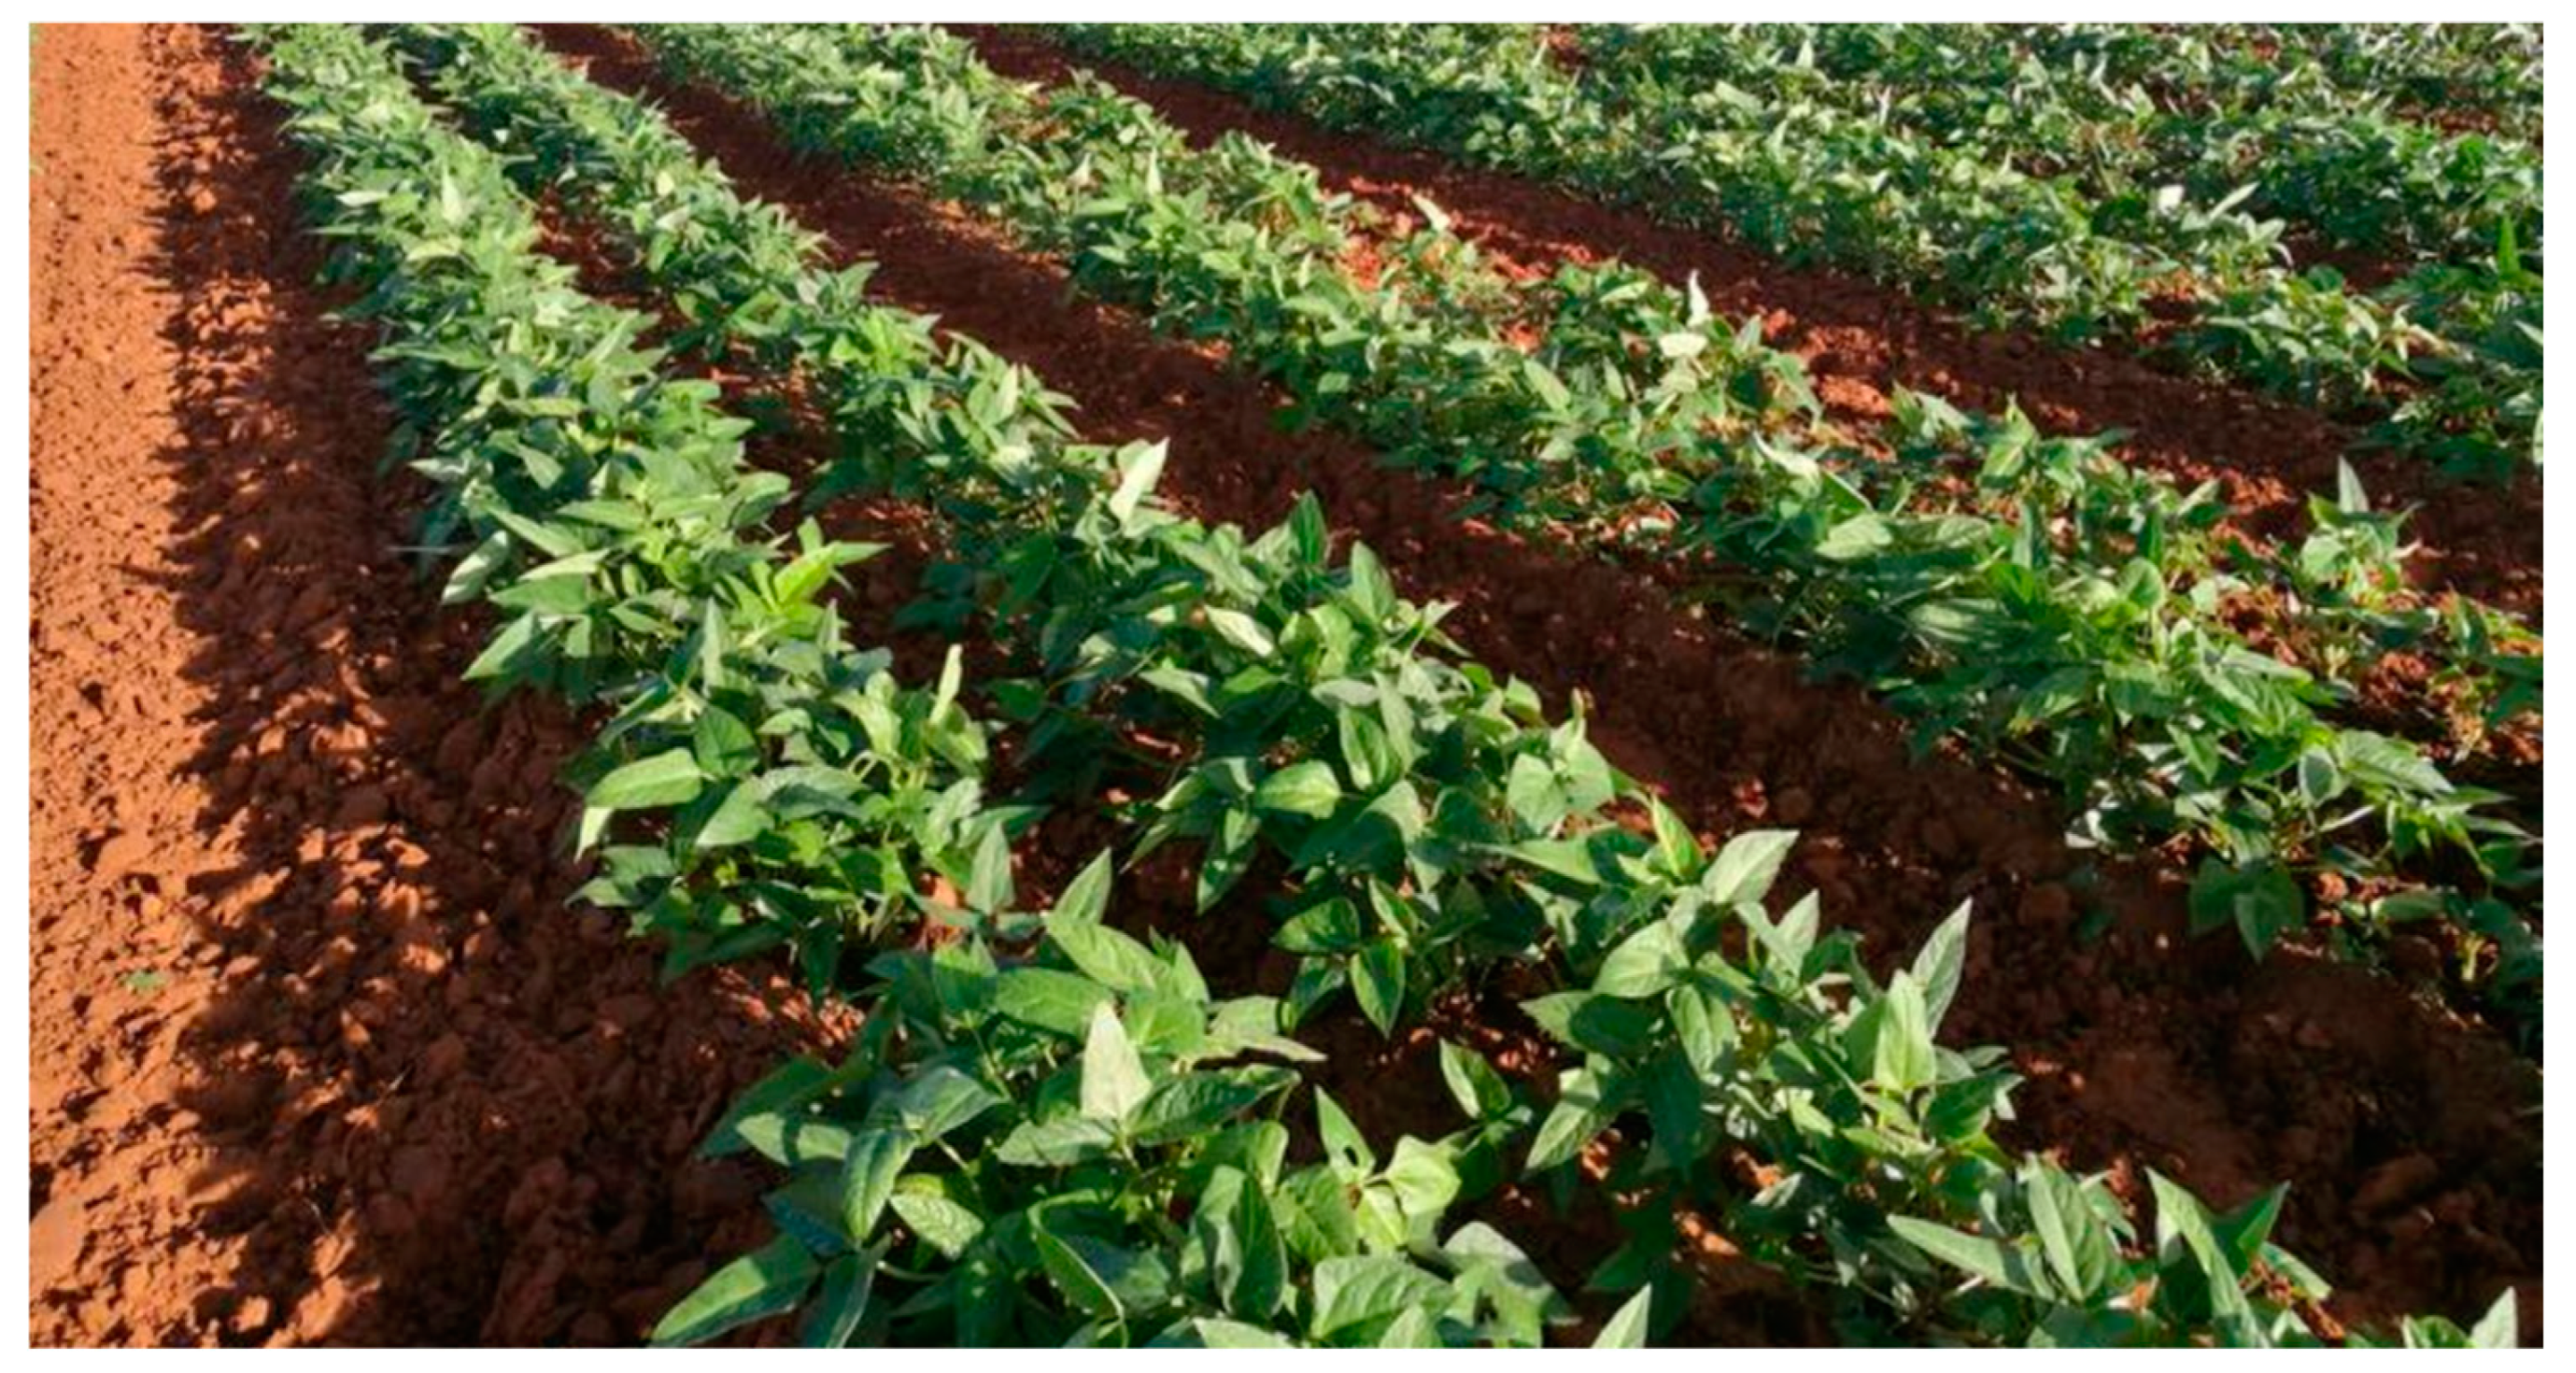
Interestingly, cowpea is a summer-grown plant that grows together in the field in various areas of the country. Cowpea is largely-known for its ability to tolerate water scarcity. A typical example of Cowpeas in South African soil is demonstrated in
Figure 1.
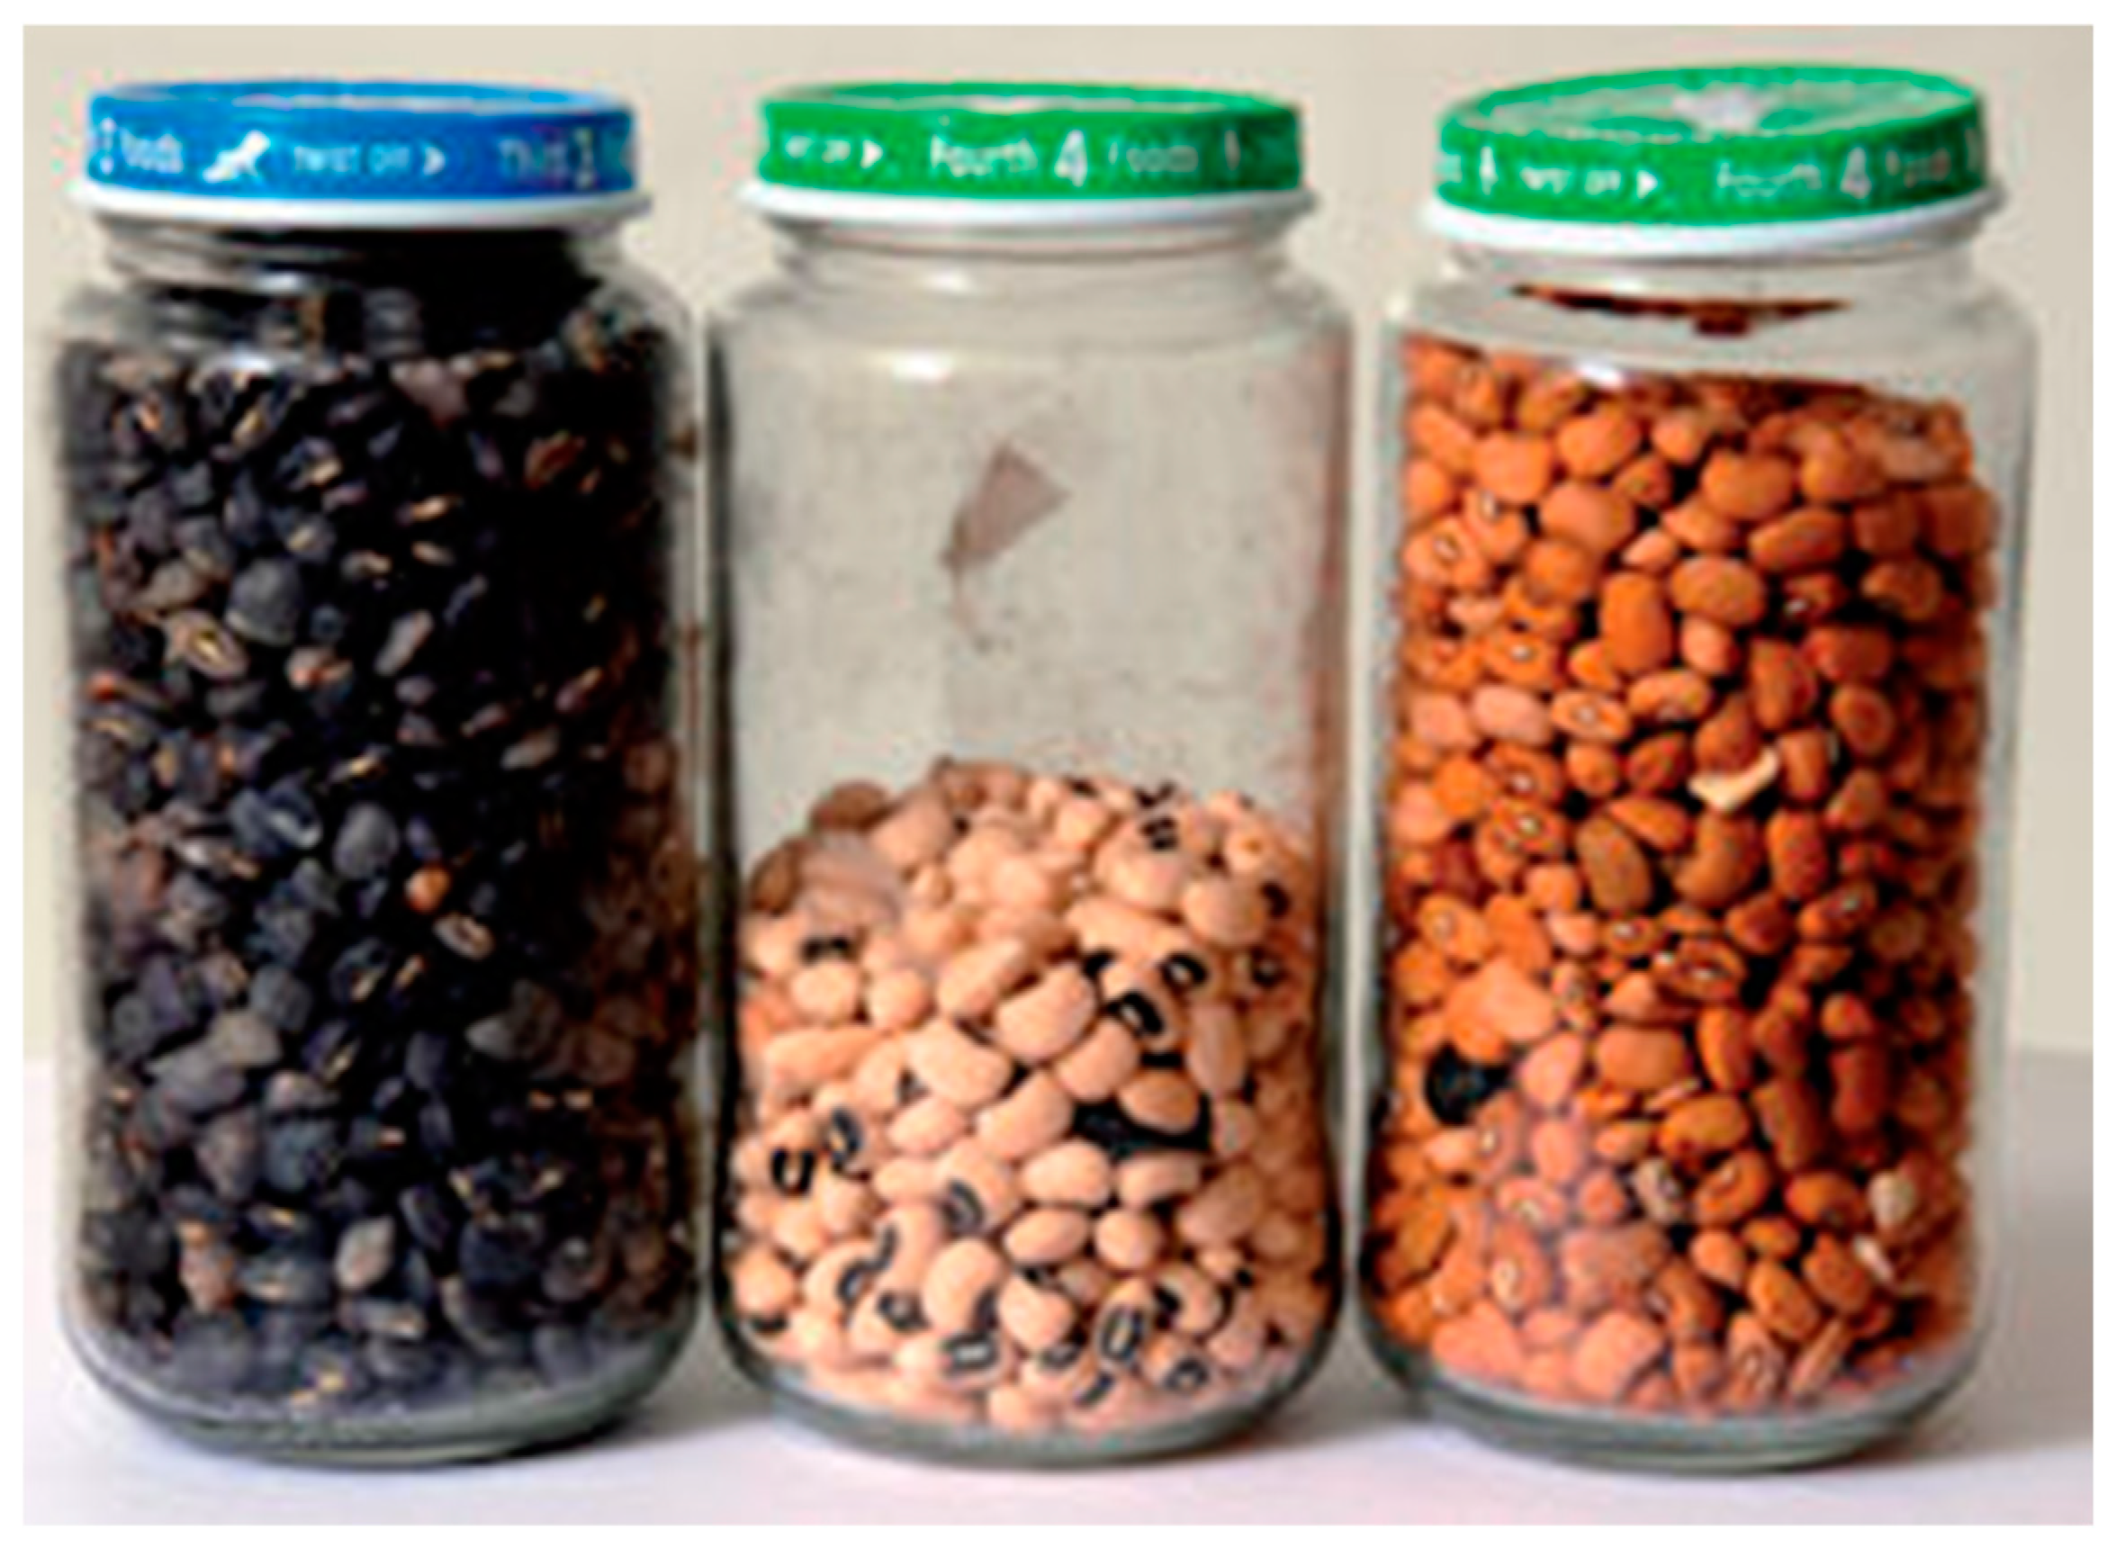
The seeds generally yielded in South Africa are illustrated in
Figure 2.
As a result, the current study was conducted to determine cowpea growth and performance under different water strain treatments and the growth, survival and development of cowpea cultivated separately or in combination for various periods.
2. Materials and Methods
2.1. Description of the Study
Various activities were carried out during the course of this study, such as site selection, soil sample prior to planting for detailed characterization, field trial setup, and subsequent follow-up tasks. From March to June 2021, three-pot tests were conducted on a farm-based in Mpumalanga has a yearly average temperature of 28 °C, with a sandy loam soil, and receives about 667 mm of rain annual, (25.4365°S, 30.9818°E), one in a greenhouse environment and the other two in the outdoors. A 30.7 % of silt soil, clay loam soil with 57.6% clay, 12% sand by weight, organic matter composition [2.03 % (w/w)], a 12.25 % (w/v) of CaCO3, phosphorous (0.025 mg g-1) with a pH of 8.3 was used as well. However, the Lowveld Agricultural Corporation contributed to the cowpea seeds.
2.2. Description of Experimental Design and Layout
At the trial sites previously mentioned in the description site, five (5) cowpea varieties were planted using a randomized complete block design (RCDB) with three replications. The experimental units were three-row plots that were 5 m long, 0.75 m wide, and had an intra-row spacing of 0.30 m, resulting in a population density of 44.444 plants/ha at a density of one plant per stand. Three to four seeds were sown per hill, however they had to be thinned to two plants after three weeks before seedling emergence. 10 kg of lime ammonium nitrate (LAN) will be administered per hectare in order to encourage great root growth and remove any potential confounding effects of nitrogen deficit. From late vegetative growth until pod physiological maturity, regular 80 ml/15L application of the broad-spectrum insecticide karate will be made to combat weeds and insects.
2.3. Experiment: Effect of Water Stress on Growth of Cowpea Grown in Pure Stands
The purpose of this experiment was to understand how various levels of water strain affected the development of cowpeas. Containers with a width of 25 cm and a depth of 22 cm were occupied with uniformly mixed field soil. Seed sowing was done on March 25, 2021 in all containers and further thinned after three weeks to one plant seedling to reduce competition like sunlight, moisture, and nutrients. However, the same spatial configuration was maintained for mutually samples from various treatments. Seedlings were propagated in an untreated greenhouse with an average day/night temperature of 30/21° C.
Experiments were set up in a randomized complete block design (RCDB), including three water stress treatments as plots treated, all of which were replicated four times. Seedlings were immersed in water as a standard treatment. Interestingly, stress that occurred during the vegetative phase persisted during blooming, and there was no water stress. Moisture was controlled in stress applications till the tensiometer confirmed 65% and the plants began to show wilting signs, after which water was given to the soil surface. The practice of drying and re-watering proceeded till the crop fully developed. Furthermore, plants in the treated stress condition were irrigated daily with an equal quantity of water.
Each crop variety height, leaf number, and length were recorded, as well as the number of branches, and age-related number of leaves, beginning 26 days following emergence and continuing throughout harvesting. Temperature at the greenhouse was maintained on a daily bases. Prior to crop harvest, data on growth characteristics, such as leaf length, plant height, number of branches, chlorophyll content index, and the number of trifoliate leaves per plant, were collected on a two weeks interval. Data on the pod mass, total plants per pod, pod length, seed yield, seeds per pod, mass fodder, and haulm weight were also collected during the harvest.
On June 15, 2021, all plants in each container were acquired by cautiously uprooting dry cowpea plants, and trembling the collected plants to eradicate freely adhered soils to the roots. Collected samples were transported in a disinfected brown envelop to the Biology Laboratory in an cooler box. Gathered samples were kept at -20°C until further analysis.
2.4. Statistical Analysis
The analysis of variance (ANOVA) system were used to analyze all of the acquired data. The generalized linear mixed model was used to analyze greenhouse data (growth and yield) (GLMM). The least significant difference (LSD) at a 5% probability level was used to determine whether there is a significant difference between the treatment means.
3. Results
This section presents results on cowpeas growth at various phases of water stresses. The results indicate regression models developed for various periods of water stress including vegetative to maturity, flower to maturity and excellent water through the season. At each period of water stress, regression models of the leaf area and shoot dry weight are developed. The growth phase of cowpeas at the vegetative to maturity period is observed in the next subsection. The LA and SDW of the cowpea are observed and regression models are developed.
3.1. Vegetative to Maturity Period
Leaf Area (LA)
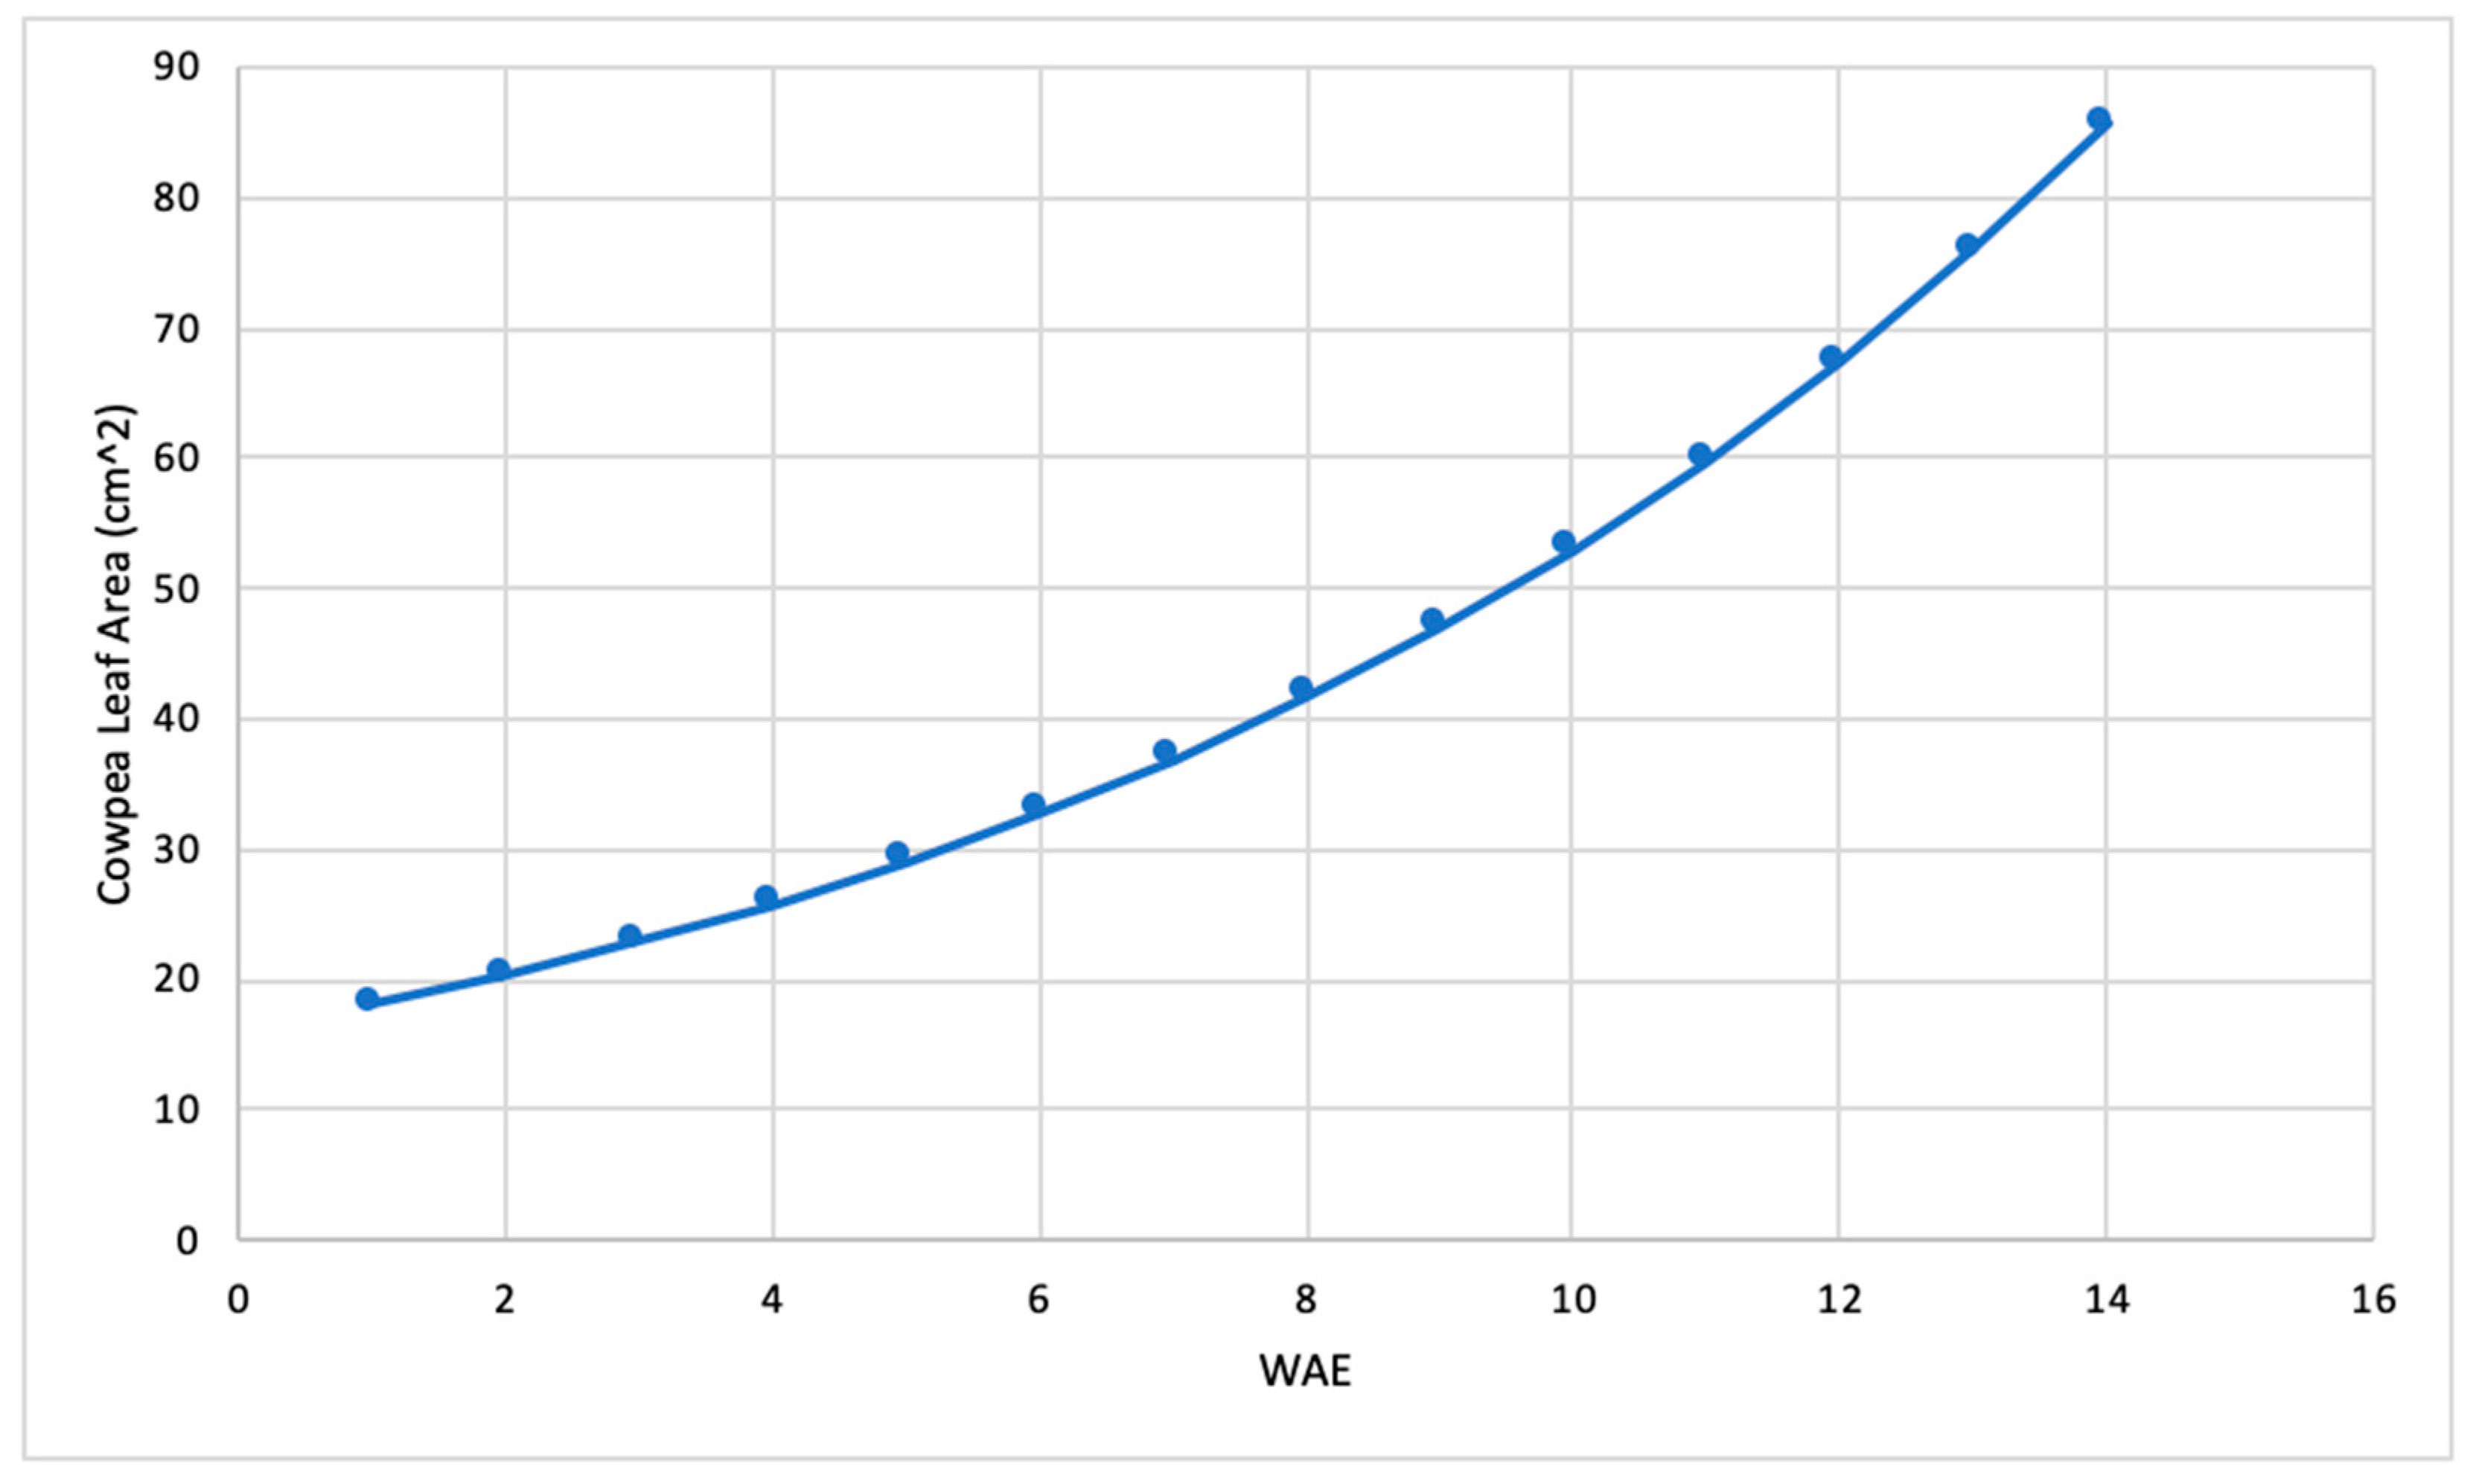
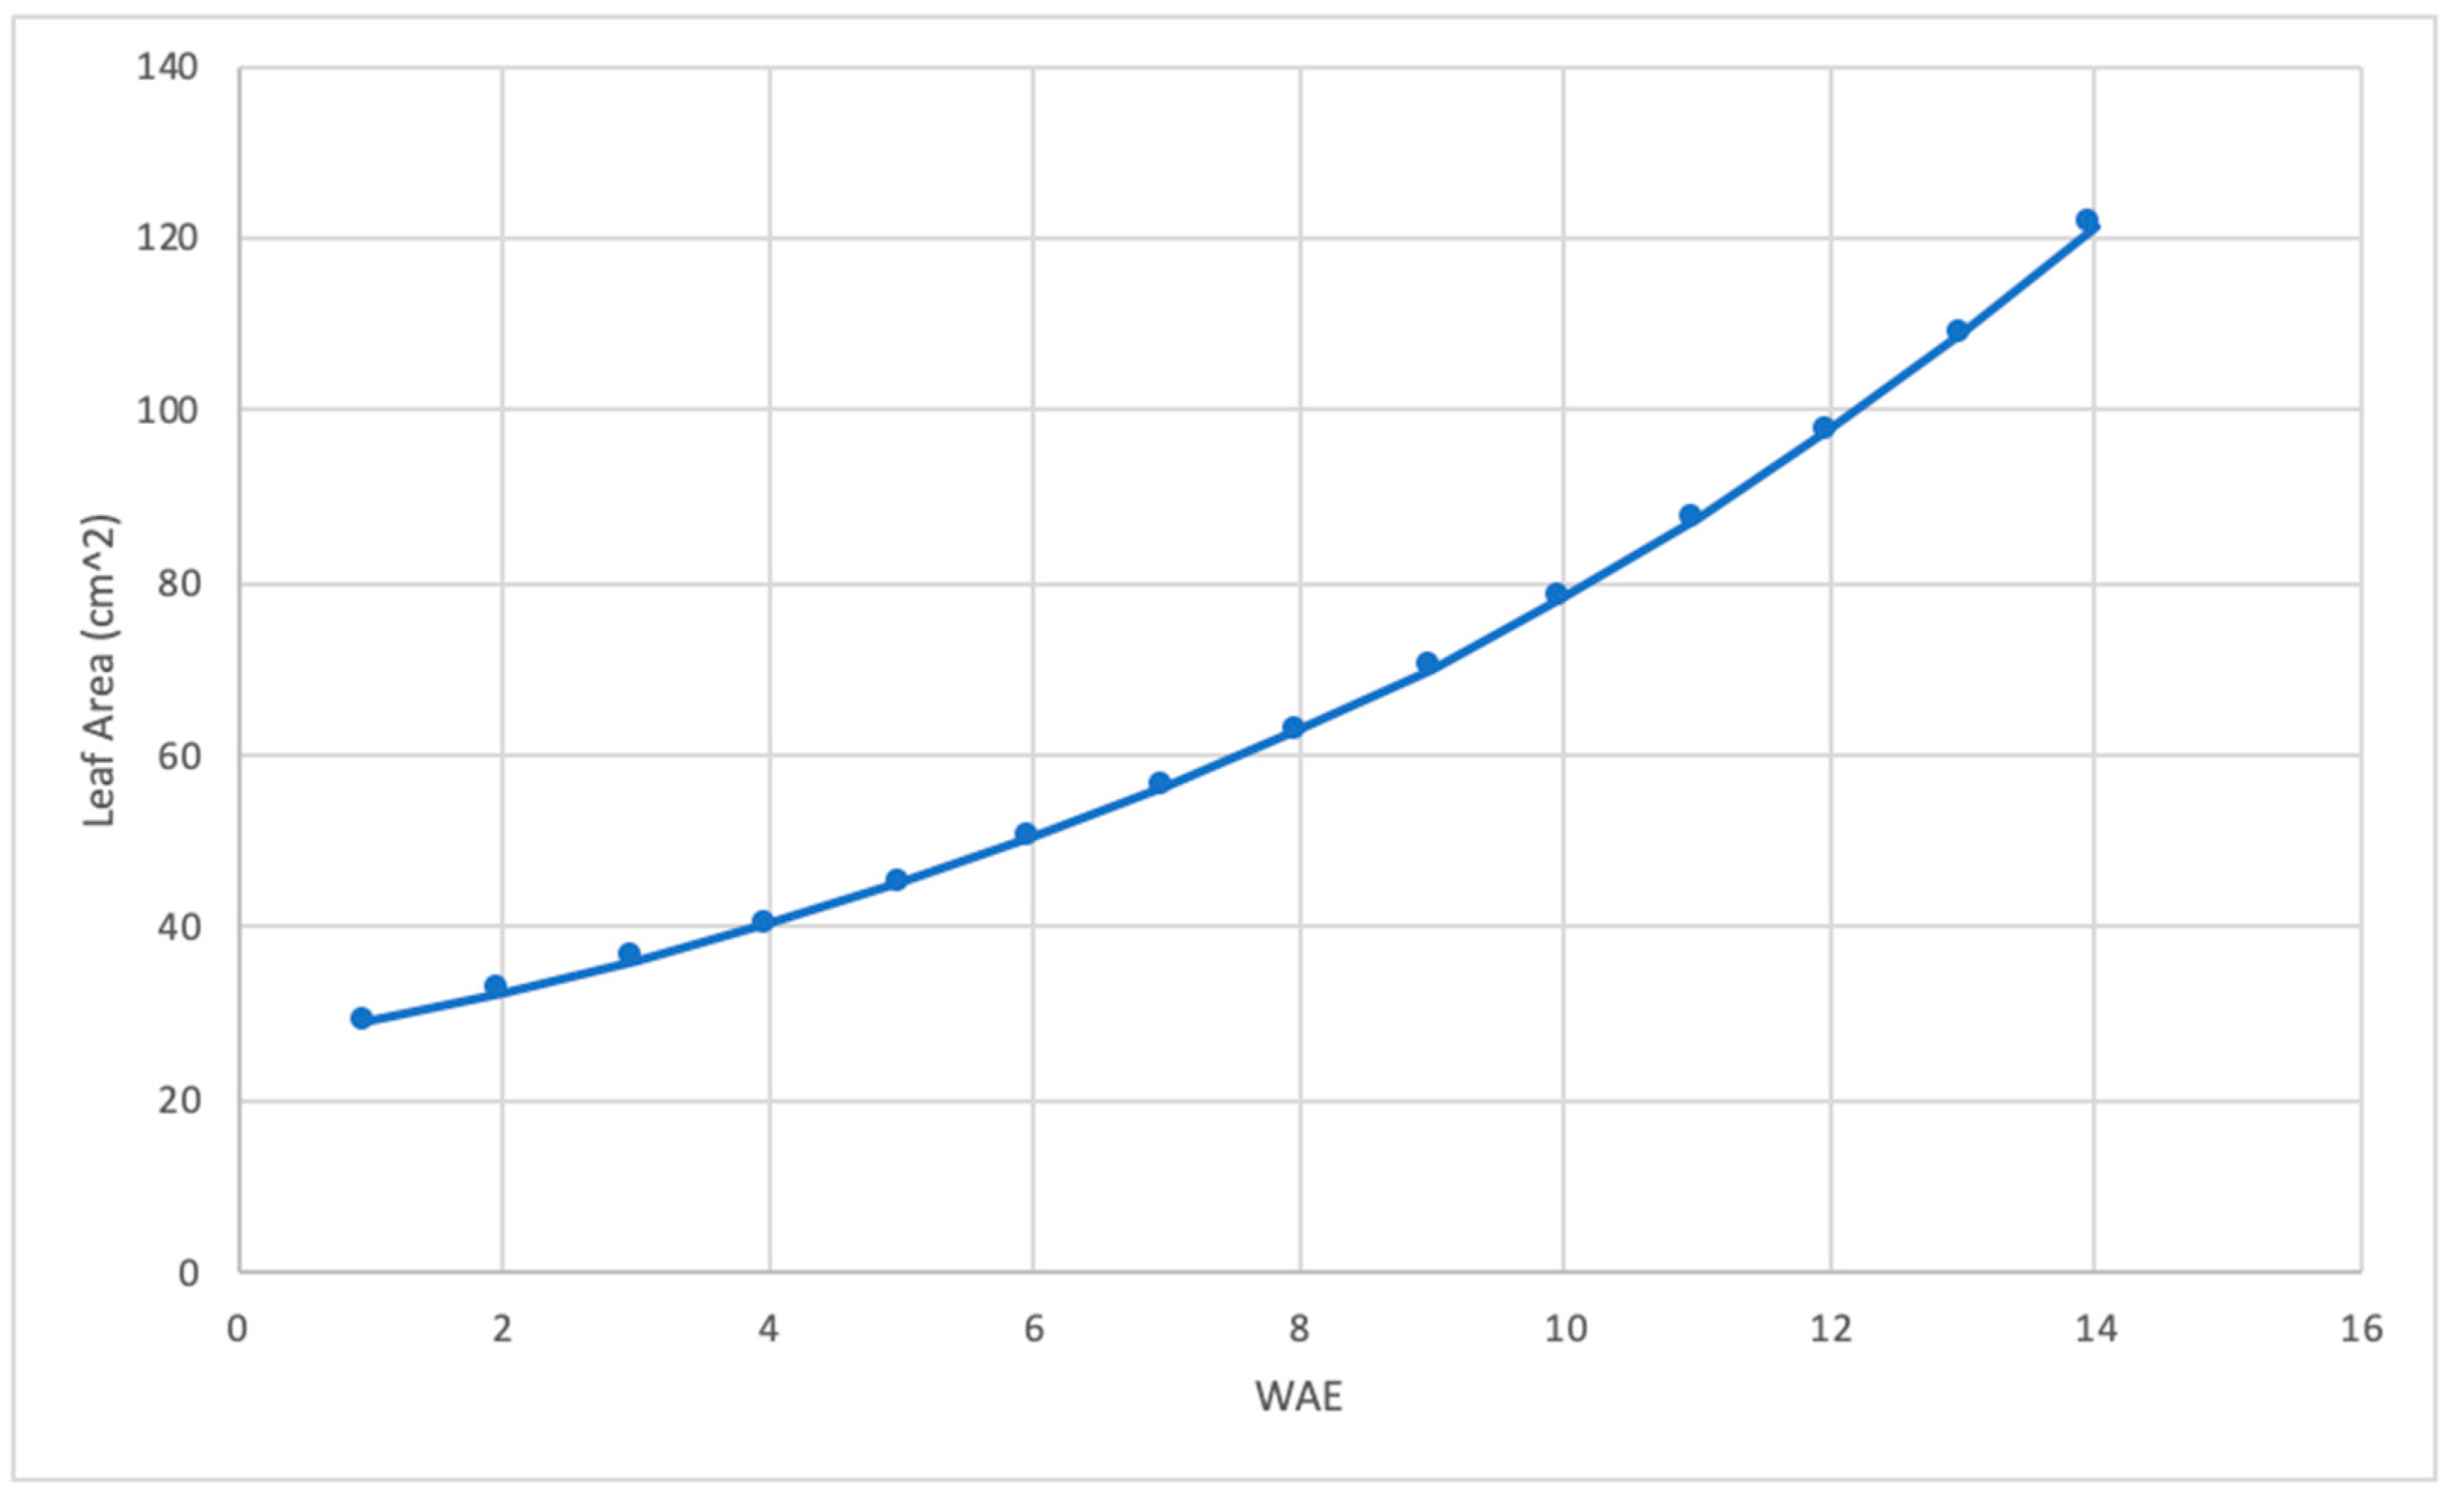
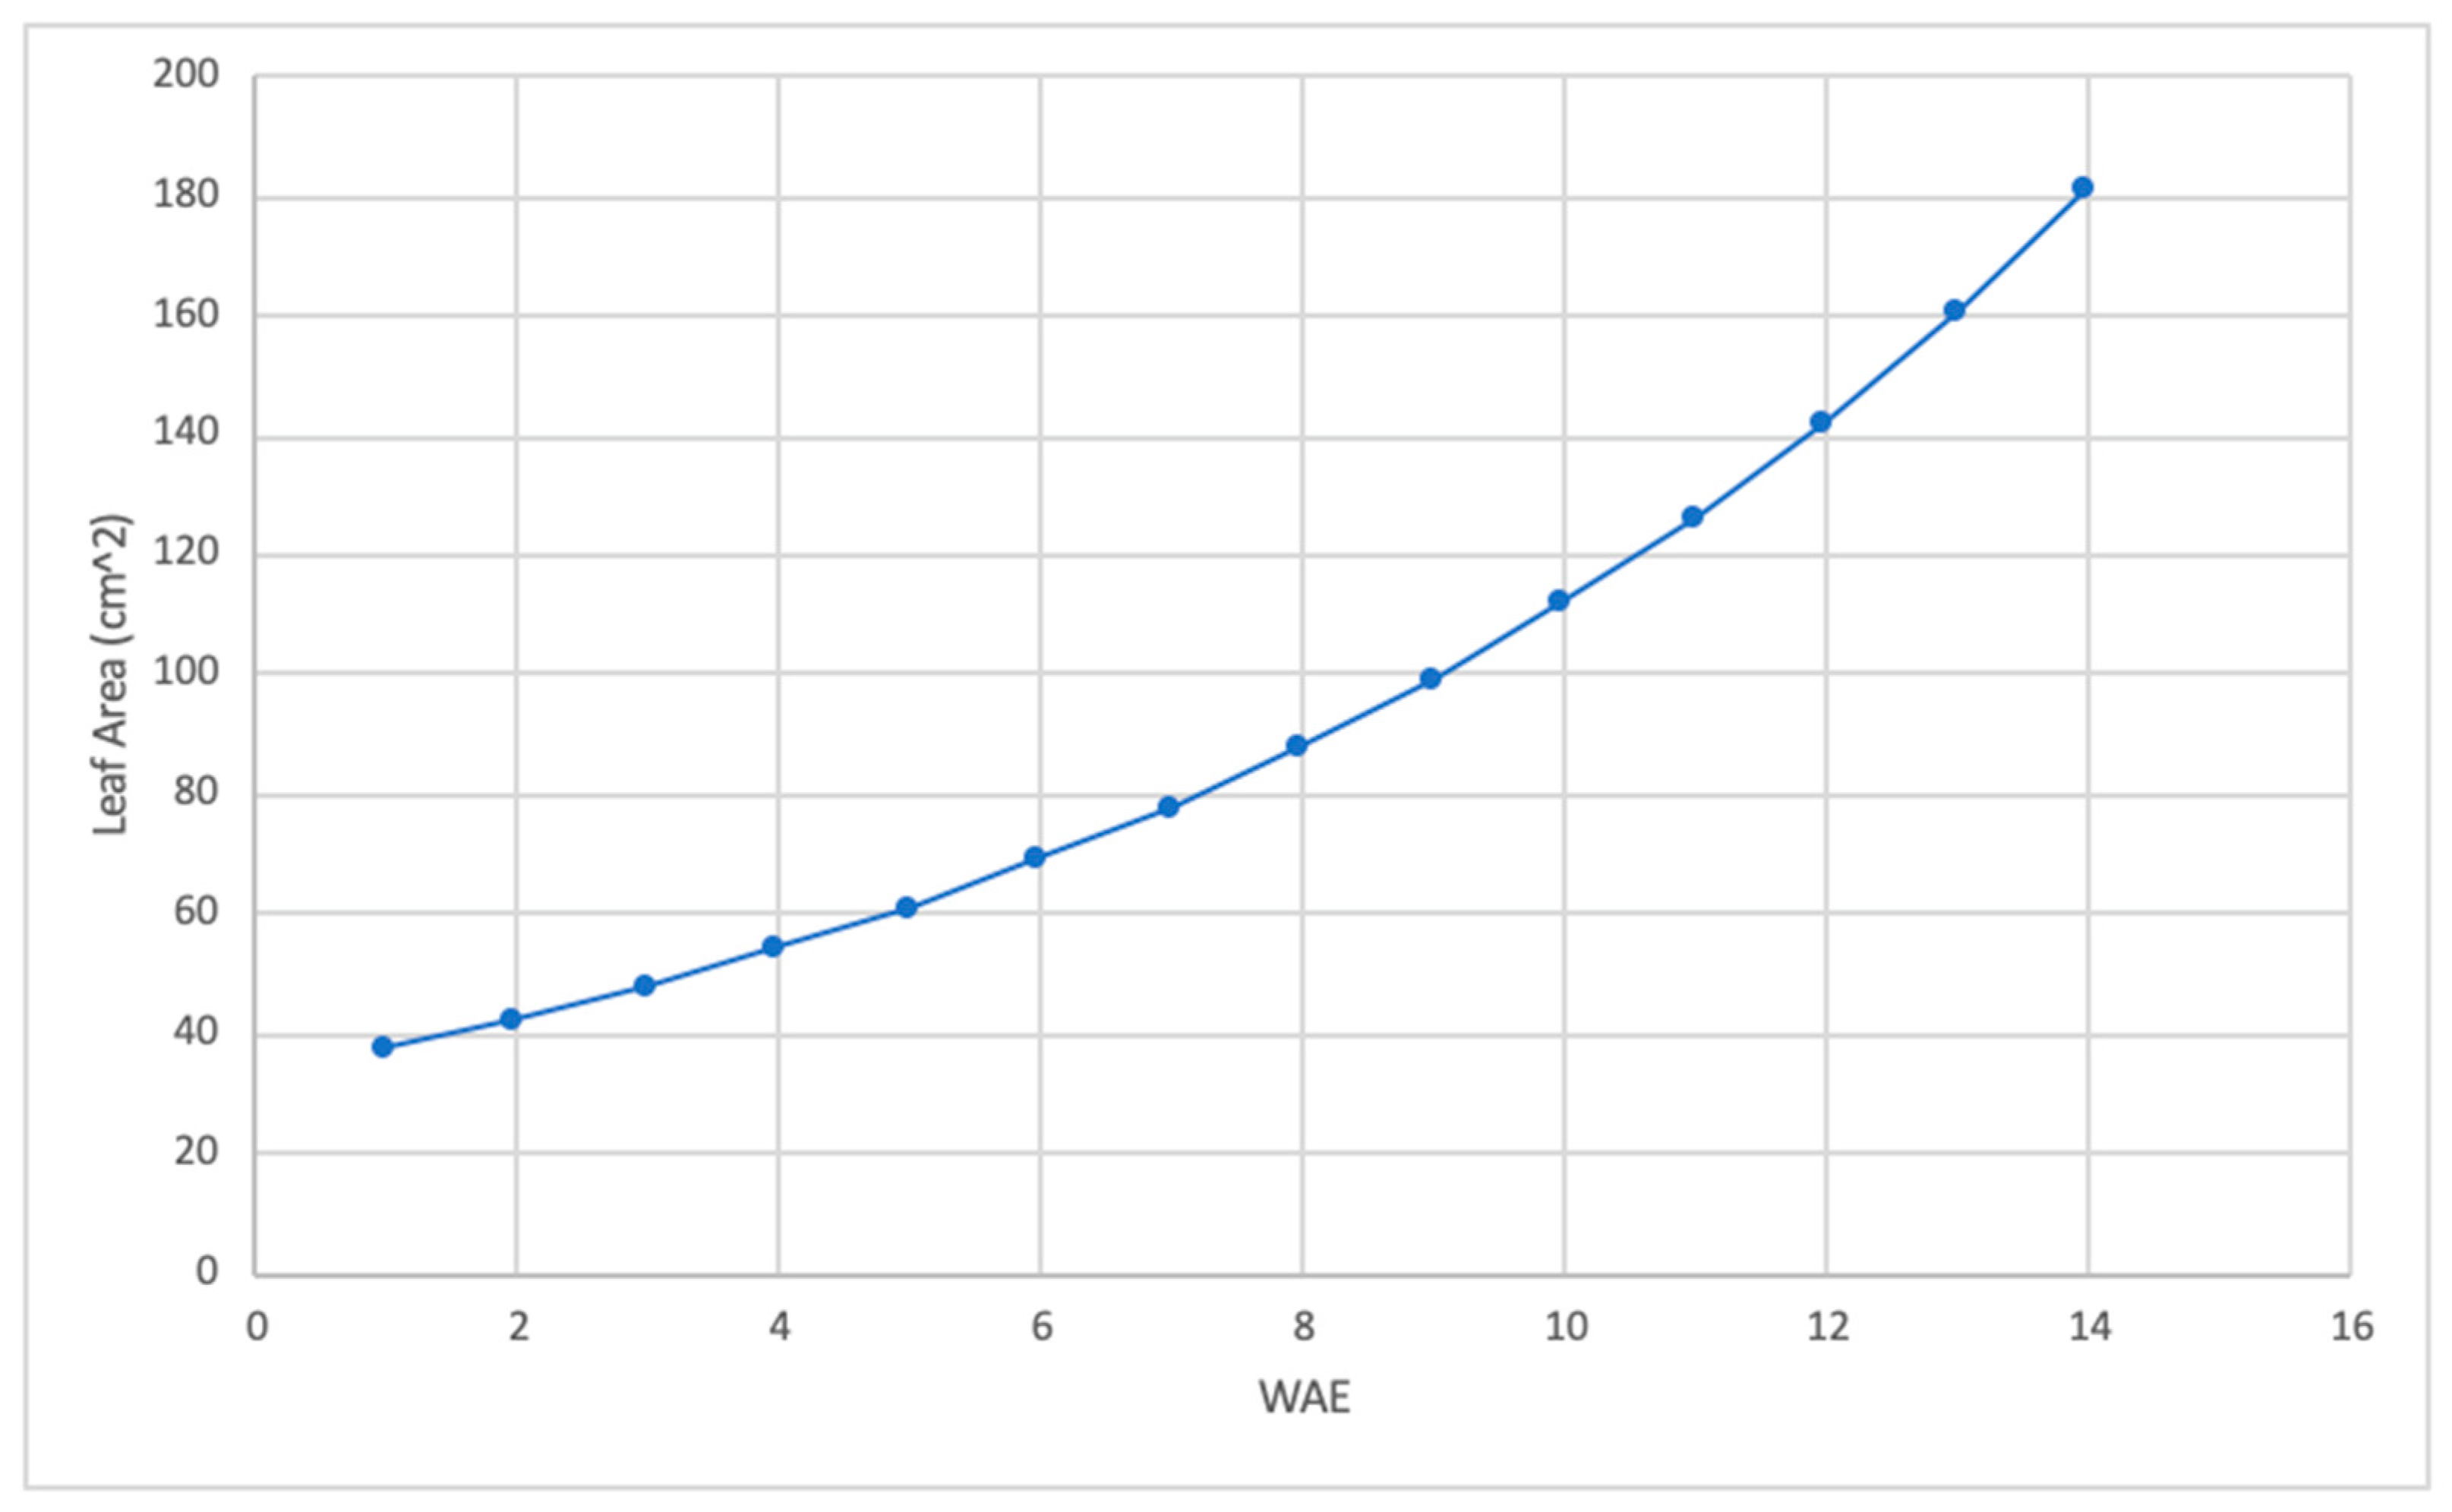
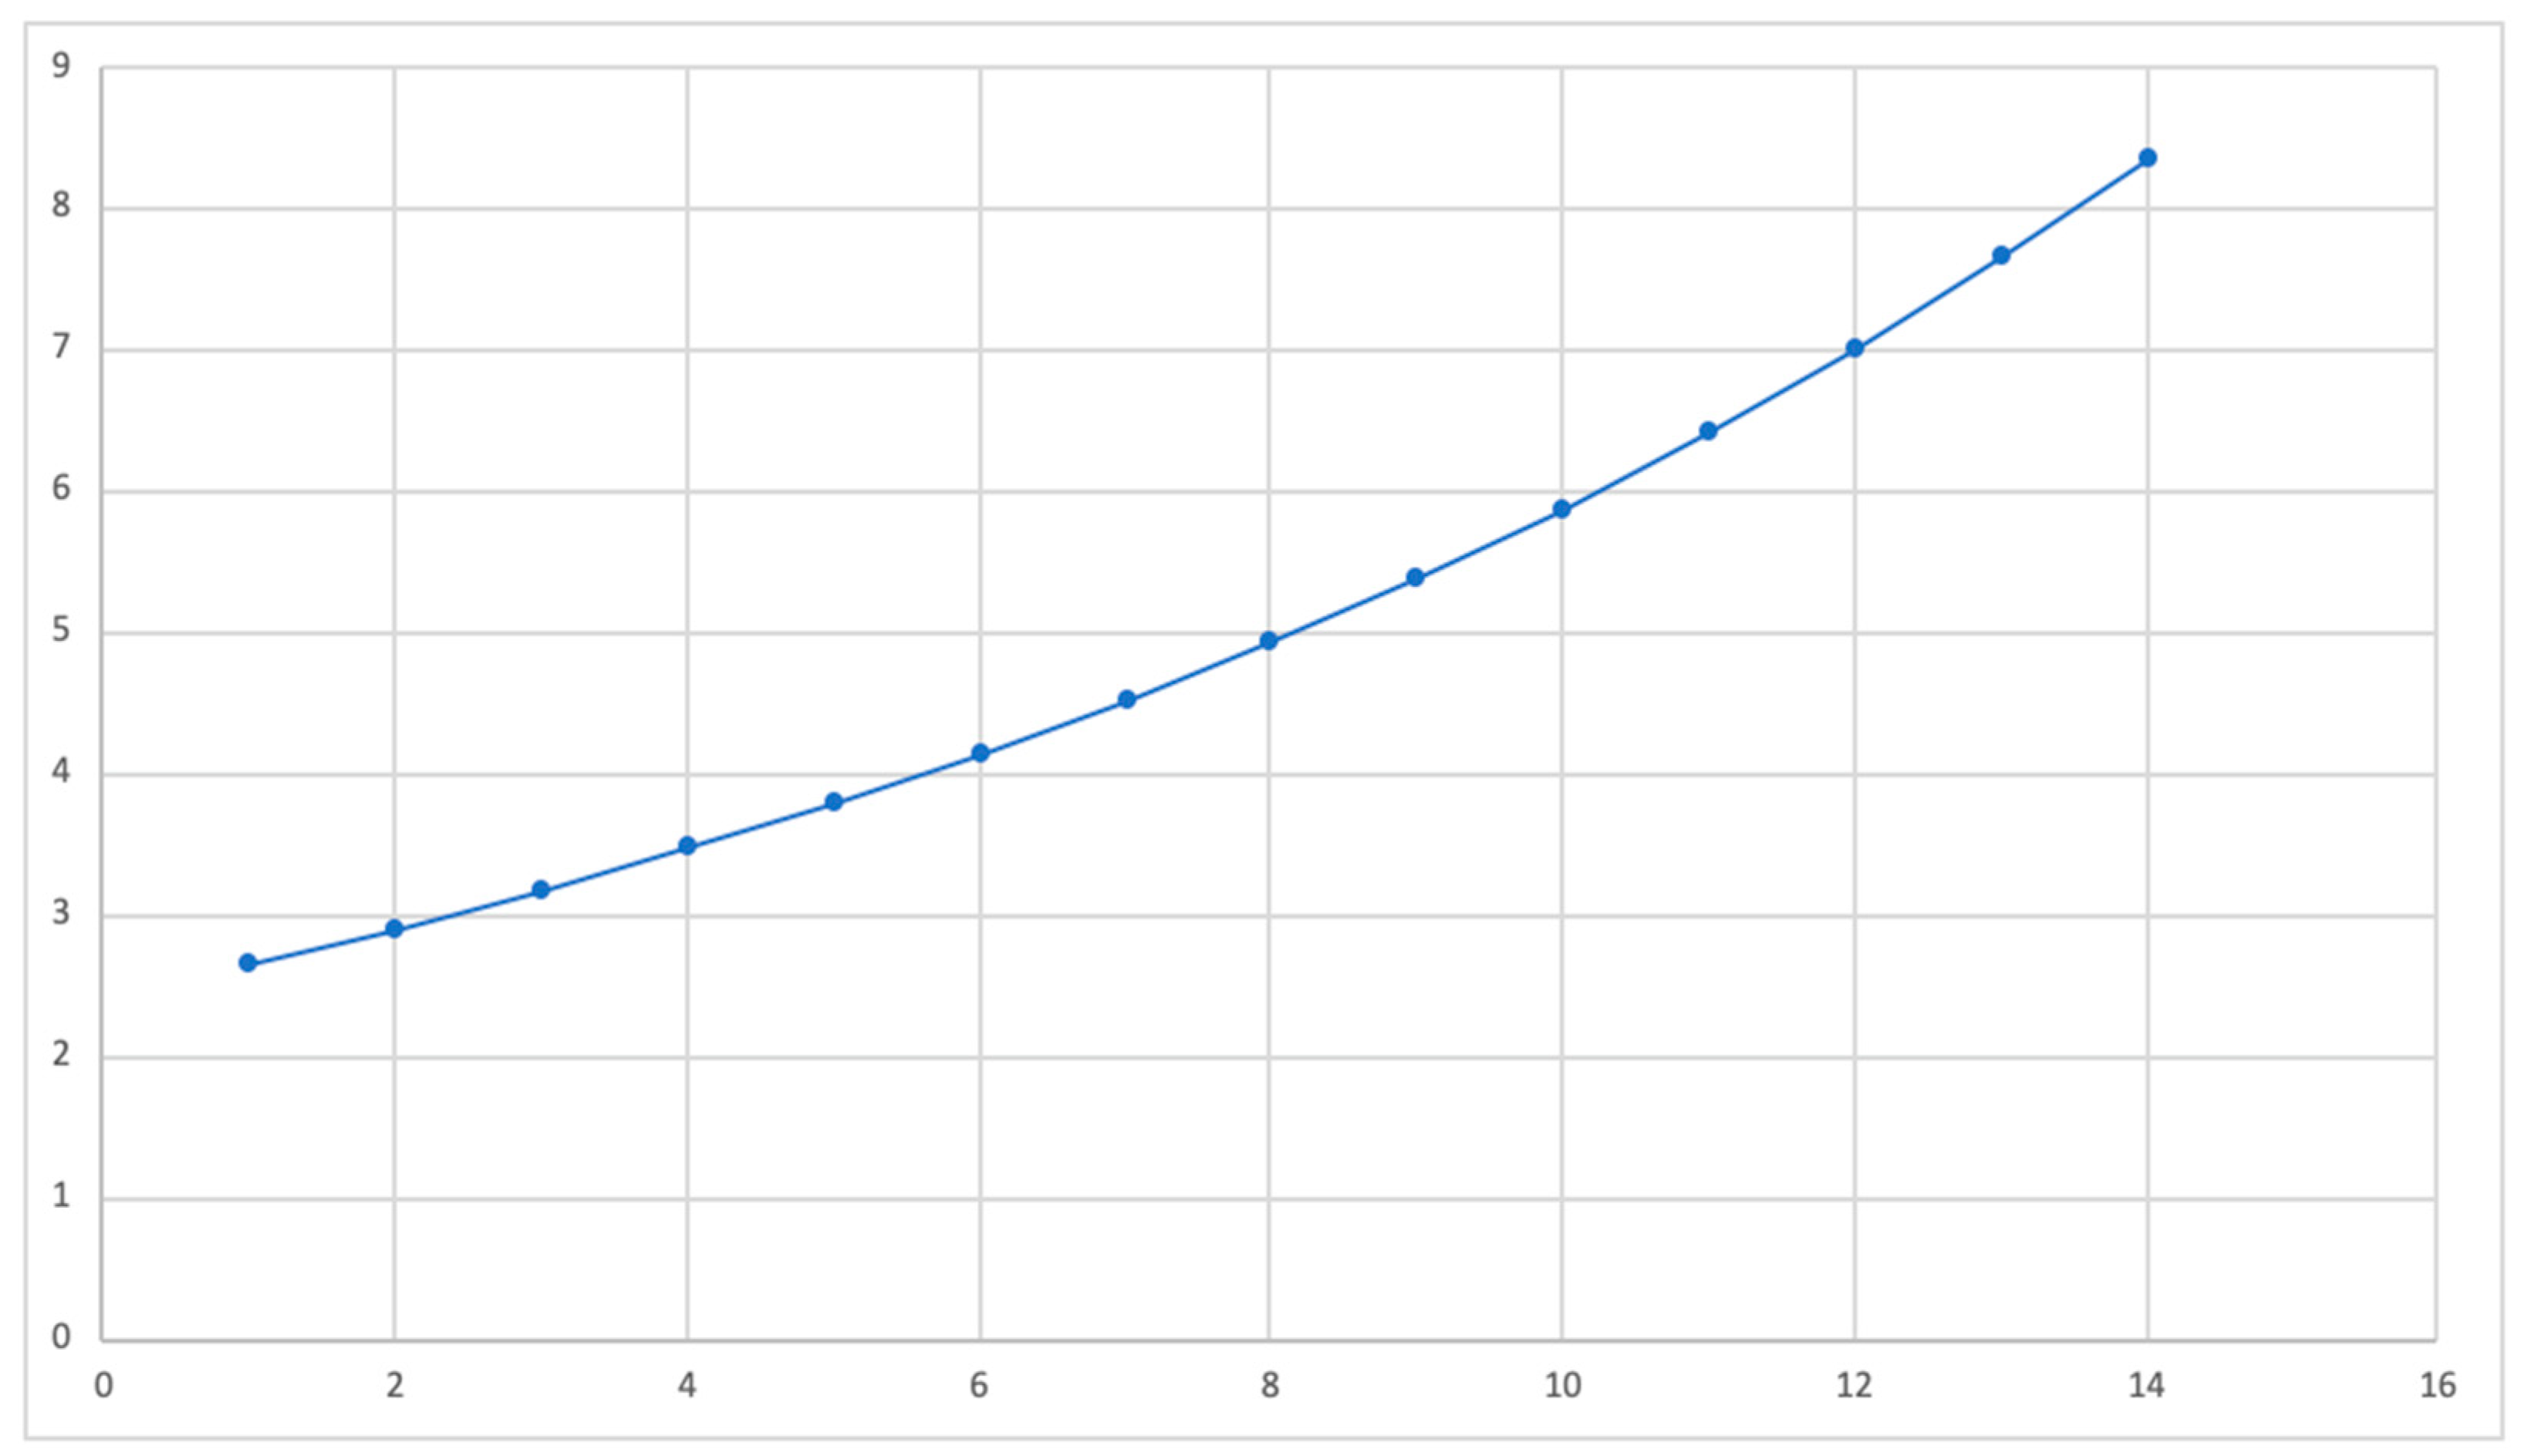
Cowpea dry shoot weight decreased at a modest rate up to a concentration of 8 seedlings per container whenever water stress occurred earlier in the vegetative phase and remained unchanged afterwards. Shoot dry weight dropped dramatically with concentration whenever water stress began at flowering and there was no water pressure as a result of a reduction in leaf surface relative productivity growth. Furthermore, extended miserable water stress gives rise to the strength of intraspecific competition. Cowpea leaf length and breadth and leaf surface had a linear correlation that was independent of moisture stress and seedling frequency. The experimental data of the leaf area measured over 14 weeks is presented in
Figure 3.
3.2. NB: Week After Emergence (WAE)
Cowpea pod and seed production were influenced by both low moisture and compaction stresses. When contrasted to water stress that began at the plant developmental and blooming stages, capsule dry weight improved about 5.5 and 1.76 times, whereas the amount of seeds/plant improved by 7 and 4 times, accordingly. Seed frequency was inversely associated with cowpea capsule dry mass and quantity of seeds per plant. At low plant rates, the inequalities in moisture stress impact were higher. The proposed regression model for the LA under the vegetative to maturity period is tabulated in
Table 1.
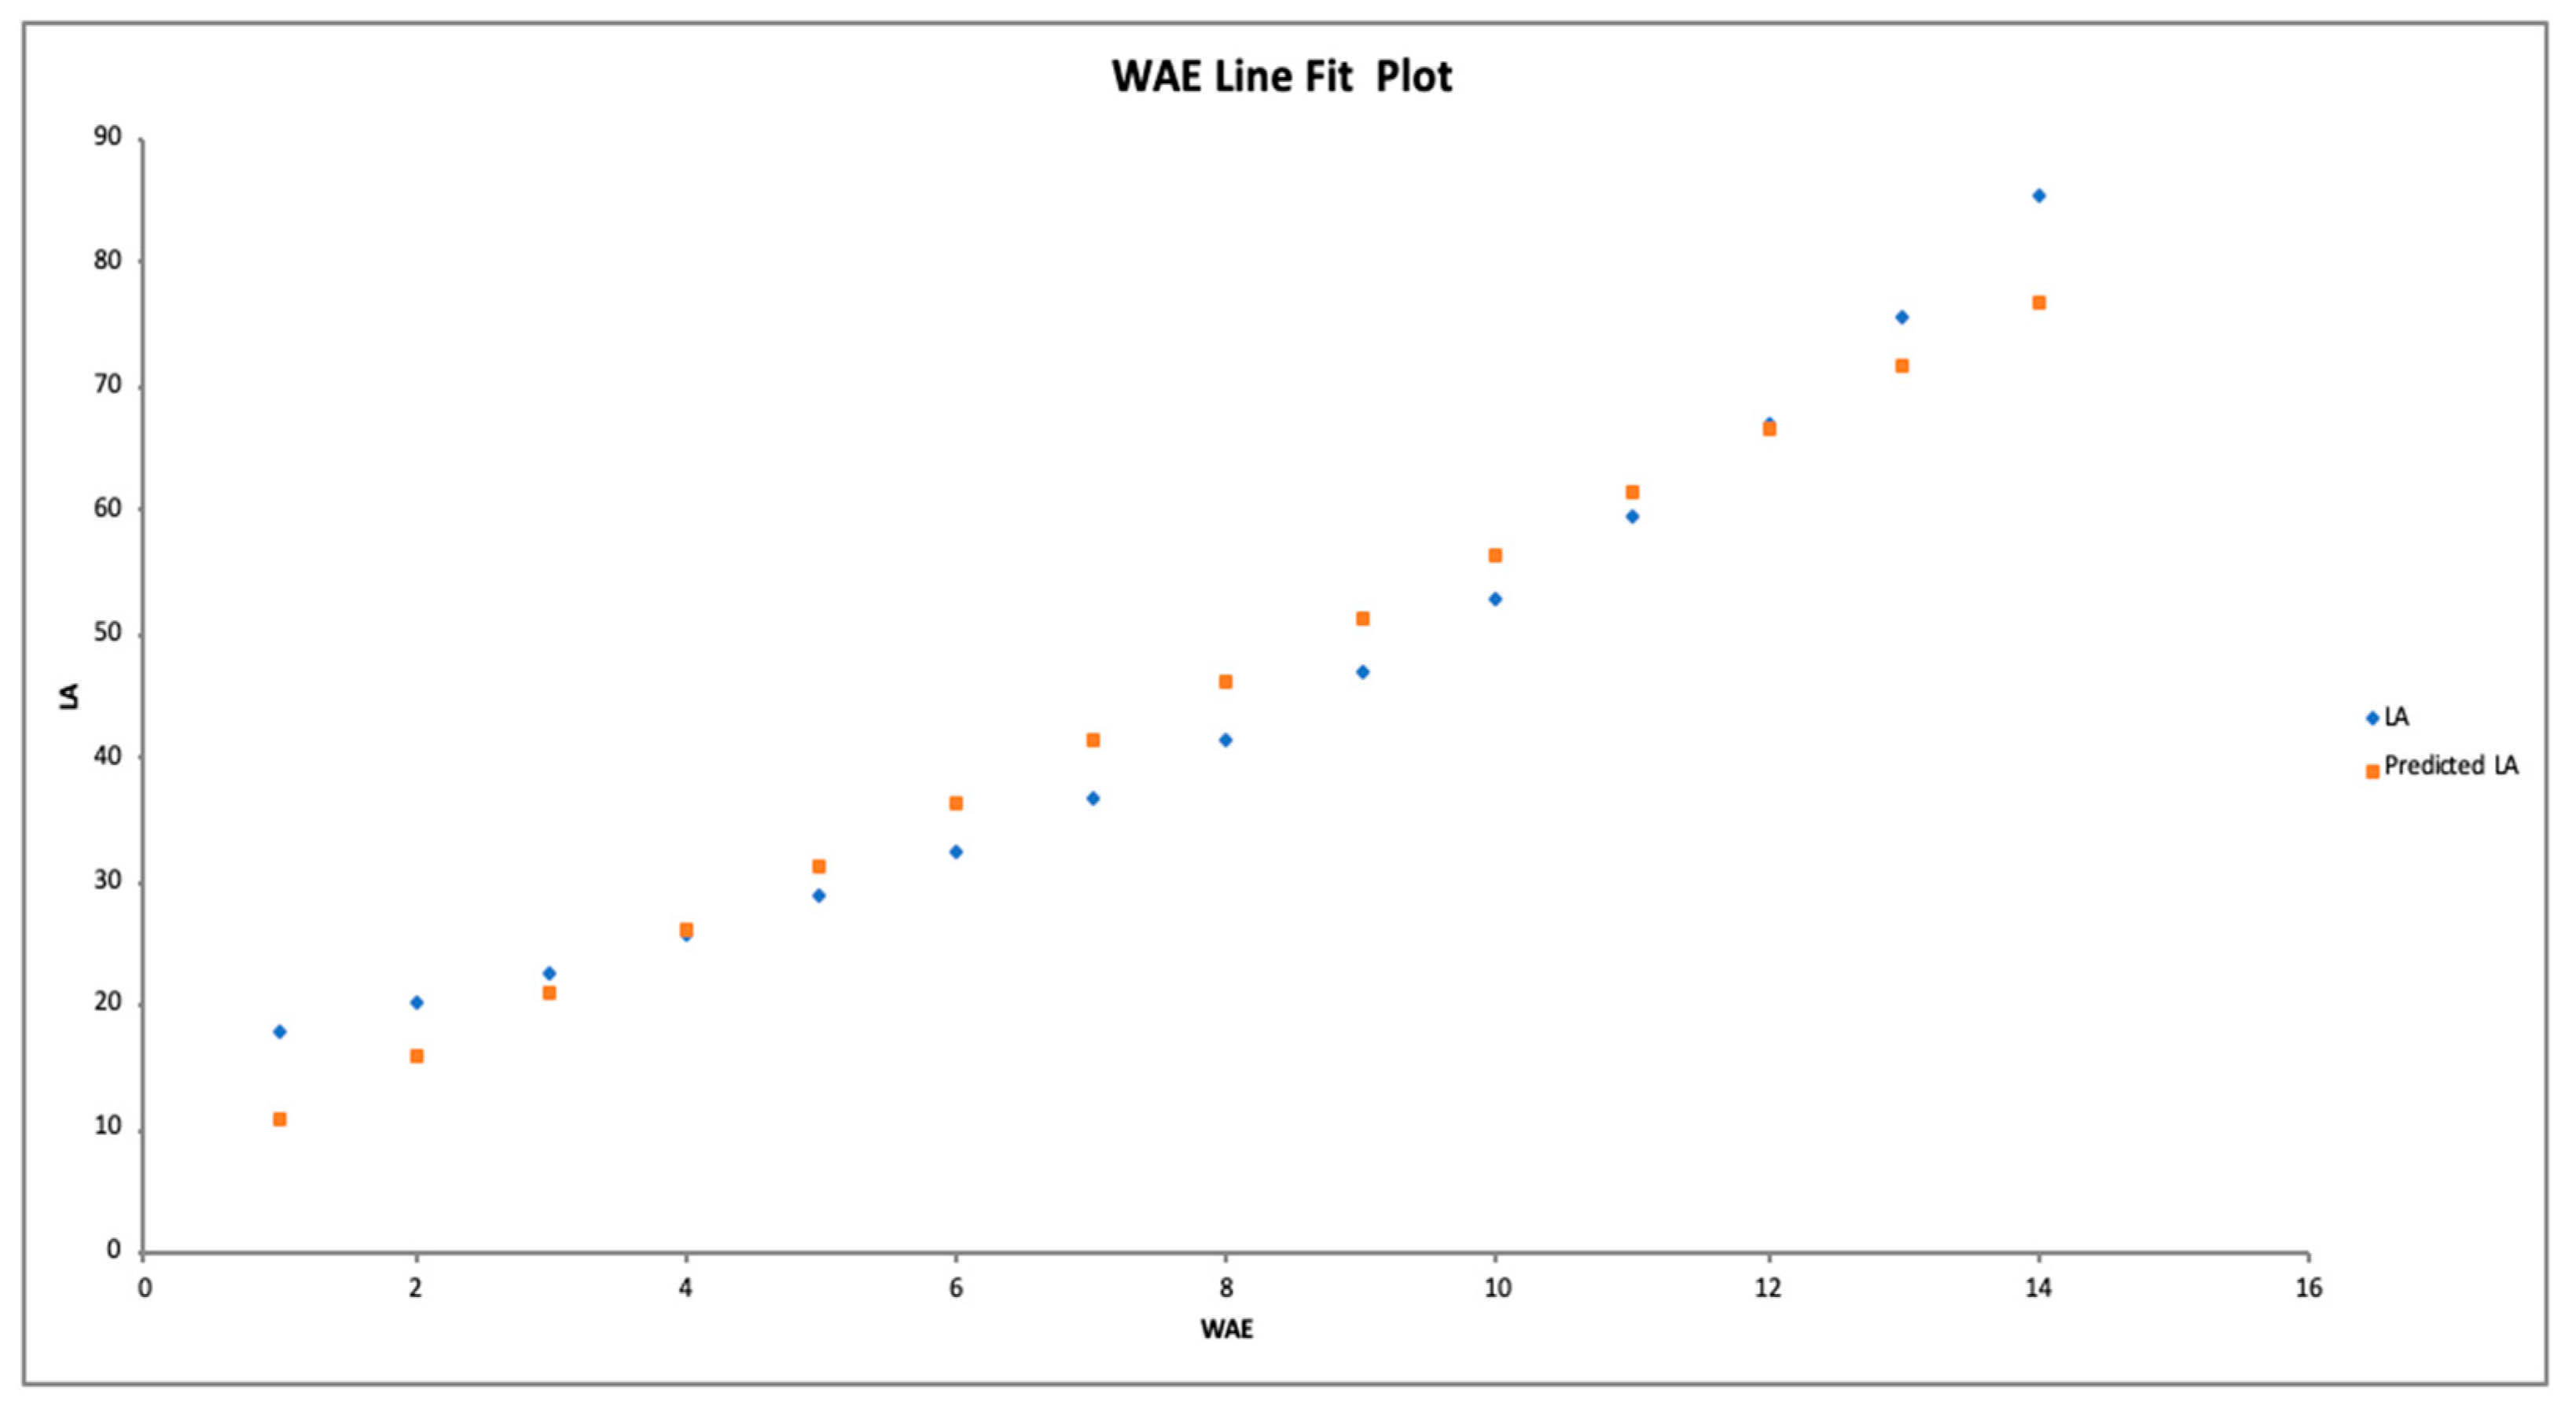
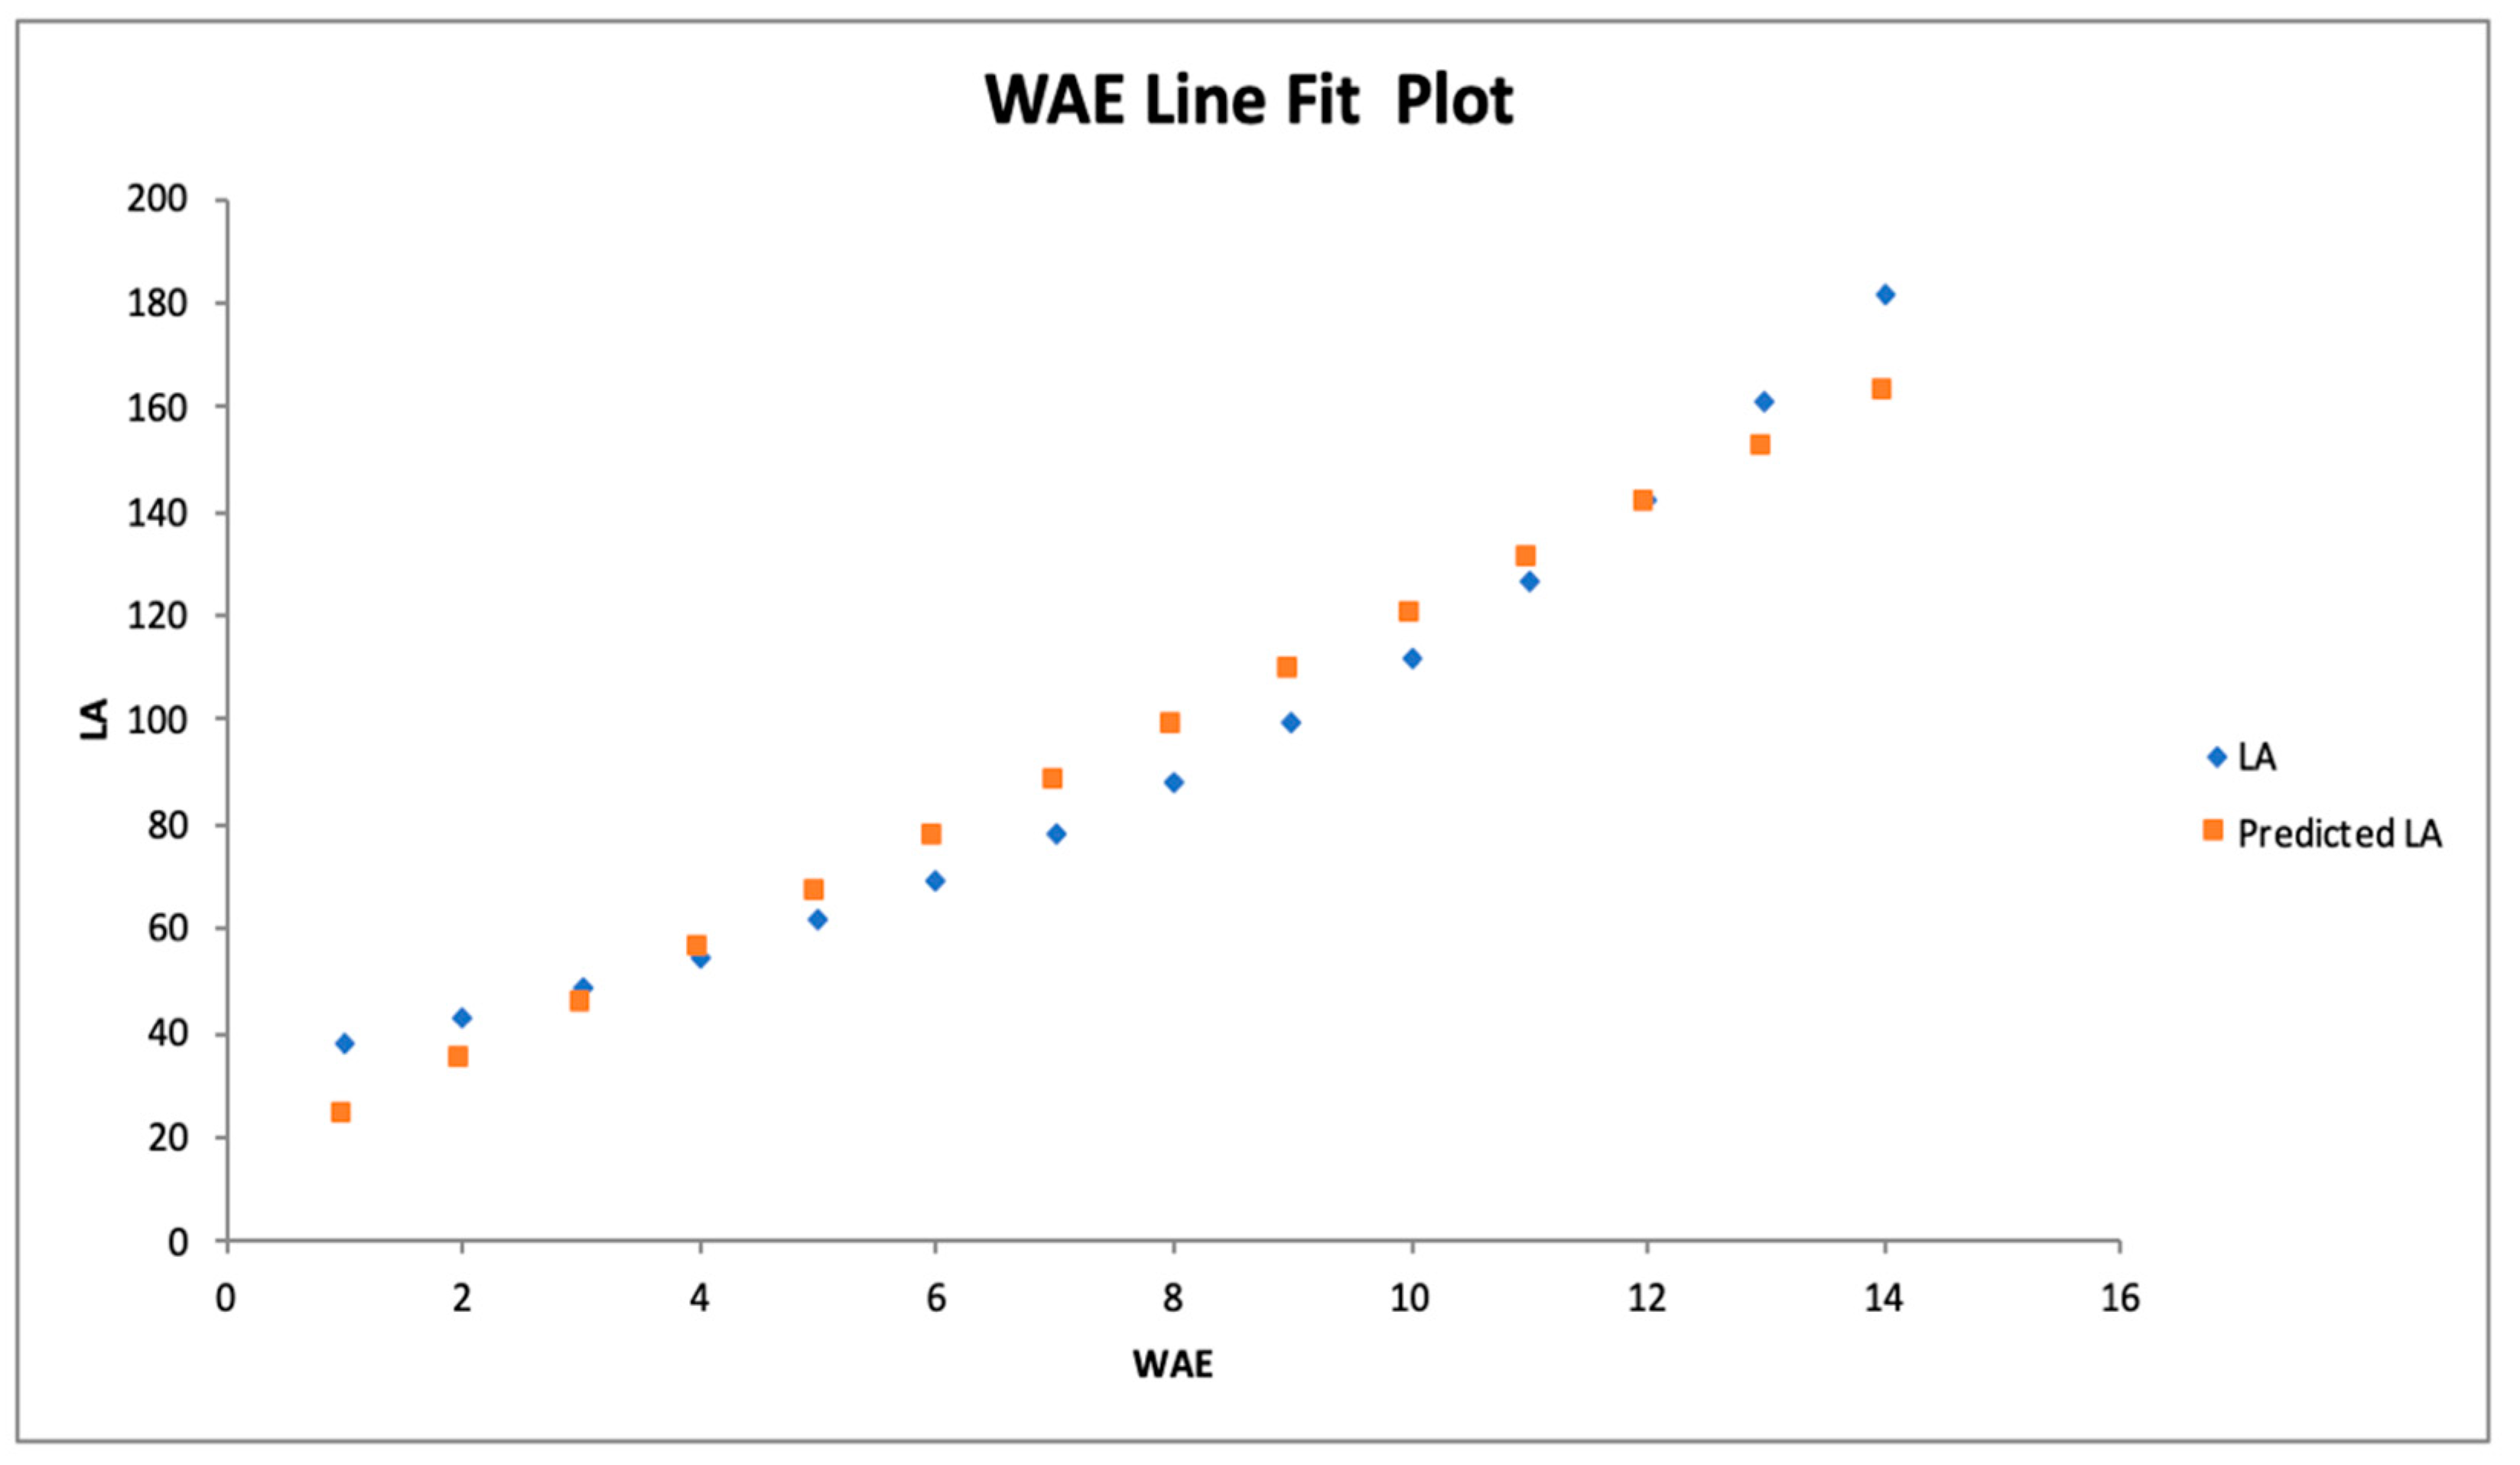
The correlation coefficient is observed to be 0.957, signifying a significant correlation between the practical data and the predicted values. Consequently, the p-value is observed to be less than 0.05 (0.038) which implies that the data is statistically significant. It specifies convincing substantiation in contradiction to the null hypothesis, given that there is less than a 5% probability the null is correct. Therefore, for the Cowpea Leaf Area, the null hypothesis is rejected.
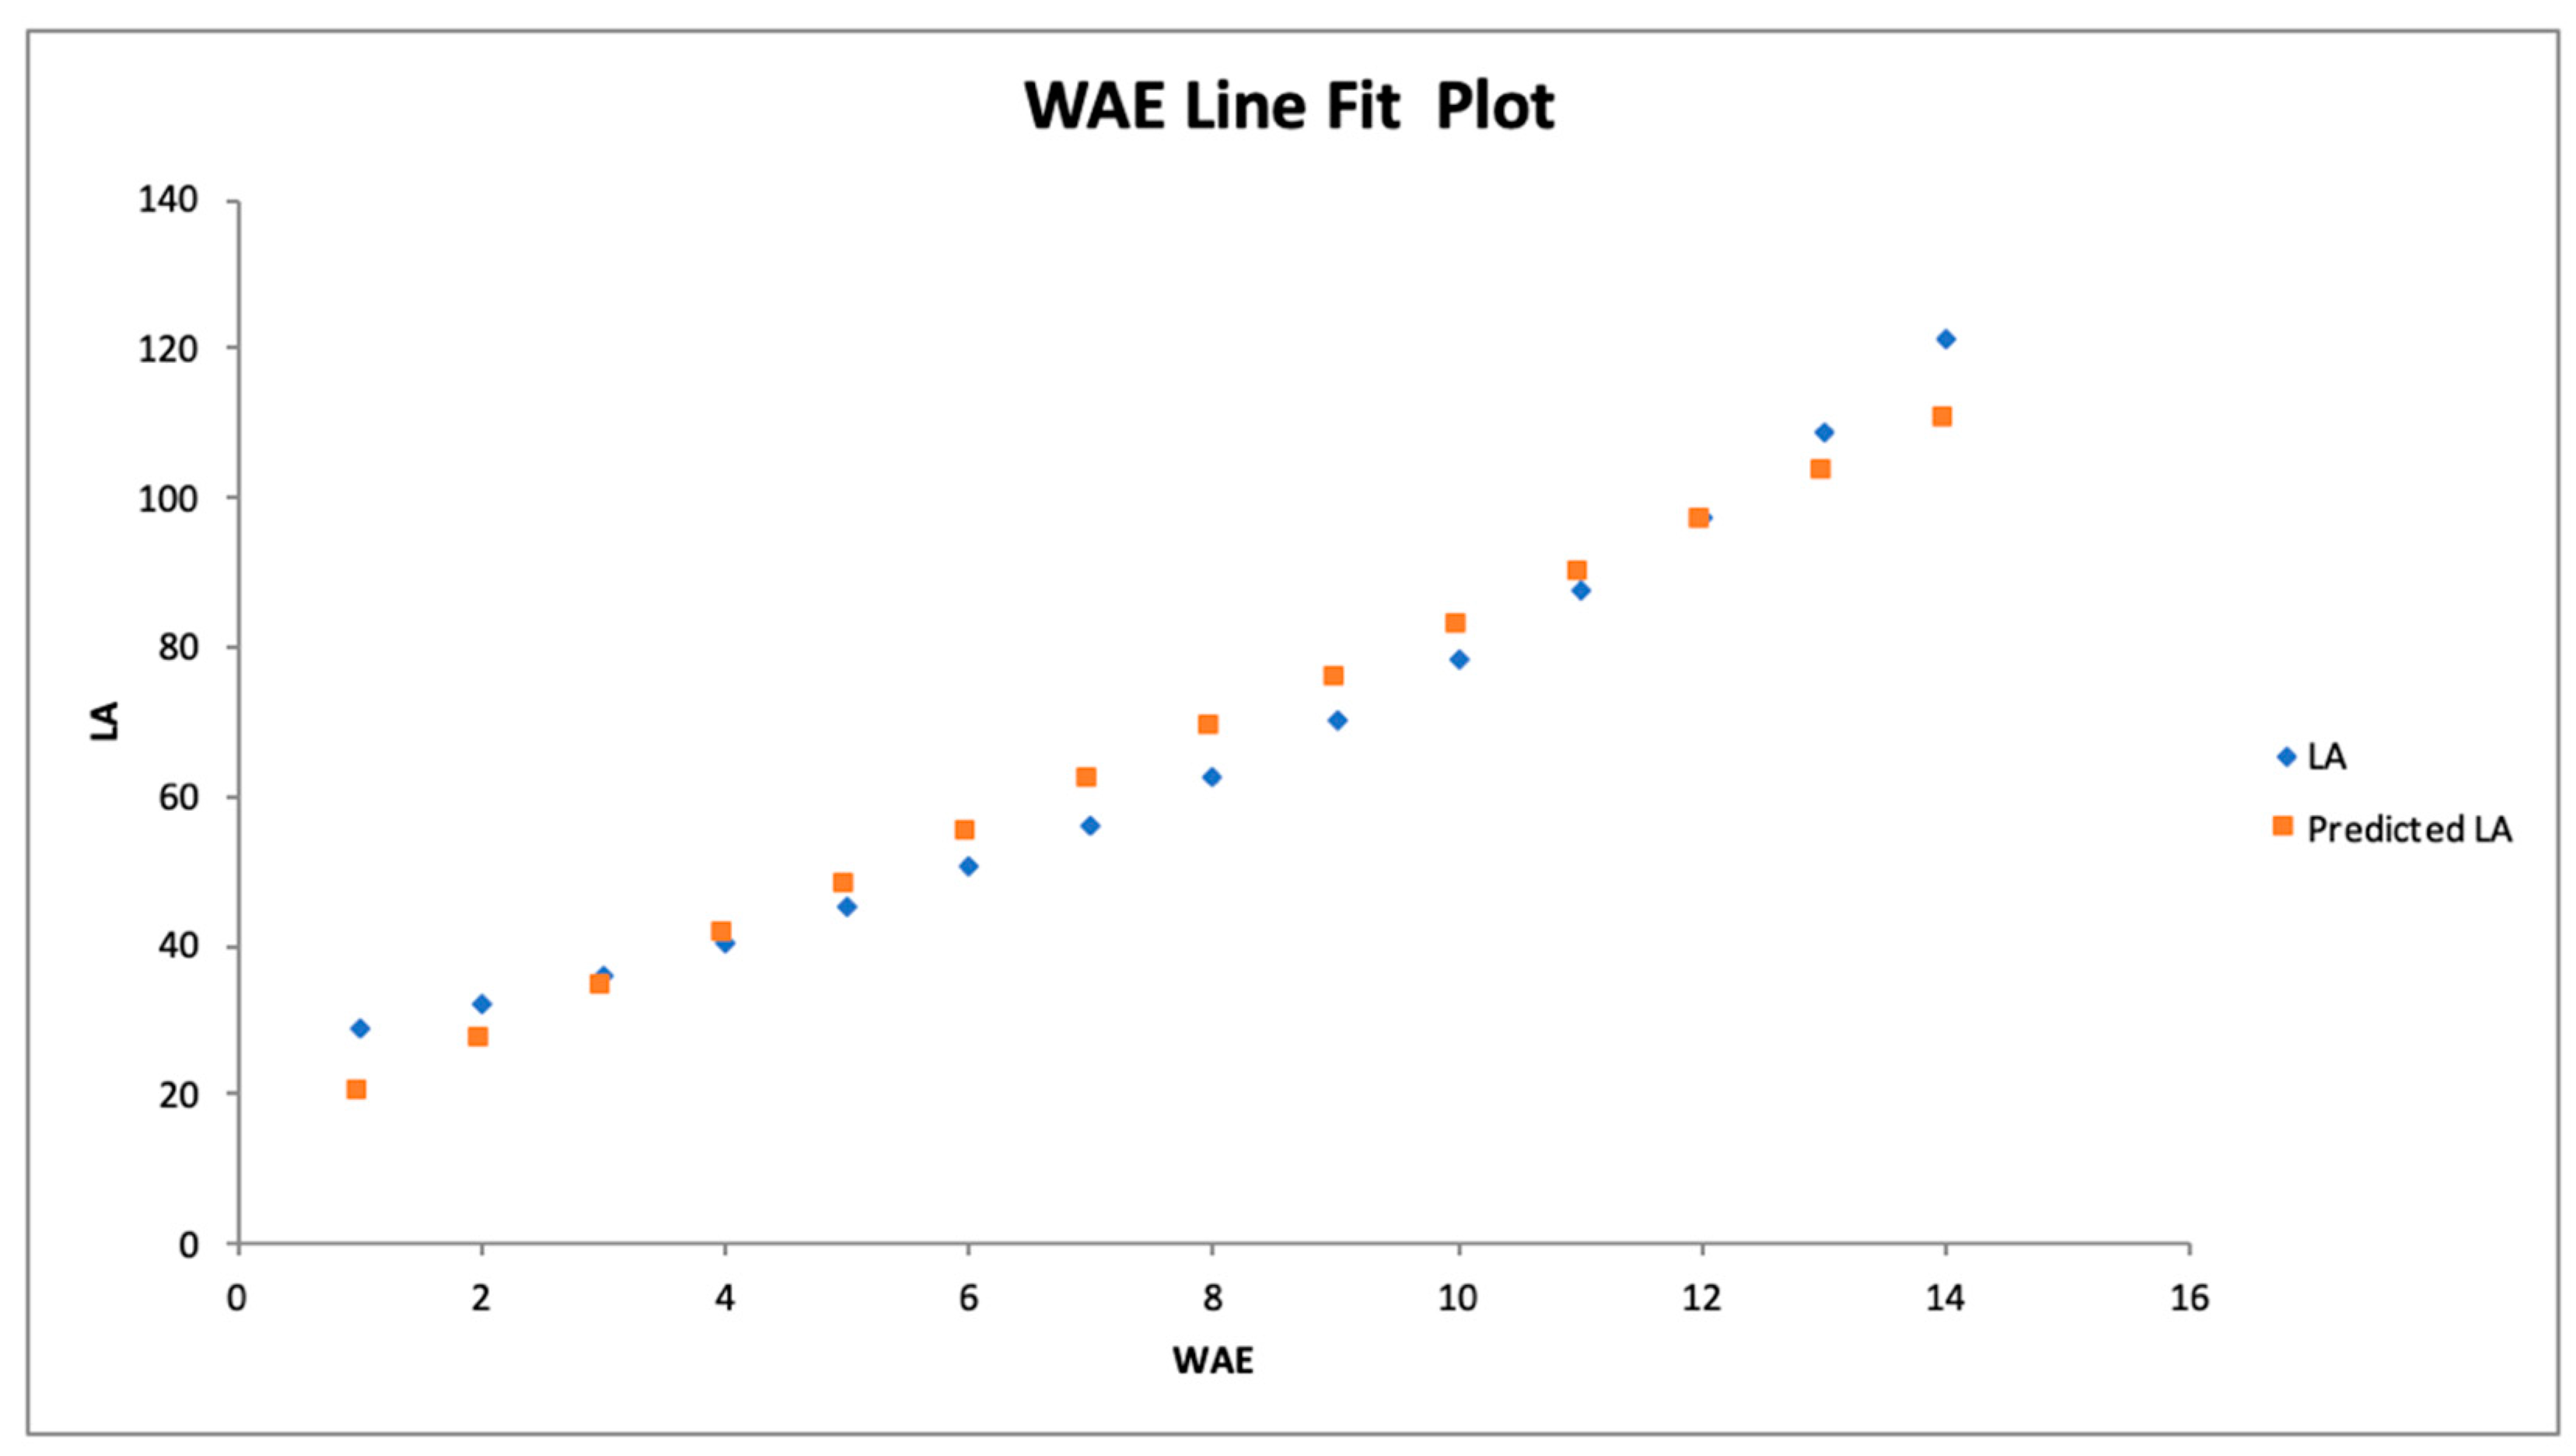
The line fit plot for the Cowpea leaf area of the proposed model is demonstrated in
Figure 4.
As observed, the line fit plot for the Cowpea leaf area under the Vegetative to Maturity period yields good results with a strong correlation of 0.957 between the actual Cowpea leaf area and the predicted values over the 14 weeks period.
Shoot Dry Weight
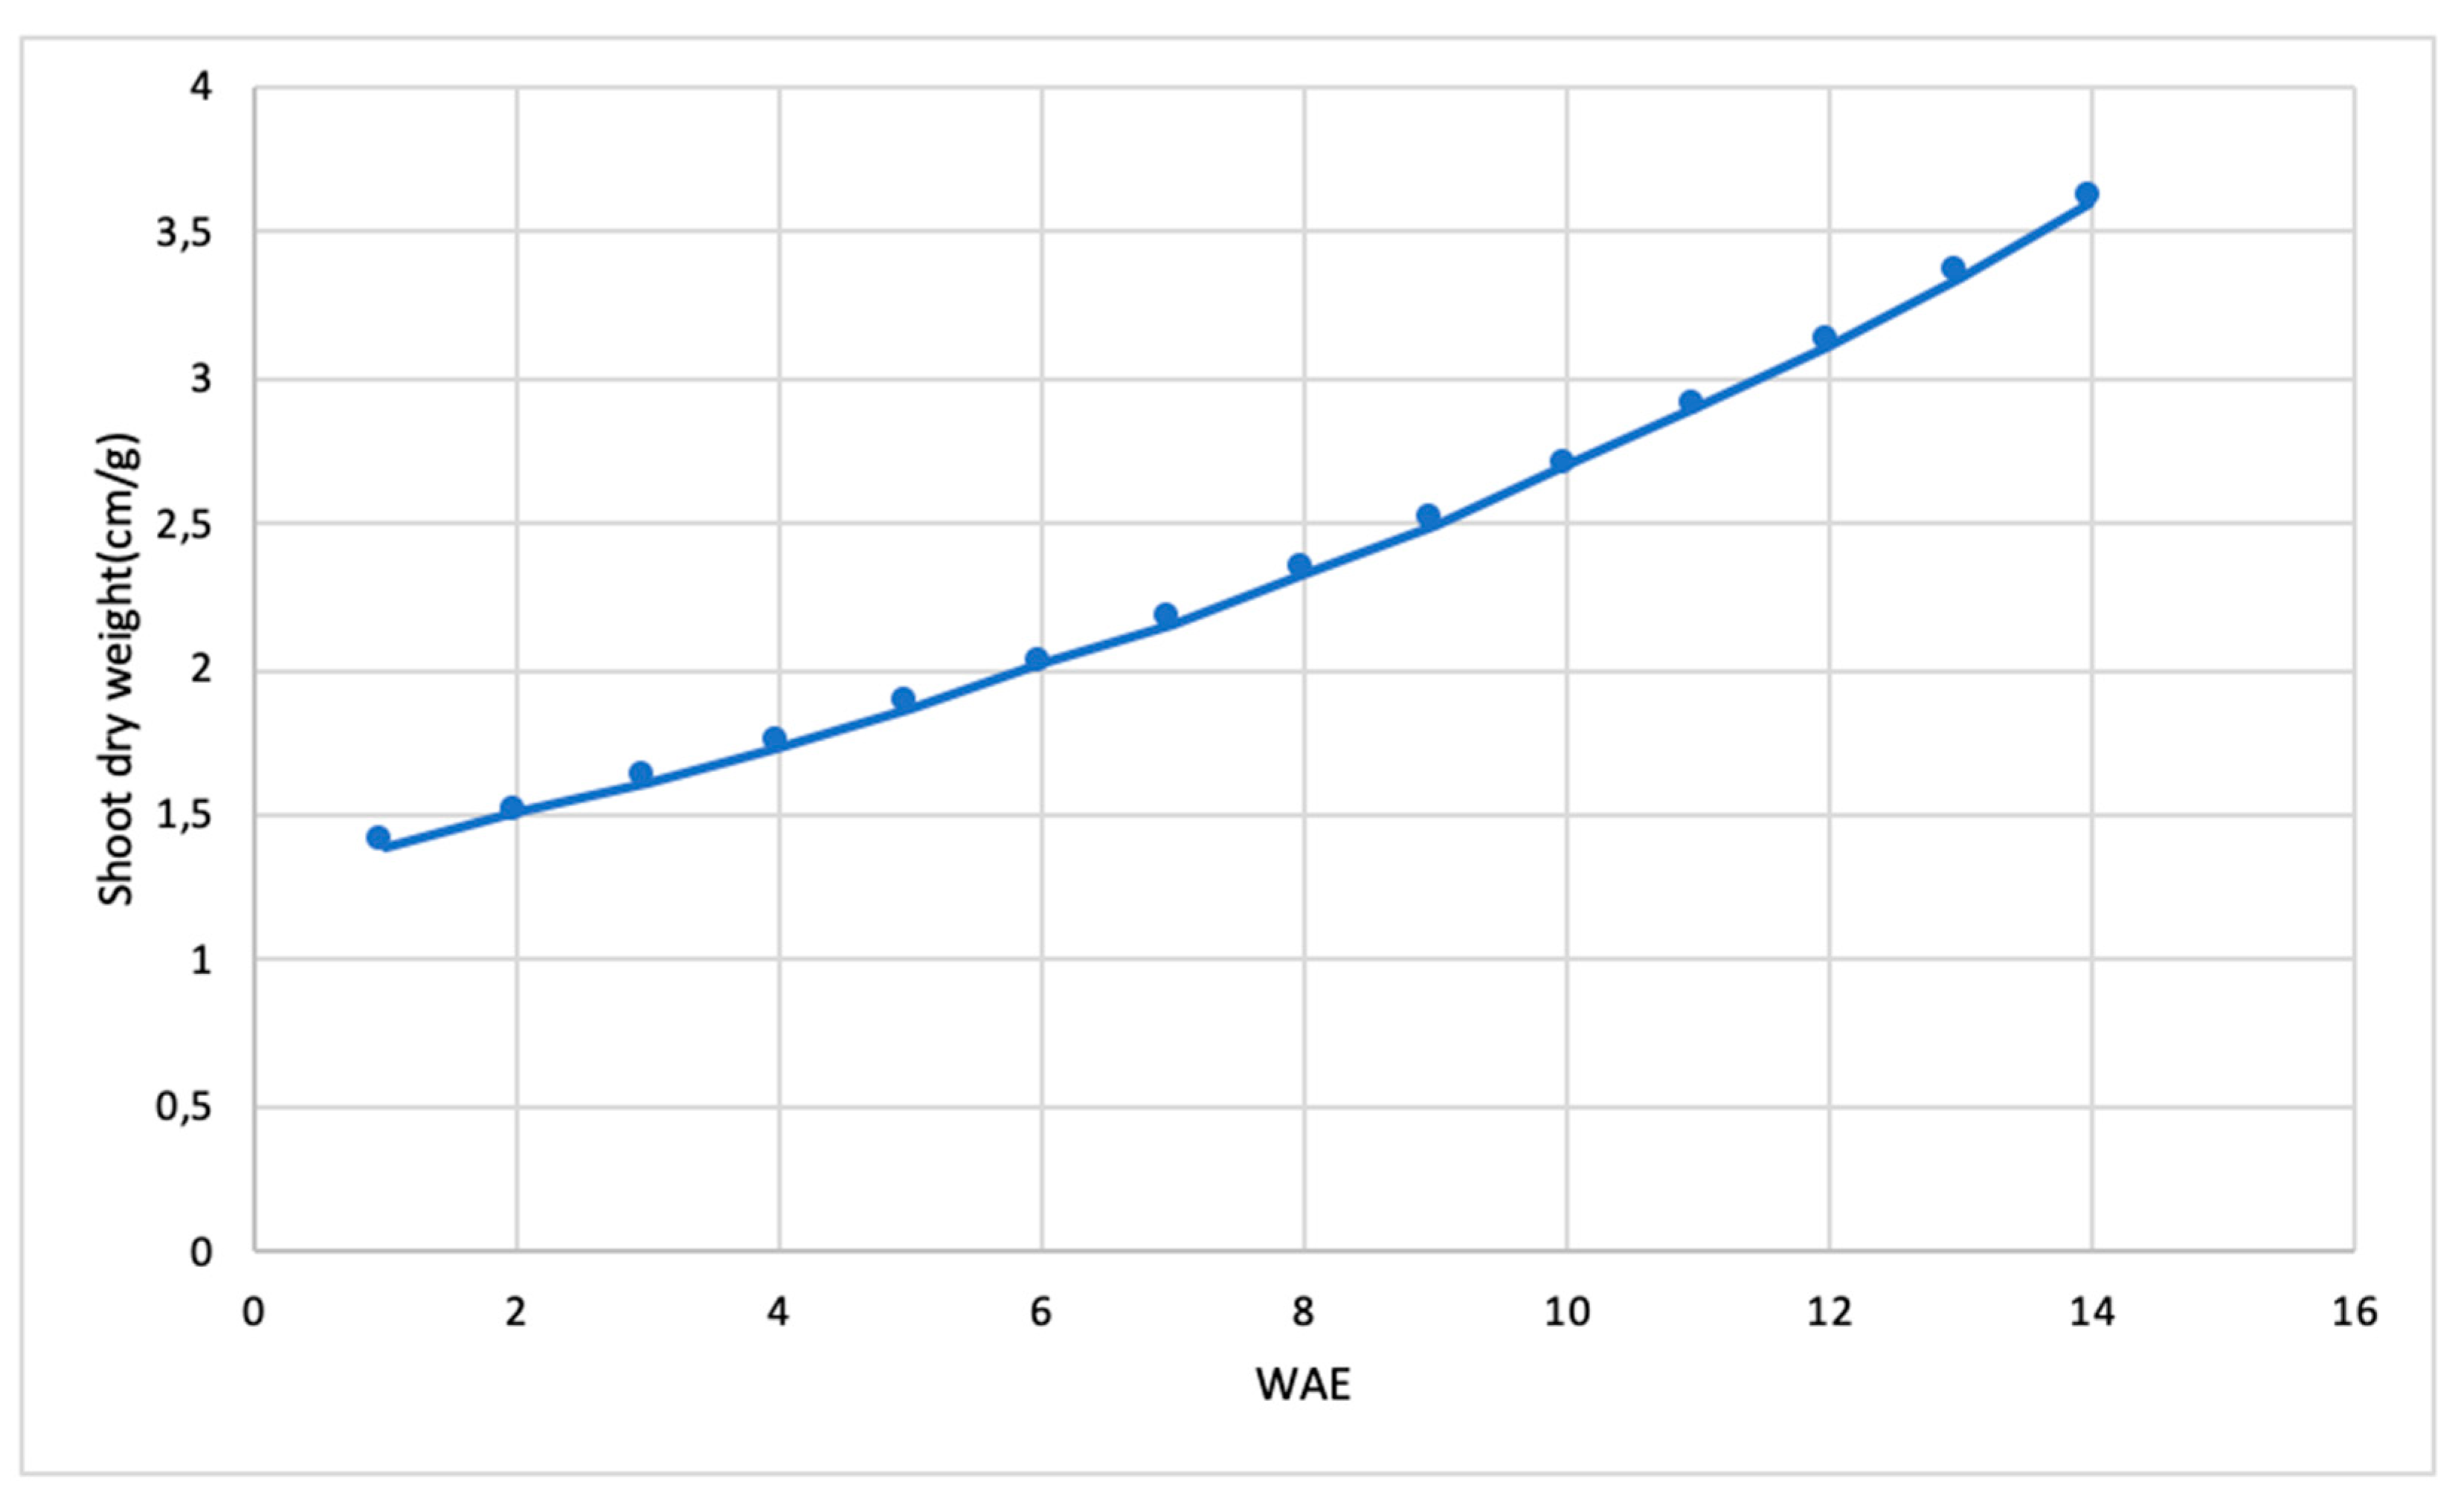
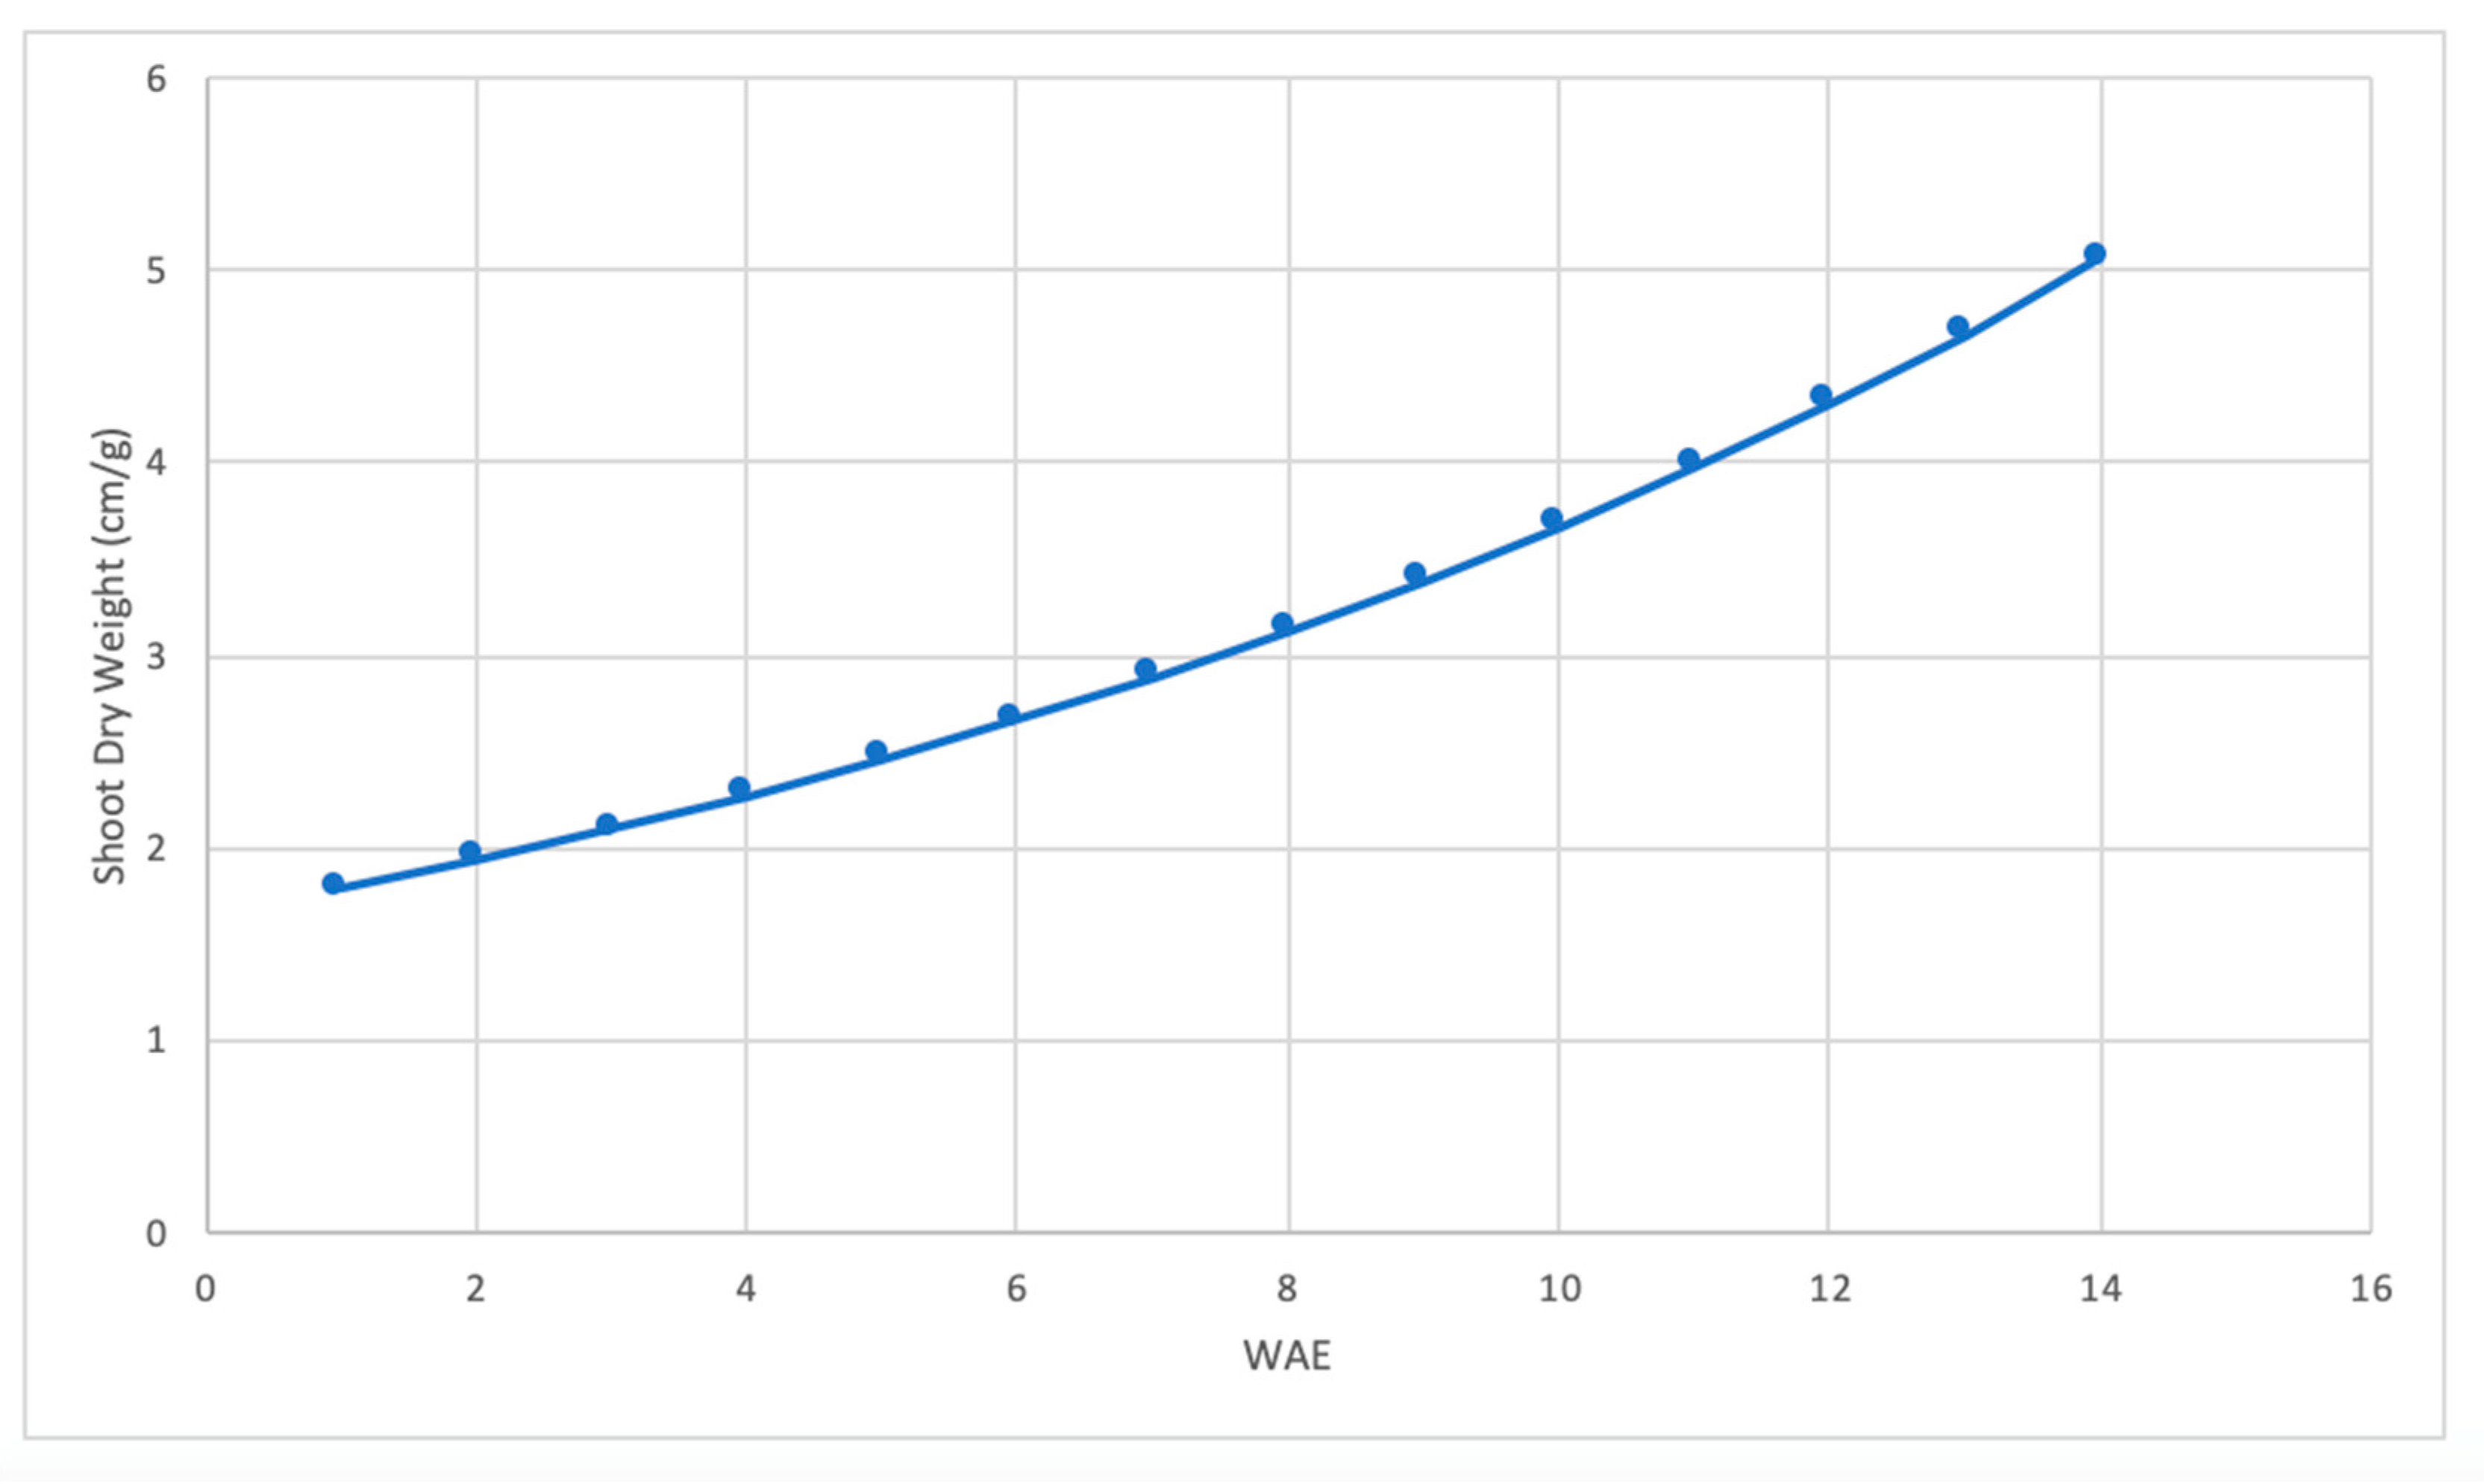
The experimental data of the shoot Dry Weight under the Vegetative to Maturity period measured over 14 weeks is presented in
Figure 5.
The proposed regression model for the SDW under the vegetative to maturity period is tabulated in
Table 2.
The correlation coefficient is observed to be 0.983, signifying a significant correlation between the practical data and the predicted values. Consequently, the p-value is observed to be less than 0.05 (1.29E-10) which implies that the data is statistically significant. It specifies convincing substantiation in contradiction to the null hypothesis, given that there is less than a 5% probability the null is correct. Therefore, for the Cowpea SDW, the null hypothesis is rejected.
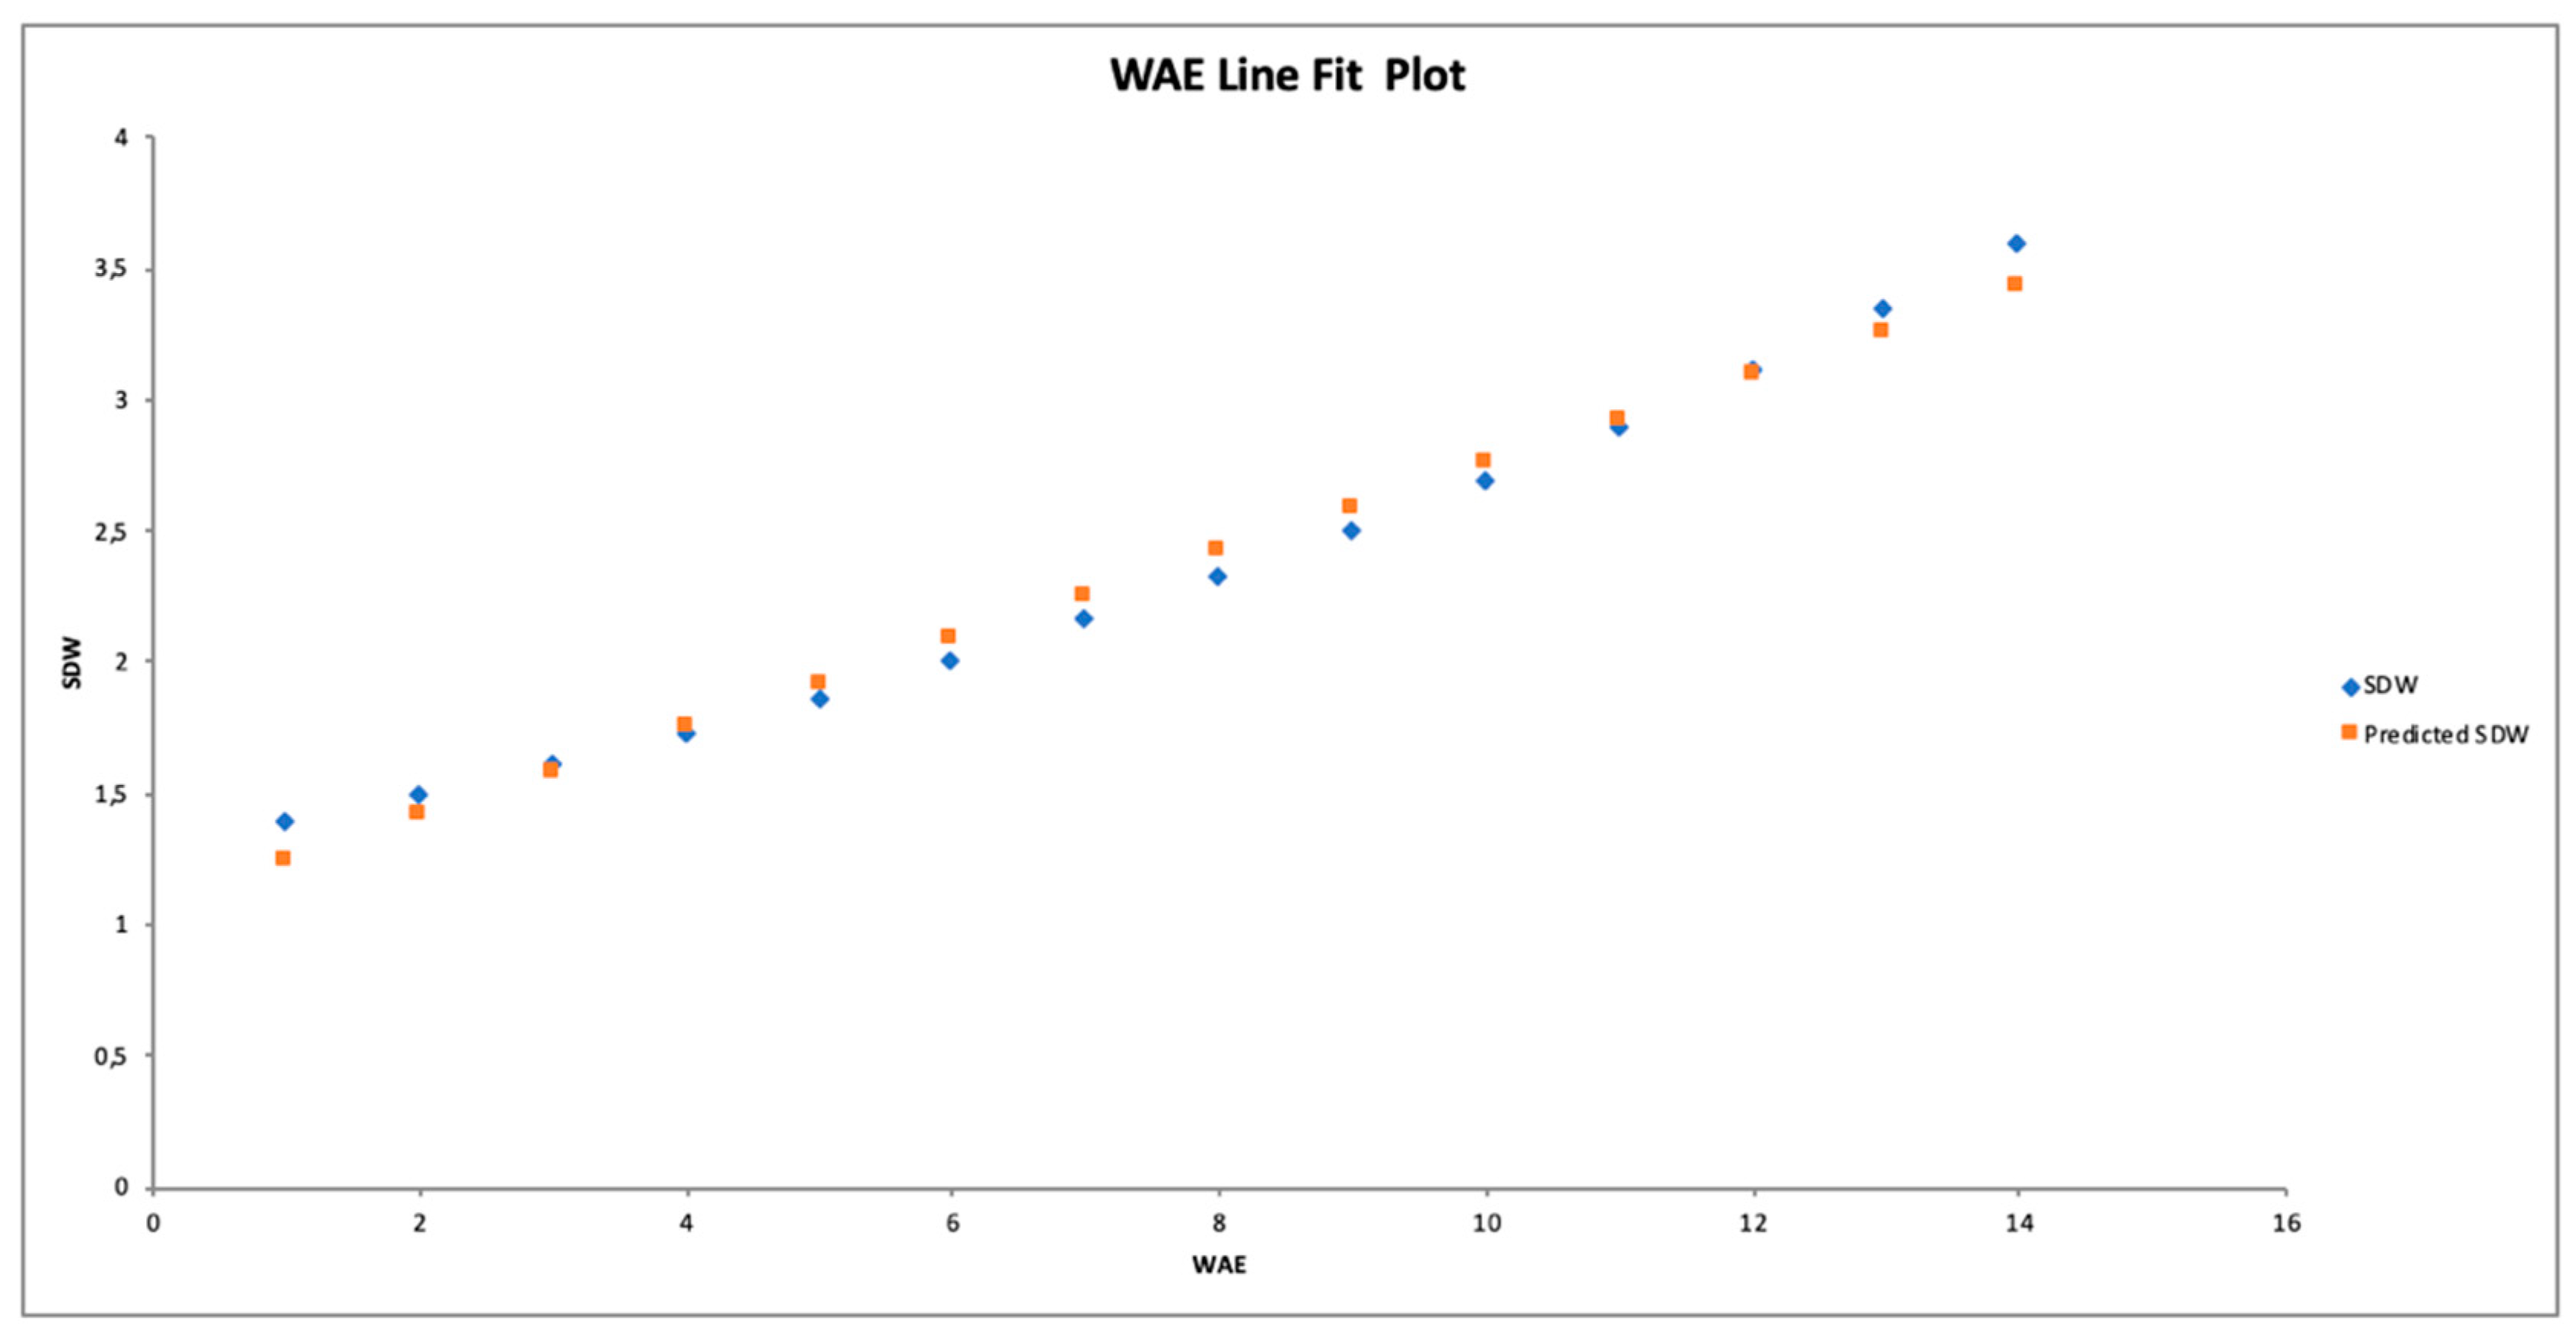
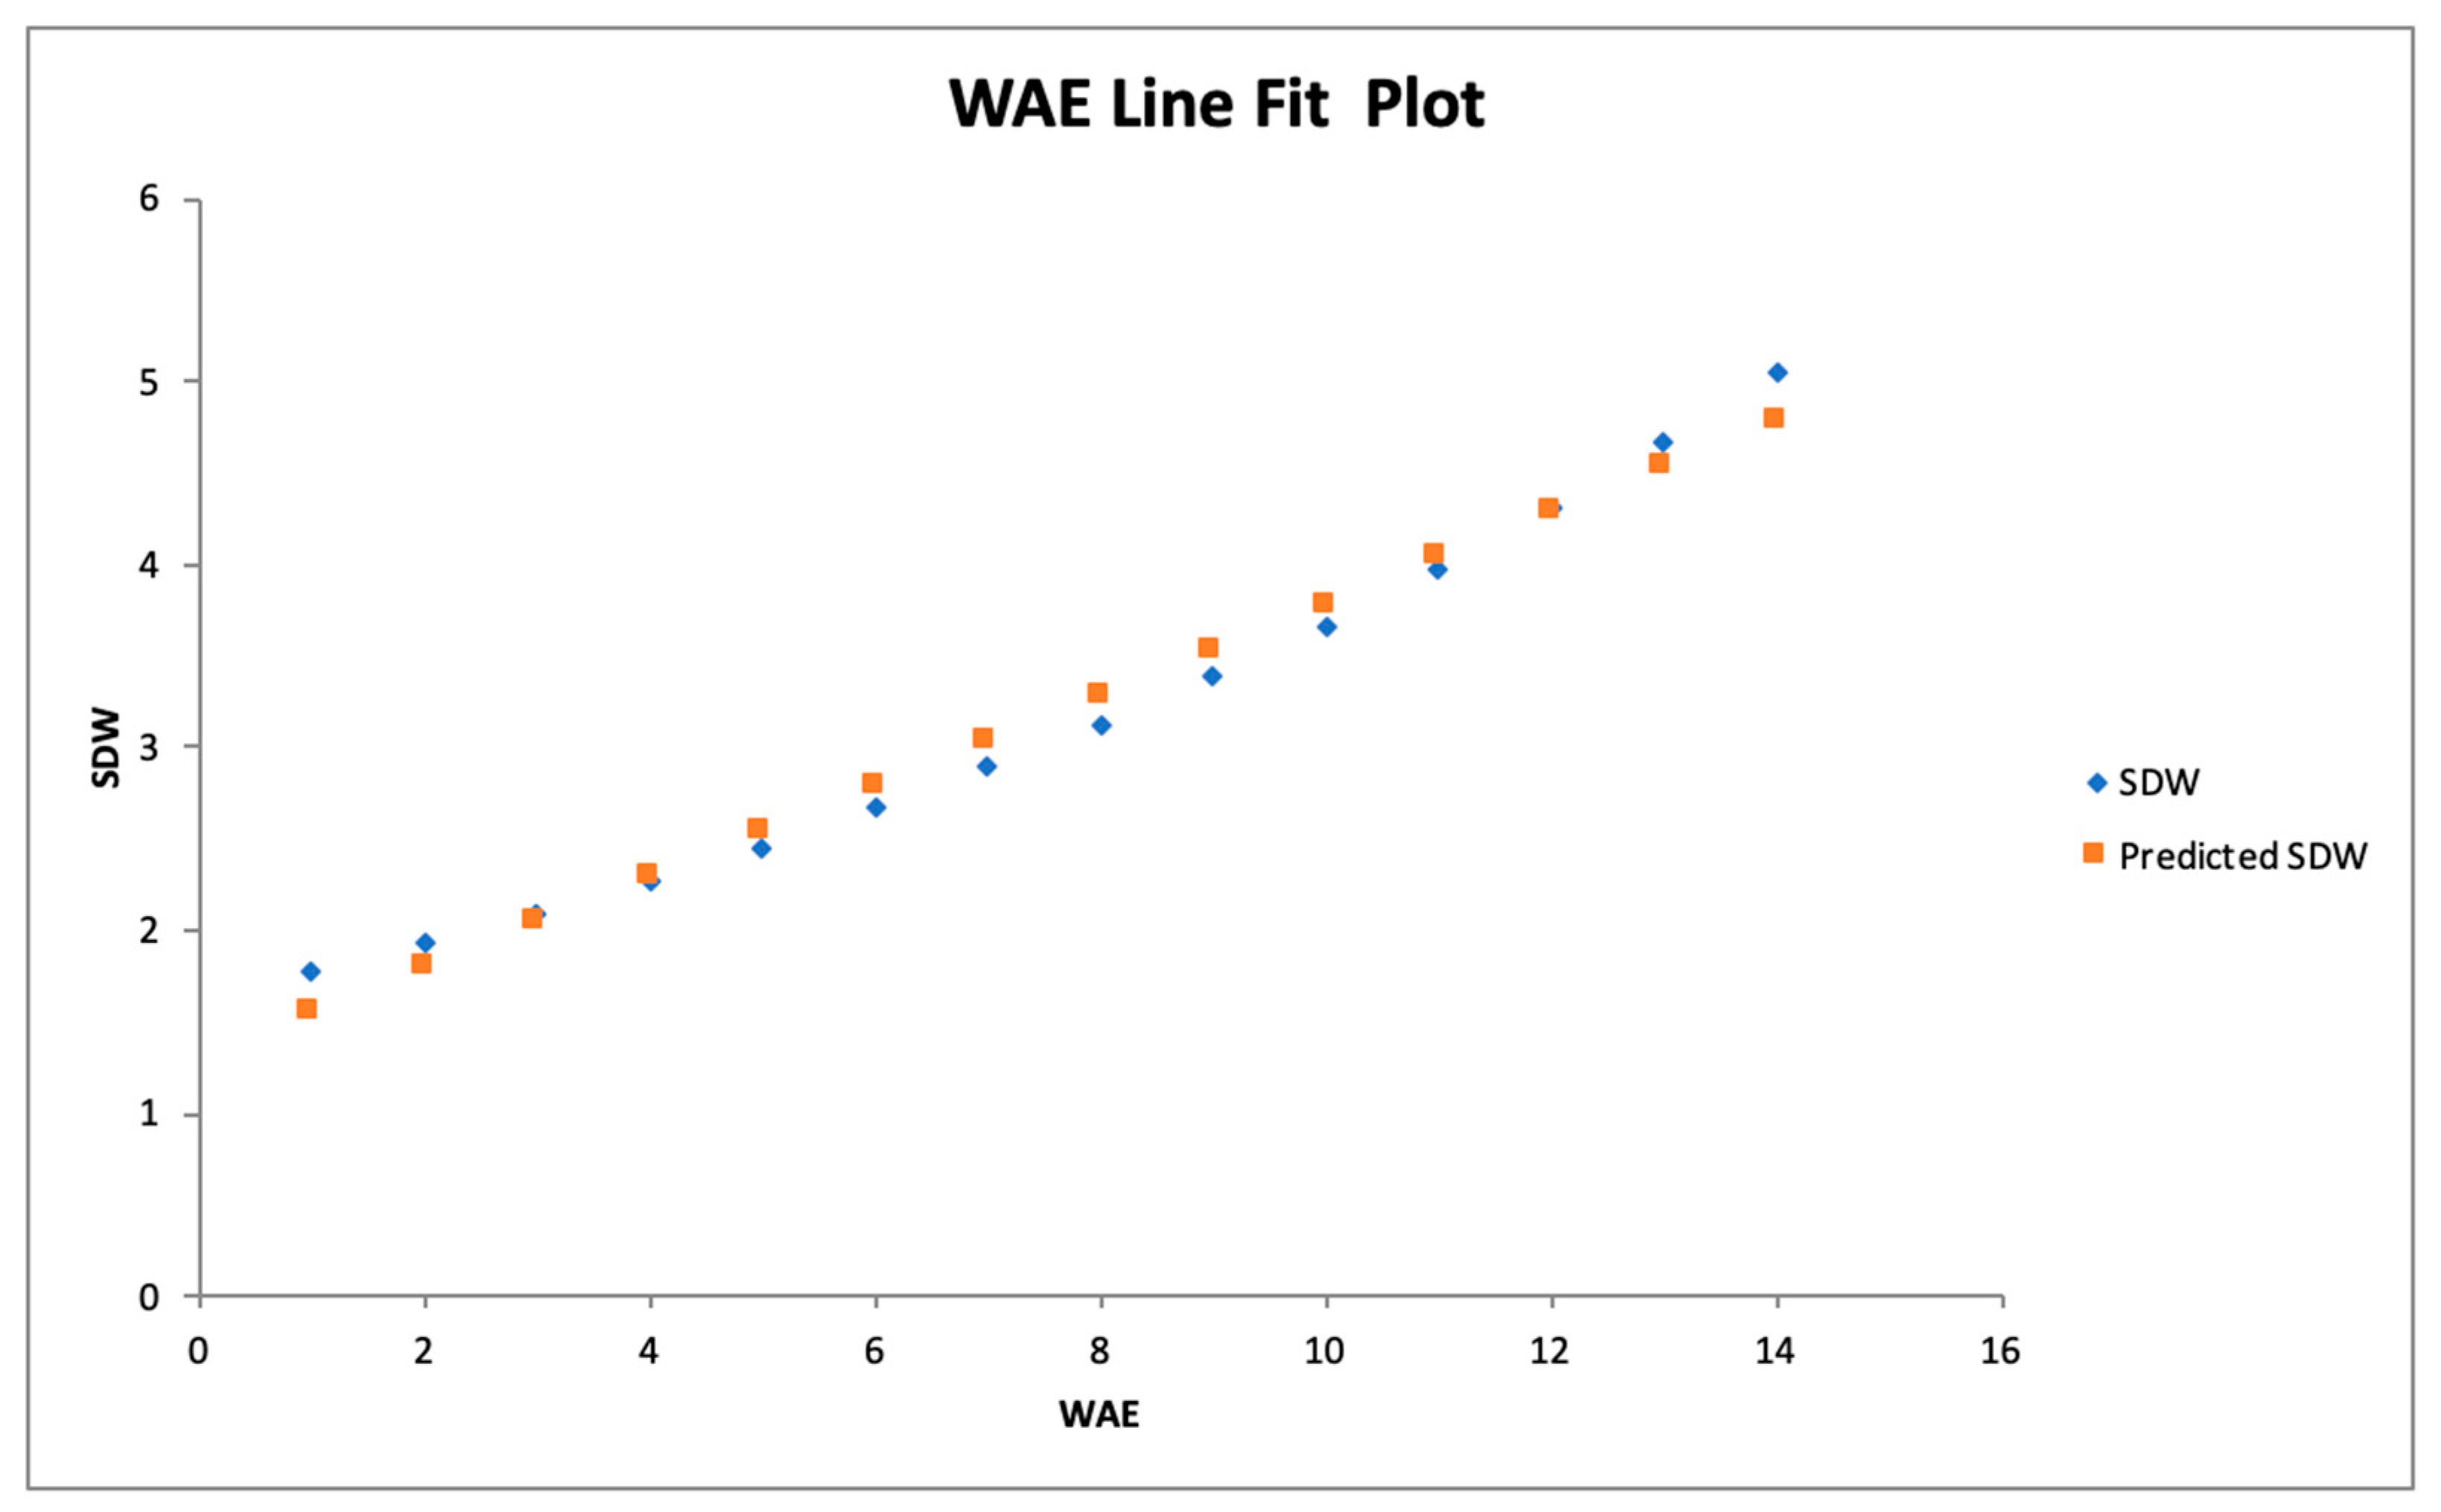
The line fit plot for Cowpea SDW of the proposed model is demonstrated in
Figure 6.
As observed, the line fit plot for Cowpea SDW under the Vegetative to Maturity period yields good results with a strong correlation of 0.983 between the actual Cowpea SDW and the predicted values over the 14 weeks period.
3.3. Flower to Maturity Period
3.3.1. Leaf Area
The experimental data of the Cowpea LA under Flower to maturity period measured over 14 weeks is presented in
Figure 7.
The proposed regression model for the LA under Flower to maturity period is tabulated in
Table 3.
The correlation coefficient is observed to be 0.963, signifying a significant correlation between the practical data and the predicted values. Consequently, the p-value is observed to be less than 0.05 (0,038) which implies that the data is statistically significant. It specifies convincing substantiation in contradiction to the null hypothesis, given that there is less than a 5% probability the null is correct. Therefore, for the Cowpea Leaf Area, the null hypothesis is rejected.
The line fit plot for the Cowpea leaf area of the proposed model is demonstrated in
Figure 8.
As observed, the line fit plot for the Cowpea leaf area under Flower to maturity period yields good results with a strong correlation of 0.963 between the actual Cowpea leaf area and the predicted values over the 14 weeks period.
3.3.2. Shoot Dry Weight
The experimental data of the Cowpea SDW under the Flower to maturity period measured over 14 weeks is presented in
Figure 9.
The proposed regression model for the SDW under Flower to maturity period is tabulated in
Table 4.
The correlation coefficient is observed to be 0.98, signifying a significant correlation between the practical data and the predicted values. Consequently, the p-value is observed to be less than 0.05 (3.81E-09) which implies that the data is statistically significant. It specifies convincing substantiation in contradiction to the null hypothesis, given that there is less than a 5% probability the null is correct. Therefore, for the Cowpea SDW, the null hypothesis is rejected.
The line fit plot for Cowpea SDW of the proposed model is demonstrated in
Figure 10.
As observed, the line fit plot for Cowpea SDW under Flower to maturity period yields good results with a strong correlation of 0.98 between the actual SDW and the predicted values over the 14 weeks period.
3.4. Excellent Watering Through the Season
3.4.1. Leaf Area
The experimental data of the Cowpea LA under Excellent watering through the season measured over 14 weeks is presented in
Figure 11.
The proposed regression model for the LA under Excellent watering through the season is tabulated in
Table 5.
The correlation coefficient is observed to be 0.98, signifying a significant correlation between the practical data and the predicted values. Consequently, the p-value is observed to be less than 0.05 (0.957) which implies that the data is statistically significant. It specifies convincing substantiation in contradiction to the null hypothesis, given that there is less than a 5% probability the null is correct. Therefore, for the Cowpea Leaf Area, the null hypothesis fails to reject.
The line fit plot for the Cowpea leaf area of the proposed model is demonstrated in
Figure 12.
As observed, the line fit plot for the Cowpea leaf area under excellent watering through the season yields good results with a strong correlation of 0.957 between the actual leaf area and the predicted values over the 14 weeks period.
3.4.2. Shoot Dry Weight
The experimental data of the Cowpea SDW under Excellent watering through the season measured over 14 weeks is presented in
Figure 13.
The proposed regression model for the SDW under Excellent watering through the season is tabulated in
Table 6.
The correlation coefficient is observed to be 0976, signifying a significant correlation between the practical data and the predicted values. Consequently, the p-value is observed to be less than 0.05 (31.57E-07) which implies that the data is statistically significant. It specifies convincing substantiation in contradiction to the null hypothesis, given that there is less than a 5% probability the null is correct. Therefore, for the Cowpea Leaf Area, the null hypothesis is rejected.
4. Conclusions
In this work, a focus was drawn on analyzing cowpea’s growth phases by proposing regression analysis under the impact of water stresses to facilitate South Africa’s local farmers in optimally mapping their cultivation schedule over the period of drought without imperiling their yields. The proposed regression models predict the cowpea’s growth at various periods of water stress including vegetative to maturity, flower to maturity and excellent water through the season. At each period of water stress, regression models of the leaf area and shoot dry weight are developed. The various growth phases of the cowpeas were studied under three-pot test conditions. The results suggest that water stress at initial growth phases decreased the shoot dry weight (SDW), and leaf area (LA) of studied cowpeas. Growth analysis of cowpeas species cultivated in pure stands for the distinctive periods showed that the leaf area was the most explanatory variable in the SDW of cowpea at the initial growth phase. The correlation coefficient of the LA and SDW of cowpeas produced by the proposed models at vegetative to maturity, flower to maturity and excellent water through the season are 0.957 and 0.983, 0.963 and 0.980, 0.957 and 0.976
The study further revealed that water stress abridged growth and implementation of Cowpeas and adversely effects the generative organ. Additionally, the detrimental effect of water stresses augmented with plant densities.
Author Contributions
B.A.T and B.A.M, conceptualized, carried out the computations, investigated, wrote, and prepared the article. B.A.T and B.A.M was responsible for managing the project and editing the article. The published version of the article has been reviewed and approved by all authors.
Funding
This research received no external funding.
Institutional Review Board Statement
Not applicable.
Informed Consent Statement
Not applicable.
Data Availability Statement
Not applicable.
Acknowledgments
The authors would like to thank local farmers for their contribution in the database.
Conflicts of Interest
The authors declare no conflict of interest.
References
- Agele, S.O.; Olufayo AIremiren, G.O. Effects of season of sowing on wateruse and yield of tomato in humid south Nige-ria. African Crop Science 2002, 10, 213–237. [Google Scholar]
- Akande, S.R.; Ajayi, S.A.; Adetumbi, J.A.; Ad-eniyan, O.N.; Ogunbodede, B.A.; Owolade, O.F.; Olakojo, S.A. A. Planting dateeffects on cowpea seed yield and quality atsouthern guinea Savanna of Nigeria. Proofs 2012, 34, 79–88. [Google Scholar]
- Awasthi, U.D.; Singh, R.B.; Dubey, S.D. Effect of sowing date and moistureconservation practice on growth and yield ofIndian mustard (Brassica juncea) varieties. In-dian Journal of Agronomy 2007, 52, 151–153. [Google Scholar] [CrossRef]
- Banik, P.; Bagchi, D.K.; Sasmal, P.K.; Ghosal, M.N. Evaluation of Legume growth. Crop Science Journal 2000, 185, 9–14. [Google Scholar]
- Bhale, V.M.; Wanjari, S.S. Conserva-tion Agriculture: a new paradigm to increaseresource use efficiency. Indian Journal of Agronomy 2009, 54, 167–177. [Google Scholar] [CrossRef]
- CSO. 2012 annual agricultural surveyreport. Government Printer, Gaborone, , Bot-swana 2013. [Google Scholar]
- De-Wilt, P.V.; Nachtengaele, F.O. Ex-planatory notes on soil map of the Republicof Botswana. Soil Mapping and Advisory Ser-vices. Government Printer Press: Gaborone, 1996. [Google Scholar]
- FAO. Climate change, water and foodsecurity. FAO Water Report 36. FAO: Rome, 2011. [Google Scholar]
- Lemos, M.C.; Dilling, L. Equity in fore-casting climate: can science save the world’spoor? Science Public Policy 2007, 34, 109–116. [Google Scholar] [CrossRef]
- Luhanga, P.V.; Andringa, J.C. haracter-istics of solar radiation at Sebele, Gaborone,Botswana. Solar Energy 1990, 44, 77–81. [Google Scholar] [CrossRef]
- Madamba, R.; Grubben, G.J.; Asante, I..K; Akromah, R. Vigna unguiculata (L.)Walp. Plant Resources for Tropical Africa1.Cereals and Pulses; Brink, M., Belay, G., Eds.; PROTA Foundation: Wageningen, Netherlands, 2006; pp. 221–229. [Google Scholar]
- (PDF) Grain yield water use efficiency of cowpea (Vigna unguiculata L. Walp.) in response to planting dates in Botswana. 22 May. Available online: https://www.researchgate.net/publication/325732545_Grain_yield_water_use_efficiency_of_cowpea_Vigna_unguiculata_L_Walp_in_response_to_planting_dates_in_Botswana (accessed on 22 May 2022).
- Ezin, I.; Tosse, A.G.C.; Chabi, I.B.; Ahanchede, A. Adaptation of Cowpea (Vigna unguiculata (L.) Walp.) to Water Deficit during Vegetative and Reproductive Phases Using Physiological and Agronomic Characters. International Journal of Agronomy 2021, 2021, 9665312. [Google Scholar] [CrossRef]
- Onuh, M.O.; Donald, K.M. Effects of water stress on the rooting, nodulation potentials and growth of cowpea (Vigna unguiculata (l) walp). Science World Journal 2009, 4. [Google Scholar] [CrossRef]
- Fall, L.D.; Fall-Ndiaye, M.A.; Badiane, F.A.; Crueye, M. Genetic diversity in cowpea (Vigna unguiculata (L Walp) varietiesdetermined by ARA & RAPD techniques. African Journal ofBiotechnology 2003, 2, 48–50. [Google Scholar]
- (PDF) Effects of water stress on the rooting, nodulation potentials and growth of cowpea ( Vigna unguiculata (l) walp). 22 May. Available online: https://www.researchgate.net/publication/272327341_Effects_of_water_stress_on_the_rooting_nodulation_potentials_and_growth_of_cowpea_Vigna_unguiculata_l_walp (accessed on 22 May 2022).
- Gaiser, T.; Graef, F. Optimization of a parametric landevaluation method for cowpea and mearl millet production insemiarid regions. Agronomic 2001, 21, 705–712. [Google Scholar] [CrossRef]
- (PDF) Effects of water stress on the rooting, nodulation potentials and growth of cowpea ( Vigna unguiculata (l) walp). 22 May. Available online: https://www.researchgate.net/publication/272327341_Effects_of_water_stress_on_the_rooting_nodulation_potentials_and_growth_of_cowpea_Vigna_unguiculata_l_walp (accessed on 22 May 2022).
- Gomesda SJ, A.; Ja Costa, R.C.; Oliveira JT, A. Drought – induced effects and recovery of nitrate assimilation andnodule activity in cowpea plants inoculated with bradyrhizobiumspp. under moderate nitrate level. Brazilian Journal of microbiology 2001, 32. [Google Scholar]
- Kramer, P.J. Water stress and plant growth. Agron. J. 1963, 55, 31–35. [Google Scholar] [CrossRef]
- Lecoeur, J.; Sinclair, T.R. Field Pea transpiration and leaf growth in response to soil water deficits. Crop Sci. 1996, 36, 331–335. [Google Scholar] [CrossRef]
- Sinclair, T.R.; Muchow, R.C.; Ludlow, M.M.; Leach, G.J.; Lawn, R.J.; Foale, M.A. Field and model analysis of the effect of water deficits on carbon and nitrogen accumulation by soybean, cowpea and black gram. Field. Crops. Res. 1987, 17, 121–140. [Google Scholar] [CrossRef]
- Shaheen, S.; Naseer, S.; Ashraf, M.; Akram, N.A. Salt stress affects water relations, photosynthesis, and oxidative defense mechanisms in Solanum melongena L. Journal of Plant Interactions 2013, 8, 85–96. [Google Scholar] [CrossRef]
|
Disclaimer/Publisher’s Note: The statements, opinions and data contained in all publications are solely those of the individual author(s) and contributor(s) and not of MDPI and/or the editor(s). MDPI and/or the editor(s) disclaim responsibility for any injury to people or property resulting from any ideas, methods, instructions or products referred to in the content. |
© 2024 by the authors. Licensee MDPI, Basel, Switzerland. This article is an open access article distributed under the terms and conditions of the Creative Commons Attribution (CC BY) license (http://creativecommons.org/licenses/by/4.0/).