
Submitted:
01 September 2025
Posted:
02 September 2025
You are already at the latest version
Abstract
The rapid proliferation of electric vehicles (EVs) demands lightweight yet efficient battery thermal management systems (BTMS). Fin-embedded phase change material energy storage tube(PCM-EST) offer significant potential due to their high thermal energy density and passive operation, but conventional designs face a critical trade-off: enhancing heat transfer typically increases mass, conflicting with EV lightweight requirements. To resolve this conflict, this study proposes a multi-objective surrogate optimization framework integrating Computational Fluid Dynamics (CFD) and Kriging modeling. Fin geometric parameters—number, height, and tube length—were rigorously analyzed via ANSYS Fluent simulations to quantify their coupled effects on PCM melting/solidification dynamics and structural mass. Results reveal that fin configurations dominate both thermal behavior and weight. An enhanced Multi-objective Particle Swarm Optimization (MOPSO) algorithm was then deployed to simultaneously maximize heat transfer and minimize mass, generating a Pareto-optimal solution. The optimized design achieves 8.7% enhancement in heat exchange capability and 0.732kg mass reduction—outperforming conventional single-parameter designs by 37% in weight savings. This work establishes a systematic methodology for synergistic thermal-structural optimization, advancing high-performance BTMS for sustainable EVs.
Keywords:
phase change material energy storage tube(PCM-EST)
; new energy vehicle thermal management
; enhanced heat transfer
; Kriging surrogate model
; multi-objective particle swarm optimization (MOPSO)
1. Introduction
With the rapid advancement of new energy vehicles (NEVs), there is growing demand for efficient and reliable thermal management systems to ensure optimal vehicle performance and safety. Effective battery temperature control remains a critical challenge in NEV operation. Non-optimal operating temperatures can diminish efficiency and accelerate battery degradation, while excessively high temperatures may induce thermal runaway and other safety hazards [1,2].
Phase change materials (PCMs), leveraging their high latent heat, effectively absorb and release heat during phase transitions, making them widely employed in thermal management systems for NEVs [1]. Huang [3] and Ashima [4] demonstrated that passive phase change cooling ensures superior temperature regulation and uniformity in lithium-ion battery modules. Additional passive thermal management approaches utilizing PCM latent heat include immersion cooling [5,6], sleeve-type cooling [7], and encapsulation cooling [8]. However, despite enhancements in thermal conductivity achievable through the incorporation of high-conductivity materials into composite PCMs, their intrinsic thermal transfer properties remain relatively low. Consequently, upon reaching the latent heat storage capacity, PCMs can impede the battery system’s heat dissipation performance. Studies indicate that a single-PCM thermal reservoir is inadequate for meeting the thermal management requirements of EV power batteries. Integration with auxiliary cooling mechanisms is therefore essential to facilitate the timely dissipation of heat stored within the PCM, thereby enhancing the system’s overall cooling efficiency. Park [9] developed a numerical model comparing an active thermal management system using two-phase refrigerants with a passive PCM-based system for lithium-ion batteries. Simulation results from combined charge-discharge cycling tests indicated that the active refrigerant cooling system achieved higher cooling efficiency than the passive PCM system. Fu [10] proposed a novel structural design for a power battery thermal management system. This design integrates PCMs, liquid cooling, and air cooling for heat dissipation under high-temperature conditions, and incorporates electric resistance heating for temperature regulation in low-temperature environments, offering a new strategy for EV battery thermal management. Liu [11] developed a heat dissipation module based on a composite PCM combined with liquid cooling. By modifying the connection configuration of the liquid cooling system’s hoses, different coupling schemes can be implemented, demonstrating significantly enhanced cooling performance compared to systems relying solely on PCMs for heat dissipation.
Despite the significant advantages of PCMs in thermal management, their application in NEVs faces substantial challenges. A primary limitation is their low thermal conductivity [12], which restricts the rate of heat absorption and release. Conventional PCM-based thermal management systems often necessitate incorporating thermal conductivity enhancers (such as metallic fins or nanoparticles) or implementing complex structural modifications to augment heat transfer rates. Unfortunately, these enhancements typically increase system weight and complexity, conflicting with the critical requirements for lightweight and compact designs in NEVs [13]. Consequently, PCM-based thermal management systems have thus far been hindered from achieving widespread adoption.
In contrast, the PCM-EST offers a promising thermal management solution for NEVs. Its advantages encompass flexible design, adaptable layout, and the potential to partially substitute liquid cooling circuits, thereby minimizing weight addition. For instance, Song [14] utilized PCM-EST to recover fuel cell waste heat for cabin heating, reducing air conditioning energy consumption by 26%. However, maximizing the thermal benefits of PCM within the PCM-EST critically depends on its structural design. Common enhancement strategies involve integrating fins, expanding surface areas, or incorporating porous structures within the storage tube to augment heat exchange between the PCM and the heat transfer fluid (HTF) [15,16,17,18]. Optimizing fin geometric parameters—such as shape, quantity, and size—significantly improves system heat transfer performance. Specifically, fin number profoundly impacts PCM melting and solidification characteristics due to its direct influence on the heat transfer area. Al-Abidi et al. [19] investigated internal and external fins in a triple-tube heat exchanger, revealing that increasing fin number and height markedly accelerated PCM melting. Hosseini et al. [20] experimentally and numerically validated that optimized fin geometries and arrangements enhance heat transfer rates while maintaining compactness. Yan et al. [21] demonstrated numerically that Y-shaped fins in a triple-tube latent heat thermal energy storage (LHTES) system expedite PCM heat storage; reducing fin thickness and increasing branch fin angles shortened total charging time. Hong et al. [22] introduced an innovative T-shaped fin strategy, extending fin length to enhance PCM heat sink thermal management. This approach reduced melting time by 25.5% compared to a finless system, indicating significant efficiency gains. Peng et al. [23] examined the impact of branched rectangular fin cross-angle and installation height on organic PCM melting, collaboratively optimizing transient conduction and natural convection. Mostafa et al. [24] proposed a system integrating rectangular and triangular fins, achieving a substantial ~57.56% increase in PCM melting rate. Waqas et al. [25] highlighted that vein fin structures significantly outperform other designs in PCM melting performance; using 8 vein fins increased the melting rate by 91% within 1000 seconds compared to the finless case.
Furthermore, optimization techniques are crucial for designing PCM-EST systems, balancing thermal performance against structural constraints. Computational fluid dynamics (CFD) simulations are widely employed to model complex PCM heat transfer processes, enabling exploration of design parameter impacts [26]. However, due to the high computational cost of precise simulations, surrogate models (e.g., Kriging model) have gained prominence for approximating PCM system performance, reducing computational effort and enhancing optimization efficiency [27,28,29,30].Jiang et al. [28] utilized a Kriging surrogate model combined with Particle Swarm Optimization (PSO) to optimize a composite PCM/expanded graphite system for lithium-ion battery thermal management, significantly improving heat transfer and reducing costs. Bianco et al. [31] employed genetic algorithms (GA) with MATLAB-COMSOL Multiphysics numerical models, finding that reducing the shell diameter by 12 cm utilized 72% of the PCM potential, with the maximum fully available PCM being 40% of the initial amount.Liu et al. [32] applied the particle swarm optimization algorithm to optimize a tubular heat exchanger, obtaining the optimal fin cross-angle and branching ratio. This increased PCM heat transfer efficiency by 27.9%, with the optimized design validated for accuracy.
Despite significant advances in PCM-based thermal management systems, current research predominantly concentrates on optimizing isolated design elements—such as fin geometry or material properties—often overlooking the complex interactions between multiple parameters [33,34]. Furthermore, most strategies aimed at enhancing heat transfer efficiency achieve these gains at the expense of increased system weight and complexity [35,36,37,38], conflicting directly with the imperative for lightweight, highly efficient compact designs in new energy vehicles.These limitations prevent fins from realizing their full heat transfer potential, yielding suboptimal efficiency improvements in PCM systems. This approach also contributes to material wastage and unnecessary mass accumulation. Existing studies further lack systematic analysis of optimization outcomes and fail to resolve compatibility issues between fin designs and heat exchanger architectures.To bridge these gaps, this study proposes a Multi-objective Particle Swarm Optimization (MOPSO) framework for parameter optimization of energy storage tubes. This methodology enables simultaneous achievement of structural lightweighting, system simplification, and compliance with prescribed thermal performance requirements.
This study aims to optimize the design of PCM-ESTs for thermal management systems in NEV batteries, focusing on enhancing heat transfer performance while achieving structural lightweighting. Specifically, we investigate the influence of key geometric parameters—including fin number, fin height ratio, and inner tube diameter and length—on both the weight of the heat storage tube and its comprehensive heat exchange capacity. These parameters affect the heat transfer coefficient by altering the heat exchange area but concurrently increase system mass. Thus, maximizing thermal potential while minimizing weight constitutes a critical design challenge. Through integrated CFD simulations, MOPSO and Kriging surrogate modeling, this work systematically analyzes the impact of geometric parameters on PCM thermal behavior during melting and solidification. The study identifies the optimal PCM-EST configuration that balances heat transfer efficiency with mass reduction. The resulting framework offers a novel approach for PCM-EST design, addressing the dual challenge of improving thermal performance and reducing weight in battery thermal management systems. The optimized design is expected to enhance battery temperature regulation while improving overall energy efficiency and sustainability through reduced energy consumption and material usage. This research provides innovative solutions and actionable insights for advancing thermal management technologies, supporting the broader adoption of new energy vehicles.
2. PCM-EST Structure and Parameter Design
Figure 1 illustrates the configuration of the PCM-EST within the electric vehicle BTMS. The system comprises two interconnected loops: ①Air Conditioning Loop: compressor, evaporator, condenser, expansion valve, and heat exchanger.②Battery Thermal Management Loop: battery liquid cooling plate, water pump, PTC heater, radiator, PCM-EST, three-way valve, and four-way valve.
Positioned at the battery cooling fluid outlet, the three-way valve divides the flow into two branches (W1 and W2). These branches converge at the four-way valve, which directs the combined flow through three distinct cooling circuits: S1: No cooling;S2: Weak cooling;S3: Strong cooling.All circuits (S1-S3) subsequently reconverge and return to the pump inlet, completing the circulation loop. The PCM-EST unit in this study is installed within branch W1, where it dynamically absorbs or releases heat to regulate battery temperature and reduce overall thermal management system energy consumption.
The operational logic functions as follows: ① Low Battery Temperature:heat stored in the PCM-EST (W1 branch) supplements the PTC heater to warm the battery coolant.Reduces PTC power demand while accelerating battery heating.② High Battery Temperature: when PCM-EST is cool: absorbs battery heat while simultaneously warming the PCM;When PCM-EST is hot: activate radiator (S3 branch) for heat dissipation, or engage chiller (S2 branch) for forced battery cooling.
2.1. PCM-EST Structure
This study employs the PCM-EST to encapsulate the PCM within discrete energy storage units. A key advantage of this approach is that the PCM avoids direct contact with the battery pack. These energy storage units can be integrated with the battery liquid cooling system to provide both cooling and heating functions for the battery pack.The structure of the PCM-EST is illustrated in Figure 2. Comprising four concentric layers from the exterior inward, the PCM-EST consists of: an outer shell, the PCM, a heat transfer fin tube, and heat transfer fluid (HTF). Fins are uniformly distributed around the heat transfer tube, and an insulation layer encases the exterior of the tube assembly.
2.2. PCM-EST Parameter Design
The amount of PCM in each energy storage tube is constrained by parameters such as its diameter and length. Therefore, an initial estimate of the required PCM mass is necessary. To highlight the thermal energy storage advantage of the PCM, we consider its mass at the point of peak heat absorption during the charging process [39]. The relationship between PCM mass and volume is given by Equation (1), while Equation (2) expresses the heat absorbed by the PCM as a function of its mass:
——the volume of PCM,m3;
——the weight of PCM,kg;
——the specific heat of PCM,J/(kg∙K);
——the temperature of PCM at the beginning,K;
——the temperature of PCM at the end,K;
——the latent heat of phase change,KJ/kg。
Given the optimal operating temperature range for batteries (20-45 °C), the phase transition temperature of the PCM is selected as approximately 40 °C. The physical properties of the composite PCM utilized in Ma’s study [40] are presented in Table 1.
Based on the above formula and Du’s research [41] on PCM applications in thermal management, the energy required to heat the PCM from 20 °C to complete melting is approximately 4933 kJ. This corresponds to a PCM mass of about 22.5 kg and a volume of approximately 0.0248 m3. The effect of natural convection on the phase change process is also considered. Key structural parameters include the heat transfer tube diameter (), insulation layer diameter (), tube length (), number of fins (n), and fin height (). Factors influencing the heat storage and release rate of the tube include the fluid’s inlet temperature, flow rate, and the structure of the PCM-EST. While the fluid inlet temperature and flow rate are external factors controllable by the system, the PCM-EST structure must be designed with appropriate parameters prior to implementation in the thermal management system.
Cao’s study [42] on double-layer PCM-ESTs analyzed the impact of parameters such as tube length and diameter on the heat exchange performance of a single tube. The research demonstrated that maintaining a constant overall PCM volume distributed across multiple tubes yields an efficient heat exchange energy storage device. Complementing this, Yuwen Z. [26] investigated the contribution of fin number, thickness, and height to the enhanced heat storage performance of double-layer PCM-ESTs.Building upon this prior work, the present study adopts a similar approach. A commonly used tube diameter was selected. The inner and outer diameters of the double-layer PCM-EST are specified as follows: heat transfer tube diameter = 28×1 mm (outer diameter × wall thickness), insulation layer diameter = 67×1 mm. Based on these dimensions, fins were incorporated to examine the impact of fin number on the energy storage and release efficiency of the double-layer PCM-EST. This analysis led to the determination of the final structure for the single double-layer PCM-EST. The specific parameters used in the simulation are detailed in Table 2.
2.3. PCM-EST Model
2.3.1. Heat Transfer Model of PCM-EST
The heat exchange calculation between the PCM-EST and the coolant follows a similar principle to that between the battery module and the coolant. During the heat absorption or release process, the thermal power transferred from the PCM-EST to the coolant is calculated using the following formula:
——the coolant mass flow rate, K;
——the specific heat capacity of coolant, J/(kg∙K);
——the inlet temperature, K;
——the export temperature, K;
During the transient heat exchange process between the PCM-EST and the coolant, the convective heat transfer rate within the PCM-EST does not equate to the heat absorbed by the PCM. This is because a portion of the heat is transferred to the heat transfer tube. The heat transferred to the tube is calculated as follows:
kg;
the
:
2.3.2. PCM-EST Heat Storage Model
During the melting or solidification process, PCMs undergo phase transitions, leading to the movement of the phase interface coupled with heat exchange. Furthermore, the nonlinearity of the phase change interface, the complexity of its geometry, and non-standard boundary conditions pose significant challenges to solving the phase change heat transfer problem.
Various numerical methods exist for solving phase change heat transfer problems, broadly categorized into two main types: interface tracking methods and fixed grid methods. Interface tracking methods encompass fixed-step methods, variable spatial step methods, variable time step methods, independent variable transformation methods, body-fitted coordinate methods, and isothermal surface movement methods [43]. In contrast, fixed grid methods eliminate the need to explicitly track the two-phase interface position. Instead, they solve the liquid and solid regions as a single domain; common approaches include the equivalent specific heat method and the enthalpy method. Given its relative computational efficiency compared to other techniques and its widespread implementation in CFD software, the enthalpy model is employed for the PCM within the PCM-EST studied in this chapter.
The governing equations of the enthalpy model resemble those for single-phase flow, eliminating the need to satisfy explicit conditions at the solid-liquid interface during phase change. The enthalpy formulation inherently accounts for the solution within the mushy zone interface between the two distinct phases. For the PCM inside the tube, the flow during melting is assumed to be laminar, unsteady, and incompressible, with negligible viscous dissipation. The analysis accounts for the PCM’s thermophysical properties, including density, specific heat, thermal conductivity, and viscosity. The continuity, momentum, and energy equations governing the PCM model are given below [44]:
Continuity Equation:
Momentum equation:
Using the enthalpy model, the influence of phase transition on heat and mass transfer is solved through liquid phase fraction, and its energy equation is expressed as follows.
——the density of PCM, kg/m3;
——the enthalpy value of PCM, J;
——the thermal conductivity of PCM, W/(m∙K);
——the momentum source term;
——the fluid velocity, m/s;
——the dynamic viscosity, N∙S/m2;
——pressure, Pa;
The enthalpy value of PCM can be expressed as:
——the apparent heating value of PCM, J;
——the phase transition enthalpy occupied by PCM, J;
The sensible heat of PCM is represented as:
——reference enthalpy, J;
——reference temperature, K;
The phase transition enthalpy occupied by PCM is expressed as:
——latent heat of phase change, KJ/kg;
——liquid phase ratio, 0<<1.
The momentum source term can be expressed as:
In the equation,the coefficient is a constant in the mushy zone, with a value range from 104 to 107,and typical value 105.
During the phase change process, the PCM coexists in solid, liquid, and mushy phases, involving coupled heat transfer mechanisms including conduction, convection, and solid-liquid phase transition. To facilitate computation, the following simplifications are applied to the physical model based on the assumptions below [45,46]:
①The PCM is uniformly distributed and isotropic.
②The PCM adheres to the Boussinesq approximation, where density variations are considered only in the buoyancy term of the momentum equation.
③Supercooling and superheating phenomena are neglected during the phase change process.
These assumptions significantly simplify the heat transfer problem within the phase change model. The present study analyzes the phase change heat transfer characteristics in the double-layer PCM-EST and performs numerical simulations of the melting and solidification processes of the PCM within this structure.
2.4. Boundary Conditions and Parameter Settings
①Boundary Conditions for the Heat Storage and Release Process in the PCM-ESTBoundary conditions for both the inner and outer sides of the PCM-EST:
② Initial conditions
(1) The initial temperature of the phase change unit is 25 °C;
(2) The inlet temperature of the hot fluid flowing through the inner tube is in a constant temperature state of 60 °C;
(3) The insulation layer wrapped around the casing wall can be regarded as the insulation boundary, q=0;
(4) The fluid is a coolant (50% ethylene glycol aqueous solution) with a flow rate of 6 L/min (0.102 kg/s), and the parameters are shown in Table 3.
2.5. CFD Numerical Simulation
To evaluate the influence of different structural parameters on thermal performance, CFD numerical simulations were performed using ANSYS Fluent. The simulations utilized a three-dimensional (3D) transient model incorporating the energy equation, the solidification/melting model, and the laminar flow model to simulate the PCM phase change. Figure 3 illustrates the melting state of the PCM-EST at a particular cross-section.
The computational domain was discretized using an appropriate meshing technique, with local mesh refinement implemented near the fin regions. Figure 4 provides a schematic of the mesh topology for the two distinct structures.Mesh independence was verified through a systematic study. Using the baseline energy storage tube configuration (n=0, H=0) as a representative case, the liquid phase fraction results were compared across progressively refined mesh densities. Mesh independence is confirmed when the simulation results stabilize, exhibiting minimal variation with further mesh refinement. Conversely, if the results persistently increase or decrease without convergence, the mesh is deemed insufficiently refined, necessitating additional densification.
The results are presented in Figure 5. The x-axis represents the number of mesh elements, and the y-axis represents the liquid mass fraction of the PCM within the energy storage tube. The figure displays the liquid mass fractions at 10 minutes (red) and 20 minutes (blue) for three distinct mesh densities: 4.2×10⁵, 8.5×10⁵, and 12.5×10⁵ elements. Comparing the simulation results across the three mesh densities reveals that the coarsest mesh (4.2×10⁵ elements) yields less accurate results. In contrast, the results obtained with the finest mesh (12.5×10⁵ elements) are nearly identical to those using the medium mesh (8.5×10⁵ elements). However, the element count of the finest mesh is approximately 1.5 times higher than that of the medium mesh, significantly increasing computational cost. Given that excessively high mesh counts impair computational efficiency without substantially improving accuracy beyond the medium mesh, the medium mesh density (8.5×10⁵ elements) was selected. This choice ensures a balance between simulation accuracy and computational efficiency. Therefore, the optimal mesh size for the phase change unit in this study is approximately between 8.5×10⁵ and 9.5×10⁵ elements.
The simulations employed a 3D segregated-transient solver, incorporating the energy equation, the solidification/melting model, and the laminar flow model. Pressure-velocity coupling was handled using the SIMPLEC algorithm. Discretization of the momentum and energy equations utilized a second-order upwind scheme [46].The residual convergence criteria for all equations retained their default solver settings. Under-relaxation factors were set as follows: pressure (0.3), density (1), momentum (0.7), liquid fraction (0.9), and energy (1). The time step was fixed at 0.02 s, with a maximum iteration limit of 20 per time step. Convergence was achieved when the scaled residuals reached 10−6 for energy and 10−3 for velocity.
3. PCM-EST Parameter Sensitivity Analysis and Selection
Integrated within the liquid cooling loop of electric vehicle BTMS, the PCM-EST leverages the latent heat of its PCM to effectively regulate battery temperature and reduce overall vehicle energy consumption. Consequently, evaluating the heat absorption and release performance of the PCM-EST is a critical first step in designing such thermal management systems. This study analyzes the PCM-EST’s heat transfer characteristics based on the temperature of the coolant circulating through the battery pack. Using ANSYS software, the temperature field distribution within the designed PCM-EST was simulated. The simulation results were then analyzed to determine optimal design parameters, which were subsequently implemented in the BTMS.
3.1. Impact of the Fins Number
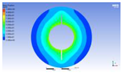
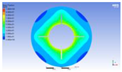
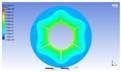
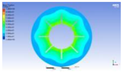
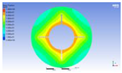
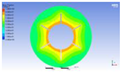
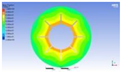
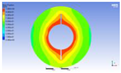
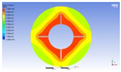
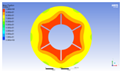
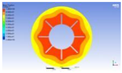
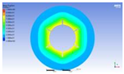
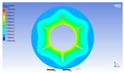
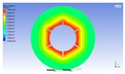
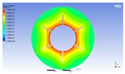
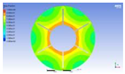
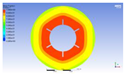
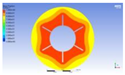
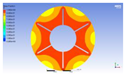
This section examines the influence of fin count (n) on the PCM’s heat storage and release characteristics while maintaining constant fin height (10 mm) and tube length (1000 mm). By exclusively varying the number of fins (n = 0, 2, 4, 6, 8), the phase evolution during melting is observed. The melting state of the PCM at different time intervals is illustrated in Table 4, where red and blue denote the liquid and solid phases, respectively. Figure 6 shows the temporal variation of the PCM liquid mass fraction for these five double-layer PCM-EST configurations.
Table 4 reveals distinct phase interface characteristics in the double-layer PCM-EST. The finless configuration exhibits a circular phase interface, whereas finned designs show interfaces conforming to the fin geometry due to their dominant influence on conductive heat transfer. This demonstrates conduction as the primary heat transfer mechanism. As melting progresses, the liquid phase expands progressively until complete phase transition occurs. Significant variations in phase interface morphology are observed across all configurations during melting. Crucially, the uniformity of the phase front correlates directly with fin count. Phase change initiates preferentially near thermal conductors—specifically at the heat transfer tube surface and along the fins.
As shown in Figure 6, the addition of fins significantly reduces the phase change time of the PCM within the tube compared to a finless tube, thereby enhancing energy storage efficiency. The complete melting times for PCM corresponding to fin numbers of n = 0, 2, 4, 6, and 8 are 1500 s, 1450 s, 1210 s, 1130 s, and 1060 s, respectively. While the reduction in melting time with 2 fins (n=2) is relatively modest, a more substantial improvement is observed with n=4, 6, and 8 compared to n=2. Furthermore, the differences in melting time among the n=4, 6, and 8 configurations are not pronounced. Therefore, considering practical factors such as process complexity and cost, this study selects the n=6 configuration as the focus for analyzing the impact of other parameters on heat transfer within the double-layer PCM-EST and for subsequent optimization.
3.2. Impact of Fin Height Proportion
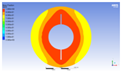
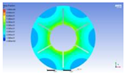
This section primarily analyzes the effect of fin height on the heat storage and release performance of the PCM, the melting/solidification rate within the PCM-EST, and the temporal evolution of PCM temperature. As established in Section 3.1, the configuration with n=6 fins exhibits a significant effect on PCM thermal performance. While further increasing the fin count yields diminishing returns in heat storage/release efficiency improvement, it also increases process complexity and cost. Therefore, adopting the n=6 fin configuration and maintaining a fixed tube length of 1000 mm, this section specifically investigates the effect of varying fin height. The melting process is compared across four double-layer storage tube models with fin heights of h = 0, 5, 10, and 15 mm. Table 5 below presents the temporal evolution of the PCM’s liquid fraction boundary within the double-layer tube at these different fin heights.
Table 5 demonstrates that, for a fixed diameter and length of the energy storage tube, incorporating fins into the heat transfer tube effectively reduces the heat storage duration. Specifically, the time required for PCM melting decreases with increasing fin height. However, the incremental reduction in melting time diminishes as the fin height increases further.
As shown in Figure 7, for the n=6 configuration, the time required for complete PCM melting decreases from 1500 s (h = 0 mm) to 1140 s (h = 5 mm), 1060 s (h = 10 mm), and 1030 s (h = 15 mm). These results indicate a positive correlation between fin height and PCM thermal energy storage/release efficiency. Nevertheless, the selection of fin height is constrained by the physical dimensions of the double-layer PCM-EST; specifically, the fin height ’’ must be less than . Moreover, beyond a certain fin height, further increases yield diminishing returns, resulting in a negligible effect on PCM thermal performance. This signifies the existence of a maximum effective fin height, beyond which performance improvements become insignificant.
3.3. Impact of Tube Section Dimensions
Given that the diameter () and length () of the insulation layer in practical energy storage tube applications are often constrained by installation site requirements and spatial limitations, this section investigates the impact of tube length on PCM melting while holding both the insulation layer diameter and PCM volume constant. The PCM volume is maintained at the value established in Section 2.2, specifically Vpcm1=2.5 L. Table 6 details the parameters for the different structural configurations analyzed. Under the constraint of constant PCM volume, the length of the double-layer PCM-EST is varied, with the insulation layer diameter being correspondingly adjusted. Tube lengths of 900 mm, 1000 mm, 1200 mm, 1400 mm, and 1500 mm are examined to assess the influence of tube dimensions on the PCM melting rate.
Under the condition of ensuring that the volume and diameter of PCM remain unchanged, five double-layer PCM-EST models are constructed based on the value of the length of the PCM-EST ( taking integers downwards). According to the research in section 3.2 of the previous section, the value for this section is set at a distance of 5mm from the top of the fin height to the inner wall surface of the outer tube, and the corresponding value is obtained. The parameters are shown in Table 6 below:
Refer to section 2.4 for Fluent’s simulation boundary conditions, inlet conditions, and environmental condition settings. The graphs showing the melting time of PCM are shown in Figure 8 and Figure 9.
Figure 8 demonstrates the impact of tube length on PCM melting time. Under constant PCM volume, increasing tube length enlarges the heat transfer area, accelerating PCM melting. Beyond optimal lengths, however, further elongation yields diminishing returns while increasing the system mass.
Figure 9 presents fluid outlet temperature profiles for different tube lengths in the double-layer PCM-EST. At a constant inlet temperature of 298.15 K and fixed PCM volume/insulation diameter, longer tubes require larger heat transfer tube diameters. This configuration increases internal fluid volume while reducing heat transfer efficiency per unit area. Consequently: Longer tubes (1200-1500 mm) maintain lower initial outlet temperatures due to greater fluid volume. Their larger diameters reduce wall heat flux, causing delayed but rapid temperature surges (observed after 600 s).Shorter tubes (900-1000 mm) exhibit sharper temperature rises earlier (1100 s) due to enhanced heat exchange efficiency.
Therefore, tube length and heat transfer tube diameter significantly influence PCM melting dynamics in double-layer energy storage systems under constant PCM volume. Increased tube dimensions prolong fluid residence time, producing a characteristic thermal response: Longer tubes exhibit initial outlet temperature depression followed by gradual recovery; This occurs because larger fluid volume (proportional to L × D2) reduces the inlet-outlet temperature gradient during later melting stages.Consequently, the system’s cooling capacity diminishes as tube length increases. Post complete PCM melting, latent heat storage capacity is exhausted, causing outlet temperature to rapidly approach inlet temperature. Notably, longer tubes achieve temperature stabilization earlier. Based on parametric analysis, the 1200 mm tube configuration (n=6 fins, H=8 mm) was selected as the optimum base model, balancing thermal performance and geometric constraints.
4. Optimization of Energy Storage Tube Parameters Based on Particle Swarm Algorithm
4.1. Optimization Design of PCM-EST Structure Parameters
The structural parameters of PCM-ESTs primarily include the tube length , the number of fins n, the height of the fins , the diameter of the heat transfer tube , and other design parameters. In current research on the optimization design of phase change energy storage devices, the focus is generally on optimizing one of the many variables. In this study, the design variables selected are the tube length, the number of fins and the fin height. The volume of PCM, inlet temperature, and inlet flow rate are kept constant.A mathematical relationship is established between these three design variables (,n, ) and the heat transfer coefficient of the PCM-EST. Based on this, an evaluation of related indicators is conducted. Below is the optimization design process for the PCM-EST.
4.1.1. Optimization Process
The optimization steps are outlined in the following diagram (Figure 10):
Figure 10 outlines the optimization workflow for energy storage tube parameters, comprising three critical phases: design sample generation, surrogate model development/validation, and optimal solution search. This iterative process continuously refines design performance through the following steps:
① Design Variable Range Definition: establish value ranges for key parameters: tube length (L), fin count (n), and fin height (H).
② Design Sampling via Latin Hypercube (LHS): generate parameter combinations using Latin Hypercube Sampling - a stratified statistical method that ensures representative coverage of multivariable design space with minimal computational points.
③ Geometric Modeling and CFD Simulation: construct 3D geometries for each sampled design and perform CFD analyses to: Quantify fluid-PCM heat transfer dynamics; Evaluate overall thermal efficiency; Calculate system mass.
④ Surrogate Model Construction: develop a mathematical proxy mapping, enabling rapid performance prediction without full CFD recomputation.
⑤ Model Validation and Refinement: verify prediction accuracy against CFD benchmarks. If R2 < 0.95 (or RMSE > threshold), augment training data and retrain model iteratively until convergence.
⑥ Multi-Objective Optimization (MOPSO): apply the Multi-Objective Particle Swarm Optimization algorithm to navigate the Pareto frontier using the validated surrogate, balancing competing objectives.
⑦ Optimal Configuration Selection: finalize heat exchange structure based on predefined design priorities.
4.1.2. Design Variables
The parameter range determined in this study is as follows::900-1500 mm;n:0-8;The value of is affected by the volume of PCM and the length of the tube, and the calculation formula is as follows:
The upper limit of the fin height is affected by the pipe diameter、, so the calculation formula for the maximum fin height is as follows:
Here, the proportion of fin height is taken as the variable:
Under the condition of ensuring the PCM type, inlet fluid temperature, inlet flow rate, and insulation layer diameter are constant, in order to facilitate the calculation of the heat transfer pipe diameter and , the value of the heat transfer pipe diameter is rounded down to the nearest 100 mm. The range of optimized parameter values is shown in Table 7, where the HTF inlet temperature is 60 °C.
4.1.3. Tube Heat Transfer and Pressure Drop Theory and Evaluation Indexes
When studying the heat transfer capability of the tube, its increased resistance must be considered comprehensively in evaluating its performance. In calculating the tube’s heat transfer performance, the fluid flow state is commonly represented by a criterion number , which is calculated using the following formula:
——the density of fluid working fluid, Kg/m3;
——the dynamic viscosity of fluid working fluid, N·s/m2;
——the velocity of fluid working fluid, m/s;
——the pipe diameter, mm.
The pressure loss during fluid flow is usually represented by the flow resistance coefficient, and its calculation formula is:
——the pressure drop at the inlet and outlet of the pipe section,Pa;
——the pipe length, m;
——the average velocity inside the pipe, m/s.
The heat transfer capacity of a double-layer PCM-EST is represented by , and its calculation formula is:
——the thermal conductivity of fluid, W/(m∙K)
——the convective heat transfer coefficient of a fluid, W/m2·K.
The calculation formula for the heat transfer coefficient is:
——the convective heat transfer area, m2;
——the average heat transfer temperature of the wall, °C;
——the average temperature of the fluid working fluid, which is usually simply calculated as the average temperature of the inlet and outlet fluids, °C;
——the convective heat transfer, J;
The calculation formula for heat exchange is:
——the mass flow rate of the fluid, kg/s;
——the specific heat capacity of a fluid, J/(kg∙K);
——the outlet temperature of the fluid, °C;
——the inlet temperature of the fluid, °C;
The comprehensive heat transfer enhancement performance (PEC) of double-layer PCM-ESTs is usually defined as the ratio of the convective heat transfer coefficient on the surface of the double-layer PCM-EST to the convective heat transfer coefficient on the initial tube surface.
——the initial Nusselt number of the tube;
——the resistance coefficient of the initial pipe;
The initial Nusselt number of the tube can be calculated using the Dittus Boelter formula:
When the fluid is heated, =0.4; When the fluid is cooled,= 0.3.
The resistance coefficient of the initial tube can be calculated using the Blasius formula:
According to the above formula, the Nusselt number and resistance coefficient of the pipe, as well as the theoretical Nusselt number and resistance coefficient of the smooth pipe, can be calculated. In order to facilitate the determination of the comprehensive performance after structural changes, the values here are =1、n=0、, The double-layer PCM-EST is used as the initial model for research.
4.2. Optimization Using Particle Swarm Algorithm Based on Kriging Surrogate Model
In the previous section, we discussed the design variables and heat transfer performance of the double-layer phase change storage tube. Next, the design variables will be used to perform sample extraction and CFD simulations in order to construct the necessary surrogate models. The Latin Hypercube Sampling (LHS) method is used to sample the tube length(), number of fins (n), and fin height ratio(). The results from all sampled model design parameters and corresponding CFD results are input into the optimization program to obtain the Kriging surrogate model, which is then used to find the optimal design values using Particle Swarm Optimization.
4.2.1. Sampling and Numerical Simulation
Once the range of design variables is determined, the next step is to perform sampling using the LHS method. LHS helps efficiently generate design space samples for heat exchange unit geometries. The primary advantages of LHS are its ability to fill the design space effectively and fit nonlinear responses, ensuring that each level of a factor is tested exactly once47. For instance, in an n-dimensional space, we extract m samples, where the n-dimensional coordinates are divided into m intervals,one sample is randomly chosen from each interval.By using this approach of spatially uniform sampling and random combination of levels, we can construct an accurate surrogate model with fewer sample points.With the sampled combinations, we proceed with the geometric modeling and CFD numerical solving process. This allows us to obtain performance parameters corresponding to each model sample, which are then used to build the Kriging surrogate model. Through this model, the approximate mapping relationship between the design parameters and performance parameters can be established.The sampling results are shown in Figure 11.
4.2.2. Establishment of the Surrogate Model
When optimization problems are highly nonlinear or lack explicit formulations, Kriging models are commonly employed to establish the corresponding mathematical representations. Kriging surrogate models are particularly well-suited for parameter optimization problems, as they can rapidly construct mathematical approximations of computational simulations, numerical analyses, or physical experimental outcomes. These models offer significant advantages, including reduced computational time and lower resource requirements, without sacrificing accuracy.
In this section, the surrogate model is established on the Matlab platform using the DACE (Design and Analysis of Computer Experiments) toolbox48, which compiles the design parameters and CFD simulation results. The design variables include the length of the double-layer phase change thermal energy storage tube (), the number of fins n), and the fin height ratio . The dependent variables are the enhanced heat exchange performance of the pipeline, the heat transfer capability of the pipeline, the resistance coefficient of the inner tube, and the overall mass of the pipeline. These parameters are used to construct the surrogate model.
The 30 data sets extracted in Section 4.2.1, along with their corresponding CFD results, are loaded into MATLAB. Using the dacefit function, a Kriging model is constructed. The regression types for the model parameters were selected based on a comparison of their goodness-of-fit, as measured by the coefficient of determination (R2). The resulting R2 values are presented in Table 8.
By comparing the goodness-of-fit R2 values, it can be observed that the closer the surrogate model’s R2 is to 1, the higher the model’s accuracy, indicating a better model. Among them, the regression equations represent PEC, 2 represent m, 3 represent Nu, and 4 represent f. For the regression mode , when using the first-order regression polynomial (regpoly1), the best fit achieved is 0.8235. The regression models for 0th, 1st, and 2nd orders all show values above 0.9, with the maximum value achieved using the second-order regression polynomial (regpoly2). For the 0th-order regression model (regpoly0), the maximum is 0.9153, and for the 1st-order regression model, the maximum is 0.9332, which suggests the use of the 0th-order regression polynomial (regpoly0). For the correlation models in the parameters, corrgauss was selected, and all other parameters were set to their default values.
Utilizing the parameters defined above, the corresponding Kriging surrogate model was constructed, and its associated error analysis plots were generated. These plots are presented in Figure 12, Figure 13, Figure 14 and Figure 15. For each figure, the left panel displays the surrogate model’s predicted values versus the actual (or real) values, while the right panel presents the corresponding error values as a bar chart.
4.2.3. Analysis of the Influence of Multiple Variables on Y1()、Y2(m)、Y3()、Y4()
Based on the surrogate model mentioned above, the response surfaces of the design variables ((),n),) and the independent variables (、、、m) are plotted. These response surfaces provide a clear visual representation of how the design variables impact the dependent variables, making it easier to observe their influence trends. This analysis will provide guidance and direction for subsequent structural optimization.
Figure 16 to 19 display the three-dimensional response surfaces for each of the design variables ((),n),) while holding one of the variables constant. These plots illustrate how the remaining two variables influence the performance indicators 、、、m.
In Figure 16, it can be observed that both n and have a positive influence on , and their effects are significant. This is consistent with the analysis results in Section 3.1 and Section 3.2. Regarding the effect of , it is clear that as increases, the performance first improves and then decreases, with the maximum value occurring around =1400.
In Figure 17, the analysis of the three variables on the three-dimensional response surface reveals that as increases, the resistance coefficient inside the pipe decreases, and the effect is significant. This is related to the increase in the heat transfer pipe diameter with the increase of under a fixed volume, as described in Equation (17). Additionally, the figure shows that the influence of L and n、 on is relatively small and can almost be neglected.
In Figure 18, it can be observed that the value of depends on both and . Combining the influences of the three variables on and , it can be seen that as increases, decreases, but also reduces overall. Additionally, the variable n、 is positively correlated with , while has little to no effect on it. Based on Figure 17, the relationship between the variables and is consistent, following an overall trend. From the figure, it can be roughly determined that when the values of are maximized, 、n、 tend to approach the upper limits of their respective ranges.
Since the structural design of the double-layer PCM-EST takes into account its own weight m, in order to achieve a lightweight design, the relationship between the three design variables and the mass m is analyzed. The response graph is shown in Figure 19. In practical use, liquid volume exists inside the inner tube, and this factor is considered in the weight calculation. Therefore, as seen in Figure 19, all variables 、、 are positively correlated with the mass m, with the influence of being more significant. To meet the lightweight design requirement, the goal is to minimize m, meaning the values of 、、 should be reduced.
Through the analysis above, the relationship between the design variables 、、 on and m can be concluded. In this study, we aim to satisfy both max() and min(m) objectives. However, these two objectives present a conflict in the values of the design variables 、、, so structural parameter optimization for the double-layer PCM-EST must be performed based on these two goals.
4.2.4. Multi-Objective Particle Swarm Optimization (MOPSO)
MOPSO is an extension of the PSO algorithm, specifically designed to address multi-objective optimization problems (e.g., minimizing energy consumption while maximizing comfort). Its core philosophy emulates the foraging behavior of bird flocks to search for Pareto-optimal solutions in the solution space. Compared with traditional multi-objective algorithms (such as NSGA-II), MOPSO offers advantages of faster convergence and simpler parameter setting.In each iteration, the particle updates its position by tracking the best-known position, known as pbest, and the global best position, denoted as gbest. The pbest is the best position a particle has ever achieved, while gbest is the best position achieved by any particle in the swarm. Once these “extreme values” are identified, the particle’s velocity and position are updated to find the global optimal solution49. This algorithm is easy to implement, highly accurate, and converges quickly, making it a top choice for solving practical problems. The optimization equation for MOPSO in MATLAB is as follows:
——comprehensive performance of pipeline heat transfer enhancement during simulation process ;
——the quality m;
Design variables represent、、 respectively.
The Kriging surrogate model constructed based on section 4.2.2 above uses MOPSO algorithm to find the optimal solution with the objective of and ; The iterative process is shown in Figure 20.
In the process of using MOPSO to find the optimal surrogate model, the surrogate model’s solution is based on the predicted values rather than the direct CFD results. To ensure the accuracy of the optimal solution, a 3D model is constructed based on the parameters of the variables obtained from the solution set (x1 = 930 mm, x2 = 6, x3 = 0.8954). The original design structure, as described in Section 3.3, has parameters (=1200,n=6,= 0.485). The CFD results for the two structures were compared and computed in ANSYS, as shown in Table 9. The comparison of the PCM melting mass fraction at the outlet of PCM-EST before and after optimization is presented in Figure 21.
Structural modifications to the double-layer PCM-EST directly impact heat transfer tube diameter. Under constant-volume constraints, reduced tube length necessitates decreased tube diameter, increasing the fluid friction factor. While fin additions (increased count and height) enhance heat transfer capability, they simultaneously increase tube mass. Conversely, diameter reduction decreases fluid volume, lowering PCM-EST mass. This creates a fundamental design tradeoff requiring balanced optimization of thermal performance versus system mass.
Table 9 results demonstrate that the optimized configuration improves convective heat transfer while increasing flow resistance. Crucially, though tube length decreased, the net reduction in hydraulic diameter lowers pressure loss. This yields an 8.7% enhancement in overall heat transfer coefficient, indicating superior thermal performance. Concurrently, total mass decreased by 0.732 kg (X% reduction), confirming optimization feasibility.
6. Conclusion
This study optimizes PCM-ESTs for NEV BTMS, targeting enhanced heat transfer efficiency and lightweight design. Through three-dimensional CFD simulations, we systematically analyzed how fin count, fin height ratio, and tube length influence composite PCM behavior during phase transitions. Results demonstrate that fin parameters significantly govern PCM-EST thermal performance and structural mass, confirming geometric optimization as an effective approach for improving system-level performance.
To balance thermal efficiency and mass reduction, we implemented a hybrid MOPSO-Kriging optimization framework. Parameter sampling, numerical modeling, and surrogate-based optimization yielded an optimal design showing 8.7% improvement in performance evaluation criterion (PEC) with 0.732 kg mass reduction. This validates the method’s dual-capability for thermal enhancement and lightweight achievement. Compared to single-variable approaches, multivariate cooperative optimization simultaneously increases heat transfer efficiency while mitigating parasitic mass penalties.
Our methodology provides an innovative solution for next-generation EV thermal management systems. By synergistically optimizing thermal performance and compactness, we enable reduced energy consumption and extended battery cycle life – enhancing vehicle sustainability. Future work should validate designs experimentally and explore advanced optimization strategies (e.g., topology optimization, AI-driven design) to further advance PCM-EST performance for continuously evolving EV thermal management requirements.
Funding
This work was supported by the Anhui Provincial Natural Science Foundation [grant numbers 2308085ME159].
Declaration of interests
The authors declare that they have no known competing financial interests or personal relationships that could have appeared to influence the work reported in this paper.
References
- Zhang, X., Li, Y., & Wang, J. (2018). A review on phase change materials for vehicle battery thermal management. Renewable and Sustainable Energy Reviews, 82, 3155-3168.
- Wu, W., Xu, X., & Zheng, Z. (2019). Thermal management of power battery packs with phase change materials: A comprehensive review. Energy Conversion and Management, 182, 262-281.
- Huang, R., Hong, W., & Yu, X. (2019). Experimental study on phase change cooling for lithium-ion power batteries. Experimental Technology and Management, 36(10), 81-85.
- Av, A., Ss, B., & Dr, A. (2019). A comparative study on battery thermal management using phase change material (PCM). Thermal Science and Engineering Progress, 11, 74-83.
- Maan, A., Ibrahim, D., & Rosen, M. A. (2019). A novel approach for performance improvement of liquid-to-vapor based battery cooling systems. Energy Conversion and Management, 187, 191–204. [CrossRef]
- Mehdi, M., Ehsan, H., & Mehdi, A. (2019). A novel hybrid thermal management for Li-ion batteries using phase change materials embedded in copper foams combined with forced-air convection. International Journal of Thermal Sciences, 141, 47-61. [CrossRef]
- Gou, J. R., Liu, W., & Luo, Y. Q. (2019). The thermal performance of a novel internal cooling method for the electric vehicle battery: An experimental study. Applied Thermal Engineering, 161, 114102. [CrossRef]
- Ramandi, M. Y., Dincer, I., & Naterer, G. F. (2011). Heat transfer and thermal management of electric vehicle batteries with phase change materials. Heat and Mass Transfer, 47(7), 777-788. [CrossRef]
- Park, S., Jang, D. S., Lee, D. C., et al. (2019). Simulation on cooling performance characteristics of a refrigerant-cooled active thermal management system for lithium-ion batteries. International Journal of Heat and Mass Transfer, 135, 131-141. [CrossRef]
- Fu, L. Q., Cao, D. Y., & Song, Y. F. (2019). Battery thermal management system based on phase change heat dissipation and resistance wire heating. Science and Technology Innovation, (17), 99-100.
- Liu, Z. Q., Huang, J. H., Cao, M., Jiang, G. W., Yan, Q. H., & Hu, J. (2021). Experimental study on the thermal management of batteries based on the coupling of composite phase change materials and liquid cooling. Applied Thermal Engineering, 185, 116415. [CrossRef]
- Farid, M. M., Khudhair, A. M., Razack, S. A. K., & Al-Hallaj, S. (2004). A review on phase change energy storage: Materials and applications. Energy Conversion and Management, 45(9-10), 1597-1615. [CrossRef]
- Khateeb, S., Amiruddin, S., Farid, M. M., & Selman, J. R. (2004). Design and simulation of a lithium-ion battery with a phase change material thermal management system for an electric scooter. Journal of Power Sources, 128(2), 292-307.
- Song, Z., Chen, H., Guo, H., et al. (2024). Dynamic simulation of a fuel cell vehicle heating system assisted by a heat storage device. Journal of Automotive Safety and Energy, 15(01), 54-62.
- Agyenim, F., Eames, P., & Smyth, M. (2010). Heat transfer enhancement in medium temperature thermal energy storage system using a multitube heat transfer array. Renewable Energy, 35(1), 198-207. [CrossRef]
- Chenhui Ji, et al., “melting performance of molten salt with nanoparticles in a novel triple tube with leaf-shaped fins.” case studies, Therm. Eng. 61 (2024)105063. [CrossRef]
- Chenhui Ji, et al., “melting performance improvement of phase change materials with thermal energy storage unit using nanoparticles.” case studies, Therm. Eng.61 (2024) 104892–104911. [CrossRef]
- Hassan Waqas, et al., “the impact of nano-infused phase change materials and blossom-shaped fins on thermal energy storage.” case studies, Therm. Eng. 65(2025) 105623. [CrossRef]
- Al-Abidi, A. A., Mat, S., Sopian, K., Sulaiman, M. Y., & Mohammad, A. T. (2013). Internal and external fin heat transfer enhancement technique for latent heat thermal energy storage in triplex tube heat exchangers. Applied Thermal Engineering, 53(1), 147-156. [CrossRef]
- Hosseini, M. J., Rahimi, M., & Bahrampoury, R. (2014). Experimental and computational evolution of a shell and tube heat exchanger as a PCM thermal storage system. International Communications in Heat and Mass Transfer, 50, 128-136. [CrossRef]
- Peiliang Yan, et al., Performance enhancement of phase change materials in triplex-tube latent heat energy storage system using novel fin configurations, Appl. Energy 327 (2022) 120064. [CrossRef]
- Yuxiang Hong, et al., Effect of T-shaped fin arrangements on the temperature control performance of a phase change material heat sink, Int. Commun. Heat Mass Trans. 148 (2023) 107073. [CrossRef]
- Benli Peng, et al., Collaborative optimization of intersectional angle and installation height of branched fin for ameliorating melting characteristics of lowly thermal conductive phase change materials (PCMs), Int. Commun. Heat Mass Trans. 147 (2023) 106999. [CrossRef]
- Mostafa Masoumpour-Samakoush, et al., Impact of innovative fin combination of triangular and rectangular fins on melting process of phase change material in a cavity, J. Energy Storage 45 (2022) 103545. [CrossRef]
- Hassan Waqas, et al., Melting performance of PCM with MoS2 and Fe3O4 nanoparticles using leaf-based fins with different orientations in a shell and tube-based TES system, Int. Commun. Heat Mass Trans. 158 (2024) 107944. [CrossRef]
- Yuwen, Z., & Faghri, A. (1996). Heat transfer enhancement in latent heat thermal energy storage system by using the internally finned tube. International Journal of Heat and Mass Transfer, 39(15), 3165-3173. [CrossRef]
- Qiao, H., & Wennan, Z. (2001). A study on latent heat storage exchangers with high-temperature phase-change material. International Journal of Energy Research, 25(4), 331-341.
- Jiang, G., Huang, J., Fu, Y., Cao, M., & Liu, M. (2016). Thermal optimization of composite phase change material/expanded graphite for Li-ion battery thermal management. Applied Thermal Engineering, 108, 1119-1125. [CrossRef]
- Wang, W., Wu, W., & Xu, X. (2020). Optimization of a phase change material-based thermal management system for lithium-ion battery modules using surrogate models and genetic algorithm. Applied Energy, 271, 115217.
- Yang, Y., Li, S., & Zhang, H. (2019). Multi-objective optimization of phase change material heat sinks using particle swarm optimization and Kriging model. Applied Thermal Engineering, 152, 103-113.
- Nicola Bianco, et al., Multi-objective optimization of a phase change material-based shell-and-tube heat exchanger for cold thermal energy storage: experimentsand numerical modeling, Appl. Therm. Eng. 215 (2022) 119047. [CrossRef]
- Zhenhui Liu, Chengyang Li,Optimizing the geometric parameters of double branched fins for improving the meltingperformance of PCM,Journal of Energy Storage,Volume 118,2025,116284. [CrossRef]
- Darzi, A. R., Farhadi, M., & Sedighi, K. (2012). Numerical study of melting inside concentric and eccentric horizontal annulus. Applied Mathematical Modelling, 36(9), 4080-4086. [CrossRef]
- Xia, T. (2021). Study on heat transfer enhancement of sleeve-type phase change energy storage unit with fins (Master’s thesis). Yangzhou University, Yangzhou.
- Liu, C. (2020). Experimental study on phase change heat storage and heat exchanger for waste heat recovery (Master’s thesis). Beijing University of Civil Engineering and Architecture, Beijing.
- Ye, S., Diao, Y., & Zhao, Y. (2014). Heat storage and release performance analysis of a novel flat heat pipe phase change heat storage unit. Electric Power Construction, 35(07), 136-140.
- Yang, Y., Liang, Y. N., Zhou, J. M., & Wu, Y. (2011). Study on heat transfer efficiency of shell-and-tube phase change thermal storage device. Thermal Science and Technology, 10(03), 226-230.
- Niu, F. X., Ni, L., Yao, Y., & Ma, Z. L. (2011). Study on heat storage characteristics of a triple-tube energy storage heat exchanger. Journal of Hunan University (Natural Science), 38(07), 69-72.
- Zhu, B., Du, R. H., Yao, M. Y., Zhao, Y. Y., & Zhang, Y. (2020). Research on battery thermal management of pure electric vehicles based on PCM. Power Supply Technology, 44(11), 1666-1670.
- Ma, Y. J. (2019). Design and simulation of phase-change-based power battery cooling. (Master’s thesis). Tsinghua University, Beijing.
- Du, R. H. (2021). Research on integrated thermal management system of pure electric vehicles based on PCM. (Doctoral dissertation). Hefei University of Technology, Hefei.
- Cao, X. L. (2019). Study on heat transfer characteristics and optimization design of a sleeve-type phase change heat storage device. (Master’s thesis). Southwest Jiaotong University, Chengdu.
- Wang, F. J. (2004). Computational Fluid Dynamics Analysis: Principles and Applications of CFD Software. Tsinghua University Press, Beijing.
- Darzi, A. R., Farhadi, M., & Sedighi, K. (2012). Numerical study of melting inside concentric and eccentric horizontal annulus. Applied Mathematical Modelling, 36(9), 4080-4086. [CrossRef]
- Karaipekli, A., Sari, A., & Kaygusuz, K. (2007). Thermal conductivity improvement of stearic acid using expanded graphite and carbon fiber for energy storage applications. Renewable Energy, 32(13), 2201-2210. [CrossRef]
- Xia, T. (2021). Study on heat transfer enhancement of sleeve-type phase change energy storage unit with fins. (Master’s thesis). Yangzhou University, Yangzhou.
- Yang, Y. Z., Wang, S. H., Chen, F., Yin, S. L., Song, Y. P., & Yu, J. Y. (2022). Optimization design of CW-type original surface heat exchange unit based on Kriging model. Journal of Engineering Thermophysics, 43(12), 3244-3251.
- Lophaven, S. N., Nielsen, H. B., & Sondergaard, J. (2002). DACE—A Matlab Kriging toolbox, version 2.0. Available online: http://www2.imm.dtu.dk/~hbn/dace/dace.pdf.
- Hao, Q. B., Gao, H., & Wan, S. J. (2018). A local support vector machine based on PSO feature weighting. Intelligent Computer and Applications, 8(06), 61-63+68.
Figure 1.
Schematic diagram of battery thermal management system using PCM-EST.
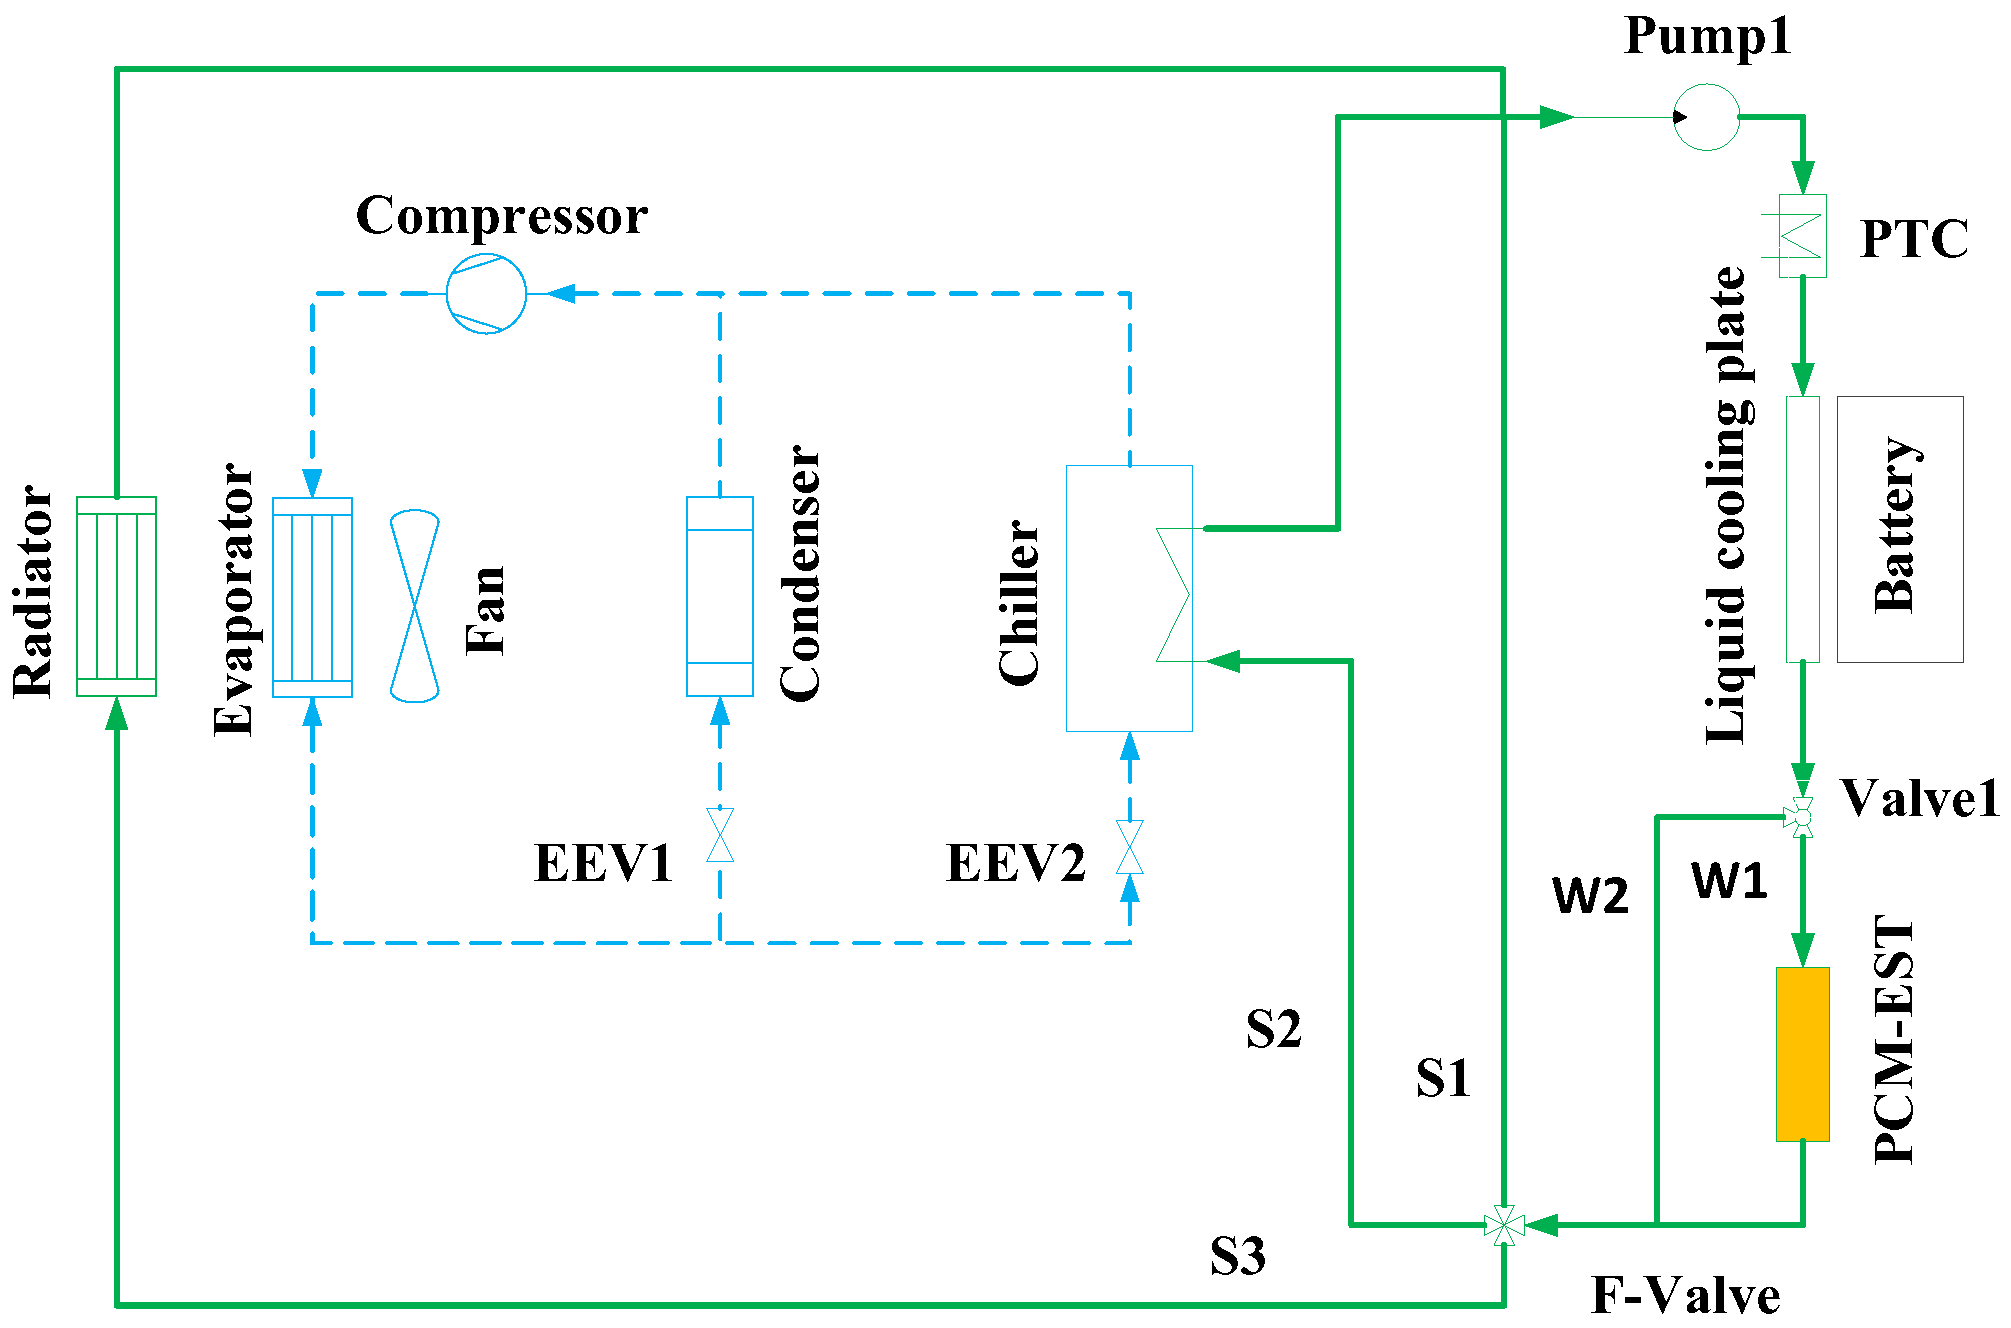
Figure 2.
Structure diagram of PCM-EST.
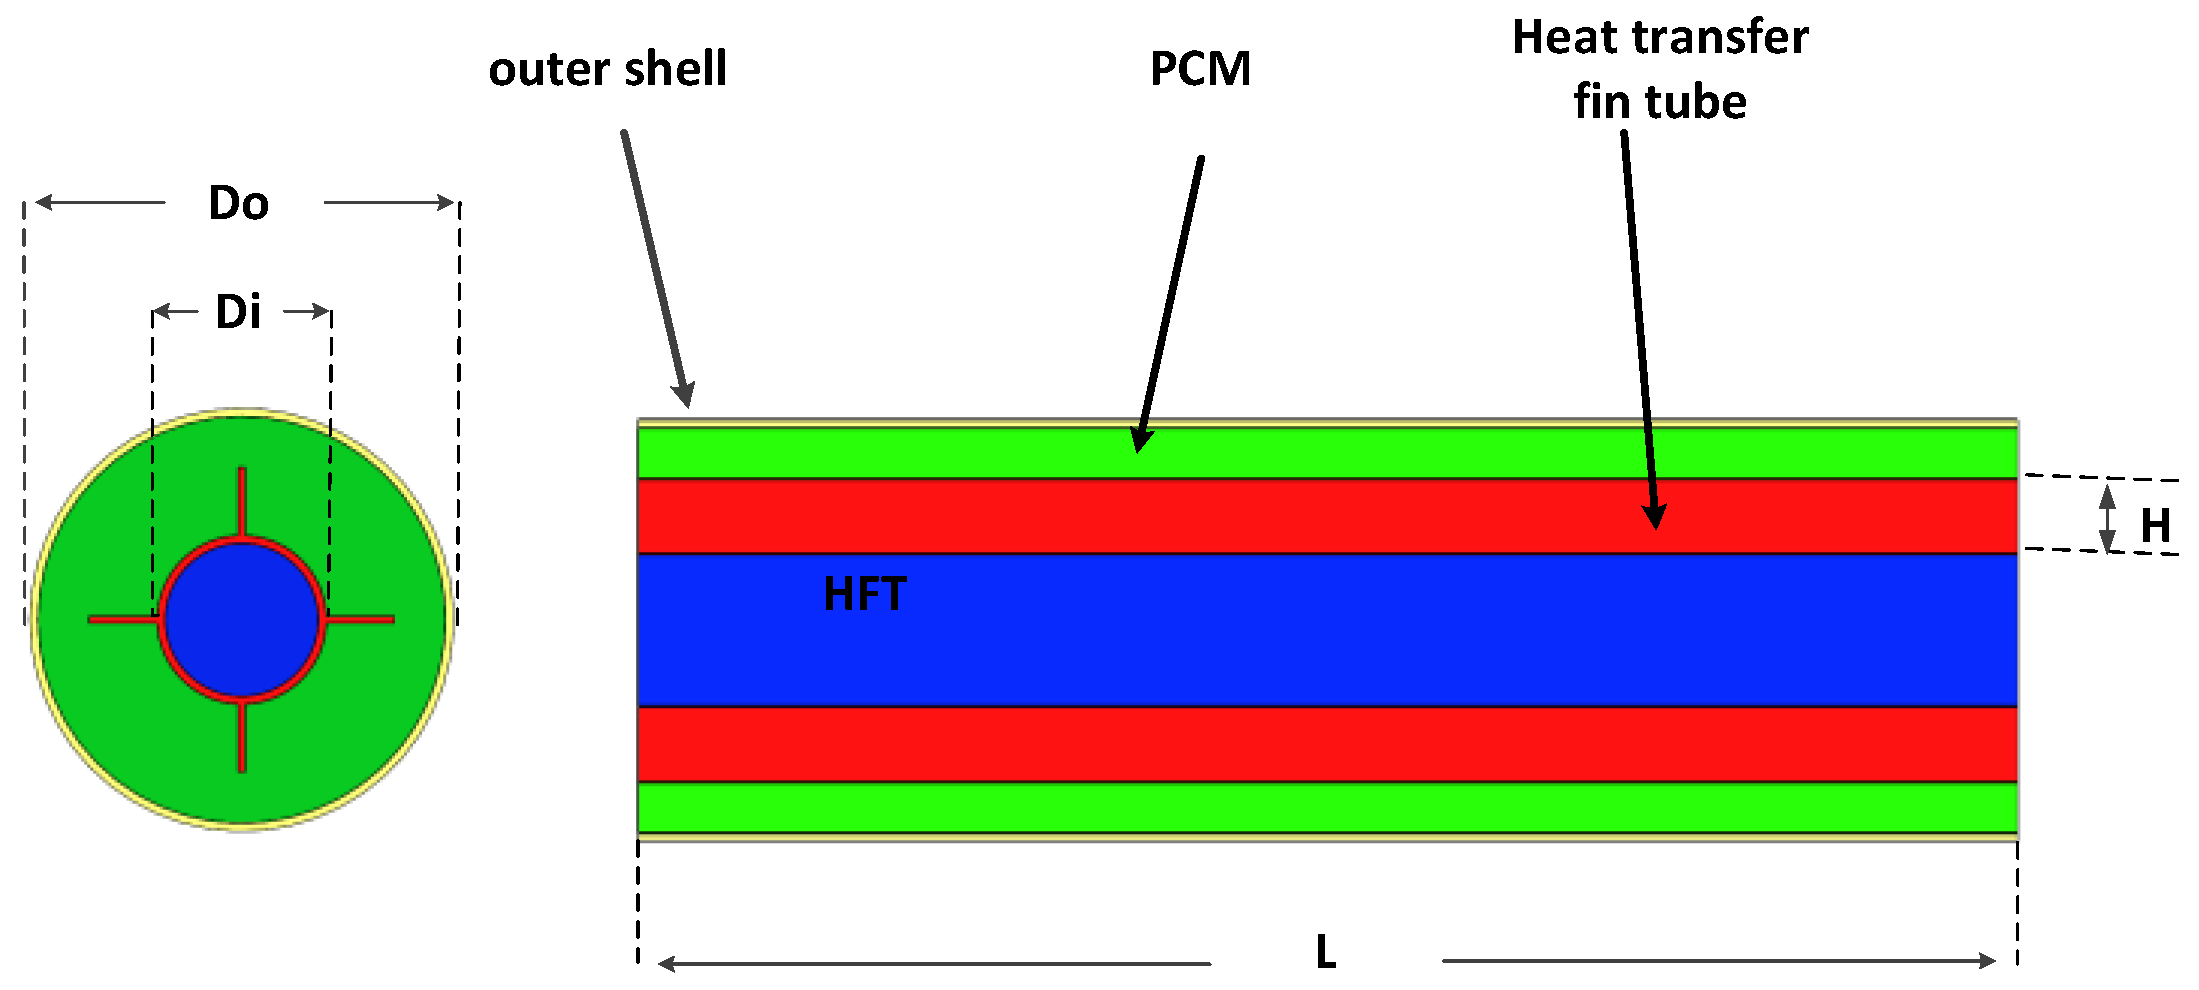
Figure 3.
PCM melting state.
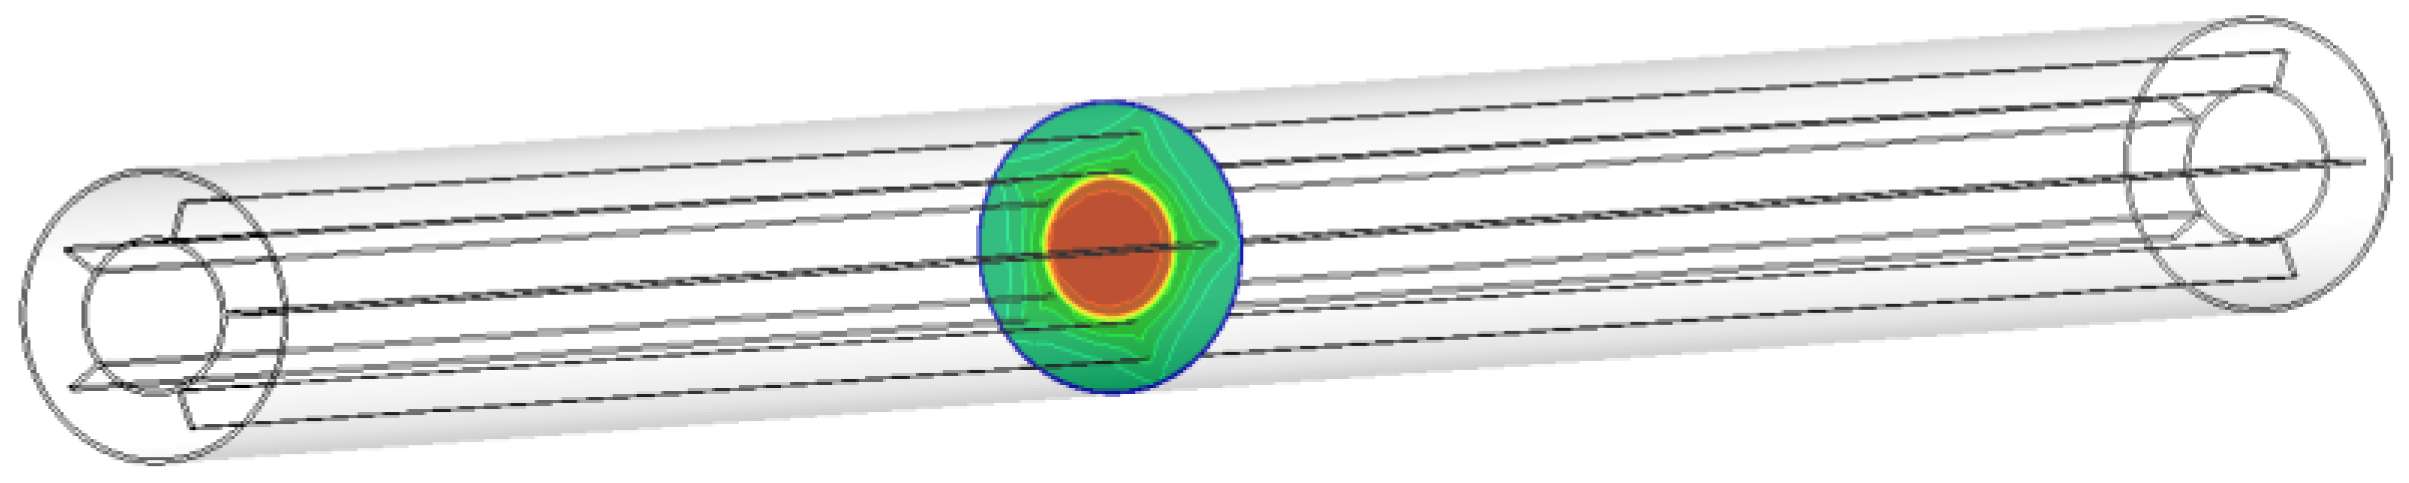
Figure 4.
Grid division diagram.
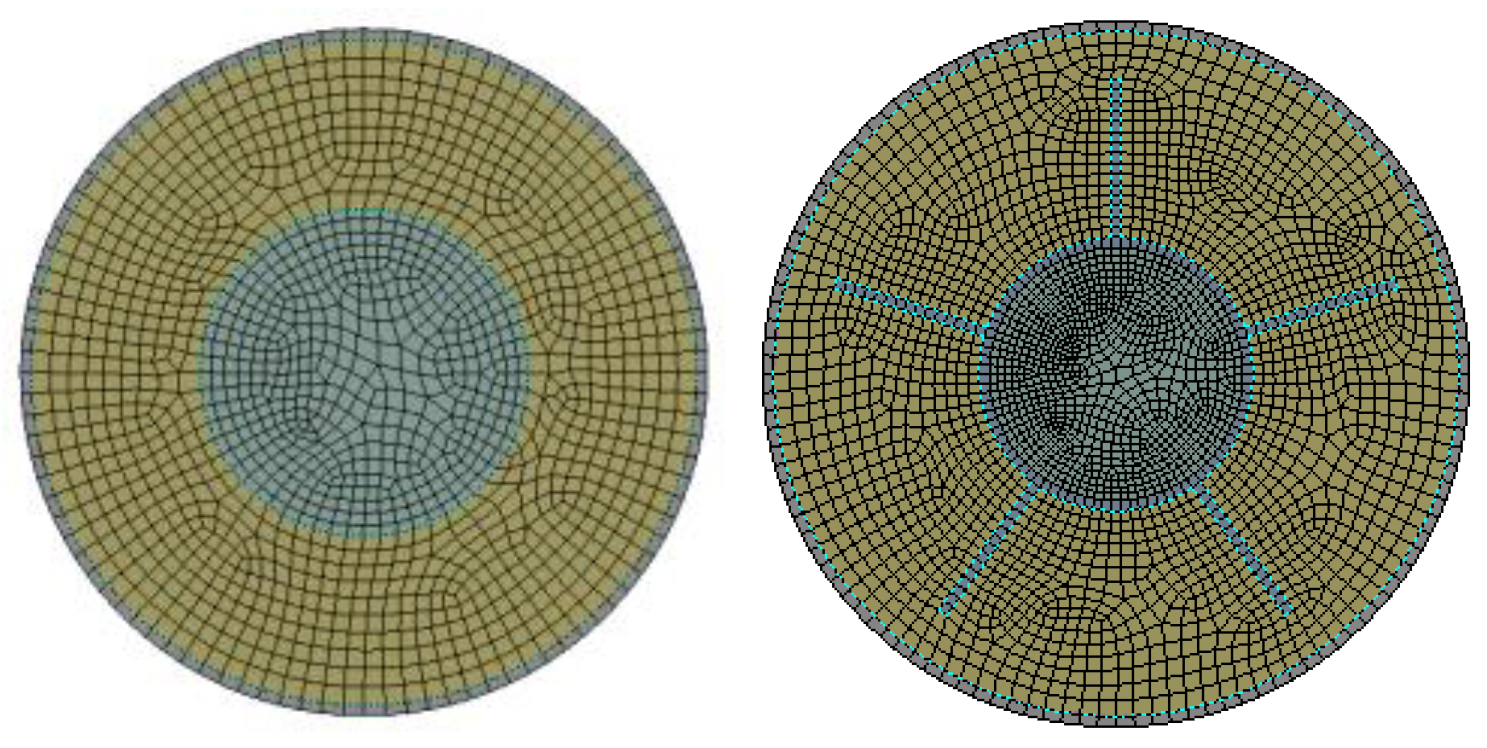
Figure 5.
Grid verification.
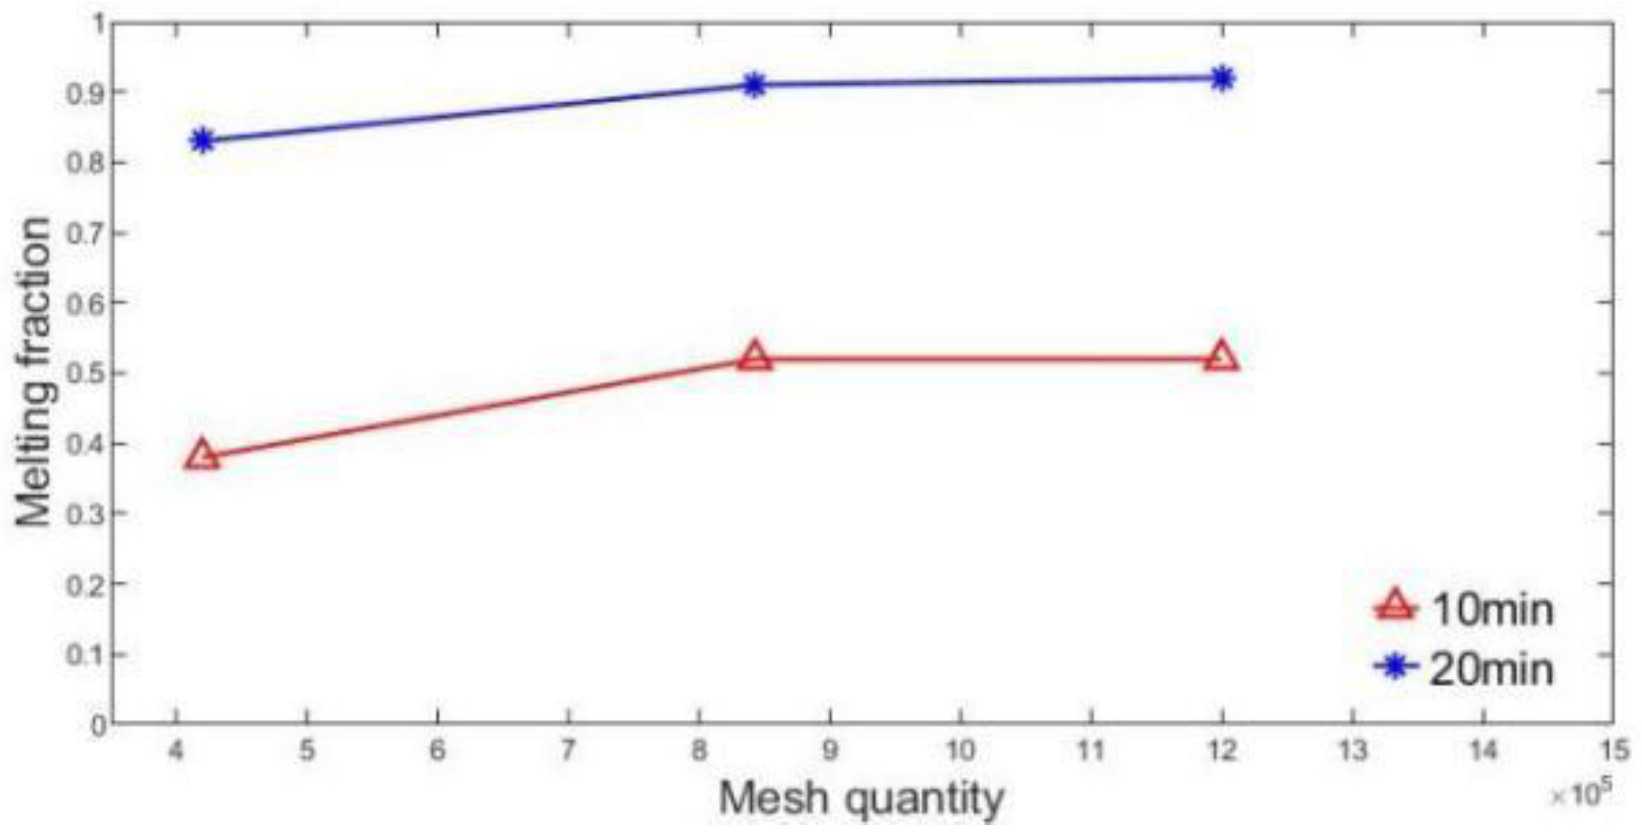
Figure 6.
Variation of melting fraction with time for different number of fins.
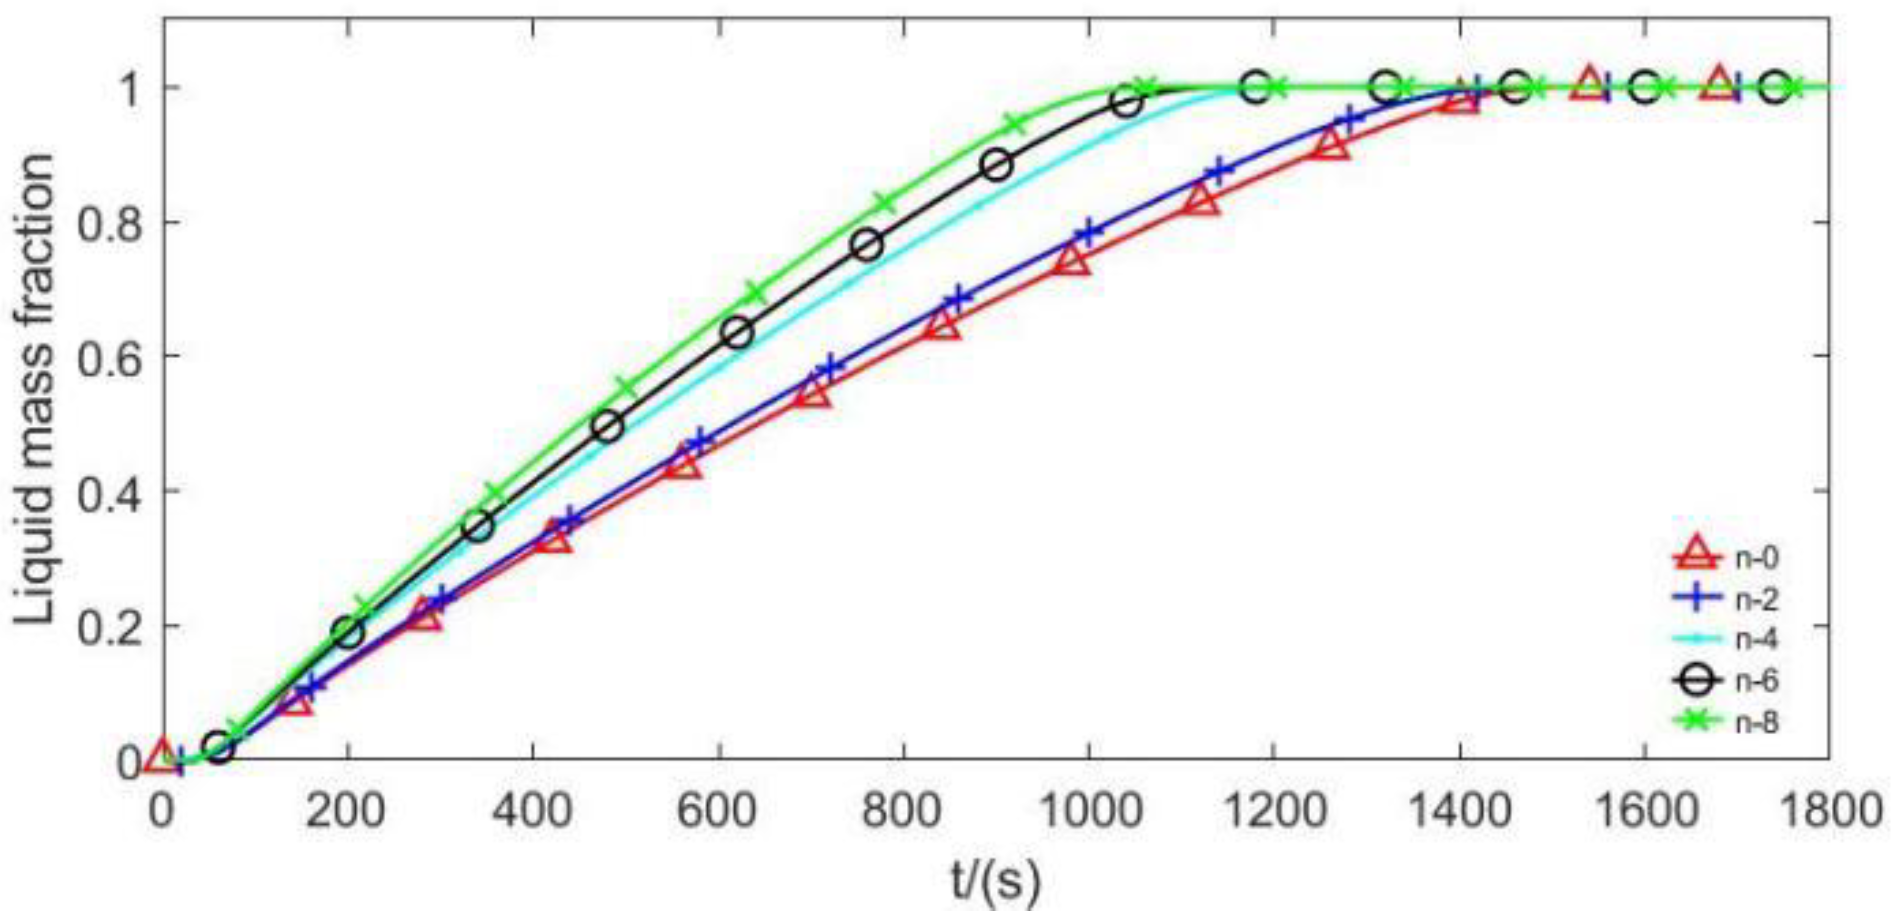
Figure 7.
Variation of melt fraction with time at different fin heights.

Figure 8.
PCM melting fraction versus time for different lengths.
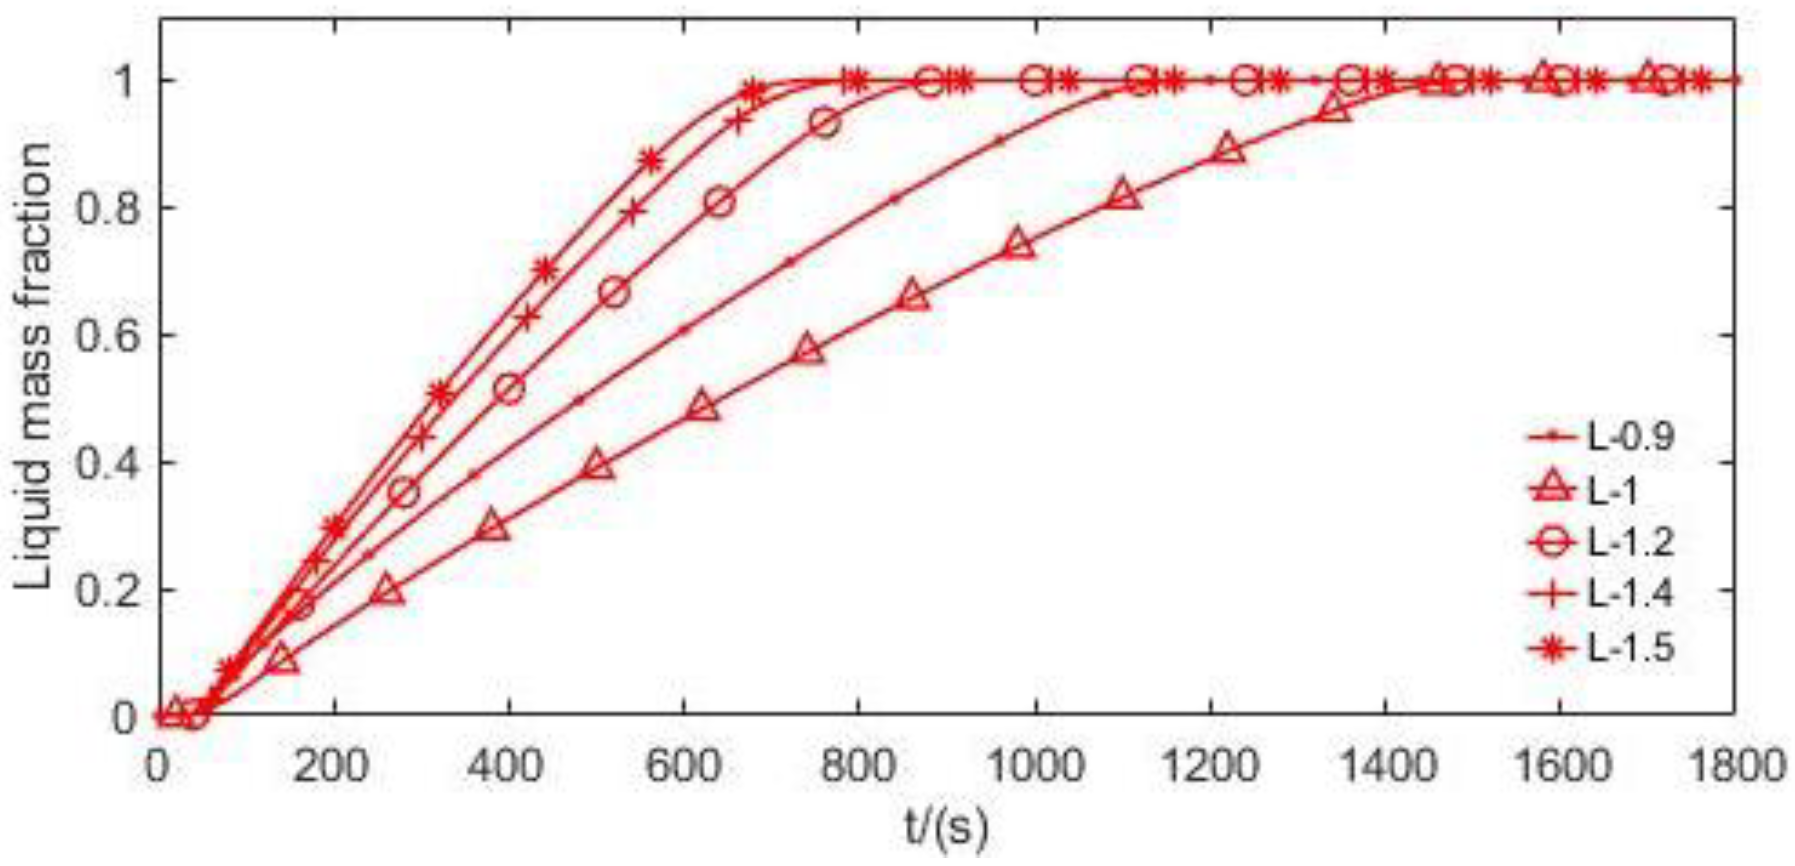
Figure 9.
Fluid outlet temperature-time at different lengths.
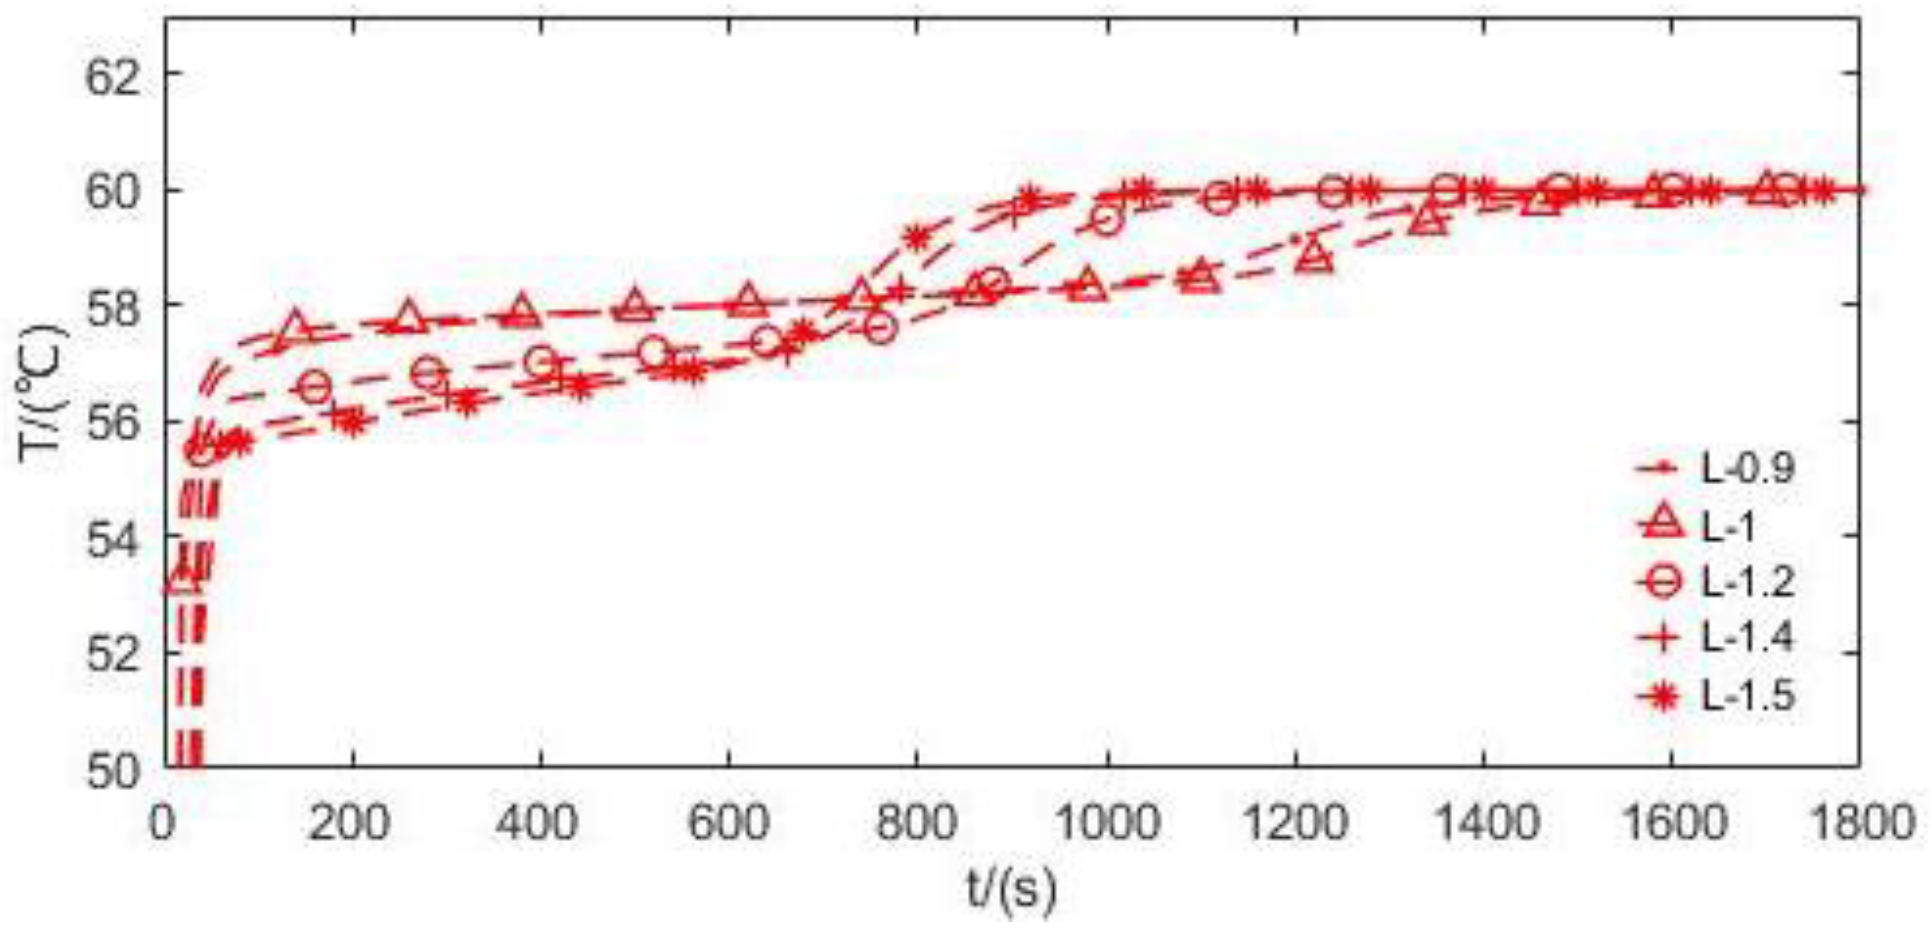
Figure 10.
Optimization process.

Figure 11.
Latin hypercube sampling.
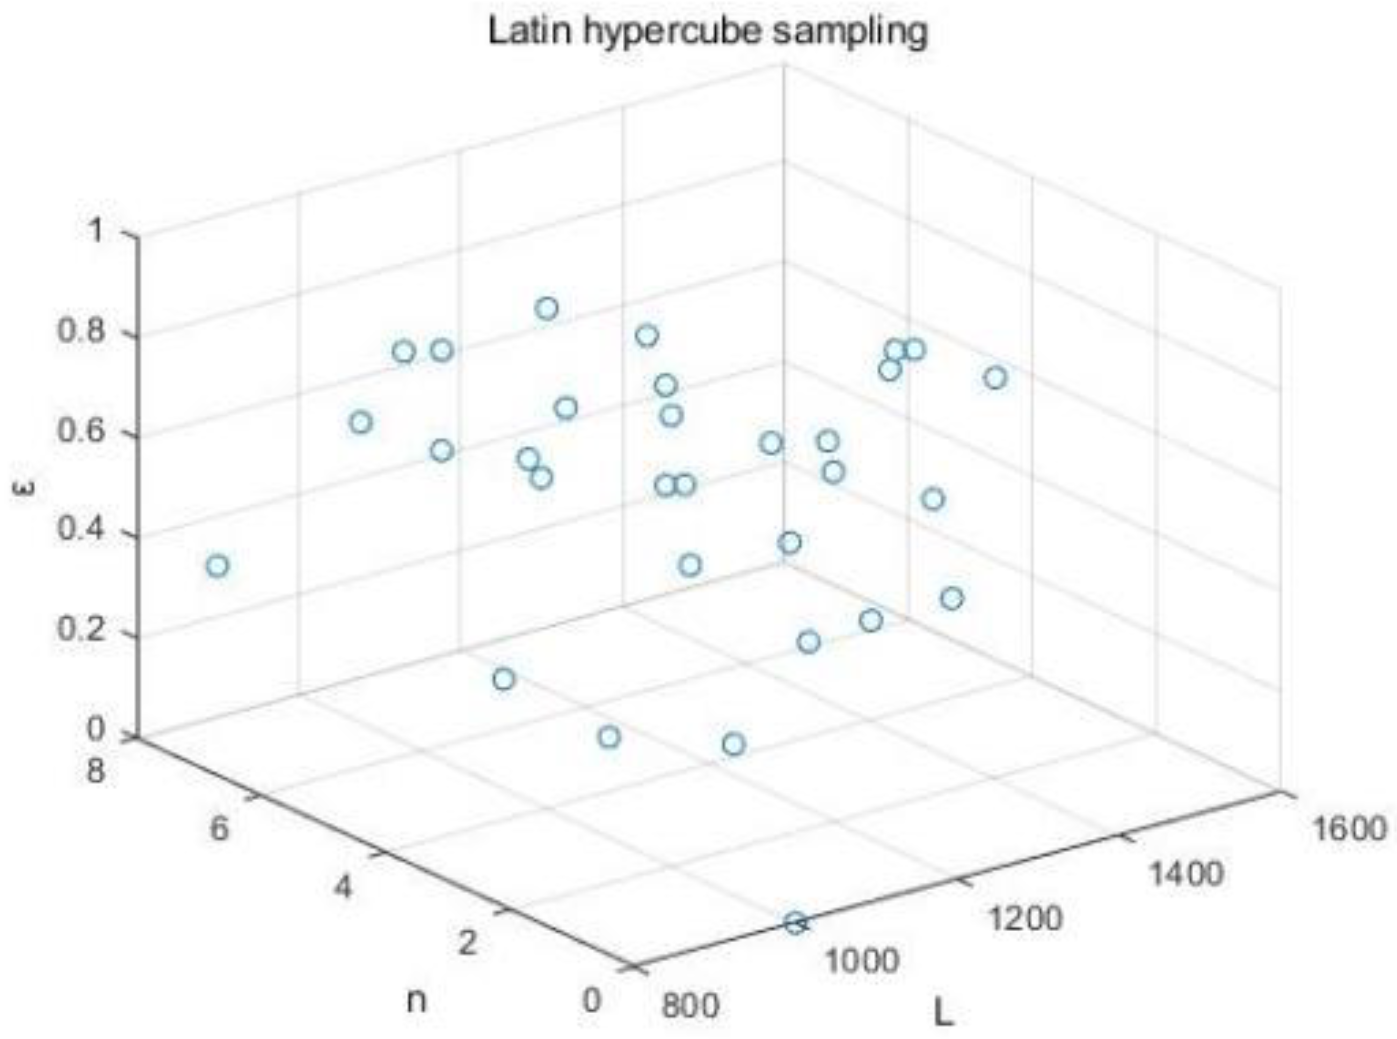
Figure 12.
Error test for
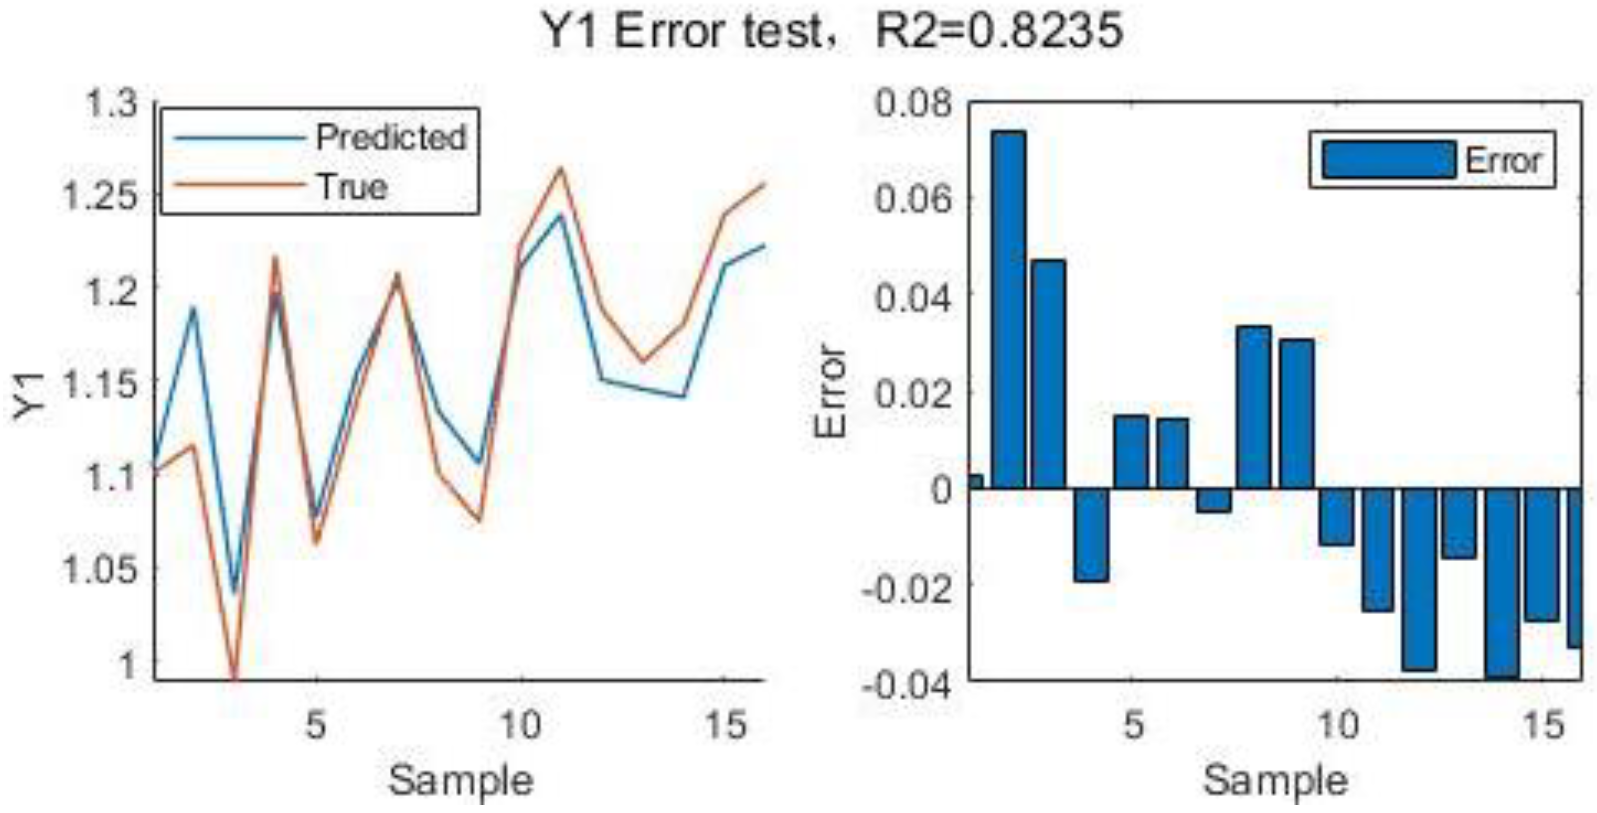
Figure 13.
Error test for
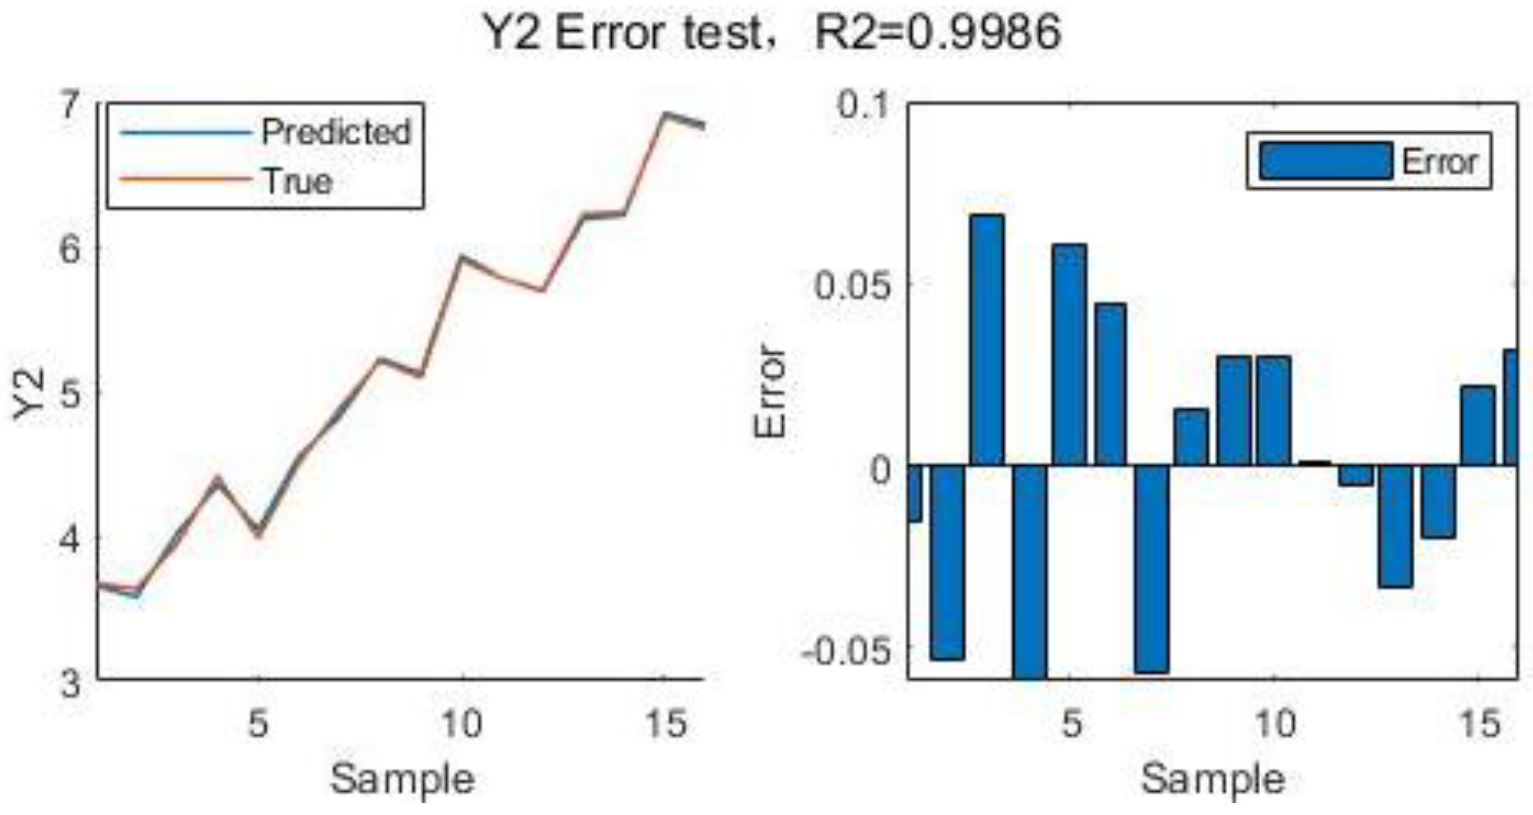
Figure 14.
Error test for
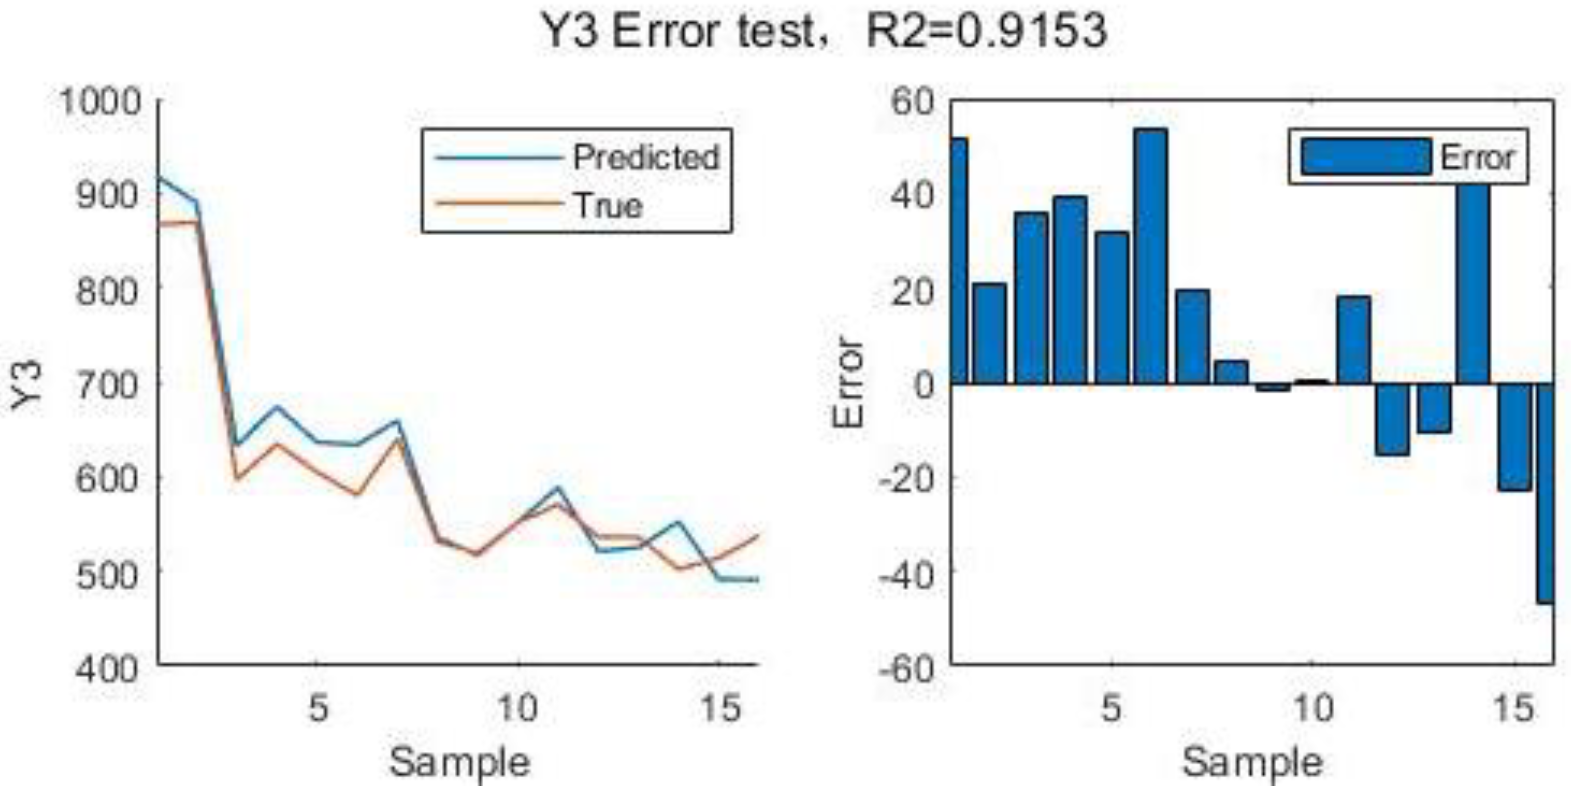
Figure 15.
Error test for
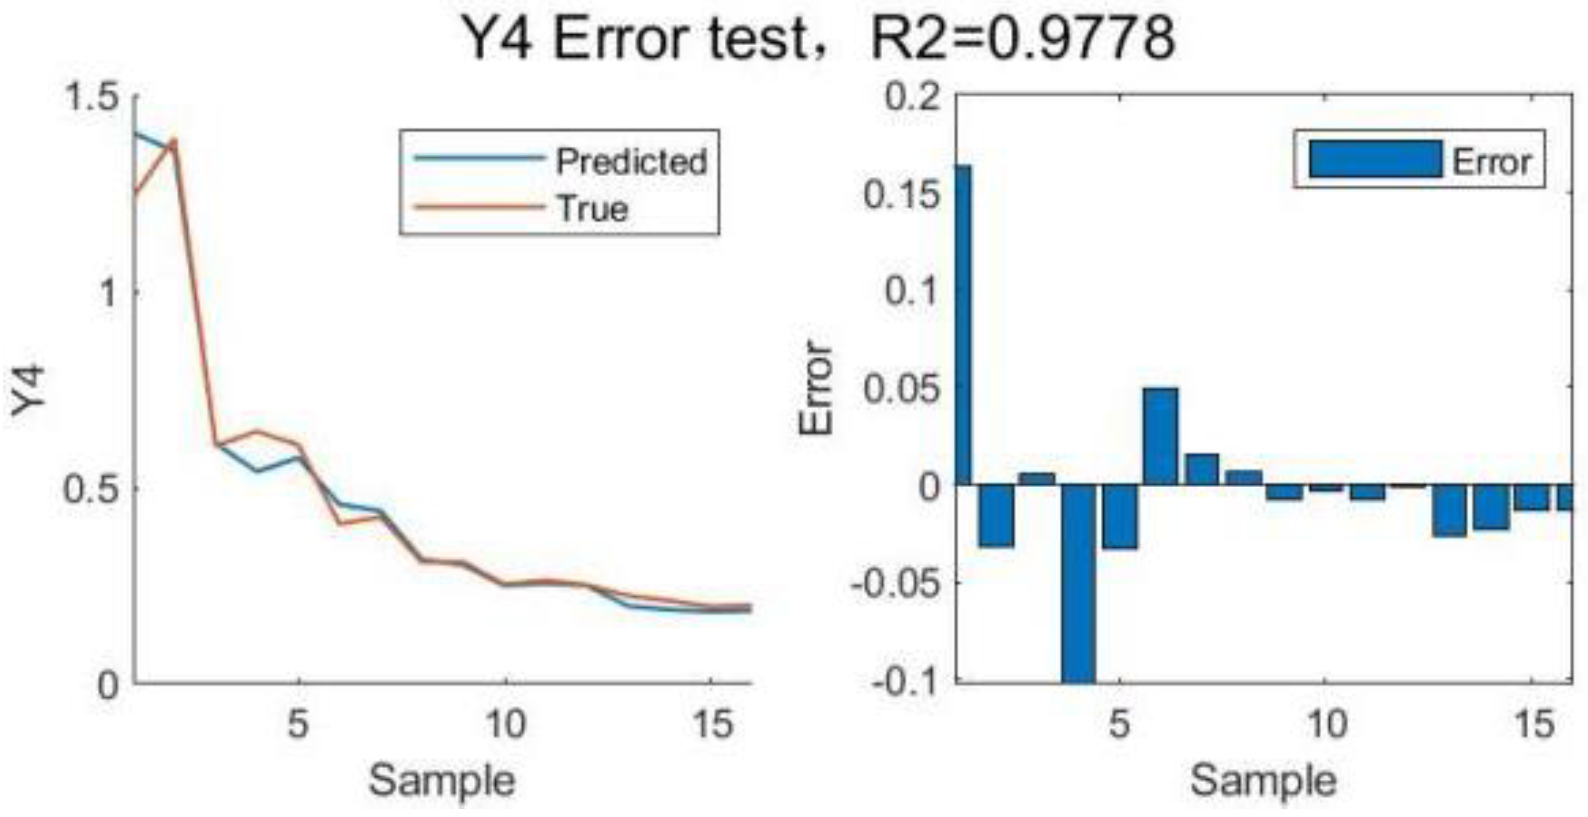
Figure 16.
Response surface analysis of the three design variables on
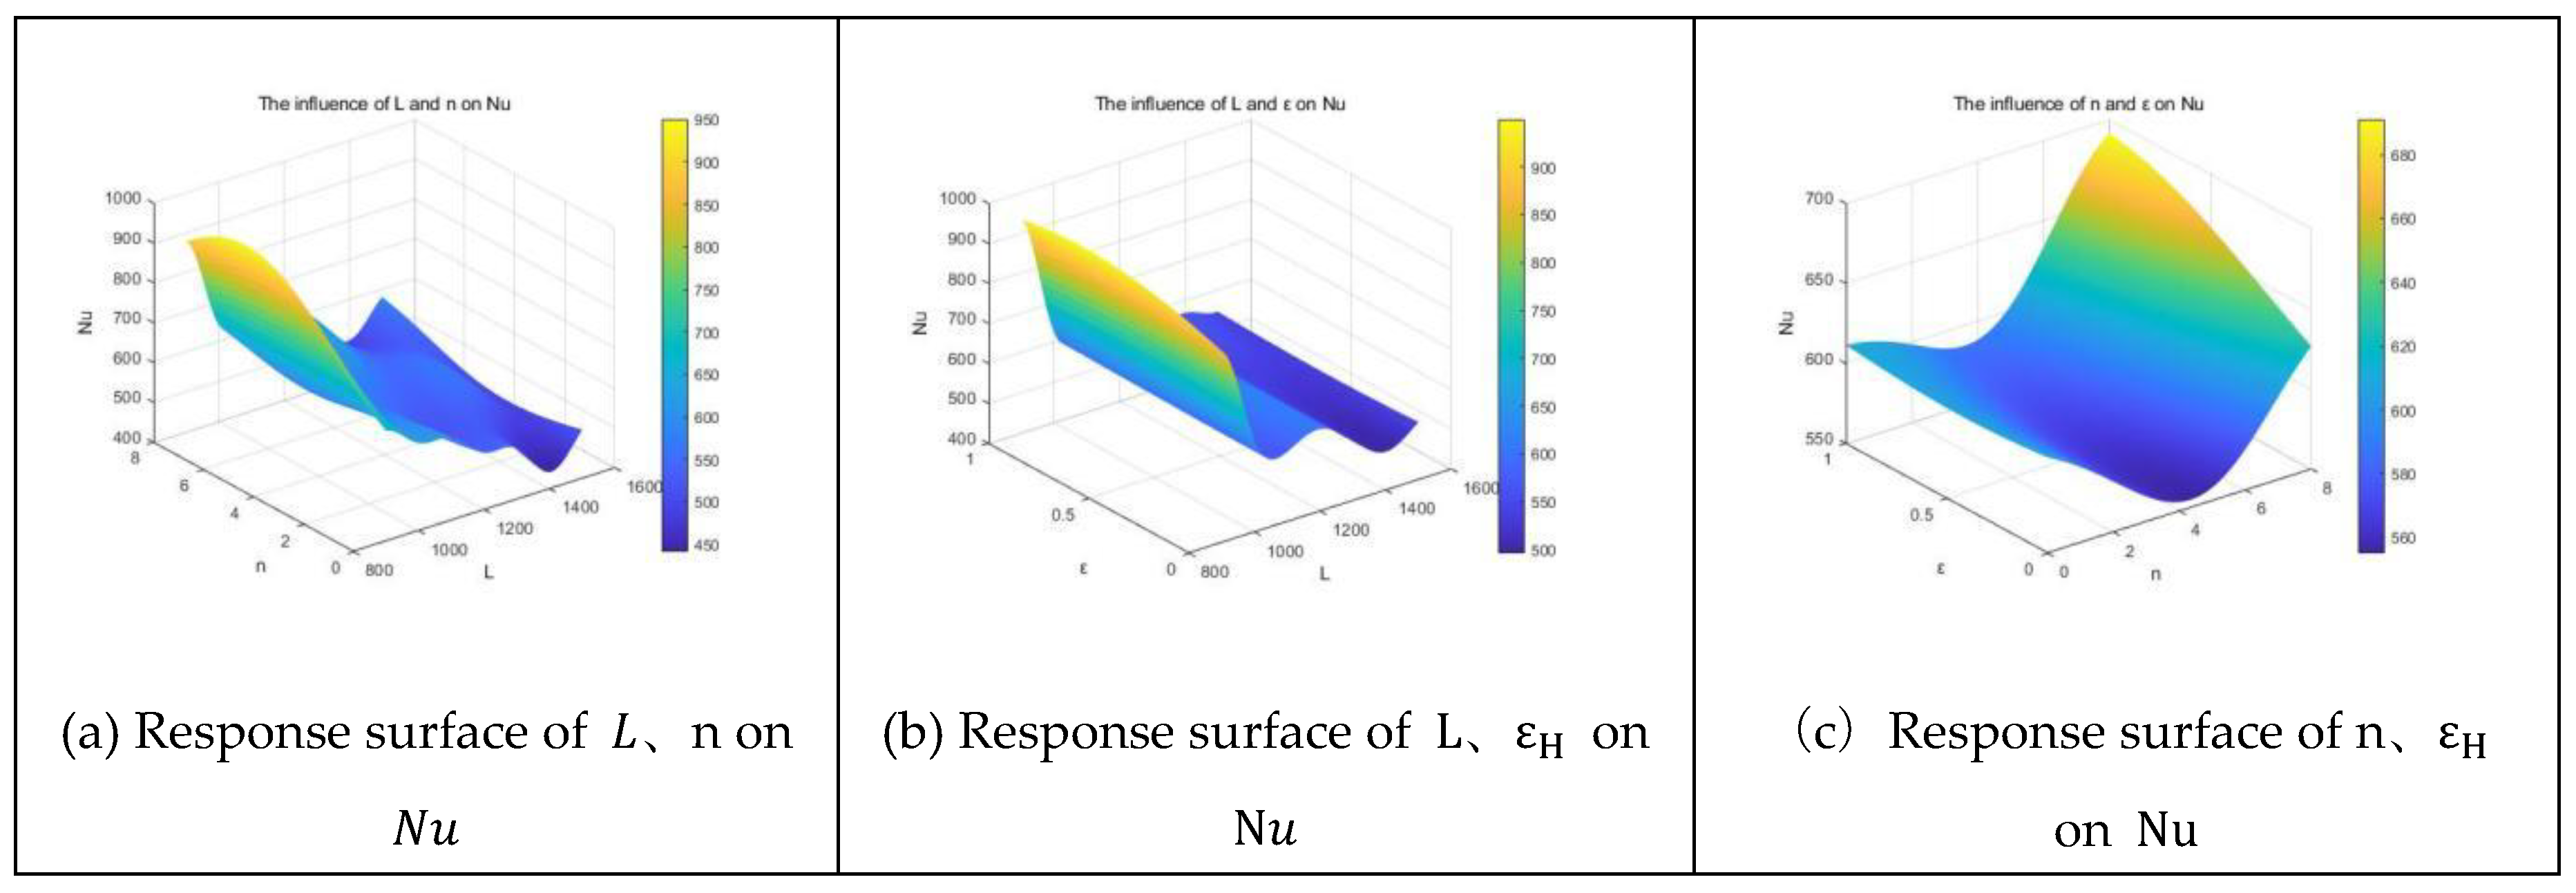
Figure 17.
Response surface analysis of the three design variables on
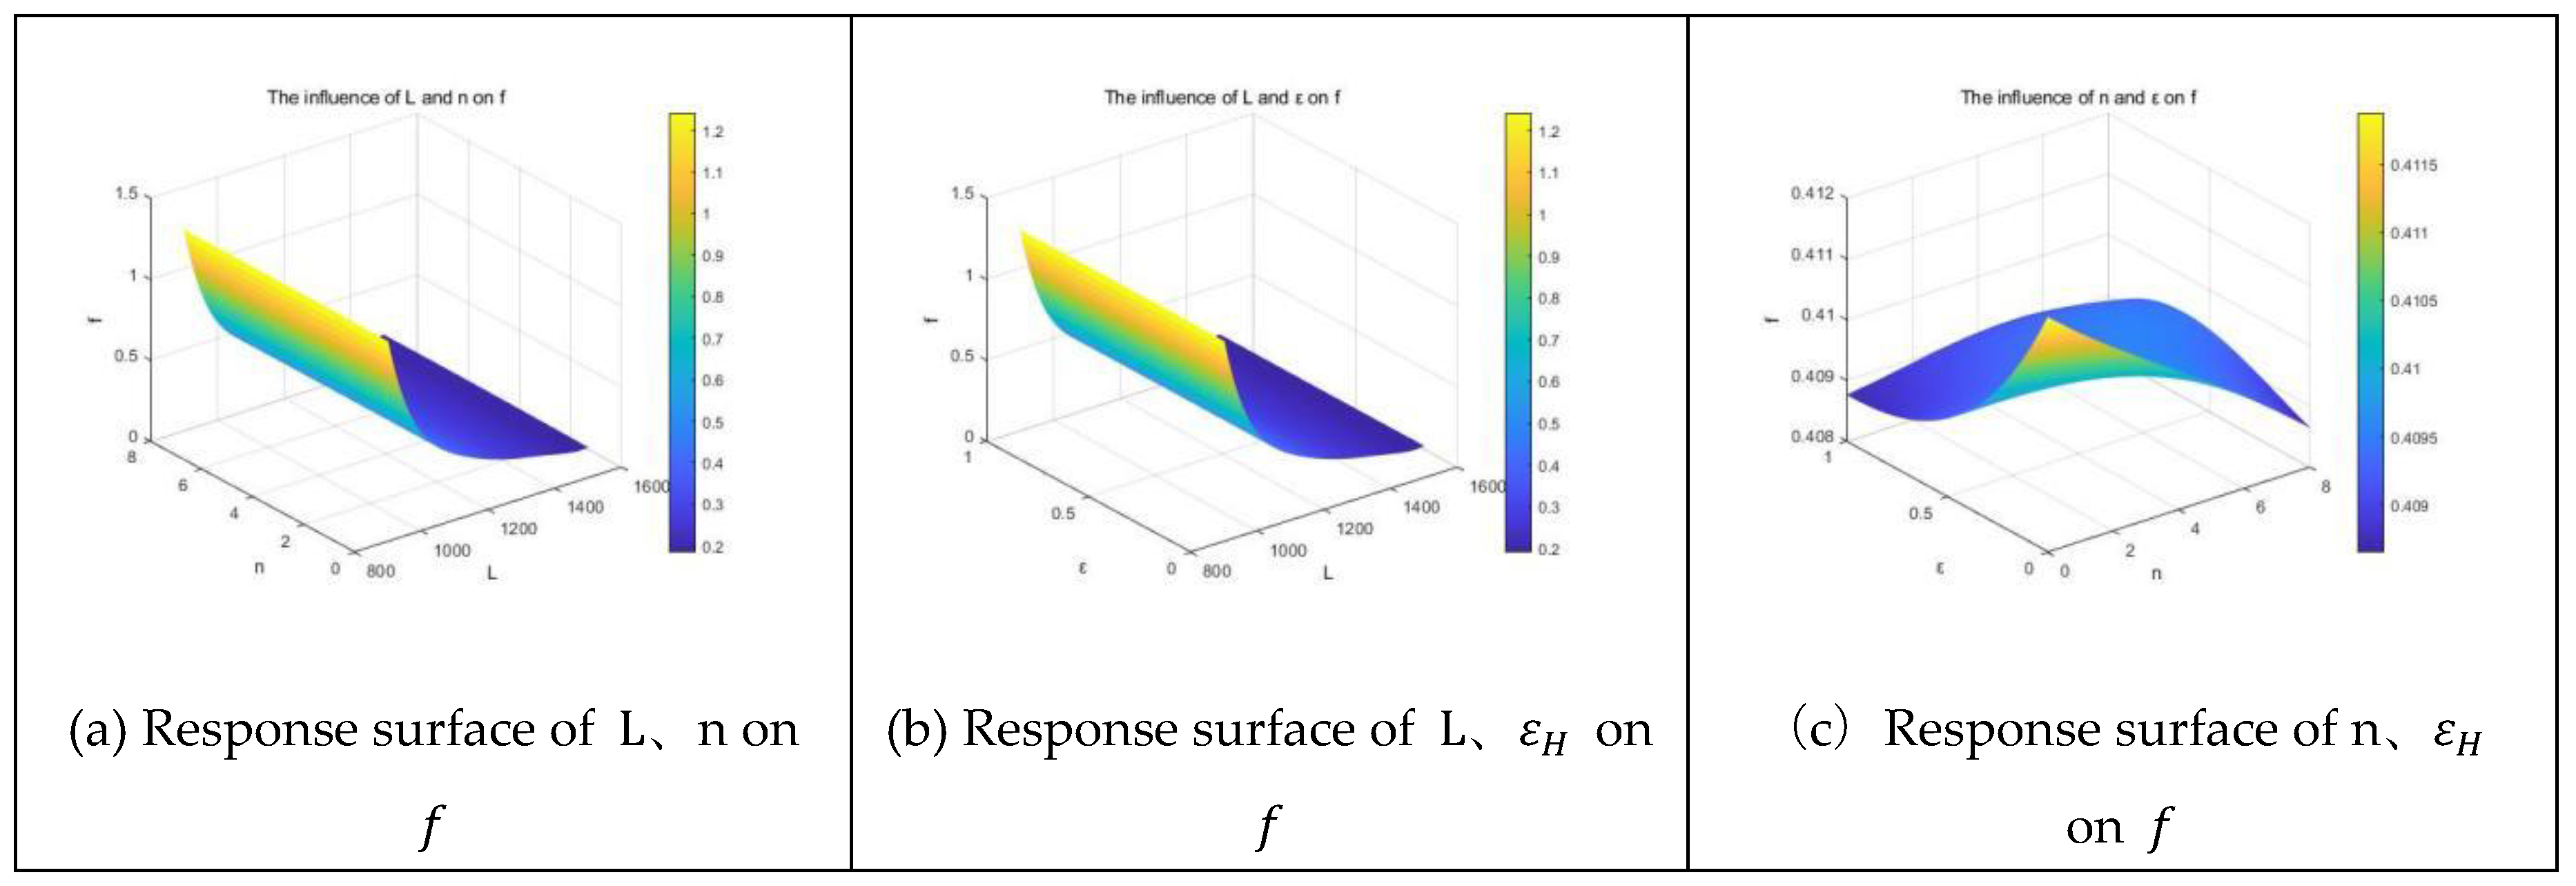
Figure 18.
Response surface analysis of the three design variables on
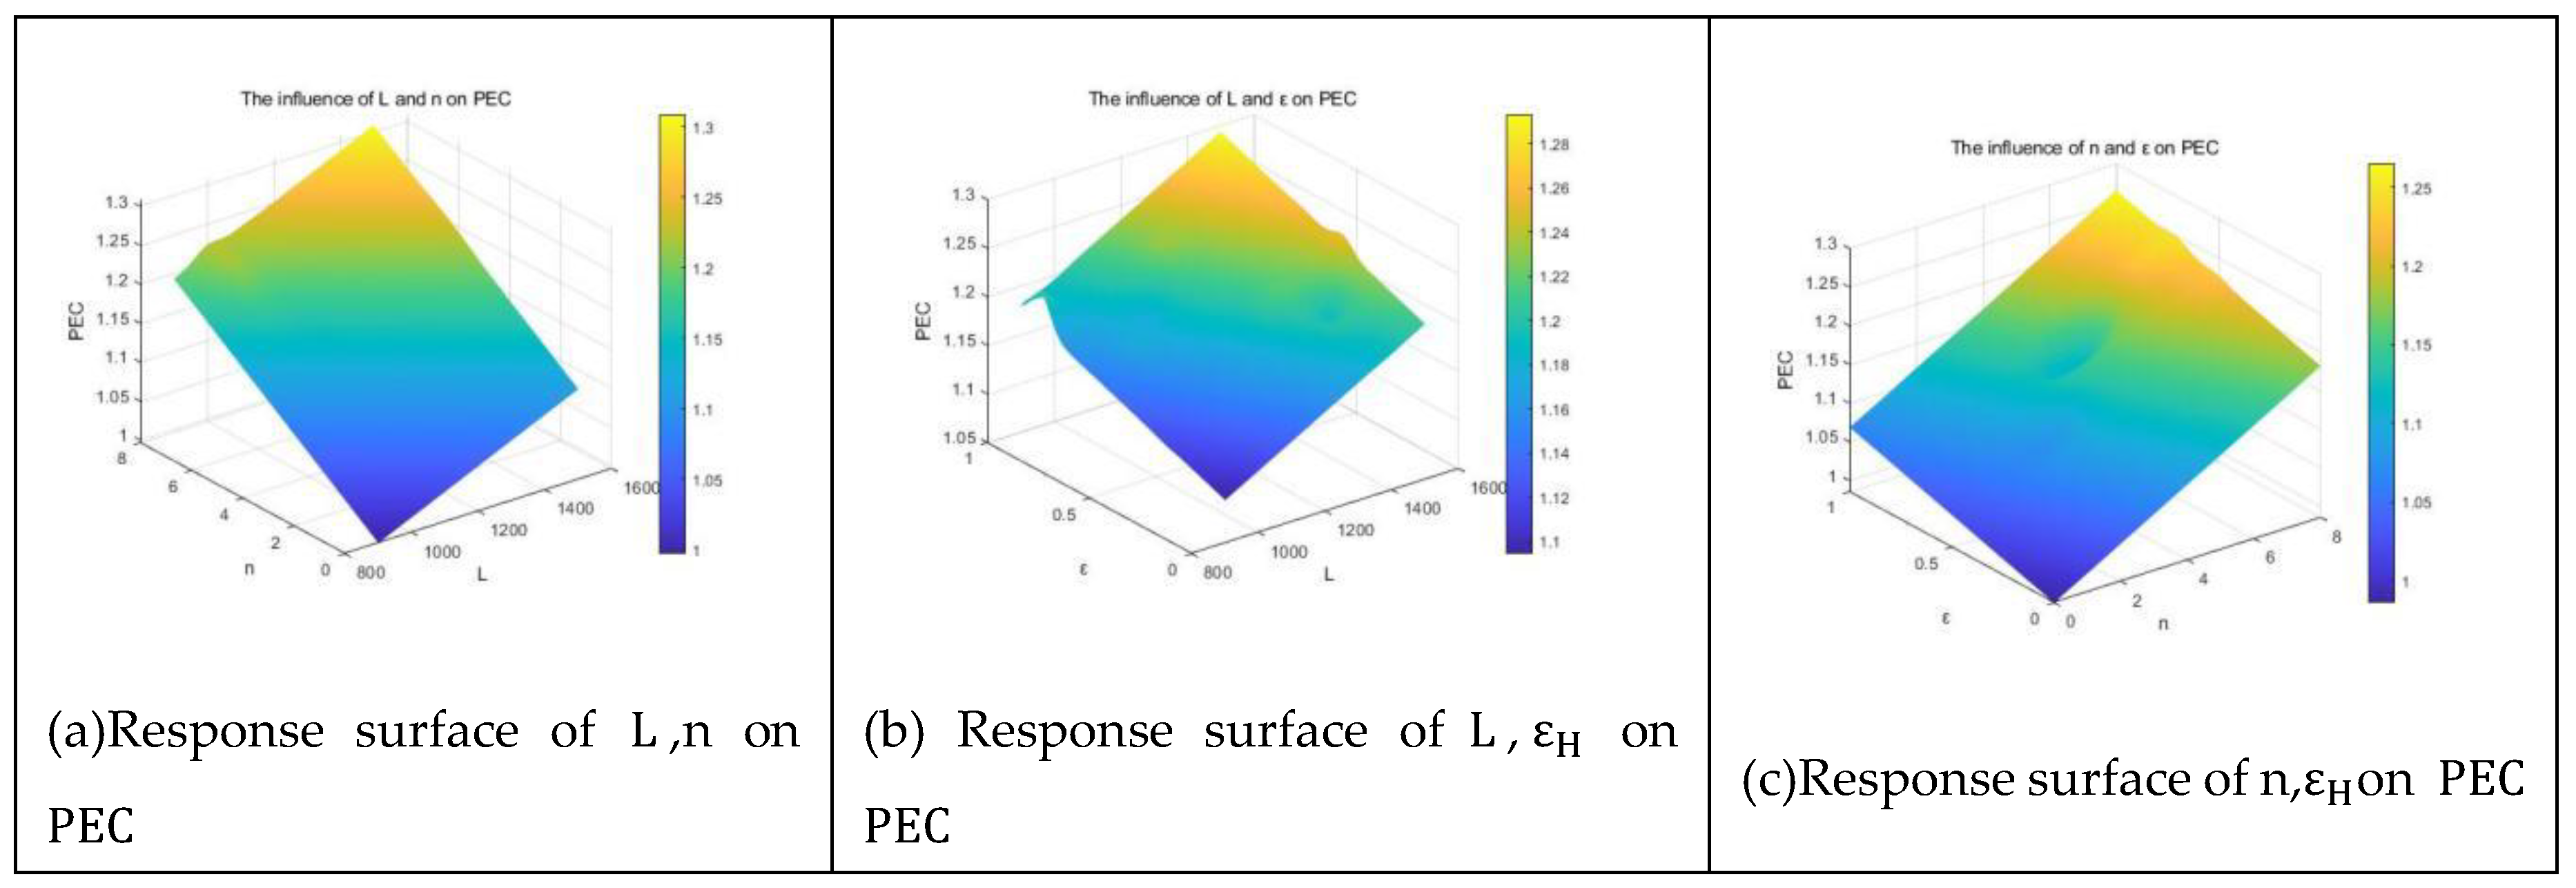
Figure 19.
Response surface analysis of the three design variables on m.
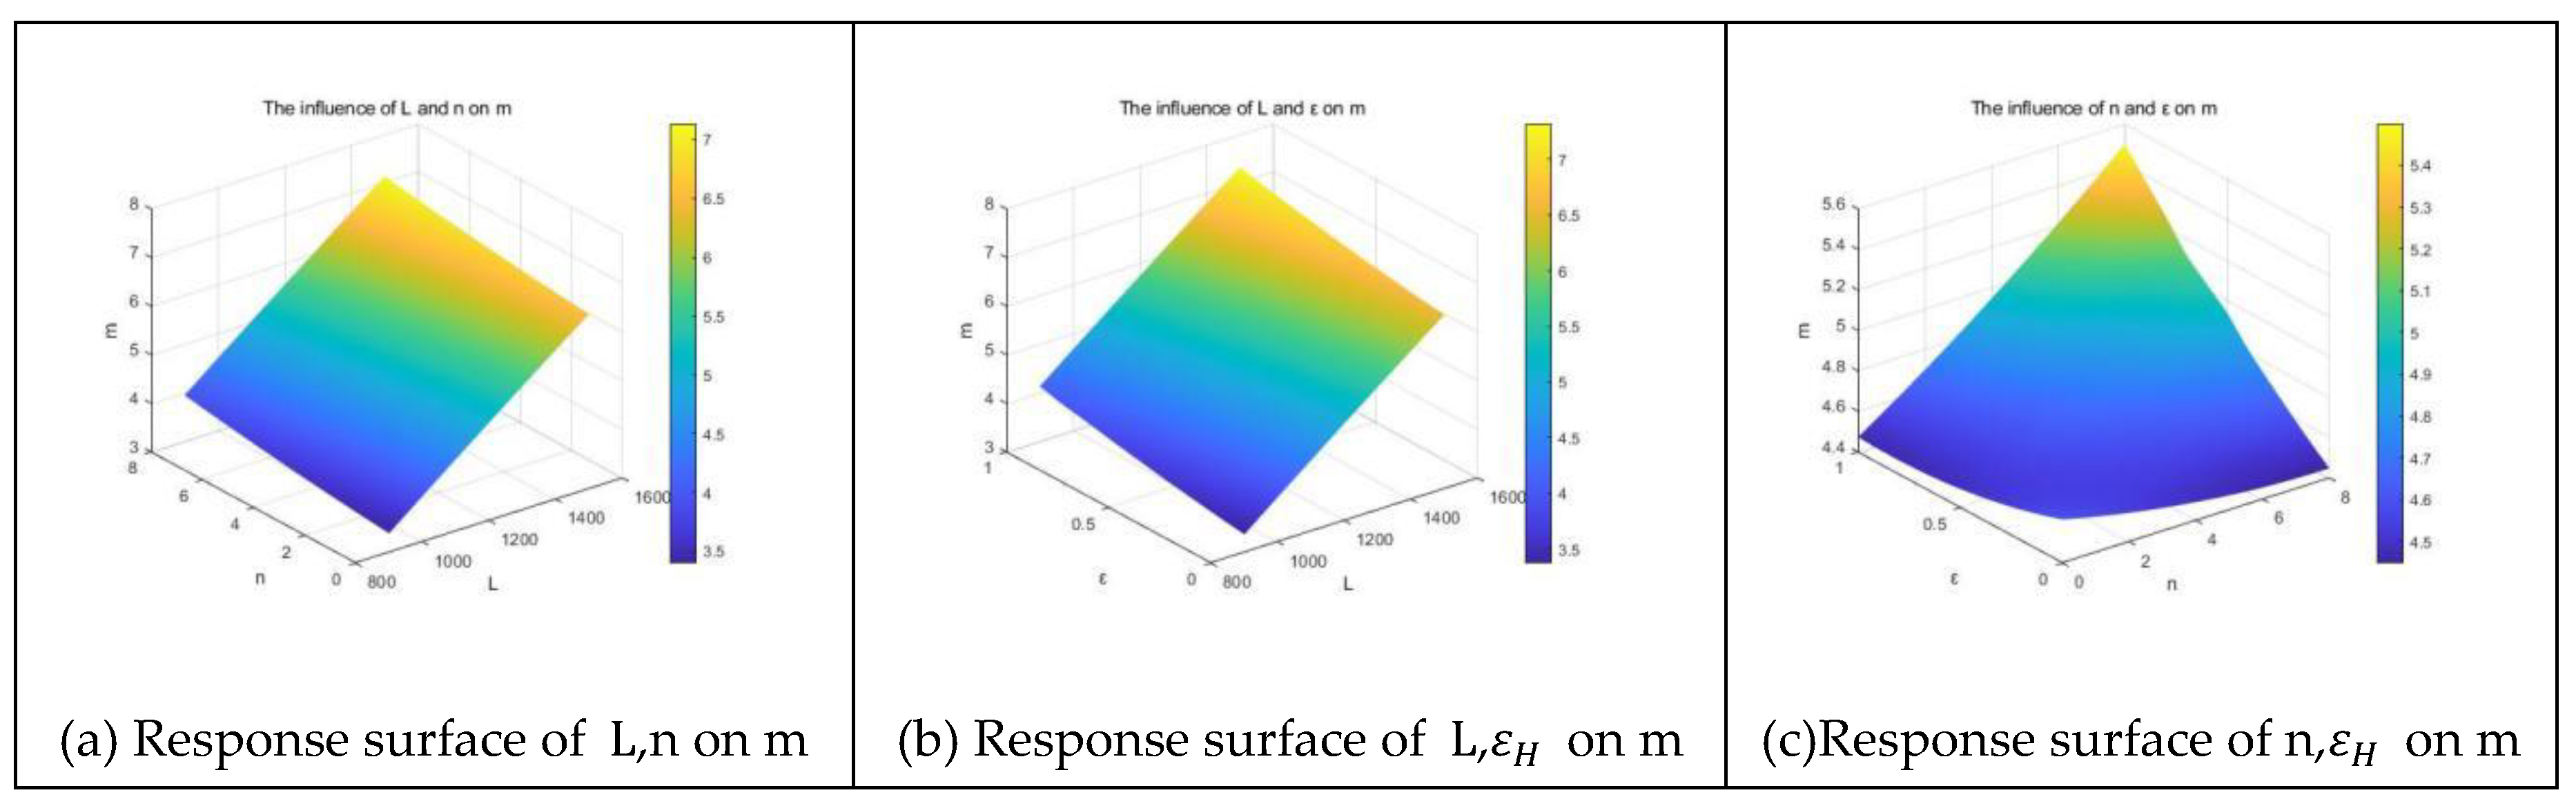
Figure 20.
Particle swarm iterative solution process.
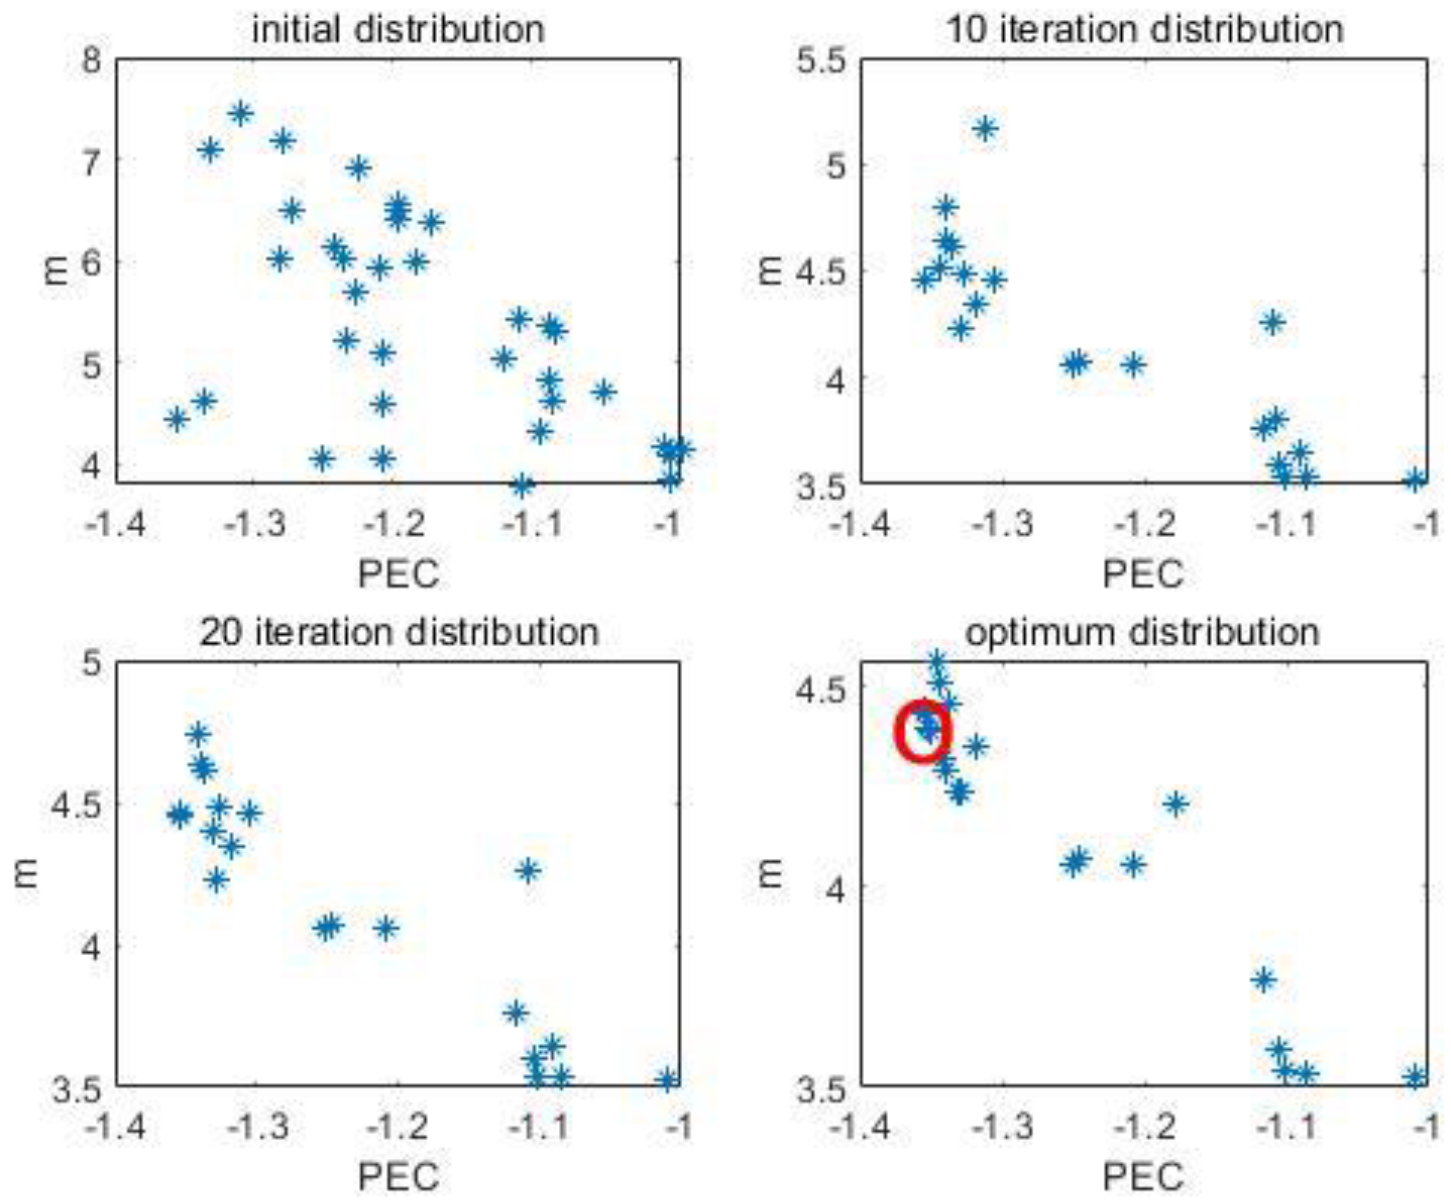
Figure 21.
PCM melting mass fraction at PC-EST exit at 600s time.
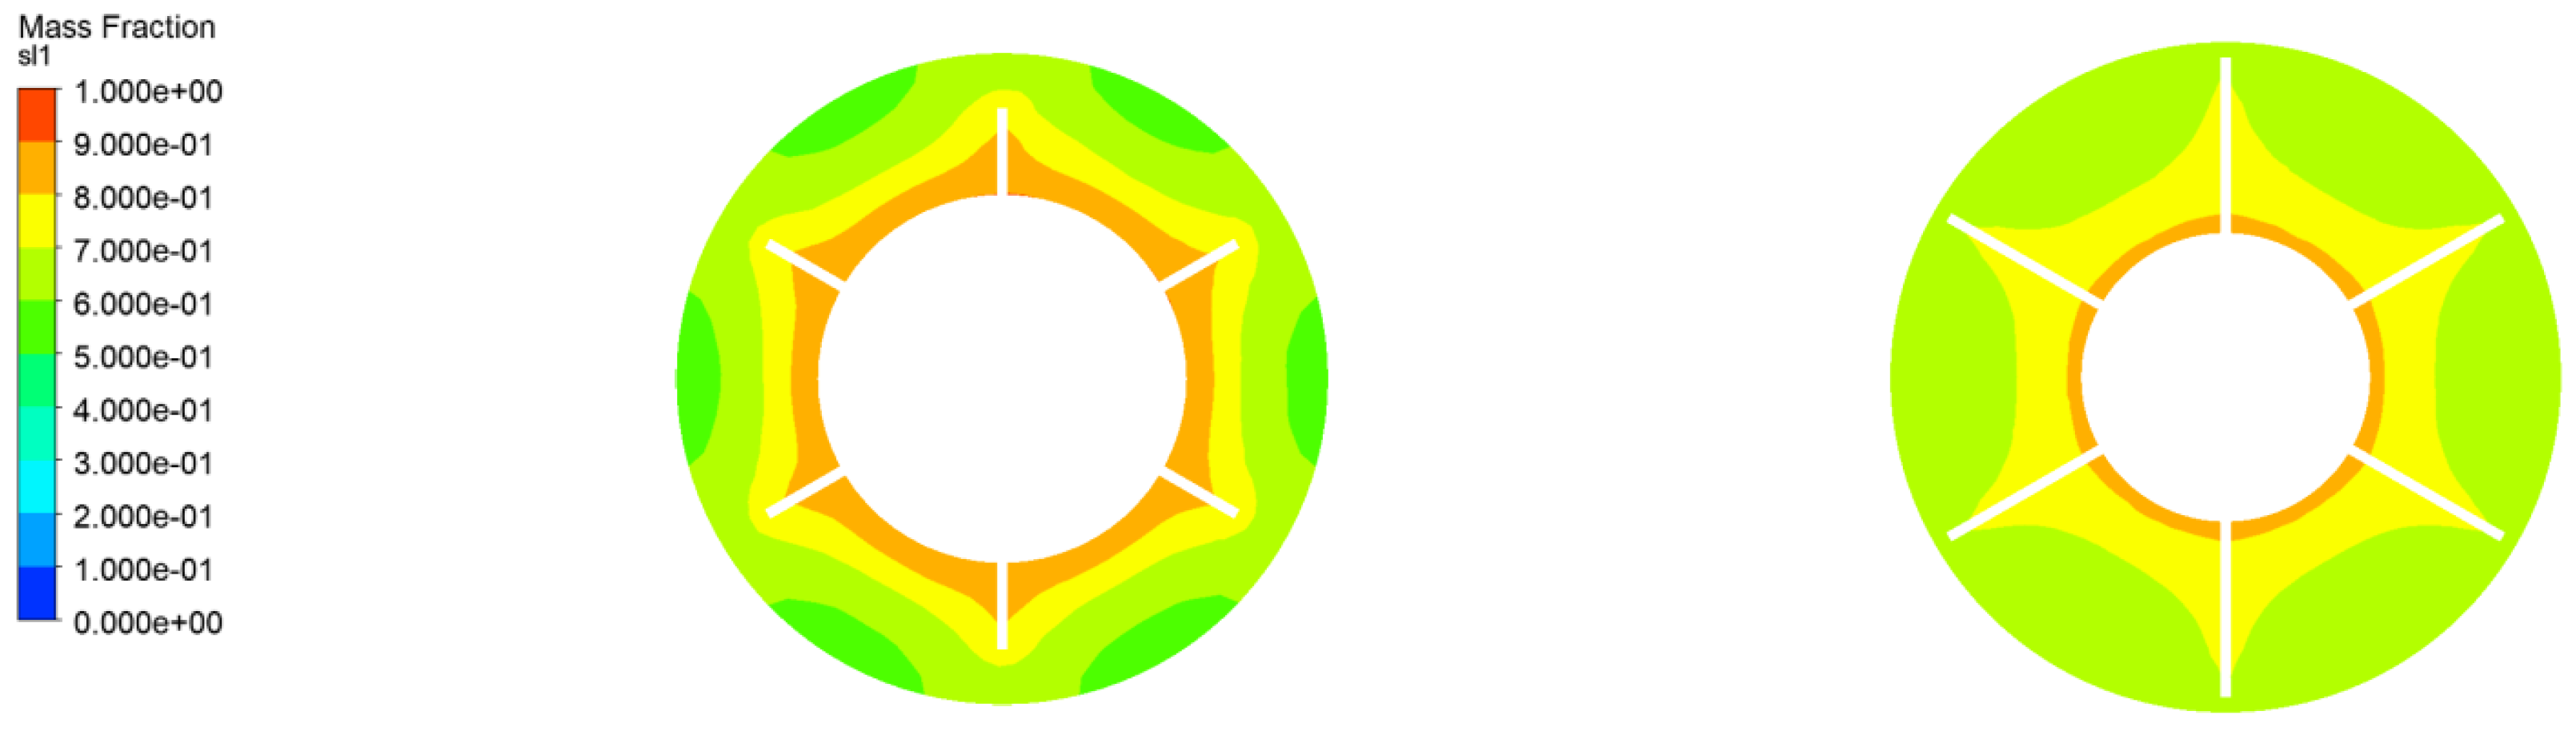

Table 1.
Physical parameters of composite phase change materials.
| Composition | Phase transition temperature(°C) | Latent heat(KJ/kg) | Thermal conductivity(W∙m-1∙K-1) | Specific heat capacity (KJ∙kg-1∙K-1) |
Density(kg∙m-3) |
| Expanded graphite/paraffin wax | 38.6-45.9 | 164 | 10.5 | 2.15 | 910 |
Table 2.
Geometric parameters of double-layer phase change energy storage tube.
| Geometric parameters | Symbol | Numerical value |
| Heat transfer tube | 67 mm | |
| Insulation layer diameter | 28 mm | |
| Tube length | 1000 mm | |
| Number of fins | n | 0 mm |
| PCM volume | Vpcm1 | 2.5 L |
Table 3.
Coolant parameter.
| Density [kg/m3] |
Freezing point [°C] |
Boiling point [°C] |
Kinematic viscosity [mm2/s] |
Dynamic viscosity [N·s/m2] |
Specific heat capacity [J/kg·K] |
Thermal conductivity [W/m·K] |
| 1073.35 | -37.9 | 107.8 | 3.67 | 0.00394 | 3281 | 0.38 |
Table 4.
Variation of the melting interface with time for different number of fins.
| 时间 | n=0 | n=2 | n=4 | n=6 | n=8 |
| 300s |  |
 |
 |
 |
 |
| 600s | 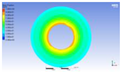 |
 |
 |
 |
 |
| 900s | 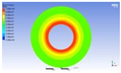 |
 |
 |
 |
 |
| 1200s | 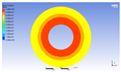 |
 |
 |
 |
 |
Table 5.
Variation of the melting interface with time for different fin heights.
| Time | =0 | =5 | =10 | =15 |
| 300s | 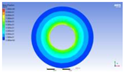 |
 |
 |
 |
| 600s | 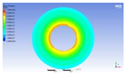 |
 |
 |
 |
| 900s | 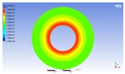 |
 |
 |
 |
| 1200s | 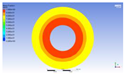 |
 |
 |
 |
Table 6.
Structure parameters corresponding to different pipe lengths.
| Parameter | Structure parameters | ||||
| Model 1 | Model 2 | Model 3 | Model 4 | Model 5 | |
| (mm) | 67 | 67 | 67 | 67 | 67 |
| (mm) | 18 | 28 | 34 | 39 | 41 |
| (mm) | 900 | 1000 | 1200 | 1400 | 1500 |
| n(mm) | 6 | 6 | 6 | 6 | 6 |
| (mm) | 16 | 12 | 8 | 6 | 5 |
Table 7.
Structural parameter range.
| Design variables | Lower limit value | Upper limit value |
| Length () | 900 | 1500 |
| Number of fins(n) | 0 | 8 |
| Proportion of fin height() | 0 | 1 |
Table 8.
Goodness of fit under different order regression models.
| Goodness of fit R2 | regpoly0 | regpoly1 | regpoly2 |
| R2() | 0.0072 | 0.8235 | 0 |
| R2() | 0.9912 | 0.9800 | 0.9986 |
| R2() | 0.9153 | 0.6472 | 0 |
| R2) | 0.9778 | 0.9189 | 0.1494 |
Table 9.
Comparison of optimization results of double-layer phase change energy storage tube.
| Parameters | m | |||||
| Particle Swarm Results | 956.5919 | 0.8684 | 1.3546 | 4.3882 | ||
| CFD results | 932.60439 | 0.941006 | 1.3345 | 4.416 | ||
| Initial design parameters | 714.38 | 0.49 | 1.2702 | 5.148 | ||
Disclaimer/Publisher’s Note: The statements, opinions and data contained in all publications are solely those of the individual author(s) and contributor(s) and not of MDPI and/or the editor(s). MDPI and/or the editor(s) disclaim responsibility for any injury to people or property resulting from any ideas, methods, instructions or products referred to in the content. |
© 2025 by the authors. Licensee MDPI, Basel, Switzerland. This article is an open access article distributed under the terms and conditions of the Creative Commons Attribution (CC BY) license (http://creativecommons.org/licenses/by/4.0/).
Copyright: This open access article is published under a Creative Commons CC BY 4.0 license, which permit the free download, distribution, and reuse, provided that the author and preprint are cited in any reuse.


