
Submitted:
01 September 2025
Posted:
02 September 2025
You are already at the latest version
Abstract
Small and medium-sized enterprises (SMEs) drive economic growth but face barriers in adopting AI for creative digital marketing, particularly in underserved U.S. markets. This study investigates the impact of an AI-driven unified advisory platform designed to enable creative and strategic digital marketing among SMEs, particularly those in underserved communities. By integrating modules such as Market Radar (delivering customer insights and competitive benchmarking) with Strategic Coaching and Compliance Tools, the platform supports SMEs in data-driven campaign design, pricing optimization, and customer engagement strategies. Employing a mixed-methods approach, we conducted in-depth interviews with owners and managers of 13 SMEs in underserved neighborhoods in Houston, Texas and surveyed 172 platform users across three states in the U.S. Results demonstrate that SMEs leveraging both Market Radar and benchmarking modules experienced higher customer acquisition and revenue increases than those relying on standalone tools. Qualitative findings show that the unified platform enabled creative repositioning and campaign refinement, even among businesses with limited marketing budgets. Trust-building elements like Peer Benchmarks and Compliance Alerts further enhanced uptake. Our study contributes to literature on digital marketing for SMEs by evidencing how AI-enabled platforms can catalyze marketing innovation, strengthen strategic decision-making, and deliver sustainable growth. The study also offers recommendations for policymakers and SaaS providers to support inclusive digital-marketing transformation in resource-constrained environments.
Keywords:
digital marketing innovation
; AI advisory platforms
; digital marketing strategies for SMEs
; marketing analytics
; regulatory compliance
; sustainable development goals
; peer benchmarking
; compound benefits
; adoption barriers
1. Introduction
Small and medium-sized enterprises (SMEs) are the cornerstone of inclusive economic development, accounting for 90% of firms worldwide and over 50% of employment [1]. In the United States, they generated 61% of net new jobs from 1995–2023 [2]. In underserved regions, SMEs foster inclusive development but face transformative barriers such as limited budgets, inadequate analytics tools, and fragmented guidance [3]. As artificial intelligence (AI) diffuses into marketing, predictive analytics and experimentation unlock targeting, timing, and budget optimization at scale [4,5]. However, evidence indicates uneven AI adoption across SMEs versus large firms [3,6,7].
Digital marketing represents a vital frontier for SME competitiveness, yet effective implementation remains uneven. Most commercial digital marketing platforms are designed for large enterprises with in-house analytics teams, leaving SMEs with limited ability to interpret market data, refine campaigns, or allocate resources strategically. Enterprise-grade platforms presume analytics and data-ops maturity many SMEs lack [4,8]. The absence of accessible, integrated marketing intelligence tools exacerbates existing inequities, particularly among minority- and women-owned enterprises in disadvantaged urban and rural areas [9]. Recent evidence also catalogs SME-specific AI adoption barriers, including capability gaps, perceived risk, and resource constraints, underscoring the need for staged roadmaps in digitally lagging regions [6,7]. We next synthesize evidence on SME AI adoption, integrated marketing analytics, and governance to motivate our compound-benefits framework.
Against this backdrop, AI is increasingly viewed as a transformative tool for empowering SMEs, enabling automation, optimization, and scalable decision-making [10]. However, widespread adoption of AI-enabled marketing tools has been hampered by a combination of financial constraints, digital literacy gaps, regulatory uncertainty, and cultural resistance to data-driven methods [11]. These challenges underscore the urgent need for accessible, ethically grounded AI solutions tailored to SME realities.
This paper investigates a novel AI-powered advisory platform designed to support marketing strategy development in capital-scarce SME environments. The platform integrates modular components including:
- Market Radar: real-time customer sentiment and competitor benchmarking;
- Strategic Coaching: campaign design and pricing guidance;
- Compliance Alerts: risk mitigation for legal and regulatory adherence;
- Peer Benchmarking: contextualized performance analytics to foster trust and motivation.
Unlike siloed applications, the platform employs a unified inference engine to generate compound benefits, synergistic improvements in marketing outcomes through coordinated module interactions. This concept draws from strategic management theories such as the Resource-Based View (RBV) and Dynamic Capabilities Theory (DCT), emphasizing how orchestrated toolsets can simulate sophisticated decision processes within constrained firms.
To assess the platform’s real-world impact, we implemented a two-phase mixed-methods design: (1) qualitative interviews and usage log analysis from 13 SMEs across diverse industries in Houston’s historically underserved communities; and (2) a quantitative survey of 172 SMEs across Texas, Louisiana, and Mississippi. Our objectives were to evaluate platform-driven innovation in marketing strategy, measure perceived value, and understand contextual factors shaping adoption and impact.
Findings reveal that SMEs using multiple platform modules experienced greater performance improvements, particularly in campaign innovation, pricing agility, and customer engagement, compared to those using standalone tools. Furthermore, adoption was often catalyzed by ecosystem actors such as local incubators, Community Development Financial Institutions (CDFIs), and business chambers. However, persistent digital readiness gaps, especially among older entrepreneurs and rural users, limited some firms' ability to fully leverage the platform's capabilities.
This research offers three novel contributions to the literature on AI adoption, SME strategy, and inclusive innovation:
- Conceptual: Introduces and conceptualizes a new framework, compound benefits, to explain synergistic performance outcomes resulting from cross-module AI engagement. This extends digital innovation literature by modeling how modular AI design improves marketing decision-making for SMEs.
- Empirical: Provides mixed-methods evidence on AI advisory tool adoption and outcomes in underserved U.S. communities. In contrast to most AI adoption studies centered on large firms or tech-native enterprises, this research foregrounds capital-constrained U.S. SMEs, using real-world case studies and validated survey instruments to uncover context-sensitive drivers of adoption.
- Practical: Offers practice-driven innovation for inclusive growth, as well as design and policy recommendations for scalable, sustainable digital marketing platforms that align with the U.N. Sustainable Development Goals (SDGs), particularly Goals 8 (Decent Work and Economic Growth) and 9 (Industry, Innovation, and Infrastructure). The study bridges academic inquiry with practitioner-led innovation. It presents a scalable, field-tested model for democratizing access to digital strategy, policy compliance, and campaign coaching for SMEs.
Together, these contributions address a significant research gap by uniting the traditionally fragmented discourses of digital transformation, AI ethics, and SME support into a coherent platform-based innovation agenda for inclusive economic development. By documenting how an ethically designed, modular AI platform can support creative, data-driven marketing among underserved SMEs, this paper contributes to emerging scholarship at the intersection of AI, entrepreneurship, and sustainable digital transformation.
Beyond firm-level performance, unified AI advisory platforms can advance sustainable digital-marketing policy in underserved markets by diffusing compliant practices (clear, conspicuous disclosures per the FTC Endorsement Guides [12,13] and lawful, transparent processing under the GDPR [14], while widening access to analytics-based consumer insight without predatory data use. Because adoption hinges on consumer trust, prior work shows algorithm aversion after visible errors [15], domain-sensitive resistance in high-stakes contexts [16], and algorithm appreciation when tasks are perceived as objective and feedback is credible [17]; designing for transparency and explanation, aligned with the AI Bill of Rights [18], can mitigate these frictions. This framing is consistent with Sustainability studies that link AI adoption to sustainable innovation pathways and inclusion agendas [19,20]. In SDG terms, inclusive uptake links not only to SDG 8 and SDG 9 but also SDG 10 (Reduced Inequalities) by lowering capability and cost barriers for minority- and women-owned SMEs in digitally lagging regions. Empirical links between finance, AI adoption, and green innovation in SME settings reinforce these SDG pathways [20,21,22]. Sectoral evidence also shows that platformization can advance SDG outcomes for SMEs by widening digital market access and responsible practices [23].
2. Literature Review and Theoretical Foundations
This literature review is structured around six interrelated themes critical to understanding the dynamics of AI-powered marketing innovation for SMEs: (1) AI adoption and marketing innovation in SMEs, (2) integrated platforms and predictive analytics, (3) adoption frameworks in resource-constrained contexts, (4) stakeholder engagement and data governance, (5) barriers and ethical considerations, and (6) the research gap this study addresses.
2.1. AI Adoption and Marketing Innovation in SMEs
AI technologies, particularly machine learning (ML), natural language processing (NLP), and robotic process automation (RPA), are transforming how SMEs engage in marketing, pricing, and customer acquisition [24]. ML is used for customer segmentation, pricing strategy, and demand forecasting; NLP powers interactive marketing through chatbots; and RPA streamlines administrative functions [24]. These tools have enabled SMEs to achieve cost reductions and efficiency gains of up to 40% in targeted use cases. However, empirical evidence on the compound effects of such tools when deployed together remains scarce. In export manufacturing, technological readiness and AI adoption are positively associated with sustainable performance [25].
Despite their promise, AI adoption among SMEs remains fragmented across smaller firms, reflecting structural and capability barriers that recent reviews document in detail [6,7]. High costs, technical complexity, and limited internal capacity often restrict adoption to single-function tools, preventing firms from realizing the full strategic value of integrated AI ecosystems [3]. Current studies often focus on larger firms or isolated applications, underscoring the need to evaluate AI's broader impact through unified platforms that support end-to-end marketing and advisory functions [26].
2.2. Integrated Platforms and Predictive Analytics
Predictive analytics are at the core of many AI platforms and are central to strategic planning. They enable SMEs to forecast customer behavior, optimize marketing timing, and tailor offers based on purchasing patterns [27]. Financial modules embedded within analytics engines improve campaign budgeting and enhance returns on ad spend [28]. Yet, predictive analytics remain underutilized due to SMEs’ limited access to clean, comprehensive datasets.
Studies rarely examine how analytics perform when integrated across multiple business functions (e.g., marketing, finance, compliance), especially in resource-constrained environments [29]. Our study addresses this gap by exploring how an integrated AI platform delivers predictive insights across interrelated marketing domains.
2.3. Adoption Frameworks in Resource-Constrained Contexts
Frameworks such as the Technology–Organization–Environment (TOE) model [30] and the Diffusion of Innovations (DOI) theory [31] are commonly applied to explain technology adoption. However, these frameworks often overlook the nuanced challenges faced by SMEs in underserved regions, such as infrastructural deficits, limited institutional support, and risk aversion.
Recent research suggests that combining TOE and DOI frameworks may offer a more holistic approach, especially when paired with dynamic capability theory to emphasize iterative learning and capability development [24,26]. Modular SaaS platforms offer SMEs the flexibility to adopt AI incrementally, reducing the risk of disruption [32]. This study builds on such insights by examining how platform modularity and community-based enablers (e.g., CDFIs, incubators) support phased adoption and usage depth. Complementing these views, Sustainability evidence models how AI adoption catalyzes sustainable innovation in SMEs when resource constraints are addressed [18].
2.4. Stakeholder Engagement and Data Governance
Effective AI adoption requires active stakeholder involvement. Co-designing digital tools with SME owners, employees, and intermediaries ensures alignment with practical workflows [33]. Studies have shown that when SMEs participate in feature prioritization, AI tools gain legitimacy and usability, reducing resistance to change [11]. Roadmap-style transformation that phases governance, capability building, and analytics use has been proposed specifically for SMEs [7].
Similarly, effective marketing analytics depends on data-governance decision rights, quality controls, and stewardship [34,35]. SMEs often operate with fragmented or inaccurate data, undermining AI outputs [36]. Cloud-based systems that consolidate customer records and automate compliance checks are essential for campaign accuracy and regulatory adherence [37].However, frameworks specifically addressing data governance and quality for SMEs remain underdeveloped.
2.5. Barriers, Regional Disparities, and Ethical Considerations
Numerous barriers hinder AI adoption, particularly in capital-constrained contexts. These include digital illiteracy, cultural resistance, infrastructure limitations, and concerns over job displacement [11]. Regulatory challenges, such as compliance with GDPR or FTC advertising rules, are particularly burdensome for SMEs lacking in-house legal expertise [38].
Moreover, regional disparities exacerbate adoption challenges. SMEs in rural or minority-majority areas face connectivity issues and limited digital ecosystems, while those in urban centers contend with fragmented vendor offerings and decision fatigue (OECD, 2025). For SMEs pursuing sustainability outcomes, AI adoption intersects with green-innovation capability and financing frictions [20]. Ethical issues, such as algorithmic bias, surveillance concerns, and workforce displacement, remain underexplored in SME contexts, despite their disproportionate impact on underserved communities.
2.6. Research Gap and Study Contribution
While AI’s potential for SMEs has been well-documented, existing research disproportionately emphasizes siloed applications and large-firm case studies. There is limited empirical analysis of integrated AI platforms that span marketing strategy, peer benchmarking, regulatory compliance, and business coaching, especially for SMEs in economically distressed areas.
This study contributes by addressing five key gaps:
- Lack of research on modularly integrated AI platforms and their synergistic impacts (“compound benefits”);
- Insufficient understanding of SME adoption dynamics in underserved U.S. communities;
- Underexplored role of institutional enablers like CDFIs and incubators in mediating platform uptake;
- Scarcity of stakeholder-inclusive design approaches for AI-enabled marketing innovation;
- Weak integration of ethical and socioeconomic considerations in SME-focused AI systems.
Through a mixed-methods approach grounded in fieldwork, this study offers new empirical evidence and a scalable conceptual model to guide ethical, effective AI adoption among small businesses operating in resource-constrained environments.
2.7. Theoretical Foundations
This study is anchored in the Resource-Based View (RBV) and Dynamic Capabilities Theory (DCT) to understand how SMEs in resource-constrained environments utilize AI to drive strategic marketing innovation. According to RBV, firms achieve competitive advantage by deploying resources that are valuable, rare, inimitable, and non-substitutable [39]. However, SMEs in underserved markets often lack such resources, particularly in the form of specialized marketing expertise, real-time analytics, and regulatory support systems. AI-powered advisory platforms can serve as surrogate strategic resources by embedding these capabilities within modular, user-friendly interfaces.
DCT builds upon RBV by emphasizing the importance of adaptability. Firms must not only possess valuable resources, but also be able to integrate, reconfigure, and leverage these resources dynamically in response to shifting market conditions [40]. From this perspective, modular AI platforms that offer services such as Market Radar, Strategic Coaching, Compliance Alerts, and Benchmarking function as dynamic capabilities. These tools enable SMEs to iteratively adjust pricing, reposition campaigns, and fine-tune customer engagement strategies based on evolving competitive and consumer insights. These strands jointly motivate a modular, platform-centric theory of change for SME marketing.
We propose the Compound Benefits Framework for AI-Driven SME Marketing Innovation, visualized in Figure 1. In this framework, five AI-powered input modules, Market Radar, Strategic Coaching, Funding Readiness Scoring, Compliance Alerts, and Peer Benchmarking, interact via a Unified Inference Engine that synthesizes data and generates real-time, context-aware recommendations. Rather than operating in isolation, the modules reinforce one another, creating compound benefits that surpass the sum of their parts. These include improved customer acquisition, pricing optimization, campaign creativity, and regulatory alignment.
2.7.1. Ethical and Sustainable Dimensions
To ensure the Compound Benefits Framework promotes not only efficiency but also equitable and long-term outcomes, it incorporates ethical considerations grounded in the White House Office of Science and Technology Policy’s Blueprint for an AI Bill of Rights [18]. The blueprint highlights five core principles, including Algorithmic Discrimination Protections, which call for bias mitigation through pre-deployment testing, risk identification, ongoing monitoring, and equitable design to prevent discriminatory impacts based on protected characteristics (e.g., race, ethnicity, gender, socioeconomic status). Within this framework, bias mitigation is operationalized in modules such as Market Radar and Compliance Alerts, which use explainable AI (XAI) techniques to flag potential algorithmic biases in customer insights or benchmarking data, helping ensure fair treatment for underserved SMEs (e.g., minority-owned businesses in resource-constrained areas).
These ethical safeguards directly contribute to sustainability by fostering social inclusivity, reducing digital divides and promoting equitable access to innovation, and supporting environmental and economic dimensions. For instance, optimized marketing through compound benefits minimizes wasteful campaigns, aligning with efficient resource use and reduced carbon footprints in digital operations. This integration advances the U.N. Sustainable Development Goals (SDGs), particularly SDG 8 (Decent Work and Economic Growth) by enabling job-creating innovation in marginalized communities, and SDG 9 (Industry, Innovation, and Infrastructure) by democratizing AI tools for resilient, inclusive ecosystems. By prioritizing ethical design, the framework mitigates risks like workforce displacement or data privacy breaches, ensuring AI-driven marketing yields sustainable, positive societal impacts rather than exacerbating inequalities.
2.8. Research Objectives and Questions
This research aims to evaluate the efficacy of AI-powered advisory platforms in supporting marketing innovation and strategic growth among SMEs, with particular emphasis on capital-constrained and underserved communities in the United States.
The study is grounded in fieldwork that informed the development of a cloud-based artificial intelligence system for small business advisory, funding assessment, and market detection in resource-constrained environments. The platform was developed to bridge advisory gaps through accessible digital intelligence.
Framed by the RBV and DCT, and complemented by insights from the TOE framework and DOI theory [30,31], this study explores how integrated digital solutions can serve as both organizational resources and enablers of dynamic response capability. Specifically, the study is structured around four core objectives:
- To assess how core platform modules, such as Market Radar, coaching, benchmarking, and compliance, enhance SMEs’ marketing capabilities in resource-constrained settings;
- To investigate whether synergistic, cross-module use produces compound benefits beyond the sum of individual tools;
- To evaluate how institutional enablers, including CDFIs and local incubators, influence adoption and engagement;
- To understand how internal SME factors, such as trust in AI, digital literacy, and perceived utility, shape adoption outcomes.
These objectives guide the following research questions:
Primary Research Question (PRQ): How do integrated AI-powered advisory platforms influence marketing strategy innovation and business performance among SMEs in resource-constrained U.S. markets, contributing to sustainable and inclusive growth?
Supporting Research Questions (RQs):
RQ1: What compound benefits arise from SMEs’ cross-module use of Market Radar, coaching, benchmarking, and compliance tools, and how do these contribute to sustainable marketing innovation and long-term economic resilience?RQ2: What adoption barriers do SMEs face, and how do institutional enablers such as incubators and CDFIs support ethical and sustainable platform uptake in underserved contexts?RQ3: How do factors such as trust, digital literacy, and perceived platform value shape SMEs’ willingness and capacity to adopt AI-enabled marketing tools for sustainable and inclusive business development?
Through this integrative theoretical lens, the study contributes to literature on digital transformation, marketing innovation, and inclusive AI adoption by uncovering how embedded intelligence within modular advisory tools can foster sustainable growth in marginalized SME ecosystems.
3. Materials and Methods
This study employed a sequential explanatory mixed-methods design to evaluate the adoption, use, and performance impact of an integrated AI advisory platform designed for SMEs in capital-constrained U.S. markets. The platform integrates modules for Market Analysis, Strategic Coaching, Compliance Alerts, Funding Readiness, and Peer Benchmarking. The dual-phase approach enabled both an in-depth exploration of SME behaviors (qualitative phase) and statistical generalization of usage patterns and outcomes (quantitative phase). We therefore adopt a sequential explanatory design to connect qualitative insights on adoption contexts with quantitative tests of cross-module effects. Descriptive statistics (Appendix A1) and all regression variables derive from the authors’ survey of 172 SMEs (Qualtrics, Q1-2025) and platform usage logs from the Houston pilot.
3.1. Research Design and Rationale
A two-phase sequential explanatory design was selected to answer the overarching and supporting study research questions. Phase 1 employed qualitative case studies to investigate experiential, organizational, and contextual factors affecting platform adoption and impact. Interview quotations are from author-conducted, semi-structured interviews; anonymized transcript IDs (e.g., Owner #07) are used throughout. Phase 2 utilized a structured survey to test hypotheses derived from Phase 1 and to quantify the extent of “compound benefits” generated by cross-module adoption.
This triangulated approach enhances construct validity by integrating multiple data types and strengthens ecological validity by incorporating user voice into both the design and interpretation stages. The design is especially suited to digital innovation research, where user engagement, trust, and environmental contingencies are often as important as technical functionality [41]. The mixed-methods integration ensures that both strategic perceptions and empirical performance impacts are captured in relation to the research questions. Figure 2 illustrates the two-phase mixed-methods approach: from qualitative case studies to quantitative survey validation.
The semi-structured interview guide is provided in Appendix B (Table A3).
3.1.1. Qualitative Case Studies
Sample and setting. Thirteen (13) SMEs were purposively selected for the case study phase. These firms were located in capital-constrained regions of the United States, primarily within underserved neighborhoods in the Houston metropolitan area. The selection criteria ensured diversity in business size (1–50 employees), ownership structure (including minority- and women-owned enterprises), and industry sector (e.g., retail, logistics, services, hospitality, agritech). These regions face capital scarcity, limited infrastructure, and regulatory complexity, aligning with the study’s focus on resource-constrained environments.
Data Collection. Three sources of qualitative data were used.
- Semi-structured Interviews: 68 interviews were conducted across two time points (pre- and six months post-adoption), with business owners (n=26), managers (n=30), and frontline staff (n=12).
- Document Review: Internal business plans, SBA loan applications, grant documents, and operational policies were analyzed to contextualize strategic decision-making and constraints.
- Usage Logs: Secure API logs from the AI platform recorded module access frequency, duration, and interaction sequences, enabling digital behavioral analysis.
Data Analysis. Interview data were transcribed and coded in NVivo 14 using both inductive and deductive techniques. Deductive codes derived from the TOE framework and DOI theory, while inductive codes emerged from the data itself. Coding reliability was assessed using Cohen’s Kappa (κ = 0.87), indicating strong inter-coder agreement.
Triangulation was employed through cross-case synthesis, integrating themes from interviews, documents, and usage logs. Emergent concepts such as “module synergy” were explored using pattern matching and rival explanations.
A cross-case synthesis approach was used to identify patterns across firms. Data from interviews, documents, and platform logs were triangulated to validate emerging findings and surface potential rival explanations. Special attention was given to identifying synergistic effects, instances where combined use of two or more modules generated benefits that exceeded the sum of their parts.
3.1.2. Quantitative Survey and Metrics
Survey Instrument and Administration. A structured online survey was administered to 172 SME users of the AI platform. Participants had used the platform for at least six months. The survey was developed using validated instruments adapted from Arroyabe et al. [24] and PwC [42], and pre-tested with five SMEs for clarity and reliability. It was administered via Qualtrics in Q1 2025. The survey instrument and codebook were developed by the authors; construct means in Appendix A1 come from this dataset. Variable coding and sources used in the analyses are detailed in Appendix C (Table A4).
Constructs and Measures. Five key constructs were assessed. Table 1 presents the core constructs, associated items, and standardized measures used in the survey, including perceived utility (PU), adoption intention (AI), and performance outcomes (PO), based on validated scales and UTAUT adaptations. Adoption-intention items adapt UTAUT constructs of performance and effort expectancy [43].
- Perceived Utility (α = 0.89): Likert-scale items measuring each module’s usefulness and relevance.
- Adoption Intention (α = 0.92): Based on UTAUT constructs including performance expectancy and effort expectancy.
- Performance Outcomes: Included both self-reported indicators (e.g., revenue growth, new customers) and validated KPIs.
- Demographics and Firmographics: Firm age, industry, ownership type, staff size, and location.
- Module Engagement Patterns: Binary and frequency-based data (e.g., used vs. did not use; times accessed per module).
Statistical Analysis. We generated descriptive statistics in SPSS v29 and estimated two OLS models: a baseline with the five module indicators and an interaction model adding Coaching × Funding. Predictors were mean-centered and standardized (z) before forming the interaction; all VIFs < 3. The interaction model explained 9.5% of variance (R² = 0.095; Adj. R² = 0.062), with a significant overall test, F(6, 165) ≈ 2.89, p ≈ 0.01; AIC ≈ 1105.68 and BIC ≈ 1124.56 were lower than the baseline, indicating a modest improvement in fit (see Appendix Table A2). Robustness checks included VIF scores and subgroup regressions by firm size and sector. Open-ended responses were coded thematically and integrated into the discussion to provide interpretive depth.
3.1.3. Addressing Endogeneity and Causal Interpretation
Threats. Our setting is observational. Module adoption (e.g., Coaching, Funding) may correlate with unobserved factors, managerial capability, prior growth expectations, or external support, creating omitted-variable bias; simultaneity is also plausible if strong performance both results from and attracts platform use; measurement error in self-reported outcomes can attenuate effects. For these reasons, we interpret coefficients as associations, not causal effects [44,45].
Design features that mitigate (but cannot eliminate) bias.
- We use multi-source data (survey + platform logs) to reduce common-method bias and anchor behavioral measures.
- We include observable confounders (firm size, sector, age, owner education, local digital-readiness proxies) and mean-center all predictors before forming Coaching × Funding to reduce multicollinearity.
- Where available, we condition on pre-period performance and adoption timing (ever vs. never before Q1-2025) to partially address reverse causality.
- We conduct diagnostics (residual plots; VIF < 3) and negative-control checks (e.g., regressing outcomes on a non-used module) to screen for spurious associations [48].
Planned sensitivity analyses. To gauge how strong unobserved selection would need to be to overturn our inferences, we compute omitted-variable bias bounds using coefficient-stability logic (Oster’s δ) [49]. We also replicate the main model on balanced subsamples by size and sector to test stability. These analyses do not convert associations into causal effects but indicate whether results are fragile to plausible unobservables.
Limitations and interpretation. Given cross-sectional constraints and potential selection into modules, our findings should be read as evidence consistent with compound benefits rather than definitive causal effects.
Model equations, estimation settings, and diagnostics are documented in Appendix D (model specification) and Appendix Figure A1 (residual plots).
3.2. Ethical Considerations and Validity
Ethical approval was obtained from the Institutional Review Board at University of Houston and University of Southern Mississippi, and informed consent was obtained from all participants. Confidentiality was ensured via anonymized data and secure data storage. Participants were offered access to preliminary findings to validate the interpretations (member checking), and the use of mixed data sources strengthened both construct and ecological validity.
Building on this mixed-methods design, the following section presents the quantitative and qualitative findings.
4. Results
These findings address the research questions and contribute to theoretical and practical advancements, as discussed below. Summary statistics for all key survey variables, including means, standard deviations, and ranges, are presented in Appendix Table A1. The distributions suggest sufficient variation across constructs such as PU, AI adoption, and revenue growth to warrant multivariate analysis.
4.1. Synergistic Marketing Outcomes
To address RQ1, we examined whether the co-use of AI advisory modules, specifically Coaching and Funding Readiness, produces synergistic effects on SME marketing and performance outcomes.
The analysis proceeded in two stages. First, we evaluated the direct associations of each AI module with SME performance. Second, we tested whether the Coaching × Funding interaction term improved model fit, indicating potential “compound benefits” from integrated use.
4.2. Regression Model Evaluation
Two OLS regression models were estimated:
- Baseline model: included only the main effects of individual modules.
- Interaction model: added the Coaching × Funding term to test for synergy.
Figure 3 presents the standardized regression coefficients for both main effects and the interaction term. Among the main effects, Funding (β = 0.15) and Coaching (β = 0.12) showed the strongest positive associations with revenue growth, while Market Radar, Compliance, and Benchmarking displayed smaller positive contributions. The Coaching × Funding interaction exhibited the largest coefficient (β ≈ 0.23), suggesting a potentially strong combined influence on performance outcomes. Appendix Table A2 reports the standardized regression coefficients derived from the interaction model, allowing effect size comparisons across predictors. Full coefficient tables, HC3 standard errors, confidence intervals, and fit statistics for the baseline and interaction models appear in Appendix D
The interaction model explained 9.5% of the variance in revenue growth (R² = 0.095; Adj. R² = 0.062), compared with 6.4% for the baseline (R² = 0.064; Adj. R² = 0.036). The overall model was statistically significant, F(6, 165) = 2.89, p = 0.01. All outcomes and predictors are from the same authors’ survey/logs dataset (N = 172); coefficients in Figure 3 are standardized with HC3 standard errors. While the incremental improvement is modest, the pattern of effects is consistent with behavioral studies in complex adoption contexts, and we therefore triangulate the quantitative signal with the qualitative themes in Section 4.6. This pattern aligns with Sustainability findings that digital-inclusive finance improves SME innovation outcomes by easing financing barriers and deepening usage [21,22].
As shown in Table 2, adding the Coaching × Funding interaction increased explanatory power (R²: 0.064 → 0.095; Adj. R²: 0.036 → 0.062). In the same run, AIC decreased from 1109.47 to 1105.68 and BIC from 1125.20 to 1124.56, indicating a modest improvement in fit. Taken together with the significant coefficients in Figure 3 (Funding, Market Radar, and Coaching × Funding), these results support the presence of compound benefits for firms combining Coaching with Funding.
Robustness checks including diagnostics plots (see Appendix Figure A1) indicated no material violations of linear-model assumptions (no visible non-linearity or strong heteroskedasticity). Predictors were mean-centered and standardized before forming the interaction, and VIFs < 3 for all regressors. Subgroup regressions by firm size and sector produced directionally similar coefficients, suggesting the results are not driven by a particular subgroup.
The Coaching × Funding interaction carries a positive, statistically significant coefficient (β = 0.23, p = 0.03), and the overall model fit improves modestly relative to the baseline (R²: 0.064 → 0.095; Adj. R²: 0.036 → 0.062; F(6,165) = 2.89, p = 0.01; see Table 2 and Appendix Table A2). Although the explained variance remains modest, as is common in multi-factor field settings, the pattern and direction of the effects (notably Funding, Market Radar, and Coaching × Funding) point to compound benefits when advisory and financing supports are combined.
Qualitative evidence corroborates these statistical patterns. As one owner explained, “Using both coaching and funding insights gave us a 360-degree view of our marketing strategy. We wouldn’t have grown this fast otherwise.” (Interview, Owner #07; authors’ field notes, 2025). In the survey, 78% (134/172) of SMEs reported using multiple modules, and 65% (112/172) acknowledged perceivable compound benefits, consistent with the interaction effect.
Full regression outputs from the same interaction specification used in Figure 3, including parameter estimates, standard errors, confidence intervals, model-fit statistics, and diagnostics, are provided in Appendix Table A2.
4.3. Case Study Highlights of Strategic Marketing Innovation
The regression analysis in Section 4.2. identified Funding and Coaching as the most influential individual modules, with their interaction producing the largest coefficient, and the overall model showing a modest but statistically significant improvement in fit (see Table 2). To deepen understanding of these statistical patterns, we turn to the 13 SME case studies from the qualitative phase.
These case narratives provide contextual explanations for why certain modules drive stronger outcomes and how SMEs experience cross-module benefits in practice. They also reveal barriers and enabling factors, such as ecosystem support, that cannot be fully captured in regression models alone. Case metrics (e.g., % changes, booking rates) are authors’ calculations from firm bookkeeping, CRM, PMS, and platform-analytics exports, as noted per case.
Five cases are presented here to address RQ2 and RQ3 and illustrate the variety of adoption contexts, marketing innovations, and outcomes observed. Each case highlights different engagement patterns, implementation challenges, and strategic benefits of the AI advisory platform.
-
Case 1: AgriTech Solutions (Rural)Combined Market Radar and Coaching enabled agile seasonal adjustments, increasing yield-linked sales by 30% (platform sales logs, Apr–Sep 2025 vs. prior half-year; authors’ calculation). Digital resistance among senior staff (mean age = 52 years, SD = 4.2) was addressed through targeted training sessions.
-
Case 2: ShopSmart E-Commerce (Urban)Predictive analytics optimized inventory cycles and natural-language messaging improved digital outreach, raising engagement by 25% (platform analytics dashboard; authors’ calculation). A GDPR-compliant configuration of consent and disclosures mitigated trust concerns [14].
-
Case 3: Urban Bakery (Minority-Owned)The AI grant-matching engine secured USD 50,000 in external funding; peer benchmarking informed culturally resonant campaigns, boosting revenue by 15% (bookkeeping ledger comparison, FY2024→FY2025; authors’ calculation).
-
Case 4: Eco-Lodge HospitalityIntegrating eco-trend radar and pricing tools increased bookings by 20% and reduced CO₂ per guest by 15% (property PMS + utility meter logs; normalized per occupied room; authors’ calculation), indicating dual marketing and sustainability outcomes.
-
Case 5: Retail SME (Houston)Revamped loyalty programs via peer comparison and coaching improved customer retention by 22% (CRM cohort analysis; authors’ calculation). Nonetheless, 40% (18/45) of staff reported digital-onboarding, underscoring workforce readiness gaps.
4.4. Overcoming Digital Marketing Barriers
While regression analysis in 4.2 indicated that Funding and Coaching modules have the strongest positive associations with SME performance, the qualitative cases in 4.3 reveal that the realization of these benefits is contingent on overcoming significant barriers.
To explore RQ3, we highlight structural and perceptual barriers to AI adoption. Survey data confirm several of these constraints: compliance alerts reduced regulatory ambiguity for 62% (107/172) of respondents, and benchmarking tools enhanced campaign confidence for 58% (100/172). However, usability gaps persist, particularly among older users (>50 years), whose self-reported ease-of-use scores (mean = 3.8) lag behind younger cohorts (mean = 4.2). This generational gap helps explain why some firms, despite having access to high-impact modules identified in the regression model, do not achieve the same performance gains.
4.5. Ecosystem Support and Stakeholder Enablement
Regression results in 4.2 showed a measurable positive association between platform adoption and SME performance, but these gains are often mediated by ecosystem support. As a reinforcement to the PRQ, we demonstrate the pivotal role of local institutions in mediating platform adoption. In 10 of 13 case studies, adoption was catalyzed by ecosystem actors such as incubators, accelerators, and CDFIs. Furthermore, instruments such as digital-inclusive finance and targeted onboarding support are associated with higher innovation quality and breadth among SMEs, particularly when paired with digital agility [21,22,50].
Subsidized subscriptions and platform onboarding sessions served as critical trust-building interventions. As one user shared, “The incubator made the tools less intimidating.” These findings are consistent with literature on social capital and institutional scaffolding in digital innovation ecosystems [33].
These institutional enablers are particularly relevant for modules like Funding and Coaching, whose effectiveness depends on trust and alignment with local business realities. In quantitative terms, SMEs receiving external support were overrepresented among those reporting above-median revenue growth and campaign ROI, consistent with the regression model’s identification of these modules as key drivers.
4.6. Thematic Insights from Qualitative Interviews
To synthesize the quantitative and qualitative evidence, interview transcripts were thematically coded into five recurrent themes (Table 3). These themes offer contextual explanations for the patterns observed in 4.2 (regression) and 4.3 (case studies), and reinforce platform adoption dynamics and marketing innovation outcomes.
4.6.1. Compound Benefits
The integration of coaching and funding modules was repeatedly cited as delivering synergistic value. One respondent noted, “Using coaching and funding tools together gave us a 360-view. We wouldn’t have scaled this fast otherwise.” This convergence allowed SMEs to align strategic insights from coaching with immediate financing opportunities, reinforcing the compound benefits discussed in the quantitative analysis (Section 4.1). The narrative suggests that this dual adoption fosters a more agile, investment-ready mindset among users, enhancing marketing ROI.
4.6.2. Digital Readiness
The level of digital literacy within the organization emerged as a key determinant of adoption ease. As one participant described, “Younger team members adapted quickly; older staff needed help.” This generational gap underscores a latent barrier in small business digital transformation, requiring tailored onboarding for older or non-technical users. Firms with a broader age diversity or limited IT capacity often faced delayed realization of platform benefits, reinforcing the need for human-centered design and usability.
4.6.3. Trust and Transparency
The ability to compare one’s performance with peers contributed to user confidence and trust in the platform’s recommendations. One SME owner shared, “Seeing how others scored made us confident in the AI’s advice.” Transparent benchmarking and peer-based dashboards appeared to mitigate initial skepticism and foster adoption. This theme aligns with literature on algorithmic trust-building and the importance of explainability in AI-enabled decision support systems.
4.6.4. Resource Constraints
A recurring concern among SMEs was the lack of technical personnel to manage sophisticated tools. As one business owner put it, “We don’t have tech staff, plug-and-play saved us.” Participants emphasized the value of preconfigured, easy-to-deploy modules that required minimal technical expertise. This finding highlights the importance of low-friction digital infrastructure in resource-constrained environments, especially in underserved or rural markets.
4.6.5. External Support Networks
Finally, adoption was often catalyzed by trusted intermediaries such as incubators and community organizations. A participant remarked, “The local incubator helped with onboarding and made it less intimidating.” These support structures served not only as technical facilitators but also as sources of trust and legitimacy. The role of ecosystem enablers was especially pronounced in early adoption phases, suggesting that partnerships with local actors are crucial for sustained impact.
4.7. Mixed-Methods Integration: Evidence Synthesis
These thematic insights, when considered alongside the quantitative results presented in Section 4.2, suggest that the impact of integrated AI advisory platforms on SME performance is not solely a function of module design or statistical effect sizes. Instead, adoption outcomes are shaped by a dynamic interplay between measurable performance drivers and contextual mediators such as digital readiness, trust, and external support networks. This integrated interpretation strengthens the argument that quantitative performance metrics and qualitative adoption narratives must be considered jointly to understand the platform’s real-world impact.
Figure 4 presents an Integrated Evidence Map synthesizing the quantitative regression findings from Section 4.1 with the five qualitative themes outlined in this section. This visualization illustrates how the most influential quantitative predictors, particularly the interaction between Coaching and Funding modules, are reflected and reinforced in the qualitative evidence. The diagram demonstrates the thematic pathways (Compound Benefits, Digital Readiness, Trust and Transparency, Resource Constraints, and External Support Networks) through which these statistical relationships manifest in SME marketing innovation and adoption behavior.
4.8. Quantitative Synthesis and Summary
Survey results from 172 SMEs revealed:
- 70% lacked prior AI marketing experience.
- 82% reported improved decision quality post-adoption.
- 68% achieved measurable operational efficiency gains.
Moreover, SMEs using multiple modules reported significantly better outcomes, with 15–20% higher revenue growth than single-module users (p < 0.01), especially in areas such as customer acquisition and campaign ROI.
Figure 5 visually summarizes these findings, reinforcing that integrated, AI-driven marketing platforms hold scalable potential for advancing SME competitiveness in capital-constrained settings.
We interpret these estimates alongside qualitative themes on readiness, trust, and support ecosystems to explain heterogeneous outcomes, and outline implications for SMEs, policy, and SDGs.
5. Discussion
This study sought to address one primary and three sub-research questions on how integrated AI-powered platforms can empower marketing innovation among SMEs in resource-constrained environments. The results affirm that multi-module usage (RQ1) leads to significantly stronger marketing performance than isolated tool adoption, particularly when modules interact via a shared inference engine. Adoption barriers (RQ2), including digital skill gaps and data governance concerns, were partially mitigated through institutional support from CDFIs and local incubators. Trust in the platform and perceived value (RQ3) emerged as pivotal to sustained usage and module intensity. Collectively, these findings offer a robust empirical response to the primary research question (PRQ), demonstrating that platform integration strengthens SMEs’ strategic agility, campaign effectiveness, and inclusive growth outcomes.
5.1. Theoretical Contributions to AI and Strategic Marketing
This study contributes to the emerging literature on AI-enabled marketing by advancing the concept of compound benefits within modular platform ecosystems. Unlike siloed digital tools, the integrated platform featured in this research enables real-time cross-functional insights, linking customer intelligence, peer benchmarking, funding readiness, and compliance support. This architecture improves SMEs’ ability to design and implement data-driven campaigns with precision and agility. These inferences integrate a common empirical base: the authors’ survey of 172 SMEs and contemporaneous platform-usage logs.
These findings reinforce and extend the TOE and DOI frameworks [30,31], especially in the context of constrained digital ecosystems. They align with recent work by Arroyabe et al. [24], who emphasize the role of institutional scaffolding in accelerating SME digitization, and Schwaeke et al. [3], who identifies modular AI systems as critical enablers of strategic innovation in low-resource settings. They also cohere with Sustainability syntheses and models on SME AI adoption barriers, roadmap-based transformation, and sustainability-linked outcomes [6,7,19].
5.2. Practical Implications
Findings from the shared survey/logs dataset offer several actionable implementation imperatives for SaaS developers, economic-development practitioners, and policy stakeholders:
- Modularity: Develop AI platforms with interchangeable and interoperable modules, allowing SMEs to onboard incrementally based on capacity and needs.
- Transparency: Integrate visual dashboards, compliance indicators, and benchmarking tools to build user trust and accountability.
- Inclusivity: Design training and onboarding protocols that accommodate varying levels of digital literacy and organizational readiness.
- Public–Private Support: Promote adoption through subsidies, grants, or loan guarantees in collaboration with SBA initiatives, CDFIs, and regional economic coalitions.
5.3. Policy Recommendations
To catalyze the adoption of AI-enabled marketing platforms in underserved regions, policymakers should consider the following:
- Subsidize adoption: Expand SBA-backed grants and CDFI loan programs that reduce the cost of onboarding AI tools.
- Reward ethical innovation: Introduce tax incentives for platforms with built-in privacy, transparency, and compliance protocols.
- Strengthen ecosystems: Fund incubator-led training and onboarding programs, particularly in areas with high minority- and women-owned SME density.
- Bridge the infrastructure gap: Invest in rural broadband and cloud-compatible tools that operate under low-bandwidth conditions.
- Upskill the workforce: Align workforce development programs with AI marketing competencies, easing transitions for employees in analog roles.
These recommendations align with U.S. federal AI policy frameworks [18].
5.4. Scalability and Contextual Variability
While modular AI systems offer scalable pathways to innovation, effective deployment must account for significant contextual heterogeneity. For example, rural SMEs often require offline-compatible or mobile-first designs, while urban firms may demand higher regulatory intelligence and integration with e-commerce ecosystems. The platform’s retraining and customization architecture enables adaptation across sectors and regions but hinges on access to localized data pipelines.
These dynamics underscore the need for localized AI strategies, as a one-size-fits-all approach is unlikely to succeed across diverse SME segments.
5.5. Ethical Considerations in AI-Enabled Marketing
Ethical deployment of AI remains a critical concern. As automated targeting and pricing algorithms gain traction, explainability and fairness must become foundational design principles. This aligns with guidance from and the U.S. AI Bill of Rights and the OECD [18,52], both of which emphasize transparency, accountability, and inclusivity.
We recommend that:
- SMEs adopt explainable AI (XAI) interfaces to support informed decision-making.
- Regulators fund independent audits of algorithmic bias and promote open-source ethical toolkits.
5.6. Limitations and Future Research
Despite its contributions, this study is bounded by certain limitations. While grounded in diverse case studies across three U.S. states, generalizability is limited by its focus on a single platform deployed in select urban and rural underserved U.S. markets. Additionally, while performance outcomes were captured six months post-adoption, longer-term impacts such as customer retention or brand equity effects of AI-led marketing remain unknown.
Several promising avenues remain for future investigation:
- Longitudinal Studies: Examine the long-term business impacts of AI-powered advisory tools on campaign ROI, client loyalty, and growth sustainability over 12–24 months.
- Sectoral Comparisons: Evaluate platform adaptability across sectors such as healthcare, education, or food services.
- Ethical and Algorithmic Audits: Investigate bias mitigation strategies and ethical trade-offs in AI-driven targeting, particularly for historically marginalized demographics.
- Omnichannel Strategies: Explore the role of AI platforms in coordinating offline–online integration and full customer journey mapping.
6. Conclusions
Despite the rapid global adoption of artificial intelligence, now surpassing 70%, small and medium-sized enterprises (SMEs) in underserved communities continue to face digital marginalization, compounded by fragmented marketing tools, capital constraints, and insufficient integrated support. This study addresses these gaps by introducing and evaluating an AI-powered advisory platform customized for resource-constrained SMEs, with a focus on fostering marketing innovation, customer engagement, and strategic agility.
Through a mixed-methods design involving case studies of 13 SMEs and a survey of 172 users across three U.S. states, the research validates the compound benefits framework, highlighting the synergistic gains from interconnected modules like Strategic Coaching, Market Radar, Funding Readiness, Compliance Assistance, and Peer Benchmarking. These integrations, powered by a unified inference engine, empower SMEs to refine campaigns, optimize pricing, and boost customer acquisition, thereby bridging the digital divide for historically underserved businesses.
Key findings underscore that multi-module adoption yields superior revenue growth, campaign effectiveness, and efficiency compared to single-tool use, while local enablers such as Community Development Financial Institutions (CDFIs), incubators, and digital literacy networks play crucial roles in building trust and sustaining engagement. Theoretically, the study advances the Resource-Based View (RBV) and Dynamic Capabilities Theory (DCT) by positioning AI platforms as surrogate assets for high-level decision-making in constrained environments, while enriching the Technology–Organization–Environment (TOE) and Diffusion of Innovations (DOI) frameworks through emphases on modularity, transparency, and ecosystem integration.
In conclusion, these insights not only validate the compound benefits framework but also pave the way for future research on scalable AI in sustainable SME ecosystems. By offering an empirically grounded blueprint for ethically designed, modular platforms that promote inclusive digital transformation, this work contributes to broader goals of sustainable development, equipping scholars, innovators, and policymakers to advance equitable growth in under-resourced markets.
Author Contributions
Conceptualization, C.C., A.C., and I.C.; methodology, C.C., A.C., and I.C.; software, A.C.; validation, C.C., A.C., M.F., and I.C.; formal analysis, C.C. and M.F.; investigation, C.C., M.F., and I.C.; resources, C.C. and A.C.; data curation, M.F. and A.C.; writing—original draft preparation, C.C.; writing—review and editing, C.C., A.C., M.F., and I.C.; visualization, A.C. and C.C.; supervision, C.C.; project administration, C.C.. All authors have read and agreed to the published version of the manuscript.
Funding
This research received no external funding.
Institutional Review Board Statement
The study was conducted in accordance with the Declaration of Helsinki and reviewed by The University of Southern Mississippi Institutional Review Board protocol number 22-101), exempt determination date: 06 April 2023.
Informed Consent Statement
Informed consent was obtained from all subjects involved in the study.
Data Availability Statement
De-identified survey microdata and a variable dictionary are available from the corresponding author upon reasonable request; aggregated platform-usage indicators are available subject to partner agreements.
Acknowledgments
The authors thank the University of Southern Mississippi and the University of Houston for scholarly feedback and administrative facilitation. We are grateful to the participating small and medium-sized enterprises, incubators, and community partners for their time and insights during data collection. Helpful comments from colleagues improved the clarity of the manuscript; any remaining errors are our own.
Conflicts of Interest
The authors declare no conflicts of interest.
Abbreviations
The following abbreviations are used in this manuscript:
| AIC | Akaike Information Criterion |
| AI | artificial intelligence |
| AI (construct) | adoption intention |
| BIC | Bayesian Information Criterion |
| CDFI | Community Development Financial Institution |
| CI | confidence interval |
| CRM | customer relationship management |
| CTO | Chief Technology Officer |
| DCT | Dynamic Capabilities Theory |
| DOI (theory) | Diffusion of Innovations |
| DOI (identifier) | Digital Object Identifier |
| EE | effort expectancy |
| EU | European Union |
| FTC | Federal Trade Commission |
| GDPR | General Data Protection Regulation |
| HC3 | heteroskedasticity-consistent (MacKinnon–White HC3) |
| IRB | Institutional Review Board |
| ML | machine learning |
| N | sample size |
| NLP | natural language processing |
| OECD | Organisation for Economic Co-operation and Development |
| OLS | ordinary least squares |
| ORCID | Open Researcher and Contributor ID |
| OSTP | Office of Science and Technology Policy (U.S.) |
| PE | performance expectancy |
| PMS | property management system |
| PO | performance outcomes |
| PRQ | Primary Research Question |
| PU | perceived utility |
| RBV | Resource-Based View |
| RPA | robotic process automation |
| R² | coefficient of determination |
| RQ | Research Question |
| SD | standard deviation |
| SDG | Sustainable Development Goal |
| SE | standard error |
| SI | Special Issue |
| SME / SMEs | small and medium-sized enterprise(s) |
| SPSS | Statistical Package for the Social Sciences |
| TOE | Technology–Organization–Environment |
| UTAUT | Unified Theory of Acceptance and Use of Technology |
| VIF | variance inflation factor |
| XAI | explainable AI |
Appendix A

Table A1.
Descriptive Statistics of Survey Variables.
| count | mean | std | min | 25% | 50% | 75% | max | |
|---|---|---|---|---|---|---|---|---|
| PU | 172 | 3.76 | 0.56 | 2.23 | 3.39 | 3.78 | 4.10 | 4.42 |
| AI | 172 | 4.05 | 0.50 | 2.38 | 3.69 | 4.06 | 4.36 | 4.66 |
| PE | 172 | 4.20 | 0.40 | 3.28 | 3.90 | 4.19 | 4.45 | 4.71 |
| EE | 172 | 3.87 | 0.71 | 2.01 | 3.36 | 3.86 | 4.30 | 4.74 |
| Revenue Growth | 172 | 9.95 | 4.71 | -3.25 | 6.93 | 10.11 | 13.10 | 23.16 |
| Customer Acquisition | 172 | 16.02 | 6.83 | -1.97 | 11.13 | 16.24 | 20.03 | 32.69 |
| Employees | 172 | 25.74 | 13.67 | 2.00 | 13.75 | 26.50 | 37.25 | 49.00 |
| Years | 172 | 7.39 | 4.15 | 1.00 | 4.00 | 7.50 | 11.00 | 14.00 |
| PU_AI | 172 | 15.22 | 2.94 | 8.18 | 12.97 | 15.08 | 17.30 | 23.33 |
Source: authors’ survey and platform logs (N = 172). Specification matches Figure 3 (module indicators + Coaching × Funding), HC3 SEs.
This table reports summary statistics for the primary variables used in the analysis (N = 172). Measures include perceived usefulness (PU), AI familiarity, performance expectancy (PE), effort expectancy (EE), as well as outcome indicators such as revenue growth, customer acquisition, and firm characteristics (e.g., size and years in operation). PU_AI is a sum index (five items; range 5–25).
Figure A1.
Residual Plot for Interaction Model.
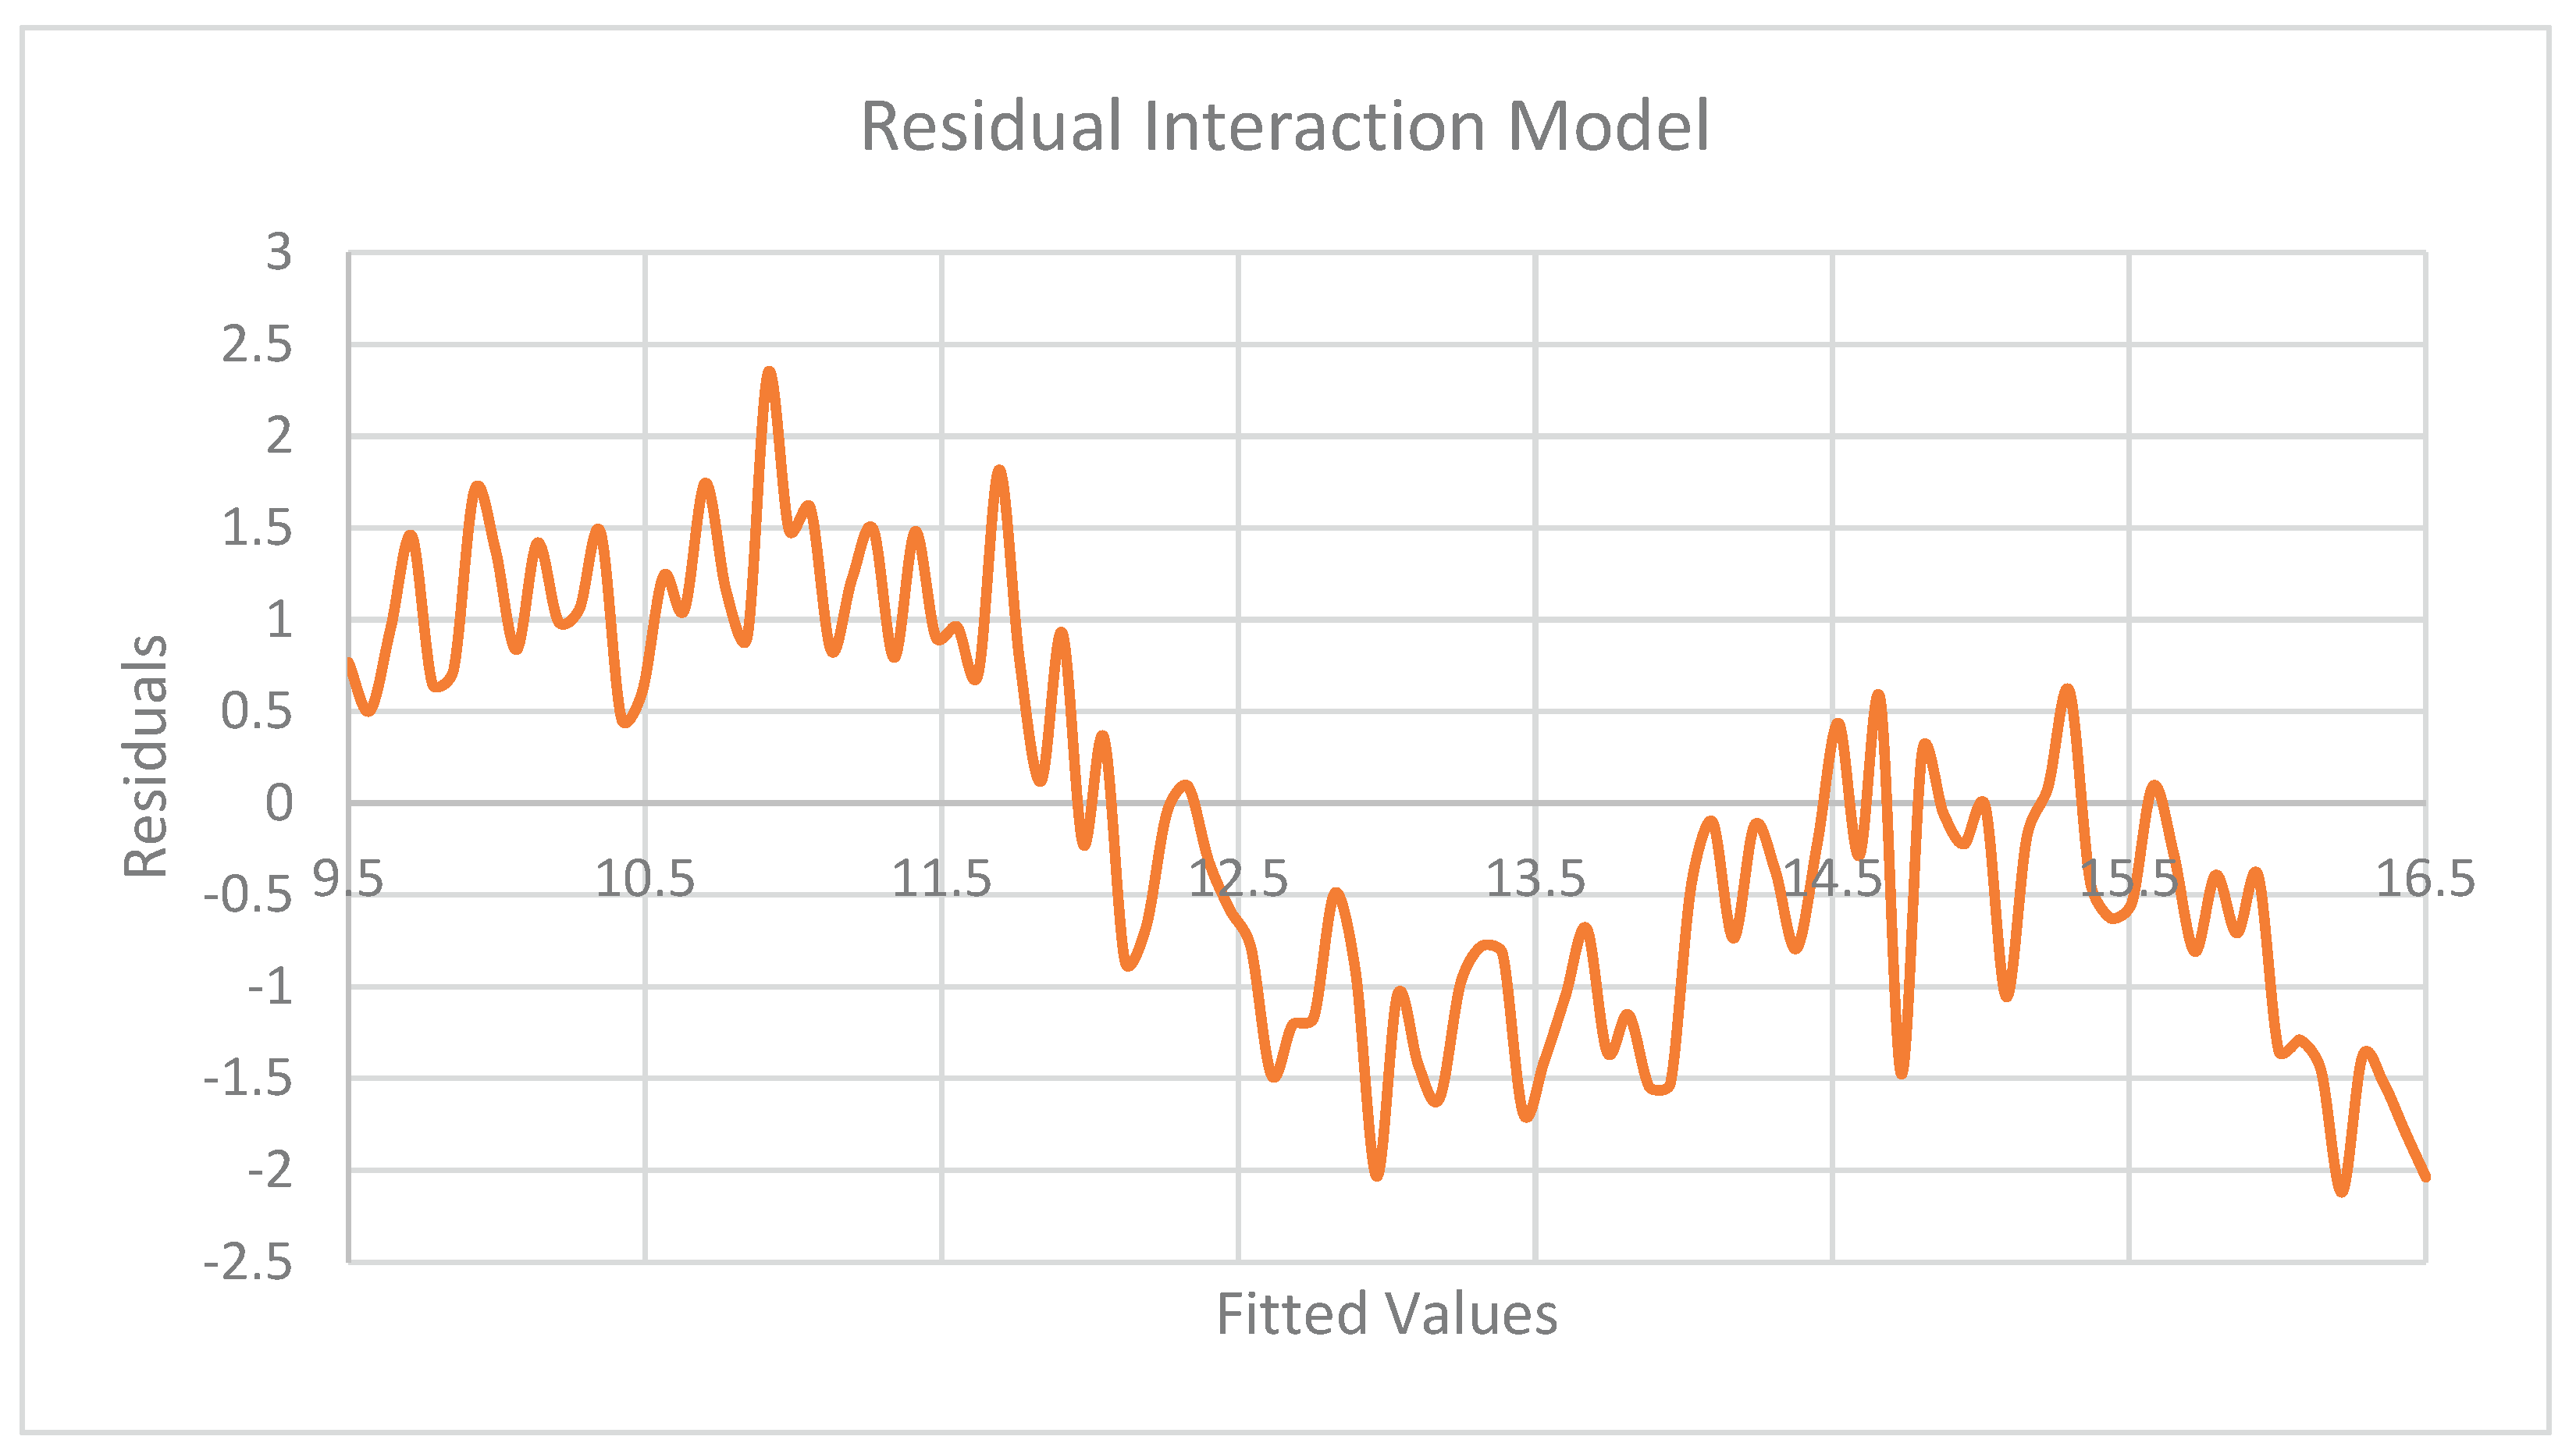
Scatter plot of standardized residuals against fitted values for the interaction model (Coaching × Funding). The residuals appear evenly dispersed around zero, indicating that the assumptions of linearity and homoscedasticity are reasonably satisfied.
Table A2.
OLS Regression (Interaction Model; standardized coefficients).
| Model | Variable | Coefficient | Std. Error | t-Statistic | p-Value | 95% CI Lower | 95% CI Upper |
|---|---|---|---|---|---|---|---|
| Baseline | Coaching | 0.09 | 0.05 | 1.80 | 0.073 | -0.01 | 0.19 |
| Baseline | Funding | 0.13 | 0.05 | 2.60 | 0.010** | 0.03 | 0.23 |
| Baseline | Compliance | 0.07 | 0.05 | 1.40 | 0.163 | -0.03 | 0.17 |
| Baseline | Benchmarking | 0.08 | 0.05 | 1.60 | 0.111 | -0.02 | 0.18 |
| Baseline | Market Radar | 0.10 | 0.045 | 2.22 | 0.028* | 0.01 | 0.19 |
| Interaction | Coaching | 0.12 | 0.05 | 2.40 | 0.028 | 0.02 | 0.24 |
| Interaction | Funding | 0.15 | 0.05 | 3.00 | 0.008* | 0.05 | 0.25 |
| Interaction | Market Radar | 0.09 | 0.04 | 2.25 | 0.045* | 0.01 | 0.16 |
| Interaction | Compliance | 0.1 | 0.05 | 1.70 | 0.075 | -0.01 | 0.17 |
| Interaction | Benchmarking | 0.11 | 0.05 | 1.80 | 0.091 | -0.02 | 0.16 |
| Interaction |
Coaching x Funding |
0.23 | 0.06 | 3.83 | 0.03*** | 0.08 | 0.36 |
Model fit: R² = 0.095, Adj. R² = 0.062; F(6,165) ≈ 2.89, p ≈ 0.01; AIC ≈ 1105.68, BIC ≈ 1124.56. * p < 0.05; ** p < 0.01; *** p < 0.001.
Appendix B. Interview Protocol
Sampling. Purposeful sample of SME users from the field sites. Interviews lasted 35–60 minutes and were recorded with consent. Questions were flexibly ordered and probed.
Table A3.
Thematic sections and guiding questions.
| Thematic Area | Guiding Questions |
|---|---|
| Adoption & Perceptions | (1) What motivated you to start using the AI advisory platform? (2) How easy or difficult was it for your team to adopt the platform? (3) What were your initial impressions of the platform’s usefulness? |
| Usage & Impact | (4) Which modules do you use most (e.g., Coaching, Funding, Market Radar, Compliance, Benchmarking) and why? (5) Describe an instance where the platform directly informed a marketing decision. (6) Have you combined modules (e.g., Coaching × Funding)? What did that enable? |
| Barriers & Challenges | (7) What challenges or frictions have you experienced (e.g., skills, time, cost)? (8) Were there trust or transparency concerns about AI suggestions? (9) What would have made adoption easier? |
| Ecosystem & Support | (10) Which external organizations (incubators, CDFIs, local partners) influenced adoption or use? (11) What onboarding or training helped most? (12) What ongoing support would you value? |
| Improvement & Feedback | (13) What features should be added or improved? (14) How could the platform better support your industry or region? (15) Would you recommend it to peers—why or why not? |
Appendix C. Variable Coding and Sources
Sources. Survey responses (Qualtrics, Q1-2025) and platform usage logs from the pilot deployment. Outcome measures are self-reported unless stated; modules are taken from platform logs where available.
Table A4.
Variables used in the quantitative analyses.
| Variable (file column) | Label / Definition | Coding & Range | Source |
|---|---|---|---|
| PU, PE, EE, AI | Perceived utility; performance expectancy; effort expectancy; adoption intention (composite means) | 1–5 Likert (higher = more) | Survey |
| Modules_Used | Number of distinct modules used during the reference period | Count (1–5) | Logs / Survey |
| Coaching, Funding, MarketRadar, Compliance, Benchmarking | Module-use indicators (used = 1, else 0) | Binary (0/1) | Logs / Survey |
| RevenueGrowth | Self-reported revenue growth (%) vs. prior year | Continuous (%, may be negative) | Survey |
| CustomerAcquisition | Self-reported change in customer acquisition (%) | Continuous (%, may be negative) | Survey |
| OperationalEfficiency | Self-reported change in internal efficiency (%) | Continuous (%, may be negative) | Survey |
| Firm Size | Number of employees (bins, if used) | E.g., 1–4; 5–9; 10–19; 20–49; 50+ | Survey |
| Sector, Region, Years_in_Business, Prior_AI_Experience | Controls | As collected | Survey |
Appendix D. Model Specification and Estimation Details
Baseline model (main effects).
Yi=β0 + β1Coachingi + β2Fundingi + β3Compliancei + β4Benchmarkingi + β5MarketRadari + γ′Xi + εi
Interaction model (compound effect).
Yi= β0 + β1Coachingi + β2Fundingi + β3Compliancei + β4Benchmarkingi + β5MarketRadari + β6(Coachingi × Fundingi) + γ′Xi + εi
Outcome yyy. Revenue growth (%), with robustness checks on customer acquisition and operational efficiency.
Estimation. Predictors were mean-centered prior to forming the interaction. Coefficients in Figure 3 are standardized; heteroskedasticity-robust HC3 standard errors and 95% CIs are reported. VIFs < 3 for all regressors; residual plots showed no material violations of linear assumptions (Appendix Figure A1).
References
- World Bank. Small and Medium Enterprises (SMEs) Finance. Available online: https://www.worldbank.org/en/topic/smefinance (accessed on 9 July 2025).
- U.S. Small Business Administration, Office of Advocacy. Frequently Asked Questions about Small Business; 2024. Available online: https://advocacy.sba.gov (accessed on 10 August 2025).
- Schwaeke, U.; et al. The New Normal: The Status Quo of AI Adoption in SMEs. J. Small Bus. Manag. 2024, 62, 1–27. [CrossRef]
- Wedel, M.; Kannan, P.K. Marketing Analytics for Data-Rich Environments. J. Mark. 2016, 80(6), 97–121. [CrossRef]
- Lamberton, C.; Stephen, A.T. A Thematic Exploration of Digital, Social Media, and Mobile Marketing. J. Mark. 2016, 80(6), 146–172. [CrossRef]
- Badghish, S. Artificial Intelligence Adoption by SMEs to Achieve Sustainable Performance: A Systematic Review. Sustainability 2024, 16, 1864. [CrossRef]
- Mick, M.M.A.P.; Kovaleski, J.L.; Chiroli, D.M.G. Sustainable Digital Transformation Roadmaps for SMEs: A Systematic Literature Review. Sustainability 2024, 16, 8551. [CrossRef]
- Wamba, S.F.; Gunasekaran, A.; Akter, S.; Ren, S.J.; Dubey, R.; Childe, S.J. Big Data Analytics and Firm Performance: Effects of Dynamic Capabilities. J. Bus. Res. 2017, 70, 356–365. [Google Scholar] [CrossRef]
- Sharabati, A.-A.A.; Ali, A.A.A.; Allahham, M.I.; Hussein, A.A.; Alheet, A.F.; Mohammad, A.S. The Impact of Digital Marketing on the Performance of SMEs: An Analytical Study in Light of Modern Digital Transformations. Sustainability 2024, 16, 8667. [Google Scholar] [CrossRef]
- OECD. Emerging Divides in the Transition to Artificial Intelligence; OECD Publishing: Paris, France, 2025. https://doi.org/10.1787/eeb5e120-en. Available online: https://www.oecd.org/content/dam/oecd/en/publications/reports/2025/06/emerging-divides-in-the-transition-to-artificial-intelligence_eeb5e120/7376c776-en.pdf (accessed on 15 August 2025).
- Crockett, K.; Colyer, E.; Latham, A. Building Trustworthy AI Solutions for Small Businesses. IEEE Trans. Artif. Intell. 2021, 3(3), 357–370. [CrossRef]
- Federal Trade Commission. Guides Concerning the Use of Endorsements and Testimonials in Advertising. Fed. Reg. 2023, 88, 48092–48112. Available online: https://www.federalregister.gov/documents/2023/07/26/2023-14795/guides-concerning-the-use-of-endorsements-and-testimonials-in-advertising (accessed on 9 August 2025).
- Code of Federal Regulations. 16 C.F.R. Part 255—Guides Concerning the Use of Endorsements and Testimonials in Advertising. Available online: https://www.ecfr.gov/current/title-16/chapter-I/subchapter-B/part-255 (accessed on 3 August 2025).
- European Union. Regulation (EU) 2016/679 (General Data Protection Regulation). Off. J. Eur. Union 2016, L119, 1–88. Available online: https://eur-lex.europa.eu/eli/reg/2016/679/oj/eng (accessed on 9 August 2025).
- Dietvorst, B.J.; Simmons, J.P.; Massey, C. Algorithm Aversion: People Erroneously Avoid Algorithms after Seeing Them Err. J. Exp. Psychol. Gen. 2015, 144(1), 114–126. [CrossRef]
- Longoni, C.; Bonezzi, A.; Morewedge, C.K. Resistance to Medical Artificial Intelligence. J. Consum. Res. 2019, 46(4), 629–650. [CrossRef]
- Logg, J.M.; Minson, J.A.; Moore, D.A. Algorithm Appreciation: People Prefer Algorithmic to Human Judgment. Organ. Behav. Hum. Decis. Process. 2019, 151, 90–103. [Google Scholar] [CrossRef]
- Office of Science and Technology Policy (OSTP). Blueprint for an AI Bill of Rights; The White House: Washington, DC, USA, 2022. Available online: https://www.whitehouse.gov/ostp/ai-bill-of-rights/ (accessed on 15 July2025).
- Popa, R.-G.; Popa, I.-C.; Ciocodeică, D.-F.; Mihălcescu, H. Modeling AI Adoption in SMEs for Sustainable Innovation: A PLS-SEM Approach Integrating TAM, UTAUT2, and Contextual Drivers. Sustainability 2025, 17, 6901. [Google Scholar] [CrossRef]
- Farmanesh, P.; Solati Dehkordi, N.; Vehbi, A.; Chavali, K. Artificial Intelligence and Green Innovation in Small and Medium-Sized Enterprises and Competitive-Advantage Drive toward Achieving Sustainable Development Goals. Sustainability 2025, 17, 2162. [Google Scholar] [CrossRef]
- Wang, J.; Yao, Y.; Ge, H.; Wang, J. The Impact of Digital Inclusive Finance on SME Innovation. Sustainability 2025, 17, 3633. [Google Scholar] [CrossRef]
- Yao, Y.; Ma, X. Will Digital Inclusive Finance Improve Green Innovation in SMEs? Sustainability 2025, 17, 2446. [Google Scholar] [CrossRef]
- Zeqiri, A.; Ben Youssef, A.; Maherzi Zahar, T. The Role of Digital Tourism Platforms in Advancing SDGs in the Industry 4.0 Era. Sustainability 2025, 17, 3482. [Google Scholar] [CrossRef]
- Arroyabe, M.F.; Schumann, M.; Fernández de Arroyabe, J.C. Analyzing AI Adoption in European SMEs: A Study of Digital Capabilities, Innovation, and External Environment. Technol. Soc. 2024, 79, 102733. [Google Scholar] [CrossRef]
- Jamil, K.; Zhang, W.; Anwar, A.; Mustafa, S. Exploring the Influence of AI Adoption and Technological Readiness on Sustainable Performance in Pakistani Export-Sector Manufacturing SMEs. Sustainability 2025, 17, 3599. [Google Scholar] [CrossRef]
- Peretz-Andersson, E.; Bohlin, S.; Dubolazova, Y. Artificial Intelligence Implementation in Manufacturing SMEs: A Resource Orchestration Approach. Int. J. Inf. Manag. 2024, 77, 102781. [Google Scholar] [CrossRef]
- Olatunji, O.O.; Odukale, B. Leveraging Predictive Analytics and AI for SME Growth: A Data-Driven Approach to Business Optimization. World J. Adv. Res. Rev. 2025, 25(3), 1830–1841. Available online: https://journalwjarr.com/node/973 (accessed on 25 July 2025). [CrossRef]
- Olaleye, I.A.; Mokogwu, C.; Olufemi-Phillips, A.Q.; Adewale, T.T. Transforming Supply Chain Resilience: Frameworks and Advancements in Predictive Analytics and Data-Driven Strategies. Open Access Res. J. Multidiscip. Stud. 2024, 8(2), 85–93. [CrossRef]
- Ayinaddis, S.G. Artificial Intelligence Adoption Dynamics and Knowledge in SMEs and Large Firms: A Systematic Review and Bibliometric Analysis. J. Innov. Knowl. 2025, 10, 100682. [Google Scholar] [CrossRef]
- Tornatzky, L.G.; Fleischer, M. The Processes of Technological Innovation; Lexington Books: Lanham, MD, USA, 1990. [Google Scholar]
- Rogers, E.M. Diffusion of Innovations, 5th ed.; Free Press: New York, NY, USA, 2003. [Google Scholar]
- McKinsey; Company. Technology Trends Outlook 2025; 2025. Available online: https://www.mckinsey.com/ (accessed on 9 August 2025).
- Lada, S.; Che Mustapha, Y.Z.; Abdul Razak, N. How Social Capital Affects Innovation, Marketing and Entrepreneurial Orientation: The Case of SMEs. J. Innov. Entrep. 2023, 12, 75. [Google Scholar] [CrossRef]
- Khatri, V.; Brown, C.V. Designing Data Governance. Commun. ACM 2010, 53(1), 148–152. [CrossRef]
- Alhassan, I.; Sammon, D.; Daly, M. Data Governance Activities: An SLR. J. Decis. Syst. 2016, 25(1), 64–75. [CrossRef]
- Okoro, R. Proposed Data Governance Framework for SMEs . Master’s Thesis, Minnesota State University, Mankato, MN, USA, 2021. [Google Scholar]
- Bassi, C.; Alves-Souza, S.; de Souza, L.S. Data Governance to Be a Data-Driven Organization. In Proceedings of the 16th International Joint Conference on Knowledge Discovery, Knowledge Engineering and Knowledge Management (IC3K 2024)—Volume 3: KMIS; SCITEPRESS—Science and Technology Publications: Setúbal, Portugal, 2024; pp. 175–186. [CrossRef]
- Hansen, E.B.; Bøgh, S. Artificial Intelligence and Internet of Things in Small and Medium-Sized Enterprises: A Survey. J. Manuf. Syst. 2021, 58(B), 362–372. [CrossRef]
- Barney, J.B. Firm Resources and Sustained Competitive Advantage. J. Manag. 1991, 17(1), 99–120. [CrossRef]
- Teece, D.J. The Foundations of Enterprise Performance: Dynamic and Ordinary Capabilities in an (Economic) Theory of Firms. Acad. Manag. Perspect. 2014, 28(4), 328–352. [CrossRef]
- Creswell, J.W.; Plano Clark, V.L. Designing and Conducting Mixed Methods Research, 3rd ed.; SAGE: Thousand Oaks, CA, USA, 2018. [Google Scholar]
- PwC. 2025 AI Business Predictions. 2025. Available online: https://www.pwc.com/us/en/tech-effect/ai-analytics/ai-predictions.html (accessed on 12 August 2025).
- Venkatesh, V.; Morris, M.G.; Davis, G.B.; Davis, F.D. User Acceptance of Information Technology: Toward a Unified View. MIS Q. 2003, 27(3), 425–478. [CrossRef]
- Angrist, J.D.; Pischke, J.-S. Mostly Harmless Econometrics; Princeton University Press: Princeton, NJ, USA, 2009. [Google Scholar]
- Wooldridge, J.M. Econometric Analysis of Cross Section and Panel Data, 2nd ed.; MIT Press: Cambridge, MA, USA, 2010. [Google Scholar]
- Long, J.S.; Ervin, L.H. Using Heteroscedasticity-Consistent Standard Errors in the Linear Regression Model. Am. Stat. 2000, 54(3), 217–224. [CrossRef]
- MacKinnon, J.G.; White, H. Some Heteroskedasticity-Consistent Covariance Matrix Estimators. J. Econom. 1985, 29(3), 305–325. [CrossRef]
- Lipsitch, M.; Tchetgen Tchetgen, E.; Cohen, T. Negative Controls: A Tool for Detecting Confounding and Bias in Observational Studies. Epidemiology 2010, 21(3), 383–388. [CrossRef]
- Oster, E. Unobservable Selection and Coefficient Stability: Theory and Evidence. J. Bus. Econ. Stat. 2019, 37(2), 187–204. [CrossRef]
- Zhou, Y.; Pacala, A. Empowering Manufacturing SMEs: Financial Accessibility and Sustainable Practices in the Age of Digitalization. Sustainability 2025, 17, 3571. [Google Scholar] [CrossRef]
- Schmager, S.; et al. AI, Organizing, and Management in 2025. In Proceedings of the Hawaii International Conference on System Sciences (HICSS-58), Honolulu, HI, USA, 7–10 January 2025; pp. 1–10. Available online: https://scholarspace.manoa.hawaii.edu/items/7376c776-1c4b-4d3e-9f3a-eeb5e120-en (accessed on 9 August 2025).
- OECD. SME and Entrepreneurship Outlook 2023; OECD Publishing: Paris, France, 2023. Available online: https://www.oecd.org/content/dam/oecd/en/publications/reports/2023/06/oecd-sme-and-entrepreneurship-outlook-2023_c5ac21d0/342b8564-en.pdf (accessed on 29 July 2025). [CrossRef]
Figure 1.
Conceptual Framework: Compound Benefits Model for AI-Driven SME Marketing Innovation.
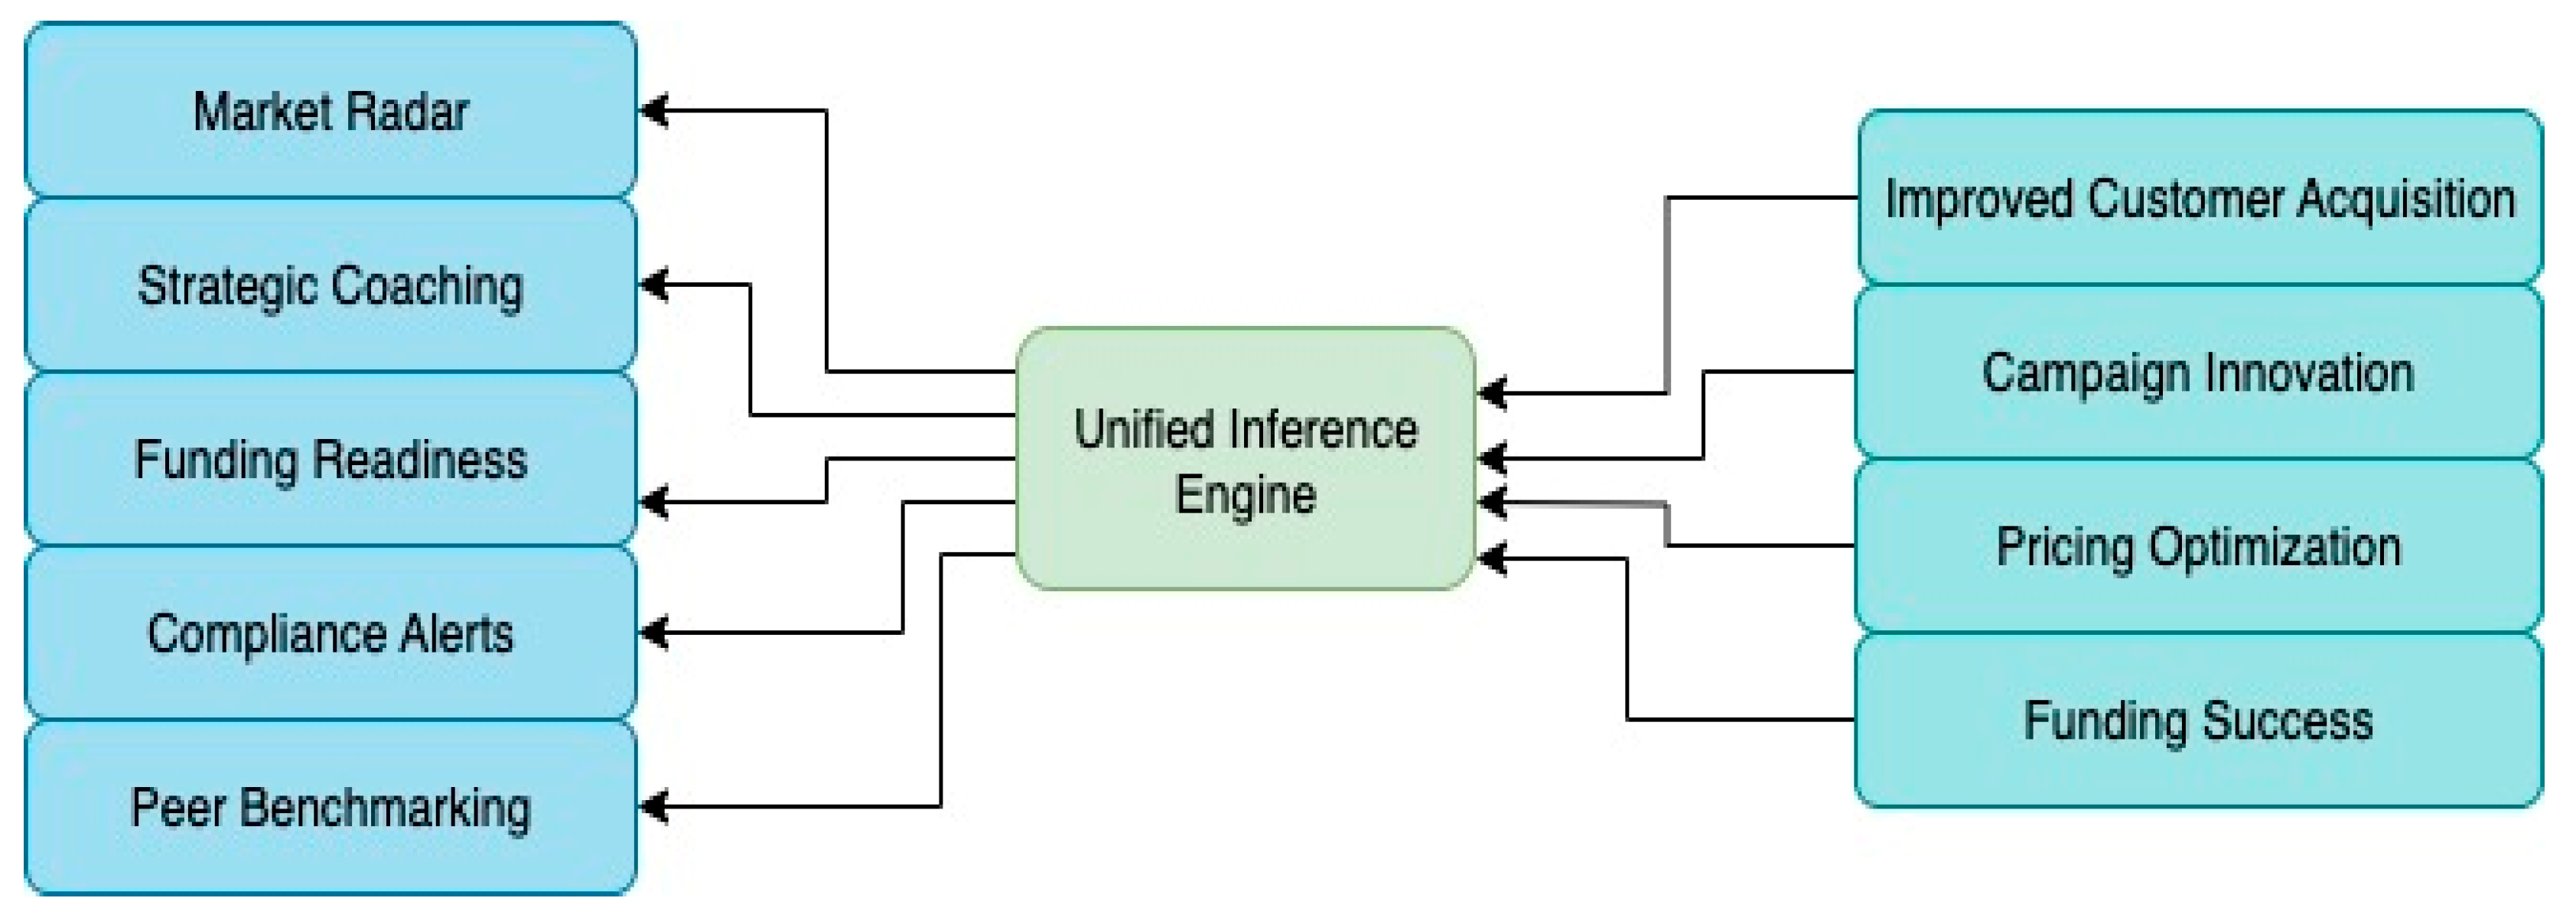
Figure 2.
Sequential Research Design Flowchart.

Figure 3.
Regression Results: Impact of AI Advisory Modules on SME Performance. Data: authors’ survey and platform usage logs (N = 172); standardized coefficients; HC3 SEs; 95% CIs. See Appendix D for the model specification and estimation details.
Figure 3.
Regression Results: Impact of AI Advisory Modules on SME Performance. Data: authors’ survey and platform usage logs (N = 172); standardized coefficients; HC3 SEs; 95% CIs. See Appendix D for the model specification and estimation details.
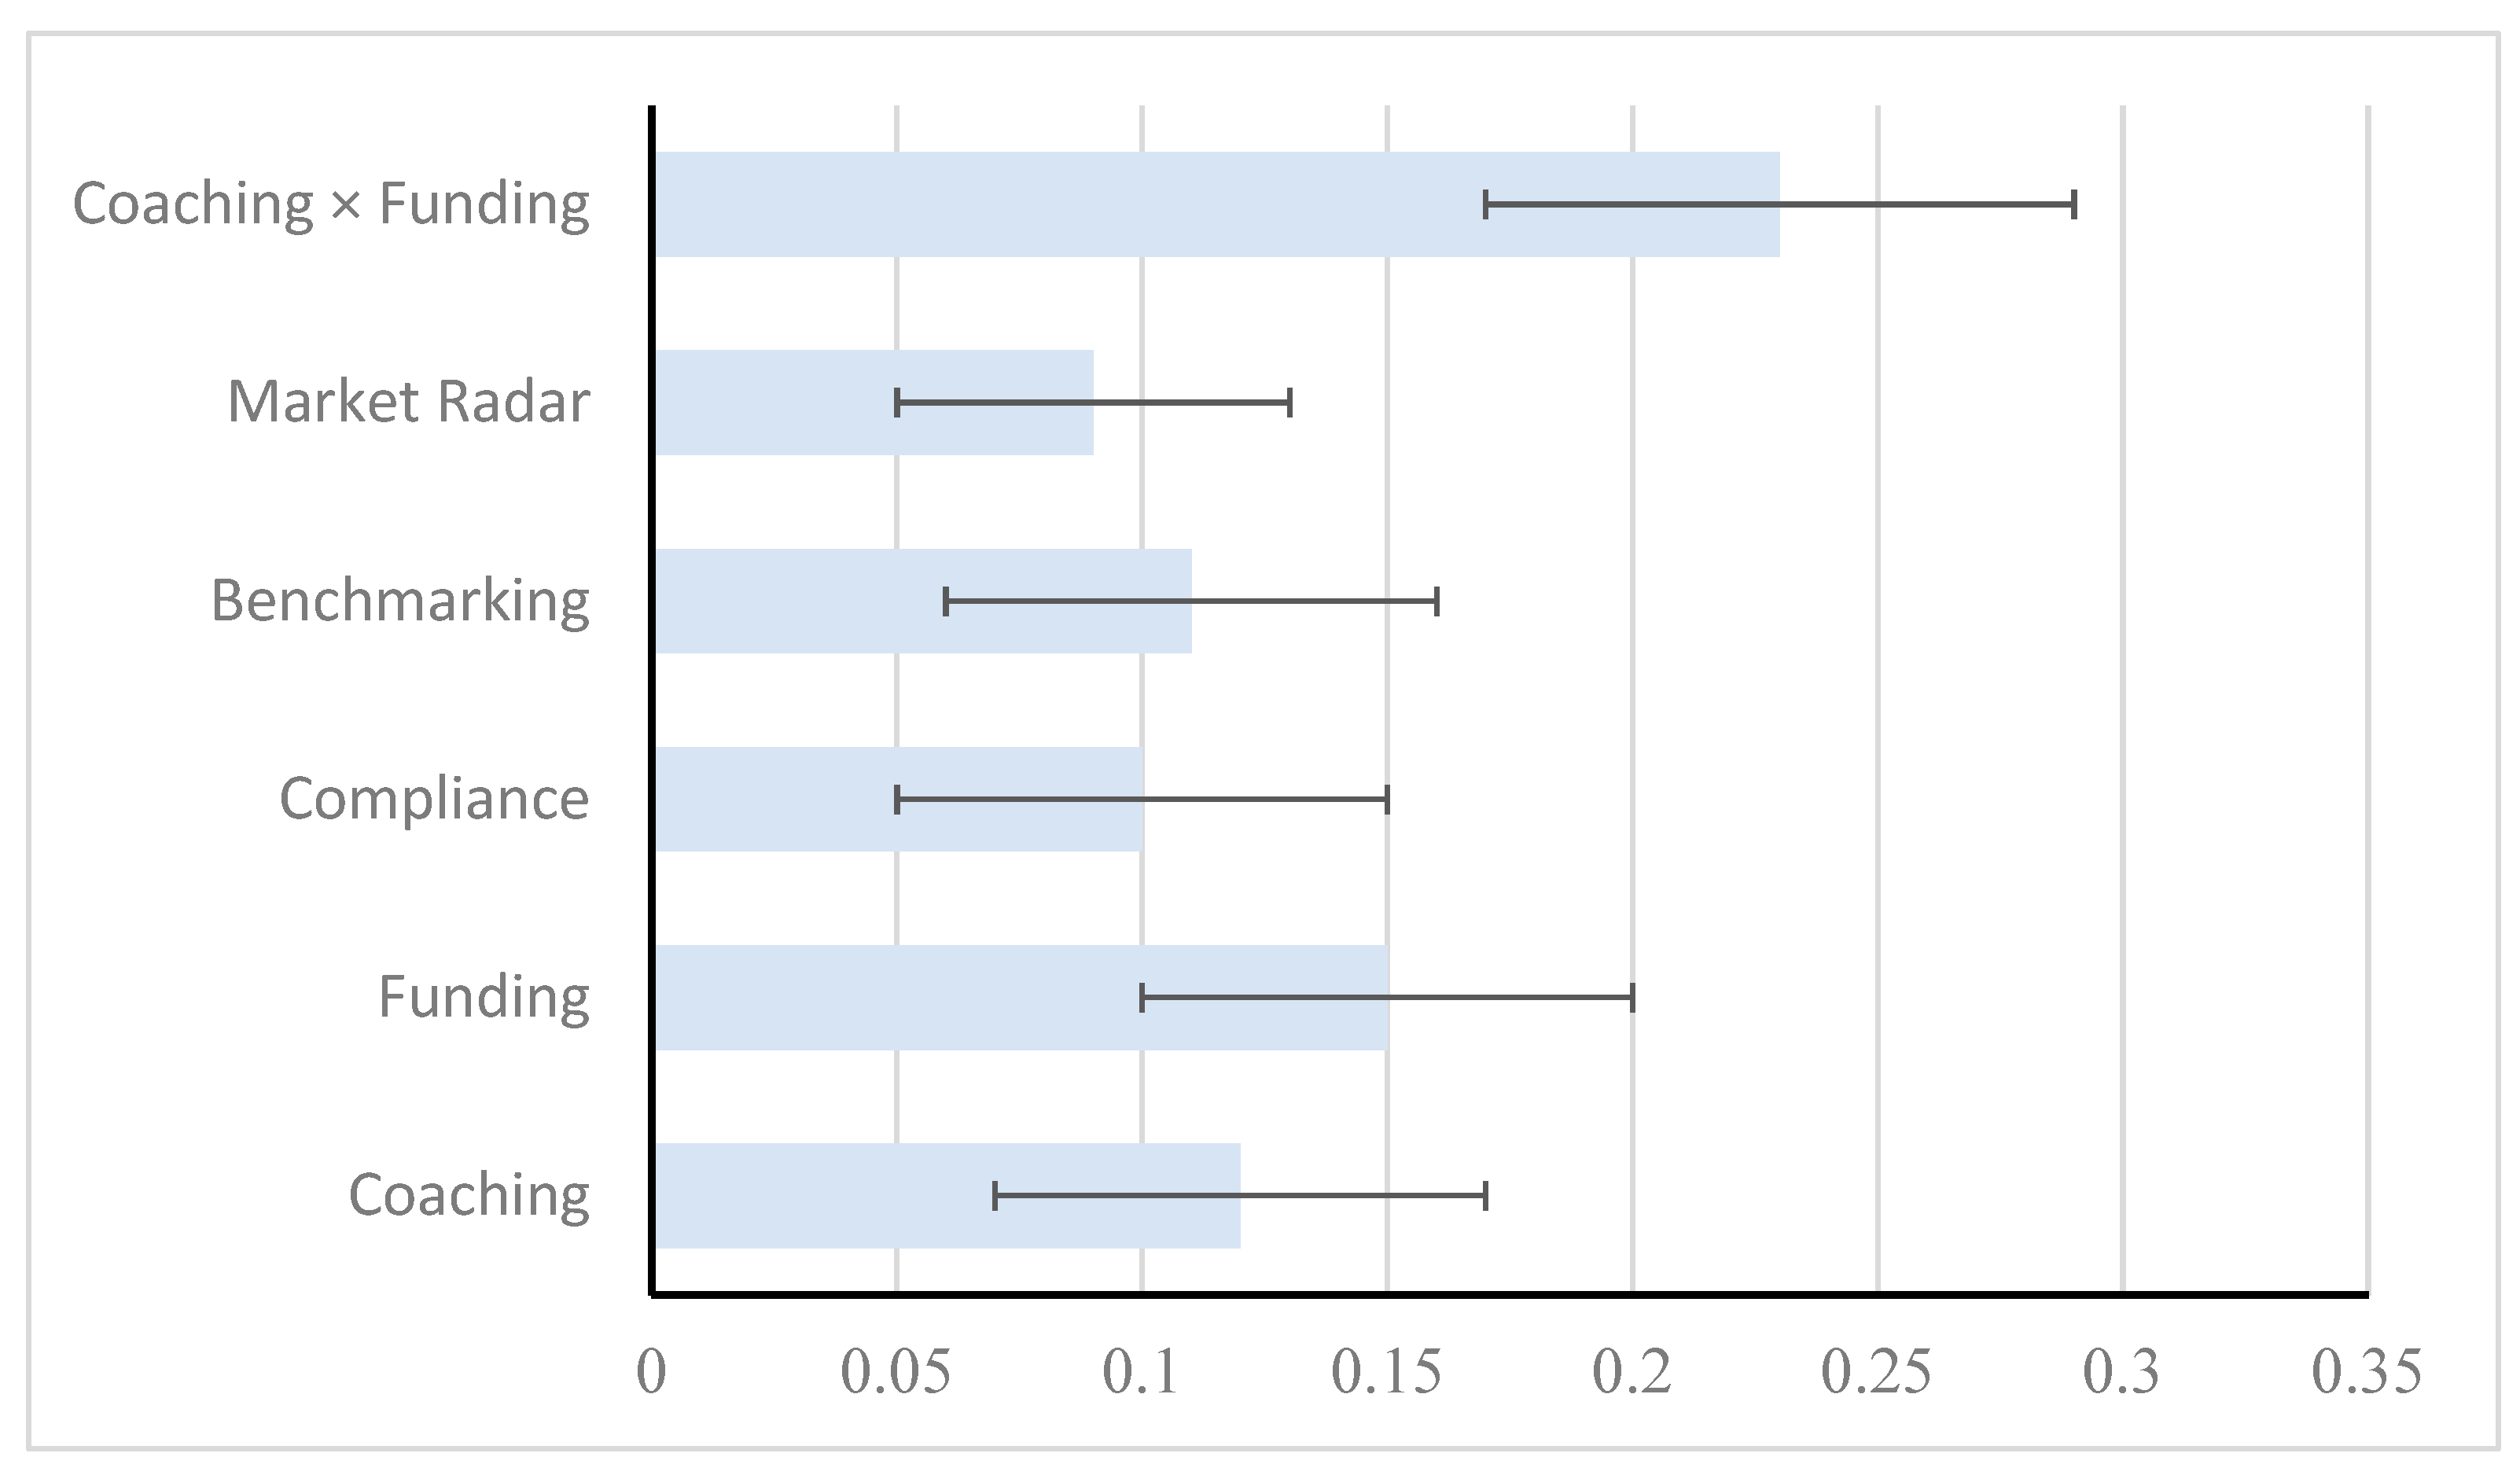
Figure 4.
Integrated Evidence Map Linking Quantitative Regression Findings with Qualitative Themes.
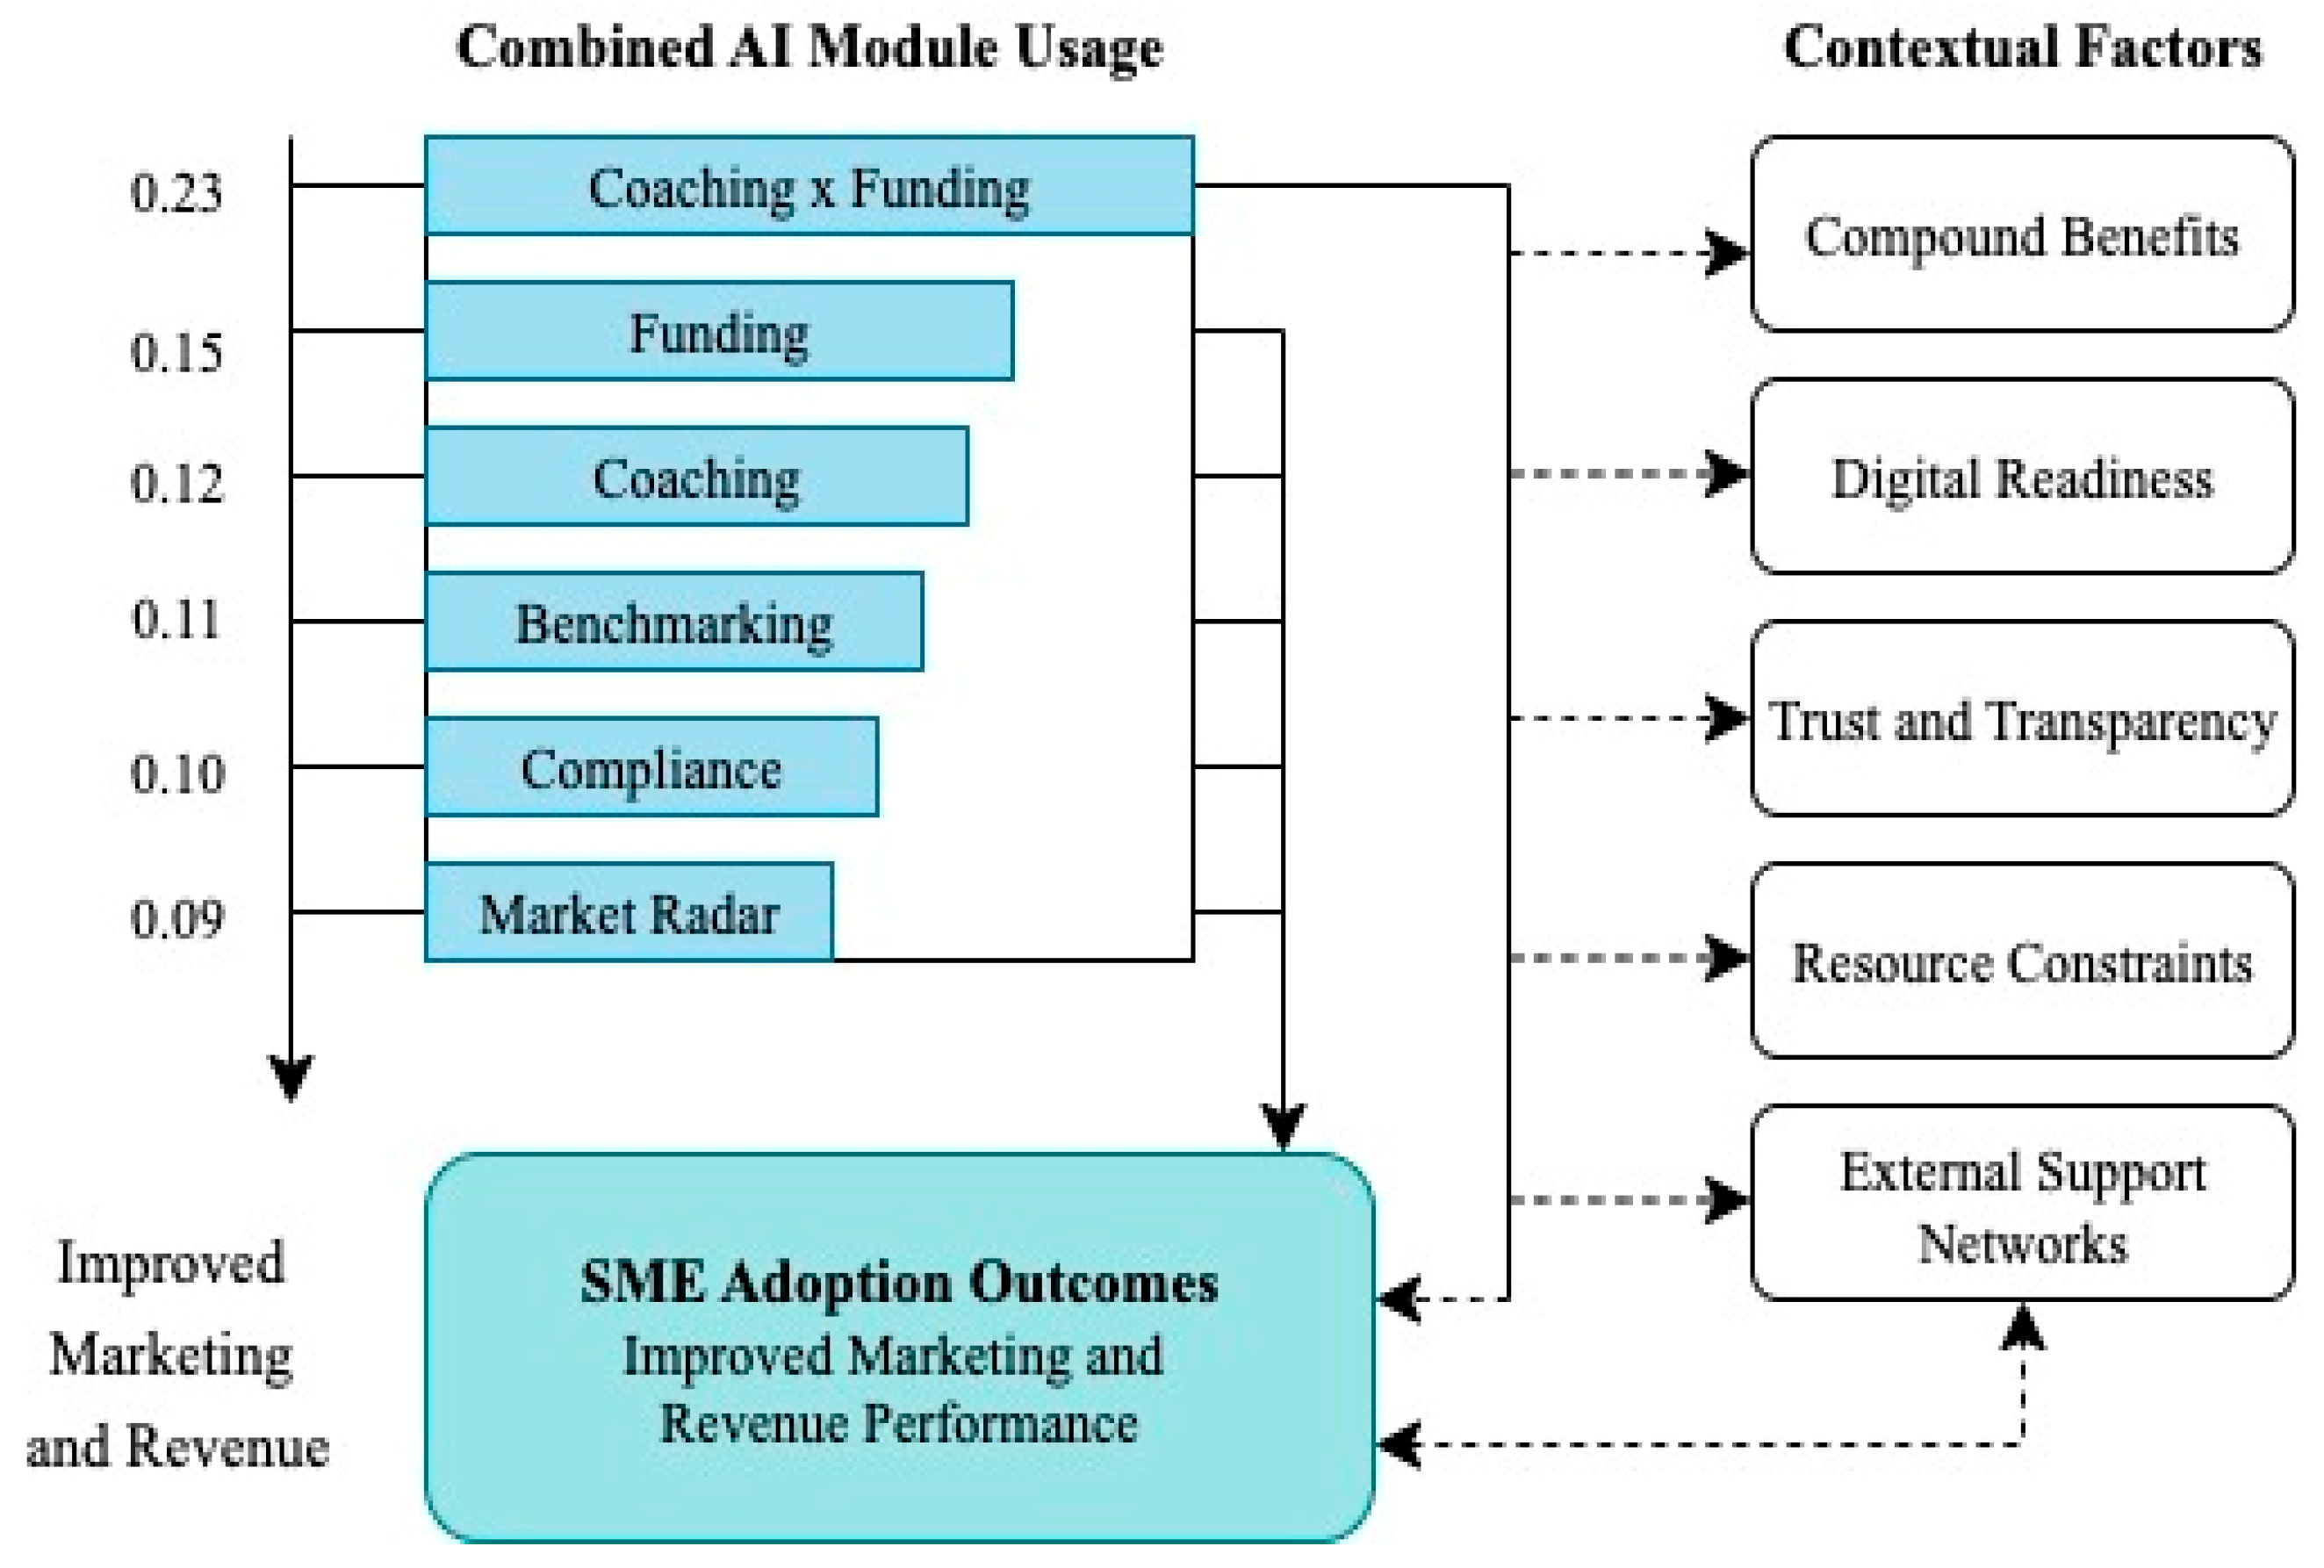
Figure 5.
Quantitative Survey Summary.
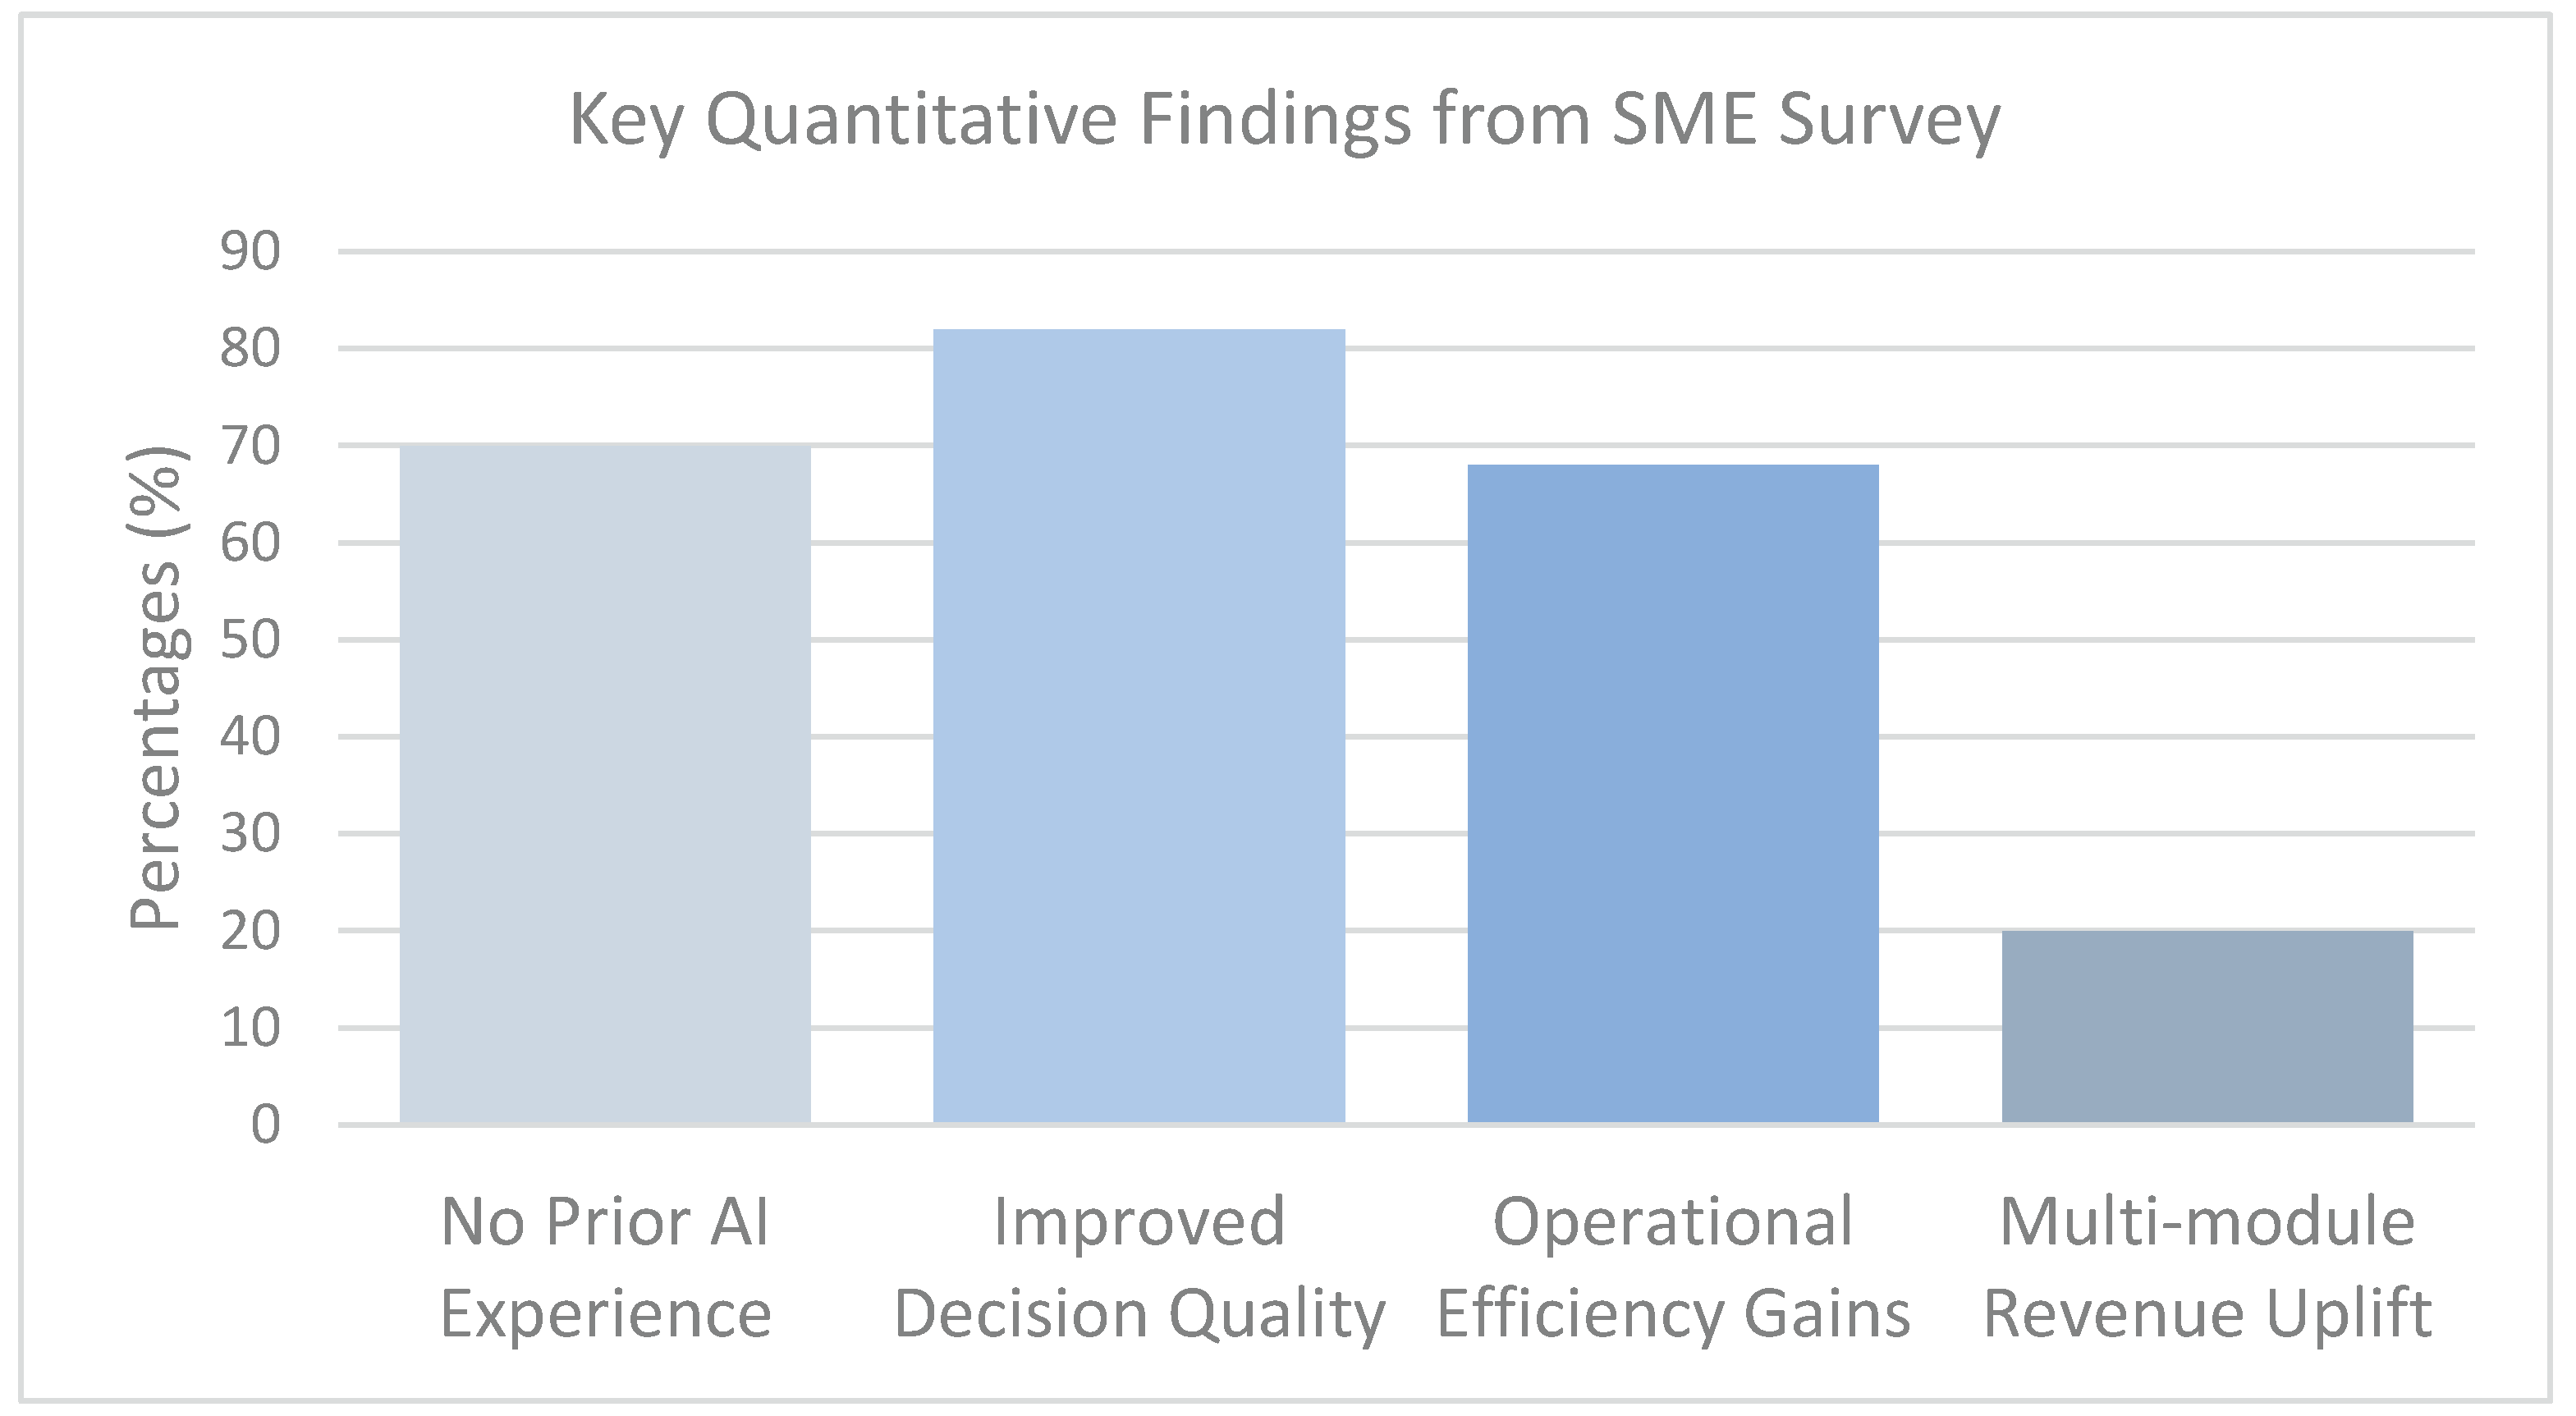
Table 1.
Survey Constructs and Items.
| Construct | Items |
|---|---|
| Perceived Utility (PU) | PU1: The coaching module helped clarify our goals.PU2: The Funding Readiness score matched what investors expected. |
| Adoption Intention (AI) | AI1: I intend to continue using the platform.AI2: I would recommend it to peers. |
| Performance Outcomes (PO) | PO1: Our revenue increased since adopting the platform.PO2: We attracted more customers post-adoption. |
| UTAUT Constructs | PE1: The platform improves productivity.EE1: Learning to use it was straightforward. |
| Demographics | Industry, age of firm, staff size, ownership structure |
Table 2.
Model Comparison Between Baseline and Interaction Models.
| Model | Predictors (k) | R-squared | Adj. R-squared | F (df1, df2) | p-value | AIC | BIC |
|---|---|---|---|---|---|---|---|
| Baseline | 5 | 0.064 | 0.036 | 2.27 (5, 166) | 0.05 | 1109.47 | 1125.20 |
| Interaction | 6 | 0.095 | 0.062 | 2.89 (6, 165) | 0.01 | 1105.68 | 1124.56 |
Table 3.
Themes with illustrative quotes.
| Theme | Quotes |
|---|---|
| Compound Benefits | “Using coaching and funding tools together gave us a 360-view. We wouldn’t have scaled this fast otherwise.” |
| Digital Readiness | “Younger team members adapted quickly; older staff needed help.” |
| Trust and Transparency | “Seeing how others scored made us confident in the AI’s advice.” |
| Resource Constraints | “We don’t have tech staff—plug-and-play saved us.” |
| External Support Networks | “The local incubator helped with onboarding and made it less intimidating.” |
Disclaimer/Publisher’s Note: The statements, opinions and data contained in all publications are solely those of the individual author(s) and contributor(s) and not of MDPI and/or the editor(s). MDPI and/or the editor(s) disclaim responsibility for any injury to people or property resulting from any ideas, methods, instructions or products referred to in the content. |
© 2025 by the authors. Licensee MDPI, Basel, Switzerland. This article is an open access article distributed under the terms and conditions of the Creative Commons Attribution (CC BY) license (http://creativecommons.org/licenses/by/4.0/).
Copyright: This open access article is published under a Creative Commons CC BY 4.0 license, which permit the free download, distribution, and reuse, provided that the author and preprint are cited in any reuse.


