
Submitted:
01 September 2025
Posted:
02 September 2025
You are already at the latest version
Abstract
Manure is a valuable organic resource for sustainable agriculture, enhancing soil fertility, and is crucial for nutrient cycling; however, it also contributes significantly to methane and nitrous oxide emissions. The European Green Deal and Latvia's National Energy and Climate Plan have set targets for reducing agricultural greenhouse gas (GHG) emissions, including those related to improved manure management. Therefore, this research aims to estimate the future manure production in Latvian agriculture to assess the potential for reducing GHG emissions by 2050. Using the LASAM model developed in Latvia, the number of farm animals, the amount of manure, and the associated GHG emissions were projected for the period until 2050. The calculations used the Intergovernmental Panel on Climate Change (IPCC) methodology and were based on national indicators and current national GHG inventory data to cover the years 2021–2050. The study predicts significant changes in the structure of manure in Latvia by 2050, as the proportion of liquid manure is expected to increase, while the amount of solid and manure deposited by grazing animals is expected to decrease. The results of the GHG emission projection showed that by 2050, total emissions from manure management would decrease by approximately 5%, primarily due to a decline in the number of farm animals and, consequently, a reduction in the amount of manure. In contrast, methane emissions are expected to increase by approximately 5% due to production intensification. The research results emphasise the need to introduce more effective methane emission reduction technologies and improve projection approaches.
Keywords:
manure
; greenhouse gases
; emissions
; farm animals
; projections
1. Introduction
Manure is a versatile organic raw material derived from animal excrement, which is crucial for sustainable farming practices and environmental management. In addition to its traditional use for soil fertilisation, manure contributes significantly to nutrient cycling by improving soil fertility and composition, while reducing the potential environmental risks associated with animal waste [1]. The prudent use of organic fertilisers in combination with mineral fertilisers can be a crucial strategy for improving soil quality, thereby increasing microbial activity and efficient nutrient cycling to produce high-quality crops [2]. Such an integrated approach not only increases agricultural productivity but also suggests a viable solution to environmental problems such as soil degradation and pollution [3,4]. This strategy proposes a more balanced supply of nutrients to plants, thereby eliminating micronutrient deficiencies that synthetic fertilisers often do not provide, as well as increasing the overall efficiency of nutrient use [5]. In addition, the inclusion of organic fertilisers, such as compost and other organic manure, in agricultural systems is increasingly recognised as an opportunity to increase soil fertility and crop yields by improving basic soil properties [6,7]. It increases water retention capacity, improves soil aggregation, and enhances microbial biomass and activity, which is crucial for robust plant growth and effective nutrient cycling. This comprehensive approach also contributes to a significant reduction in the environmental impact of agricultural practices by reducing nutrient run-off and leaching [8].
However, livestock farming is considered to be one of the main contributors to global GHG emissions, and manure management accounts for a significant share of agricultural methane (CH4) and nitrous oxide (N2O) emissions [9]. The emissions primarily originate from the anaerobic decomposition of manure’s organic matter, resulting in CH4, while N2O is mainly produced through nitrification and denitrification [10]. Recent studies by FAO (2023) showed that the livestock industry produced 6.2 gigatonnes (Gt) of carbon dioxide equivalent (CO2 eq) emissions, accounting for approximately 12% of the total anthropogenic GHG emissions, based on 2015 data [11]. Therefore, countries are increasingly performing, verifying, and redoing emission calculations for annual inventory reports and seeking to include more industries in their mandatory emission reduction systems [12]. This is because understanding the nuances of manure management possibilities becomes extremely important for developing effective emission reduction strategies [13]. Different techniques of manure management, from anaerobic processing to composting and direct incorporation of manure into soil, have different potential to reduce or increase GHG emissions [14]. The development and application of effective manure management techniques are therefore essential to reduce these GHG emissions and thus tackle climate change problems [15]. They are based on accurate real situation estimates as well as projections.
Launched in 2019, the European Green Deal is a comprehensive strategy aimed at achieving climate neutrality by 2050, while transforming the European Union (EU) into a modern, resource-efficient, and competitive economy [16]. This ambitious strategy integrates various policies to reduce GHG emissions from all industries [17,18]. This involves transitioning to resource-efficient practices and reducing waste, thereby affecting industries ranging from agriculture to manufacturing [19]. Such policy initiatives require significant changes in agricultural practices, in particular regarding manure management [20]. Collective responsibility for reducing GHG emissions and taking climate action, as required by the Paris Agreement, pertains to the national level, thereby encouraging many countries to develop long-term low-emission strategies [21]. This global action underscores the crucial need for governments to adopt comprehensive strategies that are not only aligned with international and EU objectives but also consider their unique national circumstances and economic structures in their pursuit of decarbonization [22].
Therefore, Latvia, as an EU Member State, has also integrated the overarching goals into its policy documents, developing specific strategies and instruments to achieve emission reduction in various industries [23]. In 2024, the Latvian government approved the updated National Energy and Climate Plan (NECP) 2021-2030. Latvia’s updated NECP 2021-2030 refers to the revised energy and climate targets agreed under the “Fit for 55” package. One of the objectives of the NECP is efficient use of resources and reduction of GHG emissions from agriculture, which envisages special requirements for manure storage and spreading [24]. According to the NECP, the overall target for agriculture is to reduce GHG emissions to 2176.33 kt (kilotonnes) CO2 eq. in 2030, compared with the real level of 2253.83 kt CO2 eq. in 2022 (expected decrease of 3.4%) [24]. Livestock emissions in 2022 accounted for almost half (49.8%) of the total [25], with manure management contributing to a portion of these emissions. Additionally, the use of manure is also linked to a portion of GHG emissions from crop production. Therefore, it is essential to project GHG emissions from manure management for the future (by 2050) to assess the possibilities for reducing them. Therefore, this research aims to estimate the future manure production in Latvian agriculture to assess the potential for reducing GHG emissions by 2050.
Overall, such a research study is crucial for contributing to the development of data-driven policy documents that promote sustainable, environmentally friendly, and climate-neutral agriculture, thereby ensuring food security in the future while striking a balance between economic growth and environmental protection. Assessing the actual situation and obtaining projected data on the amount of manure enables the design of more effective strategies for managing sustainable agriculture, reducing resource waste, and increasing crop productivity, as well as evaluating the potential reduction of greenhouse gas emissions from manure management. It can help policymakers to design appropriate and targeted support policies, while farmers can opt for environmentally friendly agricultural practices. Additionally, emission control and resource efficiency can reduce costs for farmers and create economic benefits.
The present research is structured into five sections. Section 2 describes the research methods, as well as the data and materials used for calculations and projections of manure production and GHG emissions. Section 3 summarizes the calculation results, comprehensively analysing the data on manure production in Latvia and the projection made using the LASAM model (Latvian Agricultural Sector Analysis Model). The data on the projected total amount of manure in agriculture were used to estimate future GHG emissions from manure management. Section 4 represents a discussion of the main research results based on the scientific literature and an analysis of empirical research studies. Section 5 summarises the main conclusions and future research priorities.
The main research limitations of the present study are that it did not examine the techniques of manure storage and spreading, nor did it assess the associated technical and environmental measures/limitations, nor did it evaluate the methods and technologies for reducing potential GHG emissions. Additionally, it did not estimate GHG emissions at the various stages of manure production and management.
2. Materials and Methods
The present research employed the LASAM model developed in Latvia for projecting the agricultural sector until 2050 [26], to simulate the number of farm animals, the amount of manure, and GHG emissions therefrom until 2050. It should be noted that the LASAM model is updated annually, based on the most up-to-date information [25]. This enables both policymakers and stakeholders to access the most up-to-date historical data on the development of agricultural sectors and to project their long-term development (until 2050) [26]. To ensure the comparability of the results obtained, GHG emission calculation by LASAM follows Latvia’s National Inventory Reports (NIR) under the UNFCCC Greenhouse Gas Emissions in Latvia from 1990 to 2022 (2024) [27], which conforms to the 2006 IPCC Guidelines for National Greenhouse Gas Inventories (IPCC Guidelines) [28]. As noted by Makuteniene et al. (2022), researchers often identify and analyse factors in GHG emissions and their evolution, including those related to agriculture [29]. To make projections about GHG emissions, the authors used the methodology prescribed by the IPCC Guidelines (2006), nationally developed indicators following Republic of Latvia Cabinet Regulation No. 834 (2014) Requirements Regarding the Protection of Water, Soil and Air from Pollution Caused by Agricultural Activity [30] and Latvia’s NIR (2024) [27], as well as the following research studies conducted in Latvia: Developing a Calculation Methodology for GHG Emissions from the Agricultural Sector and a Simulation Tool for Data Analysis with Climate Change Integrated (2014) [31] and Projecting Agricultural Development and Developing Policy Scenarios for the Period until 2050 (2024) [25].
The research period was 2021-2050, which consisted of two stages: the real situation from 2021 to 2023 (GHG emissions in 2021-2022) and projections of potential development for 2025-2050.
2.1. Manure Production and Management
First, the present research categorised each type of livestock by farming system: grazing and non-grazing. Next, the types of livestock were categorised by manure management system: solid manure and liquid manure (dairy cows and pigs), as well as manure with litter and manure without litter (laying hens). For farm animals that are grazed, the research identified the proportion of manure left on pasture. The manure management systems applied to various types of farm animals, including the assumption set in the LASAM model regarding livestock manure management, are presented in Table 1.
It was assumed that for dairy cows, the transition from a solid manure system to a liquid manure system would occur for a herd of 80 or more cows, while for pigs, it would occur with at least 500. In 2023, according to the assumptions and statistical data on livestock, solid manure was produced by 47.3% of dairy cows and 3.9% pigs, while for laying hens, it was assumed to be 10%. A projection of the proportion of dairy cows producing solid manure was made based on the target equation (assuming that in 2050, the proportion will be 20%). Similarly, the proportion of pigs producing litter manure was considered to be below 1% in 2050, and 5% for laying hens.
For livestock that are grazed, a breakdown of stored manure (solid manure) and manure deposited on pasture was made using the pasture use rate (it considered the possibilities and practices of pasture in the climatic conditions of Latvia), which was 18.8% for dairy cows, their calves and young cattle (i.e., 18.8% of the total time cows spend on pasture, thereby producing fresh manure). The pasture use rate for beef cattle, their calves, and young cattle was assumed to be 86.1%, 49.9% for sheep, 14.6% for goats, 52.1% for horses, 32.9% for laying hens and turkeys, and 35.6% for ducks and geese [31].
Projections of manure in agriculture are based on projected livestock numbers [32]. For dairy cows, the production of manure per cow is estimated based on changes in milk yield. For other types of livestock, the production of manure is assumed to be constant per animal.
2.2. Calculation of Greenhouse Gas Emissions from Manure Management
The agricultural sector produces emissions of CH4, N2O, and CO2. The following emissions are associated with manure management:
1) CH4 emissions from manure management;
2) direct and indirect N2O emissions from manure management;
3) direct and indirect N2O emissions from livestock grazing;
4) direct and indirect N2O emissions from manure use (incorporation into soil).
According to the IPCC methodology, CH4 and N2O emissions from manure management (the first two categories) are included in emissions from livestock and manure management. Therefore, most research studies and national inventory reports on GHG emissions from manure focus only on CH4 and N2O emissions from manure management; however, the present research estimated total emissions, including those from soil management (the last two categories), providing a broader and more accurate assessment.
To calculate CH4 emissions from manure management, emission factors for each farm animal category (EF(T)) were obtained from Latvia’s NIR (2024) [27], which, for all farm animals except dairy cows, other cattle, and swine, were based on the 2006 IPCC Guidelines (Table 10.15 and 10.16, cool climate) [28]. EFs for dairy cows, other cattle, and swine are calculated annually by Latvia’s NIR (2024) report compilers [27]. To estimate N2O emissions, the annual amount of excreted N by each farm animal category (Nex(T)) was also derived from Latvia’s NIR (2024) [27], with values for dairy cows, other cattle, and swine also being calculated annually. See Table 2 for the emission factors and N excreted per farm animal.
To calculate N2O emissions, it is also necessary to identify the share of the manure management system (Table 3) that was used for the calculation of real GHG amounts in 2022, while the calculations made by the authors on the breakdown of manure types were used for projections, based on the assumptions presented in Table 1 and assuming a fixed share for anaerobic digestion
CH4 emissions from manure management in the country are calculated by multiplying the emission factor (EF(T)) kg per year per animal (Table 2) for each livestock category T by the number of farm animals (N(T)) of the corresponding category (T) according to Equation 1.
where: CH4manure - CH4 emissions from manure management in the country, kg of CH4 per year; EF(T) – a CH4 emission factor for a livestock category (T), kg of CH4 per animal per year; N(T) – the number of farm animals of the corresponding category in the country; T – the category of farm animals. The emissions are added up for all categories of livestock.
To calculate direct N2O emissions from manure management, an emission factor (EF3(S)) for the manure production and storage system was selected based on the IPCC Guidelines (2006). For example, for liquid manure and solid litter manure, it was 0.005 [28]. N2O emissions were calculated based on the number of animals (current or projected), the share of manure management systems (Table 3), and the amount of N excreted by farm animals (Table 2) (Equation 2).
where: N2OMM – direct N2O emissions from manure management in the country, kg of N2O per year; N(T) – the number of farm animals of the corresponding category (T) in the country; Nex(T) – the amount of N excreted per head of farm animal of the corresponding category (T), kg of N per animal per year; MS(T, S) – the share of total annual N excretion of farm animals of the corresponding category (T) stored in a manure management system (S); EF3(S) – emission factor for direct N2O emissions from a manure management system (S), kg of N2O-N per kg of N in the manure management system; S – the manure management system; T – the category of farm animals; 44/28 – the conversion factor to convert N2O-N emissions into N2O emissions. The emissions were totaled for all categories of livestock across all manure management systems (S).
Indirect N2O emissions from manure management arise from: (1) volatilisation of nitrogen, which later enters soil and water from the atmospheric deposition, and (2) nitrogen leaching and run-off.
To calculate nitrogen emissions due to volatilisation, first of all, the loss of nitrogen (12-55%) (FracGasMS) from storage in each of the manure management systems for a particular category of livestock, which volatilises as ammonia (NH3) and nitrogen oxides (NOx) is calculated, then multiplied by an emission factor of 0.01 (EF4). The fractions of nitrogen lost in the atmosphere are estimated based on data from the IPCC Guidelines (2006) (Table 10.22) [28] (Equation 3).
where: N2O(ATD,MM) – indirect N2O emissions from manure management due to volatilisation of N from manure management, kg of N2O per year; N(T) – the number of farm animals of the corresponding category (T) in the country (current or projected); Nex(T) – the amount of N excreted per head of farm animals of the corresponding category (T), kg of N per animal per year; MS(T,S) – the share of total annual N excretion of farm animals of the corresponding category (T) stored in a manure management system (S); FracGasMS – the share of N volatilised from manure management system S as NH3 and NOx, %, for livestock category T; S – a manure management system; T – a category of farm animals; EF4 – emission factor for indirect N2O emissions from atmospheric deposition of N on soil and water surface, kg of N2O-N per kg of volatilised NH3–N + NOx–N; 44/28 – a conversion factor to convert N2O-N emissions into N2O emissions. The emissions are then totalled for all categories of livestock (T) across all manure management systems (S).
Similarly, to calculate emissions from leaching and run-off, first of all the research calculated the loss of nitrogen stored in the management systems of solid manure (5%) and liquid manure (1%) (national values identified by Latvian experts) [27,31] due to leaching and run-off, and then multiplied it by an emission factor of 0.0075 (EF5) [28] (Equation 4).
where: N2O(L, MM) – indirect N2O emissions from N leaching and run-off from manure management in the country, kg of N2O per year; N(T) – the number of farm animals of the corresponding category (T) in the country (current or projected); Nex(T) – the amount of N excreted per head of farm animal of the corresponding category (T), kg of N per animal per year; MS(T, S) – the share of total annual N excretion of farm animals of the corresponding category (T) stored in a manure management system (S); FracLeachMS – the loss of N from leaching and run-off for a category of livestock (T) for a manure management system (S), %; S – a manure management system; T – a category of farm animals; EF5 – emission factor for indirect N2O emission from N leaching and run-off, kg of N2O-N per kg of leached N; 44/28 – a conversion factor to convert N2O-N emissions into N2O emissions. The emissions were then totaled for all categories of livestock (T) across all manure management systems (S).
Direct N2O emissions from farm animal grazing are calculated using data on the annual amounts of nitrogen excreted by farm animals (Table 2), the number of farm animals (current or projected), the share of pasture (Table 3) and the emission factor (EF3), which was assumed to be 0.02 for cattle (dairy and other), birds and pigs, and 0.01 [28] for the other categories of farm animals (Equation 5).
where: N2O(PRP) – direct N2O emissions from urine and dung deposited on pasture in the country, kg of N2O per year; Nex(T) – the amount of N excreted per head of farm animal of the corresponding category (T), kg of N per animal per year; MS (PRP) – the share of total annual N excretion of farm animal category (T) deposited on pasture (CPP applies to cattle, poultry and pigs, SO to other livestock); EF3 (PRP) – emission factor for direct N2O emission from urine and dung deposited on pasture, kg of N2O-N per kg N; T – a category of farm animals; 44/28 – a conversion factor to convert N2O-N emissions into N2O emissions. The emissions were then totalled for all categories of livestock (T).
Indirect N2O emissions from farm animal grazing consist of: (1) N2O emissions from nitrogen volatilisation, which subsequently enter soil and water from the atmospheric deposition, and (2) N2O emissions from nitrogen leaching and run-off.
To identify emissions from volatilisation, first of all, the loss of nitrogen from pasture fresh manure, which volatilises as NH3 and NOx, was calculated and then multiplied by an emission factor of 0.01 (EF4) [28]. Volatilisation loss for organic fertilisers was assumed to be 20% (FracGasM) [28] (Equation 6).
where: N2O(ATD, PRP) – indirect N2O emissions from farm animal grazing due to N volatilisation in the country, kg of N2O per year; Nex(T) – the amount of N excreted per head of farm animal of the corresponding category (T), kg of N per animal per year; MS(PRP, T) – the share of total annual N excretion of farm animals of the corresponding category (T) deposited on pasture; FracGasM – the share of N from urine and dung deposited on pasture, which volatilises as NH3-N and NOx-N; EF4 – emission factor for indirect N2O emission from atmospheric deposition of N on soil and water surfaces, kg of N2O-N per kg of volatilised NH3-N and NOx-N; 44/28 – a conversion factor to convert N2O-N emissions to N2O emissions.
To calculate emissions from nitrogen leaching and run-off, first of all, the research identified the loss of N based on national data from the NIR (2024) (23% - FracLEACH-(H)) [27], as well as the share of manure deposited on pasture, which were then multiplied by an emission factor of 0.0075 (EF5) [28] (Equation 7).
where: N2O(L, PRP) – indirect N2O emissions from N leaching and run-off from manure deposited on pasture in the country, kg of N2O per year; Nex(T) - the amount of N excreted per head of farm animal of the corresponding category (T), kg of N per animal per year; MS(PRP, T) – the share of total annual N excretion of farm animals of the corresponding category (T) deposited on pasture; FracLEACH-(H) – the share of leached N from urine and dung deposited on pasture; EF5 - emission factor for indirect N2O emissions from N leaching and run-off, kg of N2O-N per kg of leached N; 44/28 – a conversion factor to convert N2O-N emissions into N2O emissions.
Direct N2O emissions from manure applied to soil. First, the research calculated the total amount of manure available for incorporation into soil. The calculation included the number of farm animals (current and projected), the share of the manure management system (pasture excluded) (Table 3), the amount of nitrogen excreted by farm animals (Table 2) and the total nitrogen loss for each of the management systems (FracLossMS), based on the data from the IPCC Guidelines (2006), Table 10.23, as well as an emission factor of 0.01 (EF1) [28] (Equations 8, 9).
where: N2O(AM) – direct N2O emissions from manure application to soil, kg of N2O per year; N(MMS Avb) – the total amount of N available for application to soil in the country, kg N per year; N(T) – the number of farm animals of the corresponding category (T) in the country; Nex(T) – the amount of N excreted per head of farm animal of the corresponding category (T), kg of N per animal per year; MS(T,S) – the share of total annual N excretion of farm animals of the corresponding category (T) stored in a manure management system (S); FracLossMS – the loss of N from the excrements of farm animals of the corresponding category for a manure management system (S), %; EF1 – emission factor for direct N2O emissions from N incorporation into soil, kg of N2O-N per kg of incorporated N; S – a manure management system; T – a category of farm animals; 44/28 – a conversion factor to convert N2O-N emissions into N2O emissions. The emissions were then totaled for all categories of livestock (T) and for all manure storage systems (S).
Indirect N2O emissions from manure applied to soil consist of: (1) N2O emissions from nitrogen volatilisation, which subsequently enter soil and water from the atmospheric deposition, and (2) N2O emissions from nitrogen leaching and run-off.
To calculate emissions from nitrogen volatilisation, first of all, the research calculated the loss of N from manure incorporation into soil, which volatilises as NH3 and NOx, and multiplied it by an emission factor of 0.01 (EF4). The share of loss for organic fertiliser was assumed to be 20% (FracGasM) [28] (Equation 10).
where: N2O(ATD, AM) – indirect N2O emissions from manure incorporation into soil due to volatilisation in the country, kg of N2O per year; N(MMS Avb) – the total amount of N available for application to soil in the country, kg pf N per year; FracGasM – the share of organic N incorporated into soil, which volatilises as NH3-N and NOx-N; EF4 – emission factor for indirect N2O emission from atmospheric deposition of N on soil and water surfaces, kg of N2O-N per kg of evaporated NH3-N and NOx-N; 44/28 – a conversion factor to convert N2O-N emissions to N2O emissions.
To determine emissions from nitrogen leaching and run-off, the research calculated the loss of N (23% - FracLEACH-(H)) from manure incorporation into soil due to leaching and run-off and multiplied it by an emission factor of 0.0075 (EF5) [28] (Equation 11).
where: N2O(L, AM) – indirect N2O emissions from manure incorporation into soil due to N leaching and run-off in the country, kg of N2O per year; N(MMSAvb) - the total amount of N available for application to soil in the country, kg of N per year; FracLEACH-(H) - the share of leached N from manure incorporated into soil; EF5 – emission factor for indirect N2O emissions from N leaching and run-off, kg of N2O–N per kg of leached N; 44/28 – a conversion factor to convert N2O-N emissions into N2O emissions.
CH4 emissions were converted to CO2 equivalent emissions by a factor of 28. N2O emissions were converted to CO2 equivalent emissions (Equations 2-11) by a factor of 265 [28].
2.3. Projections of Manure Production and Greenhouse Gas Emissions by 2050
The projections of GHG emissions were derived from the above equations based on the projected number of farm animals [32], manure breakdown projections, as well as the GHG emission factors and indicators set for 2022, as used in the NIR [25].
An exception was dairy cows, for which N excreted per cow, and an emission factor for CH4 emissions from manure management were projected depending on changes in milk yields.
Future CH4 emission factor values for dairy cows were calculated based on a previously made milk yield projection [32]. The projection of the factor for CH4 emissions from manure management was made based on a regression equation that considered the relationship between the emission factor and milk yield (Equation 12).
ef_efCH4_cowmi_reg<-LM(ef_efCH4_cowmi~cowmi_yield)
where ef_mmCH4_cowmi is a factor for CH4 emissions from manure management for dairy cows; cowmi_yield – a milk yield.
The calculated intercept of the regression equation was -1.6940811, with a coefficient of 0.0028611, and a p-value of 0.000.
Future emission factor values were calculated based on a previously made milk yield projection [32].
Similarly, a projection of N excretion per dairy cow was made based on the regression equation, which included the relationship between nitrogen (N) excretion and milk yield (Equation 13).
ef_mmN_cowmi_reg<-LM(ef_mmN_cowmi~cowmi_yield),
where ef_mmN_cowmi – N excretion per dairy cow; cowmi_yield – a milk yield.
The calculated intercept of the regression equation was 67.21, coefficient 0.00753, p= 0.000.
3. Results
3.1. Manure Production and a Projection Thereof in Agriculture Until 2050 in Latvia
Table 4 presents the results of calculations and projections for the amount of manure produced by livestock during the year, categorised by type: solid manure, liquid manure, and fresh manure left on pasture. It is the amount of manure that is available after storage (excluding the loss incurred during storage in each manure storage system) for incorporation into the soil.
The calculations used a constant output of solid manure, liquid manure, and fresh manure deposited on pasture per animal, depending on the category of farm animals and the type of manure, except for dairy cows, for which the manure output varied from year to year, depending on changes in milk yield. Consequently, changes in the total amount of manure from year to year were affected by the changes in the number of farm animals, milk yields for dairy cows, as well as an increase in the share of liquid manure, which was due to both changes in the way livestock are kept and the fact that liquid manure is heavier than litter manure.
In 2023, the total amount of manure in Latvia reached 4701 thousand tons, and it is projected to increase to 4818 thousand tons by 2050, representing 2%. Cattle produced the most significant amount of manure in Latvia in 2023 – 83% of the total –, while pig farming contributed to 9% of the total. It is projected that by 2050, the production of cattle manure will increase to 84% of the total, whereas that of pig manure is expected to remain unchanged (Table 4). This means that to achieve climate objectives, particular attention should be paid to the two categories of livestock to improve the production, management, and use of manure.
For dairy cows, due to the projected modernisation of production, as the proportion of free-range dairy cows increases, the amount of liquid manure increases, yet the projected amount of solid manure and fresh manure is projected to decrease. In 2050, compared with 2023, the amount of solid manure and fresh manure is projected to decrease by 2.3 times, whereas the amount of liquid manure is projected to increase by 58%.
The rest of the cattle are kept in barns or pasture, and their projected number in 2050 is similar to that in 2023. Therefore, the projected amount of manure also decreases slightly – the amount of solid manure in 2050 is projected to decrease by 5% and raw manure by 11% compared with the level in 2023.
The total number of pigs, according to the projection for 2050, is similar to that in 2023, yet at the same time the process of intensification of agricultural production and the development of large pig farms is expected to continue; therefore, in 2050, solid manure production is projected to decrease almost 8 times, while liquid manure production is projected to decrease by only 4%.
The total number of laying hens in 2050 is also projected to be similar to that in 2023; however, the largest number of hens is kept on large farms with intensive production technology. Therefore, the amount of solid manure and raw manure is projected to decrease (almost 2 times compared with 2023). In contrast, the amount of manure without litter is projected to increase (by 7% compared with 2023). The number of broilers is projected to stabilise at the 2023 level; thus, the amount of manure produced remains similar. For other poultry, litter manure production is projected to increase by 33%, while raw manure production is projected to increase by 50% in 2050 compared with the 2023 level.
3.2. Amounts of Greenhouse Gases from Manure Management and a Projection Thereof for 2050 for Latvia
The calculation of GHG emissions from manure management for 2021-2022 was performed, and a projection thereof until 2050 (Table 5) was made using the methodology described in the Materials and Methods section, as well as the current and projected numbers of livestock [32] and the current and projected amount of manure (Sub-section 3.1).
Table 5 shows the amounts of GHG emissions from manure management in Latvia. In 2022, they accounted for 14.9% of total GHG emissions. It is projected that, by 2050, the total amount of GHG emissions from agriculture will increase by 2%, thereby failing to meet the 3.4% reduction target set by the NECP. However, the amount of GHG emissions from manure management will be reduced by 18 thousand tonnes of CO2 eq. or 5%. The primary reasons for the decrease are changes in the composition of cattle manure and a projected 14% decrease in the number of cattle by 2050 compared to 2022. The number of cows in the analysed period is projected to decrease by 17%, yet the milk yield is projected to increase by 33%. The number of sheep is also projected to decrease by 40% and 21% for goats in 2050 compared with 2022 [32]. The projected decrease in the number of grazing livestock also results in the largest decrease in projected direct and indirect N2O emissions from grazing farm animals, by 16% and 17%, respectively, in 2050. Overall, in 2050 compared to 2022, N2O emissions across all positions are projected to decrease, whereas CH4 emissions from manure management are projected to increase by 5 thousand t CO2 eq. or 5%. This indicates the need for more efficient methane abatement technologies, especially for the storage and processing of manure.
Figure 1 shows the projected (for 2050) and current (as of 2022) breakdowns of GHG emissions from manure management in Latvia.
A comparison of GHG emissions from manure management in 2050 and 2022 reveals that the largest changes relate to CH4 emissions from manure management, as their share in the total is expected to increase by four percentage points. This will occur at the expense of some N2O emissions, as direct N2O emissions from animal grazing are projected to decrease by two percentage points, while direct N2O emissions from manure management and direct N2O emissions from manure applied to soil are projected to decrease by one percentage point. Therefore, as GHG emissions from manure management are projected to decline in the future, they can contribute to achieving the targets that are set for countries to reduce their total GHG emissions.
4. Discussion
4.1. The Need to Improve the Production, Use, and Management of Manure
The research found that, considering changes in livestock numbers and farming practices, the amount of manure is projected to remain constant; however, its kinds and percentage breakdown are expected to change. The most significant trends, according to the projections, are as follows: the amount of liquid manure is projected to increase, whereas the amount of solid manure and fresh manure deposited on pasture is projected to decrease, mainly due to the modernization of dairy cow production and changes in livestock production. This transition to liquid manure is largely due to the development of manure management strategies, which increasingly prioritise slurry systems for their efficiency in nutrient recovery and application, despite their impact on greenhouse gas emissions [9]. Furthermore, the modernisation of livestock farms, especially dairy farms, often involves a shift from solid manure production and storage to liquid manure systems to rationalise farm operations and promote nutrient processing [33]. The transition to liquid fertiliser management is also aligned with efforts to increase feed efficiency and integrate sustainable practices, e.g., anaerobic digestion, reducing GHG emissions, and improving the use of nutrients in agriculture [34]. However, it should be realised that an increase in the production of liquid manure also creates problems associated with its storage, transport, and potential leaching of nutrients into water bodies. Therefore, advanced techniques for manure management are needed to reduce environmental risks [35]. A solution would be to introduce advanced techniques of valorising manure, e.g., anaerobic decomposition, to convert livestock waste into valuable resources while reducing GHG emissions [36]. The production of digestate, which represents a high-quality organic fertiliser, contributes to circular economy principles in agriculture [37].
It is worth noting that international research studies have shown that cattle could become the primary source of nitrogen emissions in the future, thereby underscoring the need for modern manure management strategies to achieve climate objectives [38]. This is particularly important given that the continuous expansion of livestock farming produces a significant amount of livestock manure, which, if mismanaged, can cause serious environmental and economic problems [39]. Therefore, effective manure management practices are also relevant, which could significantly reduce GHG emissions [40]. Comprehensive life cycle assessments are therefore necessary to accurately identify the environmental benefits of various manure management strategies and ensure their effectiveness in reducing the total carbon footprint of livestock activities [41]. Such assessments should consider the complexity of nitrogen conversion under various manure systems, taking into account factors such as temperature, humidity, and microbial activity. Given the low efficiency of N absorption by ruminants, unabsorbed N is inevitably excreted through excrement and urine; therefore, appropriate and advanced waste management techniques beyond traditional ones are also needed to reduce environmental impacts [42]. It is therefore necessary to continue research into the effectiveness of N absorption in animal feed to reduce excretion, as well as on innovative manure processing technologies that can turn livestock waste into valuable organic fertilisers despite potential greenhouse gas emissions [39,43].
4.2. Potential Reduction of GHG Emissions from Manure Management
The authors found that by 2050, compared with 2022 in Latvia, the total amount of emissions from manure management would decrease by 5% owing to the projected decrease in the number of cattle, while increasing the milk yield of cows by 33%. The trends are expected to reduce the amount of direct and indirect N₂O emissions from grazing livestock until 2050. Other researchers also acknowledge that the introduction of optimised fertilisation regimes would improve pasture management, which contributes to a significant reduction in N₂O emissions [38]. Romera et al. (2016) found that direct N₂O emissions from nitrogen deposition with animal excrement and indirect N₂O emissions from nitrogen leaching and volatilisation are projected to decrease by 16% and 17%, respectively, by the middle of the 21st century [44]. This projected decrease is significant given that N₂O is a potent greenhouse gas that contributes significantly to global warming [45]. Furthermore, agricultural activities, particularly livestock farming, are recognised as the main contributors to atmospheric N₂O concentrations [46]. In addition, soil compaction, which is common in pastures, alters the physical composition of the soil, thereby affecting N₂O emissions, as well as gas diffusion and microbial activity [47]. Therefore, a limited density of livestock on pasture could prevent overgrazing and soil degradation [48]. Various pasture management strategies, such as rotational grazing versus continuous grazing, affect soil N dynamics and subsequent N₂O discharge. In addition, it is essential to identify the particular drivers of N₂O emissions from pasture systems [45] for the development of accurate emission reduction strategies.
In the authors’ opinion, CH₄ emissions from manure management are expected to increase by 5% by 2050. This is because it is projected in relation to milk yield; however, in general, it may be the case. The methane conversion factor for liquid manure is 10%, but for solid manure, it is 2%, and the proportion of liquid manure is increasing. It should be recognised that the increasing levels of CH₄ associated with manure management practices cause significant environmental problems, mainly global warming [49]. The growing global food consumption also increases emissions, thereby stressing the need for sustainable manure management practices to reduce the climate impact of the agricultural sector [50,52]. Recognising the critical role of CH₄ in climate change, especially from sources such as manure, requires a deeper understanding of emission sources and effective emission reduction technologies [52]. The complexity of emission sources requires innovative approaches to manure management, focusing on optimising anaerobic processing and improving the conversion of waste into energy to capture methane before it is released into the atmosphere. Furthermore, the development and widespread deployment of advanced manure treatment technologies give additional opportunities for reducing environmental pollution and increasing resource efficiency in agricultural activities [53]. However, some scientists admit that methane emissions from solid manure can be reduced to almost zero by fermenting manure in biogas plants, which would have a positive externality in generating renewable energy, and this is consistent with the principles of organic farming. The potential to reduce N2O emissions is limited for most animals worldwide [54].
Given that the agricultural sector is a significant contributor to greenhouse gas emissions, particularly CH4 and N2O, accurate manure projections are crucial for developing effective emission reduction strategies and achieving national climate objectives [46]. It is therefore necessary to continue researching ways to improve the production, management, and utilisation of manure to reduce all types of GHG emissions in the future. It is also necessary to review projection models and the methodology. It is needed to incorporate the results of national research into the preparation of the inventory reports. For the ever-increasing efforts to mitigate climate change to be successful, the efforts should apply a dynamic scientific approach to measuring GHG emissions. The IPCC GHG emission inventory guidelines are crucial for climate change mitigation and a powerful tool for achieving emission reduction targets. To implement this potential, the methodologies should be updated as new information and research studies become available [55].
5. Conclusions
Agriculture is a major contributor to GHG emissions, especially CH₄ and N₂O; therefore, accurate manure projections are important for developing effective emission reduction strategies and achieving climate objectives.
In Latvia, a 2% increase in manure production is projected by 2050 compared with 2023. In 2023, most of the manure was produced by cattle (83%), and this proportion is expected to increase slightly by 2050 (84%), while no change is projected for pig farming (9%). This means that in cattle and pig farming, it is essential to improve technologies for producing, managing, and using manure to achieve climate objectives.
By 2050, compared to 2023 in Latvia, the percentage breakdown of manure is expected to change significantly, as the amounts of litter manure and raw manure are projected to decrease. In contrast, the amount of liquid manure is projected to increase, especially on dairy (by 54%) and pig farms (by 4%). The changes require the adaptation of manure management strategies, with a particular focus on the more efficient use of liquid manure and the reduction of GHG emissions.
The projection of GHG emissions until 2050, based on the data for 2021-2022, and the projections of the number of livestock and the amount of manure, revealed that manure management in Latvia was a significant source of emissions, accounting for 14.9% of the total agricultural GHG emissions in 2022. Although it is projected that by 2050 in Latvia, the total amount of emissions from agriculture will increase by 2%, emissions from manure management will decrease by about 18 thousand tons of CO₂ eq. or 5%. The decrease is mainly due to the expected reduction in the number of herd livestock, including cattle by 14%, dairy cows by 17%, sheep by 40%, and goats by 21%, while cow milk yields are projected to increase by 33%. The trends are expected to have a particular impact on direct and indirect N₂O emissions from grazing livestock, which are expected to decrease by 16% and 17%, respectively, by 2050. However, the projections showed that CH₄ emissions from manure management would increase by about 5 thousand t CO₂ eq. or 5%, which would increase their share in the emission composition by 4 percentage points. These points highlight the need to introduce more efficient methane abatement technologies, especially in manure storage and processing. Therefore, reducing emissions from manure management can make a significant contribution to achieving the national GHG emission targets, yet this requires targeted technological and management solutions. Further research is needed to improve manure management and enhance the projection models used, as well as update the methodology, by applying the latest scientific approaches and adapting them to real-world conditions, for climate change mitigation measures to be effective.
Author Contributions
Conceptualization, A.K. and I.P.; methodology, A.K.; software, A.K.; validation, I.P., I.U., and A.N.; formal analysis, A.K.; investigation, A.K.; resources, I.P.; data curation, A.K.; writing—original draft preparation, I.P.; writing—review and editing, A.K., I.U., A.N.; visualization, A.K. and I.P.; supervision, I.P.; project administration, A.N.; funding acquisition, I.P. All authors have read and agreed to the published version of the manuscript.
Funding
The research was supported by the Ministry of Agriculture of the Republic of Latvia’s project “Forecasting of Agricultural Development and the Designing of Scenarios for Policies until 2050” (S511).
Institutional Review Board Statement
Not applicable.
Data Availability Statement
The data presented in this study are openly available in DataverseLV at https://dv.dataverse.lv/dataset.xhtml?persistentId=doi:10.71782/DATA/DWMW7G (accessed on 20 August 2025).
Acknowledgments
Not applicable.
Conflicts of Interest
The authors declare no conflicts of interest.
Abbreviations
The following abbreviations are used in this manuscript:
| % | Percentage Rate |
| CH4 | Methane |
| CO2 | Carbon dioxide |
| CO2 eq. | Carbon dioxide equivalent |
| EF | Emission factors |
| EU | European Union |
| FAO | Food and Agriculture Organization of the United Nations |
| GHG | Greenhouse Gases |
| Gt | Gigatons |
| IPCC | Intergovernmental Panel on Climate Change |
| Kg | Kilogram |
| Kt | Kilotons |
| LASAM | Latvian Agricultural Sector Analysis Model |
| N | Nitrogen |
| N2O | Nitrous oxide |
| NECP | National Energy and Climate Plan (Latvia) |
| NH3 | Ammonia |
| NIR | Latvia’s National Inventory Report |
| Nox | Nitrous oxide |
| t | Tone |
| Thou. | Thousand |
References
- Giosanu, D.; Bucura, F.; Constantinescu, M.; Zaharioiu, A.; Vîjan, L. E.; Mățăoanu, G. The Nutrient Potential of Organic Manure and its Risk to the Environment. Current Trends in Natural Sciences 2022. 11(21), 153. [CrossRef]
- agadeesha, G. S.; Prakasha, H. C.; Shivakumara, M. N.; Govinda, K.; Yogananda, S. B. Evaluation of Rock Phosphate Enriched Compost on Soil Nutrient Status after Harvest of Finger Millet-Cowpea Cropping Sequence in High Phosphorus Soils of Cauvery Command Area, Karnataka. International Journal of Plant & Soil Science 2021,17. [CrossRef]
- Devianti, D.; Yusmanizar, Y.; Syakur, S.; Munawar, A. A.; Yunus, Y. Organic fertilizer from agricultural waste: determination of phosphorus content using near infrared reflectance. IOP Conference Series Earth and Environmental Science 2021, 644(1), 12002. [CrossRef]
- Arha, A.; Kaushik, R. A.; Lakhawat, S. S.; Bairwa, H. L.; Verma, A. Effect of Integrated Nutrient Management on Growth, Flowering and Yield of Gaillardia. International Journal of Current Microbiology and Applied Sciences 2021,10(1), 3461. [CrossRef]
- Ponmozhi, C. N. I.; Kumar, R.; Baba, Y. A.; Rao, G. M. Effect of Integrated Nutrient Management on Growth and Yield of Maize (Zea mays L.). International Journal of Current Microbiology and Applied Sciences 2019, 8(11), 2675. [CrossRef]
- Kandil, E.; Abdelsalam, N. R.; Mansour, M. A.; Ali, H. M.; Siddiqui, M. H. Potentials of organic manure and potassium forms on maize (Zea mays L.) growth and production. Scientific Reports 2020, 10(1). [CrossRef]
- Hirich, E.H.; Bouizgarne, B.; Zouahri, A.; Ibn Halima, O.; Azim, K. How Does Compost Amendment Affect Stevia Yield and Soil Fertility? Environ. Sci. Proc. 2022, 16, 46. [CrossRef]
- Patel, A. Application of Nano Organic Materials in Agriculture farming and yield analysis for Groundnut crop with comparison to conventional inorganic farming. IOP Conference Series Earth and Environmental Science 2021, 785(1), 12008. [CrossRef]
- Feng, X.; Smith, W.; VanderZaag, A. Dairy manure nutrient recovery reduces greenhouse gas emissions and transportation cost in a modeling study. Frontiers in Animal Science 2023, 4. [CrossRef]
- Philippe, F.-X.; Nicks, B. Review on greenhouse gas emissions from pig houses: Production of carbon dioxide, methane and nitrous oxide by animals and manure. Agriculture Ecosystems & Environment 2014, 199, 10. [Google Scholar] [CrossRef]
- FAO. Pathways towards lower emissions – A global assessment of the greenhouse gas emissions and mitigation options from livestock agrifood systems. 2023, Rome. Available online: https://doi.org/10.4060/cc9029en (accessed on 07 July 2025).
- Moran, D.; Wall, E. Livestock production and greenhouse gas emissions: Defining the problem and specifying solutions. Animal Frontiers 2011, 1(1), 19. [CrossRef]
- Gerber, P.; Fao, R.A. P.; Steinfeld, H.; Henderson, B.; Mottet, A.; Opio, C.; Dijkman, J.; Falcucci, A.; Tempio, G. Tackling climate change through livestock. 2013. Available online: https://agris.fao.org/agris-search/search.do?recordID=XF2016016977 (accessed on 22 July 2025).
- Kreidenweis, U.; Breier, J.; Herrmann, C.; Libra, J. A.; Prochnow, A. Greenhouse gas emissions from broiler manure treatment options are lowest in well-managed biogas production. Journal of Cleaner Production 2020, 280, 124969. [Google Scholar] [CrossRef]
- Lynch, J.; Cain, M.; Frame, D. J.; Pierrehumbert, R. T. Agriculture’s Contribution to Climate Change and Role in Mitigation Is Distinct From Predominantly Fossil CO2-Emitting Sectors. Frontiers in Sustainable Food Systems 2021, 4. [Google Scholar] [CrossRef] [PubMed]
- Brodny, J.; Tutak, M. Analyzing Similarities between the European Union Countries in Terms of the Structure and Volume of Energy Production from Renewable Energy Sources. Energies 2020, 13(4), 913. [CrossRef]
- Krämer, L. Planning for Climate and the Environment: the EU Green Deal. Journal for European Environmental & Planning Law 2020, 17(3), 267. [CrossRef]
- Bellanca, M. What, How and Where: An Assessment of Multi-Level European Climate Mitigation Policies. Research Square 2024. [Google Scholar] [CrossRef]
- Ciot, M. Implementation Perspectives for the European Green Deal in Central and Eastern Europe. Sustainability 2022, 14(7), 3947. [CrossRef]
- Almeida, D. V.; Kolinjivadi, V.; Ferrando, T.; Roy, B.; Herrera, H.; Gonçalves, M. V.; Hecken, G. V. The “Greening” of Empire: The European Green Deal as the EU first agenda. Political Geography 2023, 105, 102925. [Google Scholar] [CrossRef]
- Barrett, J.; Pye, S.; Betts-Davies, S.; Broad, O.; Price, J.; Eyre, N.; Anable, J.; Brand, C.; Bennett, G.; Carr-Whitworth, R.; Garvey, A.; Giesekam, J.; Marsden, G.; Norman, J.; Oreszczyn, T.; Ruyssevelt, P.; Scott, K. Energy demand reduction options for meeting national zero-emission targets in the United Kingdom. Nature Energy 2022, 7(8), 726. [CrossRef]
- Konara, K. M. G. K.; Tokai, A. Evaluating the Energy Metabolic System in Sri Lanka. Journal of Sustainable Development, 2020, 13(4), 235. [CrossRef]
- Kļaviņš, M.; Bruneniece, I.; Bisters, V. Development of national climate and adaptation policy in Latvia. International Journal of Climate Change Strategies and Management 2009, 1(1), 75. [CrossRef]
- Latvia’s National Energy and Climate Plan 2021-2030. 2024, 135 p. Available online: https://commission.europa.eu/document/download/3e07cbed-22c0-4b69-a8e5-887e0c6aa09e_en?filename=LV_FINAL%20UPDATED%20NECP%202021-2030%20%28English%29_0.pdf (accessed on 08 July 2025).
- Research “Forecasting agricultural development and developing policy scenarios until 2050” (in Latvian). LBTU, 2024, 166 p. Available online: https://www.lbtu.lv/sites/default/files/files/projects/S486_Irina_Pilvere_24-00-S0INZ03-000006.pdf (accessed on 12 July 2025).
- Pilvere, I.; Nipers, A.; Krievina, A.; Upite, I.; Kotovs, D. LASAM Model: An Important Tool in the Decision Support System for Policymakers and Farmers. Agriculture 2022, 12, 705. [Google Scholar] [CrossRef]
- Latvia`s National Inventory Report under the UNFCCC “Greenhouse Gas Emissions in Latvia from 1990 to 2022”. Riga, 2024. Available online: https://videscentrs.lvgmc.lv/files/Klimats/SEG_emisiju_un_ETS_monitorings/Zinojums_par_klimatu/SEG_zinojums/2024/ (accessed on 02 July 2025).
- IPCC 2006. 2006 IPCC Guidelines for National Greenhouse Gas Inventories. Prepared by the National. Greenhouse Gas Inventories Programme, Eggleston H.S., Buendia L., Miwa K., Ngara T. and Tanabe K. (eds). Published: IGES, Japan. Available online: https://www.ipcc-nggip.iges.or.jp/public/2006gl/vol1.html (accessed on 07 July 2025).
- Makutėnienė, D.; Perkumienė, D.; Makutėnas, V. Logarithmic Mean Divisia Index Decomposition Based on Kaya Identity of GHG Emissions from Agricultural Sector in Baltic States. Energies 2022, 15, 1195. [Google Scholar] [CrossRef]
- Republic of Latvia Cabinet Regulation, No. 834 Adopted 23 December 2014 Requirements Regarding the Protection of Water, Soil and Air from Pollution Caused by Agricultural Activity. Available online: https://likumi.lv/ta/id/271376-noteikumi-par-udens-un-augsnes-aizsardzibu-no-lauksaimnieciskas-darbibas-izraisita-piesarnojuma-ar-nitratiem (accessed on 14 July 2025).
- Research “Development of a methodology for calculating GHG emissions in the agricultural sector and data analysis with a modeling tool, integrating climate change”, sub-project “Studies of manure management systems in Latvia” (in Latvian). 2014, 141 p. Available online: https://ppdb.mk.gov.lv/wp-content/uploads/2023/06/petijums_VARAM_2017_Lauksaimn_SEG_emisij_aprek_metodolog_un_datu_analiz_ar_model_riku_izstrad_integrej_klim_mainas.pdf (accessed on 30 June 2025).
- Pilvere, I.; Krievina, A.; Upite, I.; Nipers, A. Datasets for Manure Projections in Latvia: Challenges and Potential for Reducing Greenhouse Gas Emissions. 2025, Available online: https://dv.dataverse.lv/dataset.xhtml?persistentId=doi:10.71782/DATA/DWMW7G (accessed on 20 August 2025).
- Shepherd, M. Managing manures in organic farming. Proceedings of the British Society of Animal Science 2003, 240. [Google Scholar] [CrossRef]
- Giamouri, E.; Zisis, F.; Mitsiopoulou, C.; Christodoulou, C.; Pappas, A. C.; Simitzis, P.; Kamilaris, C.; Galliou, F.; Manios, T.; Mavrommatis, A.; Tsiplakou, E. Sustainable Strategies for Greenhouse Gas Emission Reduction in Small Ruminants Farming. Sustainability 2023, 15(5), 4118. [CrossRef]
- Ronga, D.; Mantovi, P.; Pacchioli, M. T.; Pulvirenti, A.; Bigi, F.; Allesina, G.; Pedrazzi, S.; Tava, A.; Prà, A. D. Combined Effects of Dewatering, Composting and Pelleting to Valorize and Delocalize Livestock Manure, Improving Agricultural Sustainability. Agronomy 2020, 10(5), 661. [CrossRef]
- Lee, Y.-R.; Tsai, W. Valorization of Value-Added Resources from the Anaerobic Digestion of Swine-Raising Manure for Circular Economy in Taiwan. Fermentation 2020, 6(3), 81. [CrossRef]
- Meester, S. D.; Demeyer, J.; Velghe, F.; Peene, A.; Langenhove, H. V.; Dewulf, J. The environmental sustainability of anaerobic digestion as a biomass valorization technology. Bioresource Technology 2012, 121, 396. [Google Scholar] [CrossRef] [PubMed]
- Li, L.; Awada, T.; Shi, Y.; Jin, V. L.; Kaiser, M. Global Greenhouse Gas Emissions From Agriculture: Pathways to Sustainable Reductions. Global Change Biology 2024, 31(1). [CrossRef]
- Liu, H.; Huang, Y.; Duan, W.; Qiao, C.; Shen, Q.; Li, R. Microbial community composition turnover and function in the mesophilic phase predetermine chicken manure composting efficiency. Bioresource Technology 2020, 313, 123658. [Google Scholar] [CrossRef] [PubMed]
- Venczel, M. Z.; Powers, S. E. Anaerobic Digestion and Related Best Management Practices: Utilizing Life Cycle Assessment. 2010 Pittsburgh, Pennsylvania, June 20 - June 23, 2010. [CrossRef]
- Woolery, S.; Osei, E.; Yu, M.; Güney, S.; Lovell, A. C.; Jafri, H. The Carbon Footprint of a 5000-Milking-Head Dairy Operation in Central Texas. Agriculture 2023, 13(11), 2109. [CrossRef]
- Nasiru, A.; Ibrahim, M. H.; Ismail, N. Nitrogen losses in ruminant manure management and use of cattle manure vermicast to improve forage quality. International Journal Of Recycling of Organic Waste in Agriculture 2014, 3(2). [CrossRef]
- Wang, Z.; Xu, Y.; Yang, T.; Liu, Y.; Zheng, T.; Zheng, C. Effects of biochar carried microbial agent on compost quality, greenhouse gas emission and bacterial community during sheep manure composting. Biochar 2023, 5(1). [CrossRef]
- Romera, A. J.; Cichota, R.; Beukes, P. C.; Gregorini, P.; Snow, V.; Vogeler, I. Combining Restricted Grazing and Nitrification Inhibitors to Reduce Nitrogen Leaching on New Zealand Dairy Farms. Journal of Environmental Quality 2016, 46(1), 72. [CrossRef]
- Deng, N.; Wang, H.; Hu, S.; Jiao, J. Effects of Afforestation Restoration on Soil Potential N2O Emission and Denitrifying Bacteria After Farmland Abandonment in the Chinese Loess Plateau. Frontiers in Microbiology 2019, 10. [Google Scholar] [CrossRef] [PubMed]
- Hristov, A. N.; Oh, J.-A.; Lee, C.; Meinen, R. J.; Montes, F.; Ott, T.; Firkins, J. L.; Rotz, A.; Dell, C. J.; Adesogan, C.; Yang, W.; Tricárico, J. M.; Kebreab, E.; Waghorn, G. C.; Dijkstra, J.; Oosting, S. J.; Mitigation of greenhouse gas emissions in livestock production - A review of technical options for non-CO2 emissions. 2013,177(177). Available online: https://www.uncclearn.org/sites/default/files/inventory/fao180.pdf (accessed on 14 August 2025).
- Hernandez-Ramirez, G.; Ruser, R.; Kim, D. How does soil compaction alter nitrous oxide fluxes? A meta-analysis. Soil and Tillage Research 2021, 211, 105036. [Google Scholar] [CrossRef]
- Conant, R. T.; Paustian, K. Potential soil carbon sequestration in overgrazed grassland ecosystems. Global Biogeochem. Cycles 2002, 16(4), 1143. [CrossRef]
- Bhat, R.; Infascelli, F. The Path to Sustainable Dairy Industry: Addressing Challenges and Embracing Opportunities. Sustainability 2025, 17(9), 3766. [CrossRef]
- Ivanovich, C.; Sun, T.; Gordon, D. R.; Ocko, I. Future warming from global food consumption. Nature Climate Change 2023, 13(3), 297. [CrossRef]
- Hasukawa, H.; Inoda, Y.; Toritsuka, S.; Sudo, S.; Oura, N.; Sano, T.; Shirato, Y.; Yanai, J. Effect of Paddy-Upland Rotation System on the Net Greenhouse Gas Balance as the Sum of Methane and Nitrous Oxide Emissions and Soil Carbon Storage: A Case in Western Japan. Agriculture 2021, 11(1), 52. [CrossRef]
- Lynch, J.; Cain, M.; Frame, D. J.; Pierrehumbert, R. T. Agriculture’s Contribution to Climate Change and Role in Mitigation Is Distinct From Predominantly Fossil CO2-Emitting Sectors. Frontiers in Sustainable Food Systems 2021, 4. [Google Scholar] [CrossRef] [PubMed]
- Jalal, H.; Sucu, E.; Cavallini, D.; Giammarco, M.; Akram, M. Z.; Karkar, B.; Gao, M.; Pompei, L.; Eduardo, J.; Prasinou, P.; Fusaro, I. Rumen fermentation profile and methane mitigation potential of mango and avocado byproducts as feed ingredients and supplements. Scientific Reports 2025, 15(1). [CrossRef]
- Scialabba N.E.-H.; Müller-Lindenlauf M. Organic agriculture and climate change. Renewable Agriculture and Food Systems 2010, 25(2),158-169. [CrossRef]
- Yona, L.; Cashore, B.; Jackson, R.B.; Ometto, J.; Bradford, M.A. Refining national greenhouse gas inventories. Ambio 2020, 49, 1581–1586. [CrossRef]
Figure 1.
Breakdowns of GHG emissions from manure management in 2022 and a projection for 2050 in Latvia, %.
Figure 1.
Breakdowns of GHG emissions from manure management in 2022 and a projection for 2050 in Latvia, %.
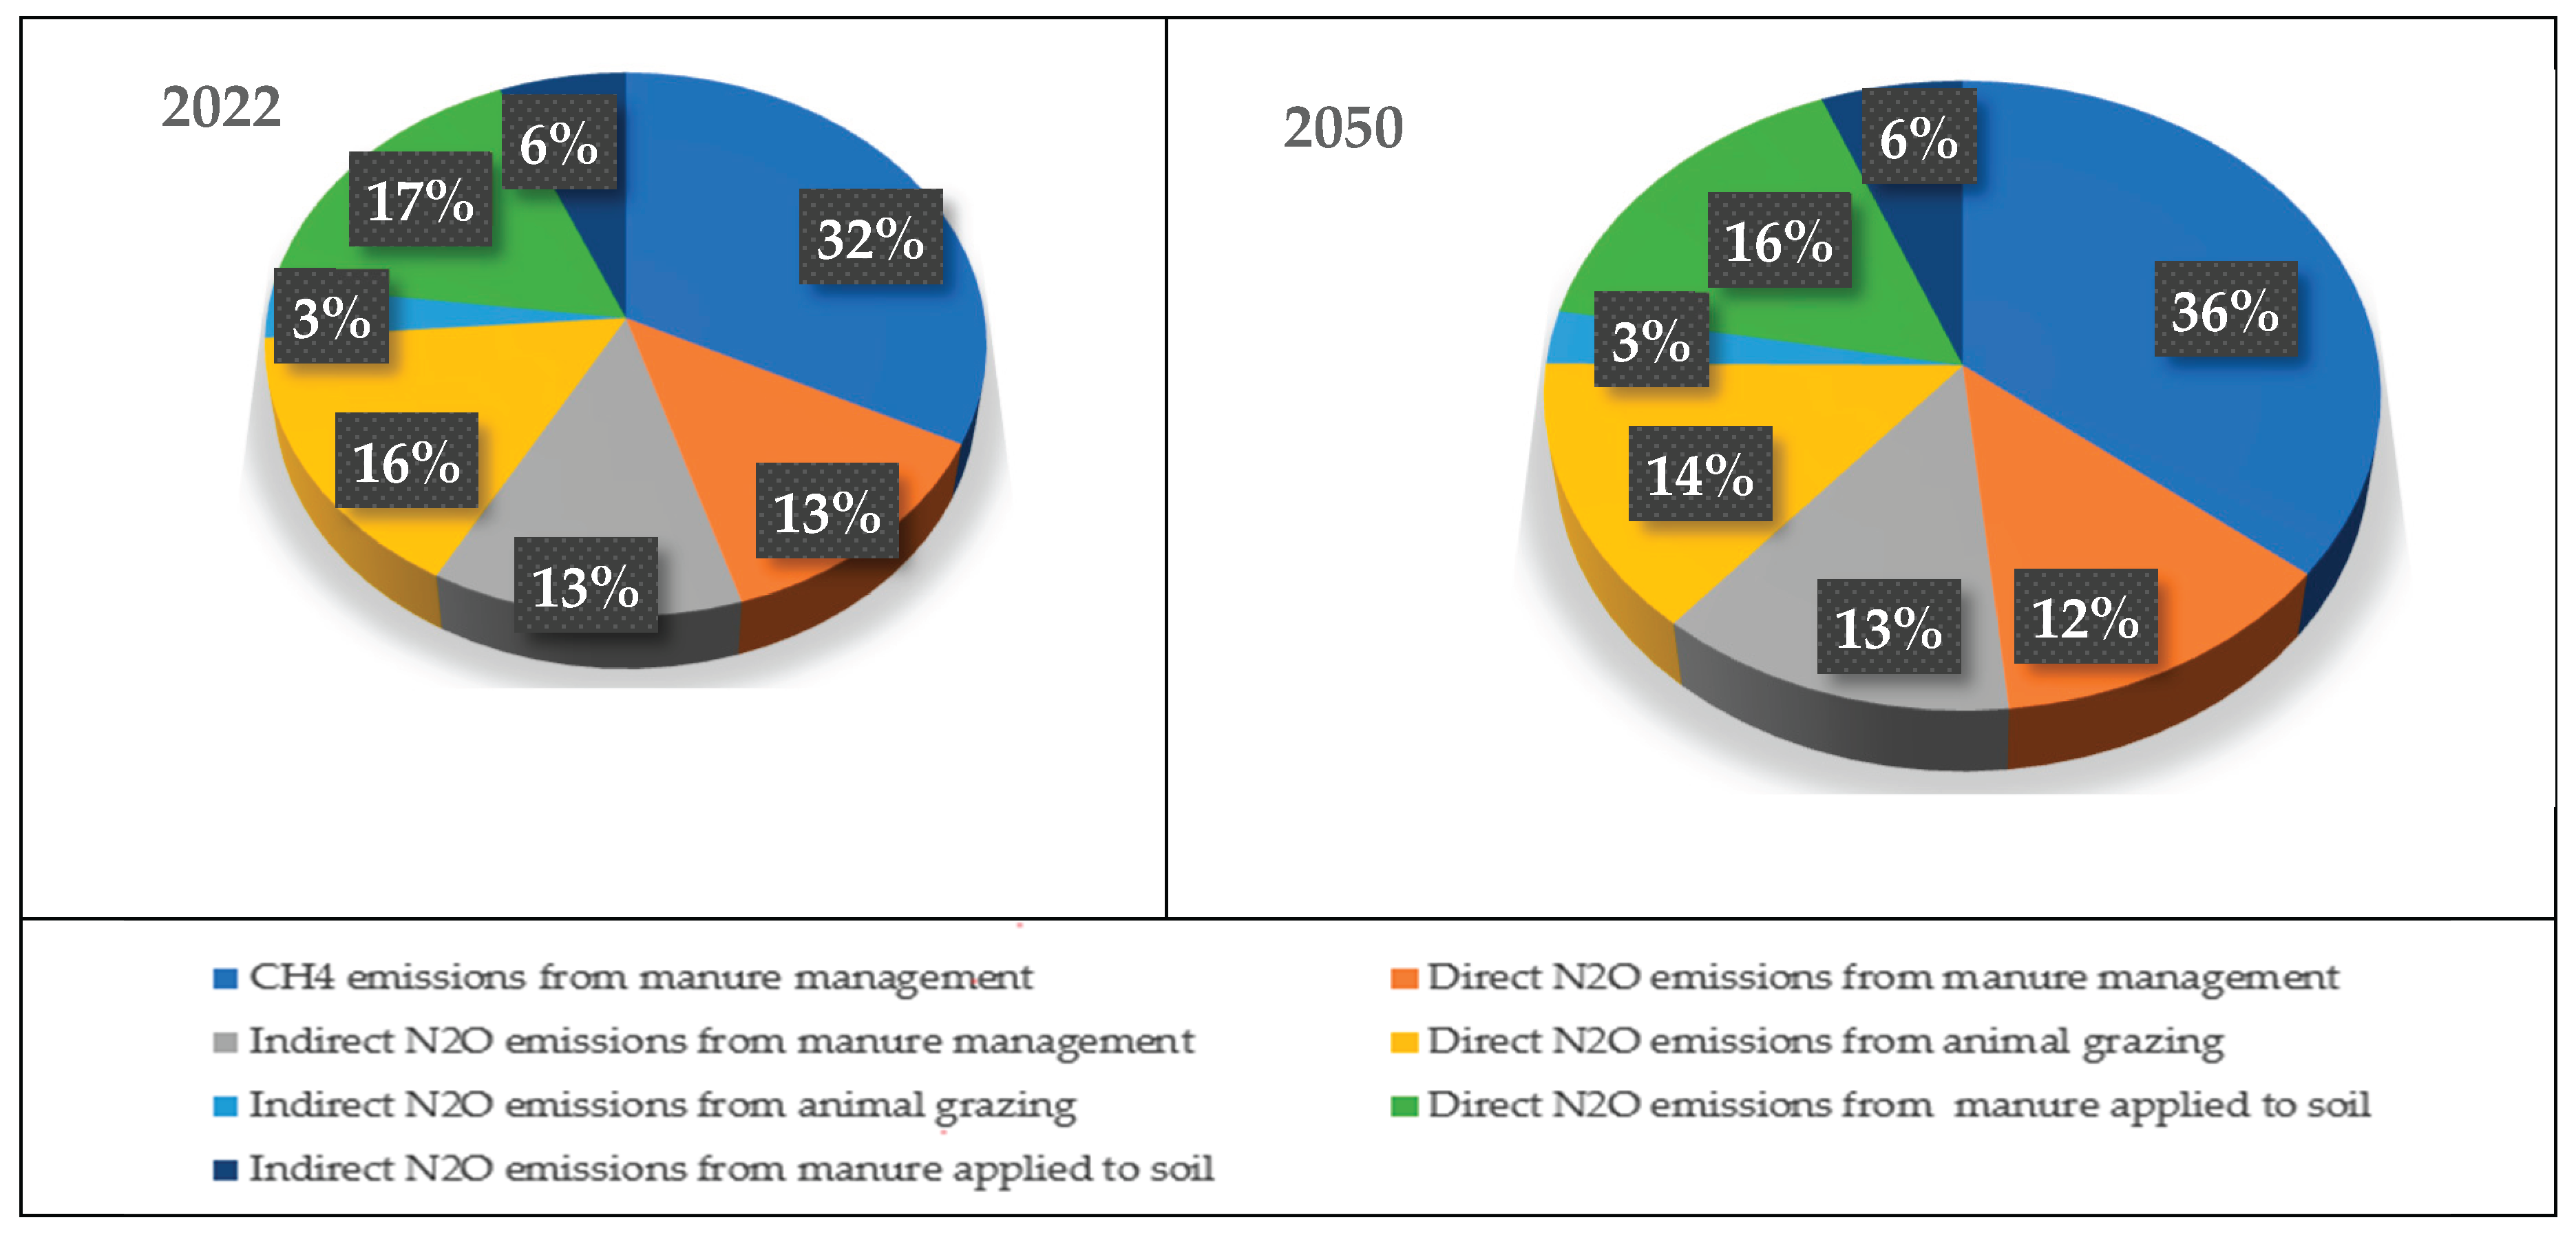

Table 1.
Livestock manure management systems and the production of various types of manure per animal (tonnes) [25,28,30,31].
| Category of farm animals | Pasture | Solid manure | Liquid-manure | Manure without litter |
Fresh manure (pasture) | Solid manure | Liquid manure | Manure without litter |
|---|---|---|---|---|---|---|---|---|
| Dairy cows* | x | x | x | - | 9.0 | 15.0 | 19.0 | - |
| Dairy cow calves (up to 1 year old) | x | x | - | - | 4.2 | 7.0 | - | - |
| Dairy cow young cattle (1-2 years old) | x | x | - | - | 6.6 | 11.0 | - | - |
| Beef cattle calves (up to 1 year old) | x | x | - | - | 3.6 | 6.0 | - | - |
| Beef young cattle (1-2 years old) | x | x | - | - | 6.0 | 10.0 | - | - |
| Other bovine animals (over 2 years old) | x | x | - | - | 5.4 | 9.0 | - | - |
| Sows and boars | - | x | x | - | - | 1.5 | 2.5 | - |
| Piglets (up to 4 months old) | - | x | x | - | - | 0.4 | 0.65 | - |
| Pigs for fattening (from 4 months old) | - | x | x | - | - | 1.2 | 2.2 | - |
| Sheep | x | x | - | - | 1.5 | 2.4 | - | - |
| Goats | x | x | - | - | 1.5 | 2.4 | - | - |
| Horses | x | x | - | - | 5 | 10.0 | - | - |
| Laying hens | x | x | - | x | 0.04 | 0.05 | - | 0.03 |
| Broilers | - | x | - | - | - | 0.01 | - | - |
| Geese | x | x | - | - | 0.03 | 0.04 | - | - |
| Ducks | x | x | - | - | 0.05 | 0.06 | - | - |
| Turkeys | x | x | - | - | 0.12 | 0.14 | - | - |
| Deer | x | - | - | - | 1.2 | - | - | - |
*For dairy cows, solid and liquid manure yields at a milk yield of 6-8 tonnes per cow per year; the model employed adjusted data.
Table 2.
Emission factors for calculating methane emissions from manure management, kg per year per farm animal, and the amount of N excreted, kg N per year per farm animal [27,28].
| Category of farm animals |
CH4 emissions from manure management, kg per year per animal | N excreted, kg per year per animal |
|---|---|---|
| Dairy cows | 20.81 | 120.4 |
| Cattle under 2 years old | 1.13 | 19.9 |
| Cattle over 2 years old | 2.02 | 63.3 |
| Pigs | 2.15 | 10.3 |
| Sheep | 0.19 | 15.30 |
| Goats | 0.13 | 15.80 |
| Horses | 1.56 | 44.00 |
| Laying hens | 0.03 | 0.55 |
| Broilers and others | 0.02 | 0.35 |
| Turkeys | 0.09 | 1.64 |
| Ducks | 0.02 | 0.58 |
| Geese | 0.02 | 1.12 |
| Deer | 0.22 | 12.00 |
Table 3.
Breakdown of manure management systems by type of manure for calculating emissions in Latvia in 2022 [27,28].
| Category of farm animals | Pasture | Solid manure | Liquid manure | Anaerobic digester |
|---|---|---|---|---|
| Dairy cows | 0.05 | 0.35 | 0.43 | 0.18 |
| Dairy cow calves up to 1 year old | 0.06 | 0.80 | - | 0.14 |
| Dairy cow, young cattle 1-2 years old | 0.06 | 0.80 | - | 0.14 |
| Beef cattle calves up to 1 year old | 0.79 | 0.21 | - | - |
| Beef young cattle 1-2 years old | 0.79 | 0.21 | - | - |
| Other cattle | 0.79 | 0.21 | - | - |
| Sows and boars | - | 0.04 | 0.46 | 0.50 |
| Piglets up to 4 months old | - | 0.04 | 0.46 | 0.50 |
| Fattening and young breeding pigs over 4 months old | - | 0.04 | 0.46 | 0.50 |
| Sheep | 0.38 | 0.62 | - | - |
| Goats | 0.10 | 0.90 | - | - |
| Horses | 0.35 | 0.65 | - | - |
| Laying hens | 0.04 | 0.45 | - | 0.51 |
| Broilers | - | 1 | - | - |
| Geese | 0.29 | 0.71 | - | - |
| Ducks | 0.32 | 0.69 | - | - |
| Turkeys | 0.30 | 0.70 | - | - |
| Deer | 1 | - | - | - |
Table 4.
Amounts of manure produced and projections thereof for various manure storage systems in Latvia for 2021-2023, with forecasts for 2025-2050, in thousand tons [25,27,28,30,31,32].
| Indicators | 2021 | 2022 | 2023 | 2025 | 2030 | 2035 | 2040 | 2045 | 2050 | 2050/2023, % |
|---|---|---|---|---|---|---|---|---|---|---|
| Dairy cows | 2260.3 | 2239.1 | 2141.8 | 2145.8 | 2333.8 | 2433.7 | 2453.8 | 2438.4 | 2426.5 | 113 |
| Solid manure | 863.1 | 814.6 | 735.7 | 684.8 | 621.7 | 543 | 459.9 | 384.8 | 323.1 | 44 |
| Liquid manure | 1277.3 | 1311.3 | 1303.9 | 1365.9 | 1625.7 | 1815.3 | 1930 | 2000.1 | 2058.5 | 158 |
| Fresh manure (pasture) | 119.9 | 113.2 | 102.2 | 95.1 | 86.4 | 75.4 | 63.9 | 53.5 | 44.9 | 44 |
| Other cattle | 1869.2 | 1881.1 | 1753.3 | 1697.6 | 1718.3 | 1704 | 1671.2 | 1642 | 1631.9 | 93 |
| Solid manure | 1285.1 | 1300.6 | 1179.3 | 1148.8 | 1175.7 | 1169.9 | 1146.4 | 1125.3 | 1120.8 | 95 |
| Fresh manure (pasture) | 584.1 | 580.5 | 574.0 | 548.8 | 542.6 | 534.1 | 524.8 | 516.7 | 511.1 | 89 |
| Pigs | 471.6 | 442.2 | 415.7 | 433.4 | 431.5 | 431 | 428.8 | 426.7 | 424.6 | 102 |
| Solid manure | 13.9 | 10.7 | 9.4 | 8.4 | 5.7 | 3.9 | 2.6 | 1.8 | 1.2 | 13 |
| Liquid manure | 457.7 | 431.5 | 406.3 | 425 | 425.8 | 427.1 | 426.2 | 424.9 | 423.4 | 104 |
| Laying hens | 107.6 | 105.9 | 107.3 | 107.4 | 107.2 | 107 | 106.6 | 106.2 | 106 | 99 |
| Solid manure | 11.4 | 11.2 | 11.4 | 11.0 | 10.0 | 9.0 | 7.9 | 6.8 | 5.8 | 51 |
| Manure without litter | 91.7 | 90.3 | 91.4 | 92.1 | 93.3 | 94.5 | 95.6 | 96.7 | 97.9 | 107 |
| Fresh manure (pasture) | 4.5 | 4.4 | 4.5 | 4.3 | 3.9 | 3.5 | 3.1 | 2.7 | 2.3 | 51 |
| Broilers | 23.9 | 23.5 | 24.6 | 24.6 | 24.6 | 24.6 | 24.6 | 24.6 | 24.6 | 100 |
| Solid manure | 23.9 | 23.5 | 24.6 | 24.6 | 24.6 | 24.6 | 24.6 | 24.6 | 24.6 | 100 |
| Other poultry* | 1.1 | 1.0 | 0.8 | 0.8 | 1.0 | 1.0 | 1.0 | 1.1 | 1.1 | 138 |
| Solid manure | 0.8 | 0.7 | 0.6 | 0.6 | 0.7 | 0.7 | 0.7 | 0.8 | 0.8 | 133 |
| Fresh manure (pasture) | 0.3 | 0.3 | 0.2 | 0.2 | 0.3 | 0.3 | 0.3 | 0.3 | 0.3 | 100 |
| Sheep | 176.2 | 170.4 | 152.7 | 144.6 | 130.3 | 120.3 | 112.7 | 106.6 | 101.4 | 66 |
| Solid manure | 108.6 | 105 | 94.1 | 89.1 | 80.3 | 74.1 | 69.5 | 65.7 | 62.5 | 66 |
| Fresh manure (pasture) | 67.6 | 65.4 | 58.6 | 55.5 | 50 | 46.2 | 43.2 | 40.9 | 38.9 | 66 |
| Goats | 25.9 | 26.5 | 23.5 | 23.2 | 22.7 | 22.1 | 21.8 | 21.5 | 21.1 | 90 |
| Solid manure | 23.4 | 23.9 | 21.2 | 21 | 20.5 | 20 | 19.7 | 19.4 | 19.1 | 90 |
| Fresh manure (pasture) | 2.5 | 2.6 | 2.3 | 2.2 | 2.2 | 2.1 | 2.1 | 2.1 | 2.0 | 87 |
| Horses | 62.1 | 64.4 | 66.5 | 66.5 | 66.5 | 66.5 | 66.5 | 66.5 | 66.5 | 100 |
| Solid manure | 40.2 | 41.7 | 43.1 | 43.1 | 43.1 | 43.1 | 43.1 | 43.1 | 43.1 | 100 |
| Fresh manure (pasture) | 21.9 | 22.7 | 23.4 | 23.4 | 23.4 | 23.4 | 23.4 | 23.4 | 23.4 | 100 |
| Deer | 20.4 | 19.4 | 14.5 | 14.5 | 14.5 | 14.5 | 14.5 | 14.5 | 14.5 | 100 |
| Fresh manure (pasture) | 20.4 | 19.4 | 14.5 | 14.5 | 14.5 | 14.5 | 14.5 | 14.5 | 14.5 | 100 |
| Total | 5018.3 | 4973.5 | 4700.7 | 4658.4 | 4850.4 | 4924.7 | 4901.5 | 4848.1 | 4818.2 | 102 |
*Turkeys, ducks, and geese.
Table 5.
Amounts of GHG emissions from manure management in Latvia in 2021-2022, a projection for 2025-2050, CO2 eq., thousand tons [25,27,28,30,31,32].
| Kinds of emissions | 2021 | 2022 | 2025 | 2030 | 2035 | 2040 | 2045 | 2050 | 2050/2022, % |
|---|---|---|---|---|---|---|---|---|---|
| CH4 emissions from manure management | 105.2 | 108.6 | 105.6 | 112.0 | 115.7 | 116.1 | 114.9 | 113.6 | 105 |
| Direct N2O emissions from manure management | 42.7 | 43.1 | 39.6 | 40.6 | 41.1 | 40.8 | 40.2 | 39.9 | 92 |
| Indirect N2O emissions from manure management | 43.8 | 42.8 | 38.8 | 40.4 | 41.1 | 41.0 | 40.6 | 40.3 | 94 |
| Direct N2O emissions from animal grazing | 52.4 | 52.9 | 49.2 | 48.4 | 47.3 | 46.1 | 45.1 | 44.3 | 84 |
| Indirect N2O emissions from animal grazing | 10.4 | 10.5 | 9.7 | 9.5 | 9.3 | 9.1 | 8.9 | 8.7 | 83 |
| Direct N2O emissions from manure applied to soil | 56.8 | 56.2 | 51.4 | 52.4 | 52.9 | 52.5 | 51.7 | 51.2 | 91 |
| Indirect N2O emissions from manure applied to soil | 21.2 | 20.9 | 19.1 | 19.5 | 19.7 | 19.6 | 19.3 | 19.1 | 91 |
| Total GHG emissions related to animal manure management | 332.6 | 335.1 | 313.5 | 322.9 | 327.2 | 325.1 | 320.6 | 317.1 | 95 |
| Total GHG emissions from agriculture | 2245.3 | 2242.5 | 2160.0 | 2234.0 | 2269.3 | 2277.9 | 2277.2 | 2281.0 | 102 |
| Total GHG emissions related to animal manure management, % of the total | 14.8 | 14.9 | 14.5 | 14.5 | 14.4 | 14.3 | 14.1 | 13.9 |
-1% |
Disclaimer/Publisher’s Note: The statements, opinions and data contained in all publications are solely those of the individual author(s) and contributor(s) and not of MDPI and/or the editor(s). MDPI and/or the editor(s) disclaim responsibility for any injury to people or property resulting from any ideas, methods, instructions or products referred to in the content. |
© 2025 by the authors. Licensee MDPI, Basel, Switzerland. This article is an open access article distributed under the terms and conditions of the Creative Commons Attribution (CC BY) license (http://creativecommons.org/licenses/by/4.0/).
Copyright: This open access article is published under a Creative Commons CC BY 4.0 license, which permit the free download, distribution, and reuse, provided that the author and preprint are cited in any reuse.


