
Submitted:
18 June 2023
Posted:
19 June 2023
You are already at the latest version
Abstract
The agricultural sector's progress towards climate neutrality is of great importance not only in the climate but also in the economic and social context. The agricultural sector is the 3rd largest emission-generating sector both in Latvia and Europe, and it directly and/or indirectly affects all other sectors. Climate-neutral agriculture is highly dependent on innovations that ensure maximum efficient farming, which not only reduces emissions but also ensures competitiveness in the market, but all of this is fundamentally influenced by well considered policies. Although the goals of the Green Deal are united, each country's situation must be thoughtfully considered individually to evaluate the best action plan for integrating the EU's common agricultural policy without reducing harvest. In addition, due to the complicated structure of the sector, it tends to be very difficult or even impossible to determine the real obstacles and mistakes that delay the progress of sustainable farming. Therefore, this research aims to create a system dynamics model using Latvia as a case study, which would not only provide an insight into the system’s structure but also identify the system's weak links and allow for the development of recommendations. The results could help policymakers in any country to make rational, non-controversial decisions simultaneously in the context of economic and Green Deal objectives. The results of the study demonstrate that to increase economic competitiveness and reduce emissions in agriculture, the most important aspect is the ability to invest in innovations and new technologies that would achieve not only the lowest emissions, but also the highest productivity and competitiveness in the market. It was found that by investing in the level of manure management it is possible to reduce GHG emissions in dairy farming by 8%, while by improving feed quality, manure management and thermoregulation all together, resulted in 60% GHG emission reduction. In addition, in a comprehensive improvement of the new innovations, the case study company managed to increase milk yield by 69%.
Keywords:
Agriculture
; Climate Neutrality
; System Dynamics
; Innovations
; Sustainability
; GHG emissions
; Policy
1. Introduction
The agriculture sector keeps an essential role both in global and in Latvia’s economy and is crucial to economic growth. However, rural areas are those that often have enormous, but rarely fully realized economic potential. Energy efficiency trends in the agricultural sector also point to necessary improvements in the whole EU [1]. To increase energy efficiency, it is necessary to introduce energy management, which is a reasonable and efficient use of energy to maximize profits by reducing costs. In addition, energy management is related not only to the economic aspect, but also the environmental aspect, in order to eliminate inefficient use of resources, which in turn causes global warming [2]. However, the main problem is the large proportion of hard-to-reduce GHG emission sources, which is the main characteristic of this sector [3]. Both in Europe and Latvia, the agricultural sector is one of the largest sectors producing GHG emissions with high potential for productivity and efficiency improvements [4,5]. Although agriculture captures carbon dioxide in the process of plant growth, emissions are also generated in many processes, for instance, intestinal fermentation processes of farm animals, manure management, agricultural soil treatment, liming and urea use, fuel use for field cultivation, energy use in various processes, etc. [6].
Agriculture is in the most direct contact with natural resources - water, land, plants, animals, natural minerals, energy - and is directly and indirectly linked to all other sectors [7]. Not only its connection with other sectors, all kinds of resources, but also the diversity of its activity makes it a very complex, difficult sector to organize, but it is a very important investment both in terms of environmental and also in economic development [8,9]. Inclusive, sustainable, growth-promoting and equitable development of all sub-sectors of agriculture could not only have a large impact on an agricultural sector itself, but also other sectors in which it is necessary to reduce GHG emissions [10,11]. As many of the resources used in agriculture are depletable, it is crucial to find methods to ensure their efficient management and their sustainability and availability in the future [12]. It is crucial to implement energy efficiency and resource efficiency measures without simultaneously reducing productivity [13]. However, these energy efficiency measures in the agricultural sector often require large investments in new technologies, and saving on such factors as lighting intensity, heat energy consumption and the economy of various resources is not possible, as it could potentially threaten the existence of the companies due to reduced or possibly even non-existent harvests. Agriculture is a sector subject to technological processes whose application has a direct impact on the production of competitive products with higher added value [14].
Undeniably the adopted policy has a great influence on the direction of agriculture. Although the goal and meaning of the green course are unified [15], the common agricultural policy is developed individually by the member states [16]. The new common agricultural policy envisages making EU agriculture fairer, greener, more results-oriented, as well as guaranteeing stable farmers’ incomes and protection against bad harvest years and market price fluctuations [17]. The direction of the transformation is influenced by different strategies.
Climate Neutrality Strategy 2050 aims to achieve climate neutrality by 2050 through improvements in key GHG-emitting sectors [18]. Action measures to achieve the goal planned in the strategy are to achieve resource-efficient agriculture that produces products with high added value and high productivity and increase agricultural investment in bioenergy. “Farm to Fork” strategy aims to make food systems equitable, healthy and environmentally friendly [19]. It sets specific targets, such as halving the use of pesticides, reducing fertilizers by at least 20%, increasing the area of organic farming by 25% and reducing antimicrobials used on farm animals by 50%. Another one is the new Biodiversity Strategy for 2030, which is a comprehensive, systemic and ambitious long-term plan to protect nature, stop ecosystem degradation and restore degraded ecosystems [20]. In the light of the Green Deal and its ‘Farm to Fork’ and ‘Biodiversity’ strategies, the EU aims to find new ways to decrease GHG emissions through a new approach for Europe - the EU Carbon Farming initiative-, stating that farming practices that remove CO2 from the atmosphere should be rewarded in line with the development of new EU business models [21]. Also the National Energy and Climate Plan (NECP) for 2030, within the framework of which there is a desire to achieve sustainable land management, farming of agricultural crops and farm animals, respecting the climate, nature protection, economic and social aspects, to make a significant contribution to bioenergy in the field, without endangering food security and CO2 sequestration and following the cascade principle; to achieve high productivity through efficient use of bio-resources (including land resources) [22]. NECP’s planned measures related to animal husbandry are: improvement of the manure management system for more efficient use of fertilizers, which is essential both from the plant yield and the environmental aspect; To implement manure fermentation biogas reactors, which have the potential to reduce GHG emissions to a minimum in large farms, ensuring efficient manure management and production of renewable energy and valuable fertilizer for crops; To improve animal feeding – various methods are known and used in the world for determining the digestibility of fodder, as well as for determining and analyzing the amount of gases released by animals -, balanced and appropriate feed affects the rate of N release from manure, which has a positive effect on the reduction of N2O emissions, meanwhile improving feed quality increases feed digestibility and reduces CH4 emissions. By achieving the desired, the population of rural areas and the well-being of residents would be improved, without reducing the fertility of the land, the yield of crops would be increased, the demand for energy from external resources would decrease. It would not only reduce the impact on the environment, but also promote the competitiveness of local companies in the market by reducing expenses, producing products with higher added value, making full use of all available resources. However, wrongly adopted policies that focus only on specific agricultural sub-sectors or groups of companies, in general may not only not promote these goals, but may even delay them. It should be taken into account that agriculture is a very complex system in which simple saving measures and knowledge are not enough, because various innovations and technologies are needed in order to achieve these savings and productivity [23].
Although the planned measures are theoretically very promising, there is a huge resistance of farmers, where the prevailing opinion is about the inequality and destruction of business in the agricultural sector, the inability to compete. Due to the complicated structure of the sector, it tends to be very difficult or even impossible to determine the real obstacles and mistakes that delay the progress of sustainable farming. Therefore, this research aims to create a system dynamics model using Latvian dairy farming as a case study, which was chosen due to the existing dairy crisis in Latvia, which is also evidenced by the low profitability indicators of animal husbandry [1]. It would not only provide an insight into the system’s structure but also identify the system’s weak links and allow for the development of recommendations.
1.1. Specifics of Dairy Farming
In animal husbandry thermoregulation, i.e. heating, conditioning, lighting and ventilation, is particularly important for animals kept indoors [24]. The quality of air, food and water has the greatest impact directly on the health of animals, and therefore also on productivity, which is the most important indicator in animal husbandry [25].
Today, ranchers are increasingly using robots and algorithms in production to optimize their farm management decisions [26]. The development of technology creates a new automation system that provides smarter and more flexible work opportunities in animal husbandry [29]. These technologies provide livestock farmers with data-based insight into economic activity, which allows them to provide the necessary animal care, increase productivity and provides an opportunity to manage the farm more easily.
One of the biggest consumers of electricity, next to lighting, is ventilation, which often accounts for at least a fifth of the barn’s maintenance costs [27], so that harmful gases such as ammonia and carbon dioxide do not exceed their critical permissible concentrations [28]. One of the solutions to increase efficiency, is modern building construction or innovations such as green roofs and walls to reduce indoor temperatures [29,30]. The main goal is to successfully combine mechanical ventilation and thermal insulation with natural, and such engineering solutions help to reduce energy by up to 50% [27], simultaneously increasing milk productivity by at least 10 – 15% [31]. The most important aspect is to pay attention to thermoregulation, because it will result in higher animal productivity, because if dairy cows suffer from overheating during summer for about 6 – 15 hours a day, it can result in a loss of 3.5 liters of milk per day due to heat stress. Often, if all resource saving and energy efficiency measures have been taken, it is important to start thinking directly about the possibilities of installing renewable energy sources on the farm.
Development has also taken place in feeding animals. Computer programs have been developed that cover each stage of feeding – feed preparation, mixing and dosing and feed distribution. They make it easier to plan the rations needed by the animal and give the ability to supplement the feed with fatty substances. Efficient use of feed can reduce methane gas emissions as well as give the ability to get the biggest yield. Also, a sensor has been created that reads the movement of the animal’s jaw to determine whether it digests the food completely.
One of the biggest threats in animal farming is disease, as it can spread very quickly between animals. Sickness of an animal has an economic impact on the farm, so it is important to detect the disease in its first days, because it reduces the cost of treatment, reduces the mortality rate, and improves production efficiency. It is possible to determine the state of health of animals by its behavior and body condition, food intake, therefore companies have created programs based on the acquisition and analysis of data parameters. To obtain data from the animal, sensors are installed on it, the task of which is to collect data about the animal’s condition and pass it on to analysis points [34].
1.2. Case Study of a Dairy Farm in Latvia
In Latvia a significant part of the population lives in rural areas, which account for approximately 84% of the total area of Latvia [32]. Although field crops are responsible for more than half of agricultural emissions in Latvia, other agricultural sectors, such as vegetable growing and animal husbandry, which have the lowest profitability, should not be forgotten, especially because animal husbandry is responsible for the remaining agricultural emissions, which amount to about 45% [1].
Although the farming practices of Latvian farmers can be assessed as positive not only because of the high quality products, but also because of productivity, the energy efficiency trends of the agricultural sector point to necessary improvements [33], because energy efficiency does not reach the EU average over the last 8 years [34]. Also Latvia’s indicators show much larger fluctuation both in the turnover of the produced products and in the energy efficiency of the agricultural sector [34].
Such sub-sectors as cereal and berry farming has been expanding in Latvia, while other sub-sectors are experiencing rather slow development or stagnating [35]. The total number of dairy farms in 2021 has decreased by 10% compared to 2020 and the total number of dairy cows has decreased by 3%, bringing the number of registered dairy cows to 131 207 [35,36], and the density of farm animals in Latvia is one of the lowest in Europe [37]. The production of milk has almost reached the EU average milk yield, which is an important indicator of livestock welfare [38]. Also the value of primary production per hectare of agricultural land in Latvia is one of the lowest in the EU, despite good climatic conditions and available water resources [39].
The system dynamics model is created based on the operating principles and data of one of the largest and most modern agricultural enterprises. Its main product is milk. There are about 470 dairy cows, and the average milk yield is 10,184 kg per cow per year, while the total milk production is 4,736 tons per year. In total, there are 3 barns in the dairy complex, where all the necessary animal welfare regulations and environmental requirements are observed. To execute the construction of cowsheds, the owner has implemented several projects of the European Agricultural Fund for Rural Development, which has enabled the introduction of innovations in the farm, which thus increases the efficiency of farming, as well as provides the most suitable conditions for all ages of the livestock. Several projects were implemented, but the most important of them were:
- construction of the new barn, in 2012, which cost EUR 2,641,915 with the payback time of 10 years,
- construction of liquid manure storage in 2015, which cost 135,435 EUR with payback time of 8 years,
- construction of a new livestock shed in 2020, which cost EUR 1,864,564 with payback time of 9 years,
- Purchase of a Siloking feed mixer/distributor in 2020, which cost 190,000 EUR with payback time of 5 years.
Based on the operating principles of the farm, it can be safely stated that this company can serve as a positive benchmark for the Green Deal goals of the future.
2. Methodology
To obtain all the necessary information, a literature analysis was carried out, in which scientific articles, statistics and policy documents, strategies were analyzed. Then one of the biggest and modern dairy farms in Latvia was surveyed, which has already implemented several innovations for precise management and livestock welfare, modern technologies, energy efficiency measures, while achieving a yield that significantly exceeds the average annual milking yield of a cow in Latvia and Europe. Data were obtained from this farm and processed; calculations were made. Then a system dynamics model using Latvia as a case study was made, which would not only provide an insight into the system’s structure but also identify the system’s weak links and allow for the development of recommendations (see Figure 1).
Stella Architect modeling tool was used to create a simulation model to present in a simplified mathematical way an agricultural sub sector – dairy farming. It was chosen because it not only shows the structure visually, but also includes numbers, equations, and mutual interactions of various influences. It includes both economic and environmental, therefore technological aspects too. To create a transparent insight into the structure of the dairy farm linked to the research objectives and focus, a simplified scheme was created (see Figure 2)
Model data input comes from two sources – literature analysis and data obtained from the specific company’s survey. Data such as the number of cows, electricity and heat consumption, investments in various technologies and modernization, milk yield were used for the case study.
The purpose of the model is to create the operation model of the dairy farm, which reflects the importance of investment implementation both in the economic and environmental context, where it is possible to observe the amount of emission reduction. It is possible to predict the importance of the implementation of investments and changes in emissions, considering several interrelated influencing factors in the dairy farm model.
3. Results
To identify the main drivers and weak links, it was necessary to model the importance of investment implementation and the change in emissions. In general, the model was divided into four sectors:
- -
- Dairy cows;
- -
- Investment in dairy farming;
- -
- Economic factors;
- -
- Emissions.
For the construction of the base model to be as close as possible to the real-life situation, it is necessary to look at several sectors in more detail, so that the model is not based on assumptions, but on real data. One of the sectors that needs to be further divided into sub-sectors is investments in the improvements of dairy farming, where it is also necessary to consider separately the investments in the improvements of feed quality, thermoregulation, and manure management. Another sector is the economic factors, where it is necessary to study in more detail both how the savings are generated, which is a key factor needed to make the investment, and the cost of capital, which determines the total one-time costs needed to cover, e.g., construction of a new barn.
Each sector was modelled so it could be used for each emission scenario. Once the boundaries of the model study were defined, it was determined that the emissions generated would be viewed in two ways:
- -
- generated emissions, which will be measured in kt CO2eq. year,
- -
- generated emissions per product, which will be measured in kt CO2eq. to the annual production volume.
It was further determined that the change in emissions in the model would be determined in 3 scenarios:
- The dairy farmer does not invest in any of the dairy farm performance improvement measures;
- The dairy farmer invests only in improving manure management;
- The dairy farmer invests in all farm improvement measures.
The scenarios were created since dairy farmers have more pressure from the state to invest in manure management than in feed quality and thermoregulation. From the first two scenarios, changes in emissions were observed, while in the third one, changes in emissions to produced production will be observed. It should be mentioned that although the model structure is created for the third scenario, it has the possibility to disable some parameter behaviour, thus creating some other scenario.
So that the data obtained by the model could be compared with the real-life situation and conclusions could be drawn, it was chosen to simulate the model in the period from 2012 to 2022. All data used in the model are obtained from dairy data, adopted considering the opinion of sector experts and literature analysis.
3.1. Dairy Cows
Dairy cows are the most important element in a dairy farm, as the obtained raw milk is the main product that brings profit to the company. Dairy cows mostly are at least two years old and have reached the 1st lactation. The cow sector in the model consists of two main stocks: dairy cows and sick cows (see Figure 3).
Dairy cow stock has both outgoing and incoming flow. To increase the number of cows, the owner buys new dairy cows or grows heifers. If a cow’s milk production drops, it is sold. Sick cows are treated, but when the treatment is unsuccessful and requires a lot of resources that would affect not only the costs, but also the yield, they are mostly sent to the slaughterhouse or die naturally. Livestock health is particularly affected by the availability of high-quality feed and living conditions, thermoregulation.
The incoming flow of the stock of dairy cows was determined considering the maximum number of beds for cows in the barn. But the outflow of the stock “sales” is determined by multiplying the sales ratio by the number of milking cows.
A similar principle applies to the cure and mortality flows of the sick cow stock, but the inflow of sick cows is affected by the level of feed quality. The effect of feed quality on morbidity is derived from a non-linear relationship in which the feed quality rating is used as an argument. The effect on morbidity ranges from 0 to 1.
Cows also produce manure because of their digestive system. Manure can be divided into liquid and litter (solid). Litter manure is cow excrement with/without litter and fodder remain, and liquid manure - with urine and/or water admixture. The total amount of manure produced was calculated as t/year.
The quantity of milk produced and sold [t] depends on the number of cows and the average yield of one cow.
In general, milk yield per cow is influenced by several parameters, including the effect of thermoregulation level and feed quality on milk yield. Both the effect of feed quality and the effect of thermoregulation on hunger are characterized by a non-linear relationship that varies in the range from approximately 0 to 1, in which the rating of feed quality or thermoregulation level is used as an argument. In the model, the average milk yield at the beginning of 2012 is used from the data of the reviewed dairy farm, to then be able to compare how investing in thermoregulation and feed quality improvement technologies increases milk yield.
The necessary data were obtained from the dairy farm and available statistical data, scientific literature analysis.
3.2. Emissions
The emission sector in the model represents emissions from the company, as well as emissions per unit of production. It is necessary to calculate the emissions to be able to evaluate the progress towards climate neutrality. In dairy farming, the main GHG emissions come from intestinal fermentation and manure management. Although in the documentation the calculation of emissions from fuel consumption, electricity and heat production is below energy and transport sector, it is important to include it. In the model, emission sector has two main stocks and two main flows (see Figure 4).
Methane emissions from intestinal fermentation processes, GHG emissions generated to produce the consumed electricity and heat energy, as well as GHG emissions generated due to fuel consumption were calculated. Manure emissions were also calculated; however, several parameters must be considered when calculating manure. Organic matter and water make up most of the composition of manure. Manure emits both methane and nitrogen oxide emissions. How much methane is released from manure depends on its oxygenation, water content, pH level and feed digestibility [40]. How much nitrous oxide will be produced depends on climate, pH and manure management. To be able to perform a unified accounting of emissions, it is necessary to switch to CO2eq. In general, both dairy farm data and predetermined constants were taken for the calculation (see Table 2).
Electricity and heat consumption are currently represented as constant values in the model. It is also necessary to calculate the emitted emissions per production quantity, which can be calculated by dividing the generated emissions by the produced production quantity.
3.3. Economic Factors
It is important to look into the economic sector as it is one of the determinants of investment and savings provides a safety net and a sense of security for a farmer that the company will have a better chance of getting out of financial difficulties after taking risks of new investments etc. [41]. In dairy farming the biggest expenses come from electricity consumption charges, dairy cow treatment costs and capital costs, while income comes from milk production and sales, where they are affected by the amount of milk sold, which depends on the yield obtained from the cow. Cow and milk prices determined by the cooperative, additional income also comes from the sale of culled cows, where the price per cow depends on the market. Income is exactly the factor that contributes to the accumulation of profit, because even if the expenses are very high, if there is a large income, the accumulated profit will also be within the norm. A feedback loop is also created from the amount of accumulated profit because the investment decision is made from the amount of accumulated profit and own available financing. If a decision is made to make investments, then the reduction in retained earnings is determined by the channeling of funding to investments and the self-financed part (see Figure 5).
The capital cost sector consists of one main stock – capital cost, the increase of which is determined by making capital investments, which is affected by the discount rate, bank loan and the loan repayment period, while the reduction of the stock is affected by the repayment period, the capital investor and the capital costs themselves. A dairy company needs to take a loan from a bank to cover the costs needed to make improvements to the farm that are not compensated by the support offered by the state.
For the sector to work in the model, it is necessary to enter data, therefore the input data used in the savings and capital expenditure sector are summarized in Table 3.
3.4. Investment in Dairy Farming
To manage dairy cow manure, it is possible to use different management methods. Each type of manure management in the model is evaluated in points, where they determine the level of management on the farm, as well as each type of management has its own determined emission factor (see Table 4).
The model considers the time required to implement improvements at the management level (see Figure 6). The improvement of the level is also influenced by the ratio between the funding diverted for improvement and the investment required to improve manure management by one point. The necessary investment for improvement per cow is determined by the necessary investment for raising the quality indicator by one point, the difference between the maximum and management level in the farm, as well as the available support measures. To determine whether it is worth investing in the improvement of manure management, the time implementation of improvement measures is determined by whether the improvement of manure management contributes to an increase in income. If the manure is used to produce biogas, it is possible for the dairy farmer to receive payment for the manure sold to the biogas plant, unless the farmer himself has invested in the biogas plant.
Feed quality is included, because it affects milk yield, health of cows and generated emissions, farm’s profit (see Figure 7). The most important indicator by which feed quality is determined is feed digestibility (%). In the model, feed quality is measured on a scale of 1 to 10, where 1 is the worst feed quality indicator and 10 is the best. But to achieve high feed quality, it is necessary to invest in technologies to achieve the set goal. The effect of feed quality on milk yield varies between approximately 0.1 and 1 and is derived from a non-linear relationship using the feed quality score as the argument. The model also examines how income could increase as feed quality increases to determine the payback period. The increase in feed quality is affected by the time it takes to introduce a new technology, as well as the ratio between the funding diverted to improve quality and the investment needed to improve quality by one point. The necessary investment for improvement per cow is determined by the necessary investment for raising the quality indicator by one point, the difference between the maximum and the existing level of feed quality in the farm, as well as the available support measures.
It is crucial to make improvements in thermoregulation to improve well-being of livestock, which would also affect the milk yield significantly and reduce diseases. In the model, the level of thermoregulation is evaluated on a scale from 1 to 10, where 1 is the worst thermoregulation and 10 is the best. The effect of thermoregulatory level on yield varies between 0.1 and 1 and is derived from a non-linear relationship using the thermoregulatory level score as an argument. The model also explores how earnings could increase if the level of thermoregulation is increased to determine the payback period (see Figure 8).
The increase in the quality of thermoregulation is also affected by the time it takes to implement a new technology, as well as the ratio between the funding diverted to improve thermoregulation and the investment to improve by one point. The necessary investment for improvement per cow is determined by the necessary investment for improving thermoregulation by one point, the difference between the maximum and existing levels in the farm, as well as the available support measures. For the model to function, the data reflected in Table 5 were entered.
3.5. Results from the Case Study and the System Dynamics Model
By the calculations based on the data of the dairy company, it was found that it is possible to achieve several improvements by investing:
By building a new barn, the company:
- -
- reduced electricity consumption by 7,000 kWh/year, which is a 46% reduction,
- -
- increased milk yield from one cow by 2,129 kg/cow/year, which is 25% improvement comparing to the year of making the investment;
- -
- increased milk yield from one cow by 3,987 kg/cow/year, which is 42% improvement, comparing to the 10-year average milk yield before the investments.
By investing in feed feeding technologies, the company increased milk yield by 174 kg/cow/year, which is 2% improvement comparing to the year of making the investment.
From the system dynamics model it was obtained that the generation of emissions in both the first and second scenario is characterized by a linear curve (see Figure 6.a). The number of generated emissions increases every year, as the number of cows increases, which thus increases the number of emissions generated from intestinal fermentation processes, but as a result of the introduction of innovations, it is possible to observe a reduction in emissions, as a higher level of manure management reduces emissions from manure.
When comparing the emissions created in these scenarios, 2017 and 2022 were taken as reference points and it was obtained that with the help of the 2nd scenario, compared to the first scenario, emissions are reduced by 0.1% in 2017 and by 10% in 2022.
Then the generated emissions per produced quantity, which is the most essential and objective indicator in agriculture, was examined. Figure 6. b. shows the emissions per produced amount of production, which is measured in kt CO2eq/kt of milk produced. In general, it can be observed that the 1st scenario also produces the highest emissions for the production, while the 2nd scenario produces less emissions than the 1st scenario only from 2015, but in the 3rd scenario, significant changes can be observed compared to the other two scenarios. already since 2013.
When comparing the generated emissions between the scenarios, 2022 was taken as a reference point. It was found that by implementing the second scenario (when investments only in manure management technology development are made), comparing to the first scenario (when no improvements are made), it is possible to achieve a reduction in emissions by 8% (2.32 ktCO2eq/kt of milk) in 2022.
When comparing the generated emissions between the second scenario (where improvements only in manure management are made) and third scenario (where improvements in manure management, thermoregulation and feed improvement are made), it was found that by implementing the third scenario, it is possible to achieve a reduction in emissions by 57% (15.28 CO2eq/kt of milk) in 2022.
When comparing the generated emissions between the first scenario (where no improvements are made) and third scenario (where improvements in manure management, thermoregulation and feed improvement are made), it was found that by implementing the third scenario, it is possible to achieve a reduction in emissions by 60% (17.59 CO2eq/kt of milk) in 2022.
The increase in the number of cows occurs up to and including 2016 but remains constant thereafter. Comparing the year 2013 with the year 2022, it can be determined that the number of cows has increased by 23%.
The initial milk yield per cow was 6.377 t/cow, which remains unchanged in the first and second scenario, but in the third scenario it is possible to observe an increase in milk yield to the maximum average milk yield per cow, which is 15.870 t/cow per year. Comparing the first year of the third scenario with the last one, it is possible to observe an increase of 69% (5,261.45 t more), but comparing the third and first scenarios of 2022, it can be concluded that by investing in the improvement of the farm, it is possible to achieve a 60% higher amount of production, which is 4,550.99 t more (see Figure 10).
4. Conclusions
After research, the strategic documents emphasize manure management and improvement of feed quality, but an important missing element is visible – a section on improving thermoregulation of animals. All these elements are an integral part that must work in one system, because their improvement significantly improves productivity, while reducing energy consumption, improving resource efficiency, and reducing not only direct but also indirect emissions not only in agriculture, but also in the energy and transport sectors.
It should be noted that the larger the volume of production, the lower the number of emissions produced per unit of production. However, in agriculture it is possible to achieve this mainly through investments in new, modern technologies, because an ill-considered economy of energy or resources can result in yield losses, which would not be a sustainable solution, neither at the company, nor at the state level. Agriculture (in this case dairy farming) cannot focus only on energy efficiency and GHG emission reduction without consideration of other aspects. It is important to look at ways to increase productivity while introducing energy-efficient and resource-efficient methods, a thoughtful management model because only that way it would be possible to achieve sustainability not only from an environmental point, but also from an economic point.
However, such technologies require investments, which are directly affected by the company’s income and savings, which in turn are affected by the volume sold and the price of the product in the market, support mechanisms, existing technological level and efficiency. To ensure the sale of the product on the market at a sufficiently high price for the company to develop innovation, it is important to develop a national policy that guarantees sales of the local producer’s products. This is very important, because if there is more support and protection for agricultural enterprises in competing countries, not only the price competitiveness, but also the safety of selling the products on the market, automatically falls. Such an ill-considered policy development promotes the opportunities of competing countries’ companies to develop innovations, which are especially critical now, when adapting to climate change and trying to fulfill the Green Deal goals and destroys the local market’s ability to existing.
The created system dynamics model allows not only to understand, but also to model possible scenarios, to calculate not only the impact of a given company or sector on the environment, by calculating the generated emissions per unit of production, but also to calculate the investments required to reduce 1 kt of CO2eq generated in the company. Such a model makes it possible to make sustainable decisions not only at the level of the company, but also at the level of state policy, to simultaneously promote not only environmental goals, but also economic growth and the development of the national economy.
Acknowledgment
This research is funded by the European Social Fund within the Project No 8.2.2.0/20/I/008 “Strengthening of PhD students and academic personnel of Riga Technical University and BA School of Business and Finance in the strategic fields of specialization” of the Specific Objective 8.2.2 “To Strengthen Academic Staff of Higher Education Institutions in Strategic Specialization Areas” of the Operational Programme “Growth and Employment”.
References
- A. Rutkovska, “Agriculture is a complex industry with a big ‘BUT’ | Macroeconomics,” 2022. [Online]. Available: https://www.makroekonomika.lv/lauksaimnieciba-ir-sarezgita-nozare-ar-lielo-bet#1-lauk. [Accessed: 16-Mar-2023].
- Rodríguez, C.M.; Rodas, C.F.R.; Muñoz, J.C.C.; Casas, A.F. A multi-criteria approach for comparison of environmental assessment methods in the analysis of the energy efficiency in agricultural production systems. J. Clean. Prod. 2019, 228, 1464–1471. [Google Scholar] [CrossRef]
- Ministry of Economics of the Republic of Latvia, “Latvia’s national energy and climate plan for 2021 - 2030.” Rīga.
- EU economy emissions in 2021: -22% since 2008 - Products Eurostat News - Eurostat.” [Online]. Available: https://ec.europa.eu/eurostat/web/products-eurostat-news/w/ddn-20221221-1. [Accessed: 20-Mar-2023].
- Latvian Ministry of Agriculture, “Latvian agriculture 2020,” pp. 1–207, 2021.
- G. and M. of L. Center of Environment, “2022 Greenhouse Gas Inventory Summary.,” 2022.
- EEA, “National Climate Policy Program Project ‘ENVIRONMENT AND AGRICULTURE.’”.
- Ma, L.; Long, H.; Tang, L.; Tu, S.; Zhang, Y.; Qu, Y. Analysis of the spatial variations of determinants of agricultural production efficiency in China. Comput. Electron. Agric. 2020, 180, 105890. [Google Scholar] [CrossRef]
- Maraseni, T.; An-Vo, D.-A.; Mushtaq, S.; Reardon-Smith, K. Carbon smart agriculture: An integrated regional approach offers significant potential to increase profit and resource use efficiency, and reduce emissions. J. Clean. Prod. 2020, 282, 124555. [Google Scholar] [CrossRef]
- Welfle, A.; Chingaira, S.; Kassenov, A. Decarbonising Kenya's domestic & industry Sectors through bioenergy: An assessment of biomass resource potential & GHG performances. Biomass- Bioenergy 2020, 142, 105757. [Google Scholar] [CrossRef]
- Ersoy, E.; Ugurlu, A. The potential of Turkey's province-based livestock sector to mitigate GHG emissions through biogas production. J. Environ. Manag. 2019, 255, 109858. [Google Scholar] [CrossRef]
- Kour, D.; Rana, K.L.; Yadav, A.N.; Yadav, N.; Kumar, M.; Kumar, V.; Vyas, P.; Dhaliwal, H.S.; Saxena, A.K. Microbial biofertilizers: Bioresources and eco-friendly technologies for agricultural and environmental sustainability. Biocatal. Agric. Biotechnol. 2019, 23, 101487. [Google Scholar] [CrossRef]
- Yu, L.; Qin, H.; Xiang, P.-A. Incentive mechanism of different agricultural models to agricultural technology information management system. Sustain. Comput. Informatics Syst. 2020, 28. [Google Scholar] [CrossRef]
- Van Bueren, E.L.; Verhoog, H.; Tiemens-Hulscher, M.; Struik, P.; Haring, M. Organic agriculture requires process rather than product evaluation of novel breeding techniques. NJAS - Wagening. J. Life Sci. 2007, 54, 401–412. [Google Scholar] [CrossRef]
- European Commission, “Agriculture and the Green Deal.” [Online]. Available: https://commission.europa.eu/strategy-and-policy/priorities-2019-2024/european-green-deal/agriculture-and-green-deal_lv. [Accessed: 20-Feb-2023].
- Council of the European Union, “Common agricultural policy.” [Online]. Available: https://www.consilium.europa.eu/lv/policies/cap-introduction/. [Accessed: 20-Feb-2023].
- Council of the European Union, “Common Agricultural Policy 2023-2027 for the year - Consilium.” [Online]. Available: https://www.consilium.europa.eu/lv/policies/cap-introduction/cap-future-2020-common-agricultural-policy-2023-2027/. [Accessed: 20-Feb-2023].
- Development The Ministry of Environmental Protection and Regional, “Latvia’s strategy for achieving climate neutrality by 2050,” 2019.
- European Comission, “Farm to Fork Strategy.” [Online]. Available: https://food.ec.europa.eu/horizontal-topics/farm-fork-strategy_lv. [Accessed: 20-Feb-2023].
- European Commission, “Biodiversity strategy for 2030.” [Online]. Available: https://environment.ec.europa.eu/strategy/biodiversity-strategy-2030_en. [Accessed: 20-Feb-2023].
- Bumbiere, K.; Sanchez, F.A.D.; Pubule, J.; Blumberga, D. Development and Assessment of Carbon Farming Solutions. Sci. J. Riga Tech. Univ. Environ. Clim. Technol. 2022, 26, 898–916. [Google Scholar] [CrossRef]
- Order of the Cabinet of Ministers no. 46, “About Latvia’s National Energy and Climate Plan 2021-2030,” 2020. [Online]. Available: https://likumi.lv/ta/id/312423-par-latvijas-nacionalo-energetikas-un-klimata-planu-20212030-gadam. [Accessed: 20-Feb-2023].
- Dhamodharan, K.; Konduru, T.; Kannan, M.; Malyan, S.K. Techno-economic feasibility and hurdles on agricultural waste management. 2022. [Google Scholar] [CrossRef]
- Costantino, A.; Fabrizio, E.; Ghiggini, A.; Bariani, M. Climate control in broiler houses: A thermal model for the calculation of the energy use and indoor environmental conditions. Energy Build. 2018, 169, 110–126. [Google Scholar] [CrossRef]
- Yeo, U.-H.; Lee, I.-B.; Kim, R.-W.; Lee, S.-Y.; Kim, J.-G. Computational fluid dynamics evaluation of pig house ventilation systems for improving the internal rearing environment. Biosyst. Eng. 2019, 186, 259–278. [Google Scholar] [CrossRef]
- Neethirajan, S. The role of sensors, big data and machine learning in modern animal farming. Sens. Bio-Sens. Res. 2020, 29, 100367. [Google Scholar] [CrossRef]
- M. R. Mondaca and N. B. Cook, “Modeled construction and operating costs of different ventilation systems for lactating dairy cows - ScienceDirect.” [Online]. Available: https://www-sciencedirect-com.resursi.rtu.lv/science/article/pii/S002203021830972X#bib17. [Accessed: 02-Feb-2021].
- Zhao, Y.; Shepherd, T.A.; Li, H.; Xin, H. Environmental assessment of three egg production systems–Part I: Monitoring system and indoor air quality. Poult. Sci. 2015, 94, 518–533. [Google Scholar] [CrossRef]
- Firfiris, V.; Martzopoulou, A.; Kotsopoulos, T. Passive cooling systems in livestock buildings towards energy saving: A critical review. Energy Build. 2019, 202. [Google Scholar] [CrossRef]
- Galama, P.; Ouweltjes, W.; Endres, M.; Sprecher, J.; Leso, L.; Kuipers, A.; Klopčič, M. Symposium review: Future of housing for dairy cattle. J. Dairy Sci. 2020, 103, 5759–5772. [Google Scholar] [CrossRef]
- West, J. Effects of Heat-Stress on Production in Dairy Cattle. J. Dairy Sci. 2003, 86, 2131–2144. [Google Scholar] [CrossRef]
- A. Gancone, K. A. Gancone, K. Bumbiere, J. Pubule, and D. Blumberga, “Sustainable biogas application in energy sector,” 2020 IEEE 61st Annu. Int. Sci. Conf. Power Electr. Eng. Riga Tech. Univ. RTUCON 2020 - Proc., Nov. 2020. [CrossRef]
- E. Comission, “The Environmental Implementation Review 2019.”.
- Statistics | Eurostat.” [Online]. Available: https://ec.europa.eu/eurostat/databrowser/view/sdg_07_30/default/table?lang=en. [Accessed: 20-Feb-2023].
- The Ministry of Agriculture of Republic of Latvia, “Agriculture in Latvia 2021,” 2022.
- O. Ieva Leimane, Agnese Krieviņa, Sallija Ceriņa, Alberts Auziņš, Pēteris Lakovskis, Silvija Dreijere, Ingūna Gulbe, “Developing a strategy for a sustainable and multifunctional dairy sector in Latvia,” 2021.
- FAOSTAT Database, “Crops and Livestock products.” [Online]. Available: https://www.fao.org/faostat/en/#data/QCL. [Accessed: 03-Apr-2023].
- C. S. B. of Latvia, “Average milk yield from one cow, kg - Time period.” [Online]. Available: https://data.stat.gov.lv/pxweb/lv/OSP_PUB/START__NOZ__LA__LAL/LAL070/table/tableViewLayout1/. [Accessed: 07-Oct-2022].
- Latvian Ministry of Agriculture, “Latvian Bioeconomy Strategy 2030,” 2018.
- Hassanat, F.; Benchaar, C. Methane emissions of manure from dairy cows fed red clover- or corn silage-based diets supplemented with linseed oil. J. Dairy Sci. 2019, 102, 11766–11776. [Google Scholar] [CrossRef]
- D. Maison, M. D. Maison, M. Marchlewska, K. Sekścińska, J. Rudzinska-Wojciechowska, and F. Łozowski, “You don’t have to be rich to save money: On the relationship between objective versus subjective financial situation and having savings,” PLoS One, vol. 14, no. 4, p. e0214396, Apr. 2019. [CrossRef]
- The Intergovernmental Panel on Climate Change, “Module 4. Agriculture. Revised 1996 IPCC Guidelines for National Greenhouse Gas Inventories: Workbook.”.
Figure 1.
Flow chart of the research development.
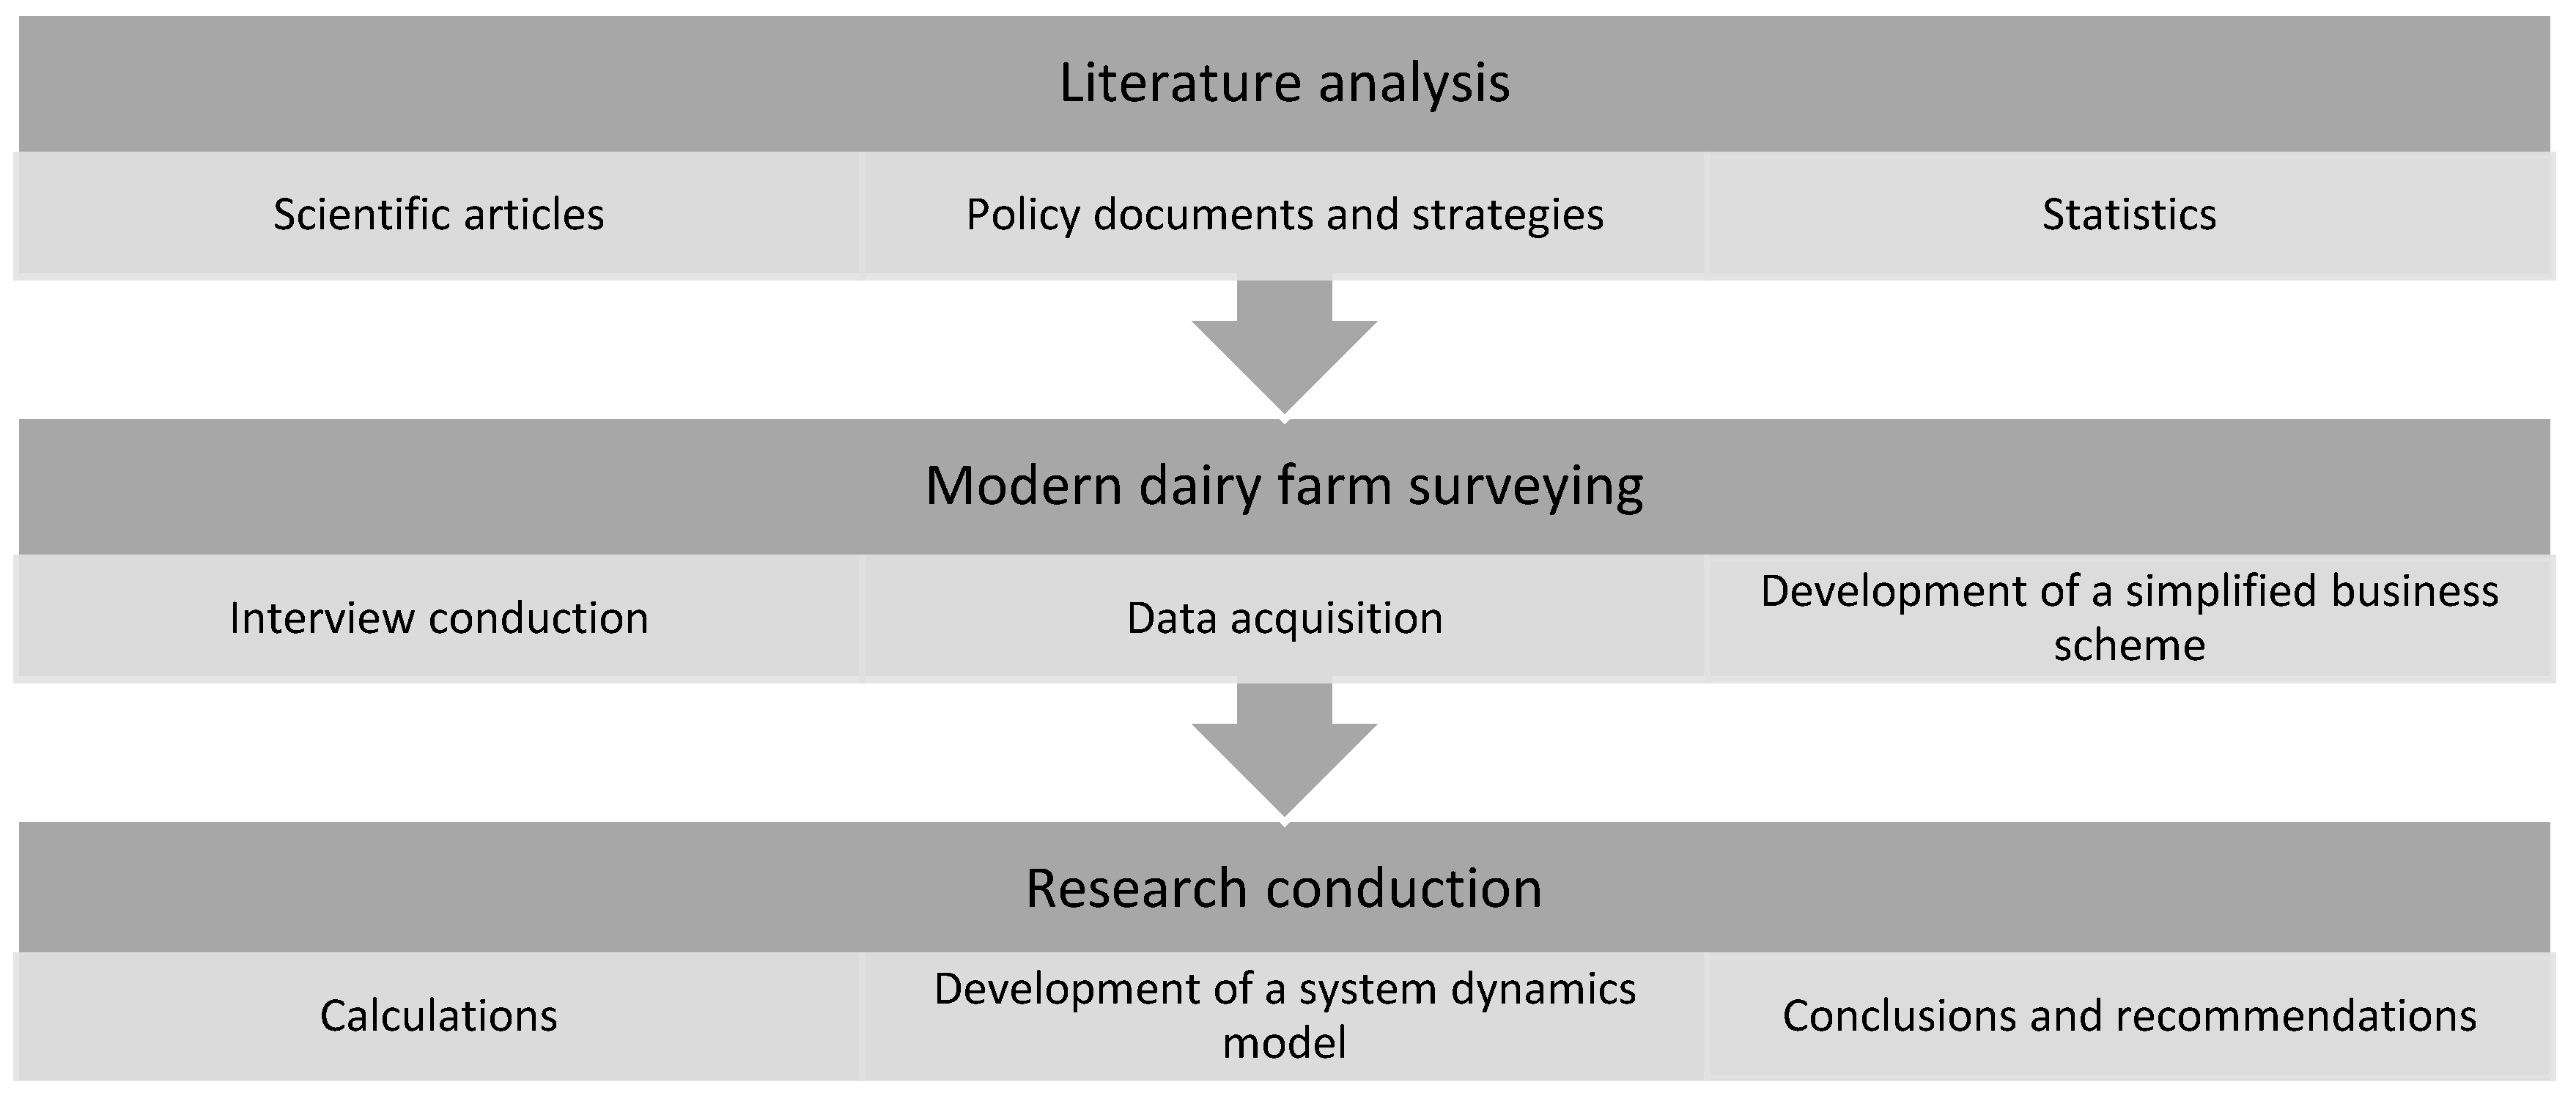
Figure 2.
Simplified operation scheme of the dairy farm.
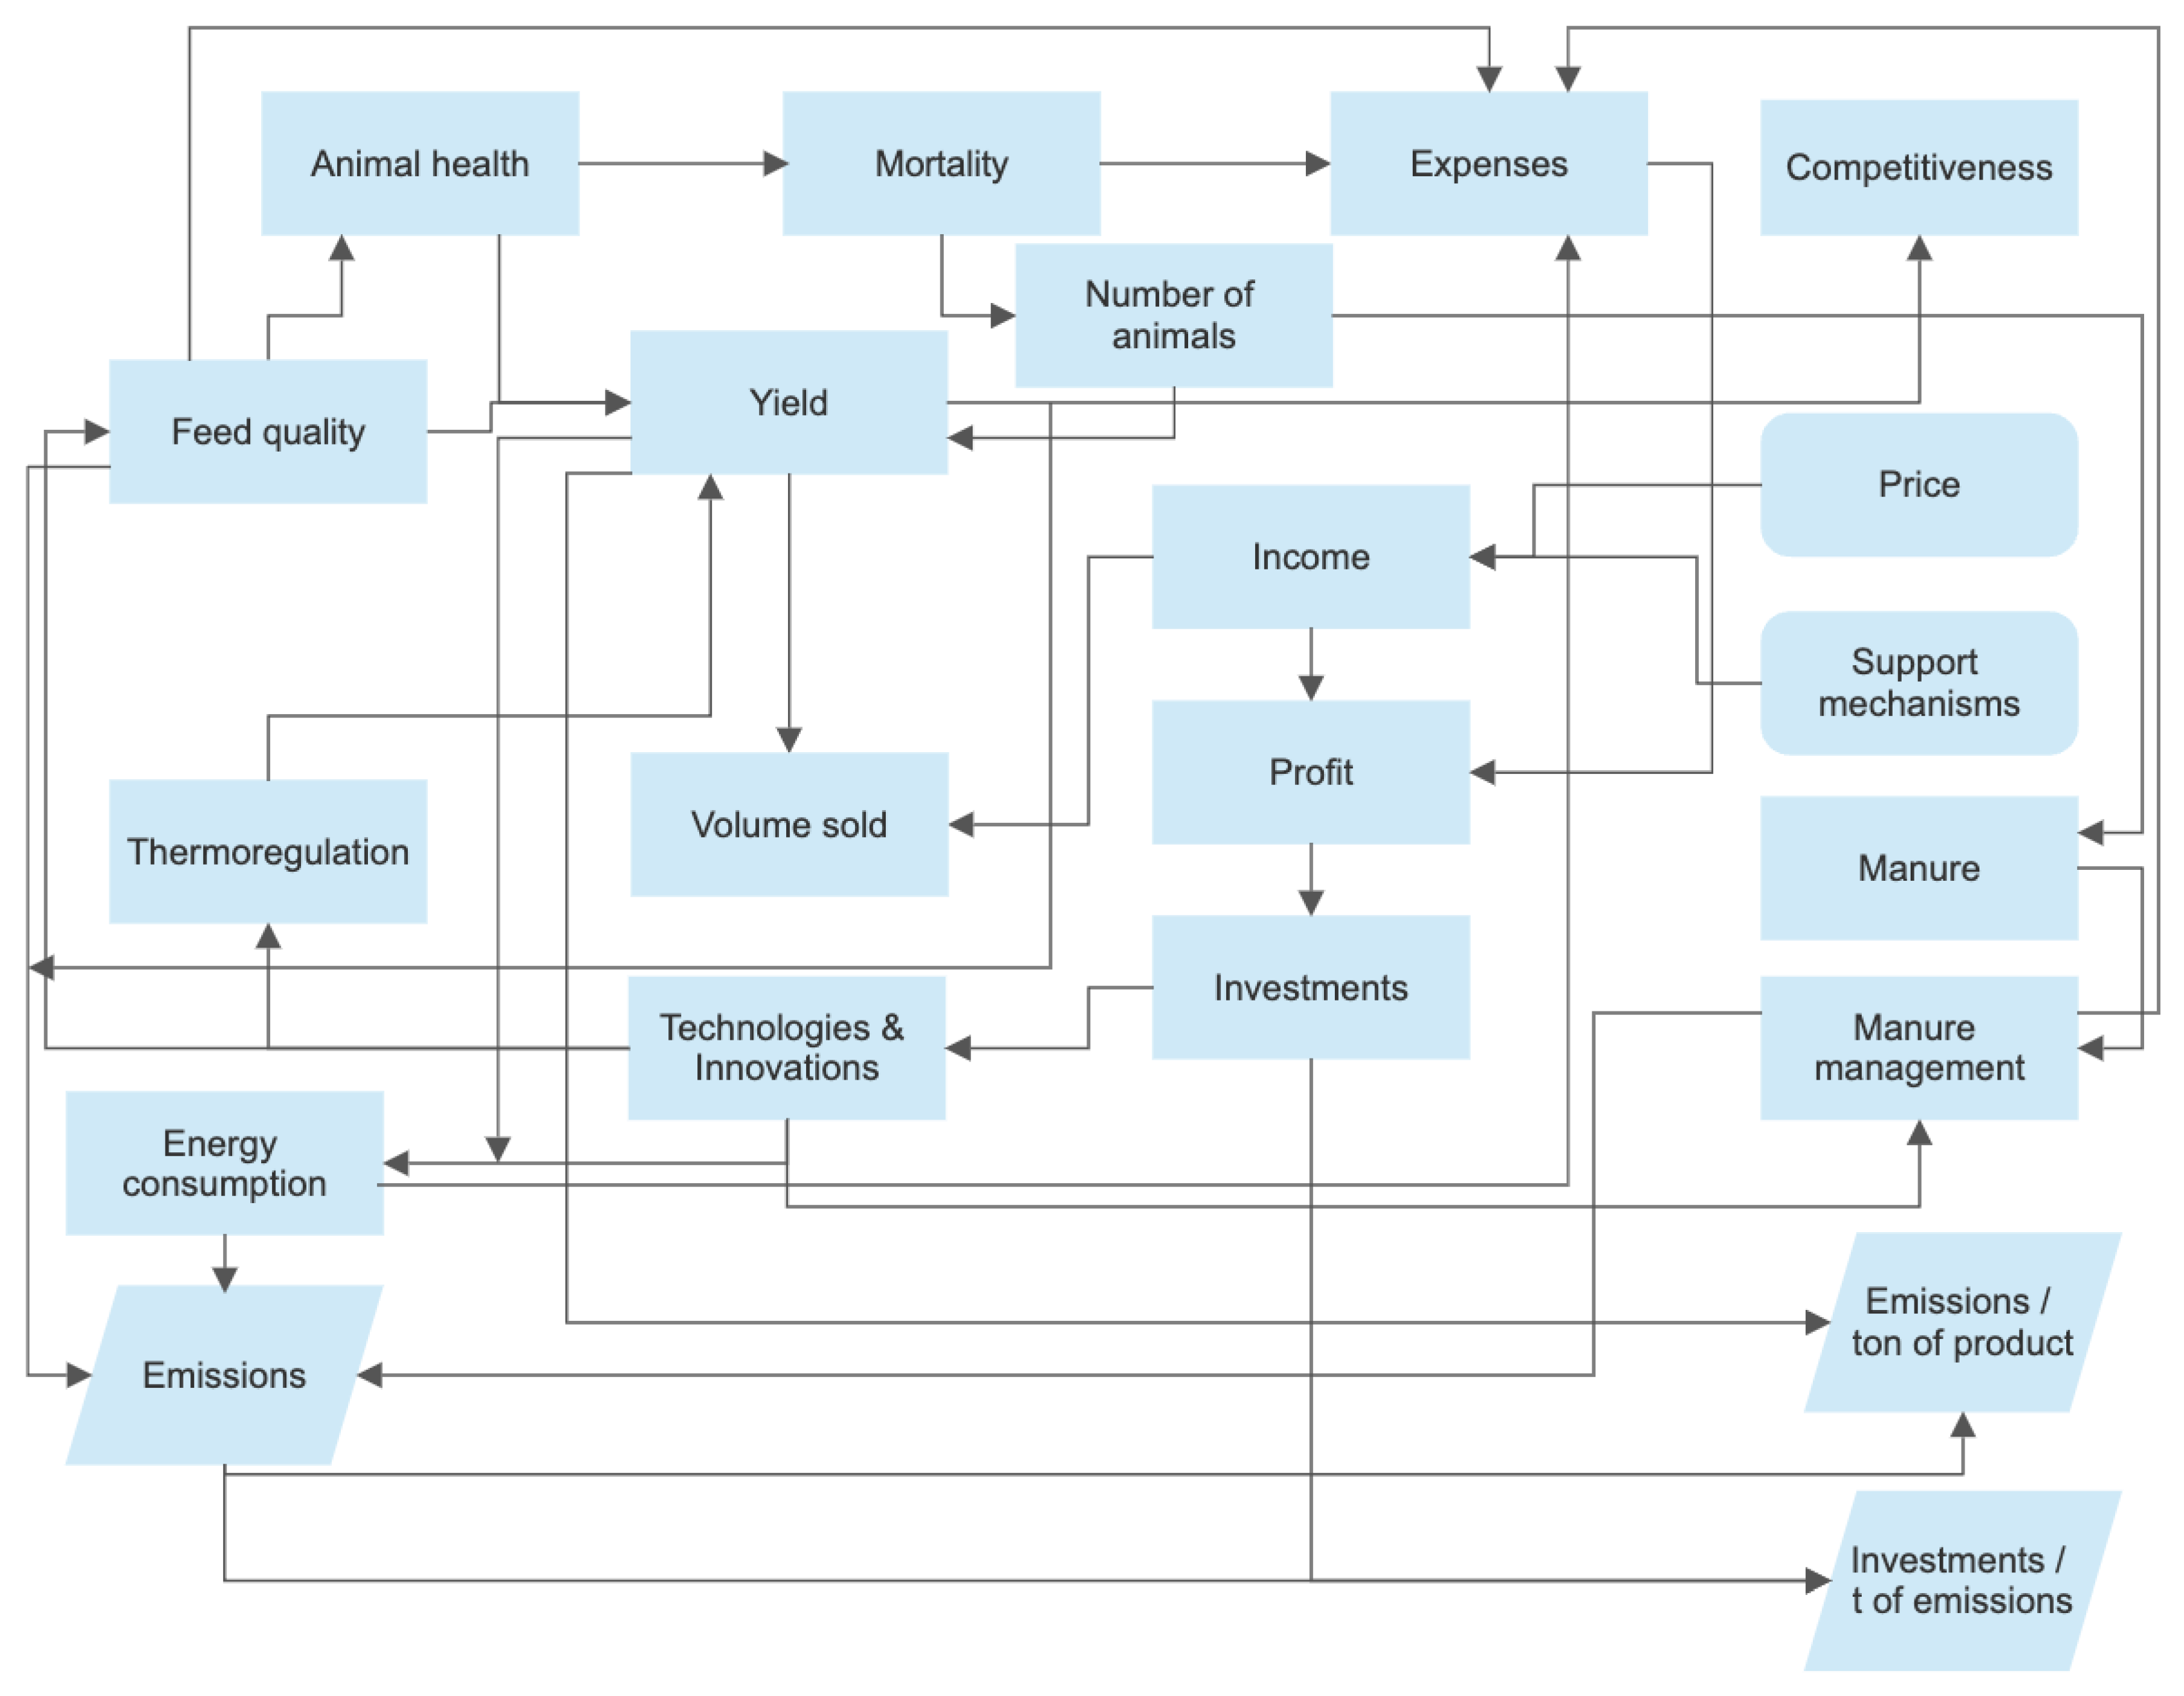
Figure 3.
Structure of the cow model.
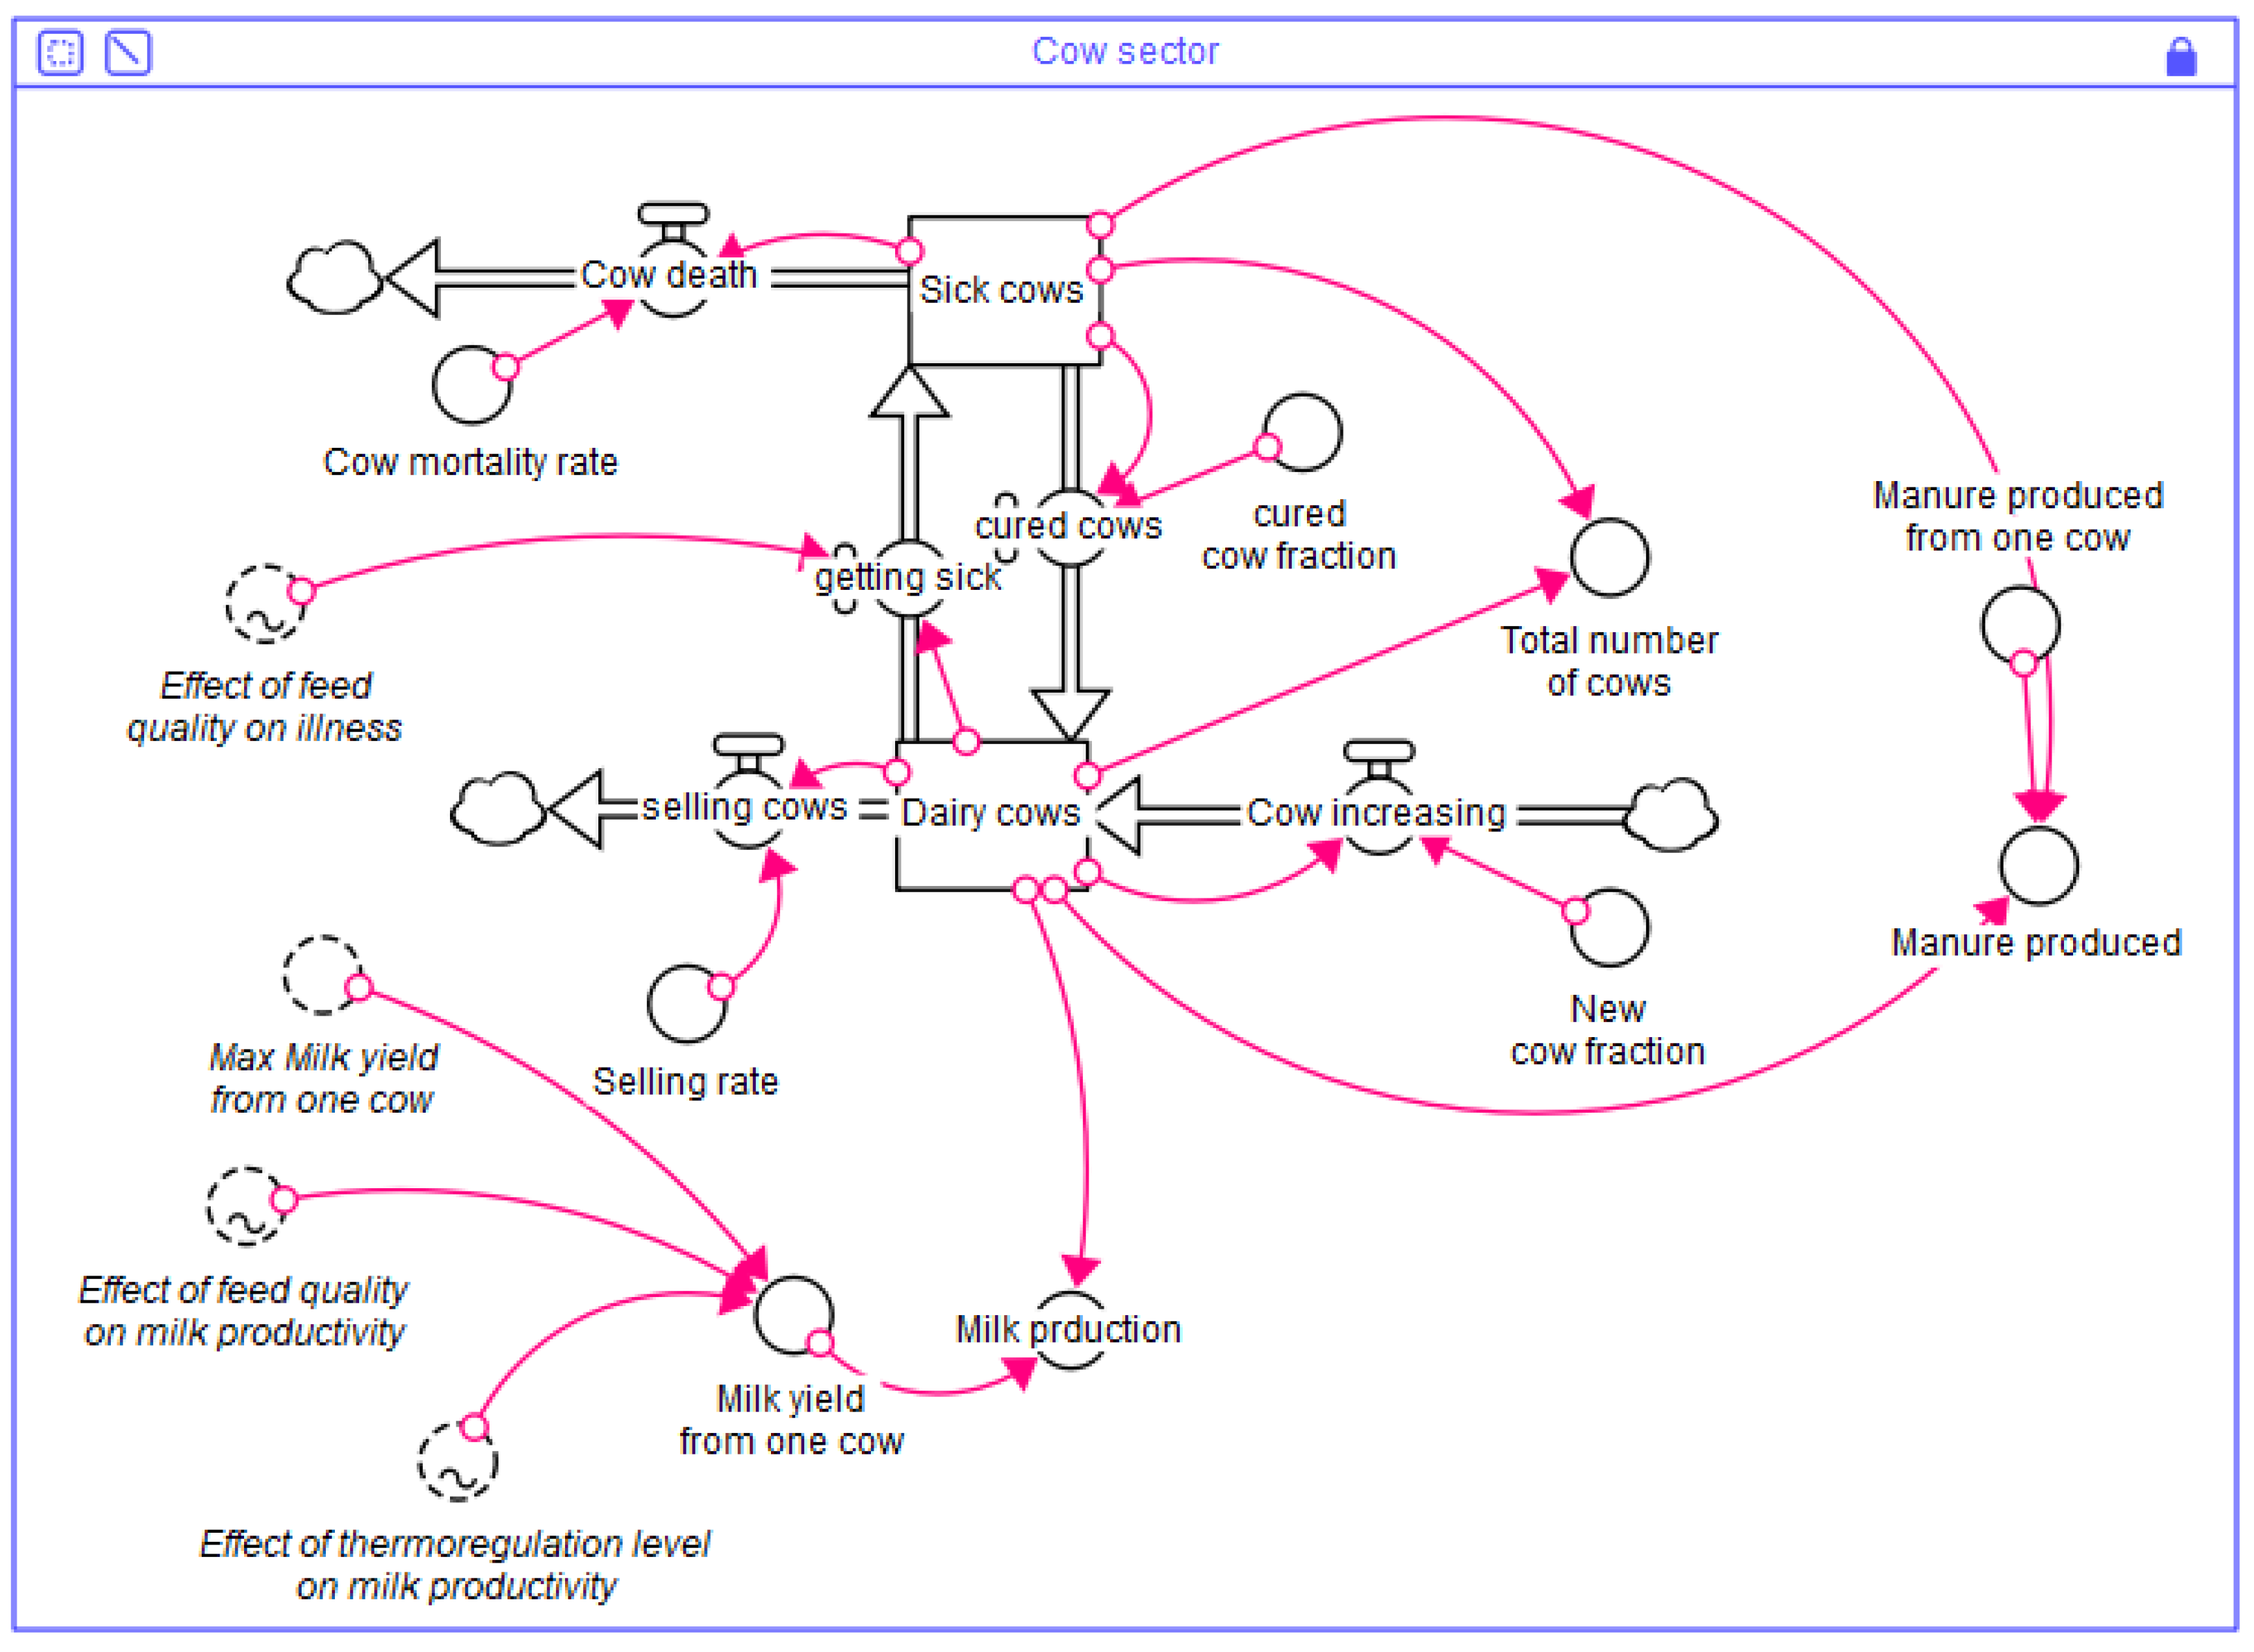
Figure 4.
Structure of the emission model.
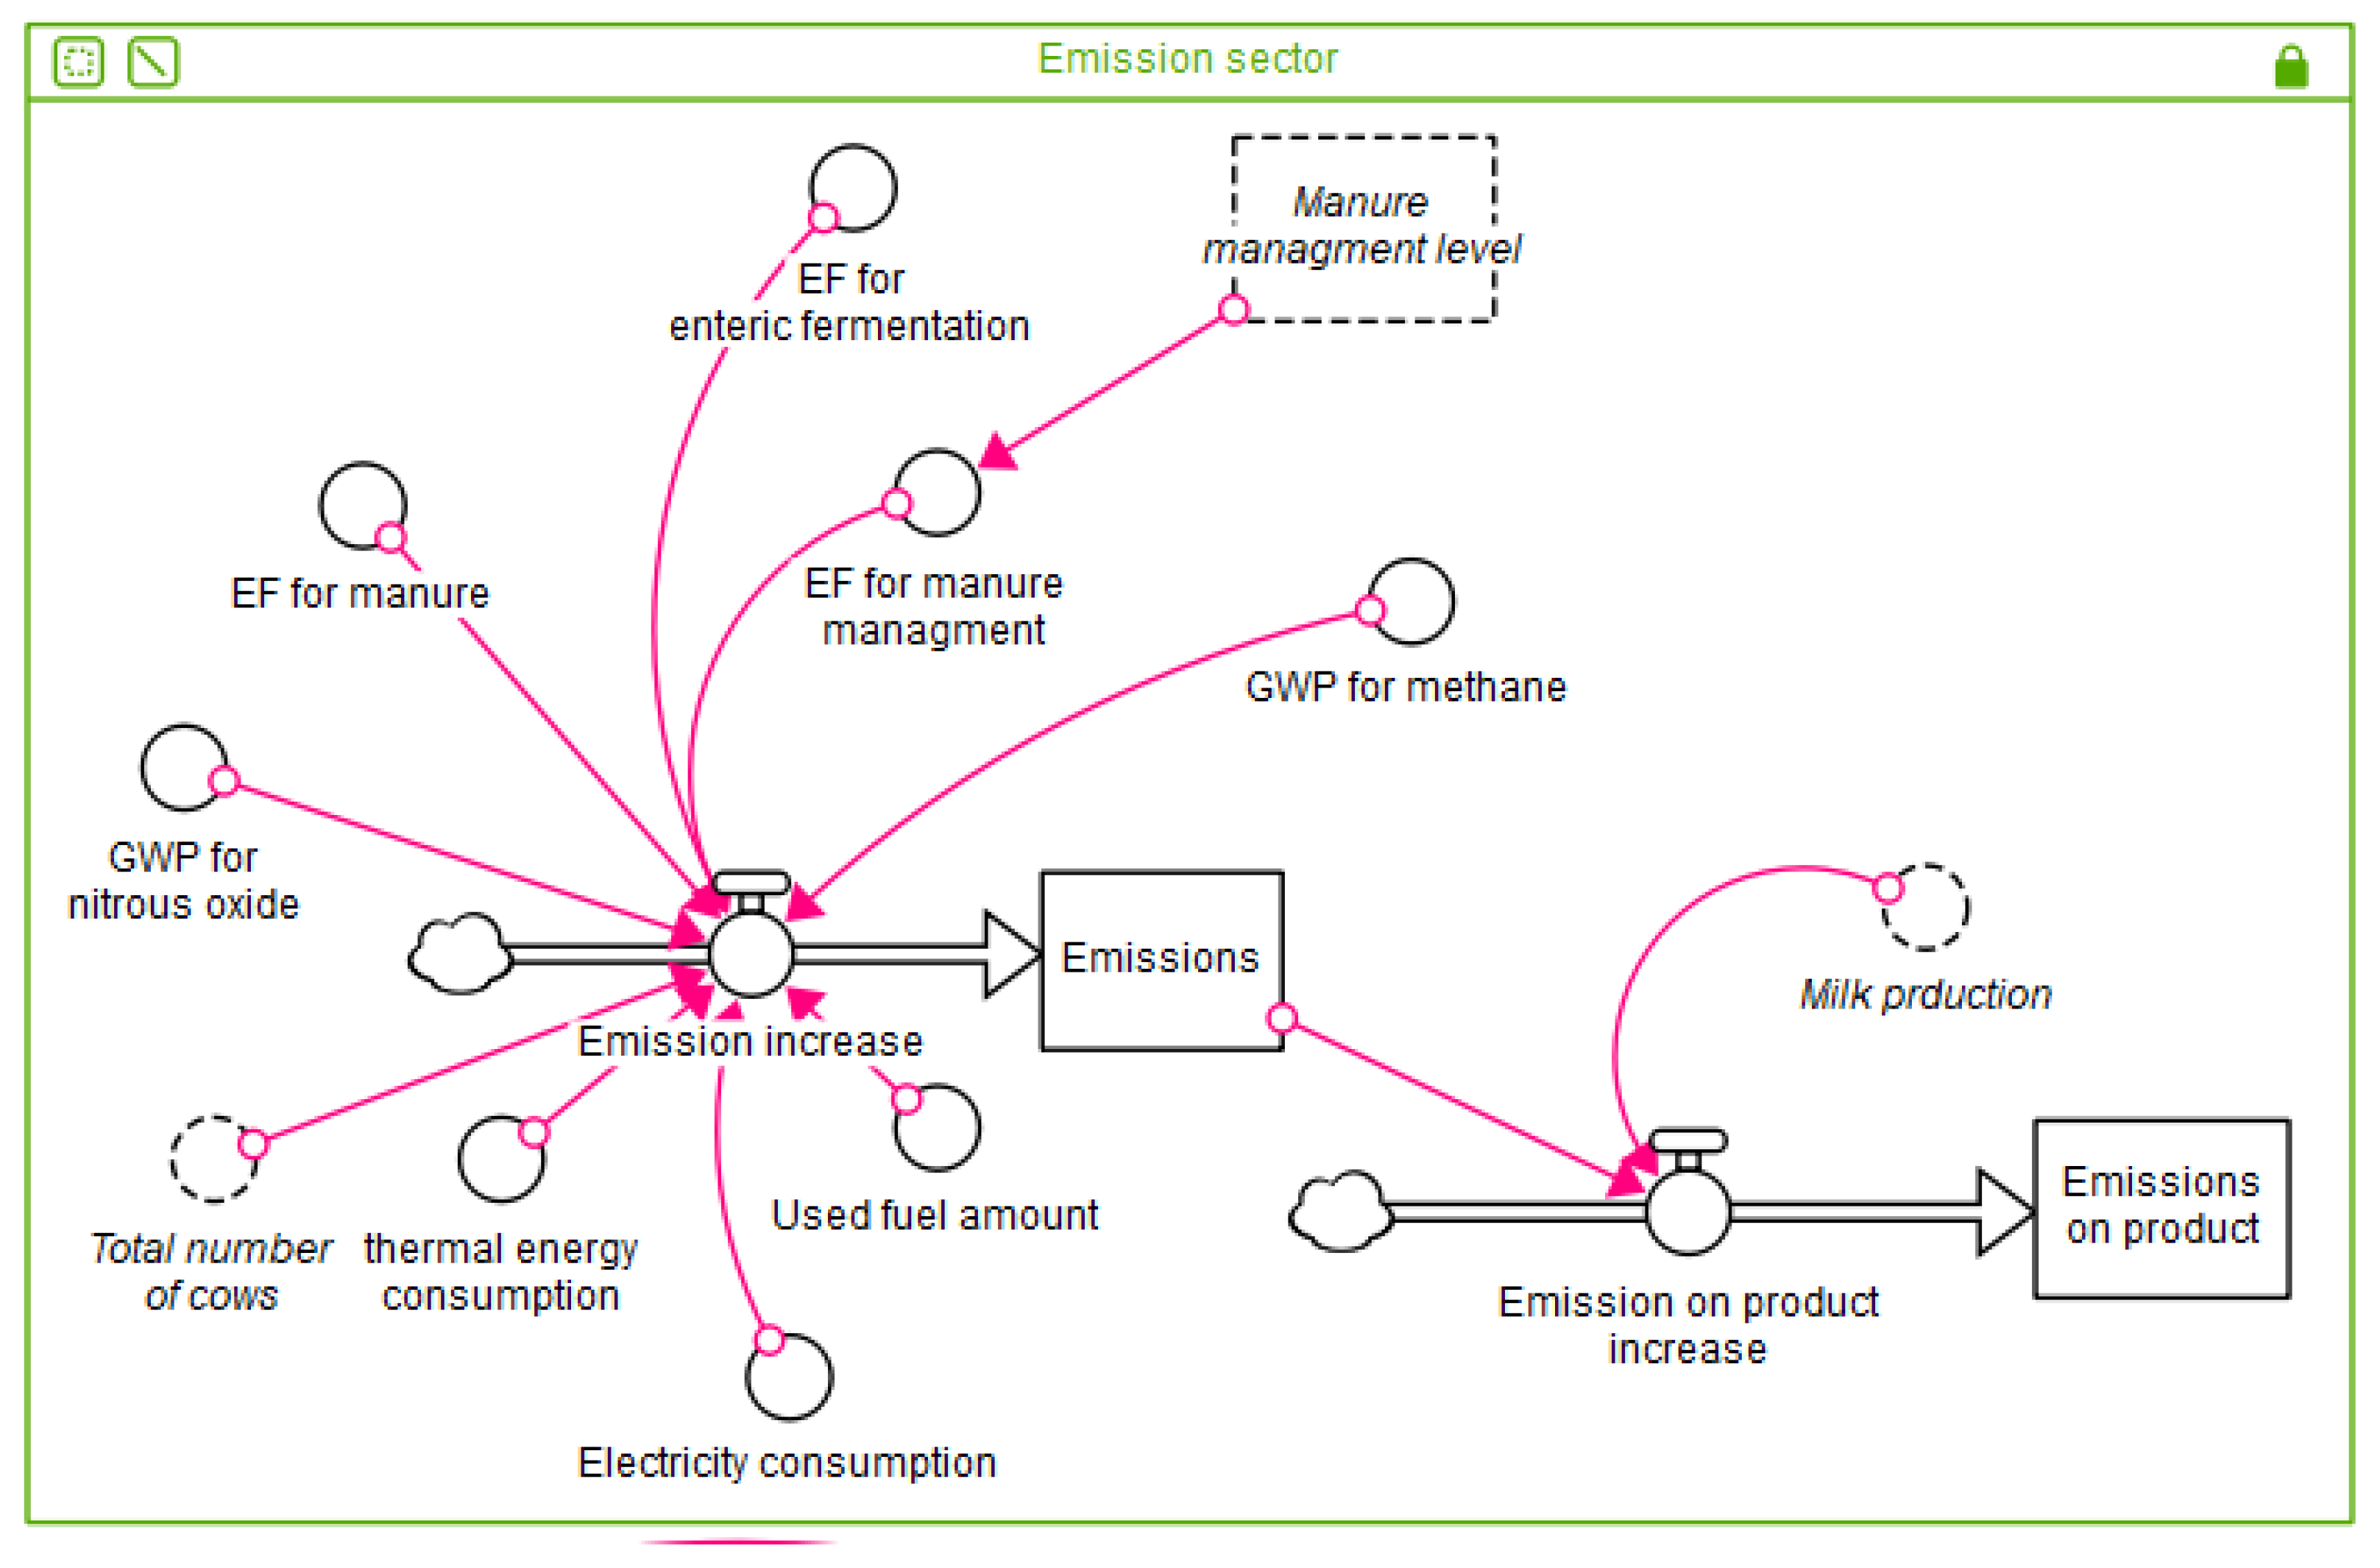
Figure 5.
Structure of the economic model.
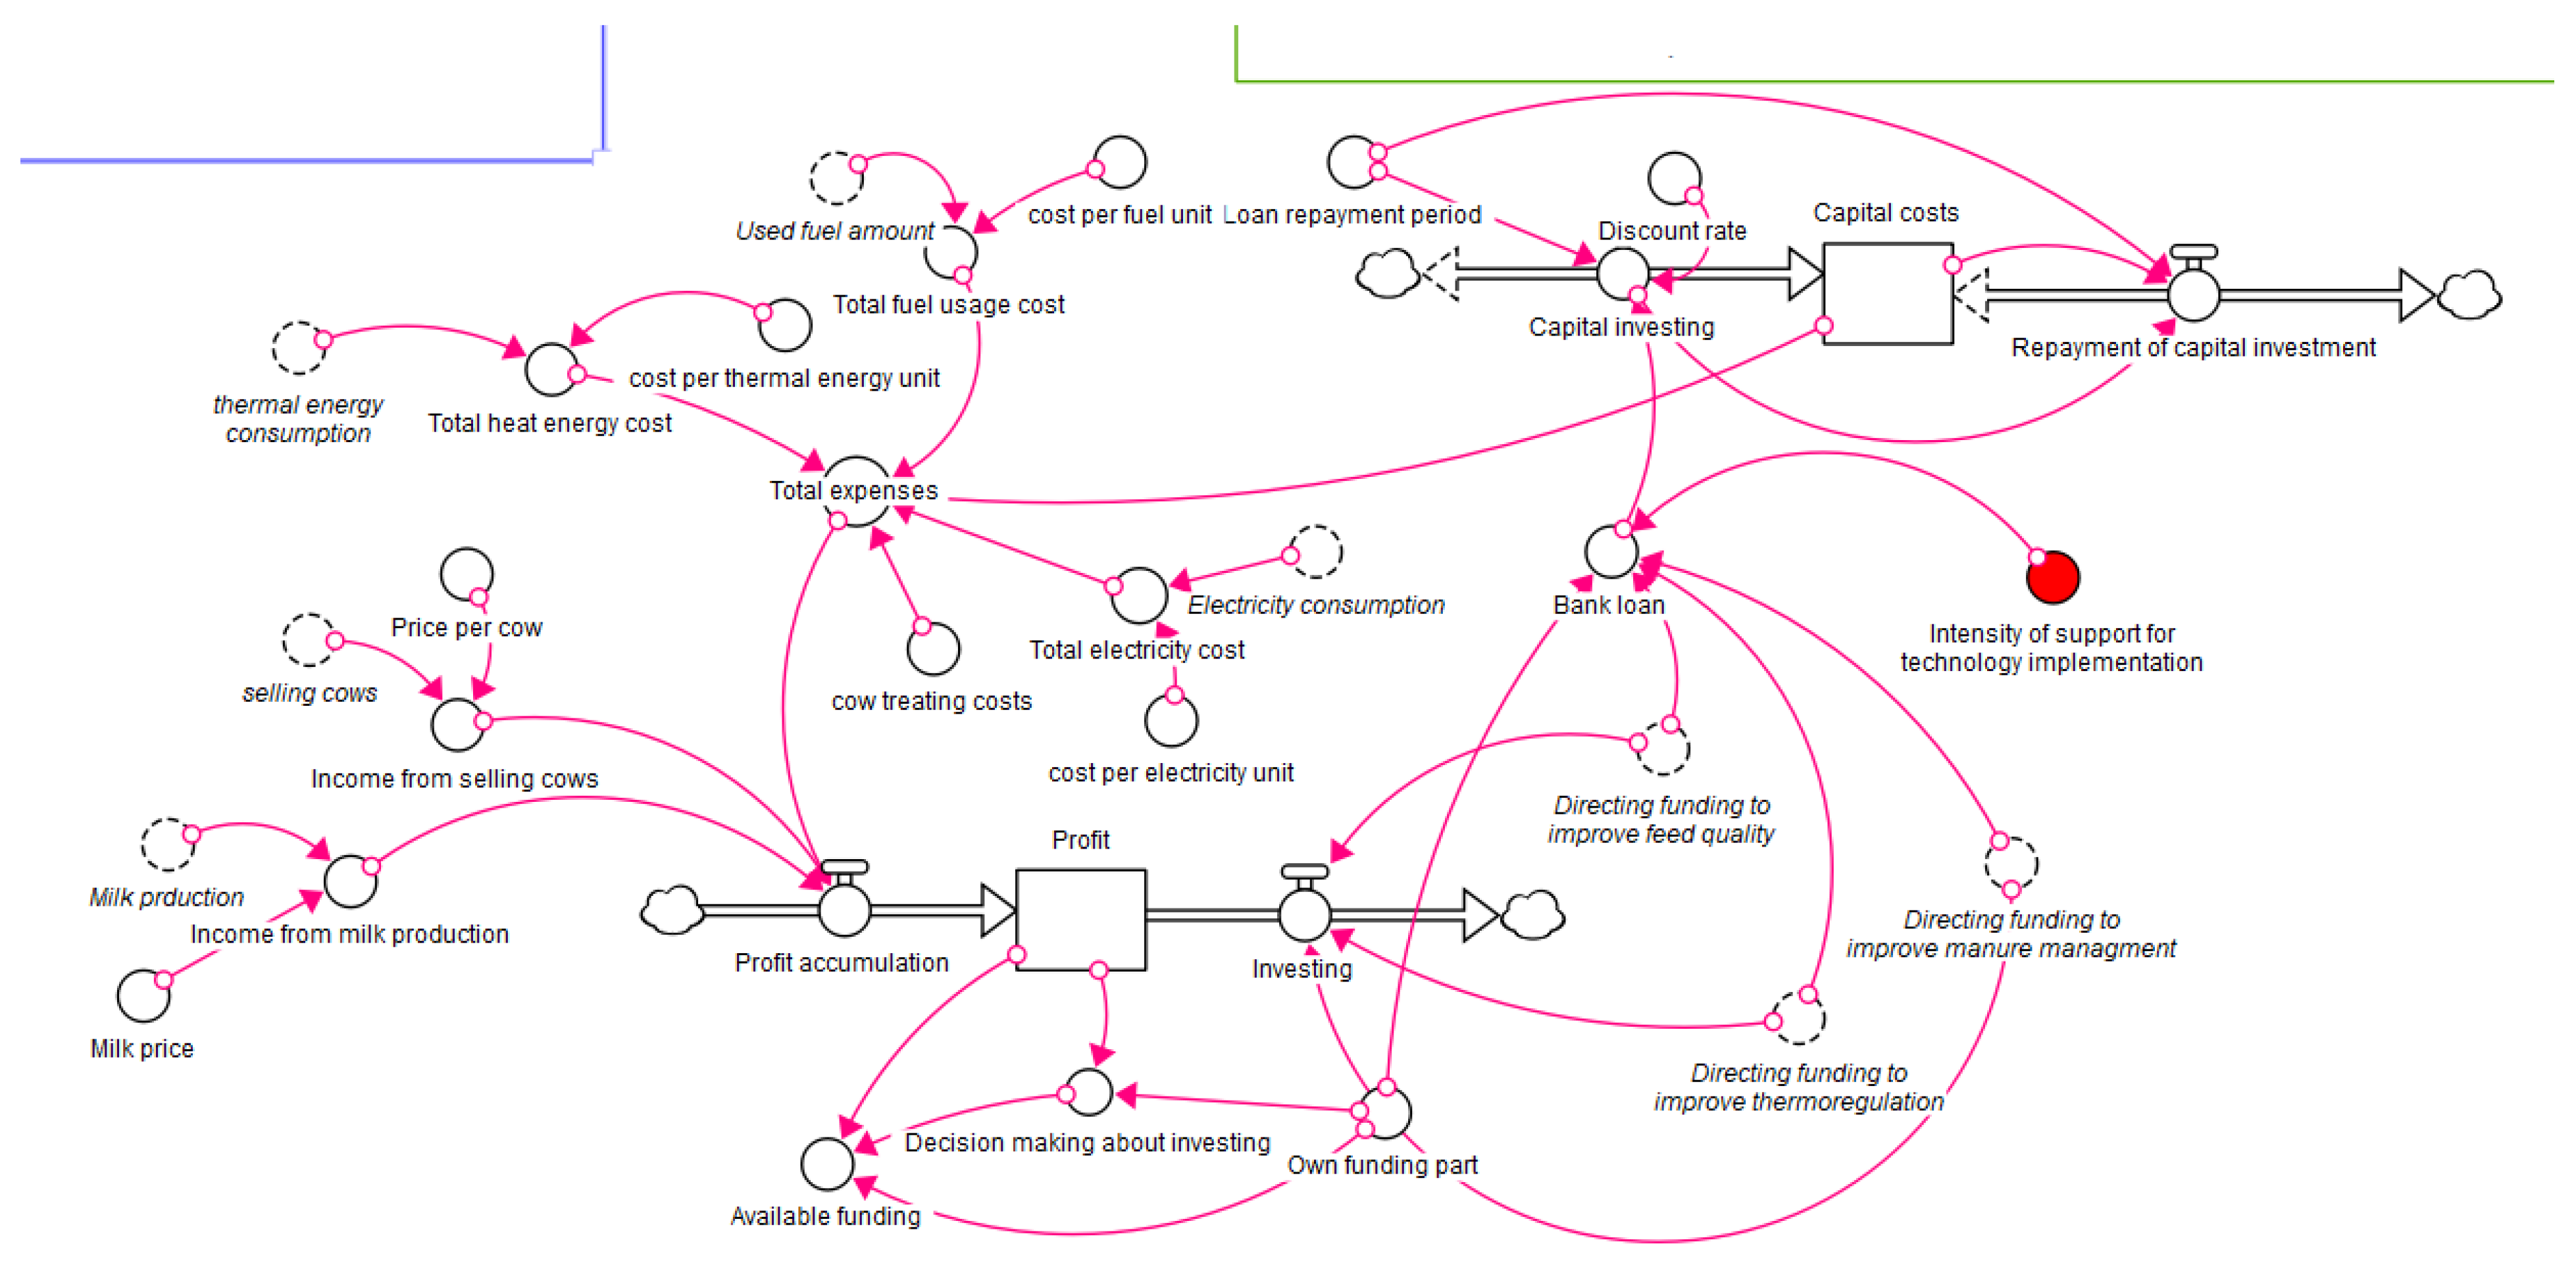
Figure 6.
Structure of the investment in manure management model.
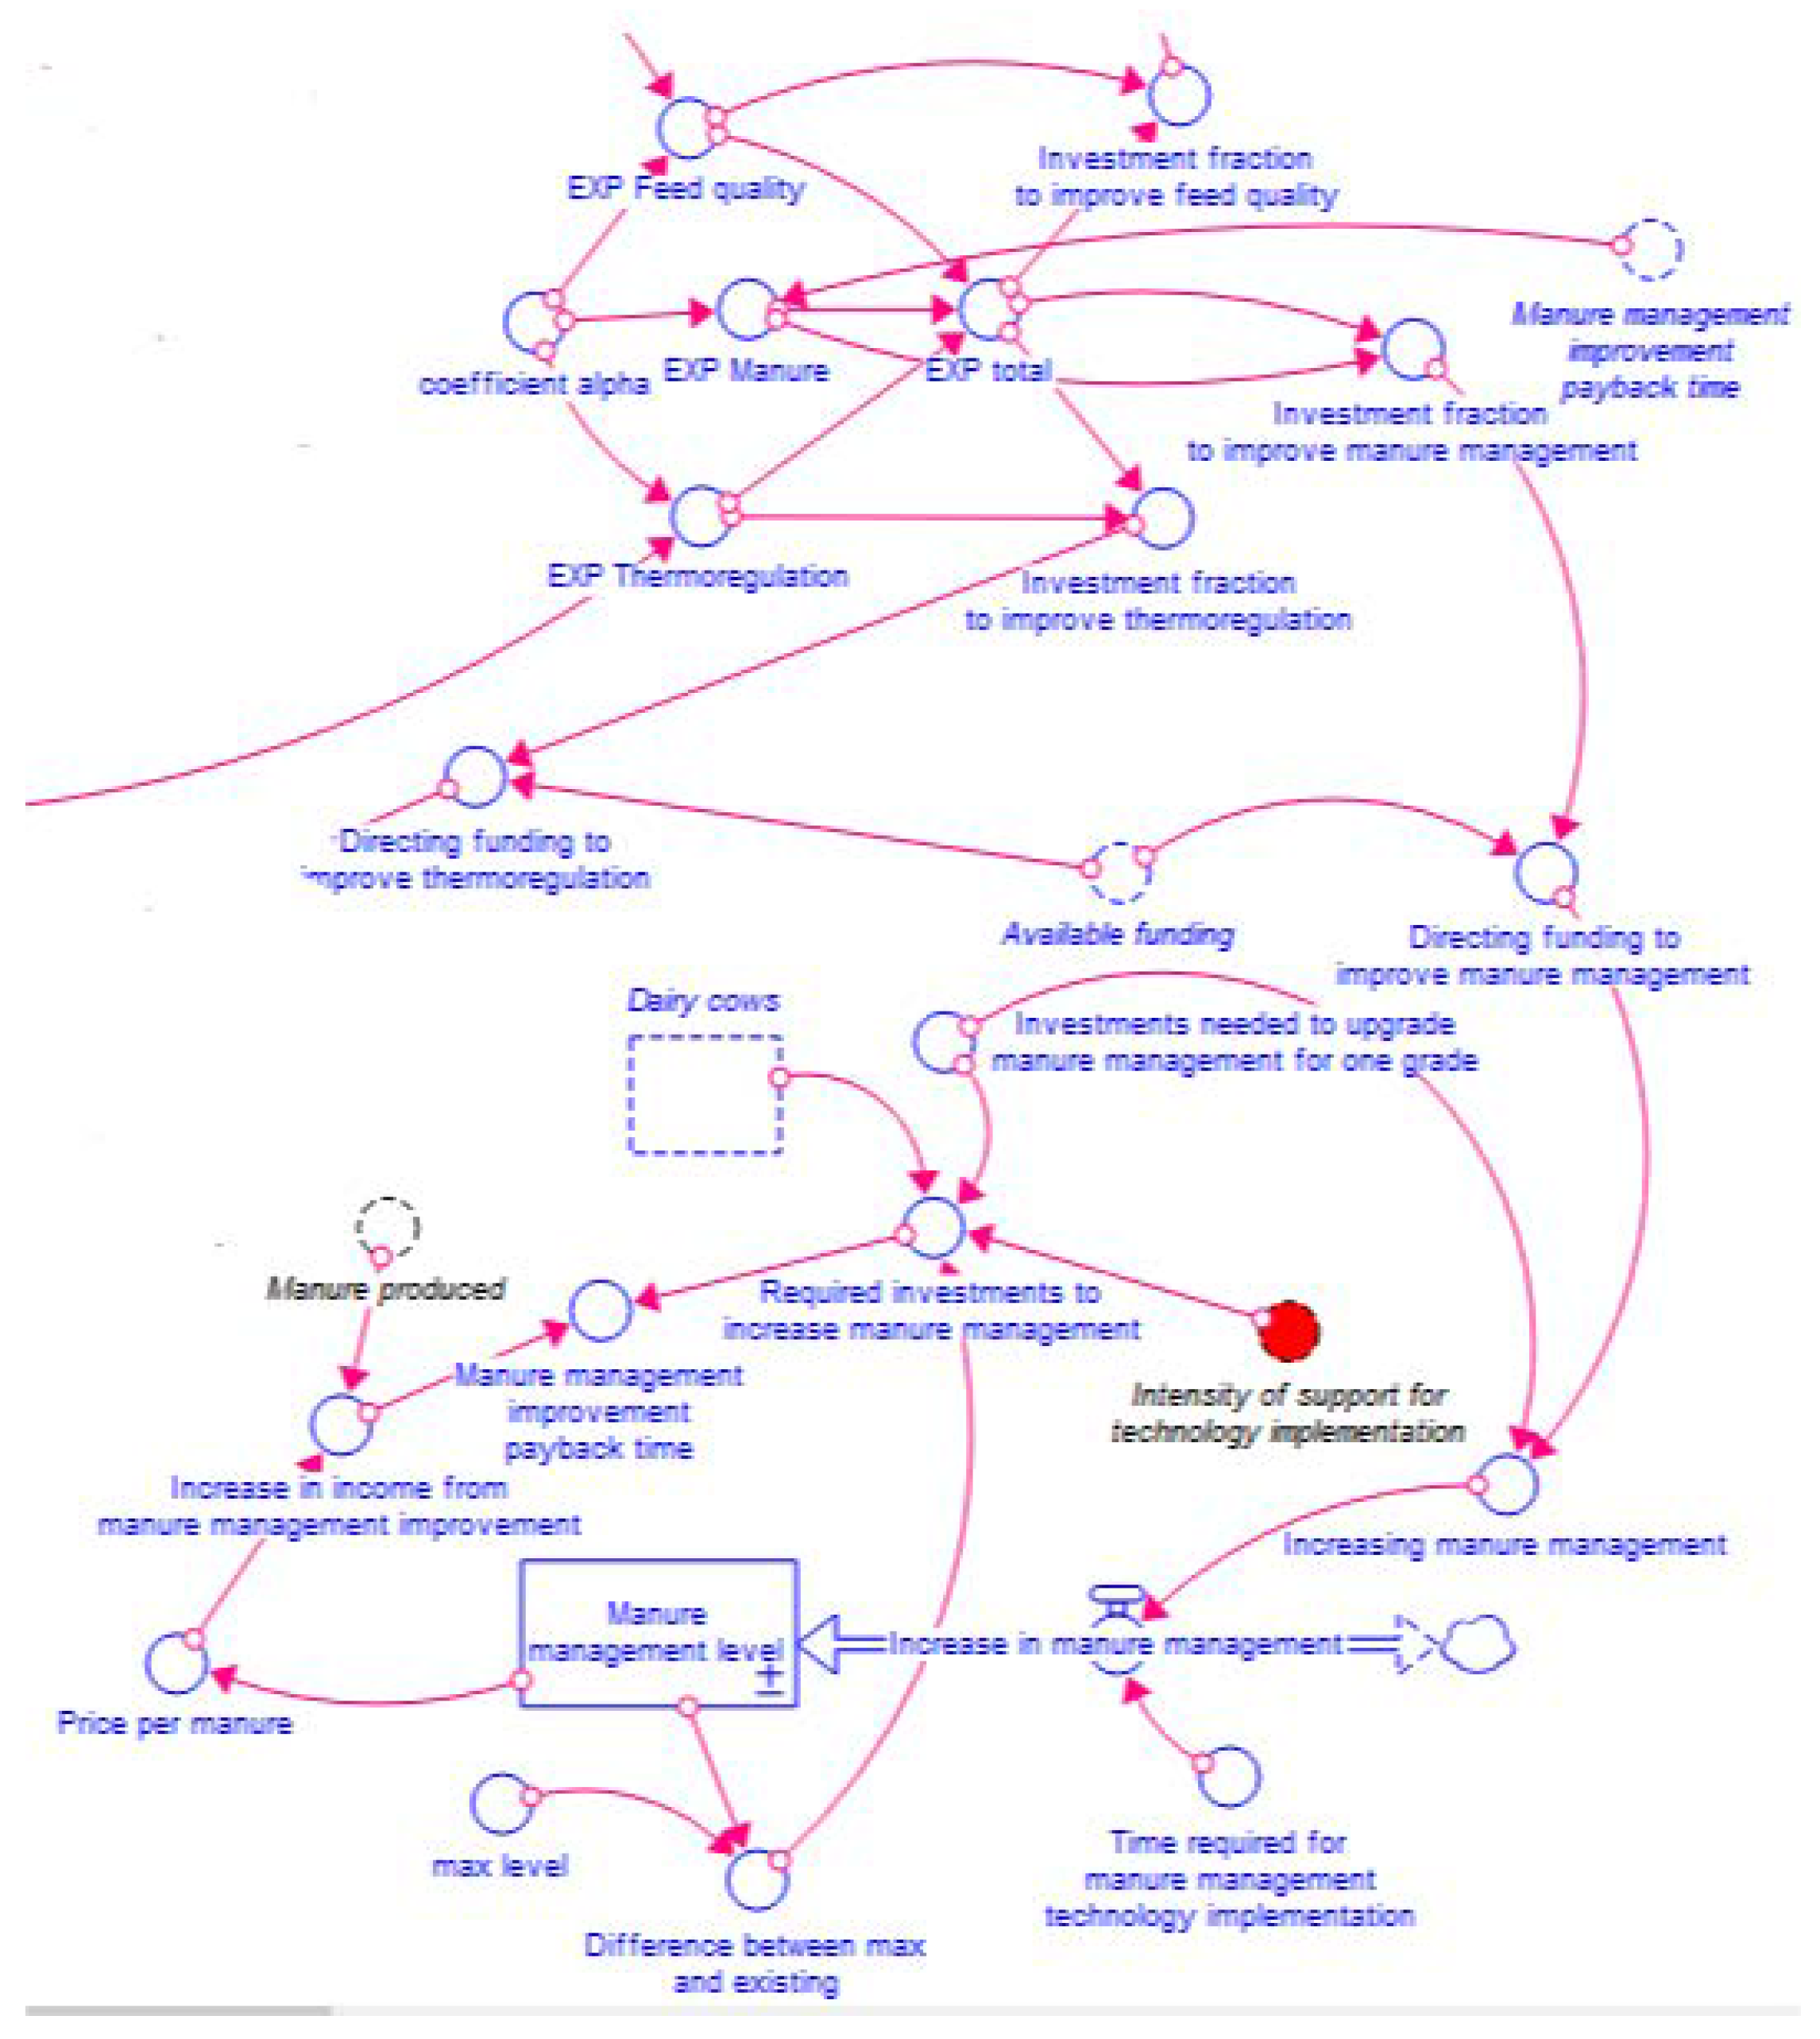
Figure 7.
Structure of the investment in feeding quality model.
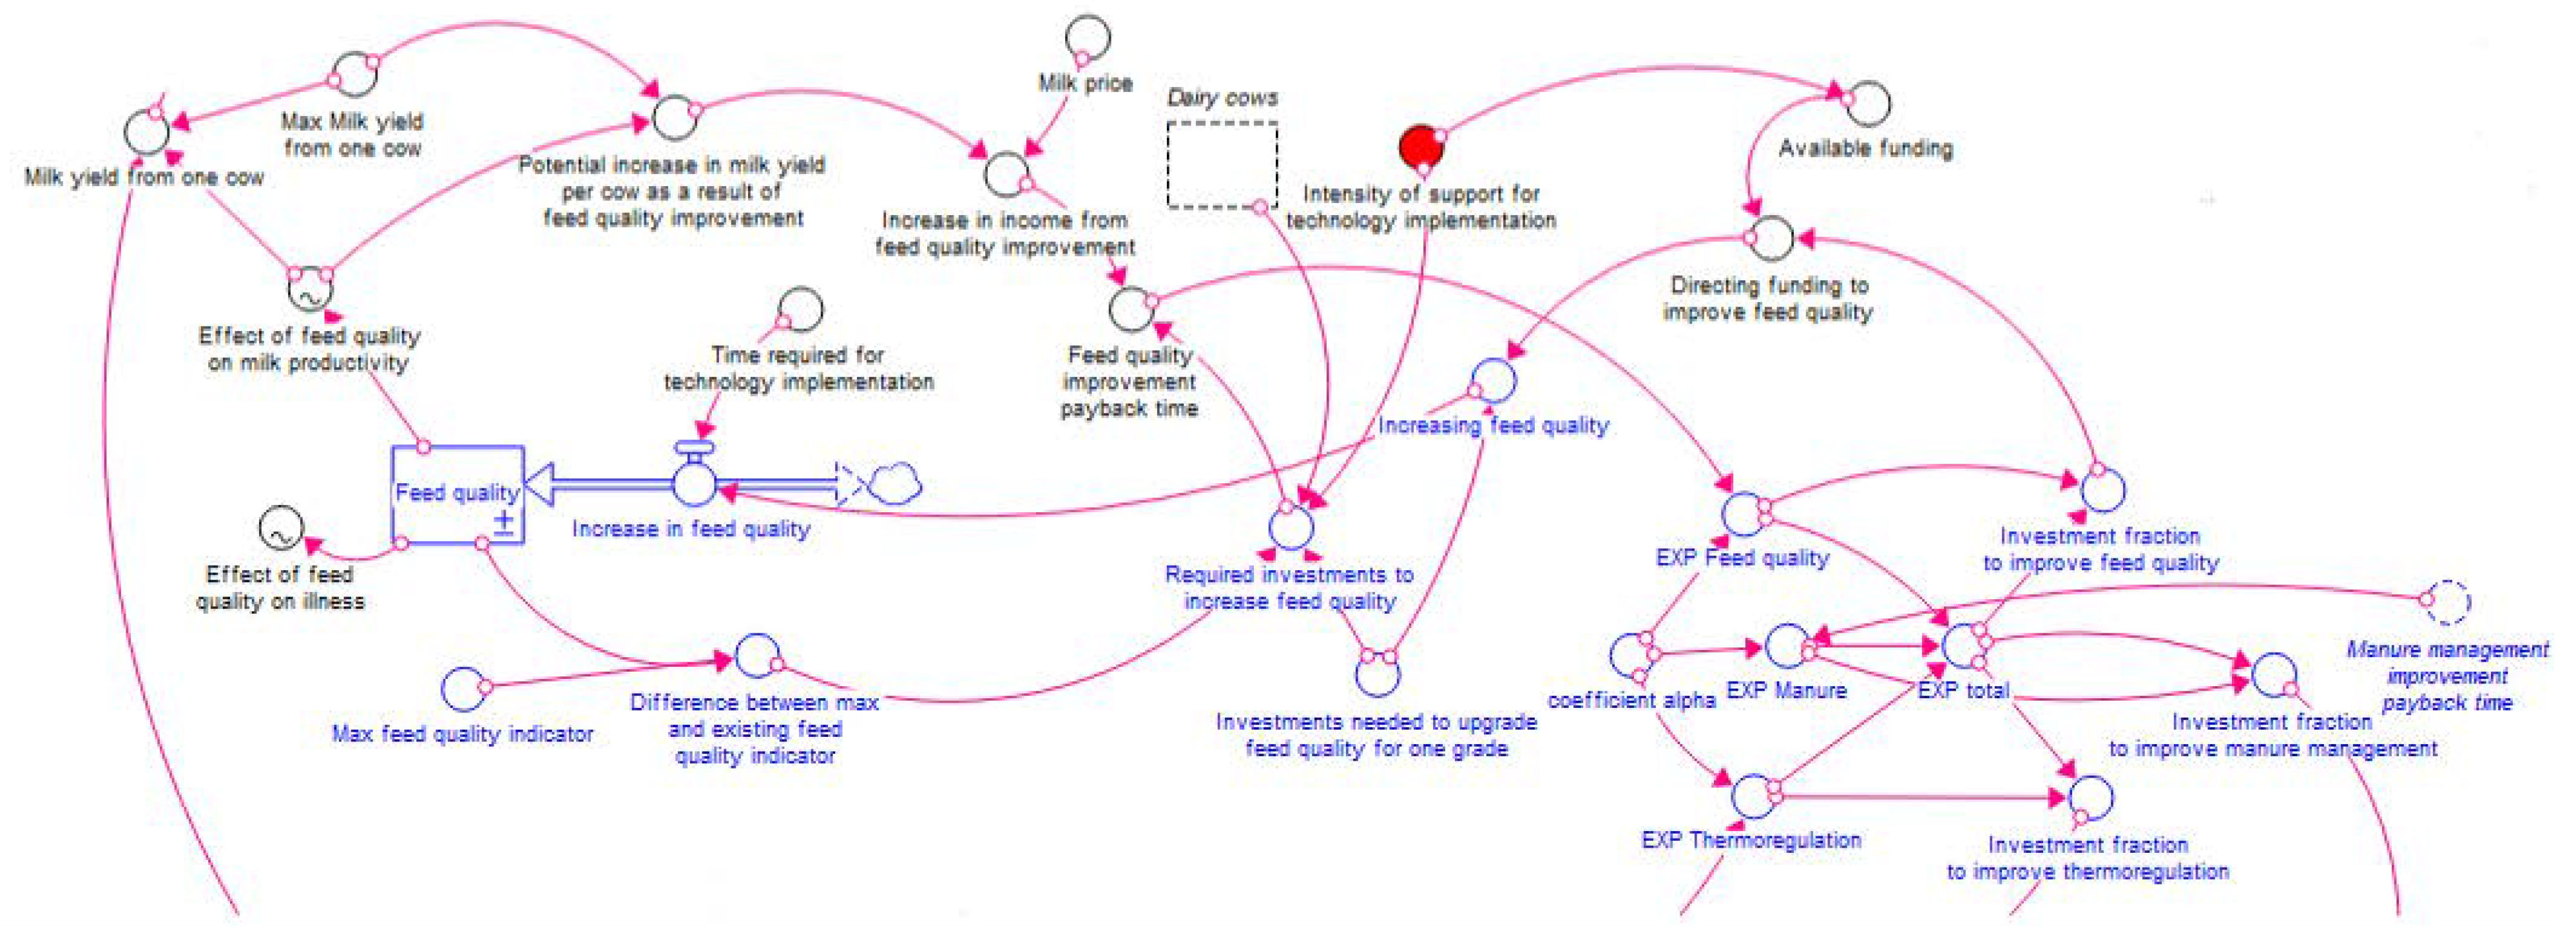
Figure 8.
Structure of the investment in thermoregulation model.
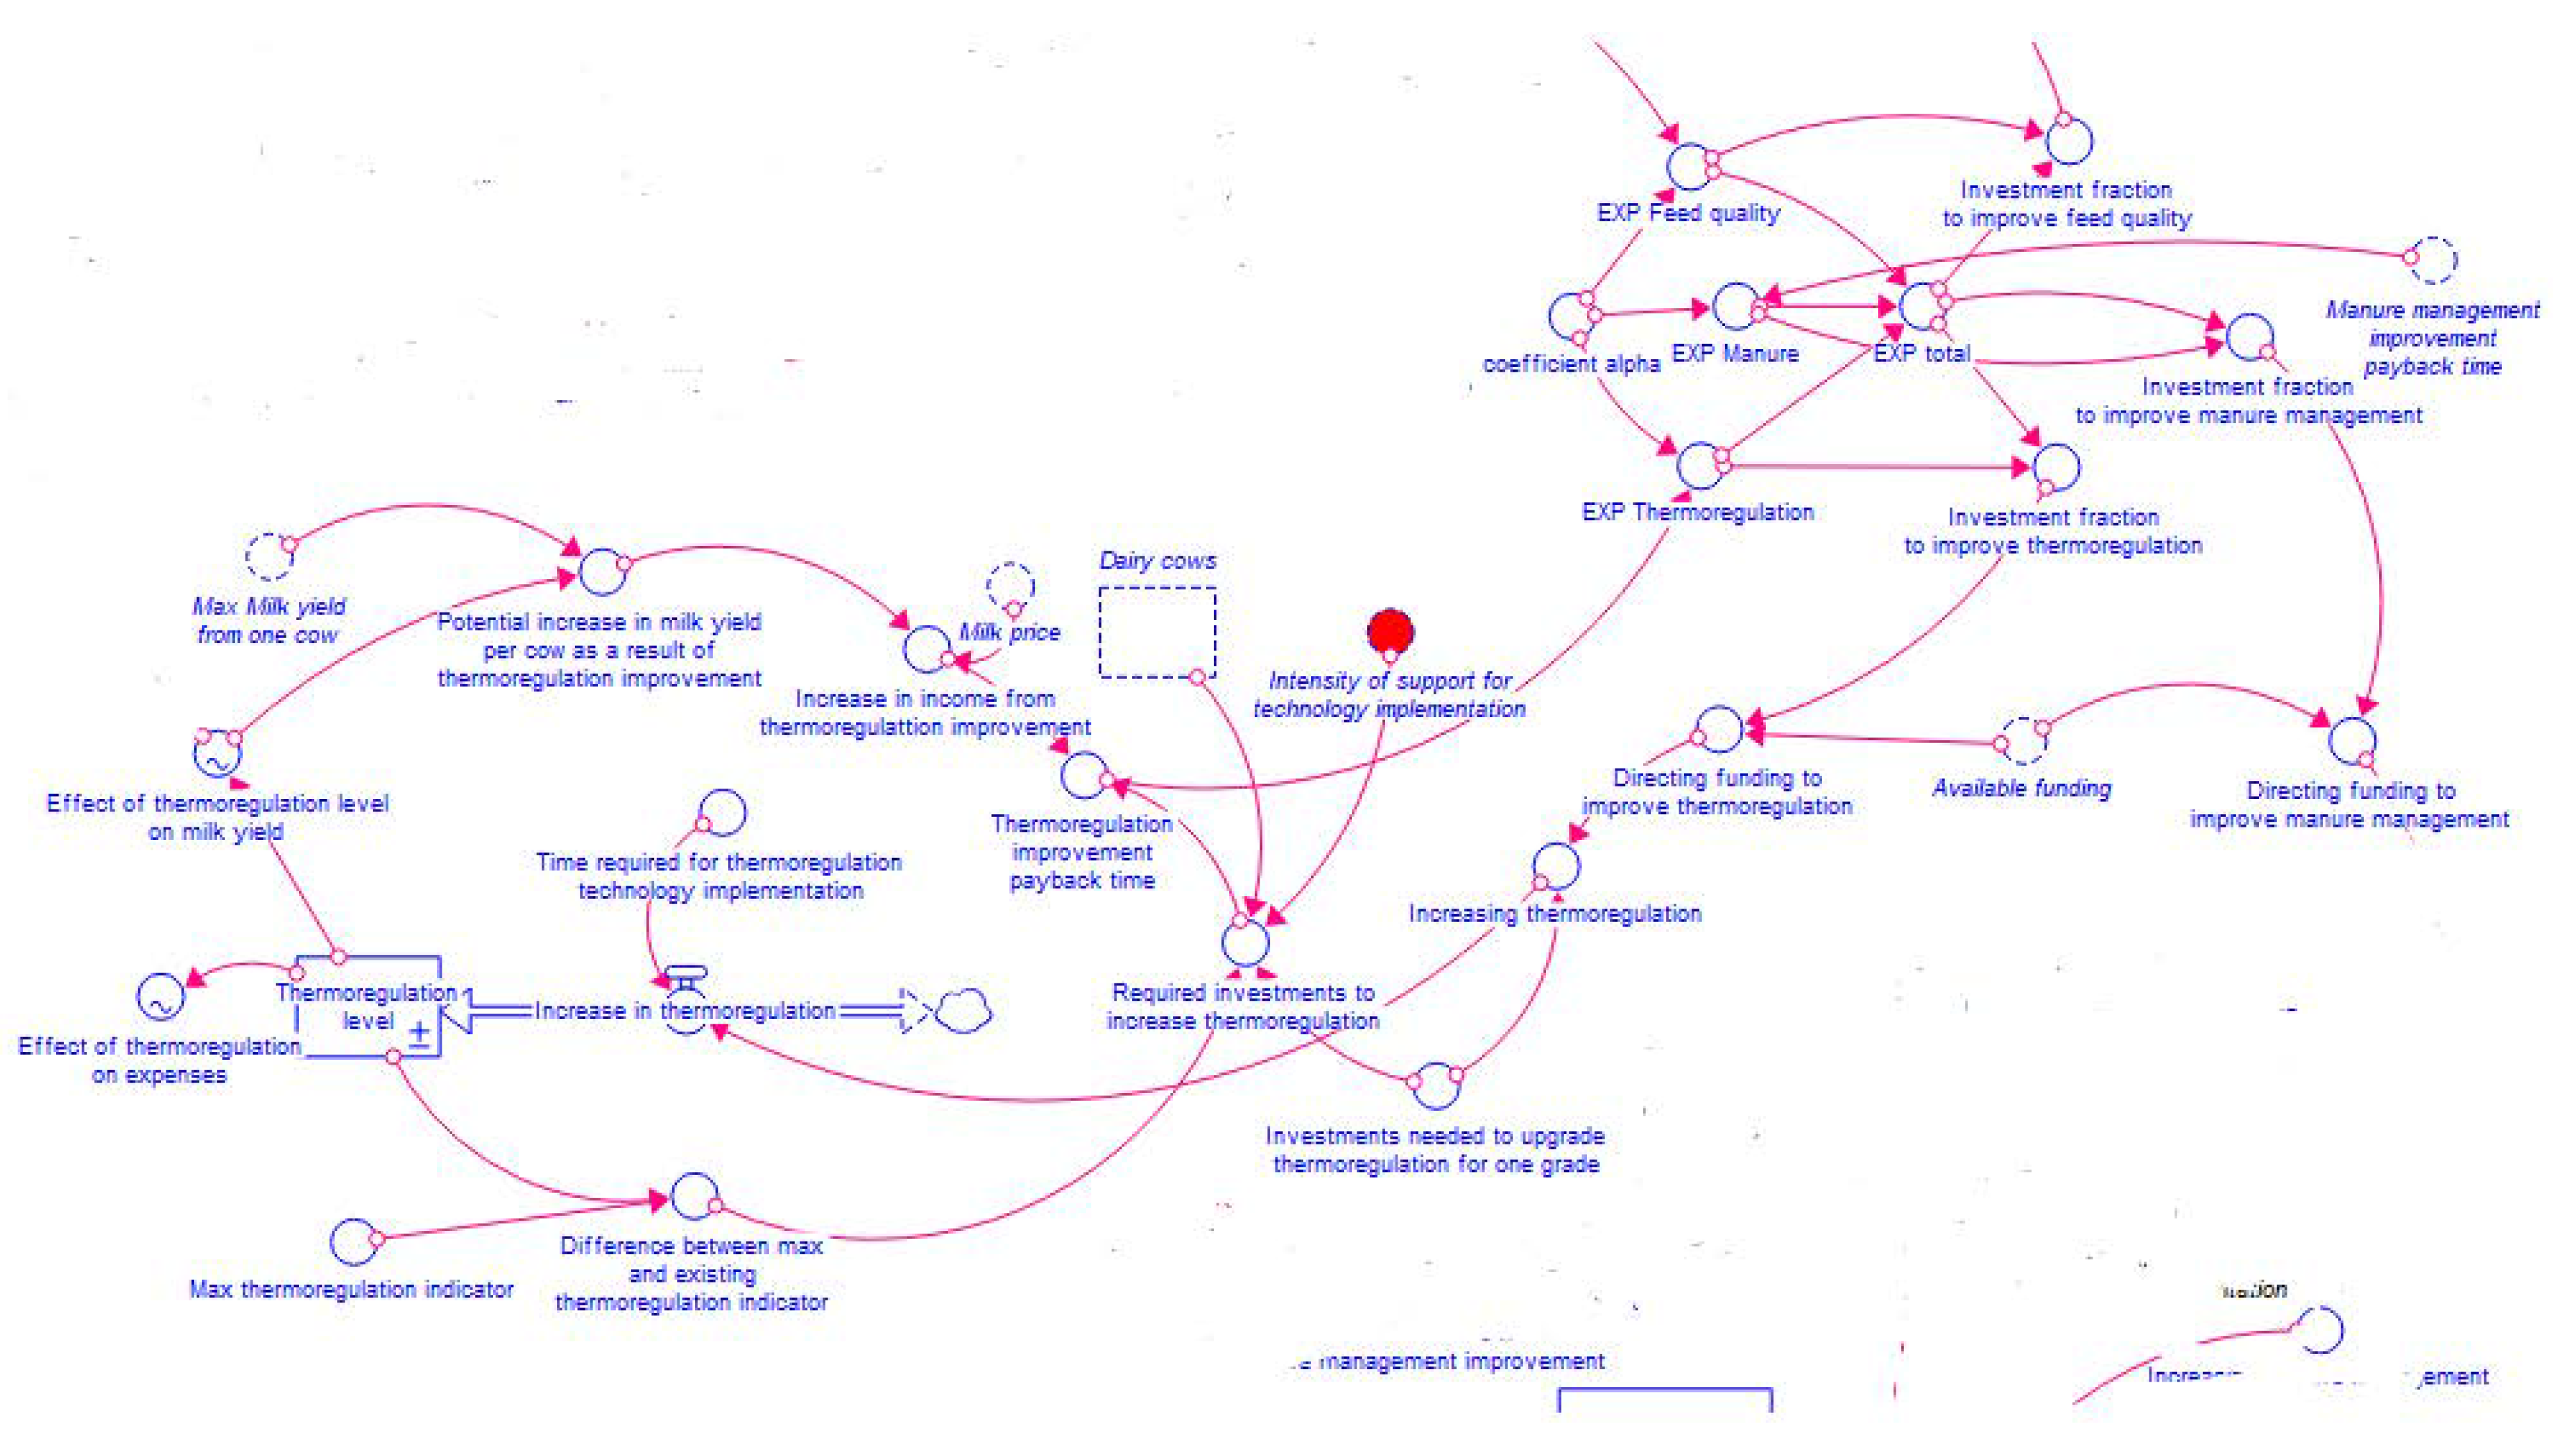
Figure 9.
a) The total amount of emissions produced in several scenarios; b) The total amount of emissions generated per the amount of output produced in several scenarios.
Figure 9.
a) The total amount of emissions produced in several scenarios; b) The total amount of emissions generated per the amount of output produced in several scenarios.
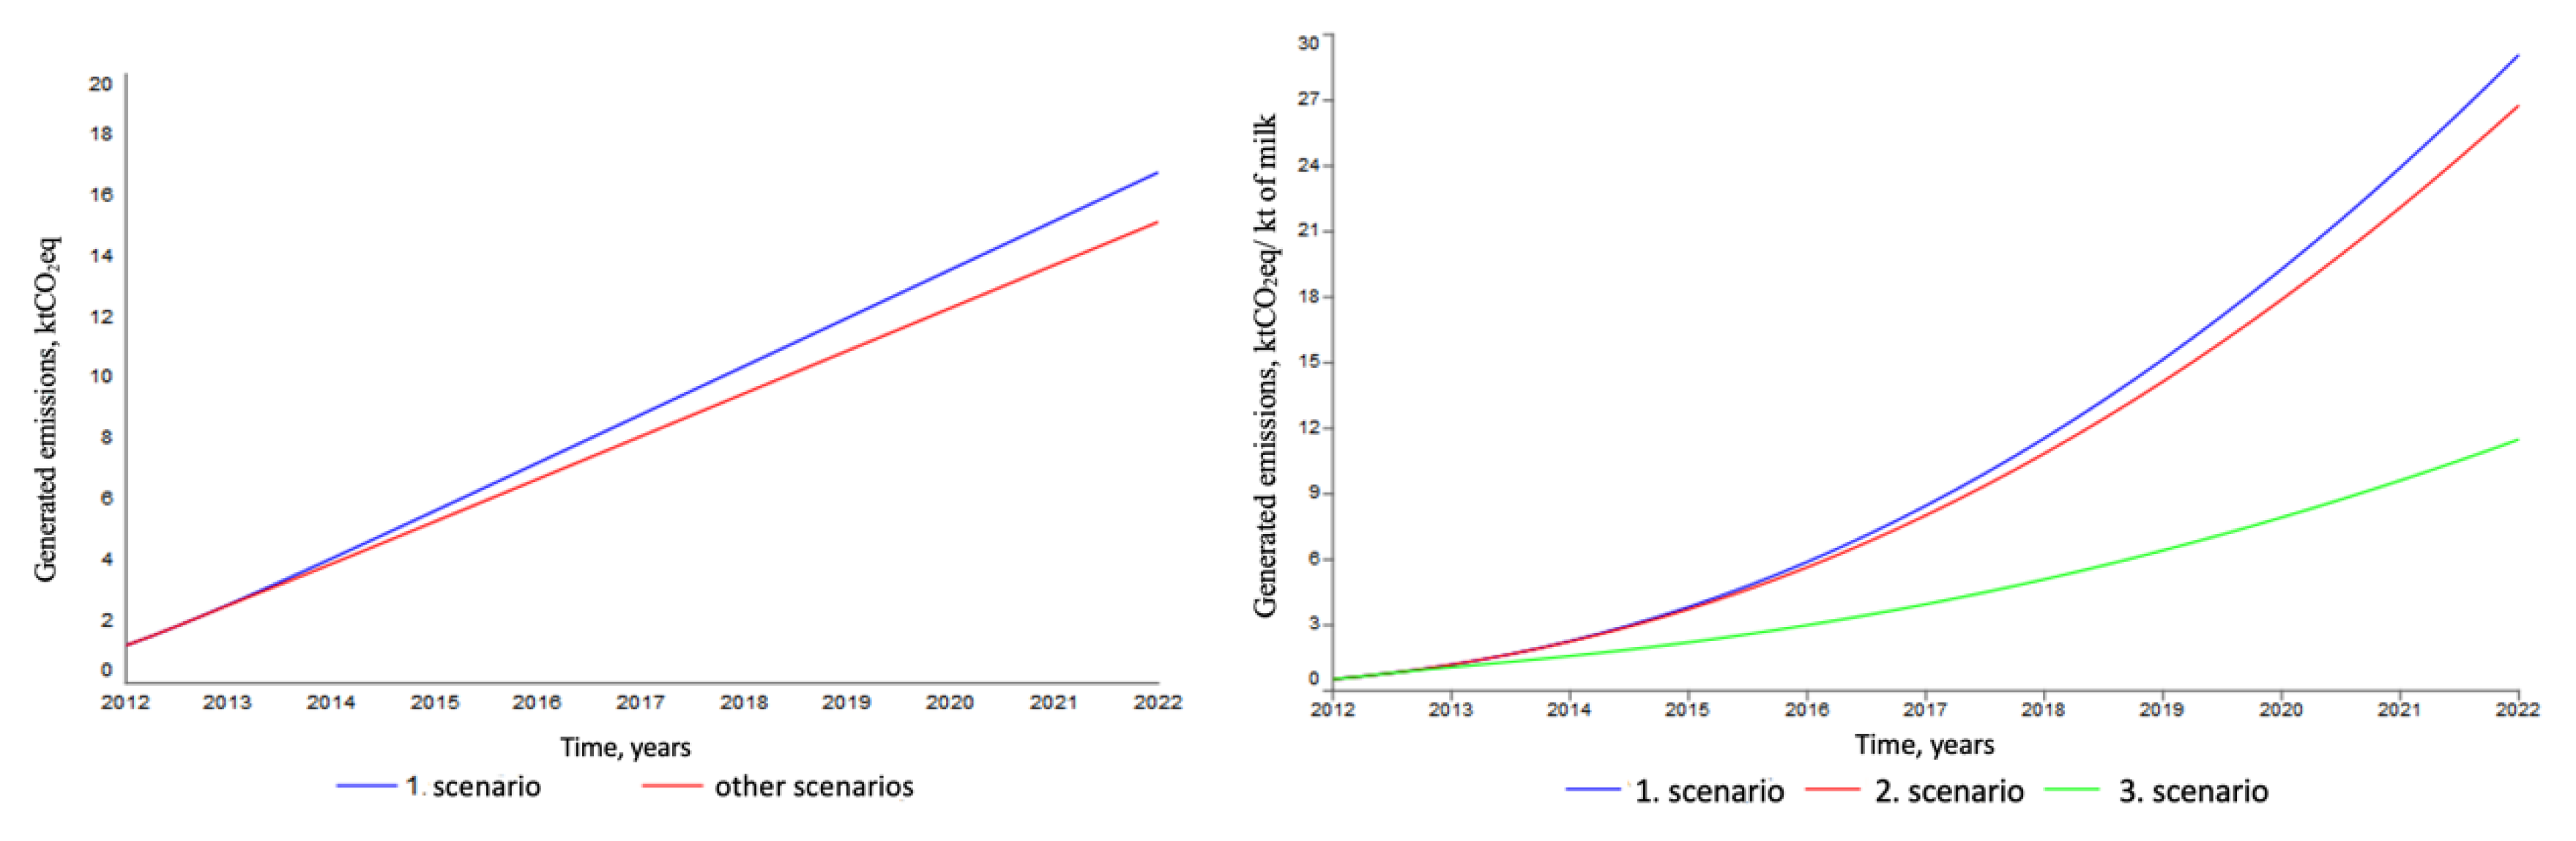
Figure 10.
Milk production in first, second and third scenario.
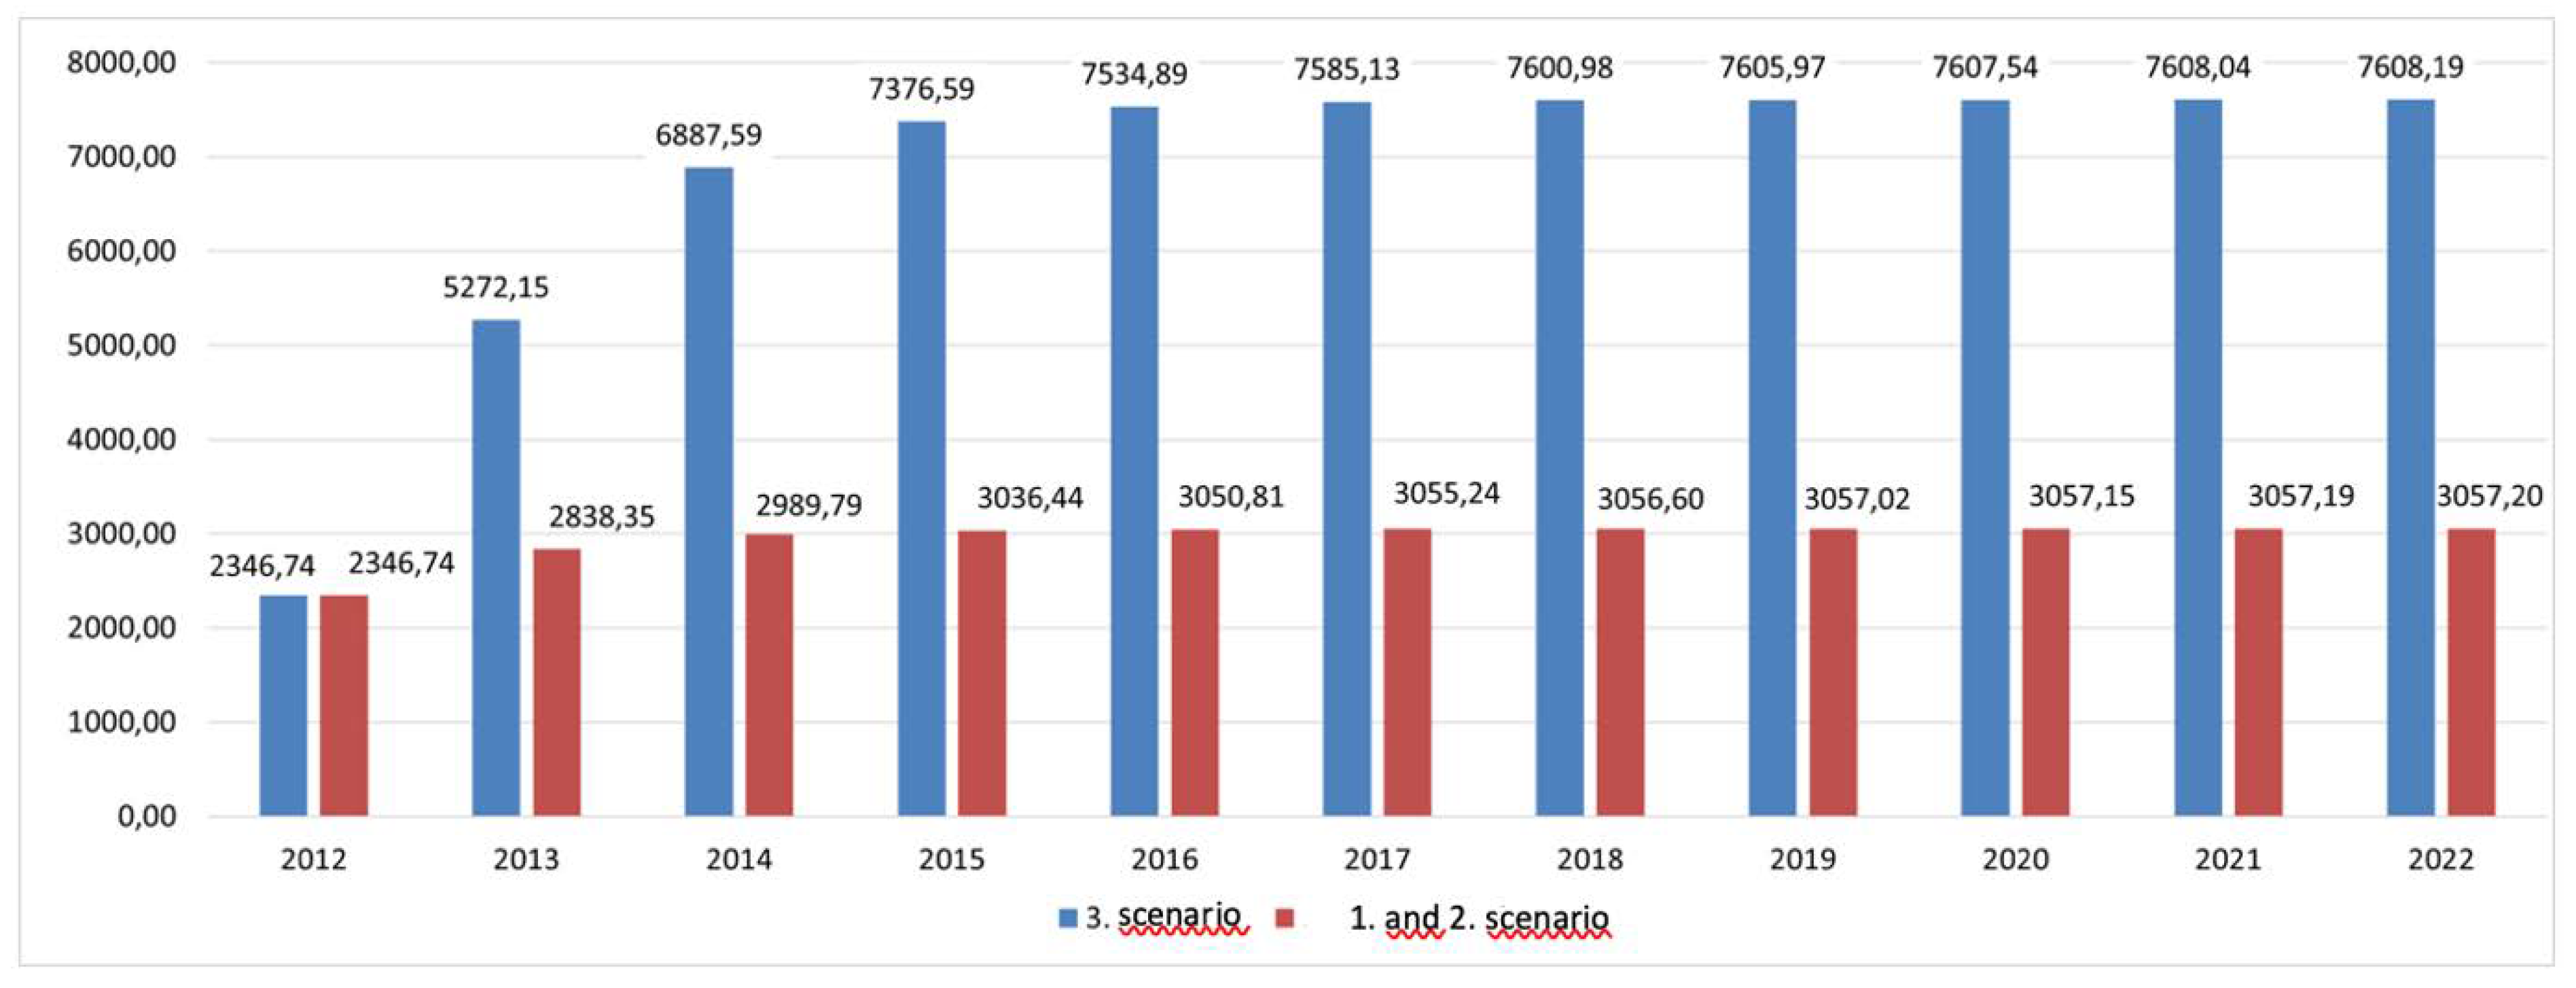

Table 1.
System dynamics model parameters for the cow sector.
| Parameter | Unit of Measure |
|---|---|
| Mortality rate | Dimensionless |
| Increase in the number of cows ratio | Dimensionless |
| Cow sales ratio | Dimensionless |
| Cow cure ratio | Dimensionless |
| The amount of liquid manure produced per cow | t/year |
| The amount of litter manure produced per cow | t/year |
| Number of milking cows | Number of cows |
| Maximum number of cow places in the barn | Number of cows |
| Maximum milk yield per cow | t/cow/year |
Table 2.
Input data for the emission sector in the model.
| Parameter | Unit of Measure |
|---|---|
| Heat energy consumption | MWh/year |
| Fuel consumption | l/year |
| Diesel fuel combustion | MWh/t |
| Electricity consumption | kWh/year |
| Global warming potential of CH4 | Dimensionless |
| Global warming potential of CO2 | Dimensionless |
Table 3.
Manure management method, level and factor [42].
Table 3.
Manure management method, level and factor [42].
| Parameter | Unit of Measure |
|---|---|
| Heat energy costs | EUR/MWh |
| Fuel costs | EUR/l |
| Cow cure costs | EUR/year |
| Cow costs | EUR/cow |
| Voluntary related support for milking cows | EUR/cow |
| Share of own financing | Dimensionless |
| Intensity of support measures | Dimensionless |
Table 4.
Manure management method, level and factor [42].
Table 4.
Manure management method, level and factor [42].
| Management Method | Management Level, Points | Emission Factor |
|---|---|---|
| Deep bedding +mixing | 1 | 0,07 |
| Solid storage | 2 | 0,02 |
| Liquid systems | 3 | 0,0005 |
| Anaerobic lagoon | 4 | 0,001 |
| Biogas production | 5 | 0,0006 |
| Biomethane production | 6 | 0 |
Table 5.
Input data for the technology development.
| Parameter | Unit of Measure |
|---|---|
| Time to implement | years |
| Manure price | EUR/t |
| Max level | Points |
| Initial level | Points |
| Investments for technology improvement for one point | Points |
Disclaimer/Publisher’s Note: The statements, opinions and data contained in all publications are solely those of the individual author(s) and contributor(s) and not of MDPI and/or the editor(s). MDPI and/or the editor(s) disclaim responsibility for any injury to people or property resulting from any ideas, methods, instructions or products referred to in the content. |
© 2023 by the authors. Licensee MDPI, Basel, Switzerland. This article is an open access article distributed under the terms and conditions of the Creative Commons Attribution (CC BY) license (http://creativecommons.org/licenses/by/4.0/).
Copyright: This open access article is published under a Creative Commons CC BY 4.0 license, which permit the free download, distribution, and reuse, provided that the author and preprint are cited in any reuse.


