Submitted:
21 July 2025
Posted:
22 July 2025
You are already at the latest version
Abstract
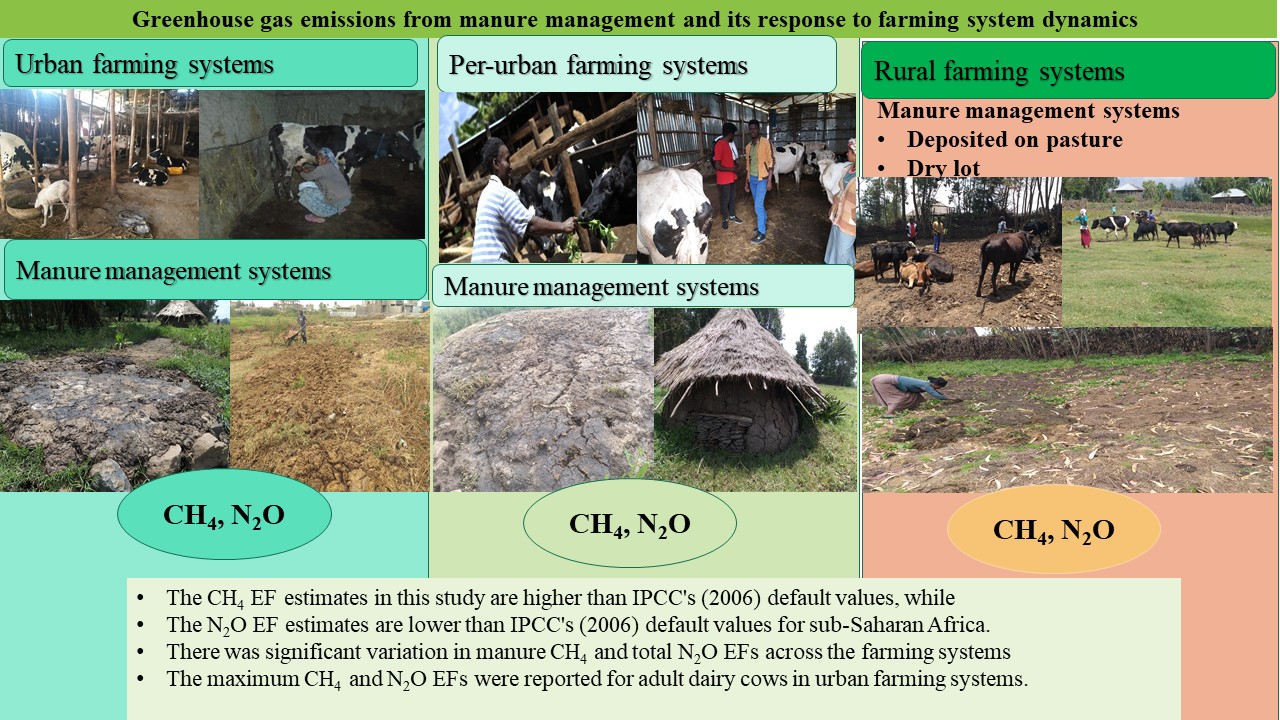
Manure management in dairy production contributes considerably to greenhouse gas (GHG) emissions in agriculture. Intensification of the sector led to increased volumes of manure accumulation, which emit GHGs like methane (CH4) and nitrous oxide (N2O). It is crucial to have reliable information in order to contribute to global efforts to reduce CH4 and N2O emissions from manure management and utilization practices. The present study was designed to develop country-specific improved (Tier II) emission factors (EF) for manure CH4 and N2O across farming system dynamics based on animal energy requirements derived from animal performance and feed characterization data of about 2500 cattle from three smallholder dairy farming systems (Urban, Peri-urban and Rural) in the Salale highlands. Our result showed that there was significant variation in manure CH4 and total N2O EFs across the farming systems. The predicted EF values for mature dairy cows in urban, peri-urban, and rural farming systems were 14.89, 11.68, and 3.19 kg CH4 head-1 year-1, and 0.62, 0.53, and 0.21 kg N2O head-1 year-1, respectively. The maximum CH4 and N2O EFs were reported for matured dairy cattle in urban farm. Smallholder rural farm showed significantly lower CH4 EFs and N2O for matured dairy cattle compared to urban and peri-urban farms. Compared with IPCC default values (2019), our values for CH4 EF are higher than those in the IPCC (2019) for sub-Saharan Africa. This study can serve as a baseline in the national emissions inventory to evaluate the effectiveness of future interventions, potentially improving the country's commitment to reduce GHG emissions. Increasing the proportion of manure used for composting and biogas instead of dung cake as fuel would result in an increase in organic manure and renewable energy sources on farms, thereby improving nutrient use efficiency and reducing greenhouse gas emissions.
Keywords:
dairy farm
; emissions factors
; greenhouse gas emissions
; manure management
; methane
; nitrous oxide
1. Introduction
Global warming, which is associated with emissions of GHG resulting from human activities, has currently become a major factor determining human development [1]. The concentration of GHG emissions (CO2, CH4, and N2O) has shown increasing trends since pre-industrial times due to human activities, with negative effects on the climate systems [2]. Methane is a potent greenhouse gas that persists in the atmosphere for approximately 9 to 15 years and traps heat 25 times more effectively than carbon dioxide (CO2) over a century [3]. Nitrous oxide has an atmospheric lifetime of 150 years and a global warming potential 296 times that of CO2 [3]. Based on IPCC (2013) data, CH4 concentrations have doubled, and N2O atmospheric concentrations are 20% higher than pre-industrial levels. In agriculture, CH4 and N2O emissions are largely attributed to animal production, which contributes 14.5%, Gerber et al. (2007), and produces 37 and 65% of global emissions, respectively (Steinfeld and Wassenaar 2007).
Most of the greenhouse gas emissions in Africa come from agriculture, with livestock production accounting for 70% [6]. Ethiopia's GHG emissions profile, for example, is dominated by agricultural emissions, which account for 79% of all national emissions. Livestock emissions are mainly attributed to enteric fermentation, manure management systems, and dung and urine deposits from managed soils [7]. Manure management (MMt) in the livestock value chain makes a significant contribution towards greenhouse gas emissions in the agriculture, forestry, and other land use categories in Ethiopia, by producing mainly CH4 and N2O [8]. IPCC (2006) defines MMt practices as all activities used to handle, treat, store, and dispose of feces and urine from livestock with the aim of preserving and recycling nutrients.
There is a substantial increase in the demand for animal-derived food due to globalization, urbanization, and income growth, especially in rapidly developing countries like Ethiopia [10]. Given the expected fast increases in the Ethiopian population to almost 190 million in 2050, urbanization doubling to nearly 40%, and diet upgrades, livestock production and consumption value chains face tremendous challenges in increasing productivity and mitigating GHG emissions [11,12,13]. Consequently, the number of cattle will increase from 70 million today to 90 million by 2030 [14], doubling the emissions from dairy value chain. According to FAO-NZAGRC, if dairy farmers continue to use traditional MMt practices, smallholder dairy farms will emit more greenhouse gases [15].
To support international efforts to lower CO2, CH4, and N2O emissions, livestock must be included in national climate action plans. Under the UNFCCC, Ethiopia is obliged to report its GHG emissions to the Conference of the Parties (COP). As part of their national determined contributions to the UNFCCC, countries have presented updated GHG mitigation actions covering the animal agriculture in 2020 [16]. GHG emissions from MMt are considered a key source category that needs to be estimated for proper mitigation measures for countries with large number of livestock, like Ethiopia.
To provide a solid foundation for governmental policies and mitigation initiatives, a precise measurement of the nation's GHG emissions is necessary. Accurate data can also be used to identify emissions hotspot, thereby implementing proper mitigation measures in MMt and utilization practices. It is advisable to adopt country-specific Tier II manure CH4 and N2O EFs for countries with a significant cattle population to quantify the effect of future interventions on baseline emissions. The development of robust and valid estimates of GHG emissions from smallholder farmers (SHFs) in Ethiopia is, however, hindered by a number of challenges. The data on Ethiopian manure CH4 and N2O emissions, for instance, are scarce, and the default values utilized to predict EFs don't take local farming practices into account [17]. Therefore, the Tier II approach would increase precision and lower uncertainty related to IPCC Tier I estimates of manure CH4 and N2O emissions [17,18].
Despite Ethiopia's large cattle population and significant GHG emissions, little work has been done to quantify the manure CH4 and N2O EFs of SHF systems and how variation in farming systems affects milk production EFs. Previous research has either estimated the CH4 and N2O emissions from manure at the regional or national level from secondary data Wilkes et al. [7] or have used data from small on-farm samples combined with assumptions about typical farming systems [19]. These studies provide limited insight into the local variations in production characteristics and intervention strategies based on aggregated findings. Furthermore, different types and amounts of feed are available to ruminant livestock in different agro-ecologies and production systems, which results in different production level and GHG emissions. According to IPCC (2019), climate, feed type, feeding conditions, and waste management practices all have a substantial impact on the regional distribution of GHG emissions from ruminant animals.
Hence, the objective of this study is to generate improved manure CH4 and N2O EFs by using the IPPC Tier II method, which is derived from data on animal performance and feed characteristics, as well as to assess the variations in EFs among farming systems in the Addis Ababa milkshed, Salale highlands of Ethiopia.
2. Materials and Methods
2.1. Description of the Study Area
The study was carried out in Addis Ababa milkshed, Salale highlands of Ethiopia (Figure 1). The milk shed lies at 38°07'60" E longitude and 9°40'60" N latitude. Approximately 42% of the area falls under tropical highland with a climate similar to that of temperate regions, while over 25% of the zone is made up of typical tropical dry land [20]. There is a broad range of altitudes in the area, from 3500 meters to 1200 meters above sea level. Rainfall occurs primarily during the summer months (June-September) and the spring months (February-April). The average annual rainfall of the area ranges from 700 mm to 1800 mm, while the temperature ranged between 7.9 ˚C and 21 ˚C, for the period of 1988 to 2018 [21]. The majority of Salale highland agriculture is mixed crop-livestock farming, and smallholder dairy farms dominate the dairy industry [20]. The study area was selected for its considerable milk production potential as well as its leading role in developing the national dairy industry [22,23,24].
2.2. Sampling and Data Collection
2.2.1. Sampling Techniques
The study employed multi-stage stratified random sampling techniques to select the sample zone, districts and kebeles, and SHF. The Salale milk belt, also known as the Salale highlands, was purposively selected due to its potential for small-scale dairy enterprise, MMt, and utilization patterns and its ideal representativeness in reflecting the realities of the three (urban, per-urban and rural) SHF farming systems. Out of 13 administrative districts (Warada) of the Salale highland, four potential mixed-farming districts were purposively chosen to represent the SHF systems. Then, the SHF were stratified by location, production level, production objectives, intensification level, and feeding conditions into urban, per-urban, and rural farming systems [25]. A national dairy herd database registered farmers and proximity to major roadways and other factors were taken into consideration while selecting sixteen kebele, four from each district. Finally, 480 households (120 urban, 180 peri-urban, and 180 rural) were randomly selected for interviews based on Arsham [26] and Wilkes [27].
2.2.2. Data Collection Techniques
Farm household surveys, animal activity data, laboratory analysis, and secondary sources, used for this study. The data was gathered between February and April 2023 in the four purposively selected districts. We employed a semi-structured questionnaire to gather information from the randomly selected households. Specifically, the questionnaire sought information on livestock holdings, dairy cattle production and reproduction management, feed sources and feeding systems, and MMt and utilization practices. A household survey enumerator expert in livestock production was recruited in each district. Besides, information on agro-ecology, chemical composition of feed, as well as humans and livestock population were obtained from agricultural and rural development offices at the zone and district levels.
Household survey: The survey was conducted between July 2023 and December 2023. In order to monitor seasonal variations in the management of manure and feed resources, the SHFs were visited twice. A team of enumerators experienced in livestock production administered the questionnaire to randomly selected SHF under the supervision of the first author. The purpose of the questionnaire was to gather data regarding the management of dairy cattle herds, livestock holdings, the reproductive and production capacities of animal, the major feed sources in the area, the feeding system, and the management and utilization of manure. Focus groups with six to eight participants were held with SHFs and village leaders in order to triangulate the data obtained from one-on-one interviews with farmers.
Characteristics and performance data: Manure management and utilization practices, as well as data on animal and feed characterization, are critical factors for predicting CH4 and N2O [9]. This study is part of our previous published work estimating enteric methane emissions [28]. It includes information on cattle breeds and age groups in three farming systems, including pure Holstein Friesian cattle, East African shorthorn zebu cattle, and hybrid cattle. Rural farming systems keep indigenous cattle, while urban and peri-urban farming systems keep pure Holstein cattle and their crosses (Table 2).
Live weight and growth rate data: The study used data from the Livestock Development Institute's, national dairy cattle database (for urban and per-urban), and survey (for rural) farm to estimate live weight and growth rate of cattle. Live weight was estimated using a heart girth meter and used the regression equation to estimate LW of the animal [29]. We used secondary sources to determine the average daily weight (ADG) gain because our computed value was unreliable [30,31] (Table 2).
Milk yield and milk chemical composition: The study collected data on milk yield and reproductive performance from LDI and field surveys. Standard 305-day milk yield was determined using test date records [32,33,34]. Rural farms' data was gathered from cooperative unions, milk collectors, and farmers' recalls. Following Van Marle-Köster et al. [35] milk samples were examined for chemical composition, published in Feyissa et al. [28] (Supplementary Table 1).
Composition of seasonal diets and feed characterization: The study assessed the digestibility of common feeds for different animal categories on a farm using data from household surveys and secondary sources [36,37,38]. For the assessment of CH4 and N2O, seasonal weighted DMD values were computed to account for seasonal feed baskets and lower uncertainty [28]. A weighted estimate of DMD was utilized to calculate CH4 and N2O amounts for every category and farming system.
Where, ADF = acid detergent fiber
Activity/Walking data: [27] for East the African dairy approach and the equation provided by the NRC (2001) were used to determine default values for the coefficient of activity data Ca. Grazing animals are primarily kept in small paddocks (private pasture and roadside) and require very little energy to obtain feed (Feyissa et al., 2023). The average grazing distance was estimated using survey data and secondary data from East Africa was used to triangulate [40,41]. The detailed information was published by [28]. The net energy required for an activity is classified by the NRC into two categories: the energy needed for walking and the energy needed for grazing or eating [39]. Walking on a flat area equals 0.00045 MJ/kg per km, eating equals 0.0012 MJ/kg body weight, and cows grazing on hillsides equals 0.006 MJ/kg per km [39]
Where NEm is net energy for maintenance, calculated using IPCC (2006), multiplying by 4.20, Mcal was converted to MJ.
Based on the aforementioned concept Ca was computed for the categories of animals.
The following formula is used to compute Ca if the percentage of feed obtained by grazing each day > 0.
Grazing on hilly terrain increases the energy requirements for maintenance by 0.006 Mcal of NEm/kg body weight, since the energy cost is higher than on comparatively level terrain. ME was converted to NEM with an efficiency of 0.7 [42].
Draft/ploughing data: During the survey, data on the working hours of an ox was collected during survey. The oxen were used to plough for 3.5 months, 7.5 hours each day, then thresh for a month. The work efficiency of Lawrence and Stibbards [43] is used to compute the energy consumed for traction or ploughing, plus additional energy consumed from traction efforts. Consequently, the energy cost of ploughing was determined to be:
MERP (MJ) = Work hours (h/d) * Dayswork * MLW (kg) * 0.002 (MJ)
Amount of energy expended by an animal: Metabolizable requirements (MER) for growth (MERG), lactation (MERL) for lactation animals, maintenance (MERM), and working (MERW) or ploughing/traction, if applicable, for each animal (category) were added to get the total energy require for each animal. Equations obtained from CSIRO [42] were used to compute energy expenditure, as follows:
Maintenance energy requirements (MERM)
Where: K = 1.3 (the intermediate value for Bos Taurus/Bos indicus); S = 1 for females; M = 1; Mean living weight (MLW) varies by season, but dry season lost weight recovers in wet season, and adult animals do not experience weight gain or loss [44]; A= age in years; M/D = Metabolizable energy content (ME MJ/DM KG) where;
Growth energy requirements (MERG)
Where: EC (MJ/kg) = energy content of the tissue (18MJ/kg) [42]
Lactation energy requirements (MERL)
Where:
ECM (MJ/kg) = energy content of milk MJ/kg
Pre-ruminant calves' (DCMCL) milk consumption was calculated in accordance with Radostits and Bell (1970). Using the growth rates of 0.362 and 0.340 kg/d for the multipurpose breed and high-grade breed, respectively, the DCM was computed as follows:
Energy requirements for walking/grazing (MERW)
Where: DIST= average distance covered; LW = live weight; 0.0026 = the energy expended (MJ/LW kg).
Energy requirements for ploughing (MERP)
MERP (MJ) = work hours (h/d) * Daywork * MLW (kg) * 0.002 (MJ)
The daily total energy expenditure (MER Total) for each animal category was computed for each season and farming system:
MERTotal (MJ/day) = MERM + MERG+ MERL + MERT
Where: GE = the gross energy of the diet is assumed to be 18.1MJ/kg DM; 0.81 = Metabolizable energy to digestible energy conversion factor; DMD = Seasonal Weighted Dry Matter Digestibility
Emission factor and daily methane production
Following [17] and Leitner et al. [18] methane production (CH4 manure) was estimated as a function of manure CH4 emissions factors.
Where: = Total CH4 emissions from MMt in the target area
[Gg CH4 yr-1]; EFT = emission factor for different animal categories
[kg CH4 head-1 yr-1]; NT = number of head of animal category T; T = Animal category
The EF for different animal categories and MMS were estimated as follows:
Where: EFT = Annual CH4 emission factor for animal category T [kg CH4 animal-1 yr-1]; VST = Daily volatile solid excreted from animal category T [kg dry matter animal-1 day-1]; 365 = Annual VS production conversion factor; Bo = Maximum CH4 production capacity for manure produced by animal category T [m3 CH4 kg-1 VS]; 0.67 = Density of CH4 gas to convert from m3 to kg (kg m-3); MCFS,k = Methane conversion factor for MMt system S by farming systems k [%]; MST,S,k = Fraction of the manure from animal category T that is handled using MMt systems S
Where: VS = Volatile solid excreted per animal per day based on dry matter intake and feed digestibility [kg dry matter day-1]; DMI = Daily dry matter intake [kg animal-1 day-1]; DE% = Seasonal digestibility of the feed [%]; ASH = Ash content of manure, default value 0.08 for cattle [17]; Bo = Production capacity of CH4 from manure by livestock category T [m3 CH4 kg-1 VS], IPCC [17] default values 0.24 for dairy cows and 0.13 for all other dairy and other cattle were used.
2.2.3. Estimation of N2O Emissions from Manure
The direct and indirect N2O emissions from manure, which occur after excretion, during storage, and during treatment before it is applied to land or used for fuel or construction, were calculated as follows [17,18]). Furthermore, there are N2O emissions from manure after application to soils, but these are not covered in the present study.
Direct N2O emissions: Emission factors for direct N2O emissions were calculated following [17] and [18].
Where: N2OD(MM) = Direct N2O emissions from MMt systems [kg N2O yr-1]; NT = Number of head of animal category T in the region; = Annual N excretion rate per head of animal category T [kg N animal-1 yr-1]; MS T,s = Fraction of Nex for cattle category T in MMt system S; EF3, S = Emission factor for direct N2O emissions from MMt systems S [kg N2O-N kg-1 N]; S = Manure management system; T = Animal category; 44/28 = Conversion of N2O-N to N2O emissions (two N atoms per N2O molecule)
Annual N excretion rates (Nex):
Where: = Annual N excretion for animal category T [kg N animal-1 yr-1]; = Annual N intake per head of animal of category T [kg N kg animal-1 yr-1]; = Fraction of annual N intake retained by animal of category T; Total N intake (Nintake) is estimated based on dry matter intake (DMI) and nitrogen content (%N) of the feed
Where: DMI = dry matter intake of the animal [kg animal-1 day-1]; N% = Feed basket N content in percent.
Total nitrogen retention (Nretention) for growth and milk production can be estimated:
Where: Nretention(T) = Daily N retained per animal of category T [kg N animal-1 yr-1]; Milk = milk production [kg animal-1 day-1] (applicable to lactating cows only); Milk CP% = Percent of crude protein in milk (applicable to lactating cows only); 6.38 = conversion from milk protein to milk N [kg protein kg-1 N]; LWG = Live weight gain per animal and season for each livestock category T [kg day-1]; 268 and 7.03 = constants from Equation in [46]; NEg = Net energy for growth [MJ day-1]; 6.25 = Conversion from kg dietary protein to kg dietary N [kg protein (kg N)-1]
Net energy for growth for cattle (NEg) can be estimated as follows
Where: NEg = net energy needed for growth [MJ day-1]; LW mean = mean live weight of the animals in the population for each season [kg], derived from seasonal animal LW measurements “Protocol for cattle enteric methane emissions”; C = coefficient with a value of 0.8 for females, 1.0 for castrates, and 1.2 for bulls [47]; MW = mature live body weight of an adult female in moderate condition (BCS = 3) [kg]; WG = average daily weight gain of the animals in the population for each season [kg day-1]
Indirect N2O emissions due to N volatilization from MMS: First, calculate the amount of N that is lost via volatilization of NH3 and NOx
Where: NVolatilization–MMS = amount of manure N lost due to volatilization of NH3 and NOx [kg N yr-1]; NT = The number of animals in each category T; = N excretion rate per head of animal category T [kg N animal-1 yr-1]; MST,S= Fraction of annual N excretion for animal category T managed in MMt system S; Frac GasMS = Percentage of manure N from livestock category T that volatilizes as NH3 and NOx from MMt systems S [%]; S = Manure management system; T = Animal category
Then indirect N2O emissions from N volatilization were calculated as follows:
Where: N2OG(MM) = indirect N2O emissions from N volatilization in MMt [kg N2O yr-1]; EF4 = emission factor for N2O emitted from atmospheric deposition of N onto soils and water surfaces [kg N2O-N (kg NH3-N +NOx-N)-1]. The default EF4 is 0.01 (Table 8).
Indirect N2O emissions due to N leaching from MMt
The amount of N that is lost via leaching from manure was calculated only for the rainy season.
Where: Leaching–MMS = Amount of manure-N that is lost due to leaching from manure [kg N yr-1]; NT = Number of head of animal category T in the region; = N excretion rate per head of animal category T [kg N animal-1 yr-1];
MS T,S = Fraction of Nex for animal category T in MMt system S; Fra Leach MS = % managed manure N losses for animal category T due to run-off and leaching during storage from MMt systems S [%, the typical range is 1-20 %], default value (Supplementary Table 2); S = Manure management system; T = Animal category
Then indirect N2O emissions from N lost via leaching was calculated as follows:
Where: N2O L(MM) = Indirect N2O emissions due to leaching and run-off of N from MMt in the region [kg N2O yr-1]; EF5 = N2O emissions factor from leaching and run-off of N [kg N2O-N (kg N leached)-1] (Supplementary Table S1).
2.3. Data Analysis
The study used one-way ANOVA and descriptive statistical analysis to analyze quantitative data on methane emissions factors in different farming systems. Post-hoc tests were used to compare means. Monte Carlo simulation was used to evaluate the degree of uncertainty for methane emission factor, with the margin of error estimated using a z-score of 1.96 [17]. Spearman's ranking correlation coefficients were used to determine each variable's contribution to overall uncertainty. The analyses were conducted using the SPSS version 26 from 2003 and Microsoft Excel software.
3. Result
3.1. Characteristics of Smallholder Farmers
There are significant differences between the three farming systems in terms of herd structure, breed/genotype composition, and productivity and reproduction (Table 1). Urban and peri-urban farming systems keep pure exotic breed or crossbreed cows with medium to high exotic blood levels, with the largest live weight reported in urban SHF systems. Whereas, rural SHF were mostly used to raise dual-purpose indigenous cattle. Low numbers of urban SHF followed stall feeding, while stall feeding with limited grazing in private pastures was a common feeding practice in peri-urban farming systems. Whereas, the rural SHF followed free grazing of natural pasture and crop aftermath throughout the year with a minimum amount of supplementation to milk cows. Previous studies reported similar results in the study area [25,48]. The average daily milk yield per cow and adult live weight varied significantly (P < 0.05) across the three farms.
Smallholder farmers primarily use natural pasture hay, crop residues, and pasture grazing for basal feed (Table 2). Local supplements include oats grain/hull and grass pea hull, while agro-industrial by-products like wheat bran, wheat middling, and noug (Guizotia abyssinica) seed cake are commonly used. The feed intake varies significantly based on farming systems and season, with the weighted mean DMD of the feed basket varying between farms and seasons (Table 3). Our study found that the weighted mean DMD of the feed basket was similar to that calculated by Goopy et al. (2018a) for Kenya, but greater than the IPCC's default estimate for Africa. Rural farming systems have significantly (≤0.05) lower average feed digestibility compared to urban and peri-urban systems, with seasonal feed baskets varying due to their year-round reliance on crop residues and pastures. These findings are consistent with previous studies showing that the primary sources of variability among Ethiopia's smallholder dairy farming systems are breed and genotype compositions, input levels, and production goals [11,25,48].

Table 1.
Composition of seasonal (wet season and dry season) diets in daily feed-basket in DMD base.
Table 1.
Composition of seasonal (wet season and dry season) diets in daily feed-basket in DMD base.
| Feed type | Urban SHF (%DMD) | Per-urban (%DMD) | Rural SHF (%DMD) | |||
|---|---|---|---|---|---|---|
| Wet season | Dry season | Wet season | Dry season | Wet season | Dry season | |
| Natural pasture | NF | NF | 8.77 | 3.47 | 32.17 | 21.67 |
| Hay | 18.98 | 16.72 | 13.05 | 10.03 | 1.78 | 5.02 |
| Crop residue | 9.84 | 11.27 | 9.6 | 10.65 | 8.76 | 10.89 |
| Pulse | 0.92 | 1.53 | 0.92 | 1.22 | 2.46 | 1.53 |
| Improved forage | 0.75 | 0.49 | 3.09 | 1.89 | 3.75 | 1.59 |
| Concentrate | 2.11 | 2.81 | 2.11 | 2.46 | Nf | 0 |
| Industrial bi-products | 25.17 | 25.14 | 18.84 | 25.52 | 5.3 | 10.11 |
| Atela (Local brewery) | 0.74 | 0.74 | 0.74 | 1.1 | 2.21 | 2.58 |
| Seasonal | 62.28 ± 3.44a | 61.67±3.93a | 60.29b ± 3.25 b | 59.82± 2.57 b | 57.46 ±3.83c | 54.18 ± 3.83d |
| Farm (%DMD) | 61.97 ± 4.3a | 60.1 ± 5.1b | 55.84 ± 4.85c | |||
3.2. Manure Management Systems
Table 3 shows the proportion of MMt systems in the study area. Solid storage, dry-lot, and depositing on pasture were the common MMt practices in the study area. In rural areas, manure is mostly deposited on pasture, whereas it is mostly stored as solids in urban and peri-urban areas. This result is consistent with the earlier findings in Sub-Saharan Africa [17,19,50], but there is slight variation in the Zway-Hawassa milk shed in Ethiopia [51]. Dry lot MMt system is not a common practice in Zuway-Hawassa milk shed. In urban farming systems, none of the manure was handled as deposits on grassland. This is due to the fact that animals are not allowed to graze on pasture in urban farming systems. Use of manure as dung cakes for fuel was a common manure utilization practice in the study area. A small portion of cattle manure was used for fertilizer in urban and peri-urban farming systems. As an alternative to cattle manure, a farmer uses small ruminant excreta for fertilizer and sells dung cakes for income. Similar findings were reported in carbon footprint studies in other parts of Ethiopia [7,52,53]
3.3. Emissions From Manure Management Systems and Its Uncertainties
3.3.1. Methane Emissions from Manure Management
Manure EFs and volatile solid (VS) excretion for all categories of cattle across the farming systems are presented in Table 4 and Table 5, respectively. The study found significant variations in EFs and manure VS excretion across three farming systems, with urban and peri-urban farms reporting the highest emissions for milking cows and rural farms reporting lower emissions for calves. This is owing to the fact that VS excretion is influenced by dry matter intake and digestible energy of feed, thereby affecting manure EFs. Similarly, there was a wide range of variation in manure EFs within cattle subcategories in the farming systems, ranging from 14.89 kg CH4 per head/year to 0.76 kg. It was found that methane EF varied significantly by farming system, with urban systems having the highest (P < 0.05) EF and rural systems having the lowest (P < 0.05).
3.3.2. Nitrous oxide (N2O) Emissions and Its Uncertainties
Table 7 and Table 8 show the estimated nitrogen excretion from manure management and the direct N2O emissions for each animal group throughout the farming systems, respectively. The highest nitrogen excretion and direct N2O emissions were reported for milking dairy cows in urban farms, and the lowest was reported for calves in rural farms. The direct N2O emissions for adult dairy cows were significantly (P < 0.05) higher in urban farms than in peri-urban and rural farm. The lowest direct N2O emissions were reported for calves in rural farming systems. Similarly, the indirect N2O emissions from manure management due to N-volatilization were higher for adult females and lower for calves in rural farms (Table 9 and Table 10). There was a significant difference in direct N2O and indirect N2O across farming systems.
A different superscript letter in the same column indicates significant differences among farming systems (P <0.05).
Table 6.
Direct N2O emissions from manure management, kg N2O for different animal categories of farming systems.
Table 6.
Direct N2O emissions from manure management, kg N2O for different animal categories of farming systems.
| Farming system | Emission factors (kg N2O head-1 year-1) | ||||||
|---|---|---|---|---|---|---|---|
| Adult female | Adult male | Growing female | Growing male | Calf (≤1) | Calf (≤6m) | Fattening male | |
| Urban | 0.4 ± 0.041a | 0.14± .0.01a | 0.25 ± 0.05a | 0.26± 0.03a | 0.16± 0.71a | 0.12 ± .03a | Na |
| Peri-urban | 0.37± 0.04b | 0.13± 0.01b | 0.20± 0.03b | 0.22 ± 0.03a | 0.14± 0.03a | 0.04± 0.01b | Na |
| Rural | 0.17± 0.02c | 0.2± 0.016a | 0.21± 0.04c | 0.23 ± .02b | 0.1 ± 0.015b | 0.06 ± 0.001c | 0.29 ± 0.026 |
3.3.3. Uncertainties for Manure CH4 and N2O Emissions
The uncertainty levels for CH4 emission factors and direct N2O emissions from manure management in urban, peri-urban, and rural dairy farming systems were -48%/+22, -36/+26, -19%/+33%, and -46%/+22, -35/+24, -19%/+32%, respectively (Table 12 and Table 13). The uncertainty level estimated in this study is lower than the report by [7] and the default value of [54]. This variation might be due to the differences in activity data used to estimate and methodological approach. This study, for instance, relies empirically on farm activity data, whereas Wilkes et al. [7] employed empirical data obtained from secondary sources. In all farming systems, methane conversion factors of manure management systems for solid storage and dung cake for fuel and feed dry matter digestibility are the main sources of uncertainty.
3.4. Discussions
3.4.1. Manure Methane Emission Factors
The significant differences in manure EFs are caused by the considerable variations in the volatile solids (VS) excreted with the manure, which could be the result of differences in breeds/genotypes and feeding practices. Smallholder dairy farms in rural areas have significantly lower estimated VS and EF than urban and peri-urban farms, which could be explained by differences in production and reproductive performance and feed characteristics, which result in different maintenance and production energy requirements (Table 1). Compared to their rural counterparts, mature females on urban and peri-urban farms are heavier and produce more milk. This led to an increase in energy requirements for milking dairy cows, as well as an increase in dry matter intake and total volatile solids, which in turn caused higher EFs. In line with this, Amon et al. (2001) observed that variation in methane emission was caused by differences in milk yield and feed intake. According to IPCC [54], there are two important manure characteristics that affect the formation of CH4 in manure: total amount of volatile solids (VS) that are excreted with the manure and the maximum BO potential methane-producing capacity of the manure itself (Bo). In addition, previous research has shown that manure methane emissions are greatly affected by the type of treatment, ambient climate conditions, diet, and the composition of manure [50,55,56]. For example, Petersen et al. (2013) and Hindrichsen et al. (2005) observed higher methane production from the manure of cattle fed a high grain diet compared to that of cattle fed a forage diet. Contrary to this, Doreau et al. (2011) reported higher manure methane production in hay and corn silage-based diets compared to corn grain diets, whereas the reverse was observed for N2O and CO2. Variations in manure methane emissions across farming systems can also be attributed to manure management systems. Pattey et al. (2005) indicated that CO2 equivalent emissions from the stockpiled manure were 1.46 times higher than from the compost for dairy and beef types of cattle manure.
The variation between the present result and the previous report might be partly due to differences in the approach and/or the input parameters used in predicting CH4 EF. Our estimates of methane EF are significantly higher than those from IPCC [17] for dairy cows in Africa, which are expected to have lower body weights and digestible feed than those in the present study. However, the current value of EFs is less than the findings of Kebreab et al. [59] for dairy cattle in Canada and Moeletsi and Tongwane [60] for South Africa. This variation could be attributed to the increased live weights of cattle and manure management techniques. In line with this, Opio et al. [50] indicated that manure CH4 emissions are lower in regions where manure is handled in dry systems. For Ethiopian crossbred dairy cattle, the estimated EF is similar to the value reported by Wilkes et al. [7], but higher than the value reported by [19]. This is primarily due to either the approach or the input data used. In general, variations in the estimated methane emissions from manure management are most likely caused by variations in the manure's VS content, which is influenced by the animal's digestible energy (DE) and gross energy (GE) intake (IPCC 2019). In addition, a difference in the maximum methane-producing capacity of manure (Bo), which is affected by DE, also influenced manure management CH4 emission factors.
3.4.2. Total N2O Emission (Direct and Indirect)
Total manure N2O (direct and indirect) emissions significantly vary among farms. The significant (P < 0.05) difference in direct and indirect N2O emission across farming systems might be the result of differences in feed resources and the nitrogen content of feeds and of variation in nitrogen excretion rate and manure management systems (Table S3). Nitrogen excretion rate is influenced by gross energy intake, which is in turn affected by live weight, weight gain, and the level of milk production [9,18,50]. Opio et al. (2013) stated that the key important variables that influence N2O emissions from manure management include the amount of N excreted and the way in which manure is managed. NASEM (2021) indicated that feed-derived nitrogen is the primary cause of cattle's nitrogen losses. On top of this, studies indicated that a substantial amount of N intake is excreted as manure N [62,63]. Manure handling and storage systems might also contribute to the significant variation in total N2O emissions across farming systems. Opio et al. (2013) indicated that a large proportion of N2O from manure management is released as direct N2O, the bulk of which originates from dry systems. As reported by Pattey et al. (2005), combined N2O-CH4 emissions in CO2 equivalent were highest from slurry storage, followed by stockpiles, and finally passively aerated compost. Similarly, Amon et al. (2001) reported that composting solid cattle manure with active turns resulted in lower N2O losses than anaerobic storage with undisturbed piles.
As compared to [17] default values, the present study's direct and indirect N2O emissions are lower than the default values, which is attributed to the lower nitrogen excretion and nitrogen volatilization rates, respectively (Table 8, Table 10 and Table 11). The low nitrogen excretion and nitrogen volatilization rate reported in our study is most likely attributed to the use of country-specific activity data on DMI, CP% content of major feed type, and DE% for prediction of nitrogen excretion rate [7,19]. In addition, our results align with the literature from other areas which also noted reduced N2O emissions with the use of local data and methodologies. For example, a study in the European Union emphasized that using specific regional feed composition data could considerably lower estimated emissions (Peterson et al., 2018). Likewise, a New Zealand study showed that accounting for local agricultural processes produced more realistic and frequently lower estimates of N2O emissions than the universal baseline figures (Johnson et al. 2019).
Additionally, the value of direct and indirect N2O emissions for matured dairy cows in this study is lower than the report for commercial dairy cows in South Africa [60]. Similarly, a lower amount of direct and indirect N2O was observed in this study than in Tadesse et al. (2020) for crossbred dairy cows in the Ethiopian highlands, possibly due to the differences in activity data used and the prediction approach we applied to estimate direct N2O emissions. These findings suggested that the use of tailored prediction techniques and country specific data can leads to an accurate prediction of GHG emission. This is useful for formulating environmental policies since it underscores the importance of localized approaches which take into account the local farming practices and context. Such tailored policies could better support emission reduction targets and help create sustainable agriculture.
4. Conclusions
By using an equation modified by Leitner et al. (2020), the present study employed a more detailed method of IPCC Tier II. To predict CH4 and N2O emissions across different farming systems, animal energy expenditure was derived from animal characteristics and performance, as well as manure management systems. The results showed that the maximum manure CH4 EFs and N2O emissions were reported for adult dairy cows in urban farming systems, whereas the minimum was reported for calves in rural farming systems. There was significant variation across intensification gradients. Urban farming systems showed significantly higher CH4 EFs and N2O for adult dairy cattle compared to rural smallholder farming systems. Compared to the IPCC Tier I default values, the present estimates of CH4 emissions are much higher for dairy cows and other animals, while N2O emissions are lower. This indicates that IPCC Tier I partly rely on default values and coefficients, which tend to overestimate or underestimate the value, which is not representative of reality on the ground. The study indicates that using region-specific information can improve the accuracy of emissions estimates deemed useful for better policy decisions and mitigation strategies for the livestock sector. In order to improve the accuracy and reduce the uncertainty of manure CH4 and N2O emissions, it is very important to generate country-specific methane conversion factors (MCF), which in turn affect the maximum methane producing capacity of manure (Bo). This study suggests that increasing the proportion of manure used for composting and biogas instead of dung cake as fuel would result in an increase in organic manure and renewable energy sources on farms, thereby improving nutrient use efficiency and reducing greenhouse gas emissions.
Supplementary Materials
The following supporting information can be downloaded at the website of this paper posted on Preprints.org.
Author Contributions
The first author (AAF) Conceptualize research idea, designed the study, data curation and analysis, interpretated the result, and drafted the manuscript. The second author (AT), participated in the study design, data collection, analysis, and manuscript write up.
Funding
None.
Institutional Review Board Statement
The research received ethical approval from the Salale University Ethics Committee, and participants were informed of their rights and responsibilities, providing explicit written consent..
Informed Consent Statement
Before the survey began, farmers were asked if they would be willing to participate.
Data Availability Statement
Data will be available upon request. The software used is available online for reviewers.
Acknowledgments
The authors are grateful to the National Livestock Development Institute for granting us access to the national dairy cattle database so that we could extract pertinent data. Additionally, we would like to express our gratitude to the reviewers who offered insightful feedback on this research, the enumerator team for gathering data, and all the farmers who generously donated their time.
Conflicts of Interest
We would like to confirm that this publication is free from any known conflicts of interest..
References
- UNEP. Thematic Focus: Climate change, Resource efficiency and Ecosystem management - Growing greenhouse gas emissions due to meat production. 2012; October:1–10.
- IPCC. Climate Change 2021—The Physical Science Basis: Working Group I Contribution to the Fifth Assessment Report of the Intergovernmental Panel on Climate Change. 2013.
- IPCC. Climate Change 2007, The Physical Science Basis: Contribution of Working Group I to the Fourth Assessment Report of the Intergovernmental Panel on Climate Change, 2007. 2007.
- Gerber PJ, Steinfeld H, Henderson B, Mottet A, Opio C, Dijkman J, et al. Tackling Climate Chnage Through Livestock: A Global Assessment of Emissions and Mitigation Opportunities. Rome, Italy: Food and Agriculture Organization of the United Nations (FAO),; 2007.
- Steinfeld H, Wassenaar T. The role of livestock production in carbon and nitrogen cycles. Annu Rev Environ Resour. 2007;32:271–94.
- Tubiello FNM, Salvatore RD, Cóndor Golec A, Ferrara S, Rossi R, Biancalani S, et al. Agriculture, Forestry and Other Land Use Emissions by Sources and Removals by Sinks. Rome, Italy; 2014.
- Wilkes A, Wassie S, Tadesse M, Assefa B, Abu M, Ketema A, et al. Inventory of greenhouse gas emissions from cattle, sheep and goats in Ethiopia (1994 - 2018) calculating using the IPCC Tier 2 approach. Environment and Climate Change Directorate of the Ministry of Agriculture. December, 2020. Addis Ababa, Ethiopia. Addis Ababa, Ethiopia; 2020.
- EPCC. Ethiopian panel on Climate Change (2015), First Assessment Report, Working Group I Report on climate change on Ethiopia. Addis Ababa, Ethiopia; 2015.
- IPCC. Guidelines for National Greenhouse Gas Inventories. IGES, Japan; 2006.
- Thornton, PK. Livestock production: Recent trends, future prospects. Philosophical Transactions of the Royal Society B: Biological Sciences. 2010;365:2853–67.
- FAO, NZAGRC. Supporting low emissions development in the Ethiopian dairy cattle sector–reducing enteric methane for food security and livelihoods. Rome; 2017.
- FAO. Livestock and livelihoods spotlight Ethiopia. 2018;:Pp12.
- FAO. Livestock, health, livelihoods and the environment in Ethiopia. An integrated analysis. Rome, Italy; 2019.
- CRGE. Ethiopian’s Climate- resilient Green Economy: Green economy Strategy. Federal Democratic Republic of Ethiopia. Addis Ababa, Ethiopia; 2011.
- FAO-NZAGRC. Supporting low emissions development in the Ethiopian dairy cattle sector-Reducing enteric methane for food security and livelihoods. Rome, Italy; 2017.
- Crumpler K, Abi Khalil R, Tanganelli E, Lapo Roffredi, Neha Rai, Meybeck A, Umulisa V, Wolf J, et al. 2021 (Interim) Global update report: Agriculture, Forestry and Fisheries in the Nationally Determined Contributions. Rome, Italy: FAO; 2021.
- IPCC. 2019 refinement to the 2006 IPCC guidelines for national greenhouse gas inventories. Geneva, Switzerland; 2019.
- Leitner S, Pelster D, Owino1 J, Marquardt S, Merbold L. Protocol for generating region-specific Tier 2 emission factors for methane (CH 4 ) and nitrous oxide (N 2 O) emissions from cattle manure. Nairobi, Kenya; 2020.
- Tadesse M, Galmessa U, Worku B. Green House Gas (Ghg) Emission from Crossbred Dairy Cattle in Small-scale Dairy Cattle Production in the Central Highlands of Ethiopia. In: Kebede FFGKFKG, የኢትዮጵያ, editors. Addis Ababa, Ethiopia: Ethiopia Institute of Agricultural Research; 2020. p. 1–900.
- Brandsma W, Mengistu D, Kassa B, Yohannes M, Van der Lee J. The Major Ethiopian Milksheds. An assessment of development potential. Wageningen, The Netherlands; 2013.
- Feyissa A, Senbeta F, Tolera A, Diriba D. Climate Smart Dairy Farming Practices for Greenhouse Gas Mitigation and Food Security Benefits in the Selale Highlands of Ethiopia A. Addis Ababa University; 2023.
- Tegegne A, Gebremedhin B, Hoekstra D, Belay B, Mekasha Y. Smallholder dairy production and marketing systems in Ethiopia: IPMS experiences and opportunities for market-oriented development. 2013.
- Zijlstra J, Berhanu T, Vernooij A, van der Lee J, Boere A. Investment opportunities in the Ethiopian Dairy sector. 2015.
- Shapiro B, Gebru G, Desta S, Negassa A, Nigussie K, Aboset G, et al. Ethiopia livestock sector analysis. ILRI Project Report. Nairobi, Kenya; 2017.
- Feyissa A, Senbeta F, Diriba D, Tolera A. Understanding variability in carbon footprint of smallholder dairy farms in the central highlands of Ethiopia. Trop Anim Health Prod. 2022;54.
- Arsham, H. Questionnaire design and surveys sampling. 2007.
- Wilkes A, Odhong C, van Dijk S, Fraval S, s Eshete Wassie S. Methods and guidance to support MRV of livestock emissions: Methods for data collection, analysis and summary results from a pilot baseline survey for the Kenya dairy NAMA. Wageningen, The Netherlands; 2019.
- Feyissa A, Senbeta F, Tolera A, Diriba D, Boonyanuwat K. Enteric methane emission factors of smallholder dairy farming systems across intensification gradients in the central highlands of Ethiopia. Carbon Balance Manag. 2023;18:1–16.
- Goopy JP, Pelster DE, Onyango A, Marshall K, Lukuyu M. Simple and robust algorithms to estimate liveweight in African smallholder cattle. Anim Prod Sci. 2018;58:1758–65.
- Haile A, Ayalew W, Kebede N, Dessie T, Tegegne A. Breeding strategy to improve Ethiopian Boran cattle for meat and milk production: IPMS (Improving Productivity and Market Success) of Ethiopian Farmers Project Working. Nairobi, Kenya; 2011.
- Dadi G, Worku A, Gudeto A, Alemu Tucho T, Guru M, Mesele F, et al. Growth Performance Evaluation of Crossbred Male Calves of Holstein Friesian with Arsi Cattle Fed on Different Dietary Ration. American Journal of Environmental and Resource Economics. 2021;6:11.
- Meseret S, Tamir B, Gebreyohannes G, Lidauer M, Negussie E. Genetic Analysis of Milk Yield in First-Lactation Holstein Friesian in Ethiopia : A Lactation Average vs Random Regression Test-Day Model Analysis. Asian Australas J Anim Sci. 2015;28:1226–34.
- Sargent FD, Lytton VH, Wall OG. Test Interval Method of Calculating Dairy Herd Improvement Association Records. J Dairy Sci. 1968;51:170–9.
- Migose SA, van der Linden A, Bebe BO, de Boer IJM, Oosting SJ. Accuracy of estimates of milk production per lactation from limited test-day and recall data collected at smallholder dairy farms. Livest Sci. 2020;2:103911. 32 May.
- Van Marle-Köster E, Mostert BE, Van Der Westhuizen J. Body measurements as selection criteria for growth in South African hereford cattle. Arch Anim Breed. 2000;43:45–56.
- Feyissa F, Prasad S, Assefa G, Kitaw G, Bediye S. The status of production, conservation and utilization of natural pasture hay for feeding dairy cattle in the greater Addis milkshed, central highlands of Ethiopia. Journal of Agricultural Research and Development. 2013;3:82–93.
- Nemera F, Tessema ZK, Ebro A. Effect of organic and inorganic fertilizer application on improvement of degraded grazing land in the central highland of Ethiopia. Livestock Research for Rural Development. 2017;29.
- Yalew S, Asmare B, Mekuriaw Y. Effects of fertilizer type and harvesting age on species composition, yield and chemical composition of natural pasture in the highlands of Ethiopia. Biodiversitas. 2020;21:4999–5007.
- NRC. Nutrient Requirements of Dairy Cattle. Seventh Re. Washington, D.C. NRC. Nutrient Requirements of Dairy Cattle. Seventh Re. Washington, D.C.: The National Academies Press; 2001.
- Ndung’u PW, Bebe BO, Ondiek JO, Butterbach-Bahl K, Merbold L, Goopy JP. Improved region-specific emission factors for enteric methane emissions from cattle in smallholder mixed crop: Livestock systems of Nandi County, Kenya. Anim Prod Sci. 2019;59:1136–46.
- Ndao S, Traoré EH, Ickowicz A, Moulin CH. Estimation of enteric methane emission factors for Ndama cattle in the Sudanian zone of Senegal. Trop Anim Health Prod. 2020;52:2883–95.
- CSIRO. Nutrient Requirements of Domesticated Ruminants. Australia; 2007.
- Lawrence PR, Stibbards RJ. The energy costs of walking, carrying and pulling loads on flat surfaces by Brahman cattle and swamp buffalo. Anim Prod. 1990;50:29–39.
- FAO. Ethiopia: Report on feed inventory and feed balance, 2018. Rome, Italy; 2018.
- Radostits, O. M. Bell JM. Nutrition of the pre-ruminant dairy calf with special reference to the digestion aiid absorption of nutrition: Can J Anim Sci. 1970;50.
- NRC NRC. Application of the 1996 NRC to Protein and Energy Nutrition of Range Cattle. Professional Animal Scientist. 1996;22:307–17.
- NRC NRC. Application of the 1996 NRC to Protein and Energy Nutrition of Range Cattle. Professional Animal Scientist. 1996;22:307–17.
- Gizaw S, Abera M, Muluye M, Dirk H, Gebremedhin B, Tegegne A. Smallholder dairy farming systems in the highlands of Ethiopia: System-specific constraints and intervention options. Nairobi, Kenya; 2016.
- Goopy JP, Onyango AA, Dickhoefer U, Butterbach-Bahl K. A new approach for improving emission factors for enteric methane emissions of cattle in smallholder systems of East Africa – Results for Nyando, Western Kenya. Agric Syst. 2018;1:72–80. 61 December.
- Opio C, Gerber P, Mottet A, Falcucci A, Tempio G, MacLeod M, et al. Greenhouse gas emissions from ruminant supply chains- A global life cycle assessment. Rome, Italy; 2013.
- Tezera, BT. Carbon Footprint of Milk at Smallholder Dairy Production in Zeway–Hawassa Milk Shed, Ethiopia. Van Hall Larenstein University of Applied Sciences; 2018.
- Tadesse M, Galmessa U, Worku B. Green House Gas (Ghg) Emission from Crossbred Dairy Cattle in Small-scale Dairy Cattle Production in the Central Highlands of Ethiopia. In: Kebede FFGKFKG, የኢትዮጵያ, editors. Addis Ababa, Ethiopia: Ethiopia Institute of Agricultural Research; 2020. p. 1–900.
- Tezera, BT. Carbon Footprint of Milk at Smallholder Dairy Production in Zeway–Hawassa Milk Shed, Ethiopia. Van Hall Larenstein University of Applied Sciences; 2018.
- IPCC. 2019 refinement to the 2006 IPCC guidelines for national greenhouse gas inventories. Geneva, Switzerland; 2019.
- Hindrichsen IK, Wettstein HR, Machmüller A, Jörg B, Kreuzer M. Effect of the carbohydrate composition of feed concentratates on methane emission from dairy cows and their slurry. Environ Monit Assess. 2005;107:329–50.
- Petersen SO, Blanchard M, Chadwick D, Del Prado A, Edouard N, Mosquera J, et al. Manure management for greenhouse gas mitigation. Animal. 2013;7:266–82.
- Doreau M, van der Werf HMG, Micol D, Dubroeucq H, Agabriel J, Rochette Y, et al. Enteric methane production and greenhouse gases balance of diets differing in concentrate in the fattening phase of a beef production system. J Anim Sci. 2011;89:2518–28.
- Pattey E, Trzcinski MK, Desjardins RL. Quantifying the reduction of greenhouse gas emissions as a result of composting dairy and beef cattle manure. Nutr Cycl Agroecosyst. 2005;72:173–87.
- Kebreab E, Clark K, Wagner-Riddle C, France J. Methane and nitrous oxide emissions from Canadian animal agriculture: A review. Can J Anim Sci. 2006;86:135–58.
- Moeletsi ME, Tongwane MI. 2004 methane and nitrous oxide emissions from manure management in South Africa. Animals. 2015;5:193–205.
- NASEM NA of SE and, M. Nutrient Requirements of Dairy Cattle. Eighth. Washington D.C.: The National Academies Press; 2021.
- Eckard RJ, Chapman DF, White RE. Nitrogen balances in high rainfall, temperate dairy pastures of south eastern Nitrogen balances in temperate perennial grass and clover dairy pastures in south-eastern Australia. Aust J Agric Res. 2007;58:1167–73.
- Eckard RJ, Chapman DF, White RE. Predicting nitrogen excretion from cattle. Aust J Agric Res. 2007;58:1167–73.
- Amon B, Amon T, Boxberger J, Alt C. Emissions of NH 3, N 2 O and CH 4 from dairy cows housed in a farmyard manure tying stall ( housing, manure storage, manure spreading ). 2001;:103–13.
Figure 1.
Map of the Study Area.
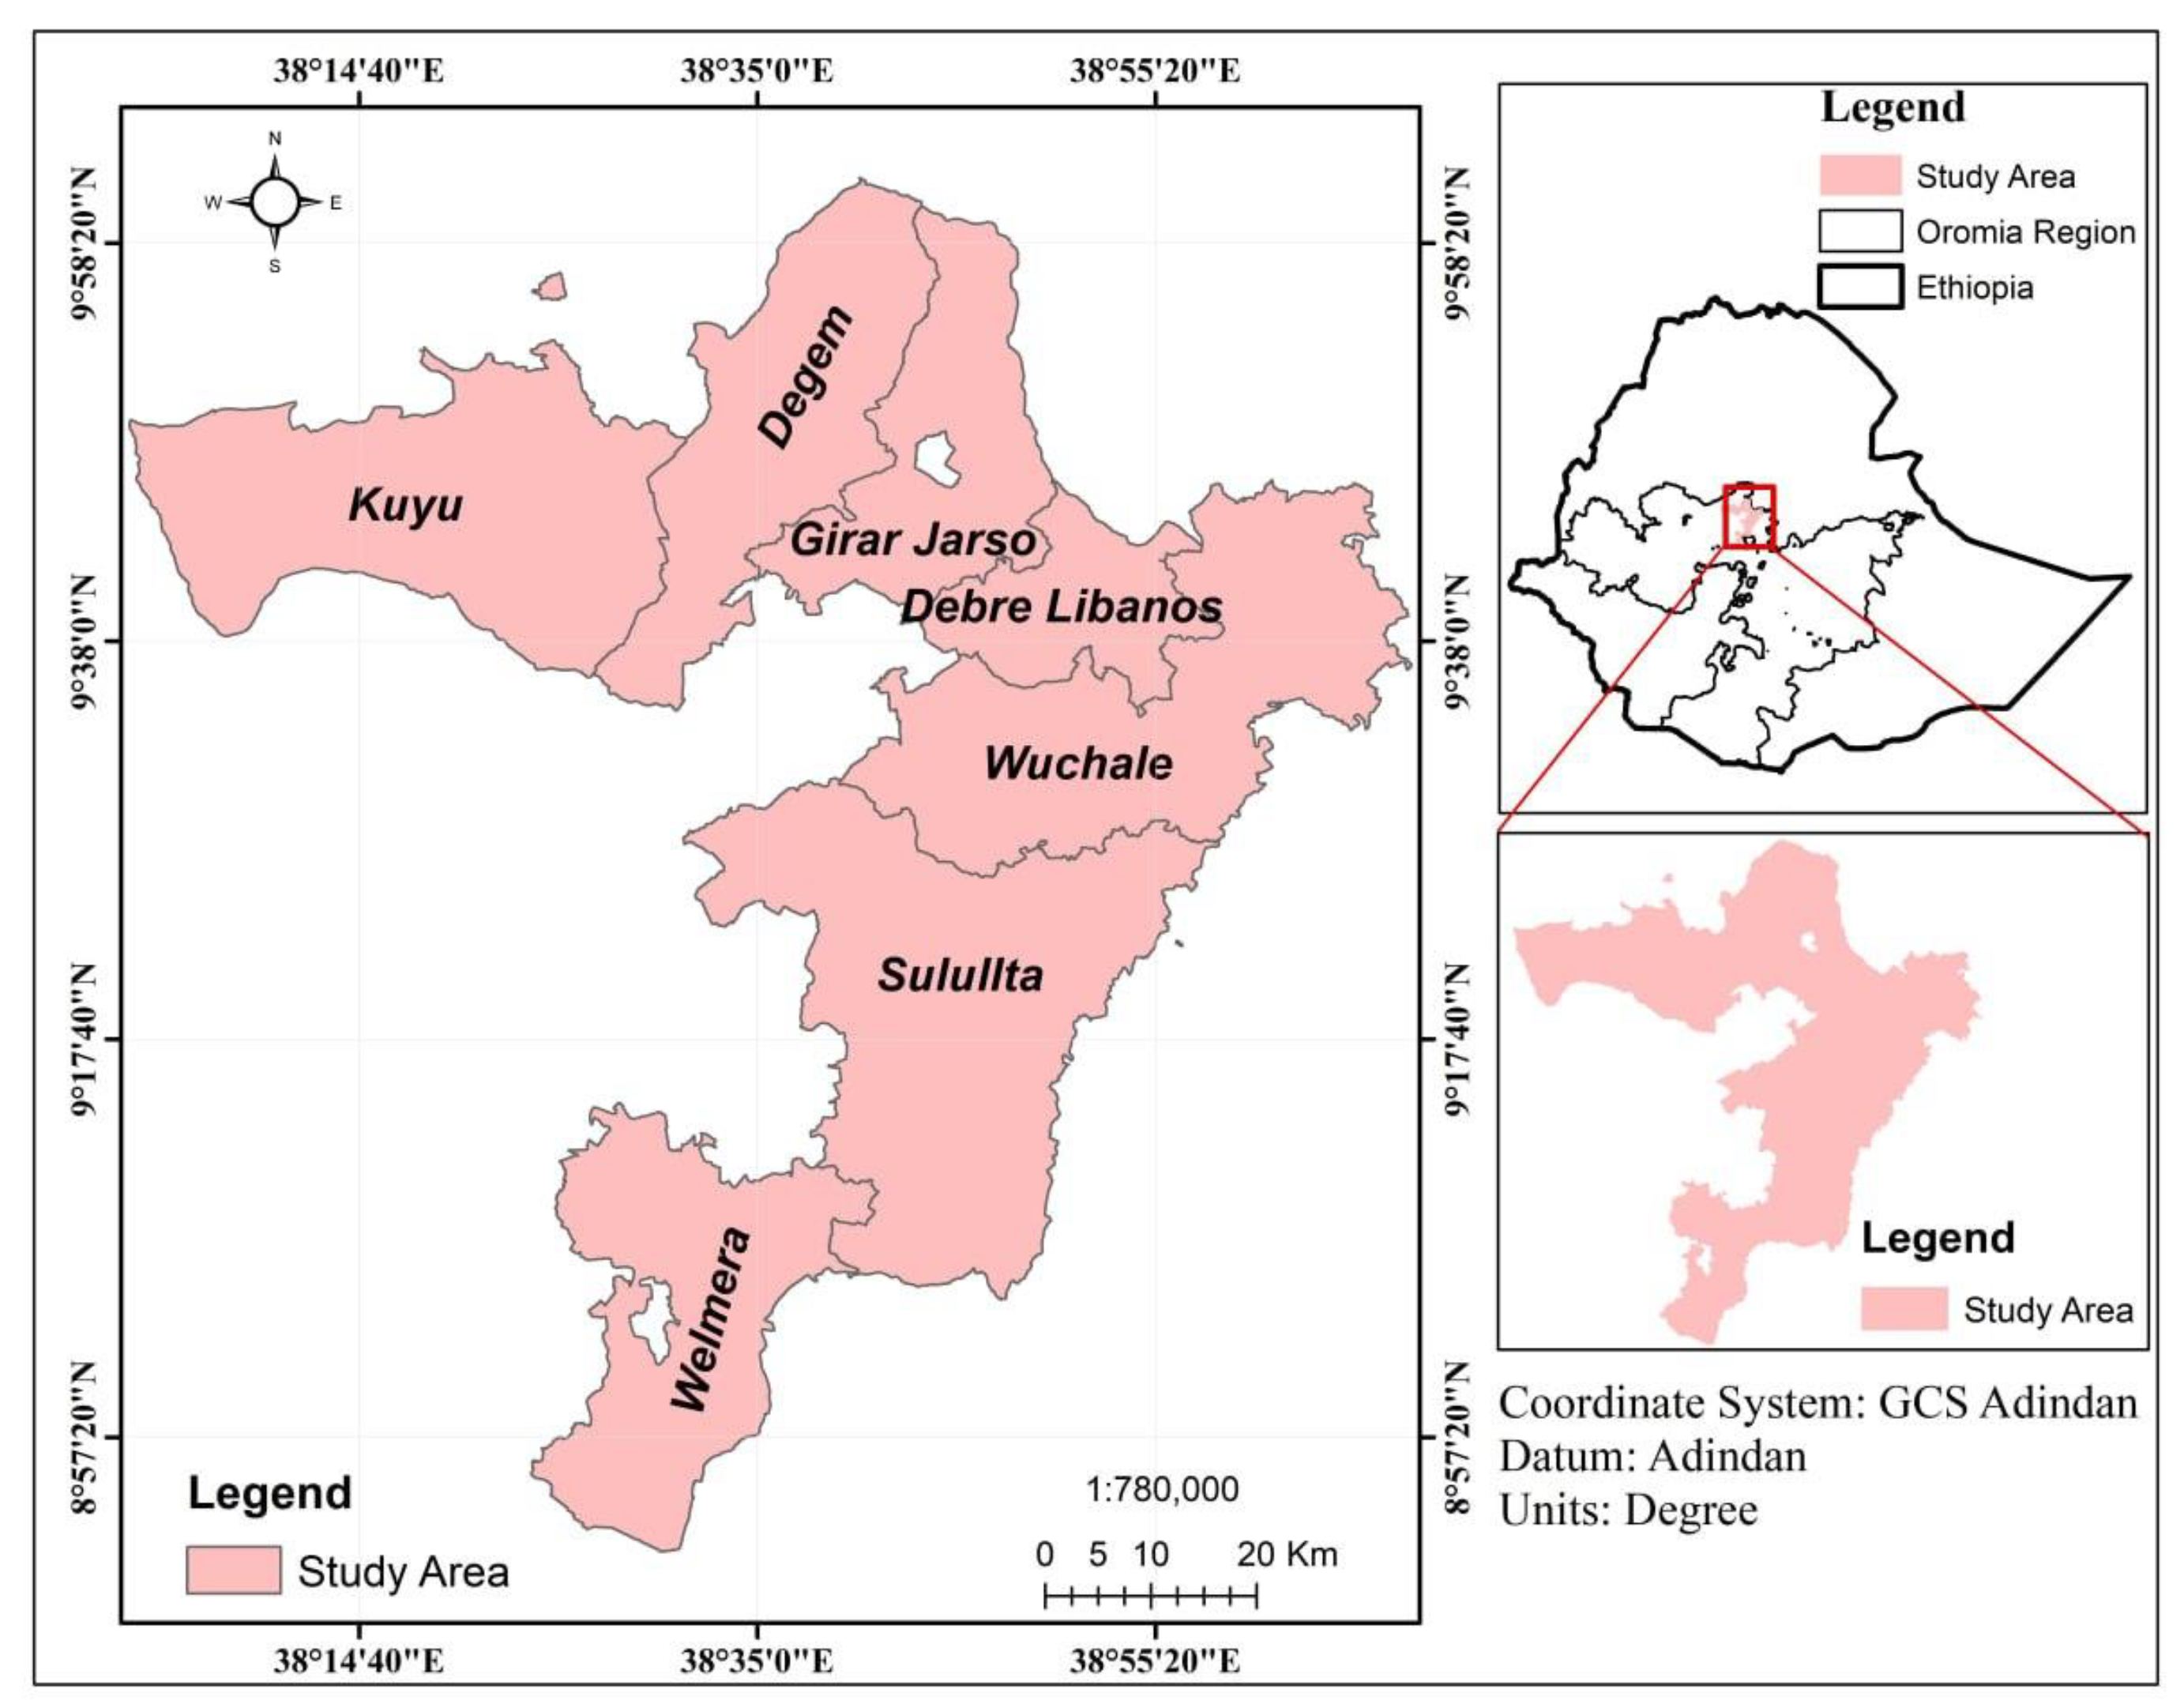
Table 1.
Herd structure, live weight (kg ± SD), animal performances, and DMD.
| Herd structure and breed composition | Farming system | ||
|---|---|---|---|
| Urban | Per-Urban | Rural | |
| Mean ± SD | Mean ± SD | Mean ± SD | |
| Breed & genotype | Pure HF & high grade | HF crosses | Local breeds |
| Adult dairy cows | 429.19a± 43.72a | 423.26 ± 42.02a | 294.16 ± 34.46b |
| Adult male | 435.27 ± 47.31 | 425.27 ± 57.17 | 351.06 ± 28.26 |
| Growing female | 271.37 ± 43.99 | 265.65 ± 39.85 | 198.3 ± 42.85 |
| Growing male | 288.13 ± 55.87 | 280.13 ± 45.87 | 234.57 ± 17.54 |
| Calf (≤12m) male and female |
141.18 ± 25.04 | 134.43 ± 25.85 | 113.35 ± 14.36 |
| Calf (≤6m) male and female |
75.11 ± 11.17 | 72.56 ± 12.04 | 57.45 ± 7.34 |
| Breeding bull | NA | NA | 346.26 ± 38.49 |
| Fattening | NA | NA | 375.69 ± 35.47 |
| Herd Performance | |||
| Milk yield (L/day) | 10.40 ± 0.84a | 8.95± 1.11b | 1.77 ± 0.18c |
| Calving interval (months) | 13.3± 0.86 | 13.7± 0.78 | 24.5 ± 0.27 |
| DMD ± SD | 62.28±3.44a | 60.1 ± 5.1b | 57.46 ± 3.83c |
Table 2.
Manure management systems of the different farming systems in the study area.
| Management Systems (%) | Farming systems | ||
|---|---|---|---|
| Urban | Peri-urban | Rural | |
| Dry lot | 11.35± 4.91 | 16.00±1.62 | 14.23 ± 1.74 |
| Solid storage | 57.57± 8.07 | 40.71± 3.56 | 27.23 ±1.75 |
| Deposited on pasture | 0 | 10.76± 1.79 | 31.5±6.05 |
| Liquid storage | 1.77±0.70 | 1.29±0.64 | 0.00 |
| Daily field spread | 1.69 ±0.50 | 4.60± 1.21 | 4.54± 1.21 |
| Compost | 1.58±0.87 | 2.96 ±0.76 | 10.10 ±1.38 |
| Burned for fuel | 25.29±3.88 | 23.18 ±1.6 | 12.40 ± 0.82 |
| Anaerobic digester | 0.75 ±0.44 | 0.5 ± 0.50 | 0 |
Table 3.
Methane emission factors (kg CH4 head-1 year-1) across farming systems.
| Farming system | Cattle category | ||||||
|---|---|---|---|---|---|---|---|
| Adult female | Adult male | Growing female | Growing male | Calf (≤1) | Calf (≤6m) | Fattening male | |
| Urban | 14.89 ± 1.51a | 6.411 ± .57a | 5.8 ± .97a | 6.41± 0.74a | 4.02± 0.71a | 2.25 ± .34a | Na |
| Peri-urban | 11.68± 1.16b | 5.101± 0.51b | 4.49± 0.67b | 5.5 ± 0.63a | 3.15± 0.62a | 1.90± 0.33b | Na |
| Rural | 3.189± 0.28c | 3.107± 0.25c | 2.659± 0.57c | 2.88 ± .22b | 0.95 ± 0.12b | 0.76 ± 0.11c | 3.39 ± 2.94 |
| Implied EF | 9.92 ± 6.61 | 4.87 ± 1.61 | 4.55± 0.98 | 4.59 ± 1.26 | 2.68 ± 0.98 | 1.63 ± 0.65 | 3.39 ± 2.94 |
Table 4.
Volatile Solid (VS) excreted (kg dry matter head-1 day-1).
| Farming system | Animal category | ||||||
|---|---|---|---|---|---|---|---|
| Adult female | Adult male | Growing female | Growing male | Calf (≤1) | Calf (≤6m) | Fattening male | |
| Urban | 3.4 | 2.7 | 2.3 | 2.7 | 1.7 | 0.95 | NA |
| Peri-urban | 3.1 | 2.5 | 2.2 | 2.6 | 1.5 | 0.93 | NA |
| Rural | 3.2 | 3.12 | 2.7 | 2.89 | 0.96 | 0.75 | 3.4 |
| Implied | 3.23 | 2.77 | 2.57 | 2.6 | 1.4 | 0.88 | 3.4 |
Table 5.
Comparison of IPCC default values of volatile Solid and EF of manure management systems.
| Sub category | IPCC (2019) | Urban | Peri-urban | Rural | ||||
|---|---|---|---|---|---|---|---|---|
| VS | CH4 | VS | CH4 | VS | CH4 | VS | CH4 | |
| Adult cows | 2.468 | 1 | 3.4 | 14.89 | 3.1 | 11.68 | 3.2 | 3.19 |
| Adult male | 1.622 | 1 | 2.7 | 6.41 | 2.5 | 5.10 | 3.12 | 3.11 |
| Growing female | 2.236 | 1 | 2.3 | 5.8 | 2.2 | 4.49 | 2.7 | 2.66 |
| Growing male | 1.77 | 1 | 2.7 | 6.41 | 2.6 | 5.5 | 2.89 | 2.88 |
| Calves <1 year | 0.913 | 1 | 1.7 | 4.02 | 1.5 | 3.15 | 0.96 | 0.95 |
| Calves < 6 | 0.95 | 2.25 | 0.93 | 1.90 | 0.75 | 0.76 | ||
Table 7.
Nitrogen excretion (kg N head-1 year-1) for cattle across farming systems.
| Farming system | Nitrogen excretion (kg N2O head-1 year-1) | ||||||
|---|---|---|---|---|---|---|---|
| Adult female | Adult male | Growing female | Growing male | Calf (≤1) | Calf (≤6m) | Fattening male | |
| Urban | 69.82 | 32.39 | 36.12 | 38.41 | 29.49 | 26.11 | Na |
| Peri-urban | 64.51 | 31.69 | 32.61 | 34.05 | 25.34 | 20.25 | Na |
| Rural | 34.87 | 24.28 | 21.47 | 23.53 | 17.61 | 14.23 | 28.01 |
Table 8.
Comparison of IPCC default values of nitrogen excretion rate (NER) and direct N2O emission of manure management systems.
Table 8.
Comparison of IPCC default values of nitrogen excretion rate (NER) and direct N2O emission of manure management systems.
| Sub category | IPCC (2019) | Urban | Peri-urban | Rural | ||||
|---|---|---|---|---|---|---|---|---|
| NER | Direct N2O | NER | Direct N2O | NER | Direct N2O | NER | Direct N2O | |
| Adult cows | 124.61 | 2.036 | 69.82 | 0.4 | 64.51 | 0.37 | 34.87 | 0.17 |
| Adult male | 68.99 | 2.33 | 32.39 | 0.14 | 31.69 | 0.13 | 24.28 | 0.2 |
| Growing female | 44.02 | 1.162 | 36.12 | 0.25 | 32.61 | 0.2 | 21.47 | 0.21 |
| Growing male | 49.06 | 0.9 | 38.41 | 0.26 | 34.05 | 0.22 | 23.53 | 0.23 |
| Calves <1 year | 19.71 | 0.325 | 29.49 | 0.16 | 25.34 | 0.14 | 17.61 | 0.1 |
| Calves < 6 | 26.11 | 0.12 | 20.25 | 0.04 | 14.23 | 0.06 | ||
Table 9.
Table 9. Indirect N2O emissions from manure management, kg N2O for different categories of cattle across farming systems.
Table 9.
Table 9. Indirect N2O emissions from manure management, kg N2O for different categories of cattle across farming systems.
| Farming system | Indirect N2O (kg N2O head-1 year-1) | ||||||
|---|---|---|---|---|---|---|---|
| Adult female | Adult male | Growing female | Growing male | Calf (≤1) | Calf (≤6m) | Fattening male | |
| Urban | 0.22 ± 0.02a | 0.16± 0.014a | 0.14± .023a | 0.15± 0.017a | 0.09± 0.01a | 0.08 ± .01a | Na |
| Peri-urban | 0.16± 0.015b | 0.14± 0.01b | 0.06± 0.01b | 0.1 ± 0.011a | 0.06± 0.011a | 0.04± 0.003b | Na |
| Rural | 0.04± 0.004c | 0.05± 0.004a | 0.04± 0.01c | 0.07 ± 0.01b | 0.03 ± 0.004b | 0.02 ± 0.003c | 0.08 ± 0.01 |
Table 10.
Table 10. Nitrogen volatilization (kg N head-1 year-1) for different categories of cattle across farming systems.
Table 10.
Table 10. Nitrogen volatilization (kg N head-1 year-1) for different categories of cattle across farming systems.
| Farming system | Nitrogen excretion (kg CH4 head-1 year-1) | ||||||
|---|---|---|---|---|---|---|---|
| Adult female | Adult male | Growing female | Growing male | Calf (≤1) | Calf (≤6m) | Fattening male | |
| Urban | 13.87 | 7.99 | 8.72 | 9.10 | 5.44 | 3.12 | Na |
| Peri-urban | 10.03 | 6.00 | 3.53 | 5.52 | 3.85 | 2.59 | Na |
| Rural | 3.81 | 3.28 | 2.73 | 3.25 | 1.75 | 1.11 | 5.16 |
Table 11.
Table 11. Comparison of IPCC default values of nitrogen volatilization (kg N head-1 year-1) and indirect N2O emission of manure management systems.
Table 11.
Table 11. Comparison of IPCC default values of nitrogen volatilization (kg N head-1 year-1) and indirect N2O emission of manure management systems.
| Sub category | IPCC (2019) | Urban | Peri-urban | Rural | ||||
|---|---|---|---|---|---|---|---|---|
| NVn | Indirect N2O | NVn | Indirect N2O | NVn | Indirect N2O | NVn | Indirect N2O | |
| Adult cows | 27.79 | 0.316 | 13.87 | 0.22 | 10.03 | 0.16 | 3.81 | 0.04 |
| Adult male | 15.38 | 0.36 | 7.99 | 0.16 | 6.00 | 0.14 | 3.28 | 0.05 |
| Growing female | 9.82 | 0.18 | 8.72 | 0.14 | 3.53 | 0.06 | 2.73 | 0.04 |
| Growing male | 10.94 | 0.14 | 9.10 | 0.15 | 5.52 | 0.1 | 3.25 | 0.07 |
| Calves <1 year | 4.4 | 0.05 | 5.44 | 0.09 | 3.85 | 0.06 | 1.75 | 0.03 |
| Calves < 6 | 3.12 | 0.08 | 2.59 | 0.04 | 1.11 | 0.02 | ||
Table 12.
Table 12. Uncertainties in methane emission factors from manure management systems.
| Farming system | Methane (kg CH4 head-1 year-1) | ||||||
|---|---|---|---|---|---|---|---|
| Adult female | Adult male | Growing female | Growing male | Calf (≤1) | Calf (≤6m) | Fattening male | |
| Urban | -48%/+22 | -22%/+12% | -34%/+26 | -26/+21 | -30%/+47% | -40%/+18% | Na |
| Peri-urban | -36%/+26% | -24%/+16% | -30%/+26 | -21%/+16 | -30%/+51% | ±31% | Na |
| Rural | -19%/+33% | -21%/+30% | ± 42% | -25%/+20% | -27%/+25% | -20%/+23% | -16%/+24% |
| Implied | -34%/+27% | -22%/+19 | -35%/+31% | -24%/+19 | -29%+41% | -30%/+24% | |
Table 13.
Table 13. Uncertainties in N2O emission factors from manure management systems.
| Farming system | Nitrous oxide (kg N2O head-1 year-1) | ||||||
|---|---|---|---|---|---|---|---|
| Adult female | Adult male | Growing female | Growing male | Calf (≤1) | Calf (≤6m) | Fattening male | |
| Urban | -48%/+22 | -22%/+13% | -30%/+26 | -26/+21% | -31%/+46% | -40%/+16% | Na |
| Peri-urban | -35%/+26% | -24%/+15% | -30%/+26 | -21%/+16% | -30%/+51% | ±31% | Na |
| Rural | -19%/+32% | -20%/+30% | -42%/+41 | -24%/+20% | -27%/+25% | -20%/ +13% | -16%/+24% |
| Implied | -34%/+27% | -22%/+19% | -34%/+31% | -27%/+19% | -29%/+41% | 30%/+20% | |
Disclaimer/Publisher’s Note: The statements, opinions and data contained in all publications are solely those of the individual author(s) and contributor(s) and not of MDPI and/or the editor(s). MDPI and/or the editor(s) disclaim responsibility for any injury to people or property resulting from any ideas, methods, instructions or products referred to in the content. |
© 2025 by the authors. Licensee MDPI, Basel, Switzerland. This article is an open access article distributed under the terms and conditions of the Creative Commons Attribution (CC BY) license (http://creativecommons.org/licenses/by/4.0/).
Copyright: This open access article is published under a Creative Commons CC BY 4.0 license, which permit the free download, distribution, and reuse, provided that the author and preprint are cited in any reuse.


