
Submitted:
16 May 2025
Posted:
19 May 2025
You are already at the latest version
Abstract
Bioenergy and organic fertilizer production from livestock manure are expected to provide an opportunity to obtain renewable resources, including environmental potential. Therefore, the main purpose of this study was to assess the economic and ecological potential of biogas and compost from livestock manure in Bangladesh using mathematical equations and spatial analysis. The study demonstrated that approximately 216.97 million tons of livestock manure were produced in 2023, and it accounted for a total biogas potential of 15,035.50 million m3, which could be converted into 27.06 million MWh of electricity, with 13.50 million tons of biofertilizer additionally. Again, this manure had the potential to produce a total of 67.36 million tons of compost, which can replace the agricultural uses of synthetic fertilizers, such as 31.41% nitrogen, 37.95% phosphorus, and 86.37% potassium content fertilizer in 2023. The greenhouse gas (GHG) emissions reduction potential by producing bioenergy and compost was assumed as 21.41 and 45.27 million tons CO2eq, respectively. In addition, biogas digestate applications can reduce manure nutrients leaching out by about 214.94 kgha-1, whereas the manure compost had the nutrients leach out reduction potential of 52.15 kgha-1. However, this study created the regional pattern maps of livestock manure socio-economic potentiality, hotspot identification, and environmental benefits assessments, which will help formulate sustainable manure management strategies for biogas and compost production in Bangladesh.
Keywords:
biogas production
; compost production
; GHG emissions reduction potential
; manure nutrients leach-out
; hotspots analysis
; synthetic fertilizer use
; spatial analysis
1. Introduction
The livestock sector is considered an important agricultural subsector in Bangladesh, where manure disposal is a critical part of livestock production. About 432.38 million head of farm animals [1] produced a large volume of manure, which has remarkable environmental impacts due to improper manure management [2]. Improper management of livestock manure is a potential cause of GHG emissions [3,4], and the emissions from manure storage and management represent 10% of total emissions from the livestock sector [5]. The Food and Agriculture Organization estimated that the global annual GHG emissions from livestock manure were more than 1.4 billion tons CO2eq in 2018, where 347 million tons CO2eq from manure management (biogas, compost, etc.) systems [3]. Another major problem confronting this industry is the contamination of water bodies by leaching manure from pastureland and agricultural soil [6,7]. In the case of nitrogen (N) leaching from livestock manure, when applied to agricultural land, about 35 million tons of manure N are lost in water and runoff, leading to pollution of waterways and coastal seas [3]. Therefore, improved manure management is an important issue for reducing GHG emissions and manure nutrient leach-out to water and getting socio-economic benefits from the livestock sector.
Several policies, laws, and regulations related to environmental protection encourage the creation of valuable resources from waste in Bangladesh. The government has highlighted the importance of producing renewable energy from agricultural waste to achieve low carbon emissions. The National Environment Policy of 2018 suggests introducing green technologies to upgrade the environment, using natural resources properly [8]. The National 3R strategy for waste management focuses on recycling and reusing natural resources to obtain renewable energy, thereby decreasing our reliance on fossil fuels for energy production [9]. Furthermore, the overconsumption of fossil fuels for energy generation poses a significant threat to sustainable development, making it essential to explore alternative energy sources to address this challenge [10,11,12]. Among the alternative energy generation technologies, anaerobic digestion (AD) is an efficient way to transform waste into resources, and it is a biological process to convert waste materials into biogas as a clean biofuel and digestate as a nutrient-rich byproduct [13,14,15]. The primary objective of any biogas industry is to reduce fossil fuel consumption, with the final goal of mitigating global warming [16]. However, the previous studies related to biogas potential in Bangladesh [17,18], stated that livestock manure had the potential to produce biogas as a potent source of renewable energy, and digestate can be used as biofertilizer.
Alternatively, livestock manure can be used as organic fertilizer by composting, which can lower the volume and weight of the original biowaste, and reduce the viability of pathogens that benefit soil function and crop quality [19,20]. Previous studies also recommended using livestock manure as an excellent source of nutrients to enrich soils [21,22]. However, direct land application of manure will not be a good option due to the leaching of manure nutrients to nearby water sources, which causes eutrophication [23]. Composting helps to bind nutrients effectively in organic forms and reduces pathogens, nuisance odor emissions, and moisture content of livestock waste, which results in a product that is more environmentally safe than raw manure application [24,25]. Moreover, compost generation might be a cheap alternative to commercial fertilizer for fertile soil, and it is viewed as a viable option for reducing the amount of waste [26].
Therefore, livestock manure can serve as compost or energy, with composting and anaerobic digestion remaining the two primary methods for recovering resources and energy from agricultural wastes [19]. A review of scientific literature highlighted various studies on manure management [3,27]; renewable energy production from livestock waste alongside emissions mitigation approaches [28,29,30,31,32]; biogas generation scenarios derived from animal waste [14,16,17,18,33]; and compost generation from animal manure accompanied by emissions assessments [37,38,39]. Nevertheless, these studies did not consider the potential for biogas and compost production concerning the aquatic environment. This study evaluates both the potential for reducing greenhouse gas (GHG) emissions and nutrient leaching from manure through the generation of bioenergy and organic fertilizer from livestock manure, a crucial aspect for this riverine country. Subsequently, regional pattern maps are created using GIS software, utilizing large datasets from various livestock types at the district and sub-district levels. This approach is novel for this study area, as prior research predominantly concentrated on national-level data, but this study considered the regional level data. Additionally, this research identifies hotspots for biogas and compost production, essential for developing strategies for sustainable manure management in Bangladesh in the future.
2. Materials and Methods
Livestock manure potential was assessed for both biogas and compost production cases in Bangladesh using mathematical equations. Based on this theoretical estimation, shapefiles were formulated to make regional pattern maps of various indicators such as biogas and electricity potential, compost and synthetic fertilizer replacement potential, GHG emissions, and manure nutrients leaching reduction potential, etc. The flowchart is given in Figure 1.
2.1. Data Sources and Processing
Data were collected from a report that was surveyed by the Department of Livestock Services (DLS) in 2023. The data related to rice production were collected from the Bangladesh Bureau of Statistics (BBS) and the Department of Agricultural Extension in Bangladesh. Some data, like manure generation, biogas, electricity, biofertilizer, and compost potential, were generated by mathematical analysis, and the equations were modified from previous articles and publications related to livestock manure management, which were discussed in specific sections. During mathematical estimation, this study considered the manure from six livestock (cattle, buffalo, sheep, goat, chicken, and duck) for the evaluation of biogas and compost potential, as these animals are generally raised in Bangladesh [1].
Before spatial analysis, the collected survey data (livestock population in each district/upazila) and mathematically estimated data (manure generation, biogas yield, electricity generation, biofertilizer yield, compost production, synthetic fertilizer replacement) were processed on a spreadsheet to make shape file data by using GIS (ArcMap 10.8) software. The shape file was further linked to the administrative data set retrieved from the BBS, and this integrated spatial database was used to interpret the spatial analysis results.
2.2. Assessment of Livestock Manure Generation
The amount of manure generated by livestock varies based on the animal type, feeding method, size, and breed [27]. Large animals are estimated to produce about 10-22.5 kg of manure per day, while small animals generate around 1.6-2 kg/day, and poultry contributes approximately 0.08-0.1 kg/day [17]. The manure yield is calculated as 10%, 4%, and 3% of the body weight for large animals, small animals, and poultry, respectively. In Bangladesh, the average weights of livestock are 190 kg for large animals, 20 kg for small animals, and 1.5 kg for poultry [28,29]. Consequently, the projected daily manure output is 19 kg for large animals, 0.8 kg for small animals, and 0.045 kg for poultry. Although collecting all manure is unfeasible, the availability coefficient has been included to estimate the total potential for biogas and compost. This coefficient was assumed as 50% for large animals, 13% for small animals, and 99% for poultry. The estimated available manure for each district took into account the respective numbers and types of livestock in all districts of Bangladesh.
2.3. Biogas, Electricity, and Biofertilizer Potential
Various factors, including animal size, body weight, percentage of total solids (TS), and availability, affect the overall biogas production from animal wastes [27]. TS is a critical element in the biogas production from animal waste, with TS distribution in manure ranging from 25-30% for large animals, 18-25% for small animals, and 10-29% for poultry [27,29]. Furthermore, biogas yield based on TS varies among animal types, with estimates of 0.6-0.8 m3 kg-1 TS for large animals, 0.3-0.4 m3 kg-1 TS for small animals, and 0.3-0.8 m3 kg-1 TS for poultry [17,18,27,29,30]. All values for the various factors used to calculate biogas potential in this study are displayed in Table 1. Equations (1, 2, 1,2,3) were utilized to estimate the potential for biogas production [28,30,31,32,33].
Here, ɳ denotes the coefficient factor (in %) for biogas to electricity conversion. The ɳ value depends on energy generation systems, and it varies from 35 to 42% for large turbine structures and 25% for small generators [28,34]. However, this study presumed the lowest values for this coefficient factor for electricity generation from biogas. Energy content in biogas was estimated by considering the calorific value (21.8 MJ/m3) of biogas. Thus, the computed energy content was 6 kWh m−3, as 1 kWh is the equivalent of 3.6 MJ [28,35]. DM indicates the dry mass, while VS is volatile solids in manure. VS in DM is responsible for the production of biogas. The percentage of DM in manure is 25%, 18%, and 10%, whereas the VS is 80%, 80%, and 70% of DM for large animals, small animals, and poultry, respectively [36].
Theoretical potential of biogas production (m3/year) = Total manure (kg/year) × TS in manure × availability coefficient × Biogas yield (m3/kg TS)
Electricity generation from biogas = Quantity of biogas produced × Energy content in biogas × η
Biofertilizer Potential = (DM - VS) + 40% of VS
2.4. Compost Production Potential
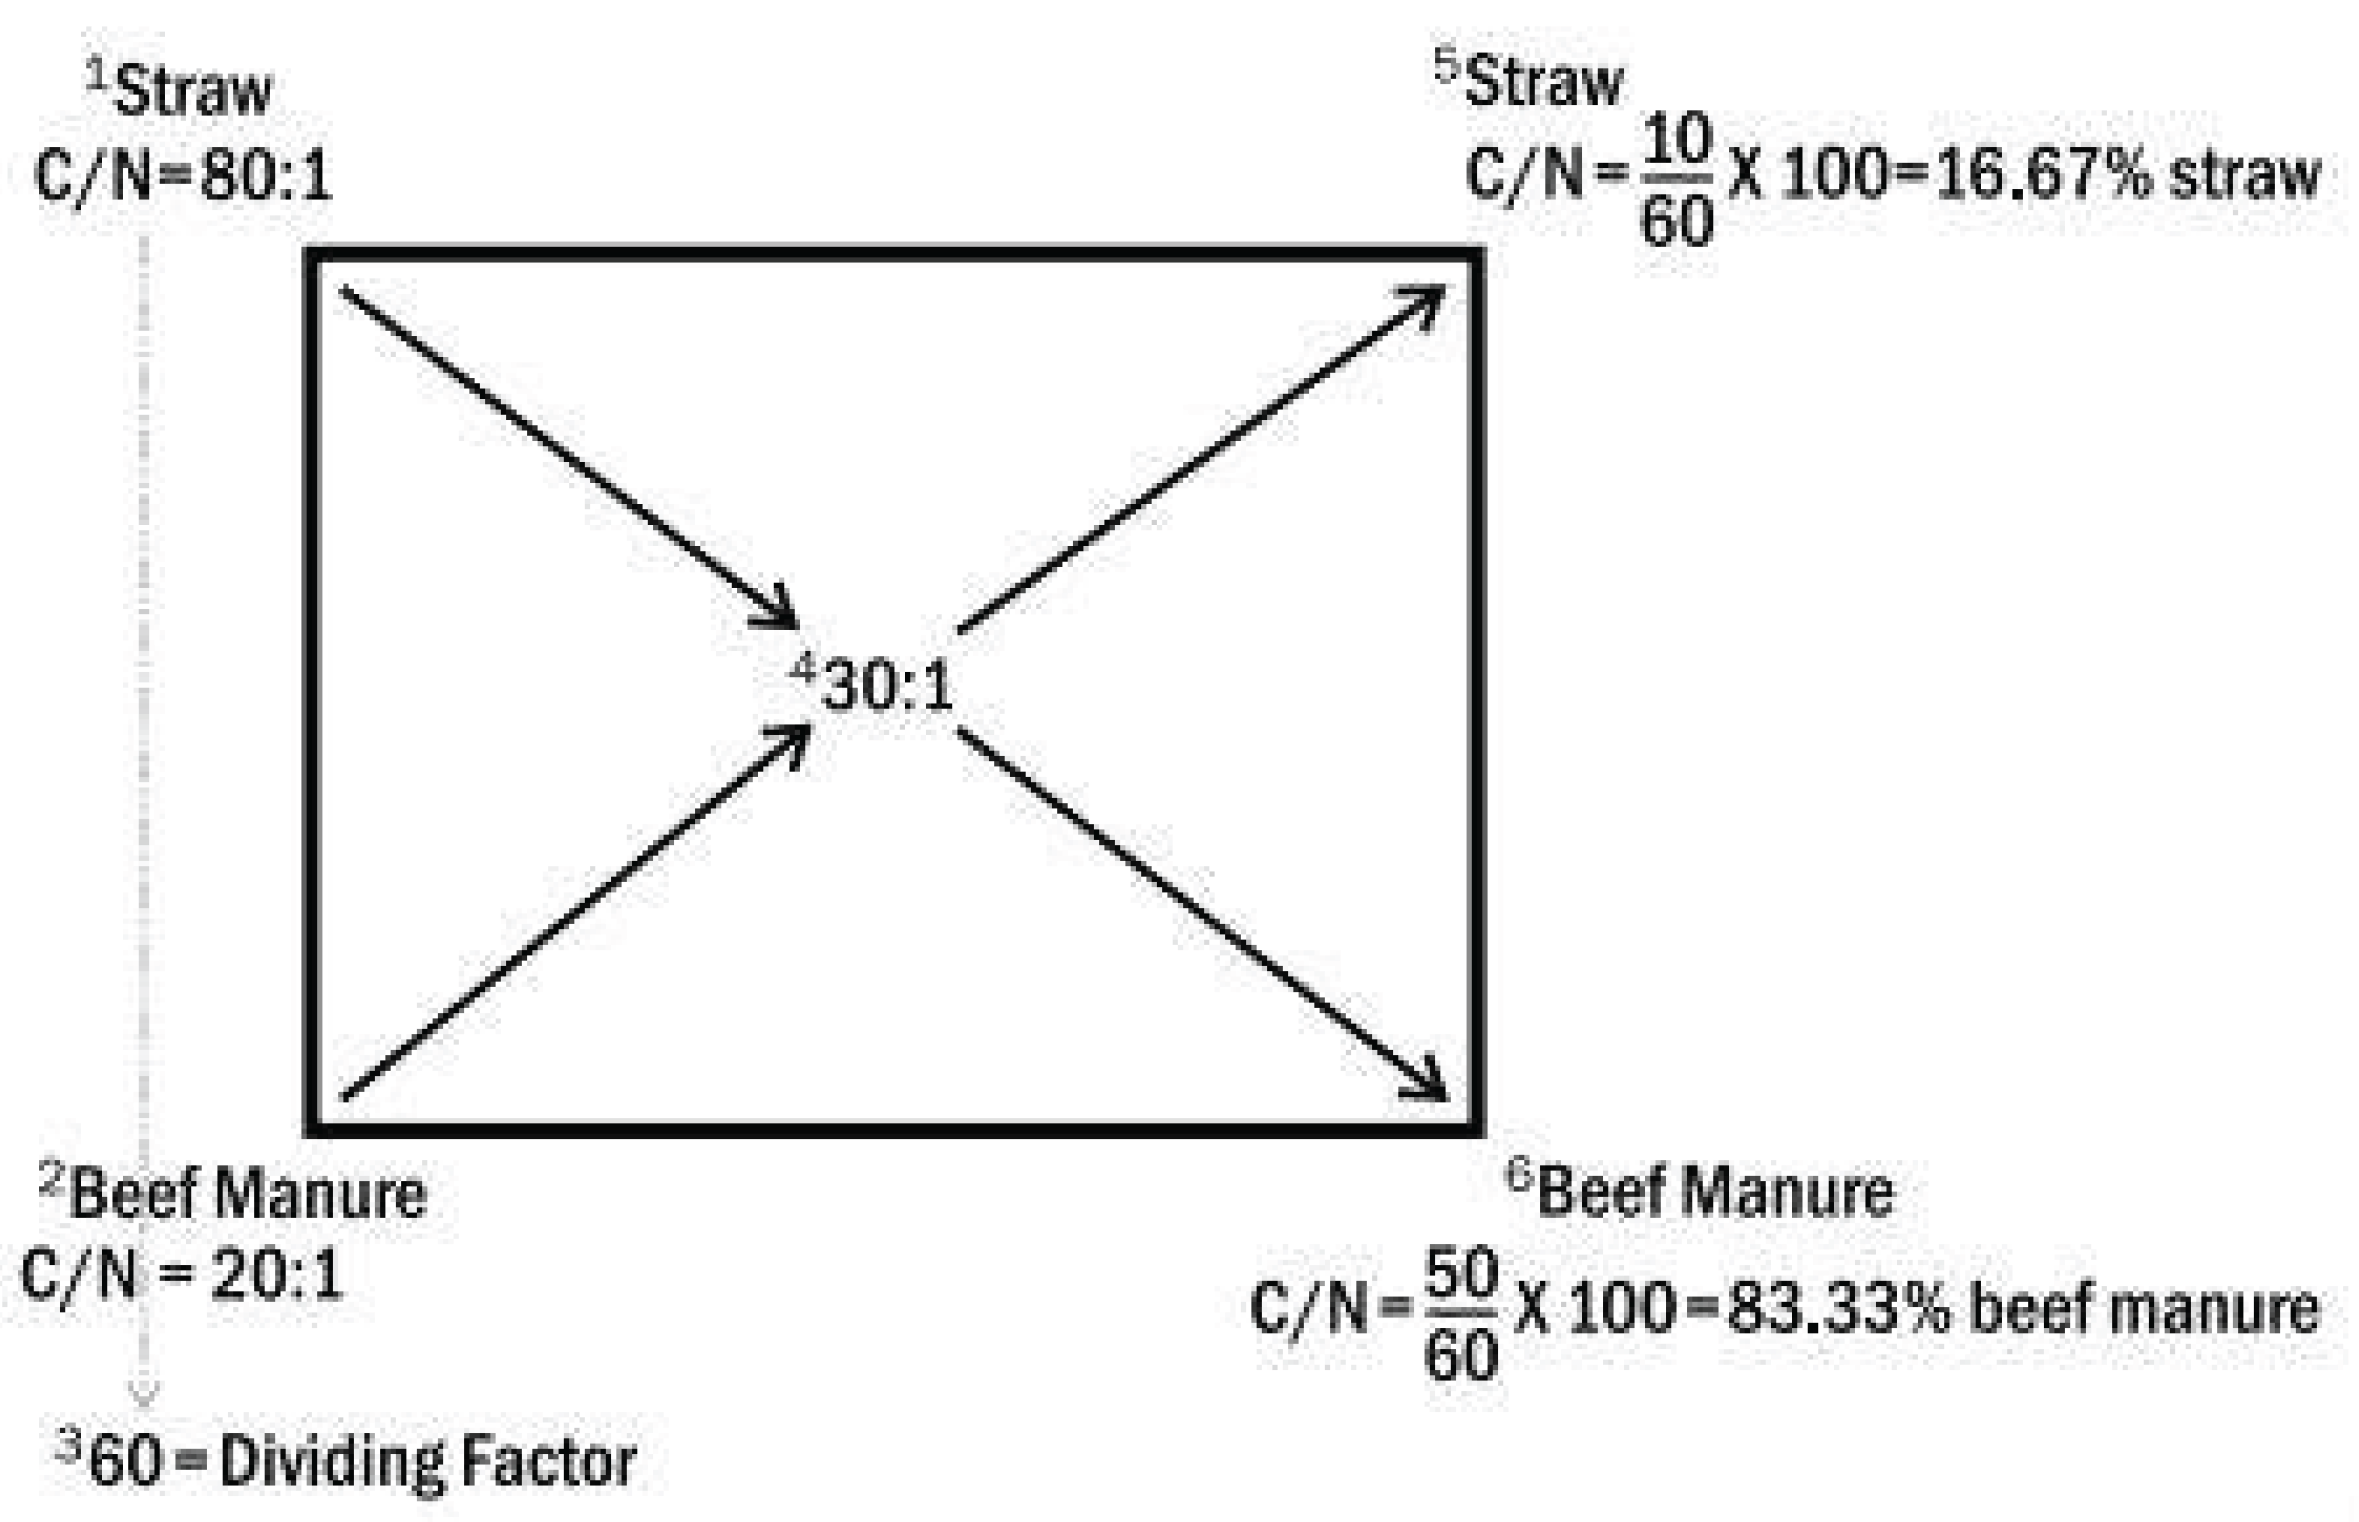
The carbon-to-nitrogen (C/N) ratio is one of the most important parameters for composting. In this study, compost was considered a mixture of livestock manure and rice straw to get the optimum C/N ratio. For the carbon source, here rice straw is considered because rice is the main crop in Bangladesh and is cultivated all over the country. The C/N ratio in a composting pile needs to range from 20:1 to 40:1. However, the C/N ratio depends on types of manure, such as 18-20:1 for large animal manure, 16-18:1 for small animal manure, and 6-7:1 for poultry manure, respectively, whereas the C/N ratio for rice straw is ranges from 80-120:1 [20,37]. This study considered the C/N ratio of compost to be 30:1, and the lowest C/N ratio values of manure and rice straw were used for compost production potential from available manure. How much manure and rice straw are needed for the desired C/N ratio is estimated by the Pearson Squire Procedure [20]. A detailed worksheet for the total amount of compost calculation based on the C/N ratio is provided in the appendix (Figure A1 and Table A1). Reduction of total mass after composting of feedstock ranged from 10% - 50% of the initial mass [38]. This study assumed a higher value of mass reduction percentage to calculate total compost generation from livestock manure.
2.5. Synthetic Fertilizer Replaceable by Manure Compost
The percentage of synthetic fertilizer replaceable by livestock manure compost (SR) was calculated by equations (4 and 5) [39]. The average values for N, P, and K content in livestock manure, loss of respective nutrients during the composting process, and bioavailability of nutrients by agricultural plants from compost used in this study are mentioned in Table 2 and Table 3. The use of synthetic fertilizer in districts was collected from the allocation of fertilizer in 2023 by the Department of Agriculture in Bangladesh [40].
SR (%) = 100 × Estimated yearly nutrient supply from manure compost ÷ Used or allocated synthetic fertilizer in a year
Nutrient supply = (% of N, P, and K content in manure) × (yearly available manure generation) × (100 – loss of N, P, and K during composting) × 0.01 × (Bioavailability of N, P, and K by agricultural plants)
2.6. Hotspot Analysis
The “Hot Spot Analysis” was performed to identify hotspots for biogas and compost production from different livestock manure in Bangladesh using GIS (ArcMap 10.8) software. This tool identifies statistically significant spatial clusters of high values (hot spots) and low values (cold spots), and it works by looking at each feature within the context of neighboring features [51]. However, a feature with a high value is interesting but may not be a statistically significant hot spot. To get a statistically significant hot spot, a feature will have a high value and be surrounded by other features with high values.
2.7. GHG Emissions Reduction Potential of Biogas
2.7.1. GHG Emissions from Biogas Plant
In biogas-based power generation plants, noticeable emissions of methane (CH4) and nitrous oxide (N2O) are not produced, making estimations unnecessary [52,53]. Nonetheless, some CH4 leakage may occur from the bioreactor; hence, this study assumed a 5% leakage rate from the biodigester [54]. The CH4 content in biogas varies with manure types, and this study classifies CH4 concentrations as 60%, 45%, and 60% for large animals, small animals, and poultry manure, respectively [28,55,56]. To estimate greenhouse gas (GHG) emissions from methane leakages, Equation (6) was applied [18,54,57]. Equation (7) was used to calculate the equivalent of CH4 [17,54]. The global warming potential of CH4 compared to CO2 is 25 kg CO2 per kg CH4 [58].
CH4 emissions due to leakages = 0.05 × Total CH4 produced × Methane density (0.717kg/m3)
Emission from biogas (CO2eq) = Methane emissions due to leakages × Global warming potential of CH4
2.7.2. Avoided Emissions for Biogas by Replacing Natural Gas
The potential for reducing GHG emissions from biogas has been evaluated concerning fossil fuels, particularly natural gas. Economic Review states that Bangladesh achieved its highest electricity generation from natural gas in 2023, accounting for approximately 50.32% of total grid production [59]. This study used Equation (8) to estimate the CO2eq emissions reduction potential from substituting natural gas with biogas [54,60]. Here, the specific emission factor (SEF) for natural gas is 2.75 kg CO2 per liter [54]. Natural gas is composed of about 90% CH4 [61,62]. The volume of natural gas equivalent to methane is in a 1:1.11 ratio. Therefore, the volume of natural gas corresponding to CH4 in liters is determined by multiplying the total amount of CH4 in biogas by the equivalent factor (1.11). The net reduction of GHG emissions was calculated using Equation (9).
Avoided CO2eq emission = Quantity of natural gas equivalent to CH4 in liter × Specific emission factor (SEF)
Net reduction of GHG emissions = Avoided CO2eq emission – Emission from biogas (CO2eq)
2.7.3. GHG Emissions Reduction Potential of Compost
The GHG emissions reduction potential for livestock manure compost was estimated compared to the emissions produced from synthetic fertilizers using equation (10).
where, GRC = GHG emissions reduction potential of compost (kg CO2eq)
𝐺𝑅C = TC × ASR × (𝐺SF – 𝐺C)
TC = Total compost from livestock manure (kg)
ASR = Average synthetic fertilizer replaceable by manure compost (%)
GSF = GHG emission rate (kg CO2eq/kg synthetic fertilizer)
GC = GHG emission rate (kg CO2eq/kg compost)
The GHG emission factors for synthetic fertilizer and compost are listed in Table 4 and Table 5. The GHG emission from composting is affected by many factors, such as the types of waste, the technology of composting, the methods of quantification of GHG emissions, etc. [63,64,65,66] where the GHG emission factor for synthetic fertilizer varies according to the region and fertilizer types. Though the emission from synthetic fertilizer and compost has no specific criteria and the values vary extensively, this study assumed the average value of the referred ranges for the assessment of the GHG emissions reduction potential of manure compost in Bangladesh.
2.8. Nutrient Leach-Out Reduction Potential of Biogas and Compost
The nutrient leach-out reduction potential of biogas and compost production was estimated by screening the leach-out nutrients through biofertilizer/compost from the total leach-out nutrients through livestock manure. This study assumed that about 50% of the total generated manure was applied in the agricultural field or left on pastureland. However, most of the studies focus on nutrient loss through runoff, subsurface drainage, and leaching, mainly from cropland due to fertilizer or chemical uses, and nutrient loss is influenced by many factors such as management practices, climate, soil properties, rainfall, and topography [79,80,81,82]. This study used the average value of the referenced range for the N and P content in manure, biofertilizer, and compost (Table 2) and N and P leach-out factors (Table 6) for calculating nutrient reduction potentials by using equation (11) [83].
where NLD = Nutrients leach out in each district (kgha-1)
NLD = (LFN + (Ii – RDN))
LFN = Leaching factor for nutrients (kgha-1)
Ini = Intensity for N or P of stock item, i, such as manure of each livestock type, biofertilizer, compost, was divided by the area of the district (kgha-1).
RDN = Recommended dose of nutrients application in the field (kgha-1), and it was considered as 30 and 15 kgha-1 for nitrogen and phosphorus application to the field from the farmyard manure source [84].
3. Results
3.1. Biogas and Compost Potential
Division-wise biogas and compost production potential against livestock populations are shown in Figure 2. Amongst divisions, the highest biogas production of 2690.12 million m3 (18.72% of the total biogas) was estimated from Rangpur followed by Rajshahi (2624.07 million m3), Chattogram (2161.47 million m3), Khulna (2074.01 million m3), Dhaka (2006.04 million m3) and Sylhet division has the least (5.66%) share of the total biogas potential from livestock manure. Similarly, the highest compost production potential was found in the Rangpur division (12,116.32 kilotons/year) and the lowest compost potential in the Sylhet division (4217.48 kilotons/year). The variation of biogas/compost potentiality in different divisions is mainly due to the variation in the number and types of livestock population in each division. For example, the total livestock population in the Chittagong division is higher than that of Rangpur nevertheless, the total biogas/compost production is lower due to the smaller number of large animals in the Chattogram division, as large animal manure produces higher biogas/compost than poultry manure.
The biogas production potential in 2023 was presented by spatial analysis at the district and upazila level of Bangladesh (Figure 3a,b). The districts and sub-districts were classified into 5 categories from very low to very high with an equal interval range based on the maximum and minimum value of biogas production. Amongst districts for annual biogas production, 6 districts (Dinajpur, Bogra, Noagaon, Sirajgonj, Mymensingh, and Chattogram) were in very high group which has 448.09 to 547.18 million m3 biogas production potentiality whereas other 8, 9, 17, 24 districts were offered in the high (348-448 million m3), moderate (249-348 million m3), low (150-248 million m3) and very low (51-150 million m3) group respectively.
The spatial distribution of compost production potential from livestock manure in Bangladesh in 2023 was shown in Figure 4, and the districts were also classified into 5 categories from very low to very high groups based on equal interval classification, similar to biogas potentiality. Here, 6 districts (Naogaon, Bogra, Sirajganj, Chuadanga, Faridpur, Narail) were categorized as very high (1.99-2.43 million tons/year) group, where eight districts (Nilphamari, Rangpur, Tangail, Pabna, Gazipur, Jhalokathi, Patuakhali, Cox’s Bazar) were placed in high (1.55-1.99 million tons/year) compost production potentiality group.
3.2. Biogas and Compost Potential According to the Livestock Types
The manure potential of six animals is presented in Table 7 and Figure 5. Total manure generation was 216.98 million tons, whereas the available manure was estimated as 107.57 million tons in Bangladesh in 2023. Total biogas was 15,035.59 million m3, with the main share of 88.91% of that biogas produced by the large animal manure, specifically cattle manure contributes 85.44%, whereas buffalo manure has only a 5.31% share of the total biogas production (Figure 5). Poultry manure constitutes about 9.52% of the total biogas production, though a very few percentage of biogas was contributed by small animals in Bangladesh. The annual electricity potential from biogas was more than 27 million MWh, whereas the maximum electricity comes from cattle manure, exactly 23.12 million MWh/year. Similarly, total biogas was assumed to produce about 13,497.17 kilotons of biofertilizer, whereas about 13,022.59, 119.55, and 355.03 kilotons/year biofertilizer were generated from large animal, small animal, and poultry manure, respectively (Table 7). In the case of compost production, about 67,454.84 kilotons of compost can be produced from total livestock manure, which can supply 2,202.13 kilotons of synthetic fertilizer in Bangladesh in 2023.
3.2. Hotspots Identification
The symbology of biogas production from various types of manure is illustrated in Figure 6. Primarily, the northern part of the country demonstrates a higher potential for biogas production from large animal manure, with four districts (Dinajpur, Naogaon, Shirajganj, Mymensingh) identified as hotspots with 95% confidence (Figure 7a). Conversely, only two districts (Patuakhali and Bhola) were recognized as hotspots (99% confidence) for biogas production from buffalo manure, while the remainder of Bangladesh exhibits extremely low biogas potential due to a smaller buffalo population (Figure 7b). The western part of Bangladesh shows potential for biogas production from goat manure, with three districts (Meherpur, Chuadanga, Jhenaidah) identified as hotspots with 99% confidence, and four other districts (Kushtia, Rajshahi, Naogaon, Joypurhat) classified as hotspots with 95% confidence (Figure 7c). The northern part of the country has hotspots (Dinajpur, Kurigram, Naogaon, Bogra, Tangail) for biogas production from sheep manure (Figure 7d). For biogas production from poultry manure, one district (Mymensingh) and two districts (Comilla, Noakhali) were recognized as hotspots for chicken (Figure 7e) and duck (Figure 7f) manure, respectively.
Alike biogas potential, the hotspots for compost production from various manure were based on symbiology analysis (Figure 8), which showed a similar pattern in symbiology and hotspots. Hotspots for compost production from cattle manure were identified in the Sirajganj, Naogaon, Faridpur, and Narail districts (Figure 9a). For buffalo manure, the Gaibandha and Patuakhali districts were designated as hotspots for compost production (Figure 9b). Likewise, the compost potential of goat manure was notably high in five districts: Khagrachori, Rajshahi, Narail, Lakshmipur, and Comilla (Figure 9c). In comparison, five other districts (Bogra, Tangail, Kushtia, Faridpur, Narail) were categorized as having very high potential for compost production from sheep manure (Figure 9d). The potential for compost from chicken manure was highest in the Naogaon district. In contrast, Noakhali and Cox’s Bazar ranked highest for duck manure compost in 2023 (Figure 9e, f).
The potential for total biogas and compost production is influenced by the manure of large animals, particularly cattle manure. Thus, the patterns of biogas and compost production from cattle manure (Figure 6a and Figure 8a) closely resemble those of total biogas and compost production (Figure 3a and Figure 4a).
The detailed spatial analysis of biogas and compost production potential identified suitable areas for developing biogas and compost plants, while the hotspot analysis provides a clear understanding of which districts will be suitable for establishing biogas and compost plants from specific types of livestock manure in Bangladesh in the future.
3.3. Electricity Production Potential
Division-wise electricity potential from biogas in Bangladesh is illustrated in Figure 10. Among the eight divisions, Rangpur ranks highest in its electricity production potential, generating 4.04 million MWh/year from livestock manure, which could meet 59.97% of the total electricity demand in 2024 (Figure 10a,b). In contrast, the Chattogram division was estimated to produce about 3.24 million MWh/year from biogas but can only satisfy 17.93% of its electricity demand due to significantly high industrial electricity needs. Although the Barisal division has relatively low electricity production potential, it can still replace more than 50% of its demand.
The spatial assessment of electricity generation reveals nearly identical distribution patterns with biogas production potential. Six districts (Dinajpur, Bogra, Naogaon, Sirajganj, Mymensingh, and Chittagong) fall into the very high category (806,548-984,928 MWh/year), while eight districts (Nilphamari, Rangpur, Gaibandah, Tangail, Pabna, Jessore, Comilla, and Patuakhali) are categorized as high (628,168-806,547 MWh/year) for electricity production (Figure 11a).
From the upazila-wise biogas potential map, the western north part of the country had significant electricity potential, ranging from 54,549 to 137,323 MWh each year (Figure 11b). However, the existing electricity coverage map (Figure 11c) indicates where electricity is needed for economic development. The upazila-wise analysis of electricity potential can provide insights into where the electricity demand could be met by bioenergy production from livestock manure.
3.4. Synthetic Fertilizer Replacement Capacity as Manure Compost Production
The percent of synthetic fertilizer used replaceable with livestock manure compost as N (urea), P2O5 (diammonium phosphate) and K2O (muriate of potash) were estimated for each district of Bangladesh where the data was classified into 5 categories, i.e., less than 20% (pink colored), 21– 40% (blue colored), 41–60% (green colored), 61–80% (yellow colored) and greater than 81% (red colored) in Figure 12. Average and ranges were 31.367% (256.82-2.37%), 37.89% (175.09-3.95%), and 86.26% (284.87-6.38%) for N content fertilizer, P2O5, and K2O replaceable by manure compost, respectively. About 20% of N content fertilizer uses can be replaced by manure compost for at least 26 districts among 64 districts, where 3 districts (Narail, Lakshmipur, Jhalokati) have the chance to replace more than 80% synthetic N fertilizer uses in Bangladesh in 2023. This study revealed that over 80% of P2O5 and K2O fertilizers can be substituted with manure compost across 8 and 24 districts, respectively. This suggests that compost holds greater potential compared to synthetic fertilizers in these regions. An even higher replacement rate, exceeding 100%, was observed in various districts characterized by lower agricultural crop production but a significant number of reared livestock.
3.5. GHG Emissions and Nutrients Leach Out Reduction Potential
The net emissions reduction potential for biogas indicated that five districts (Dinajpur, Bogra, Naogaon, Mymensing, and Chattogram) fall under the very high category (638-779 kilotons CO2eq/year), while 8 districts fall under the high category and 9 districts were classified as medium emitting category (Figure 13a). The rest of the districts were categorized as low to very low groups for net emission reduction potential. In the case of emission reduction potential from manure compost, six districts (Bogra, Naogaon, Sirajganj, Faridpur, Chuadanga, and Narail) had fallen into the very high category (1339-1635 kilotons CO2eq/year), whereas 8, 9, 17 and 24 districts were identified as high, medium, low and very low group respectively (Figure 13b).
For nutrient leach-out reduction potential, eight districts (Nilphamari, Lalmonirhat, Joypurhat, Bogra, Sirajganj, Pabna, Kushtia, Meherpur) fall under the very high category (91 to 111 kgha-1year-1) for biogas production (Figure 14a), while six districts (Nilphamari, Lalmonirhat, Bogra, Sirajganj, Pabna, Kushtia) fall under the very high category (350 to 430 kgha-1year-1) for compost production (Figure 14b) in Bangladesh. However, deep-colored to light-colored districts indicate the intensity of nutrient leach-out reduction potential accordingly, from very high to very low group in both cases.
A comparison of GHG emissions and nutrient leach-out reduction potential for biogas and compost production from various livestock groups is shown in Figure 15. In total, about 21,402 and 45,267 kilotons CO2eq/year of GHG emission could be reduced from biogas and compost, respectively. The combined manure nutrient reduction potential was 3,122 and 748 from biogas and compost, respectively. Overall, the GHG emissions reduction potential by producing manure bioenergy was lower than manure compost due to the lower amount of fossil fuels needed for composting than for anaerobic digestion. However, the manure nutrients leach-out reduction potential was much higher for biogas production than compost because of a smaller amount of biogas digestate produced than compost generation for agricultural production.
4. Discussion
The potential assessment of livestock manure is necessary for efficient manure management plans. About 90.66% of total biogas is produced by large animals’ manure, whereas poultry contributes only 8.56%, which is similar to the results of [17,18,29]. Large animal and poultry manure have the highest prospective for biogas or bioenergy generation in rural areas of the country [93].
At present, the installed generation capacity has been increased to 26,700 MW, including captive and renewable energy, and per capita power generation has increased to 609 kWh [59]. As Bangladesh depends much on natural gas for power generation, the biogas yield can reduce the dependency on fossil fuels. The total need for electricity in Bangladesh was about 788,450 million kWh/year in 2023 [94]. This study estimated 27.06 million MWh/year of electricity generated from manure biogas in 2023, which can fulfill 30.59% of total electricity demand. Afterwards, in rural areas, biogas offers an alternative to liquid petroleum gas (LPG) as a cooking fuel, which results in the reduction of GHG emission (the emission factor for LPG is 63100 CO2 ton/PJ and for biogas is 54600 CO2 ton/PJ), reported by [95]. It can also be converted to other fuels like diesel, coal, etc. One study found that total biogas potential from animal manure can replace 12.13 million tons of coal and 1.65 megaliters of diesel by biogas in 2016 [18]. Livestock manure can even produce energy and contribute to our national grid. By 2030, the Government of Bangladesh plans to produce 12% of total electricity from renewable sources [94]. So, the renewable energy demand can be mitigated by producing biogas from livestock manure in Bangladesh.
Again, organic fertilizer production through compost generation has a significant role in crop production. Being an agriculturally based country, the demand for fertilizer in crop production is huge in Bangladesh. Compost production potential from livestock manure will be a reasonable alternative to avoid the use of synthetic fertilizer, and the estimated total compost can replace 2202.13 kilotons of total synthetic fertilizer uses with an average of 31% urea, 37% P2O5, and 86% K2O in 2023. However, farmers tend to prefer chemical fertilizers to compost for high and quick yields. Sometimes, the replacement of chemical fertilizer seems to be very impractical in many cases because they evaluate compost quality to be very inconsistent and unreliable. Most farmers refuse to use compost consistently because they are more interested in increasing crop yield rapidly without considering the environmental impacts. Therefore, to extend livestock compost more widely in Bangladesh, further research should be conducted, for instance, on the technology to evaluate compost quality and efficiency in crop yield compared to synthetic fertilizer more precisely.
Besides the manure potentiality assessment, this study found that the GHG emissions and manure nutrients leach out were reduced by producing both biogas and compost, which is encouraged by the existing rules and policies in Bangladesh. Among GHG mitigation options like better storage, separation, and aeration of livestock manure, etc., biogas and compost generation are foremost for getting both socio-economic and environmental benefits, following a potential assessment. The estimated GHG emissions reduction potential as avoided emissions by replacing natural gas was 30.29 million tons CO2eq, respectively, which was similar to the literature [17,18]. This study estimated the average emission rate from biogas-based electricity generation as 298.21 g CO2eq/kWh, which was parallel to the studies by [96,97,98,99]. Some studies found less GHG emission (9-25 g CO2eq/kWh) [100,101] and higher GHG emission (510 g CO2eq/kWh) [31] than this study because of the different methodological approaches and distinguished equations applied. However, it is supported that the GHG emission from biogas-based electricity generation is less than the emission from electricity production using sources other than biogas sources, such as fossil fuels, coal, etc., in Bangladesh, i.e., 588g CO2eq/kWh [95]. The study also estimated the GHG emission reduction potential for compost, which is comparatively higher than biogas generation due to it requiring less fuel consumption and operation cost [102]. Afterward, total GHG emissions in Bangladesh come from three sectors, such as energy (44.02%), agriculture (36.01%), and waste (11.55%) [59]. If expected levels of biogas and compost generation from livestock manure are implemented, then it will reduce environmental impacts in each sector.
In addition, this study estimated that the manure nutrients leach out to water approximately 3121.41 and 749.10 kilotons (leach out reduction rate 214.94 and 52.15 kgha-1) annually from bioenergy and manure compost production cases, respectively. These green technologies will reduce the amount of manure nutrients leaching to water, which can prevent the eutrophication potential. However, the manure nutrients leach-out reduction potential is a very new concept for both manure biogas and compost production from livestock manure in Bangladesh, which deserves further investigation in the future.
5. Conclusions
Biogas and compost production are socio-economically effective and environmentally safe for livestock manure management. Biogas can effectively produce renewable energy, which can reduce the burden on excessive fossil fuel use for electricity generation, and composting can recover nutrients as organic fertilizer, which can replace the use of synthetic fertilizer for crop yield in rural areas of Bangladesh. Moreover, biogas and compost production can significantly reduce GHG emissions to the air and manure nutrients leaching out to water. If this huge amount of manure can be utilized for biogas and compost production on a large scale, it will be beneficial for the country’s economy and environment.
Overall, this study provides a spatial distribution of biogas and compost production potential across Bangladesh by creating regional pattern maps, which will help make specific decisions where biogas and compost plants can be made for better manure management, and it has enormous scope to improve the livestock production in Bangladesh. However, proper techno-economic analysis of biogas and compost plants and life cycle assessment in the future may clarify the economic and environmental perspective more transparently for the researchers, policymakers, livestock farmers, fertilizer establishments, and the energy segment of the government.
Author Contributions
Conceptualization, Z.M.; methodology, Z.M.; software, H.Y.; validation, H.Y.; formal analysis, Z.M.; investigation, H.Y.; resources, H.Y.; data curation, Z.M.; writing—original draft preparation, Z.M.; writing—review and editing, H.Y.; visualization, Z.M.; supervision, H.Y. All authors have read and agreed to the published version of the manuscript.
Funding
This research received no external funding.
Data Availability Statement
Suggested Data Availability Statements are available in the section “MDPI Research Data Policies” at https://www.mdpi.com/ethics.
Acknowledgments
The first author is grateful for Professor Helmut Yabar’s supervision and guidance. I also gratefully acknowledge the support from the Graduate School of Environmental Sciences and Technology, University of Tsukuba, Japan.
Conflicts of Interest
The funders had no role in the design of the study; in the collection, analyses, or interpretation of data; in the writing of the manuscript; or in the decision to publish the results.
Appendix A
Appendix A.1
An example of using the Pearson Square method for proper compost mixture determination [20]. Pearson Square Procedure: 1 is the C/N ratio of a typical straw. 2 is the C/N ratio of typical beef manure. 3 is the difference between straw and beef manure. 4 is the desired C/N ratio. 5 is the difference between the beef manure C:N ratio and the desired C:N ratio. Multiplying this value by 100 reveals that 16.67% of straw is needed for the desired C/N ratio. 6 is the difference of straw C/N ratio and desired C/N ratio. Multiplying this value by 100 reveals that 83.33% of manure is needed for the desired C/N ratio.
Figure A1.
An example of using the Pearson Square method for proper compost mixture.
Appendix B.1

Table A1.
A worksheet for total amount of compost calculation based on C/N ratio:.
| Manure | C/N Ratio | % of Manure | % of Rice Straw | Total available manure (in kg) | Compost production (in kg) | Final compost production (in kg) (after 50% mass reduction) |
| Large Animal | 18:1 | 80.645 | 19.355 | 90876153648.85 | 112,686,655,897.88 | 56,343,327,948.94 |
| Small Animal | 16:1 | 78.125 | 21.875 | 108460030.91 | 138,828,839.56 | 69,412,919.78 |
| Poultry | 6:1 | 67.567 | 32.432 | 5552972364.02 | 8,218,468,133.88 | 4,109,234,066.94 |
References
- DLS. Livestock Economy at a Glance [Internet]. Bangladesh: Department of Livestock Services; 2024. Available from: http://dls.portal.gov.bd/sites/default/files/files/dls.portal.gov.bd/page/ee5f4621_fa3a_40ac_8bd9_898fb8ee4700/2023-07-23-12-04-afbcccb96f8b27d4bab6501aa8c2c2ff.
- ILMM. Draft National Integrated Livestock Manure Management (ILMM) policy. Ministry of Fisheries and Livestock, The people’s republic of Bangladesh; 2015.
- FAO. Livestock and environment statistics: manure and greenhouse gas emissions. Global, regional and country trends, 1990-2018. [Internet]. Rome; 2020. Report No.: FAOSTAT Analytical Brief Series No. 14. Available from: https://openknowledge.fao.org/server/api/core/bitstreams/f0cebfdd-725e-4d7a-8e14-3ba8fb1486a7/content.
- Searchinger T, Waite R, Hanson C, Ranganathan J. Creating a sustainable food future “A Menu of Solutions to Feed Nearly 10 Billion People by 2050”. [Internet]. World Reaserch Institute; 2019. Available from: https://agritrop.cirad.fr/593176/1/WRR_Food_Full_Report_0.
- Gerber PJ, Steinfeld H, Henderson B, Mottet A, Opio C, Dijkman J, et al. Tackling climate change through livestock – A global assessment of emissions and mitigation opportunities. [Internet]. Rome: Food and Agriculture Organization of the United Nations (FAO); 2013. Available from: https://openknowledge.fao.org/server/api/core/bitstreams/e1afd815-5a76-4b88-beac-fb9bc0e92001/content.
- Adeoye, P.A.; Hasfalina, C.M.; Amin, M.S.M.; Thamer, A.M.; Akinbile, C.O. Environmental Implication of Poultry WasteGeneration and Management Techniques inMinna, Semi-arid Region of Nigeria. Annual Research of Review in Biology Available from: http://www.sciencedomain.org/review-history.php?iid= 419&id=32&aid=3558. 2014, 4, 1669–8116. [Google Scholar] [CrossRef]
- Cheng, H.; Ouyang, W.; Hao, F.; Ren, X.; Yang, S. The non-point source pollution in livestock-breeding areas of the Heihe River basin in Yellow River. Stoch. Environ. Res. Risk Assess. 2006, 21, 213–221. [Google Scholar] [CrossRef]
- MoEF. The National Environment Policy, 2018 [Internet]. Ministry of Environment and Forest, The Government of Bangladesh. 2024 [cited 2024 May 1]. Available from: https://moef.gov.bd/site/page/1c05e31e-1bb0-46ce-95a3-6ee3c82b439f/%E0%A6%AA%E0%A6%B0%E0%A6%BF%E0%A6%AC%E0%A7%87%E0%A6%B6-%E0%A6%A8%E0%A7%80%E0%A6%A4%E0%A6%BF,%E0%A6%86%E0%A6%87%E0%A6%A8-%E0%A6%93-%E0%A6%AC%E0%A6%BF%E0%A6%A7%E0%A6%BF.
- DoE. Department of Environment-Government of the People\’s Republic of Bangladesh [Internet]. 2024 [cited 2025 Mar 11]. Available from: https://doe.gov.bd/.
- Venier, F.; Yabar, H. Renewable energy recovery potential towards sustainable cattle manure management in Buenos Aires Province: Site selection based on GIS spatial analysis and statistics. J. Clean. Prod. 2017, 162, 1317–1333. [Google Scholar] [CrossRef]
- Mahal, Z.; Yabar, H. A Spatial Modeling Approach for Optimizing the Locations of Large-Scale Biogas Plants from Livestock Manure in Bangladesh. Land 2025, 14, 79. [Google Scholar] [CrossRef]
- Aktar, K.; Yabar, H.; Mizunoya, T.; Islam, M. Application of GIS in Introducing Community-Based Biogas Plants from Dairy Farm Waste: Potential of Renewable Energy for Rural Areas in Bangladesh. Geomatics 2024, 4, 384–411. [Google Scholar] [CrossRef]
- Ai, P.; Jin, K.; Alengebawy, A.; Elsayed, M.; Meng, L.; Chen, M.; Ran, Y. Effect of application of different biogas fertilizer on eggplant production: Analysis of fertilizer value and risk assessment. Environ. Technol. Innov. 2020, 19, 101019. [Google Scholar] [CrossRef]
- Li, J.; Wei, L.; Duan, Q.; Hu, G.; Zhang, G. Semi-continuous anaerobic co-digestion of dairy manure with three crop residues for biogas production. Bioresour. Technol. 2014, 156, 307–313. [Google Scholar] [CrossRef]
- Mathew, A.K.; Bhui, I.; Banerjee, S.N.; Goswami, R.; Chakraborty, A.K.; Shome, A.; Balachandran, S.; Chaudhury, S. Biogas production from locally available aquatic weeds of Santiniketan through anaerobic digestion. Clean Technol. Environ. Policy 2015, 17, 1681–1688. [Google Scholar] [CrossRef]
- Paolini, V.; Petracchini, F.; Segreto, M.; Tomassetti, L.; Naja, N.; Cecinato, A. Environmental impact of biogas: A short review of current knowledge. J. Environ. Sci. Heal. Part A 2018, 53, 899–906. [Google Scholar] [CrossRef]
- Siddiki, S.k.Y.A.; Uddin, M.N.; Mofijur, M.; Fattah, I.M.R.; Ong, H.C.; Lam, S.S.; et al. Theoretical calculation of biogas production and greenhouse gas emission reduction potential of livestock, poultry and slaughterhouse waste in Bangladesh. Journal of Environmental Chemical Engineering [Internet] Available from: https://linkinghubelseviercom/retrieve/pii/S2213343721001810. 2021, 9, 105204. [Google Scholar] [CrossRef]
- Chowdhury, T.; Chowdhury, H.; Hossain, N.; Ahmed, A.; Hossen, M.S.; Chowdhury, P.; Thirugnanasambandam, M.; Saidur, R. Latest advancements on livestock waste management and biogas production: Bangladesh’s perspective. J. Clean. Prod. 2020, 272, 122818. [Google Scholar] [CrossRef]
- Lei, Z.; Zhan, X.; Lee, D.-J. Recent advancements in sustainable management of livestock waste and rural environment (LSW-2020). Bioresour. Technol. 2020, 316, 123958. [Google Scholar] [CrossRef] [PubMed]
- Mary, AK. Mary AK. Composting Animal Manures: A guide to the process and management of animal manure compost | NDSU Agriculture [Internet]. 2022 [cited 2024 May 24]. Available from: https://www.ndsu.edu/agriculture/extension/publications/composting-animal-manures-guide-process-and-management-animal-manure-compost.
- Brown, C. Available Nutrients and Value for Manure. [Internet]. Toronto, Canada: The Ontario Ministry of Agriculture and Food and the Ministry of Rural Affairs.; 2013. Available from: https://fieldcropnews.com/wp-content/uploads/2015/03/Nutrient-Value-of-Manure.
- Rayne, N.; Aula, L. Livestock Manure and the Impacts on Soil Health: A Review. Soil Syst. 2020, 4, 64. [Google Scholar] [CrossRef]
- Mahal, Z.; Yabar, H.; Mizunoya, T. Spatial Assessment of Greenhouse Gas Emissions and Eutrophication Potential from Livestock Manure in Bangladesh. Sustainability 2024, 16, 5479. [Google Scholar] [CrossRef]
- Bayu, W.; Rethman, N.F.G.; Hammes, P.S. The Role of Animal Manure in Sustainable Soil Fertility Management in Sub-Saharan Africa: A Review. J. Sustain. Agric. 2005, 25, 113–136. [Google Scholar] [CrossRef]
- Sanford, G.R.; Cook, A.R.; Posner, J.L.; Hedtcke, J.L.; Hall, J.A.; Baldock, J.O. Linking Wisconsin Dairy and Grain Farms via Manure Transfer for Corn Production. Agron. J. 2009, 101, 167–174. [Google Scholar] [CrossRef]
- Lin, L.; Xu, F.; Ge, X.; Li, Y. Improving the sustainability of organic waste management practices in the food-energy-water nexus: A comparative review of anaerobic digestion and composting. Renew. Sustain. Energy Rev. 2018, 89, 151–167. [Google Scholar] [CrossRef]
- Avcioğlu, A.O.; Türker, U. Status and potential of biogas energy from animal wastes in Turkey. Renew. Sustain. Energy Rev. 2012, 16, 1557–1561. [Google Scholar] [CrossRef]
- Abdeshahian, P.; Lim, J.S.; Ho, W.S.; Hashim, H.; Lee, C.T. Potential of biogas production from farm animal waste in Malaysia. Renew. Sustain. Energy Rev. 2016, 60, 714–723. [Google Scholar] [CrossRef]
- Afazeli, H.; Jafari, A.; Rafiee, S.; Nosrati, M. An investigation of biogas production potential from livestock and slaughterhouse wastes. Renew. Sustain. Energy Rev. 2014, 34, 380–386. [Google Scholar] [CrossRef]
- Deublein D, Steinhauser A. Biogas from Waste and Renewable Resources. In: Biogas from Waste and Renewable Resources [Internet]. John Wiley & Sons, Ltd.; 2010 [cited 2024 May 24]. p. 85–95. Available from: https://onlinelibrary.wiley.com/doi/abs/10.1002/9783527632794.ch8.
- Afotey, B.; Sarpong, G.T. Estimation of biogas production potential and greenhouse gas emissions reduction for sustainable energy management using intelligent computing technique. Meas. Sensors 2022, 25, 100650. [Google Scholar] [CrossRef]
- Islam, K.N.; Sarker, T.; Taghizadeh-Hesary, F.; Atri, A.C.; Alam, M.S. Renewable energy generation from livestock waste for a sustainable circular economy in Bangladesh. Renew. Sustain. Energy Rev. 2021, 139, 110695. [Google Scholar] [CrossRef]
- Halder, P.; Paul, N.; Joardder, M.; Khan, M.; Sarker, M. Feasibility analysis of implementing anaerobic digestion as a potential energy source in Bangladesh. Renew. Sustain. Energy Rev. 2016, 65, 124–134. [Google Scholar] [CrossRef]
- Benito, M.; Ortiz, I.; Rodríguez, L.; Muñoz, G. Ni–Co bimetallic catalyst for hydrogen production in sewage treatment plants: Biogas reforming and tars removal. Int. J. Hydrogen Energy 2015, 40, 14456–14468. [Google Scholar] [CrossRef]
- Garcia AP. Techno-economic feasibility study of a small-scale biogas plant for treating market waste in the city of El Alto [Internet]. KTH School of Industrial Engineering and Management Energy Technology EGI-2014-083MSC Division of Energy and Climate SE-100 44 STOCKHOLM; 2014. Available from: http://kth.diva-portal.org/smash/get/diva2:741758/FULLTEXT01.pdf.
- Ngumah, C.; Ogbulie, J.; Orji, J.; Amadi, E. Potential of Organic Waste for Biogas and Biofertilizer Production in Nigeria. Environ. Res. Eng. Manag. 2013, 63, 60–66. [Google Scholar] [CrossRef]
- Rynk R, van de Kamp M, Willson GB, Singley ME, Richard TL, Kolega JJ, et al. On-Farm Composting Handbook (NRAES 54). 1992 Jun [cited 2024 May 24]; Available from: https://hdl.handle.net/1813/67142.
- Breitenbeck, G.A.; Schellinger, D. Calculating the Reduction in Material Mass And Volume during Composting. Compos. Sci. Util. 2004, 12, 365–371. [Google Scholar] [CrossRef]
- Ikumo, H. Estimation of Potential Supply of Livestock Waste Compost to Replace Chemical Fertilizer Use in Japan Based on 2000 Census of Agriculture. Jpn. Agric. Res. Quarterly: JARQ 2005, 39, 83–89. [Google Scholar] [CrossRef]
- DAE. Department of Agricultural Extension-Government Of the People’s Republic of Bangladesh [Internet]. 2024 [cited 2024 Jul 9]. Available from: https://dae.gov.bd/.
- Cestonaro, T.; Costa, M.S.S.d.M.; Costa, L.A.d.M.; Pereira, D.C.; Rozatti, M.A.; Martins, M.F.L. Addition of cattle manure to sheep bedding allows vermicomposting process and improves vermicompost quality. Waste Manag. 2017, 61, 165–170. [Google Scholar] [CrossRef]
- Hossain, Z.; Bahar, M.; Sarkar, B.; Donne, S.W.; Wade, P.; Bolan, N. Assessment of the fertilizer potential of biochars produced from slow pyrolysis of biosolid and animal manures. J. Anal. Appl. Pyrolysis 2021, 155, 105043. [Google Scholar] [CrossRef]
- Dale F. Leikam, Ray E. Lamond. Estimating Manure Nutrient Availability [Internet]. Kansas State University, Department of Agronomy; 2003. Report No.: MF-2562. Available from: https://bookstore.ksre.ksu.edu/download/estimating-manure-nutrient-availability_MF2562.
- Raza, S.T.; Tang, J.L.; Ali, Z.; Yao, Z.; Bah, H.; Iqbal, H.; Ren, X. Ammonia Volatilization and Greenhouse Gases Emissions during Vermicomposting with Animal Manures and Biochar to Enhance Sustainability. Int. J. Environ. Res. Public Heal. 2020, 18, 178. [Google Scholar] [CrossRef]
- Costa MSSDM, Bernardi FH, Costa LADM, Pereira DC, Lorin HEF, Rozatti MAT, et al. Composting as a cleaner strategy to broiler agro-industrial wastes: Selecting carbon source to optimize the process and improve the quality of the final compost. Journal of Cleaner Production [Internet] Available from: https://linkinghubelseviercom/retrieve/pii/S0959652616319205. 2017, 142, 2084–2092. [CrossRef]
- Cao, Y.; Chang, Z.; Wang, J.; Ma, Y.; Yang, H.; Fu, G. Potential use of anaerobically digested manure slurry to suppress Phytophthora root rot of chilli pepper. Sci. Hortic. 2014, 168, 124–131. [Google Scholar] [CrossRef]
- Slepetiene, A.; Volungevicius, J.; Jurgutis, L.; Liaudanskiene, I.; Amaleviciute-Volunge, K.; Slepetys, J.; Ceseviciene, J. The potential of digestate as a biofertilizer in eroded soils of Lithuania. Waste Manag. 2020, 102, 441–451. [Google Scholar] [CrossRef]
- Mayerová, M.; Šimon, T.; Stehlík, M.; Madaras, M.; Koubová, M.; Smatanová, M. Long-term application of biogas digestate improves soil physical properties. Soil Tillage Res. 2023, 231, 105715. [Google Scholar] [CrossRef]
- Alfa, M.; Adie, D.; Igboro, S.; Oranusi, U.; Dahunsi, S.; Akali, D. Assessment of biofertilizer quality and health implications of anaerobic digestion effluent of cow dung and chicken droppings. Renew. Energy 2014, 63, 681–686. [Google Scholar] [CrossRef]
- Ezemagu, I.; Ejimofor, M.; Menkiti, M.; Diyoke, C. Biofertilizer production via composting of digestate obtained from anaerobic digestion of post biocoagulation sludge blended with saw dust: Physiochemical characterization and kinetic study. Environ. Challenges 2021, 5, 100288. [Google Scholar] [CrossRef]
- ESRI. Hot Spot Analysis (Getis-Ord Gi*) (Spatial Statistics)—ArcGIS Pro | Documentation [Internet]. 2024 [cited 2024 Jul 8]. Available from: https://pro.arcgis.com/en/pro-app/latest/tool-reference/spatial-statistics/hot-spot-analysis.htm.
- De Vries JW, Vinken TMWJ, Hamelin L, De Boer IJM. Comparing environmental consequences of anaerobic mono- and co-digestion of pig manure to produce bio-energy – A life cycle perspective. Bioresource Technology [Internet] Available from: https://wwwsciencedirectcom/science/article/pii/S0960852412013193. 2012, 125, 239–248. [CrossRef]
- Szabo, G.; Fazekas, I.; Szabo, S.; Szabo, G.; Buday, T.; Paladi, M.; Kisari, K.; Kerenyi, A. THE CARBON FOOTPRINT OF A BIOGAS POWER PLANT. Environ. Eng. Manag. J. 2014, 13, 2867–2874. [Google Scholar] [CrossRef]
- Ayodele, T.; Ogunjuyigbe, A.; Alao, M. Economic and environmental assessment of electricity generation using biogas from organic fraction of municipal solid waste for the city of Ibadan, Nigeria. J. Clean. Prod. 2018, 203, 718–735. [Google Scholar] [CrossRef]
- Nasir, I.M.; Ghazi, T.I.M.; Omar, R. Anaerobic digestion technology in livestock manure treatment for biogas production: A review. Eng. Life Sci. 2012, 12, 258–269. [Google Scholar] [CrossRef]
- Noorollahi, Y.; Kheirrouz, M.; Asl, H.F.; Yousefi, H.; Hajinezhad, A. Biogas production potential from livestock manure in Iran. Renew. Sustain. Energy Rev. 2015, 50, 748–754. [Google Scholar] [CrossRef]
- Nehra, M.; Jain, S. Estimation of renewable biogas energy potential from livestock manure: A case study of India. Bioresour. Technol. Rep. 2023, 22, 101432. [Google Scholar] [CrossRef]
- IPCC. IPCC Guidelines for National Greenhouse Gas Inventories Agriculture, Forestry and Other Land Use [Internet]. 2006 [cited 2024 May 28]. Available from: https://www.ipcc-nggip.iges.or.jp/public/2006gl/vol4.html.
- Economic Review. Finance Division, Ministry of Finance. [Internet]. 2024 [cited 2024 May 2]. Available from: https://mof.portal.gov.bd/site/page/28ba57f5-59ff-4426-970a-bf014242179e/Bangladesh-Economic-Review.
- Kaygusuz, K. Renewable and sustainable energy use in Turkey: a review. Renew. Sustain. Energy Rev. 2002, 6, 339–366. [Google Scholar] [CrossRef]
- Viswanathan B. Chapter 3 - Natural Gas. In: Viswanathan B, editor. Energy Sources [Internet]. Amsterdam: Elsevier; 2017 [cited 2024 May 30]. p. 59–79. Available from: https://www.sciencedirect.com/science/article/pii/B9780444563538000034.
- Lebel, E.D.; Finnegan, C.J.; Ouyang, Z.; Jackson, R.B. Methane and NOx Emissions from Natural Gas Stoves, Cooktops, and Ovens in Residential Homes. Environ. Sci. Technol. 2022, 56, 2529–2539. [Google Scholar] [CrossRef]
- Andersen, J.; Boldrin, A.; Christensen, T.; Scheutz, C. Greenhouse gas emissions from home composting of organic household waste. Waste Manag. 2010, 30, 2475–2482. [Google Scholar] [CrossRef] [PubMed]
- Clemens, J.; Cuhls, C. Greenhouse gas emissions from mechanical and biological waste treatment of municipal waste. Environ. Technol. 2003, 24, 745–754. [Google Scholar] [CrossRef]
- Hao, X.; Chang, C.; Larney, F.J. Carbon, Nitrogen Balances and Greenhouse Gas Emission during Cattle Feedlot Manure Composting. J. Environ. Qual. 2004, 33, 37–44. [Google Scholar] [CrossRef] [PubMed]
- Hellebrand, H. Emission of Nitrous Oxide and other Trace Gases during Composting of Grass and Green Waste. J. Agric. Eng. Res. 1998, 69, 365–375. [Google Scholar] [CrossRef]
- Skowrońska, M.; Filipek, T. Life cycle assessment of fertilizers: a review. Int. Agrophysics 2014, 28, 101–110. [Google Scholar] [CrossRef]
- Albaugh, T.J.; Vance, E.D.; Gaudreault, C.; Fox, T.R.; Allen, H.L.; Stape, J.L.; Rubilar, R.A. Carbon Emissions and Sequestration from Fertilization of Pine in the Southeastern United States. For. Sci. 2012, 58, 419–429. [Google Scholar] [CrossRef]
- Brentrup F, Hoxha A, Christensen B. Carbon footprint analysis of mineral fertilizer production in Europe and other world regions. 2016.
- Davis J, Haglund C. Life Cycle Inventory (LCI) of Fertiliser Production: Fertiliser Products Used in Sweden and Western Europe. SIK; 1999. 160 p.
- Williams, A.G.; Audsley, E.; Sandars, D.L. Environmental burdens of producing bread wheat, oilseed rape and potatoes in England and Wales using simulation and system modelling. Int. J. Life Cycle Assess. 2010, 15, 855–868. [Google Scholar] [CrossRef]
- Chen, W.; Geng, Y.; Hong, J.; Yang, D.; Ma, X. Life cycle assessment of potash fertilizer production in China. Resour. Conserv. Recycl. 2018, 138, 238–245. [Google Scholar] [CrossRef]
- Friedrich, E.; Trois, C. GHG emission factors developed for the recycling and composting of municipal waste in South African municipalities. Waste Manag. 2013, 33, 2520–2531. [Google Scholar] [CrossRef]
- Phong, N.T. Greenhouse Gas Emissions from Composting and Anaerobic Digestion Plants. 2012. [Google Scholar]
- Ahn, H.; Mulbry, W.; White, J.; Kondrad, S. Pile mixing increases greenhouse gas emissions during composting of dairy manure. Bioresour. Technol. 2011, 102, 2904–2909. [Google Scholar] [CrossRef] [PubMed]
- Luske, B. Reduced GHG emissions due to compost production and compost use in Egypt Comparing two scenarios [Internet]. Louis Bolk Instituu; 2010. Report No.: 2010-016 LbD. Available from: https://orgprints.org/id/eprint/17480/4/17480.pdf.
- Nordahl, S.L.; Preble, C.V.; Kirchstetter, T.W.; Scown, C.D. Greenhouse Gas and Air Pollutant Emissions from Composting. Environ. Sci. Technol. 2023, 57, 2235–2247. [Google Scholar] [CrossRef] [PubMed]
- White P, Dranke M, Hindle P. Integrated Solid Waste Management: A Lifecycle Inventory. Springer Science & Business Media; 2012. 374 p.
- Dunkerley, D. Effects of rainfall intensity fluctuations on infiltration and runoff: rainfall simulation on dryland soils, Fowlers Gap, Australia. Hydrol. Process. 2011, 26, 2211–2224. [Google Scholar] [CrossRef]
- Jin, Z.; Guo, L.; Yu, Y.; Luo, D.; Fan, B.; Chu, G. Storm runoff generation in headwater catchments on the Chinese Loess Plateau after long-term vegetation rehabilitation. Sci. Total. Environ. 2020, 748, 141375. [Google Scholar] [CrossRef]
- Zhong, S.; Tian, X.; Geng, Y.; Santagata, R.; Zhuang, M.; Chen, W.; Yang, S.; Ulgiati, S. Sustainability assessment in the anthropocentric watershed based on emergy and decomposition methods: A case study of Erhai Lake Basin, southwest China. Ecol. Indic. 2022, 139, 108932. [Google Scholar] [CrossRef]
- Du, Y.; Li, T.; He, B. Runoff-related nutrient loss affected by fertilization and cultivation in sloping croplands: An 11-year observation under natural rainfall. Agric. Ecosyst. Environ. 2021, 319, 107549. [Google Scholar] [CrossRef]
- Dybowski, D.; Dzierzbicka-Glowacka, L.A.; Pietrzak, S.; Juszkowska, D.; Puszkarczuk, T. Estimation of nitrogen leaching load from agricultural fields in the Puck Commune with an interactive calculator. PeerJ 2020, 8, e8899. [Google Scholar] [CrossRef] [PubMed]
- Singh SR, Kundu DK, Dey P, Singh P, Mahapatra BS. Effect of balanced fertilizers on soil quality and lentil yield in Gangetic alluvial soils of India. J Agric Sci [Internet] Available from: https://wwwcambridgeorg/core/product/identifier/S0021859618000254/type/journal_article. 2018, 156, 225–240. [CrossRef]
- Yli-Halla, M.; Lötjönen, T.; Kekkonen, J.; Virtanen, S.; Marttila, H.; Liimatainen, M.; Saari, M.; Mikkola, J.; Suomela, R.; Joki-Tokola, E. Thickness of peat influences the leaching of substances and greenhouse gas emissions from a cultivated organic soil. Sci. Total. Environ. 2022, 806, 150499. [Google Scholar] [CrossRef]
- Kløve, B.; Sveistrup, T.E.; Hauge, A. Leaching of nutrients and emission of greenhouse gases from peatland cultivation at Bodin, Northern Norway. Geoderma 2010, 154, 219–232. [Google Scholar] [CrossRef]
- Sun C, Zhou H, Chen L, Shen Z. The pollution risk assessment of nitrogen and phosphorus loss in surface runoff from farmland fertilizer. J Agro-Environ Sci [Internet]. Available from: http://wwwaesorgcn/html/2017/7/20170706htm. 2017, 36, 1266–1273.
- Pham, T.; Yli-Halla, M.; Marttila, H.; Lötjönen, T.; Liimatainen, M.; Kekkonen, J.; Läpikivi, M.; Klöve, B.; Joki-Tokola, E. Leaching of nitrogen, phosphorus and other solutes from a controlled drainage cultivated peatland in Ruukki, Finland. Sci. Total. Environ. 2023, 904, 166769. [Google Scholar] [CrossRef]
- Sieczko, A.K.; van de Vlasakker, P.C.; Tonderski, K.; Metson, G.S. Seasonal nitrogen and phosphorus leaching in urban agriculture: Dominance of non-growing season losses in a Southern Swedish case study. Urban For. Urban Green. 2022, 79, 127823. [Google Scholar] [CrossRef]
- Portela, S.I.; Reixachs, C.; Torti, M.J.; Beribe, M.J.; Giannini, A.P. Contrasting effects of soil type and use of cover crops on nitrogen and phosphorus leaching in agricultural systems of the Argentinean Pampas. Agric. Ecosyst. Environ. 2024, 364, 108897. [Google Scholar] [CrossRef]
- Norberg, L.; Linefur, H.; Andersson, S.; Blomberg, M.; Kyllmar, K. Nutrient losses over time via surface runoff and subsurface drainage from an agricultural field in northern Sweden. J. Environ. Qual. 2022, 51, 1235–1245. [Google Scholar] [CrossRef]
- Fu, J.; Wu, Y.; Wang, Q.; Hu, K.; Wang, S.; Zhou, M.; Hayashi, K.; Wang, H.; Zhan, X.; Jian, Y.; et al. Importance of subsurface fluxes of water, nitrogen and phosphorus from rice paddy fields relative to surface runoff. Agric. Water Manag. 2019, 213, 627–635. [Google Scholar] [CrossRef]
- Abdullah-Al-Mahbub Md, Islam ARMT. Current status of running renewable energy in Bangladesh and future prospect: A global comparison. Heliyon [Internet] Available from: https://linkinghubelseviercom/retrieve/pii/S2405844023015153. 2023, 9, e14308. [CrossRef] [PubMed]
- BPDB. Bangladesh Power Development Board- [Internet]. 2024 [cited 2024 Nov 12]. Available from: http://www.bpdb.gov.bd/site/page/d2d5afd4-9f20-4c05-9102-a7c7de13798e/-.
- IEA. CO2 Emissions From Fuel Combustion Highlights 2013 [Internet]. International Energy Agency; 2013 p. 112. Available from: 10.1787/co2-data-en.
- Isola, C.; Sieverding, H.L.; Asato, C.M.; Gonzalez-Estrella, J.; Litzen, D.; Gilcrease, P.C.; Stone, J.J. Life cycle assessment of portable two-stage anaerobic digestion of mixed food waste and cardboard. Resour. Conserv. Recycl. 2018, 139, 114–121. [Google Scholar] [CrossRef]
- Kadiyala, A.; Kommalapati, R.; Huque, Z. Evaluation of the Life Cycle Greenhouse Gas Emissions from Different Biomass Feedstock Electricity Generation Systems. Sustainability 2016, 8, 1181. [Google Scholar] [CrossRef]
- Siddiqui, S.; Zerhusen, B.; Zehetmeier, M.; Effenberger, M. Distribution of specific greenhouse gas emissions from combined heat-and-power production in agricultural biogas plants. Biomass- Bioenergy 2020, 133, 105443. [Google Scholar] [CrossRef]
- Whiting, A.; Azapagic, A. Life cycle environmental impacts of generating electricity and heat from biogas produced by anaerobic digestion. Energy 2014, 70, 181–193. [Google Scholar] [CrossRef]
- Miranda, D.S.; Kulay, L. A prospective study on the environmental feasibility of supplying electricity to the Brazilian Amazon through biogas power generation. Sustain. Energy Technol. Assessments 2022, 55, 102962. [Google Scholar] [CrossRef]
- Ugwu, S.N.; Harding, K.; Enweremadu, C.C. Comparative life cycle assessment of enhanced anaerobic digestion of agro-industrial waste for biogas production. J. Clean. Prod. 2022, 345, 131178. [Google Scholar] [CrossRef]
- Vaneeckhaute, C.; Meers, E.; Michels, E.; Buysse, J.; Tack, F. Ecological and economic benefits of the application of bio-based mineral fertilizers in modern agriculture. Biomass- Bioenergy 2013, 49, 239–248. [Google Scholar] [CrossRef]
Figure 1.
Research flowchart.
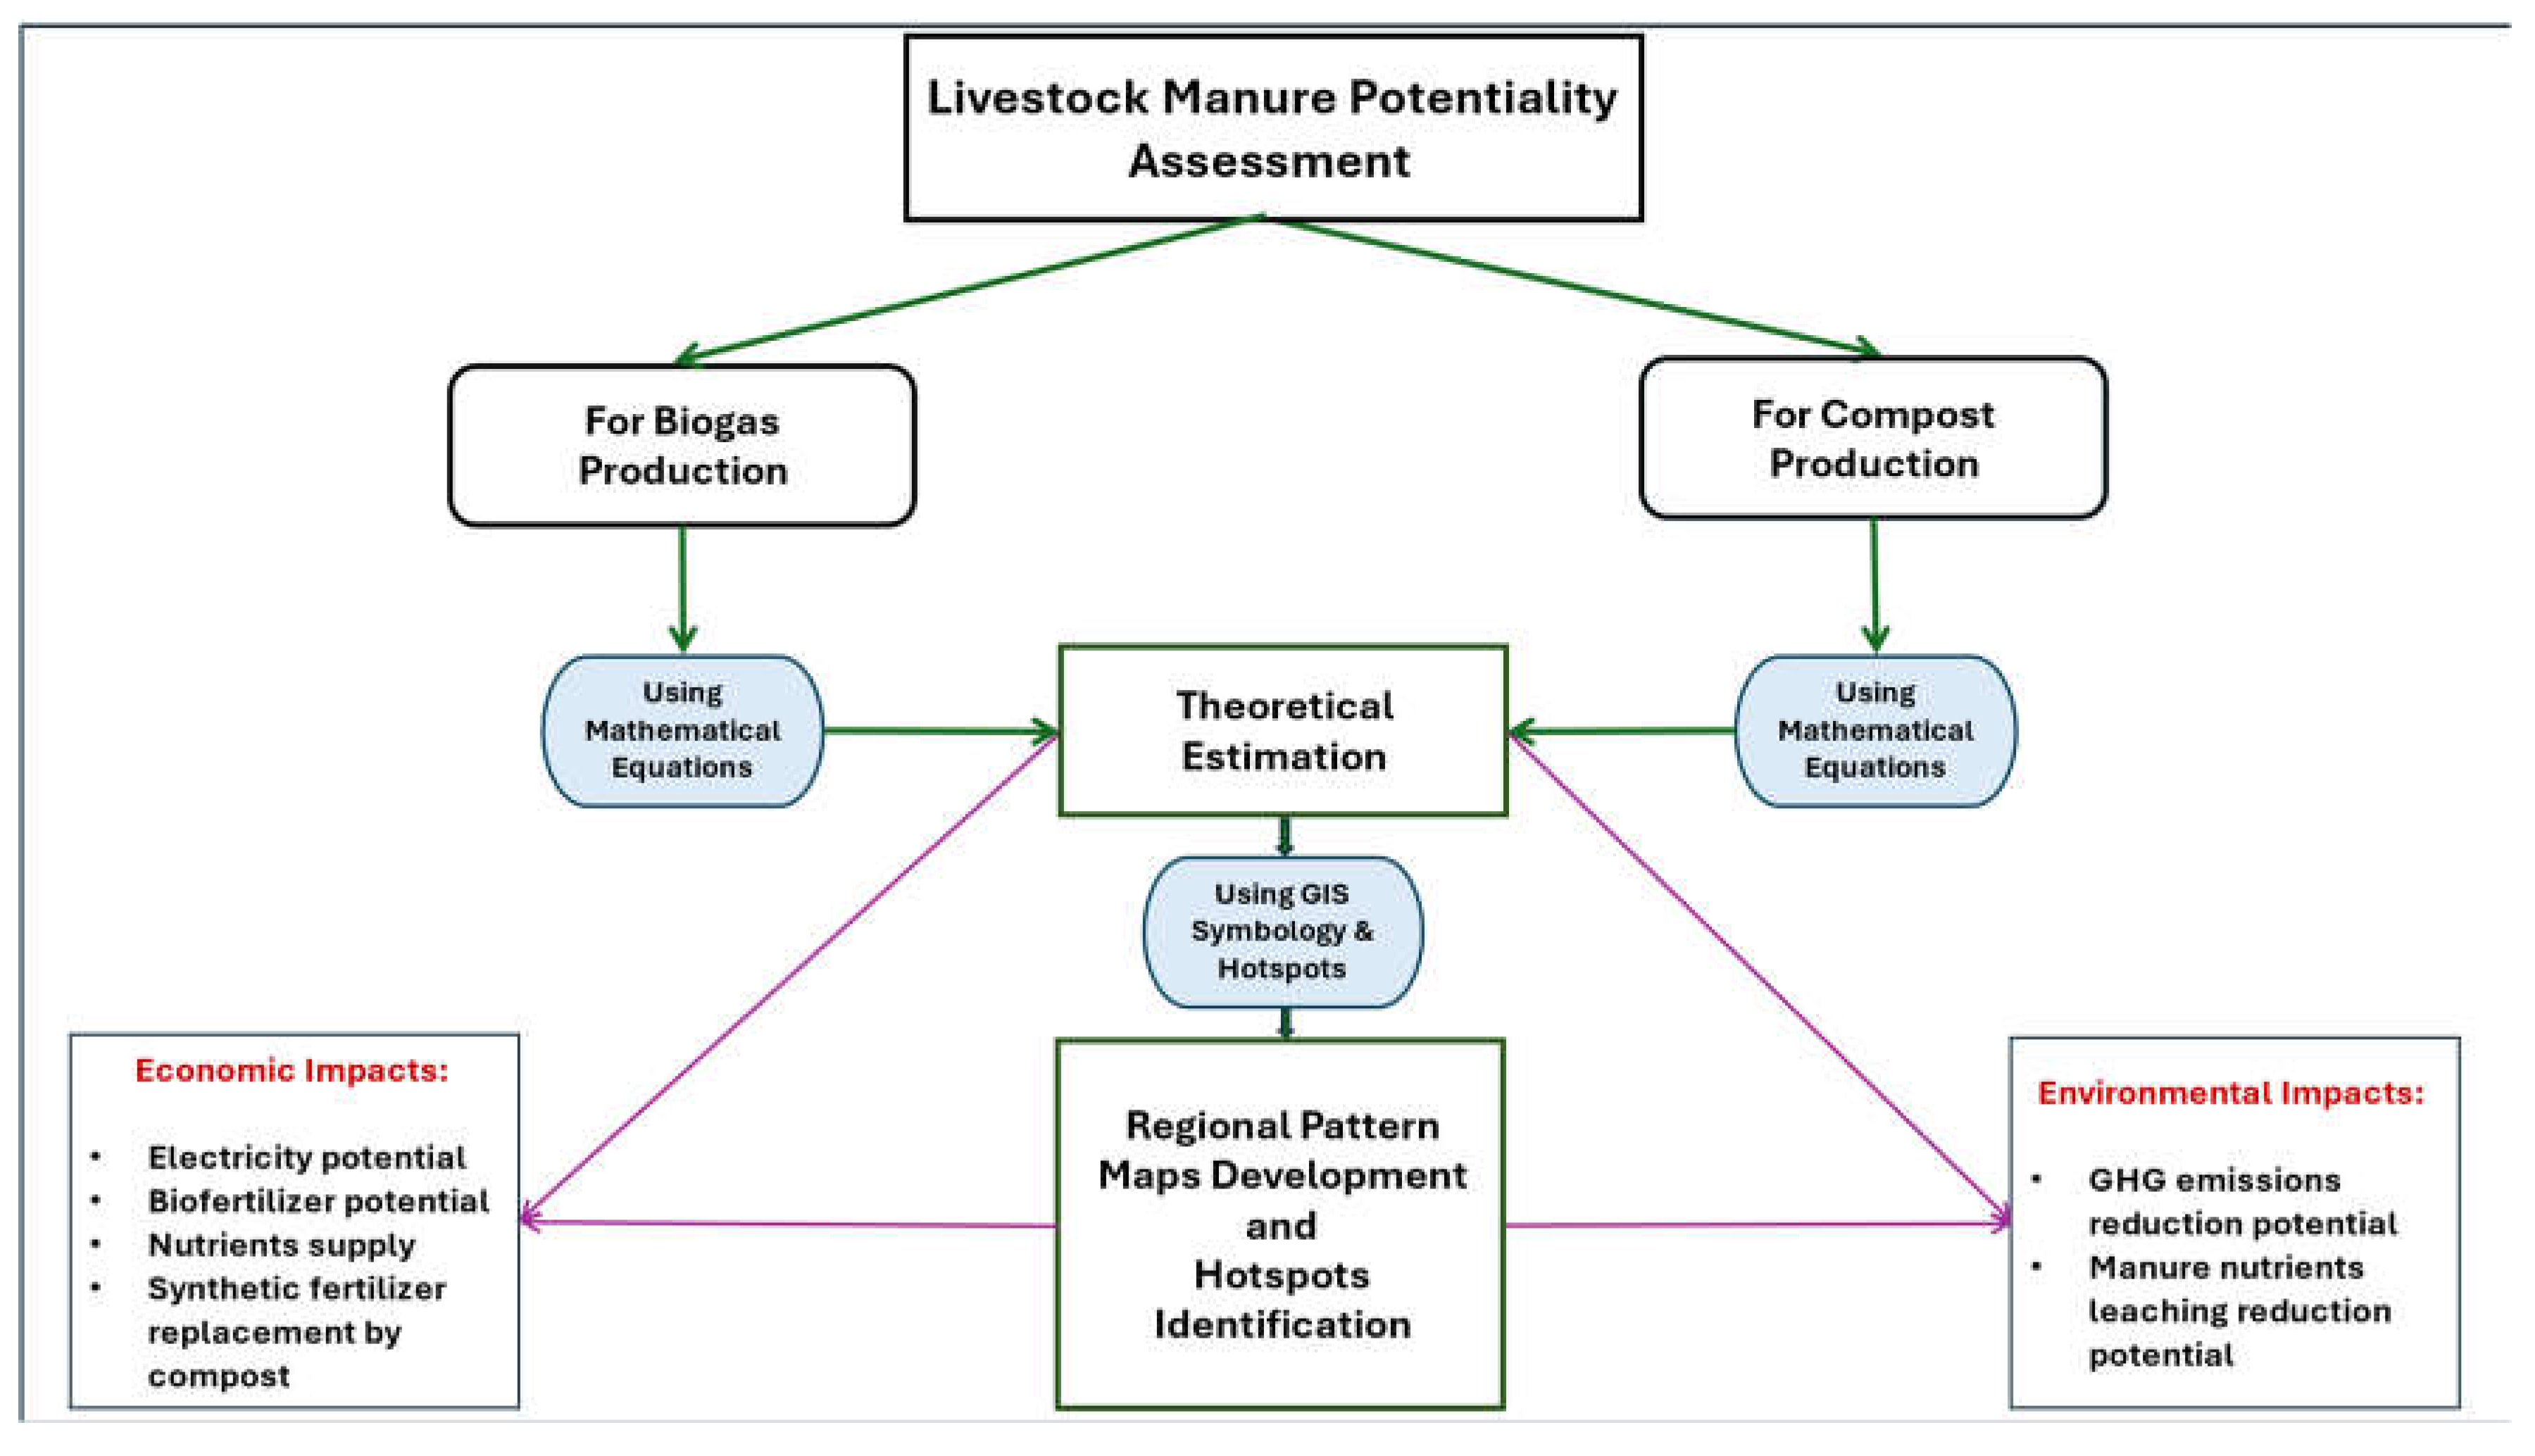
Figure 2.
Division-wise biogas and compost potential from livestock manure in 2023.
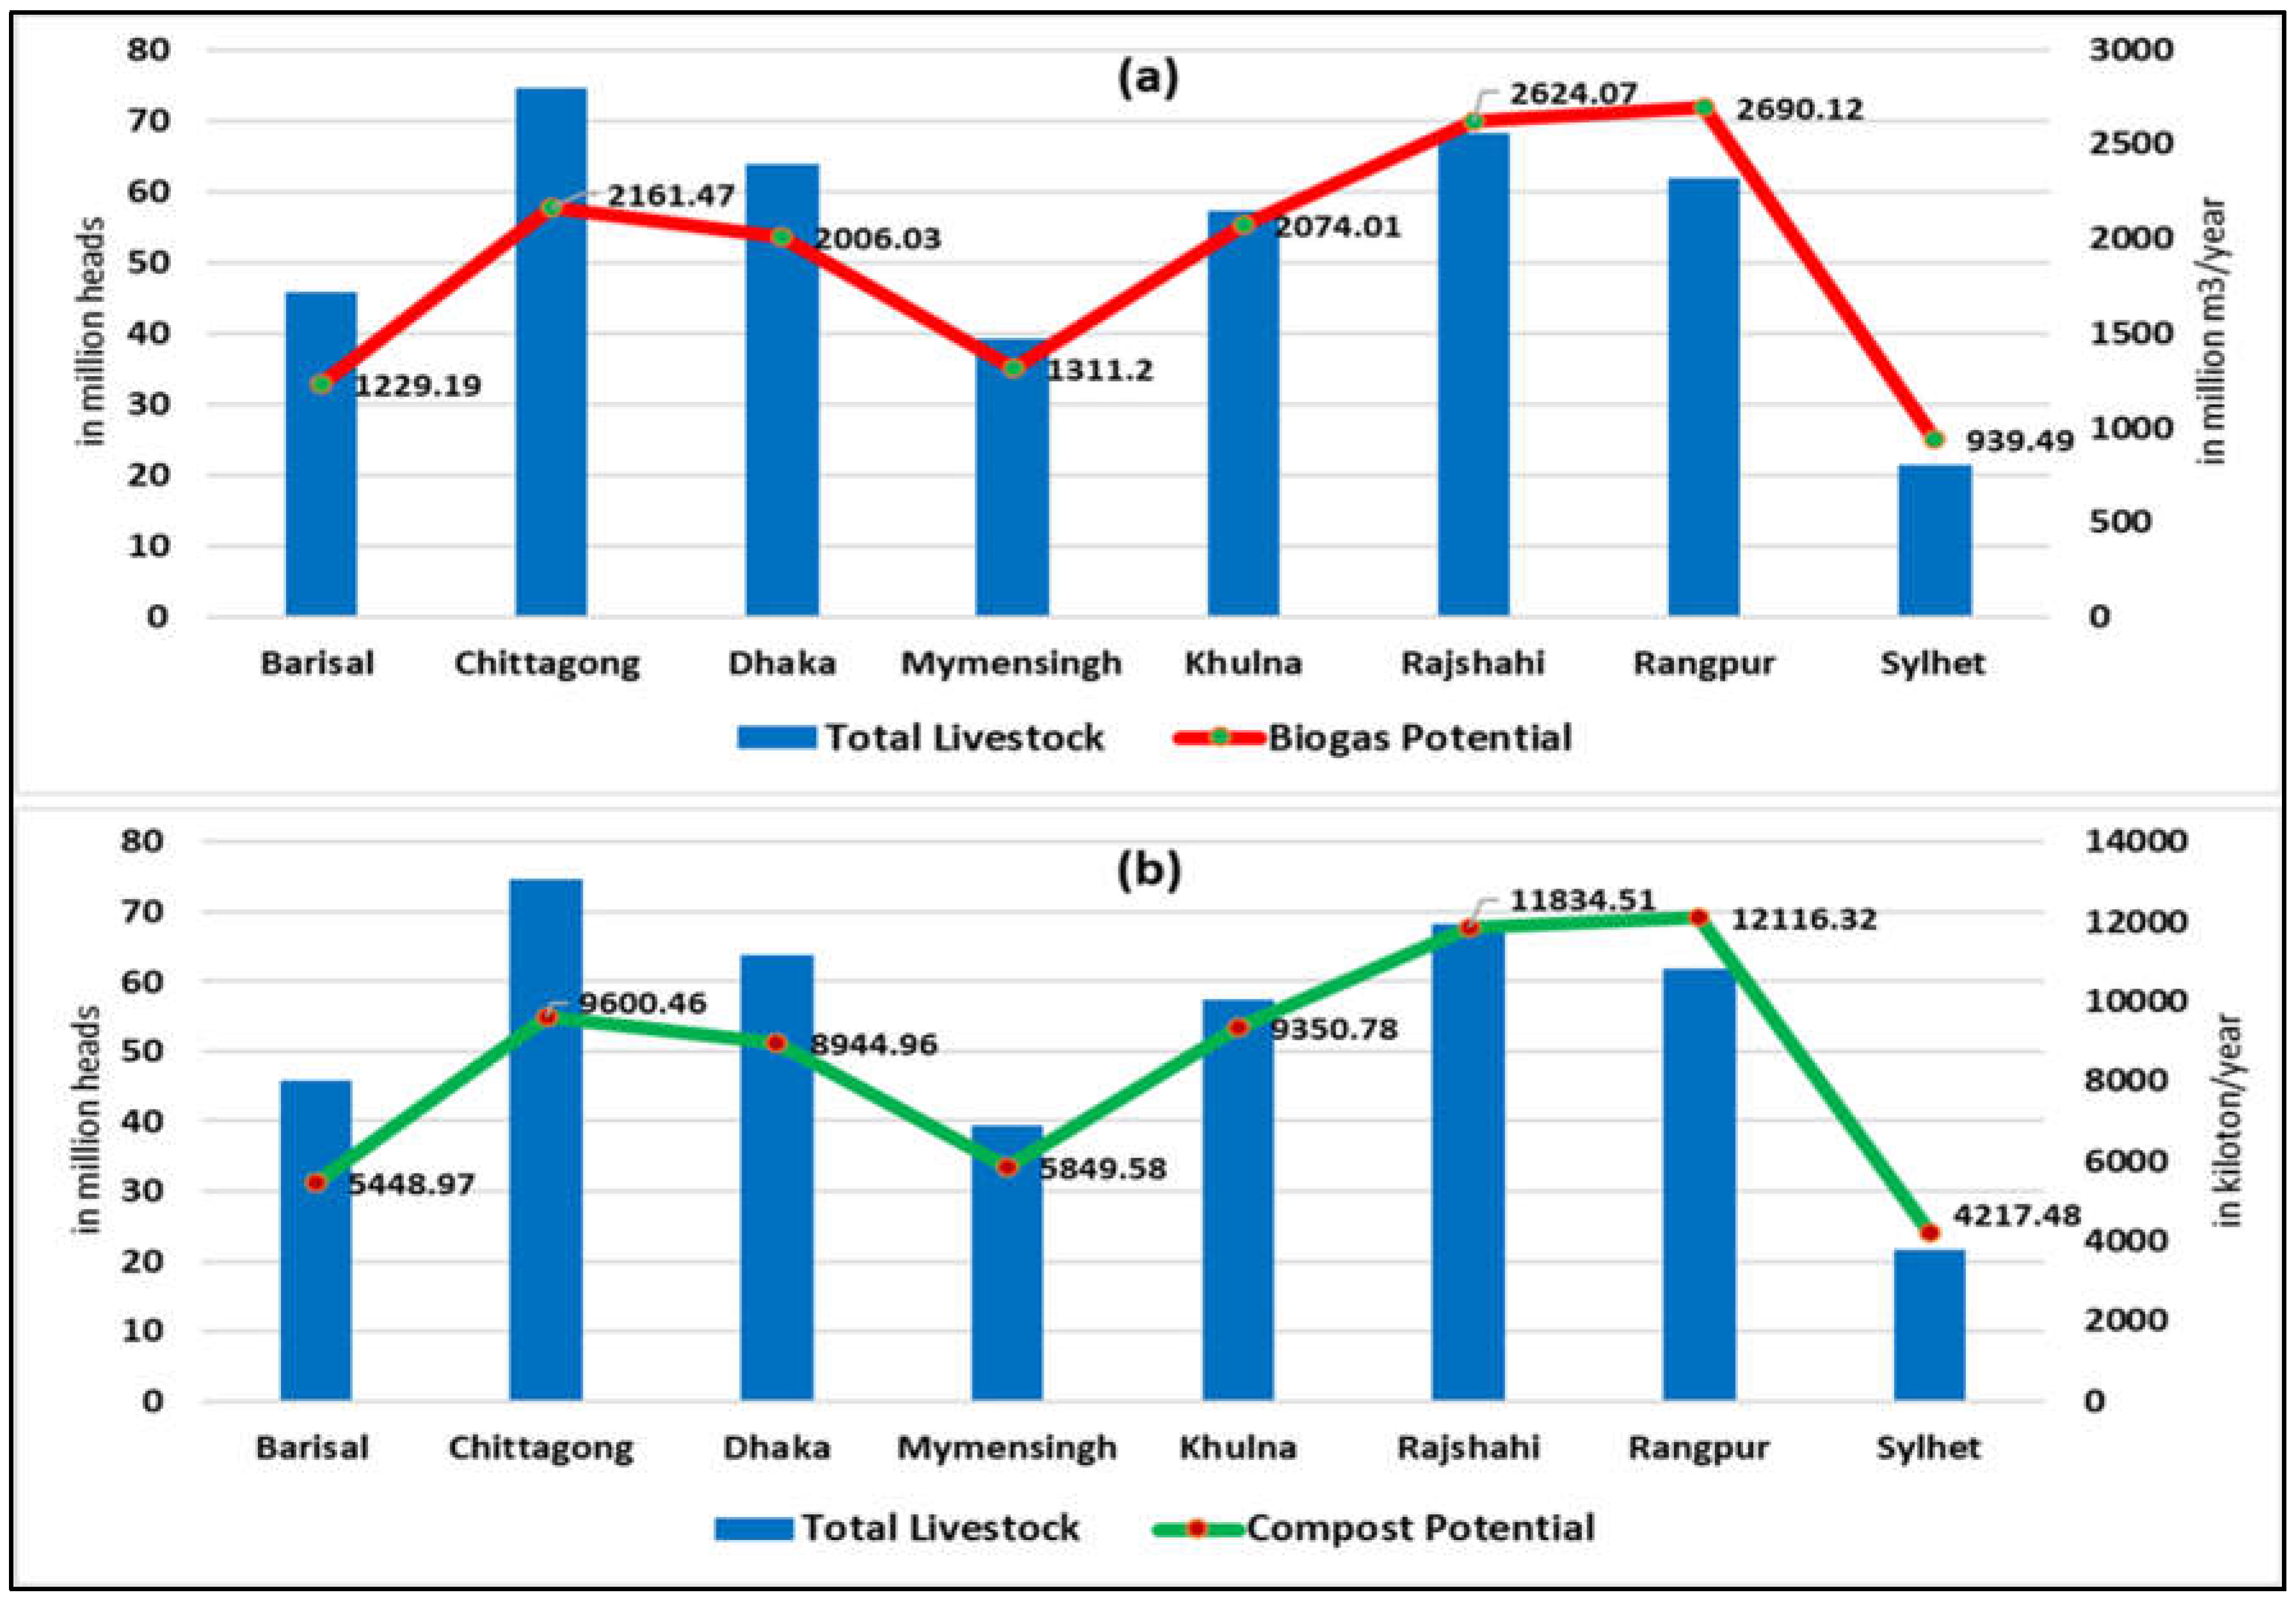
Figure 3.
Total biogas production potential from livestock manure in Bangladesh in 2023: (a) District-wise biogas potential; (b) Upazila-wise biogas potential.
Figure 3.
Total biogas production potential from livestock manure in Bangladesh in 2023: (a) District-wise biogas potential; (b) Upazila-wise biogas potential.
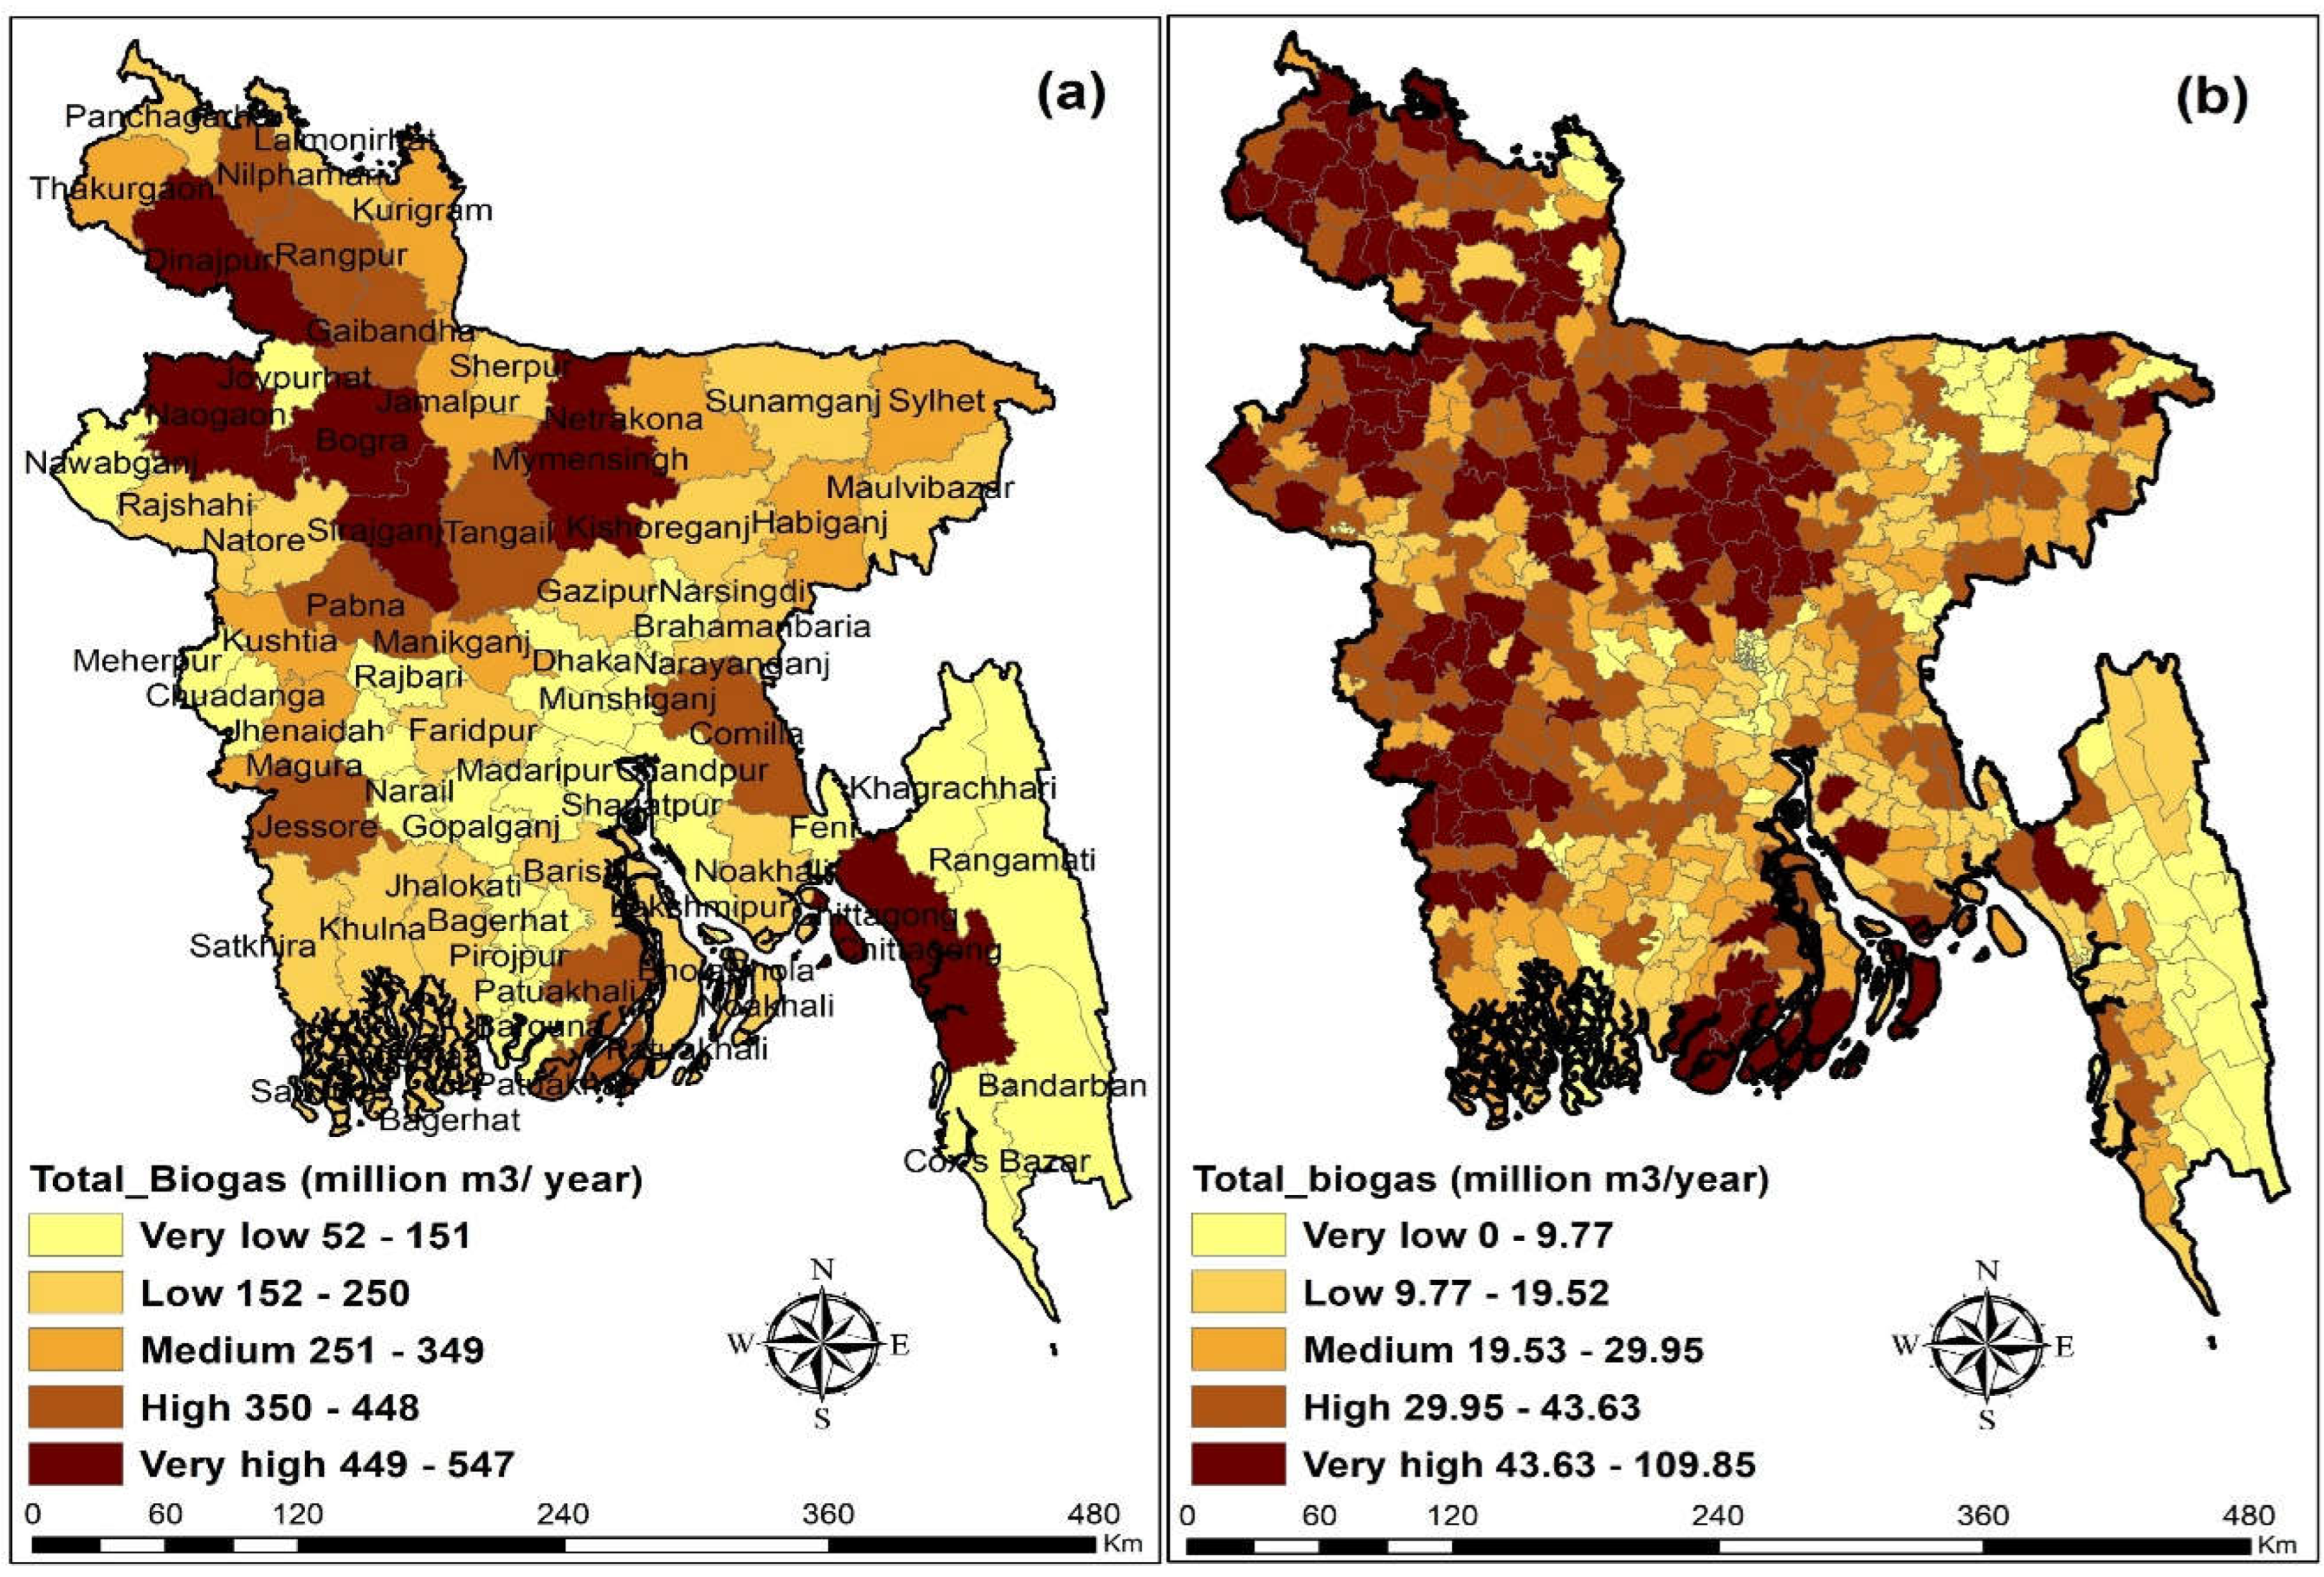
Figure 4.
Total compost production potential from livestock manure in Bangladesh in 2023: (a) District-wise compost potential; (b) Upazila-wise compost potential.
Figure 4.
Total compost production potential from livestock manure in Bangladesh in 2023: (a) District-wise compost potential; (b) Upazila-wise compost potential.
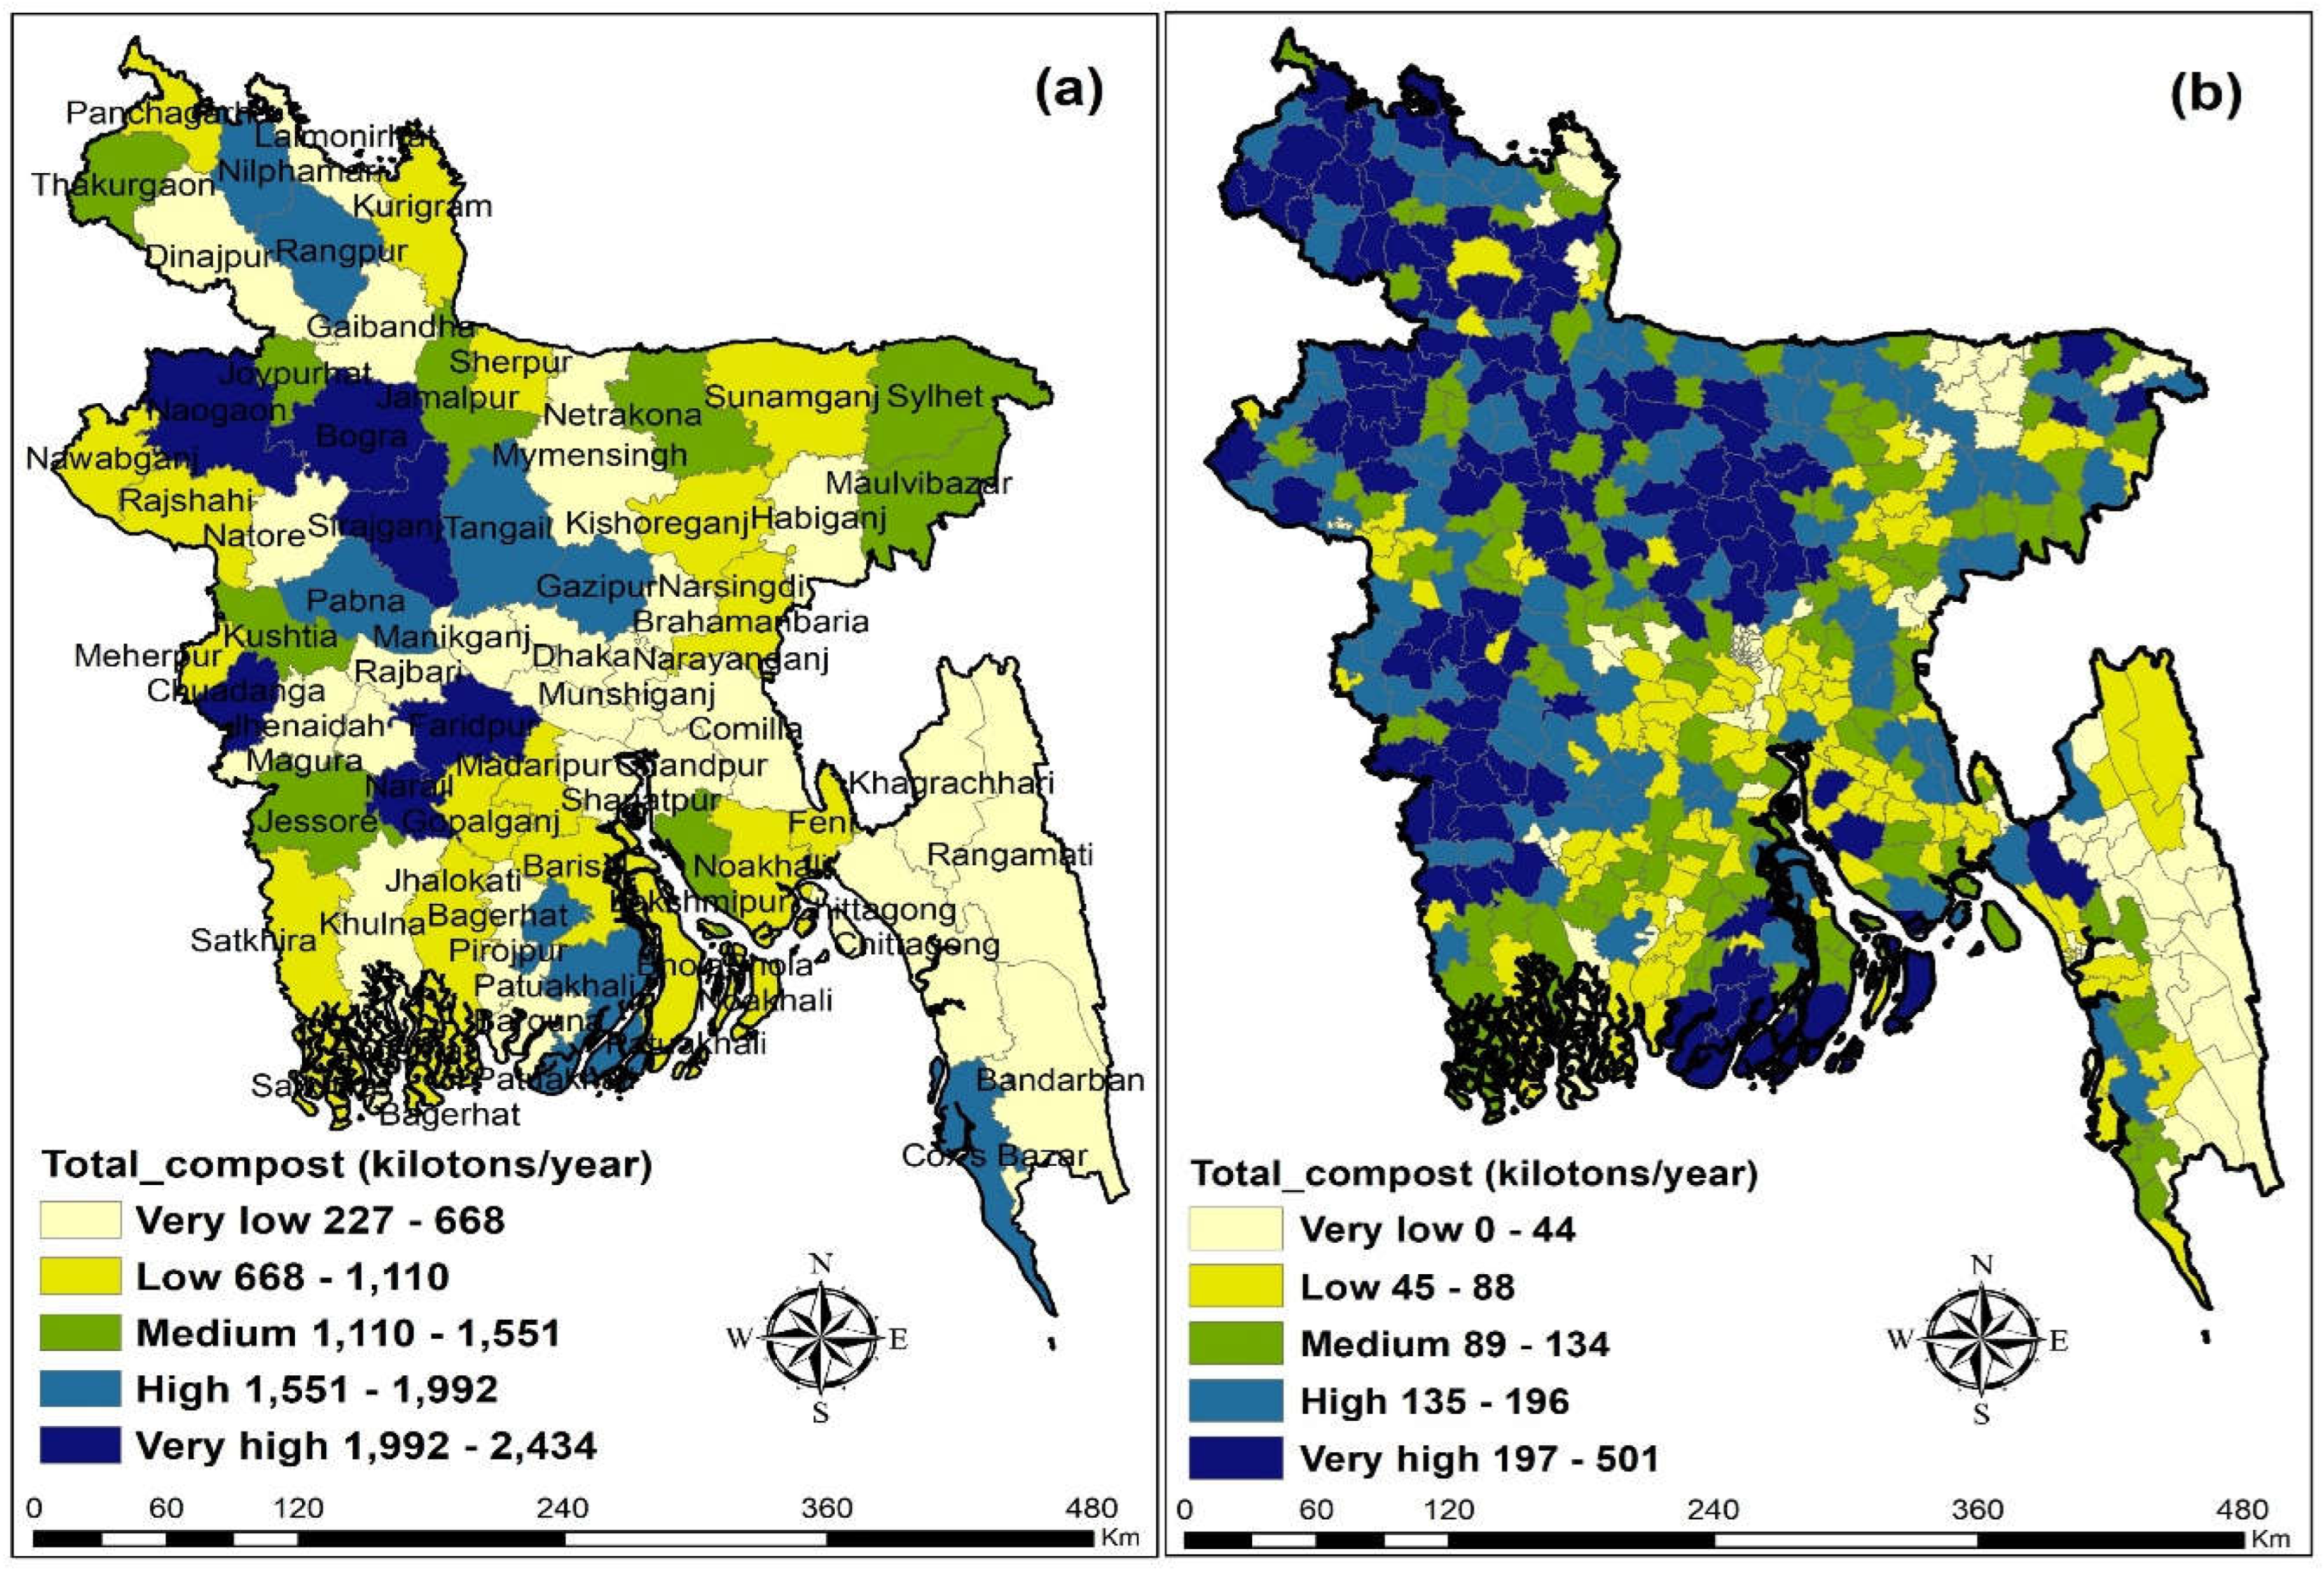
Figure 5.
Total biogas and compost production potential from different livestock manure in Bangladesh in 2023.
Figure 5.
Total biogas and compost production potential from different livestock manure in Bangladesh in 2023.

Figure 6.
Symbology for biogas production from different livestock manures in Bangladesh: (a) Cattle manure; (b) Buffalo manure; (c) Goat manure; (d) Sheep manure; (e) Chicken manure; (f) Duck manure.
Figure 6.
Symbology for biogas production from different livestock manures in Bangladesh: (a) Cattle manure; (b) Buffalo manure; (c) Goat manure; (d) Sheep manure; (e) Chicken manure; (f) Duck manure.
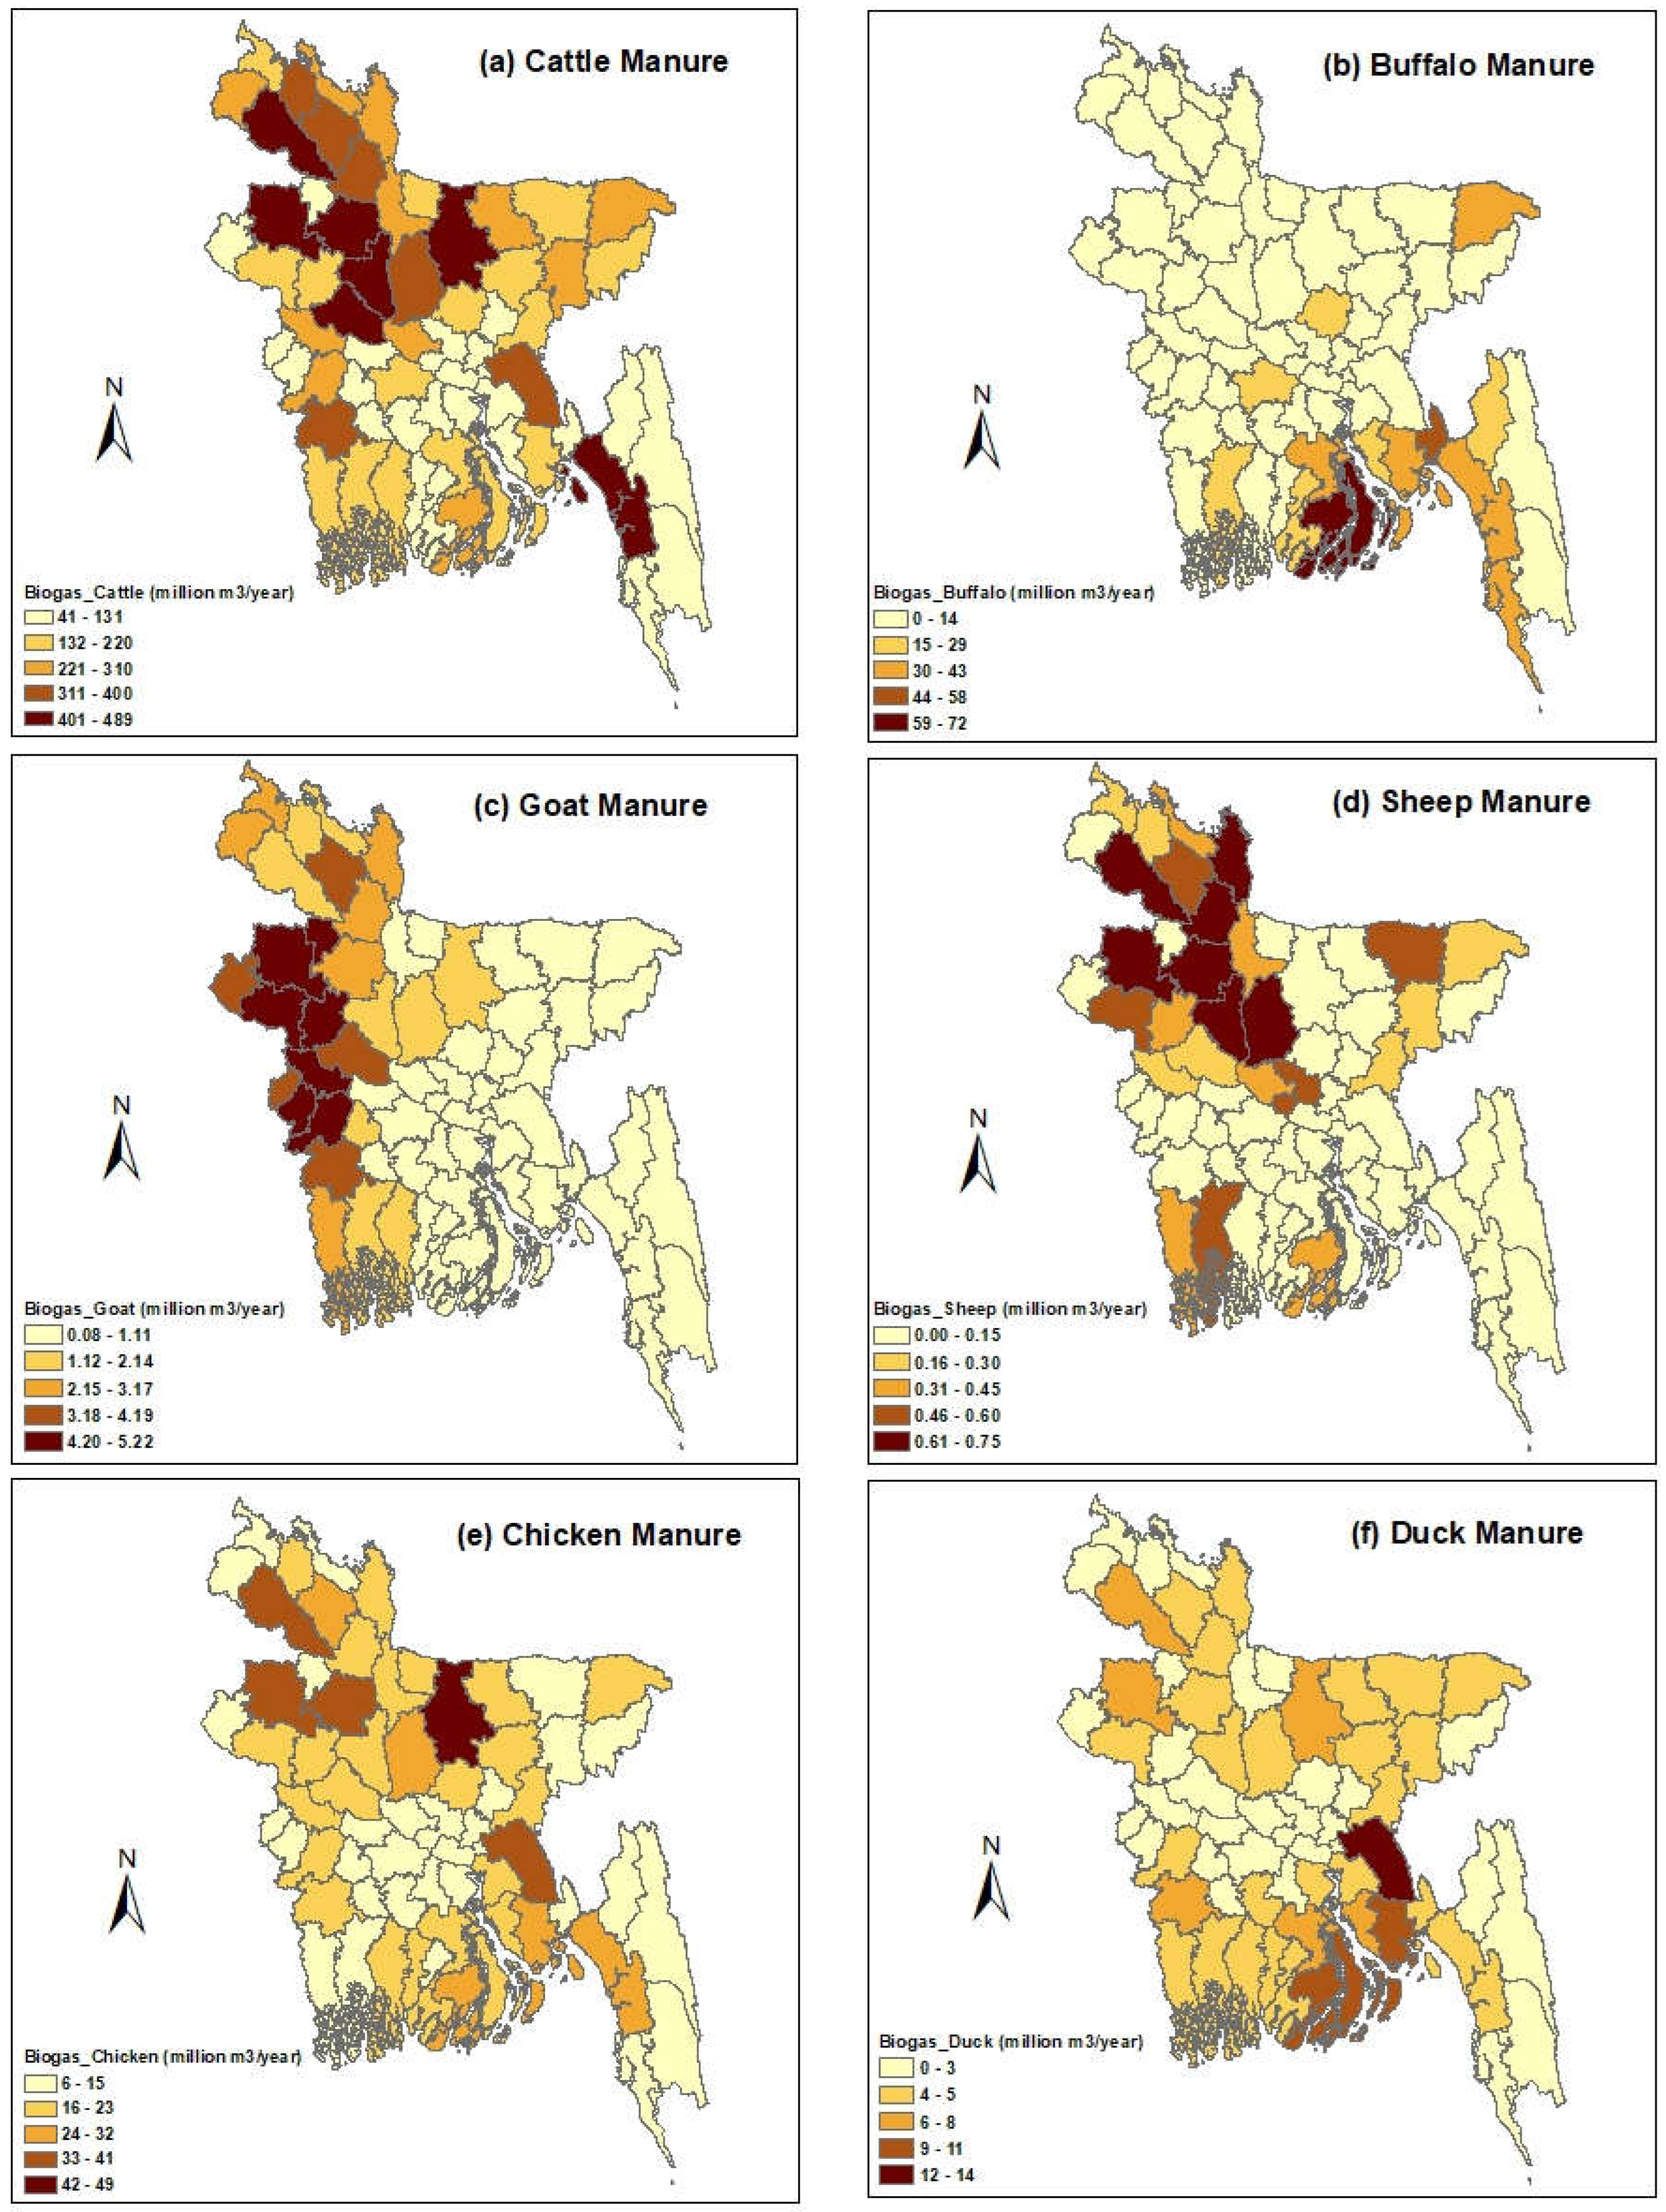
Figure 7.
Hotspots for biogas production from different livestock manures in Bangladesh: (a) Cattle manure; (b) Buffalo manure; (c) Goat manure; (d) Sheep manure; (e) Chicken manure; (f) Duck manure.
Figure 7.
Hotspots for biogas production from different livestock manures in Bangladesh: (a) Cattle manure; (b) Buffalo manure; (c) Goat manure; (d) Sheep manure; (e) Chicken manure; (f) Duck manure.
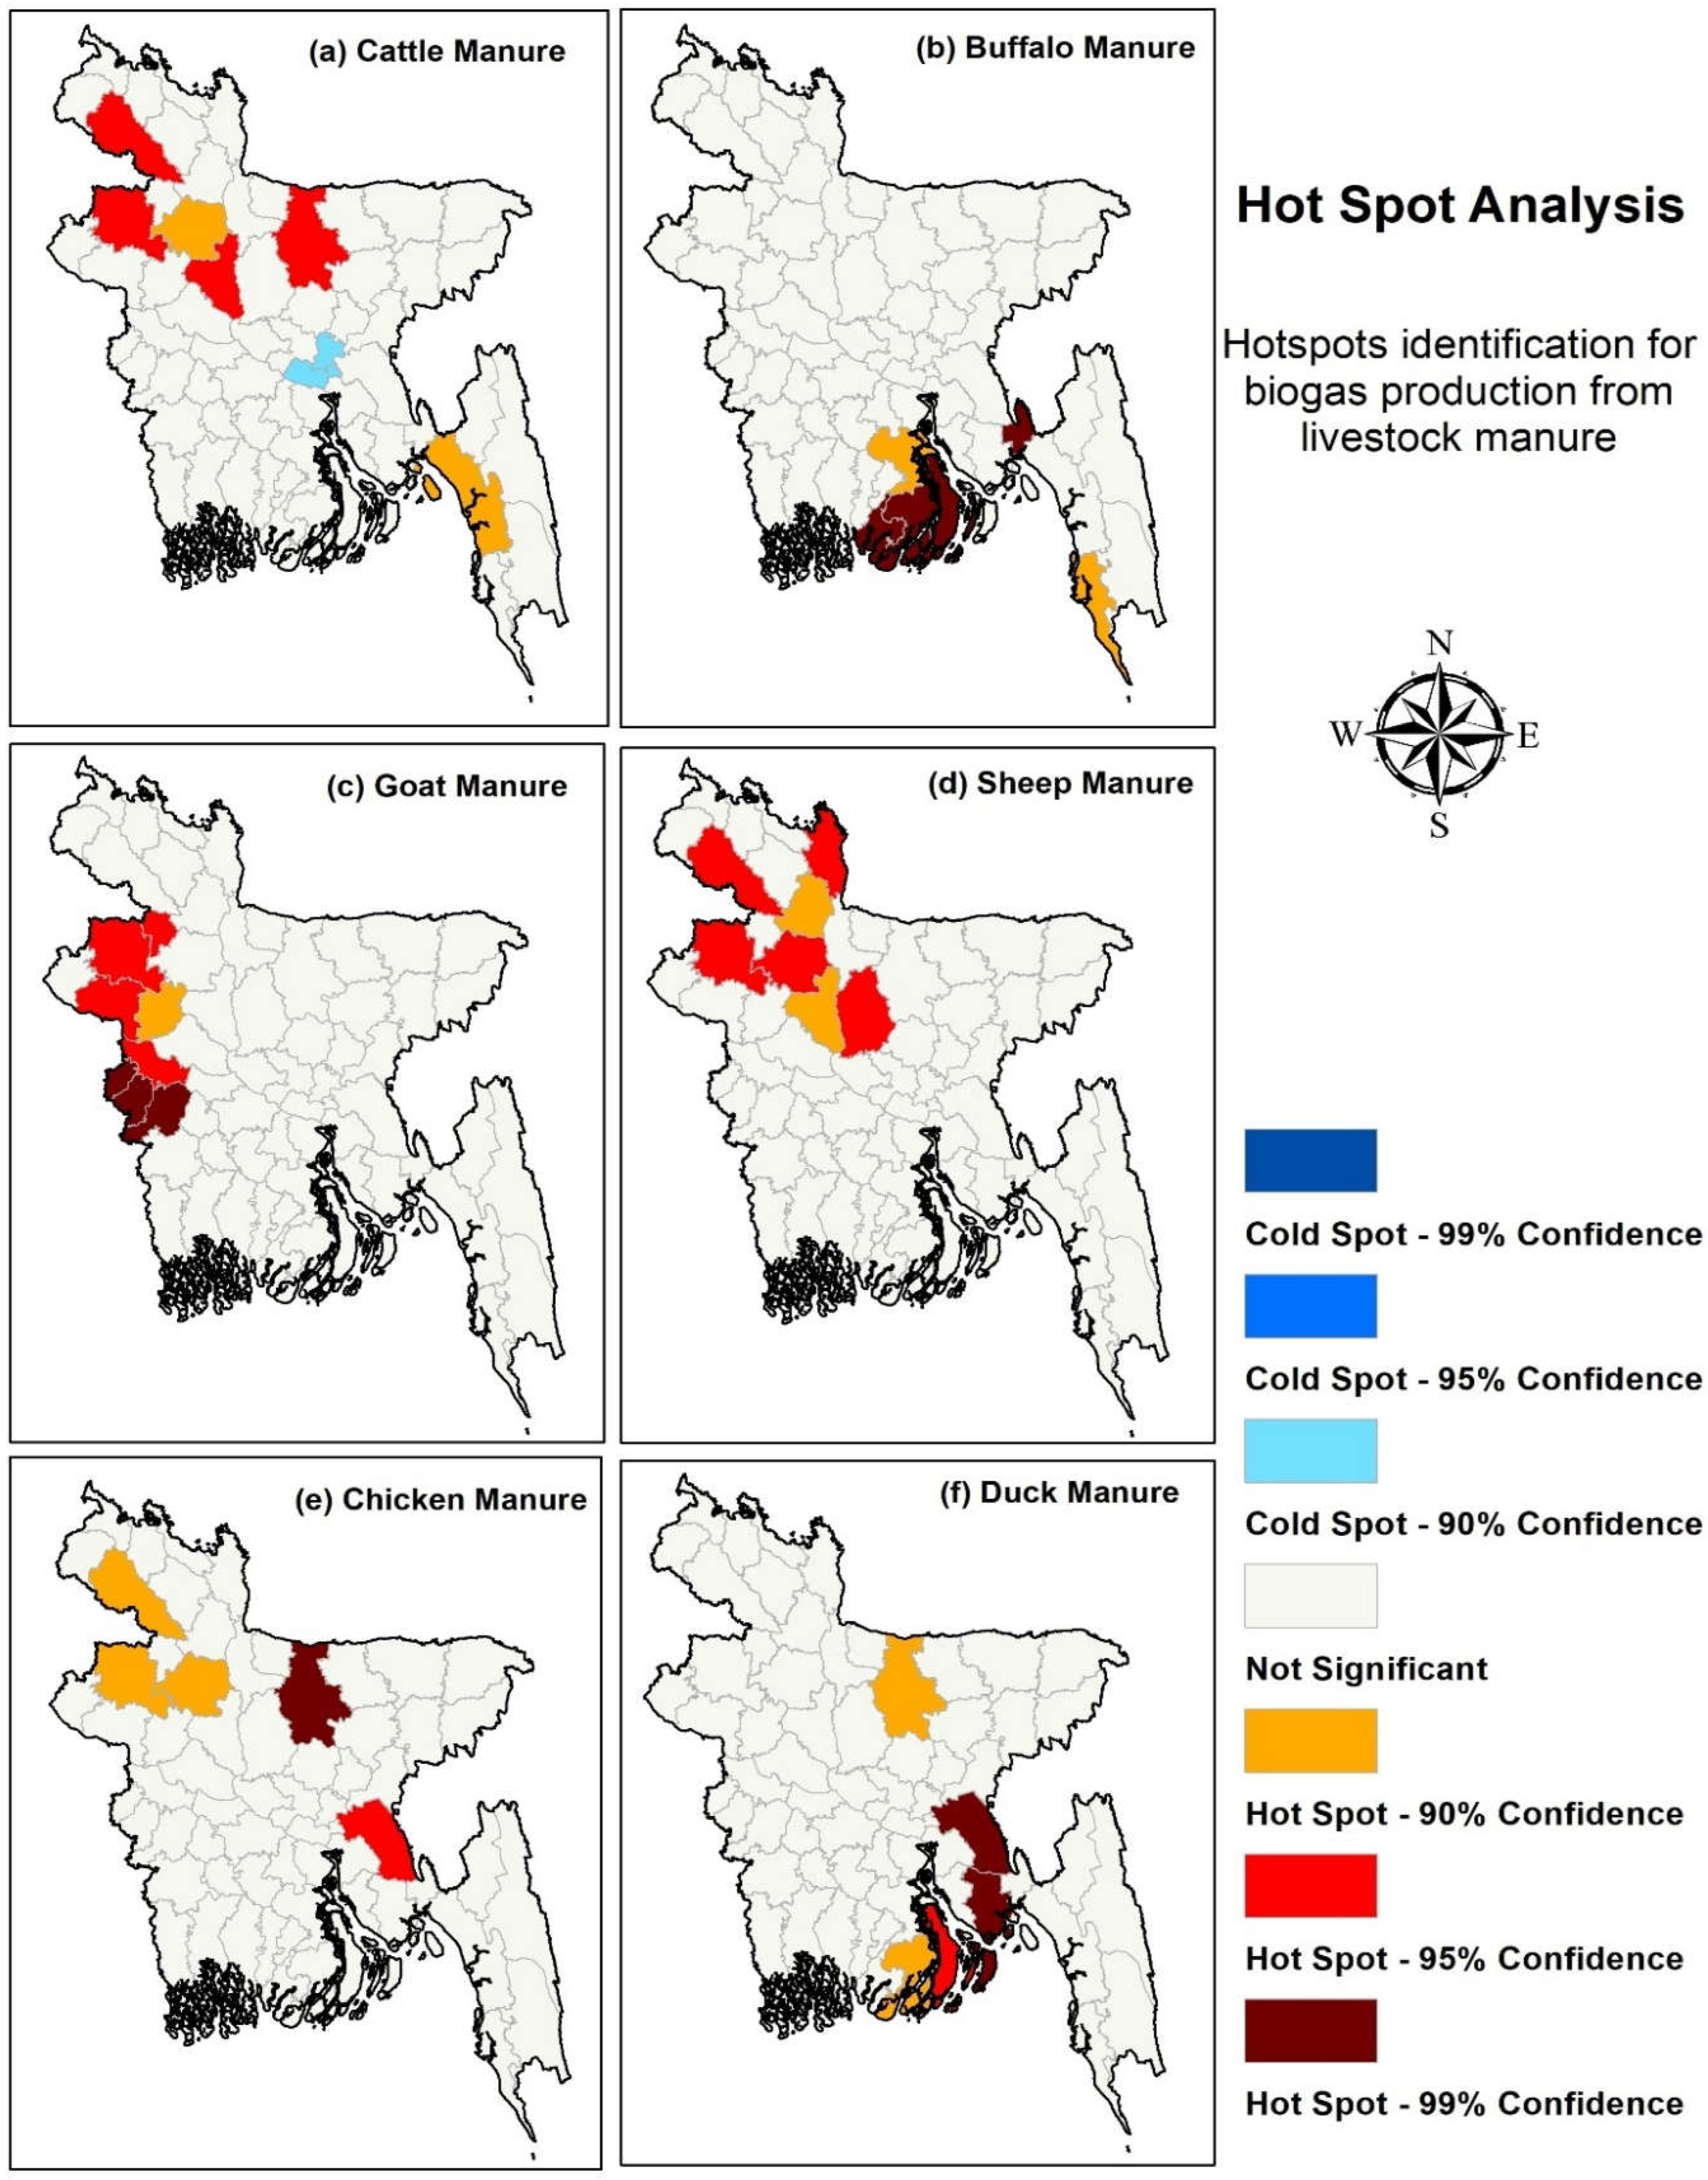
Figure 8.
Symbology for compost production from different livestock manures in Bangladesh: (a) Cattle manure; (b) Buffalo manure; (c) Goat manure; (d) Sheep manure; (e) Chicken manure; (f) Duck manure.
Figure 8.
Symbology for compost production from different livestock manures in Bangladesh: (a) Cattle manure; (b) Buffalo manure; (c) Goat manure; (d) Sheep manure; (e) Chicken manure; (f) Duck manure.
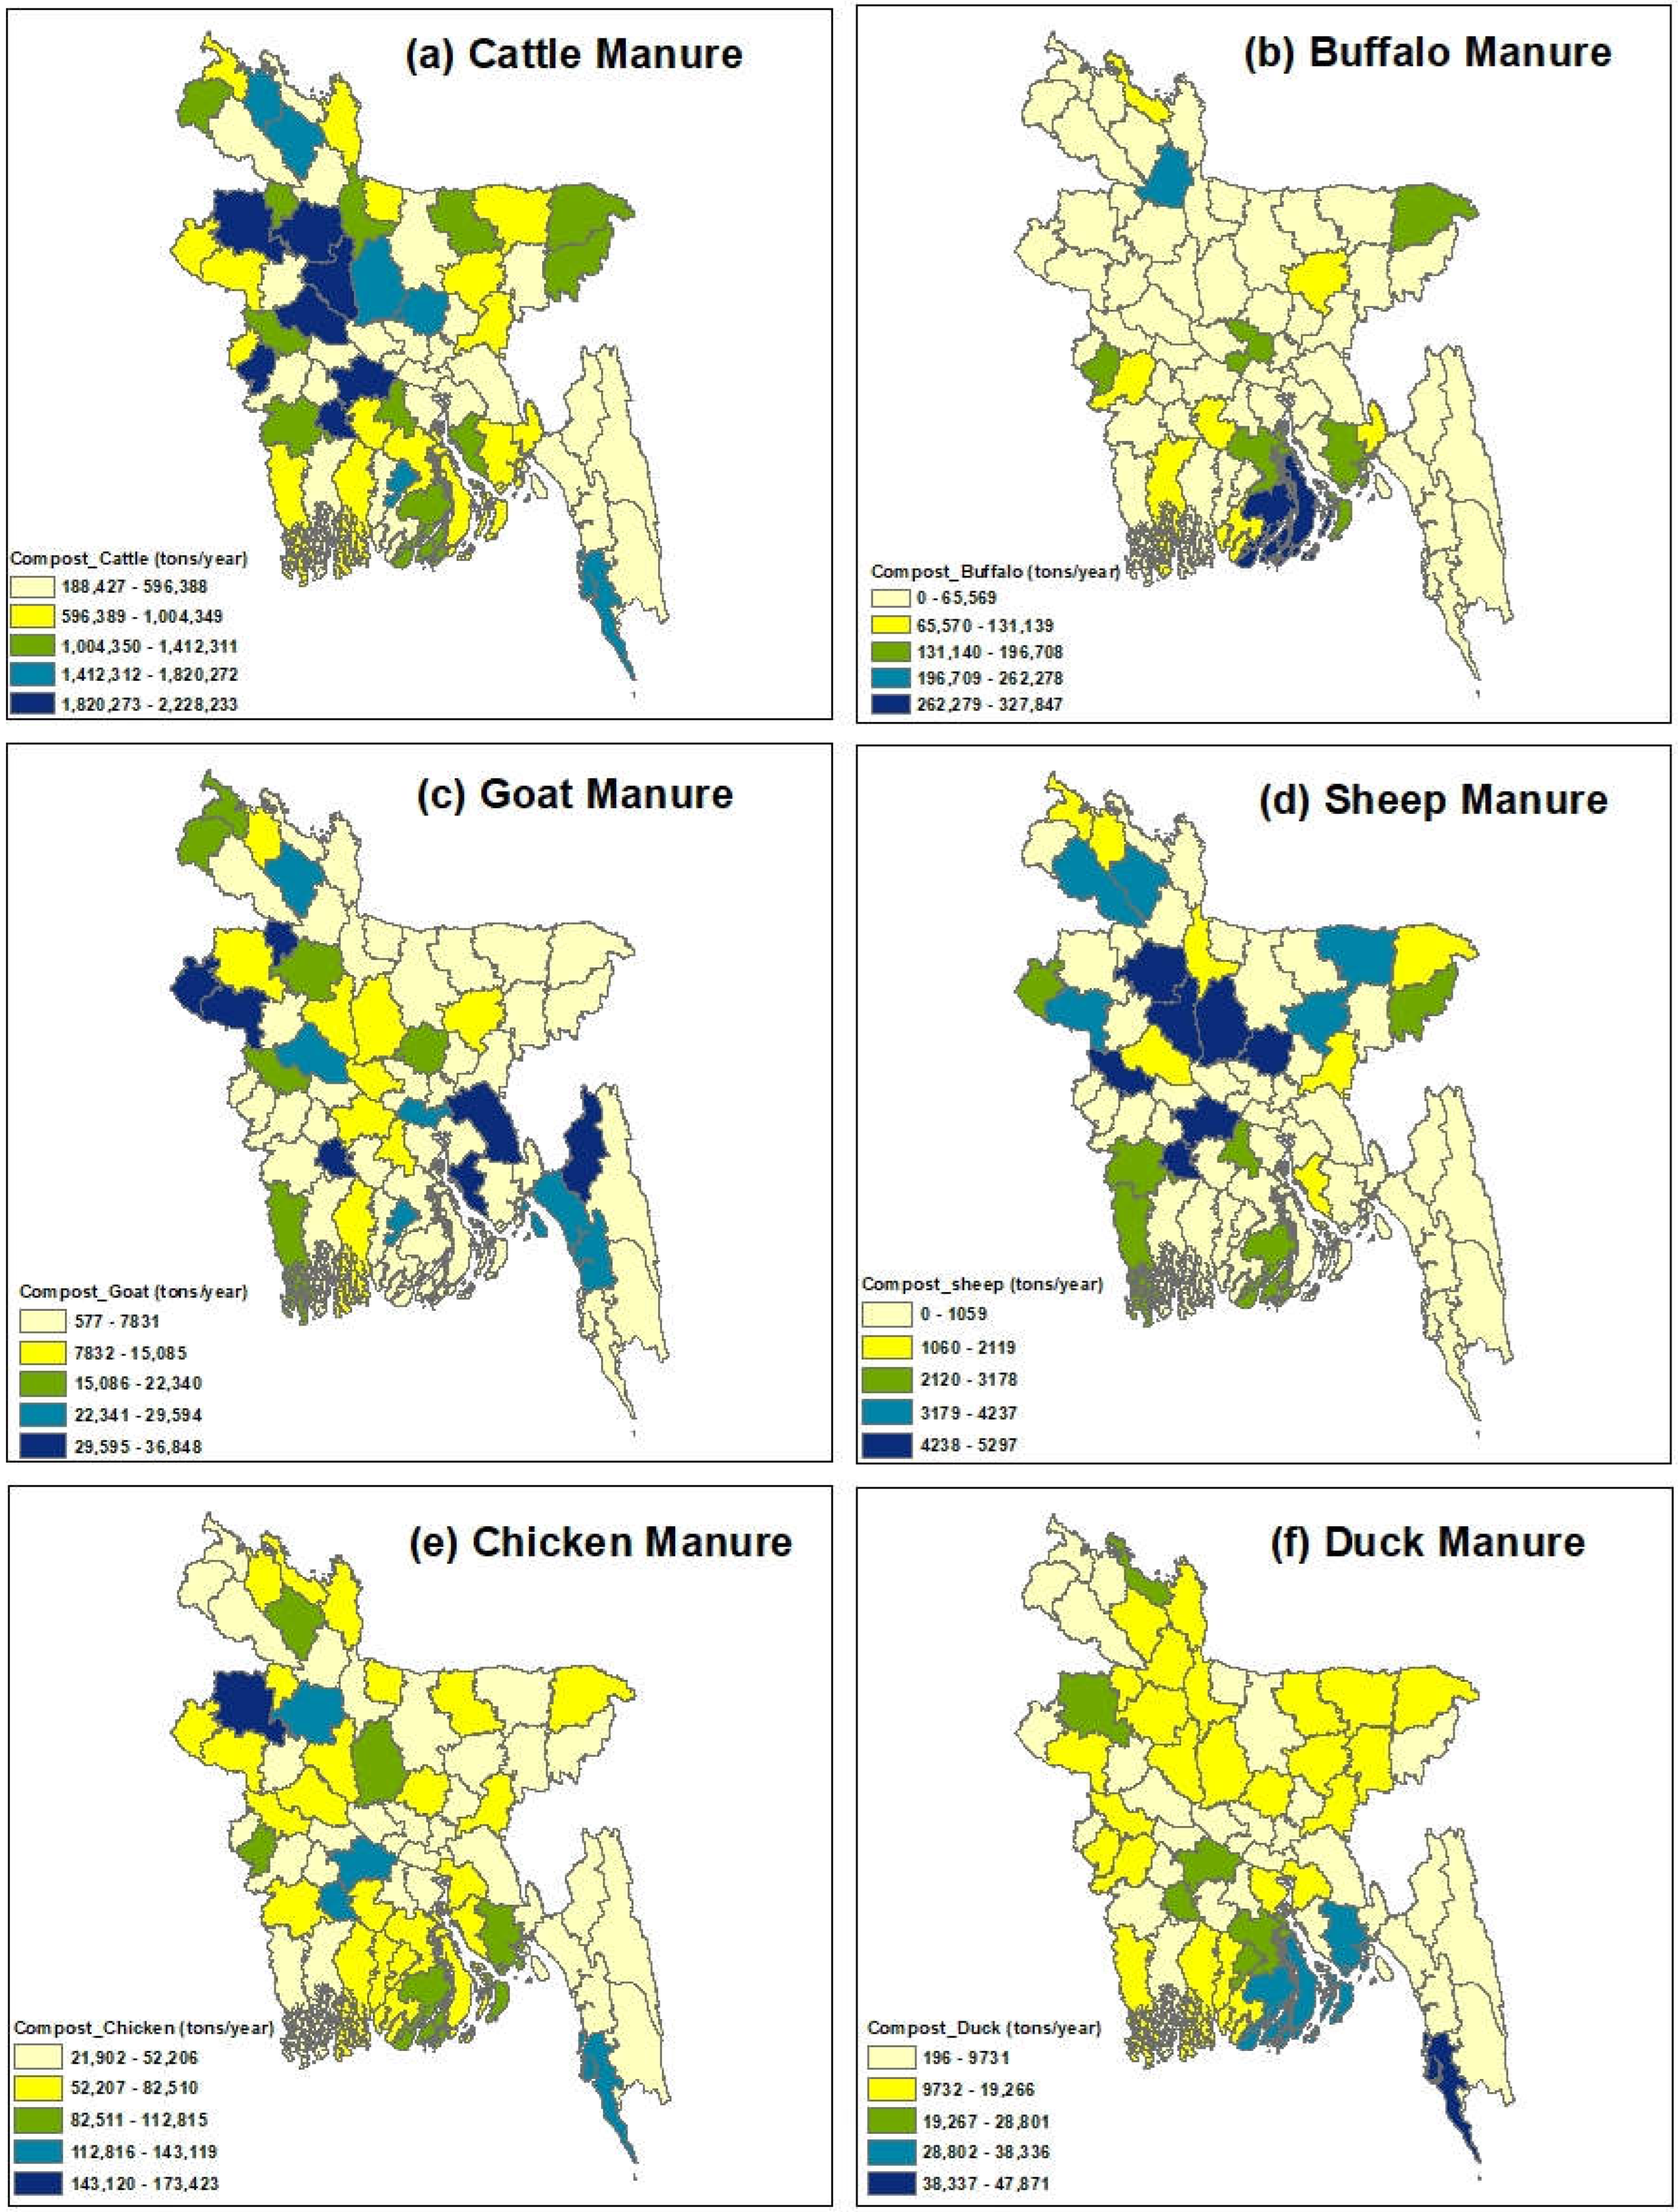
Figure 9.
Hotspots for compost production from different livestock manures: (a) Cattle manure; (b) Buffalo manure; (c) Goat manure; (d) Sheep manure; (e) Chicken manure; (f) Duck manure.
Figure 9.
Hotspots for compost production from different livestock manures: (a) Cattle manure; (b) Buffalo manure; (c) Goat manure; (d) Sheep manure; (e) Chicken manure; (f) Duck manure.
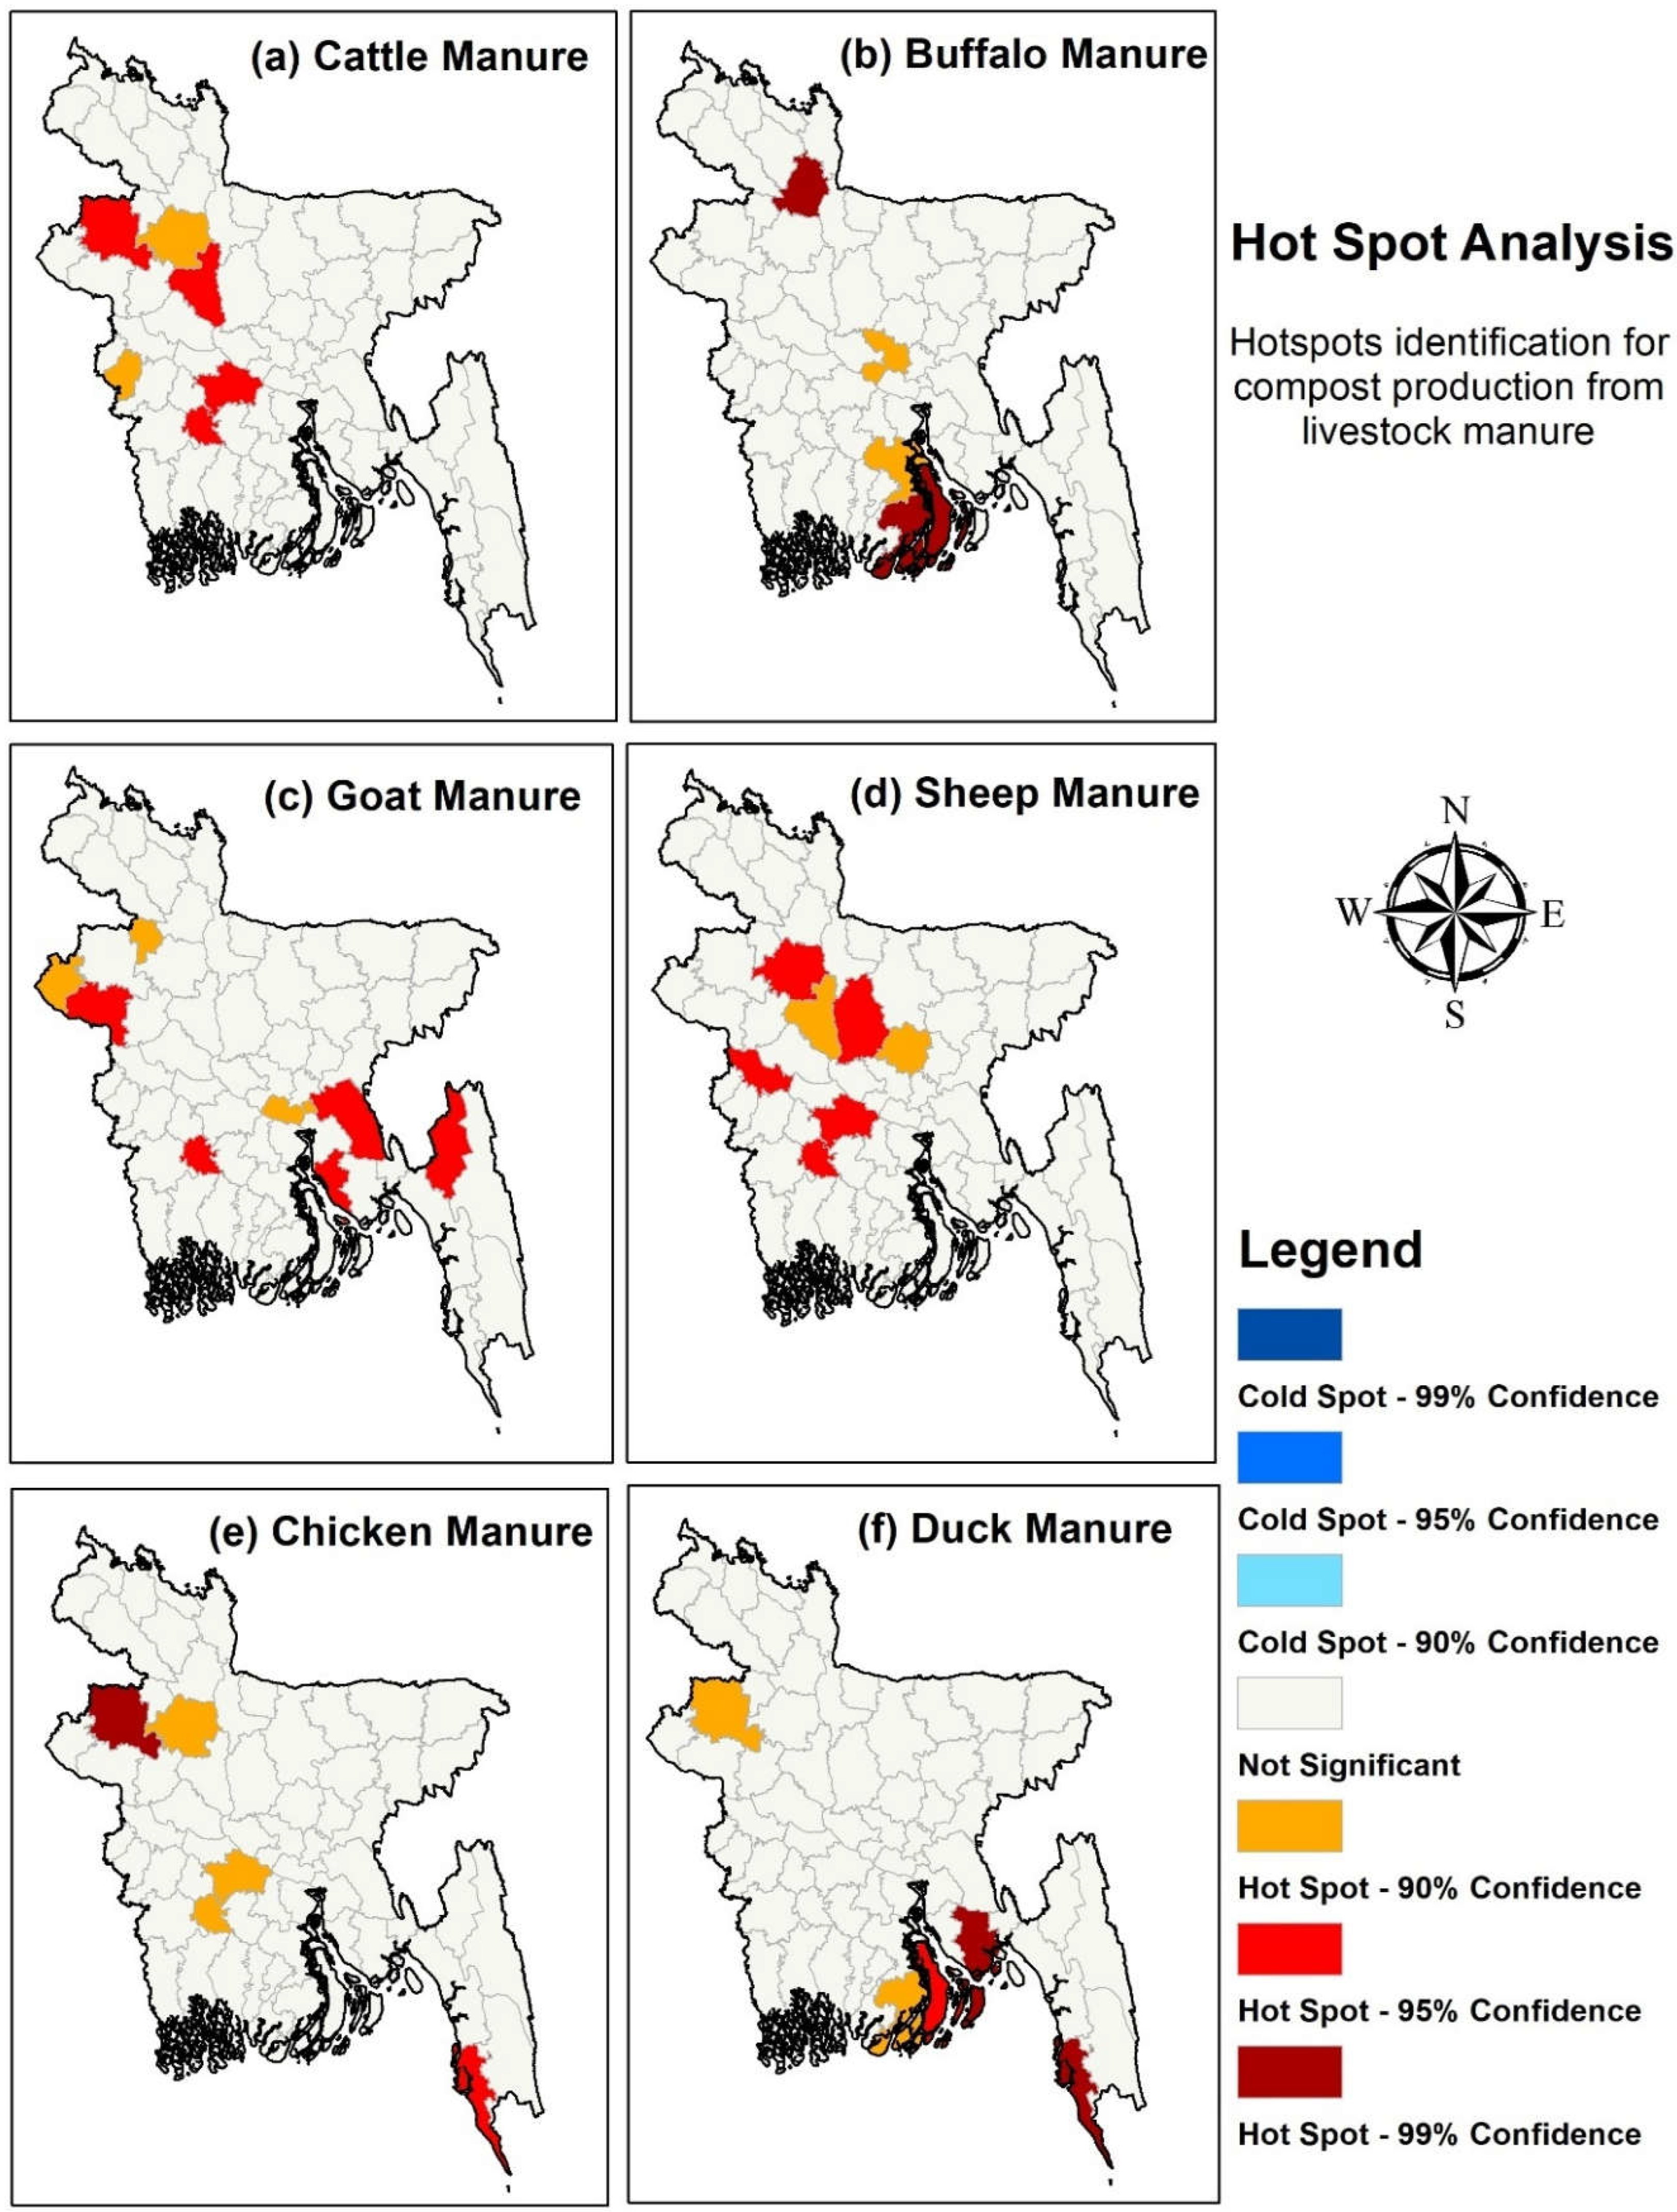
Figure 10.
Division-wise electricity potential from biogas in Bangladesh: (a) Electricity production from biogas; (b) Replacement of electricity demand by biogas.
Figure 10.
Division-wise electricity potential from biogas in Bangladesh: (a) Electricity production from biogas; (b) Replacement of electricity demand by biogas.
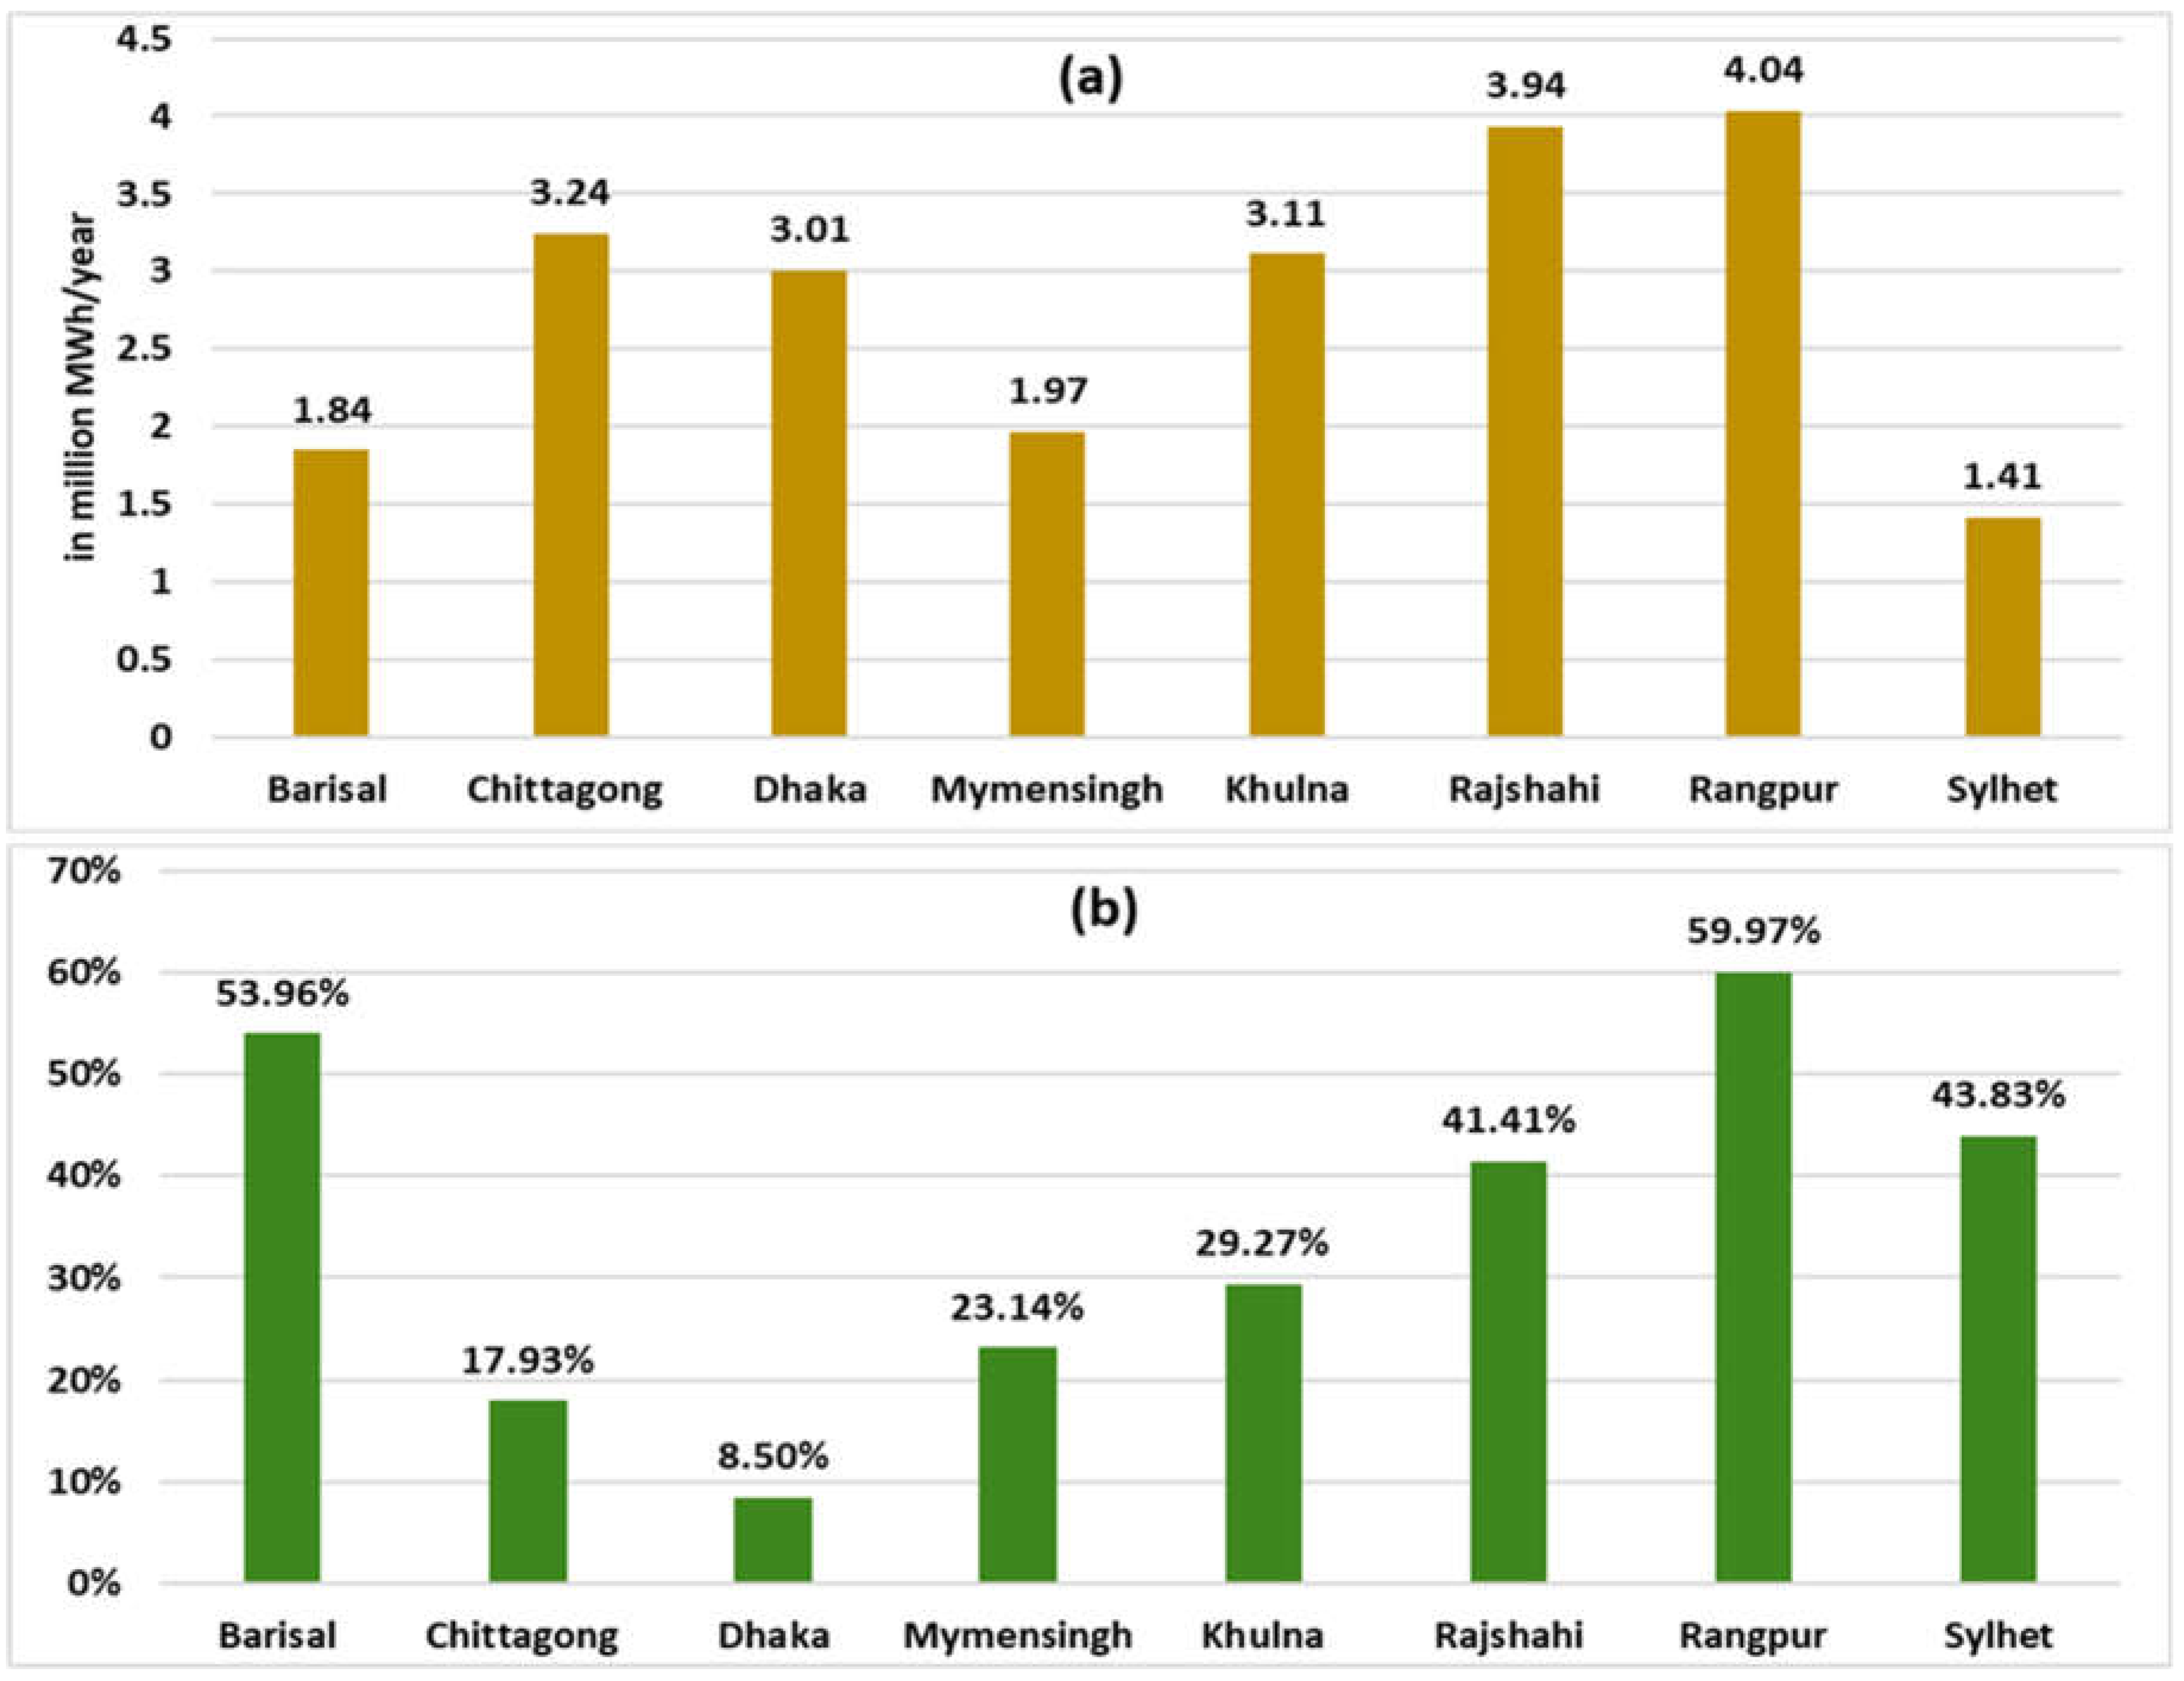
Figure 11.
Spatial distribution of electricity potential from biogas in Bangladesh in 2023: (a) District-wise potential; (b) Upazila-wise potential; (c) Existing electricity coverage.
Figure 11.
Spatial distribution of electricity potential from biogas in Bangladesh in 2023: (a) District-wise potential; (b) Upazila-wise potential; (c) Existing electricity coverage.
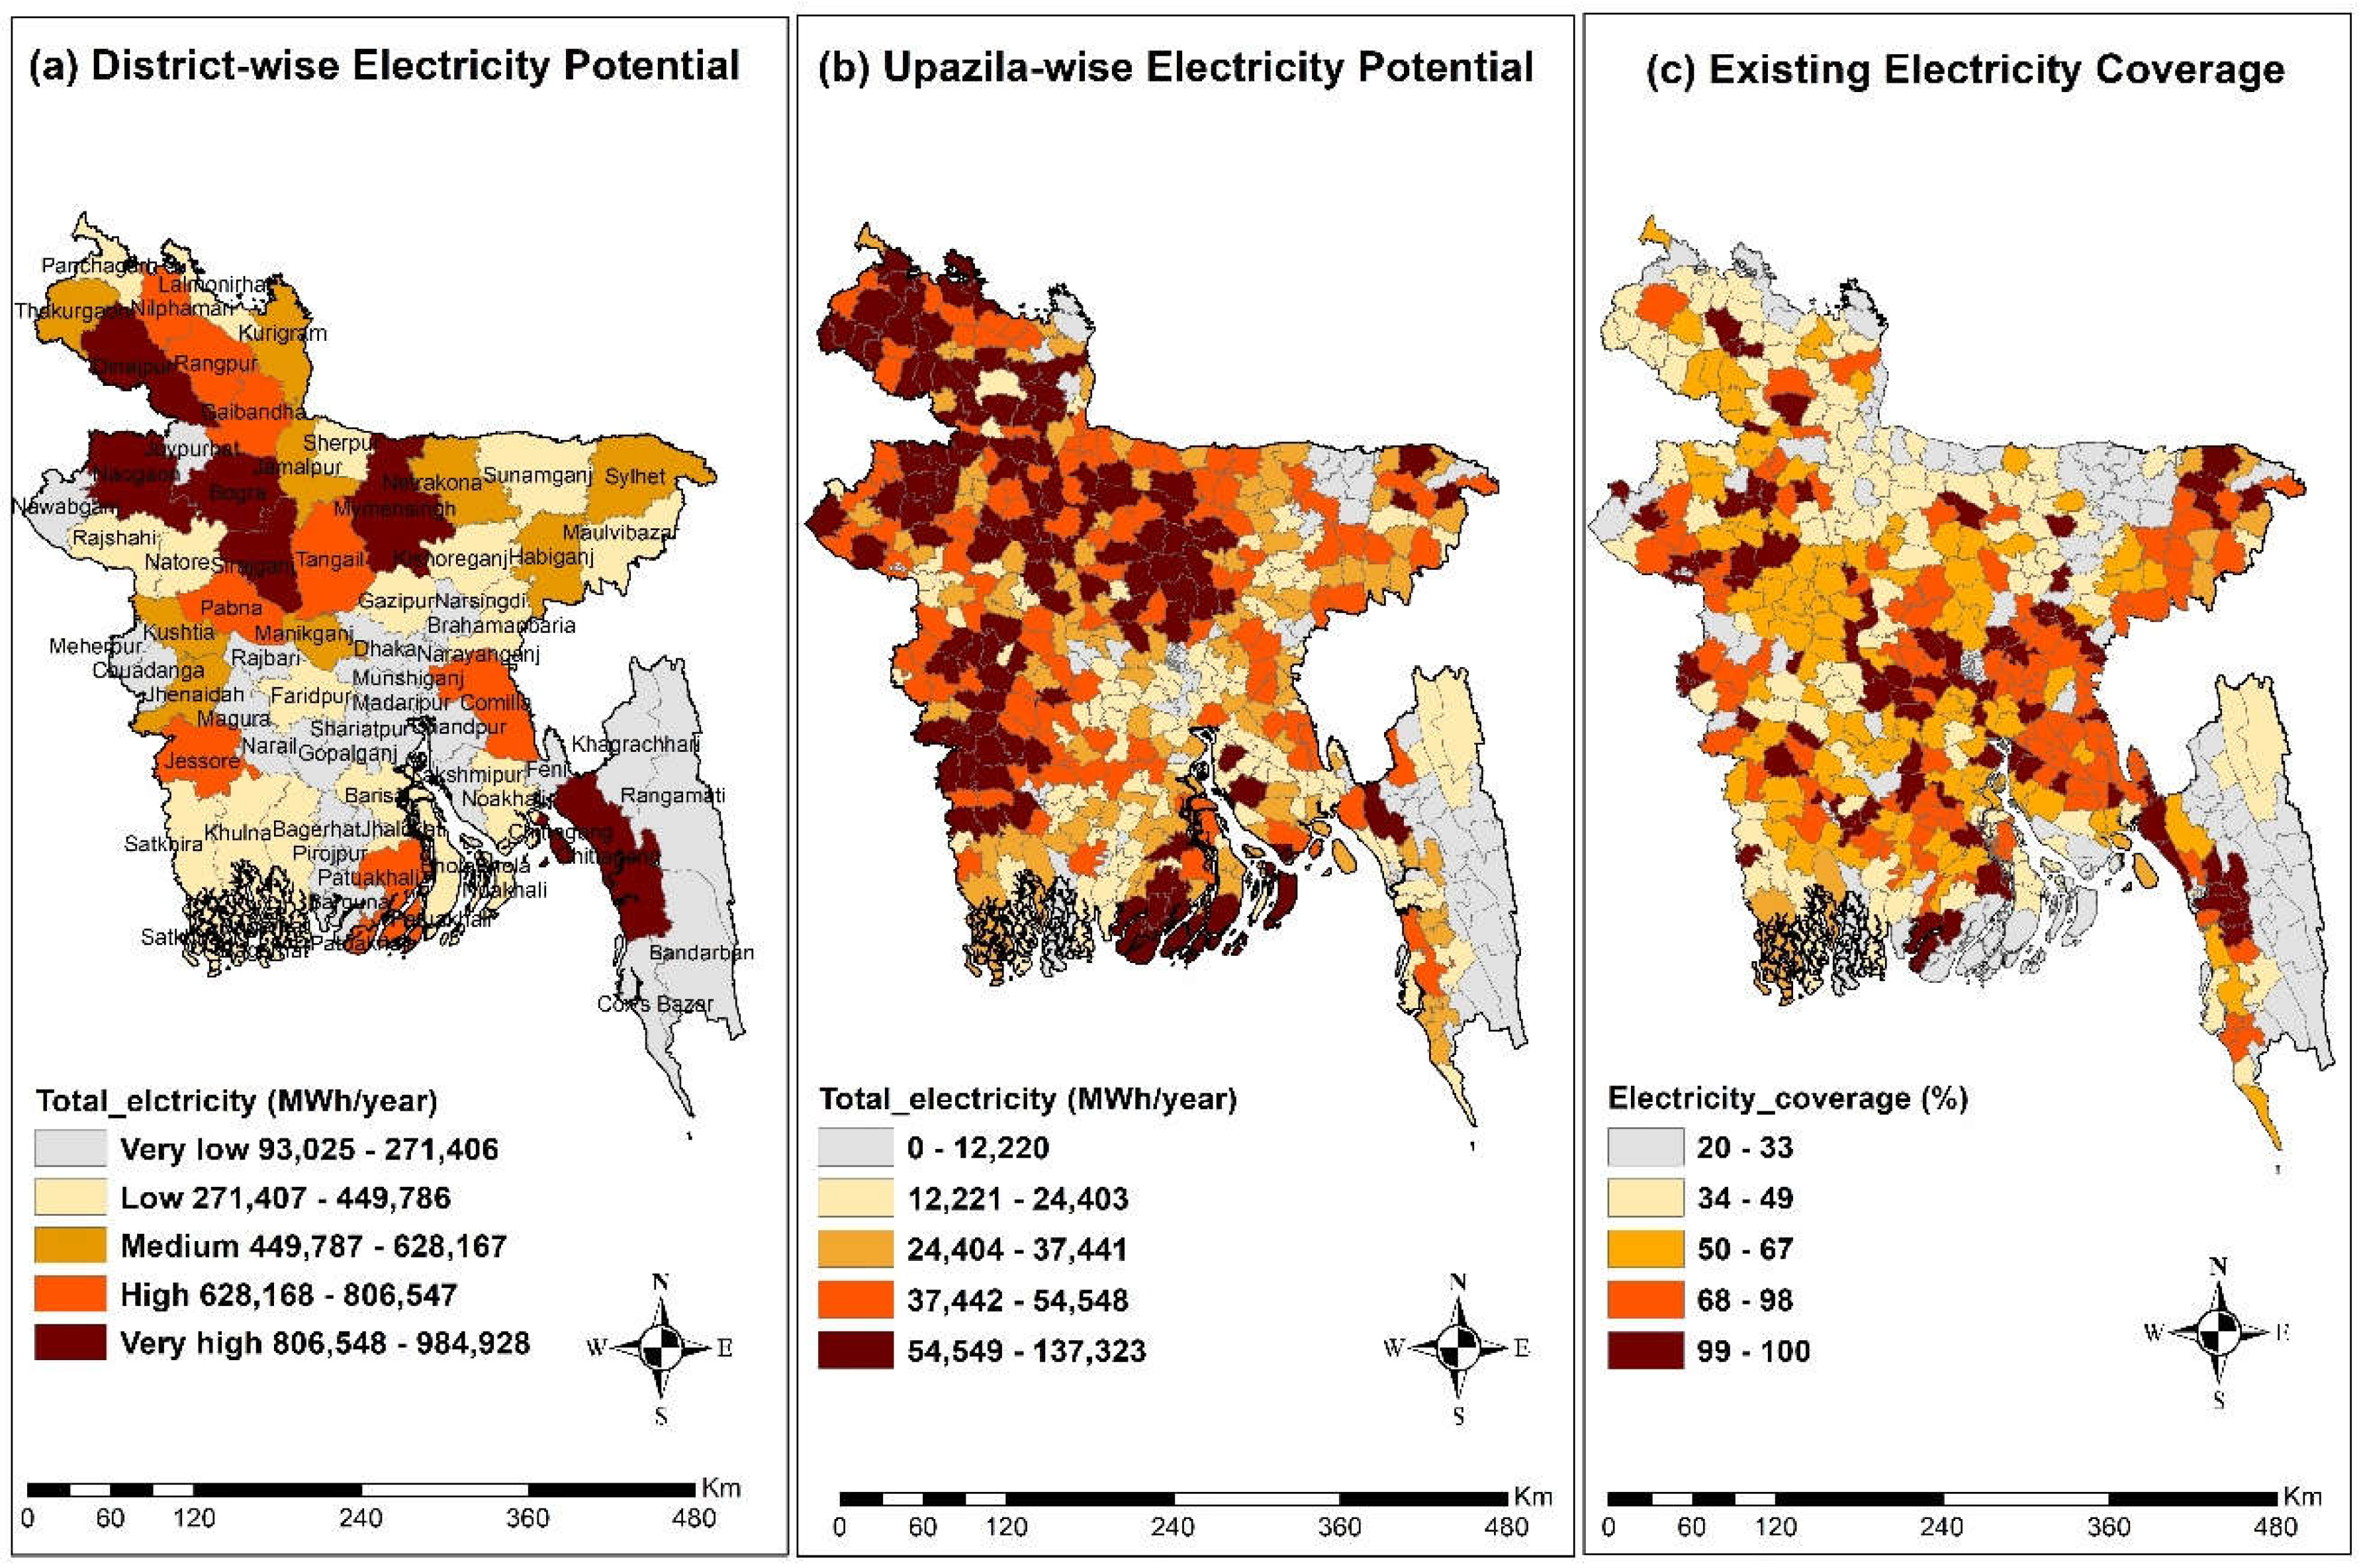
Figure 12.
Synthetic fertilizer replacement by compost (%) in Bangladesh in 2023: (a) N replaceable, (b) P2O5 replaceable, (c) K2O replaceable.
Figure 12.
Synthetic fertilizer replacement by compost (%) in Bangladesh in 2023: (a) N replaceable, (b) P2O5 replaceable, (c) K2O replaceable.
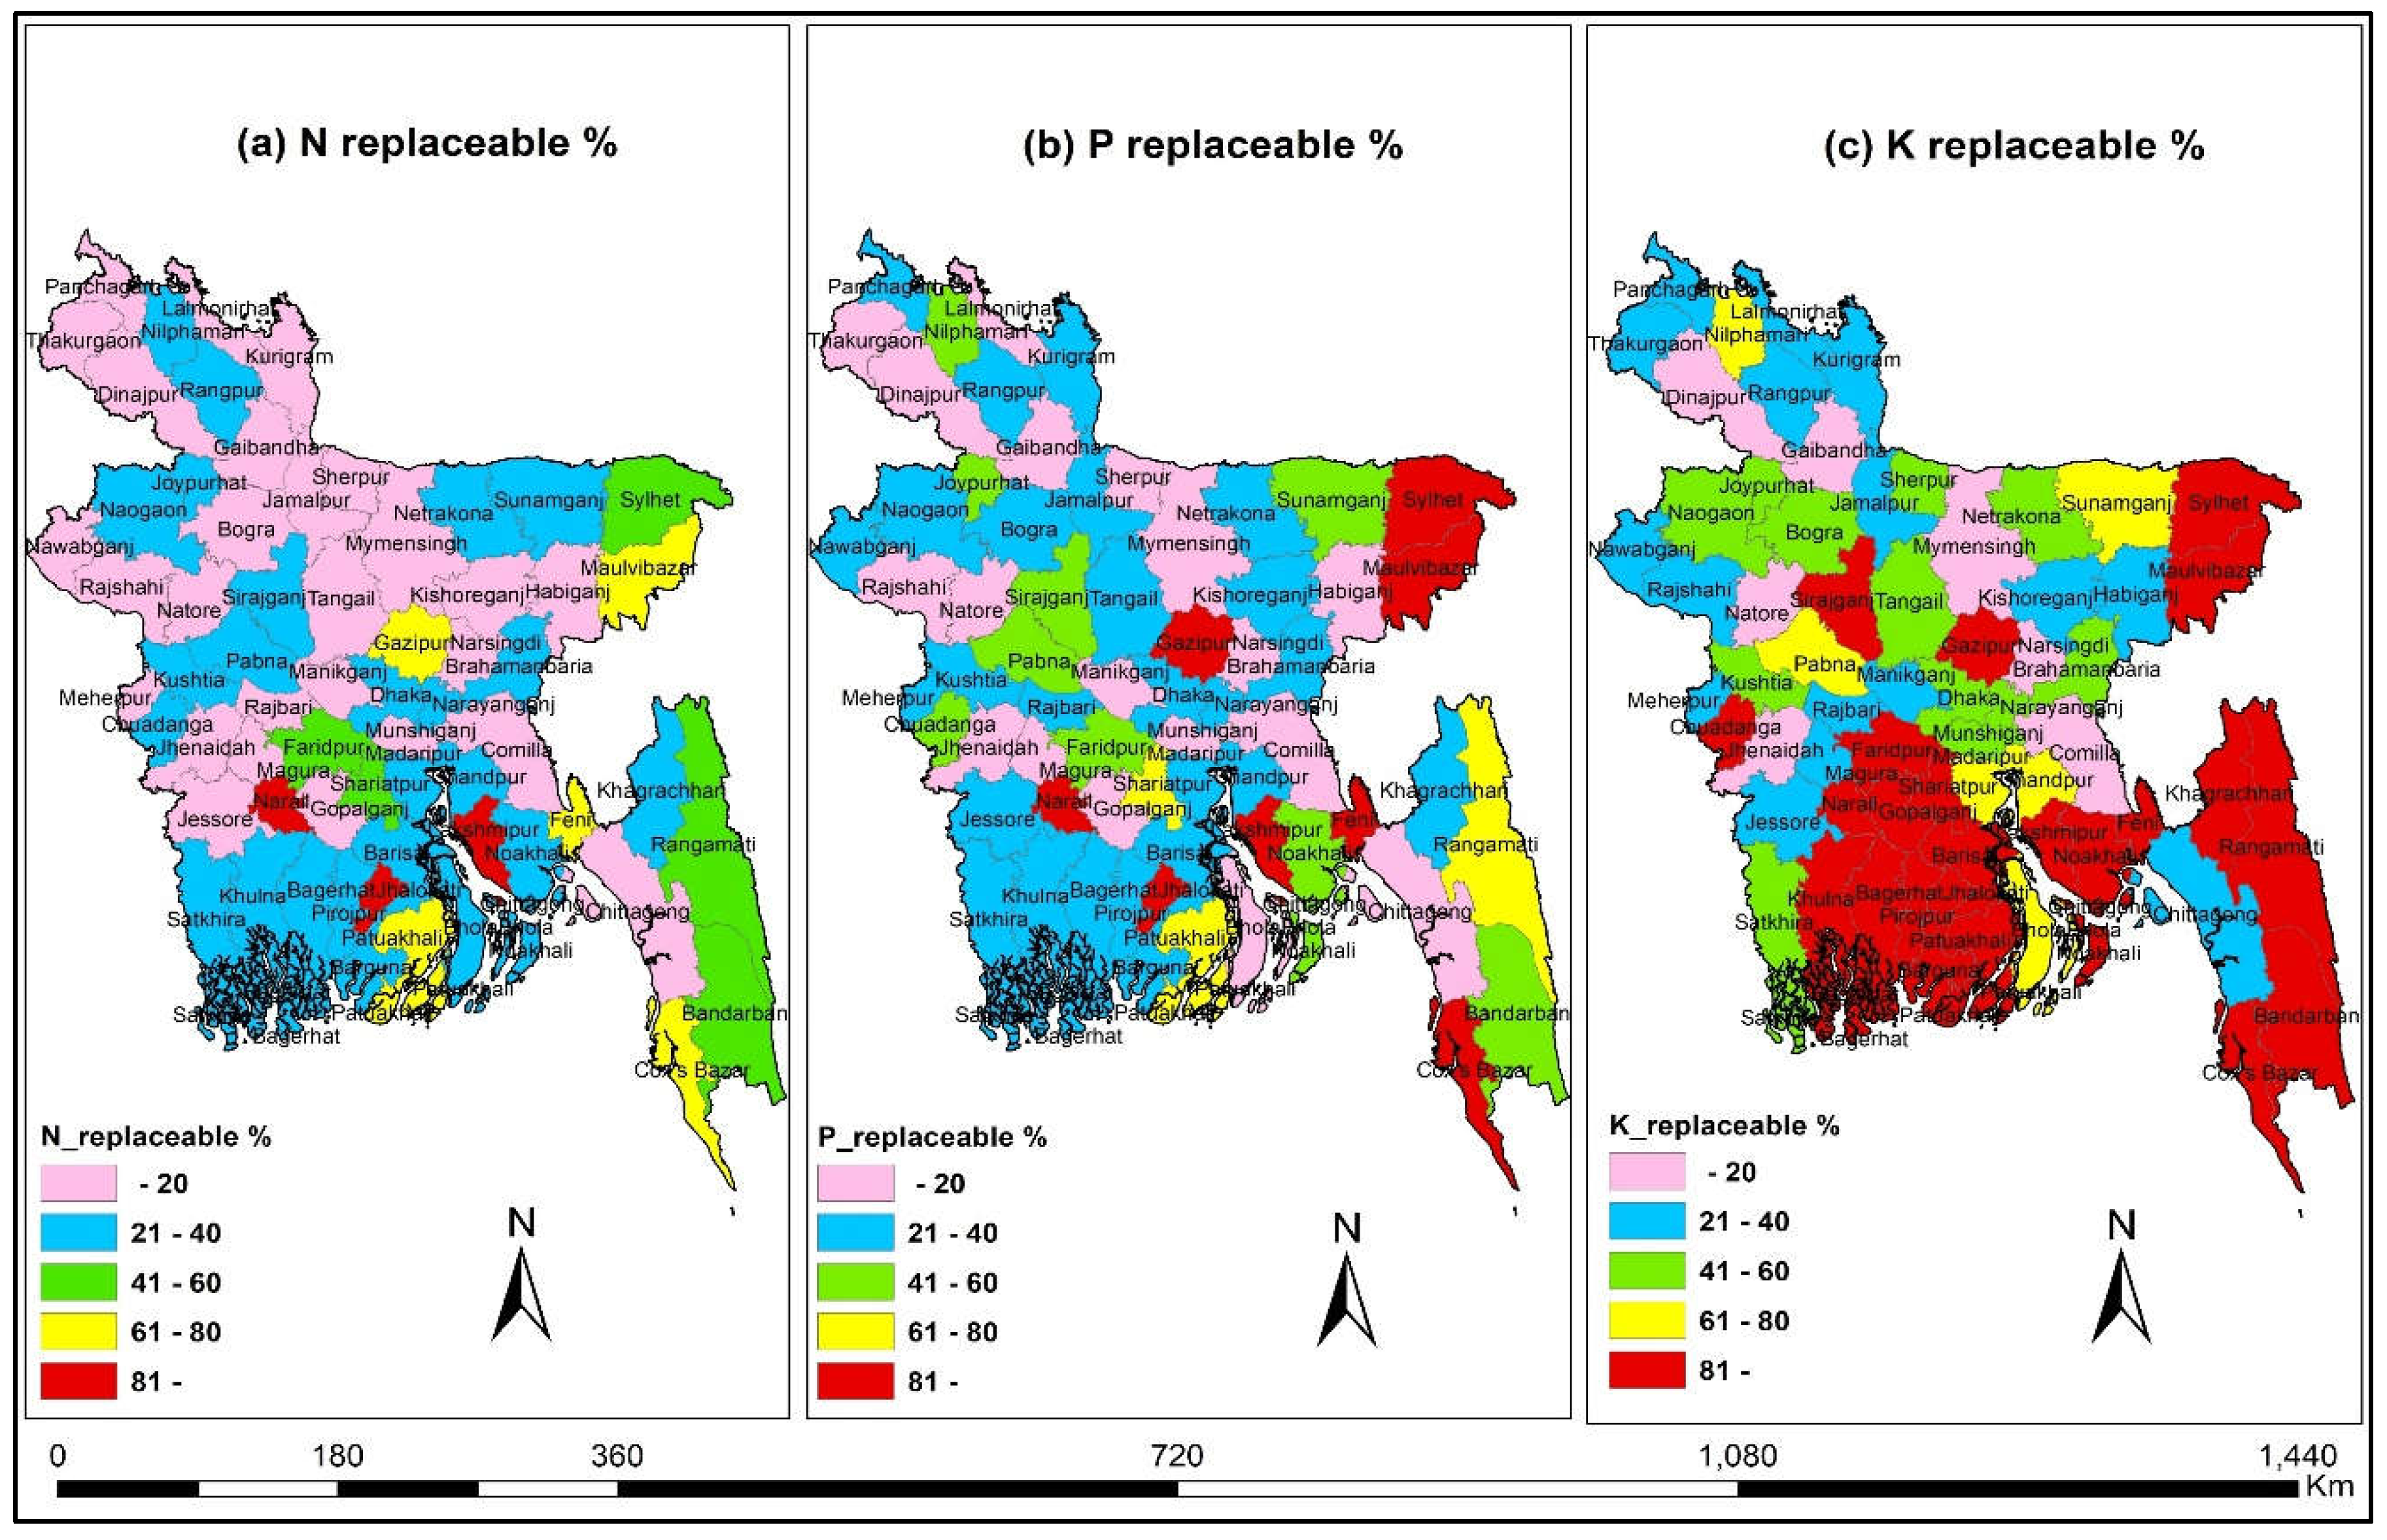
Figure 13.
GHG emission reduction potential (tons CO2eq/year): (a) for biogas production; (b) for compost production.
Figure 13.
GHG emission reduction potential (tons CO2eq/year): (a) for biogas production; (b) for compost production.

Figure 14.
Nutrients leach out reduction potential (kgha-1year-1): (a) for biogas production; (b) for compost production.
Figure 14.
Nutrients leach out reduction potential (kgha-1year-1): (a) for biogas production; (b) for compost production.
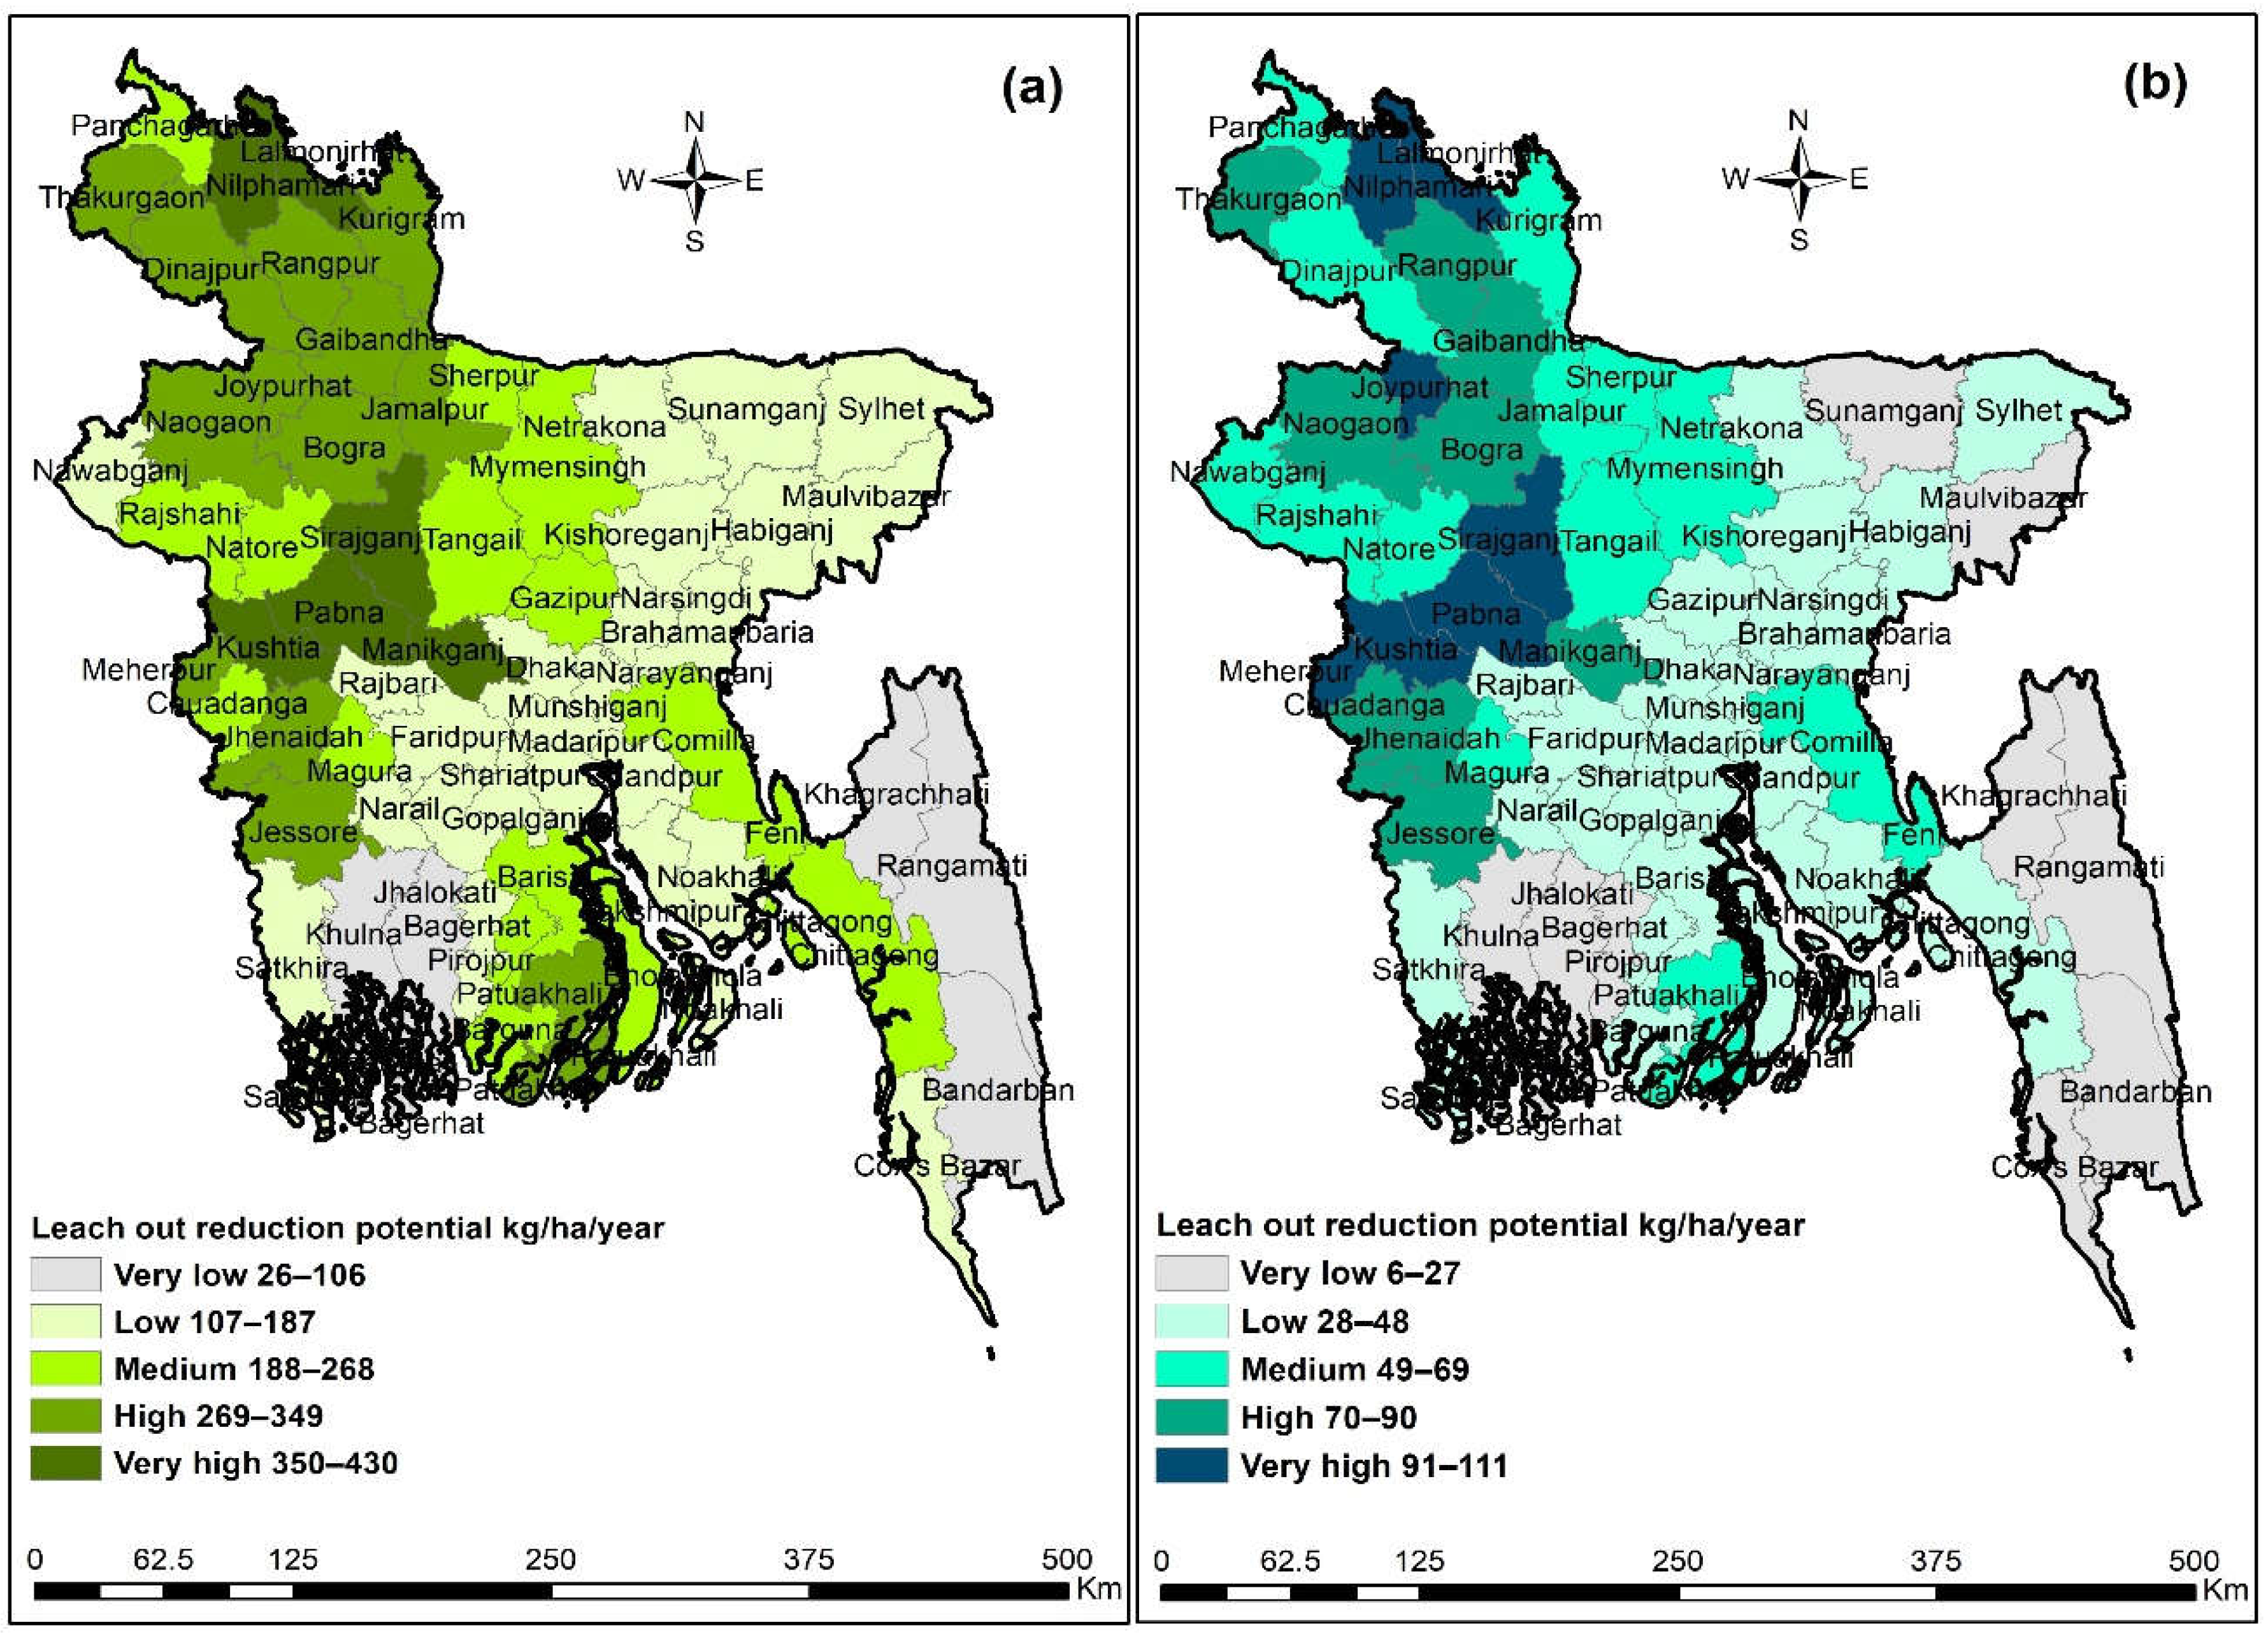
Figure 15.
Comparison of environmental impacts between biogas and compost production: (a) GHG emissions reduction potential; (b) nutrients leach-out reduction potential.
Figure 15.
Comparison of environmental impacts between biogas and compost production: (a) GHG emissions reduction potential; (b) nutrients leach-out reduction potential.
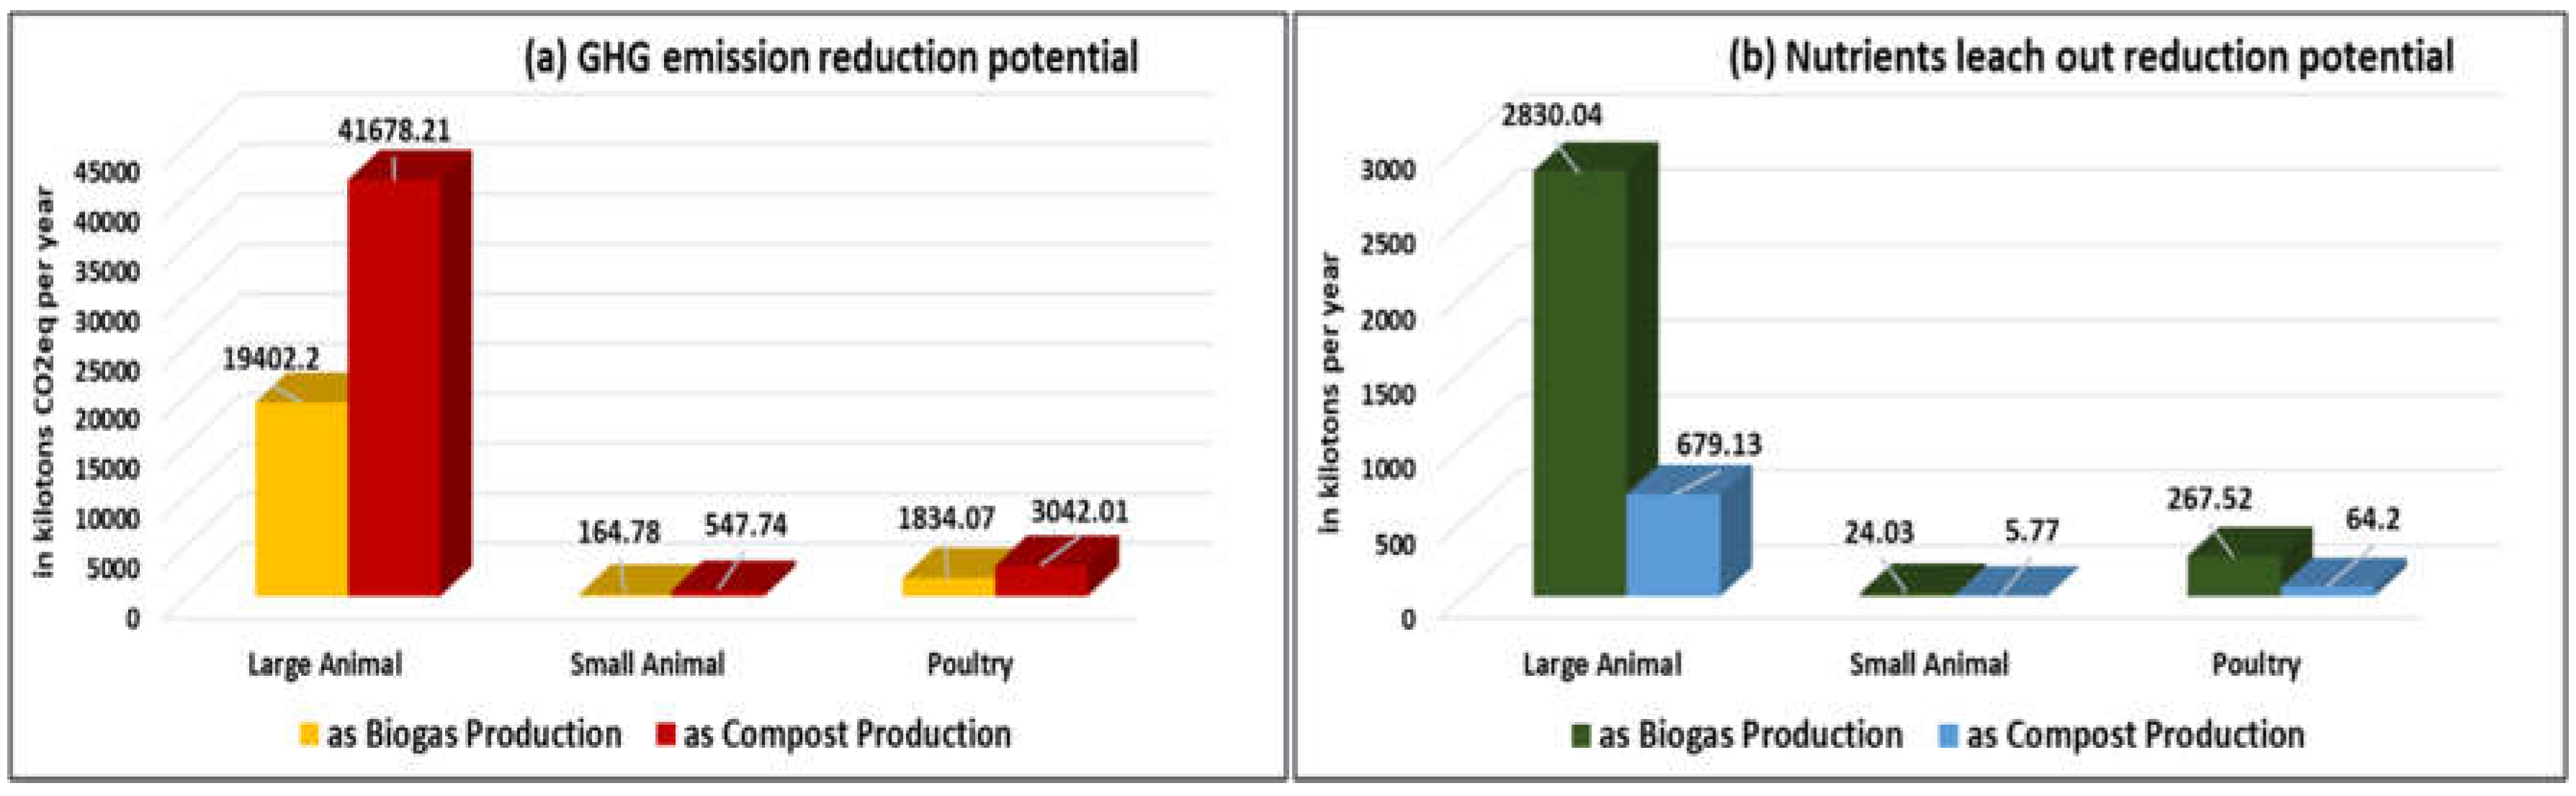
Table 1.
Values to estimate the biogas potential in this study.
| Livestock types | Manure generation rate (kg/head/day) | Availability coefficient (%) | TS of manure (%) | Biogas yield (m3 kg-1 TS) | DM (% of manure) | VS (% of DM) |
| Large Animal | 19 | 50 | 25 | 0.60 | 25 | 80 |
| Small Animal | 0.8 | 13 | 25 | 0.40 | 18 | 80 |
| Poultry | 0.045 | 90 | 29 | 0.80 | 10 | 70 |
Table 2.
The NPK content in livestock manure and biogas digestate/compost.
| Components | N (%) | P (%) | K (%) | References |
| Large animal manure | 2.7 | 0.624 | 0.6 | [41] |
| 1.79 | 1.68 | 6.17 | [42] | |
| 0.92 | 0.33 | 0.66 | [21] | |
| 0.55 | 0.90 | 0.50 | [43] | |
| Small animal manure | 1.94 | 0.99 | 0.38 | [42] |
| 1.04 | 0.28 | 1.03 | [21] | |
| 1.82 | 0.59 | 1.11 | [44] | |
| Poultry manure | 4.52 | 1.68 | 2.12 | [42] |
| 2.7 | 1.32 | 1.45 | [21] | |
| 1.65 | 2.40 | 1.7 | [43] | |
| Biofertilizer/Compost | 3.3 | 0.92 | 2.1 | [45] |
| 2.1 | 0.94 | 3.67 | [46] | |
| 0.72 | 0.16 | 0.29 | [47] | |
| 6.1 | 2.7 | 5.5 | [48] | |
| 2.36 | 2.37 | - | [49] | |
| 0.22 | 0.012 | 0.03 | [50] |
Table 3.
Loss of nutrients during composting and bioavailability to plants.
| Nutrients | N | P | K | References |
| Loss of nutrients during composting (%) | 40 | 10 | 20 | [39] |
| Nutrient bioavailability by agricultural plants (%) | 40 | 80 | 90 | [39] |
Table 4.
GHG emission factors for synthetic fertilizer production.
| Emission factor (kg CO2eq/kg fertilizer) | Types of fertilizer | Country/Region | References |
| 1.6 | Urea | Europe | [67] |
| 3.1 | USA | [68] | |
| 1.9/2.7 | Europe/Russia, USA | [69] | |
| 4 | Sweden and Western Europe | [70] | |
| 3.5 | United Kingdom | [71] | |
| 1.3-1.8 | Ammonium phosphate | Sweden and Western Europe | [70] |
| 1.4/1.7 | Europe/Russia, USA | [69] | |
| 1 | Single superphosphate | Sweden | [70] |
| 0.6 | United Kingdom | [71] | |
| 0.4-0.54 | Triple superphosphate | Europe, Russia, USA | [69] |
| 1 | Sweden | [70] | |
| 1.2 | United Kingdom | [71] | |
| 0.14-0.25 | Potassium chloride | China | [72] |
Table 5.
GHG emission factors for composting waste.
| Emission factor (kgCO2eq/kg compost) | Waste types | Authors |
| 0.172-0.186 | Municipal waste | [73] |
| 0.18 | Biowaste | [74] |
| 0.239 | Household waste | [63] |
| 0.145-0.173 | Dairy manure | [75] |
| 0.413 | Municipal waste | [64] |
| 0.423 | Cattle manure | [65] |
| 0.164 | Organic waste | [76] |
| 0.381 | Grass and green waste | [66] |
| 0.229 | Livestock manure | [77] |
| 0.323 | Solid waste | [78] |
Table 6.
Nutrient leaching factors through runoff and subsurface drainage.
| TN (kgha-1) | TP (kgha-1) | Country | Soil type | Crops | Others | Reference |
| 9.3 | 0.29 | Finland | Peat soil | Cereals, barley | Subsurface drainage | [85] |
| 21.7 | 0.30 | Norway | Mineral soil | Perennial grass | Subsurface drainage | [86] |
| 2.41 | 0.64 | China | - | cereals | Runoff | [87] |
| 25 | 0.30 | Finland | Peat soil | Grass | Subsurface drainage | [88] |
| 39-191 | 0.9-2.4 | Sweden | Garden plants | Surface runoff | [89] | |
| 3.3-30.4 | 0.11-0.32 | Argentina | No-tillage | Cover crops | Rainfall | [90] |
| 4.3 | 0.04 | Sweden | Silty loam | Barley, grass | Subsurface | [91] |
| 28.5–40.0 | 0.7-4.3 | East Asia | - | Rice, Paddy | Subsurface | [92] |
| 4.5–12.9 | 0.5-2.6 | East Asia | - | Rice, Paddy | Surface runoff | [92] |
Note: TN=Total nitrogen, TP=Total phosphorus.
Table 7.
The assessed livestock manure potential in Bangladesh in 2023.
| Manure Potentiality | Cattle | Buffalo | Goat | Sheep | Chicken | Duck | Total |
| Manure generation (million tons/year) | 188.819 | 11.528 | 8.618 | 1.208 | 5.645 | 1.156 | 216.98 |
| Available manure (million tons/year) | 94.409 | 5.764 | 1.120 | 0.157 | 5.081 | 1.04 | 107.57 |
| Biogas(million m3/year) | 12,847.06 | 784.36 | 101.64 | 14.24 | 1,069.33 | 218.96 | 15,035.59 |
| Electricity (MWh/year) | 23.12 | 1.41 | 0.202 | 0.028 | 1.924 | 0.394 | 27.064 |
| Biofertilizer (kilotons/year) | 12,273.26 | 749.33 | 104.86 | 14.69 | 294.68 | 60.34 | 13,497.17 |
| Compost (kilotons/year) | 58,534.03 | 3,573.72 | 717.02 | 100.47 | 3,759.76 | 769.86 | 67,363.03 |
| Synthetic fertilizer supply (kilotons/year) | 692.81 | 43.24 | 643.78 | 90.21 | 609.28 | 125.76 | 2,202.13 |
Disclaimer/Publisher’s Note: The statements, opinions and data contained in all publications are solely those of the individual author(s) and contributor(s) and not of MDPI and/or the editor(s). MDPI and/or the editor(s) disclaim responsibility for any injury to people or property resulting from any ideas, methods, instructions or products referred to in the content. |
© 2025 by the authors. Licensee MDPI, Basel, Switzerland. This article is an open access article distributed under the terms and conditions of the Creative Commons Attribution (CC BY) license (http://creativecommons.org/licenses/by/4.0/).
Copyright: This open access article is published under a Creative Commons CC BY 4.0 license, which permit the free download, distribution, and reuse, provided that the author and preprint are cited in any reuse.


