Submitted:
28 August 2025
Posted:
30 August 2025
You are already at the latest version
Abstract
Calcium propionate serves as an effective feed additive for mitigating hypocalcemia and ketosis in early-lactation dairy cows by providing supplemental calcium and gluconeogenic substrates. This study investigated the effects of varying calcium propionate supplementation levels during the postpartum period on productive performance, milk mineral composition, and fatty acid profiles in dairy cows. Thirty-two multiparous Holstein cows were randomly assigned to four groups (8 cows/group) at calving: a control group (CON) fed a basal diet without supplementation and three treatment groups receiving a basal diet supplemented with 200 (LCaP), 350 (MCaP), or 500 g/d (HCaP) of calcium propionate until 35 days in milk (DIM). All cows were transitioned to the same diet from 36 DIM onward. Productive performance was monitored daily through the peak of lactation (36–125 DIM), with milk samples collected at 7, 21, and 35 DIM for mineral and fatty acid analysis. Calcium propionate supplementation during early lactation tended to increase milk yield during the peak of lactation, with the highest value observed in the MCaP group. The milk K concentration exhibited a quadratic response, with significantly greater values observed in the LCaP and HCaP groups. Conversely, milk Mg and P concentrations decreased linearly with increasing supplementation with calcium propionate. The fatty acid profiles demonstrated a linear decline in the proportions of short-chain fatty acids (C6:0, C8:0, and C12:0) with increasing calcium propionate supplementation. Furthermore, the proportions of C18:2 cis-9,12 and the sum of polyunsaturated fatty acids exhibited a quadratic response, with the lowest values observed in the MCaP group. These findings indicate that calcium propionate supplementation modulates milk mineral homeostasis (K, Mg, P) and alters fatty acid metabolism, concurrently improving lactation performance. The 350 g/d supplementation level achieved the most favorable balance between production enhancement and milk composition, suggesting its potential as an optimal strategy for early-lactation dairy cow management.
Keywords:
calcium propionate
; dairy cow
; fatty acid
; mineral
1. Introduction
The rapidly increasing demand for calcium and energy for milk synthesis during early lactation in dairy cows frequently exceeds dietary intake, increasing the risk of hypocalcemia and ketosis [1]. Clinical hypocalcemia, defined by blood calcium levels < 1.4 mmol/L, affects approximately 5% of cows [2], whereas subclinical hypocalcemia (1.4 - 2.0 mmol/L) impacts approximately 50% of cows [3,4]. Simultaneously, 2% - 15% of dairy cows develop clinical ketosis, and 40% - 60% experience subclinical ketosis [5], primarily due to inadequate adaptation to the negative energy balance (NEB) during this period [6]. Hypocalcemia and ketosis in dairy cows can negatively impact their productivity, fertility, and overall health [7,8].
Research has shown that dairy cows experiencing fewer health issues during early lactation tend to have higher milk production and more consistent lactation curves [9]. Thus, mitigating NEB and enhancing calcium availability during early lactation can positively influence milk yield in subsequent periods. The milk composition can provide useful information on the health status of dairy cows during early lactation. Research has demonstrated that the concentrations of certain minerals in milk are influenced not only by dietary element concentrations [10] but also by the health status of the cows [11] and the dietary calcium level, which affects the absorption and metabolism of other minerals (particularly P, Mg, Fe, and Zn) [12,13]. Moreover, milk fatty acid profiles serve as noninvasive indicators of the energy and metabolic status of early-lactating cows by reflecting the extent of body fat mobilization [14,15]. This is because fatty acids derived from adipose tissue differ from those synthesized de novo from dietary sources [16].
Calcium propionate is a valuable source of calcium and gluconeogenetic precursors (Goff et al., 1996; Zhang et al., 2022b). Previous studies have shown that calcium propionate can increase milk yield, prevent hypocalcemia and alleviate NEB in early-lactating cows [17,18]. It may also influence adipose tissue mobilization [19] and affect milk fatty acid profiles. Dietary supplementation with calcium propionate increases dietary calcium levels and improves the health status of dairy cows, which may consequently influence milk mineral concentrations. However, few studies have examined how dietary calcium propionate supplementation during early lactation affects lactation performance during the peak of lactation, as well as milk mineral composition and fatty acid profiles.
This study aimed to evaluate the effects of calcium propionate supplementation on productive performance during the peak of lactation and on milk mineral composition and fatty acid profiles during early lactation. We hypothesized that increasing the calcium and gluconeogenetic precursor supply through calcium propionate supplementation during early lactation would enhance subsequent lactation performance. Additionally, we hypothesized that calcium propionate supplementation would alter milk mineral composition and fatty acid profiles by influencing mineral absorption and adipose tissue mobilization.
2. Materials and Methods
The animal experiment was conducted from September 2020 to February 2021 at Beijing Sunlon Livestock Development Co., Ltd. (Beijing, China). The research methods and protocols were carried out according to the standards established by the Institute of Animal Sciences of the Chinese Academy of Agricultural Sciences under the protocol of No. IAS2020-93.
2.1. Experimental Design and Animal Management
Thirty-two multiparous Holstein dairy cows were randomly assigned to the control (CON), low-calcium propionate (LCaP), medium-calcium propionate (MCaP), and high-calcium propionate (HCaP) groups in a randomized block design before calving on the basis of body weight, parity, and previous 305-day milk yield. A priori power analysis was performed with G*Power (version 3.1.9.6) to ensure an appropriate sample size. The initial characteristics of the dairy cows in each group are presented in Table 1. The cows in the experiment were loosely housed in individual stalls with ad libitum access to feed. Each cow was provided with a diet that allowed 5% to 10% leftover feed before the next feeding. All the cows had free access to food and water. After calving, the dairy cows in the four groups were offered the same total mixed ratio (TMR) as the basal diet, supplemented with different doses of calcium propionate (Jiangsu Runpu Food Technology Co. LTD., Lianyungang, Jiangsu, China; purity > 99%): 0, 200, 350, and 500 g/d per cow from calving to DIM 35. According to the experimental design, each cow was administered calcium propionate three times a day in approximately equal amounts at the time of feeding. The supplement was administered orally via a stainless-steel pellet gun to ensure accurate intake [20]. From 36 to 125 DIM, all cows in the study were fed the same lactation diet as TMR without supplementation of calcium propionate. All cows were milked at 6:00, 14:00, and 22:00 and offered the same basal diet at 7:00, 14:30, and 18:00. The ingredient composition and nutrient levels of the diets during early lactation (0 to 35 DIM) and the peak of lactation (after 35 DIM) are presented in Table 2. The nutrient requirements for dairy cows were formulated according to NRC (2001) recommendations.
2.2. Sample Collection
The amount of feed offered and refused for each cow during the peak of lactation was recorded and weighed daily to calculate dry matter intake (DMI). Feed samples were collected weekly for the analysis of chemical composition. The daily milk yield (36–125 DIM) was automatically recorded by an AfiMilk MPC milk meter (Kibbutz Afikim, Israel). Two 50-mL milk samples were collected in sterile centrifuge tubes from each cow across three consecutive milking times per day at 7, 21, 35, 65, 95, and 125 DIM. The milk samples were mixed at a 4:3:3 volume ratio for the milk samples collected in the morning, noontime, and evening within a single day [21]. Then, the milk samples collected at 65, 95, and 125 DIM were stored at 4 °C with 2-bromo-2-nitropropane-1,3-diol for the analysis of milk composition, including milk fat, protein, lactose, and somatic cell count (SCC). The milk samples collected at 7, 21, and 35 DIM were stored at -80 °C without preservative for subsequent analyses of mineral composition and fatty acid profiles.
2.3. Analytical Procedures
The dietary samples were dried at 55 °C for 48 h and then passed through a 1 mm screen. The diet was analyzed for dry matter (DM), crude protein (CP), ether extract (EE), starch, calcium (Ca), phosphorus (P), and acid detergent fiber (ADF) content according to AOAC [22] methods 934.01, 954.01, 920.39, 996.11, 968.08, 946.06, and 973.18, respectively. Neutral detergent fiber (aNDF) content was analyzed according to Van Soest et al. [23].
The composition of milk fat, protein, lactose, and SCC was analyzed by a Combi Foss 4000 (Hillerød, Denmark) within 48 h. The 4% FCM (fat-corrected milk) yield and ECM (energy-corrected milk) yield were calculated according to 4% FCM = 0.4 × milk yield + 15 × milk fat yield (NRC, 2001), and the ECM (kg/d) = 0.327 × milk yield + 12.95 × milk fat yield + 7.20 × milk protein yield (de Souza et al., 2021). The Ca, P, Mg, K, Fe, and Zn concentrations in milk were determined using the methods described by Franzoi et al. [24] and Kandhro et al. [25]. Briefly, triplicate 10 g milk samples were weighed into Teflon digestion vessels. Approximately 10.0 mL of a prepared mixture containing nitric acid and perchloric acid at a ratio of 10:1 (v/v) was added to the digestion vessel and heated in a Galanz microwave oven (900 W, Galanz Enterprise Group, Guangdong, China) until the digestive fluid became colorless, transparent or yellowish. The contents of the vessels were cooled to room temperature and then filtered into a 25 mL volumetric flask by a filter funnel and paper. The volumetric flask was diluted to a volume of 25 mL with ultrapure water for the analysis of milk mineral concentrations. A blank test was also conducted in the same manner without the addition of the milk sample. Inductively coupled plasma atomic emission spectrometry (ICP‒OES) with an Agilent 5100 ICP‒OES (CA, USA) was used to determine Ca, P, Mg, K, Fe, and Zn contents at wavelengths of 315.887, 766.491, 239.5, 279.079, 178.287, and 206.2 nm, respectively [26]. Single element solutions (Inorganic Ventures, Christiansburg, VA) were diluted with ultrapure water to prepare calibration solutions at concentrations ranging from 0 to 100 mg/L for Ca, P, Mg, and K and from 0 to 4 mg/L for Fe and Zn [24].
Milk fatty acid profiles were analyzed via an Agilent 8860 gas chromatograph (CA, USA) equipped with an HP-88 capillary column (100 m × 0.25 mm ID, 0.20 µm film thickness; Agilent, CA, USA), following the methods of Sun et al. [27]. The milk samples used in the experiments were thawed at 4 °C, after which 2 g of each milk sample was collected into a 10 mL centrifuge tube. A hexane–isopropanol mixture at a ratio of 3:2 (v/v) was added to the tube at a volume of 4 mL and mixed for 2 min. Subsequently, 2 mL of 66.7 g/L sodium sulfate solution was added to the tube and vortexed for 2 min. The solution was then centrifuged at 2,500 × g for 10 min. The upper solution was transferred to a high-temperature resistant tube. Then, 2 mL sodium hydroxide methanol solution (2.0 g/100 mL) was added into the solution for saponification of the fat for 30 min at 50 °C. After cooling to room temperature, 2 mL of acetyl chloride methanol (1:10 v/v) was added to the mixture, and the mixture was methyl esterified at 90 °C for 2 h. The mixture was then cooled to room temperature, and 2 mL of ultrapure water was added. The mixture was extracted with hexane 3 times, diluted to 10 mL, and 0.5 g of sodium sulfate was added. The supernatant was filtered into vials and used for the analysis of fatty acid profiles gas chromatography. The initial temperature of the gas chromatographic column was 120 °C (10 min), which was subsequently increased to 230 °C at a rate of 1.5 °C/min and maintained at 230 °C for 35 min. The sample injector and detector temperatures were set at 250 °C and 300 °C, respectively. The carrier gas was nitrogen, and the pressure was 190 kPa. The fatty acid methyl ester chromatograms of the milk samples were compared with those of the standard solution (Anpel Laboratory Technologies Inc., Shanghai, China) to identify and quantify the fatty acids. Additionally, the proportions of saturated fatty acid (SFA), unsaturated fatty acid (UFA), monounsaturated fatty acid (MUFA), polyunsaturated fatty acid (PUFA), short-chain fatty acid (SCFA), medium-chain fatty acid (MCFA), long-chain fatty acid (LCFA), and total trans fatty acid contents were calculated on the basis of the carbon chain length and degree of unsaturation of the individual fatty acid concentration [28].
2.4. Statistical Analysis
The study employed a randomized block design with repeated measures. The MIXED procedure of SAS 9.4 was used to analyze all the data. The normality of data distribution and homoscedasticity were tested via the UNIVARIATE procedure in SAS. The repeated measures model included the fixed effects of treatment, block, time, the interaction of treatment and time, and the random effects of cows. Sampling time was treated as a repeated measure, and the compound symmetry covariance structure, which yielded the lowest corrected Akaike information criterion [29], was selected for the analysis model. Orthogonal polynomial contrasts in SAS were used to assess the linear and quadratic effects of calcium propionate supplementation levels. Additionally, orthogonal coefficients for the unequally spaced levels of calcium propionate supplementation (0, 200, 350, and 500 g/d) were generated via the IML procedure in SAS. Duncan’s multiple range test was used for multiple comparisons among treatments. Statistical significance was defined as P ≤ 0.05, and a trend was defined as 0.05 < P ≤ 0.10.
3. Results
3.1. Productive Performance During Peak Lactation
The results for productive performance during the peak of lactation (36 - 125 DIM) are shown in Table 3. As calcium propionate supplementation increased, the milk yield tended to increase linearly during the peak of lactation (P = 0.09), whereas the content of lactose in milk decreased linearly (P = 0.02). However, early-lactation calcium propionate supplementation had no significant effect on DMI, 4% FCM, ECM, milk fat, milk protein, or SCC during the peak of lactation.
3.2. Milk Mineral Composition
The effects of calcium propionate supplementation on milk mineral composition during early lactation are presented in Table 4. This study revealed that calcium propionate supplementation did not affect the concentrations of milk Ca or Fe in early-lactating dairy cows. Improving the amounts of calcium propionate supplementation levels quadratically altered the milk K concentrations (P < 0.001), with the lowest value observed in the HCaP group, but linearly decreased the milk Mg (P = 0.01) and P (P < 0.01) concentrations. The milk Mg and P concentrations also showed quadratic trends (P < 0.10), peaking in the LCaP group. Additionally, the milk K and Fe concentrations were affected by treatment × time interactions (P < 0.05) (Figure 1). The milk K concentration in the HCaP group was significantly lower than that in the other groups at 21 DIM (P = 0.002). At 35 DIM, the milk K concentrations in the LCaP and MCaP groups were significantly greater than those in the CON and HCaP groups (P < 0.001), with the highest value in the LCaP group. Furthermore, the milk Fe concentration tended to decrease in the calcium propionate-supplemented groups at 21 DIM (P < 0.10), but no differences were observed at 7 and 35 DIM (Figure 1). The concentration of Zn in the milk tended to change quadratically with increasing calcium propionate supplementation levels (P < 0.10), peaking in the LCaP group.
3.3. Milk Fatty Acid Profiles
The effects of calcium propionate supplementation on milk fatty acid profiles in early-lactating dairy cows are shown in Table 5. Increasing the concentration of calcium propionate linearly decreased the proportions of C6:0, C8:0, and C12:0 (P < 0.05). Moreover, the proportion of 18:2 cis-9, 12 showed both linear and quadratic effects (P < 0.01), which were significantly lower in the MCaP and LCaP groups than in the CON group (P < 0.01). Increasing the calcium propionate supplementation level quadratically affected the proportions of C17:0 (P = 0.01) and C20:4 cis-5, 8, 11, and 14 (P < 0.001), which were all highest in the MCaP group. The proportions of C15:1 cis-10, C18:1 trans-9, and C20:2 cis-11, 14 tended to initially increase but then decreased as the supplementation level of calcium propionate increased (P < 0.10). The proportion of C20:3 cis-11,14,17 in milk tended to show a quadratic response in cows supplemented with calcium propionate (P < 0.10), with the lowest value observed in the MCaP group. Furthermore, calcium propionate supplementation linearly increased the C10:0 proportion (P < 0.05) and tended to reduce the proportion of C18:3 cis-9, 12, and 15 (P < 0.10). The contents of the other fatty acids did not significantly differ among the four treatments. The proportions of C16:0, C17:0, C18:2 cis-9, 12, and C20:4 cis-5, 8, 11, 14 were influenced by the interaction between treatment and time (P < 0.05) (Figure 2). At 7 DIM, the MCaP group presented the highest proportions of C16:0, C17:0, and C20:4 cis-5, 8, 11, and 14 compared with the other groups (P < 0.05). Cows supplemented with calcium propionate had lower proportions of C18:2 cis-9,12 than did those in the CON group at 7 and 35 DIM (P < 0.05).
Descriptive statistics of the milk fatty acid profiles are presented in Table 6. The proportion of PUFA was quadratically affected by calcium propionate supplementation (P = 0.01) and was lowest in the MCaP group. Compared with the CON group, the LCaP and MCaP groups presented significantly lower PUFA proportions (P = 0.03). The proportions of PUFAs were affected by the interaction of treatment and time (P < 0.01), while there was a tendency toward a significant interaction effect of treatment and time on the proportion of MCFAs (P < 0.10). Increasing the calcium propionate dose quadratically affected the total trans fatty acid proportion (P < 0.10), with the greatest value observed for cows in the MCaP group.
4. Discussion
Most dairy cows reach their peak milk yield between 45 and 100 DIM [30], after which the milk yield gradually decreases. The higher milk yield in the groups supplemented with calcium propionate than in the CON group suggested that calcium propionate supplementation to dairy cows during early lactation had a positive impact on lactation performance. High lactation persistency, associated with health status in early lactation, is linked to a slow decrease in milk yield after peak production [31]. The peak lactation performance is significantly influenced by nutrition and management practices during early lactation. Calcium propionate can improve milk yield in dairy cows during early lactation [17]. Furthermore, milk yield during early lactation is positively correlated with extended lactation performance [32]. However, high milk production also increases the risk of elevated SCC [33]. Notably, milk lactose, which serves as the predominant osmoregulatory substance in milk, is negatively associated with SCC in milk [34]. The milk yield of the calcium propionate groups was greater than that of the other groups. The calcium propionate-supplemented groups presented greater milk yield. Consequently, the increase in both milk SCC and milk yield may contribute to the linear decrease in milk lactose content. Despite this reduction, the average milk lactose yield in the calcium propionate-supplemented groups remained numerically greater than that in the CON group.
The milk Ca concentration in the study was not affected by dietary calcium propionate feeding levels. The blood Ca concentration is strictly regulated by parathyroid hormone, calcitonin, and 1,25-dihydroxyvitamin D3, which control Ca absorption, excretion, and bone metabolism [35]. The lowest blood calcium levels occur approximately 12 to 24 hours after calving [36]. Blood calcium levels are subsequently maintained at a normal level through the mobilization of bone calcium. At the sampling time points (7, 21, and 35 DIM), the stable blood Ca concentration resulted in an unchanged milk Ca concentration. The supplementation of calcium in feed is beneficial for reducing the mobilization of bone calcium. Additionally, the dietary Ca concentration is inversely related to the milk P concentration [37]. It has been reported that diets with high levels of Ca can adversely affect Mg absorption in ruminants [38,39]. Therefore, in this study, the milk Mg and P concentrations during early lactation decreased linearly with increasing levels of calcium propionate.
K plays roles in regulating acid‒base balance, maintaining osmotic pressure, transducing signals, transmitting nerve impulses, and contracting muscle [40]. Toscano et al. [41] reported a negative correlation between the milk K concentration and the serum β-hydroxybutyrate (BHB) concentration. Dietary calcium propionate supplementation can decrease the blood BHB concentration [18], which may increase the milk K concentration. Increasing the dietary calcium concentration can increase K absorption [42] and the serum K concentration [43] in dairy cows. However, the milk K concentration decreased when calcium propionate was supplemented at 500 g/d. This increase was accompanied by a decrease in DMI in the HCaP group (21.20 kg/d) compared with the MCaP group (22.87 kg/d) in early lactation, as previously reported [17]. Zinc is important for immune function, cell division, and protein synthesis [44]. The improved metabolic status resulting from dietary supplementation with calcium propionate [19] might enhance Zn absorption in the intestines of dairy cows. However, diets high in Ca can reduce Zn absorption and balance [45]. Consequently, the milk Zn concentration tended to change quadratically with increasing calcium propionate feeding levels during early lactation, peaking in the LCaP group.
Because of the high energy requirement of milk production, dairy cows experience NEB during early lactation. The milk fatty acid profiles of dairy cows in early lactating cows are useful indicators for identifying NEB status [46]. When a cow is in NEB status, a greater percentage of preformed fatty acids from body fat reserves and a lower percentage of de novo fatty acids from the diet are used to produce milk fat. Propionate plays a crucial role in alleviating NEB in early-lactating dairy cows by promoting glucose synthesis. The levels of short- and medium-chain fatty acids, which are synthesized primarily de novo in the mammary glands of dairy cows, decrease during NEB in early lactation [46]. Although the sum of the SFAs did not differ among the four groups in this study, the proportions of C6:0, C8:0, and C12:0 linearly decreased with increasing levels of calcium propionate. Many studies have demonstrated that dietary supplementation with monensin, an ionophore antibiotic, can alter rumen bacterial population fermentation toward increasing the propionate proportion and decreasing the acetate:propionate ratio, consequently reducing the proportions of short-chain fatty acids in the milk of dairy cows [47,48]. Therefore, in this study, the reduced proportions of these fatty acids may be partly attributed to the increased propionate intake associated with increased levels of calcium propionate. Notably, C17:0 is synthesized de novo from ruminal propionate [49]. In a study by Zhang et al. [17], dairy cows supplemented with calcium propionate at 500 g/d presented decreased DMI. Consequently, increased supplementation with calcium propionate resulted in a quadratic response to the milk C17:0 proportion during early lactation in the current study. The results of Churakov et al. [46] showed that the C18:0 and C18:1 cis-9 concentrations in milk were the best variables for detecting the severity of NEB in cows. Pacheco-Pappenheim et al. [50] also reported that dairy cows with NEB status mobilized more C16:0, C18:0, and C18:1 cis-9 from body fat reserves, leading to increased proportions of these fatty acids in milk fat. The previous results of Zhang et al. [19] showed that increasing calcium propionate feeding levels quadratically changed milk yield, with the greatest value observed in the MCaP group. However, calcium propionate supplementation did not significantly alter the proportions of these fatty acids in milk in the present study, suggesting that the extra energy requirement for increased milk yield was derived from feed nutrition (22.87 kg/d in the MCaP group vs 21.71 kg/d in the CON group in early lactation) [17] rather than body fat reserves. Wang et al. [51] reported that inulin could reduce the proportion of C18:2 cis-9,12 (linoleic acid) in milk and increase the propionate concentration in the rumen. The decrease in C18:2 cis-9, 12 may be related to the increased supplementation of propionate, which improved the biohydrogenation of fatty acids by rumen microorganisms and quadratically changed the toxic effects of PUFAs, as suggested by Lock et al. [52]. Further research should investigate how calcium propionate affects the biohydrogenation of fatty acids in early-lactating dairy cows.
The energy status of dairy cows in early lactation affects the origin of fatty acids for the synthesis of milk fat in the mammary gland [50]. It has been reported that body fat mobilization due to NEB increases the proportion of LCFAs (i.e., C > 16) in milk [16]. However, in this study, calcium propionate did not affect the proportion of LCFAs. It was hypothesized that the increased energy requirement for increased milk yield in the LCaP and MCaP groups [19] was met through dietary intake; therefore, fat mobilization was not affected. PUFAs, which are exclusively obtained from dietary sources [53], were lower in the groups supplemented with calcium propionate than in the CON group. This may be associated with the increased milk production in these groups supplemented with calcium propionate [19].
5. Conclusions
Supplementing dairy cows with calcium propionate during early lactation tended to improve milk production during the peak of lactation, particularly at a dosage of 350 g/d. It also affects milk mineral composition and fatty acid profiles. The milk K concentration exhibited a quadratic response to increasing calcium propionate dose, whereas the Mg and P concentrations decreased. The C18:2 cis-9,12 proportion decreased significantly at 350 g/d. Overall, a dosage of 350 g/d calcium propionate was found to be optimal for early-lactation dairy cows.
Author Contributions
Conceptualization, F.Z. and B.X.; methodology, F.Z..; validation, F.Z., X.T. and B.X.; formal analysis, F.Z.; investigation, F.Z.; resources, F.Z.; data curation, F.Z.; writing—original draft preparation, F.Z.; writing—review and editing, F.Z.; visualization, F.Z.; supervision, B.X.; project administration, B.X.; funding acquisition, B.X. All authors have read and agreed to the published version of the manuscript.
Funding
This research was funded by National Key R&D Program of China (2023YFD2000701) and the Science and Technol-ogy Innovation Project of the Institute of Animal Sciences (2024-YWF-ZYSQ-08).
Institutional Review Board Statement
The animal study protocol was approved by Animal Ethics Committee of the Chinese Academy of Agricultural Sciences (approval No. IAS2020-93).
Informed Consent Statement
Not applicable.
Data Availability Statement
Data are available from the corresponding author upon request.
Acknowledgments
The authors express thanks to the staff of the Beijing Sunlon Livestock Development Co., Ltd. for their help in animal management.
Conflicts of Interest
The authors declare no conflicts of interest.
Abbreviations
The following abbreviations are used in this manuscript:
| ADF | acid detergent fiber |
| aNDF | neutral detergent fiber |
| Ca | calcium |
| CON | control treatment |
| CP | crude protein |
| DIM | days in milk |
| DM | dry matter |
| DMI | dry matter intake |
| ECM | energy-corrected milk |
| EE | ether extract |
| FCM | fat-corrected milk |
| HCaP | high calcium propionate treatment |
| LCaP | low calcium propionate treatment |
| LCFA | long-chain fatty acid |
| MCaP | medium calcium propionate treatment |
| MCFA | medium-chain fatty acid |
| MUFA | monounsaturated fatty acid |
| NEB | negative energy balance |
| NEFAs | non-esterified fatty acids |
| NEL | net energy of lactation |
| P | phosphorous |
| PUFA | polyunsaturated fatty acid |
| SCC | somatic cell count |
| SCFA | short-chain fatty acid |
| SFA | saturated fatty acid |
| TMR | total mixed ration |
| UFA | unsaturated fatty acid |
References
- Bertoni, G.; Trevisi, E.; Lombardelli, R. Some new aspects of nutrition, health conditions and fertility of intensively reared dairy cows. Ital. J. Anim. Sci. 2009, 8, 491–518. [Google Scholar] [CrossRef]
- Venjakob, P.L.; Staufenbiel, R.; Heuwieser, W.; Borchardt, S. Association between serum calcium dynamics around parturition and common postpartum diseases in dairy cows. J. Dairy Sci. 2021, 104, 2243–2253. [Google Scholar] [CrossRef] [PubMed]
- Reinhardt, T.A.; Lippolis, J.D.; McCluskey, B.J.; Goff, J.P.; Horst, R.L. Prevalence of subclinical hypocalcemia in dairy herds. The Veterinary Journal. 2011, 188, 122–124. [Google Scholar] [CrossRef]
- Goff, J.P. The monitoring, prevention, and treatment of milk fever and subclinical hypocalcemia in dairy cows. The Veterinary Journal. 2008, 176, 50–57. [Google Scholar] [CrossRef]
- McArt, J.A.A.; Nydam, D.V.; Oetzel, G.R. Epidemiology of subclinical ketosis in early lactation dairy cattle. J. Dairy Sci. 2012, 95, 5056–5066. [Google Scholar] [CrossRef]
- Soares, R.A.N.; Vargas, G.; Muniz, M.M.M.; Soares, M.A.M.; Canovas, A.; Schenkel, F.; Squires, E.J. Differential gene expression in dairy cows under negative energy balance and ketosis: A systematic review and meta-analysis. J. Dairy Sci. 2021, 104, 602–615. [Google Scholar] [CrossRef] [PubMed]
- Rico, J.E.; Barrientos-Blanco, M.A. INVITED REVIEW: Ketone biology: the shifting paradigm of ketones and ketosis in the dairy cow. J. Dairy Sci. 2024. [Google Scholar] [CrossRef] [PubMed]
- Hernandez, L.L.; McArt, J.A.A. Perspective: Transient postparturient hypocalcemia—A lactation-induced phenomenon of high-producing dairy cows. J. Dairy Sci. 2023, 106, 8177–8180. [Google Scholar] [CrossRef]
- Grossman, M.; Hartz, S.M.; Koops, W.J. Persistency of lactation yield: A novel approach. J. Dairy Sci. 1999, 82, 2192–2197. [Google Scholar] [CrossRef] [PubMed]
- Zamberlin, S.; Antunac, N.; Havranek, J.; Samarzija, D. Mineral elements in milk and dairy products. MLJEKARSTVO. 2012, 62, 111–125. [Google Scholar]
- Visentin, G.; Niero, G.; Berry, D.P.; Costa, A.; Cassandro, M.; De Marchi, M.; Penasa, M. Genetic (co)variances between milk mineral concentration and chemical composition in lactating Holstein-Friesian dairy cows. Animal. 2019, 13, 477–486. [Google Scholar] [CrossRef]
- Alfaro, E.; Neathery, M.W.; Miller, W.J.; Crowe, C.T.; Gentry, R.P.; Fielding, A.S.; Pugh, D.G.; Blackmon, D.M. Influence of a Wide Range of Calcium Intakes on Tissue Distribution of Macroelements and Microelements in Dairy Calves. J. Dairy Sci. 1988, 71, 1295–1300. [Google Scholar] [CrossRef]
- NRC: Nutrient requirements of dairy cattle; Washington, DC: National Academies Press, 2001.
- Pires, J.A.A.; Larsen, T.; Leroux, C. Milk metabolites and fatty acids as noninvasive biomarkers of metabolic status and energy balance in early-lactation cows. J. Dairy Sci. 2022, 105, 201–220. [Google Scholar] [CrossRef]
- Mann, S.; Nydam, D.V.; Lock, A.L.; Overton, T.R.; Mcart, J.A.A. Short communication: Association of milk fatty acids with early lactation hyperketonemia and elevated concentration of nonesterified fatty acids. J. Dairy Sci. 2016, 99, 5851–5857. [Google Scholar] [CrossRef] [PubMed]
- Duplessis, M.; Gervais, R.; Lapierre, H.; Girard, C.L. Combined biotin, folic acid, and vitamin B12 supplementation given during the transition period to dairy cows: Part II. Effects on energy balance and fatty acid composition of colostrum and milk. J. Dairy Sci. 2022, 105, 7097–7110. [Google Scholar] [CrossRef]
- Zhang, F.; Zhao, Y.G.; Wang, H.; Nan, X.M.; Wang, Y.; Guo, Y.M.; Xiong, B.H. Alterations in the milk metabolome of dairy cows supplemented with different levels of calcium propionate in early lactation. Metabolites. 2022, 12, 699. [Google Scholar] [CrossRef] [PubMed]
- Liu, Q.; Wang, C.; Yang, W.Z.; Guo, G.; Yang, X.M.; He, D.C.; Dong, K.H.; Huang, Y.X. Effects of calcium propionate supplementation on lactation performance, energy balance and blood metabolites in early lactation dairy cows. J. Anim. Physiol. Anim. Nutr. 2010, 94, 605–614. [Google Scholar] [CrossRef] [PubMed]
- Zhang, F.; Zhao, Y.; Wang, Y.; Wang, H.; Guo, Y.; Xiong, B. Effects of calcium propionate on milk performance and serum metabolome of dairy cows in early lactation. Anim. Feed Sci. Technol. 2022, 283, 115185. [Google Scholar] [CrossRef]
- Wang, Y.; Nan, X.M.; Zhao, Y.G.; Jiang, L.S.; Wang, H.; Zhang, F.; Hua, D.K.; Liu, J.; Yao, J.H.; Yang, L. :; et al. : Consumption of supplementary inulin modulates milk microbiota and metabolites in dairy cows with subclinical mastitis. Appl. Environ. Microbiol. 2022, 88, e02059–02021. [Google Scholar] [CrossRef]
- Wang, B.; Tu, Y.; Zhao, S.P.; Hao, Y.H.; Liu, J.X.; Liu, F.H.; Xiong, B.H.; Jiang, L.S. Effect of tea saponins on milk performance, milk fatty acids, and immune function in dairy cow. J. Dairy Sci. 2017, 100, 8043–8052. [Google Scholar] [CrossRef]
- AOAC: Official methods of analysis of AOAC international; Arlington, VA, USA: Association of Official Analytical Chemist, 2005.
- Van Soest, P.J.; Robertson, J.B.; Lewis, B.A. Methods for dietary fiber, neutral detergent fiber, and nonstarch polysaccharides in relation to animal nutrition. J. Dairy Sci. 1991, 74, 3583–3597. [Google Scholar] [CrossRef] [PubMed]
- Franzoi, M.; Niero, G.; Penasa, M.; Cassandro, M.; De Marchi, M. Technical note: Development and validation of a new method for the quantification of soluble and micellar calcium, magnesium, and potassium in milk. J. Dairy Sci. 2018, 101, 1883–1888. [Google Scholar] [CrossRef] [PubMed]
- Kandhro, F.; Kazi, T.G.; Afridi, H.I.; Baig, J.A. Compare the nutritional status of essential minerals in milk of different cattle and humans: Estimated daily intake for children. J. Food Compos. Anal. 2022, 105, 104214. [Google Scholar] [CrossRef]
- Visentin, G.; Penasa, M.; Gottardo, P.; Cassandro, M.; De Marchi, M. Predictive ability of mid-infrared spectroscopy for major mineral composition and coagulation traits of bovine milk by using the uninformative variable selection algorithm. J. Dairy Sci. 2016, 99, 8137–8145. [Google Scholar] [CrossRef]
- Sun, L.L.; Liu, L.; Brenna, J.T.; Wu, Z.H.; Ma, L.; Bu, D.P. Odd- and branched-chain fatty acids in milk fat from Holstein dairy cows are influenced by physiological factors. Animal. 2022, 16, 100545. [Google Scholar] [CrossRef]
- Turini, L.; Conte, G.; Bonelli, F.; Serra, A.; Sgorbini, M.; Mele, M. Multivariate factor analysis of milk fatty acid composition in relation to the somatic cell count of single udder quarters. J. Dairy Sci. 2020, 103, 7392–7406. [Google Scholar] [CrossRef]
- Grueber, C.E.; Nakagawa, S.; Laws, R.J.; Jamieson, I.G. Multimodel inference in ecology and evolution: challenges and solutions. Journal of Evolutionary Biology. 2011, 24, 699–711. [Google Scholar] [CrossRef]
- Peiter, M.; Phillips, H.N.; Endres, M.I. Association between early postpartum rumination time and peak milk yield in dairy cows. J. Dairy Sci. 2021, 104, 5898–5908. [Google Scholar] [CrossRef]
- Appuhamy, J.A.D.R.N.; Cassell, B.G.; Dechow, C.D.; Cole, J.B. Phenotypic Relationships of Common Health Disorders in Dairy Cows to Lactation Persistency Estimated from Daily Milk Weights. J. Dairy Sci. 2007, 90, 4424–4434. [Google Scholar] [CrossRef]
- Lehmann, J.O.; Mogensen, L.; Kristensen, T. Early lactation production, health, and welfare characteristics of cows selected for extended lactation. J. Dairy Sci. 2017, 100, 1487–1501. [Google Scholar] [CrossRef]
- Windig, J.J.; Calus, M.P.L.; de Jong, G.; Veerkamp, R.F. The association between somatic cell count patterns and milk production prior to mastitis. Livestock Production Science. 2005, 96, 291–299. [Google Scholar] [CrossRef]
- Hamon, A.; Dufour, S.; Kurban, D.; Lemosquet, S.; Gervais, R.; Guinard-Flament, J. Decreased lactose percentage in milk associated with quarter health disorder and hyperketolactia, a proxy for negative energy balance, in dairy cows. J. Dairy Sci. 2024. [Google Scholar] [CrossRef]
- McDowell, L.R. Minerals in animal and human nutrition, 2nd ed.; Elsevier: Amsterdam, 2003. [Google Scholar]
- Oetzel, G.R. Oral calcium supplementation in peripartum dairy cows. Vet. Clin. N. Am.-Food Anim. Pract. 2013, 29, 447–455. [Google Scholar] [CrossRef]
- Alvarez-Fuentes, G.; Appuhamy, J.A.D.R.N.; Kebreab, E. Prediction of phosphorus output in manure and milk by lactating dairy cows. J. Dairy Sci. 2016, 99, 771–782. [Google Scholar] [CrossRef]
- Care, A.D.; Brown, R.C.; Farrar, A.R.; Pickard, D.W. Magnesium absorption from the digestive tract of sheep. Quarterly Journal of Experimental Psychology. 1984, 69, 577–587. [Google Scholar] [CrossRef] [PubMed]
- Kronqvist, C.; Emanuelson, U.; Sporndly, R.; Holtenius, K. Effects of prepartum dietary calcium level on calcium and magnesium metabolism in periparturient dairy cows. J. Dairy Sci. 2011, 94, 1365–1373. [Google Scholar] [CrossRef]
- Schwerbel, K.; Tungerthal, M.; Nagl, B.; Niemann, B.; Drosser, C.; Bergelt, S.; Uhlig, K.; Hopfner, T.; Greiner, M.; Lindtner, O. :; et al. : Results of the BfR MEAL Study: The food type has a stronger impact on calcium, potassium and phosphorus levels than factors such as seasonality, regionality and type of production. Food Chemistry-X. 2022, 13, 100221. [Google Scholar] [CrossRef] [PubMed]
- Toscano, A.; Giannuzzi, D.; Pegolo, S.; Vanzin, A.; Bisutti, V.; Gallo, L.; Trevisi, E.; Cecchinato, A.; Schiavon, S. Associations between the detailed milk mineral profile, milk composition, and metabolic status in Holstein cows. J. Dairy Sci. 2023, 106, 6577–6591. [Google Scholar] [CrossRef] [PubMed]
- Jarrett, J.P.; Taylor, M.S.; Nennich, T.D.; Knowlton, K.F.; Harrison, J.; Block, E. Effect of dietary calcium and stage of lactation on potassium balance in lactating Holstein cows through 20 weeks of lactation. The Professional Animal Scientist. 2012, 28, 502–506. [Google Scholar] [CrossRef]
- Valldecabres, A.; Pires, J.A.A.; Silva-del-Río, N. Effect of prophylactic oral calcium supplementation on postpartum mineral status and markers of energy balance of multiparous Jersey cows. J. Dairy Sci. 2018, 101, 4460–4472. [Google Scholar] [CrossRef]
- Xu, N.N.; Yang, D.T.; Miao, C.; Valencak, T.G.; Liu, J.X.; Ren, D.X. Organic zinc supplementation in early-lactation dairy cows and its effects on zinc content and distribution in milk and cheese. JDS Communications. 2021, 2, 110–113. [Google Scholar] [CrossRef]
- Wood, R.J.; Zheng, J.J. High dietary calcium intakes reduce zinc absorption and balance in humans. The American Journal of Clinical Nutrition. 1997, 65, 1803–1809. [Google Scholar] [CrossRef] [PubMed]
- Churakov, M.; Karlsson, J.; Rasmussen, A.E.; Holtenius, K. Milk fatty acids as indicators of negative energy balance of dairy cows in early lactation. Animal. 2021, 15, 100253. [Google Scholar] [CrossRef] [PubMed]
- AlZahal, O.; Odongo, N.E.; Mutsvangwa, T.; Or-Rashid, M.M.; Duffield, T.F.; Bagg, R.; Dick, P.; Vessie, G.; McBride, B.W. Effects of monensin and dietary soybean oil on milk fat percentage and milk fatty acid profile in lactating dairy cows. J. Dairy Sci. 2008, 91, 1166–1174. [Google Scholar] [CrossRef] [PubMed]
- He, M.; Perfield, K.L.; Green, H.B.; Armentano, L.E. Effect of dietary fat blend enriched in oleic or linoleic acid and monensin supplementation on dairy cattle performance, milk fatty acid profiles, and milk fat depression. J. Dairy Sci. 2012, 95, 1447–1461. [Google Scholar] [CrossRef]
- French, E.A.; Bertics, S.J.; Armentano, L.E. Rumen and milk odd- and branched-chain fatty acid proportions are minimally influenced by ruminal volatile fatty acid infusions. J. Dairy Sci. 2012, 95, 2015–2026. [Google Scholar] [CrossRef]
- Pacheco-Pappenheim, S.; Yener, S.; Goselink, R.; Quintanilla-Carvajal, M.X.; van Valenberg, H.J.F.; Hettinga, K. Bovine milk fatty acid and triacylglycerol composition and structure differ between early and late lactation influencing milk fat solid fat content. Int Dairy J. 2022, 131, 105370. [Google Scholar] [CrossRef]
- Wang, Y.; Nan, X.M.; Zhao, Y.G.; Jiang, L.S.; Wang, H.; Hua, D.K.; Zhang, F.; Wang, Y.P.; Liu, J.; Yao, J.H. :; et al. : Dietary supplementation with inulin improves lactation performance and serum lipids by regulating the rumen microbiome and metabolome in dairy cows. Anim. Nutr. 2021, 7, 1189–1204. [Google Scholar] [CrossRef]
- Lock, A.L.; Bauman, D.E. Modifying milk fat composition of dairy cows to enhance fatty acids beneficial to human health. Lipids. 2004, 39, 1197–1206. [Google Scholar] [CrossRef]
- Panda, C.; Varadharaj, S.; Voruganti, V.S. PUFA, genotypes and risk for cardiovascular disease. Prostaglandins Leukotrienes and Essential Fatty Acids. 2022, 176, 102377. [Google Scholar] [CrossRef]
Figure 1.
Effects of dietary supplementation with different levels of calcium propionate on milk mineral compositions, including K and Fe, of dairy cows during early lactation (1-35 DIM). CON: without calcium propionate; LCaP, MCaP, and HCaP contained 200, 350, and 500 g/d calcium propionate per cow, respectively. a, b, c Means with no common superscript in the bar graph are significantly different (P < 0.05). The error bars represent the standard error. The P value at a time point indicates a significant difference among the groups at that time.
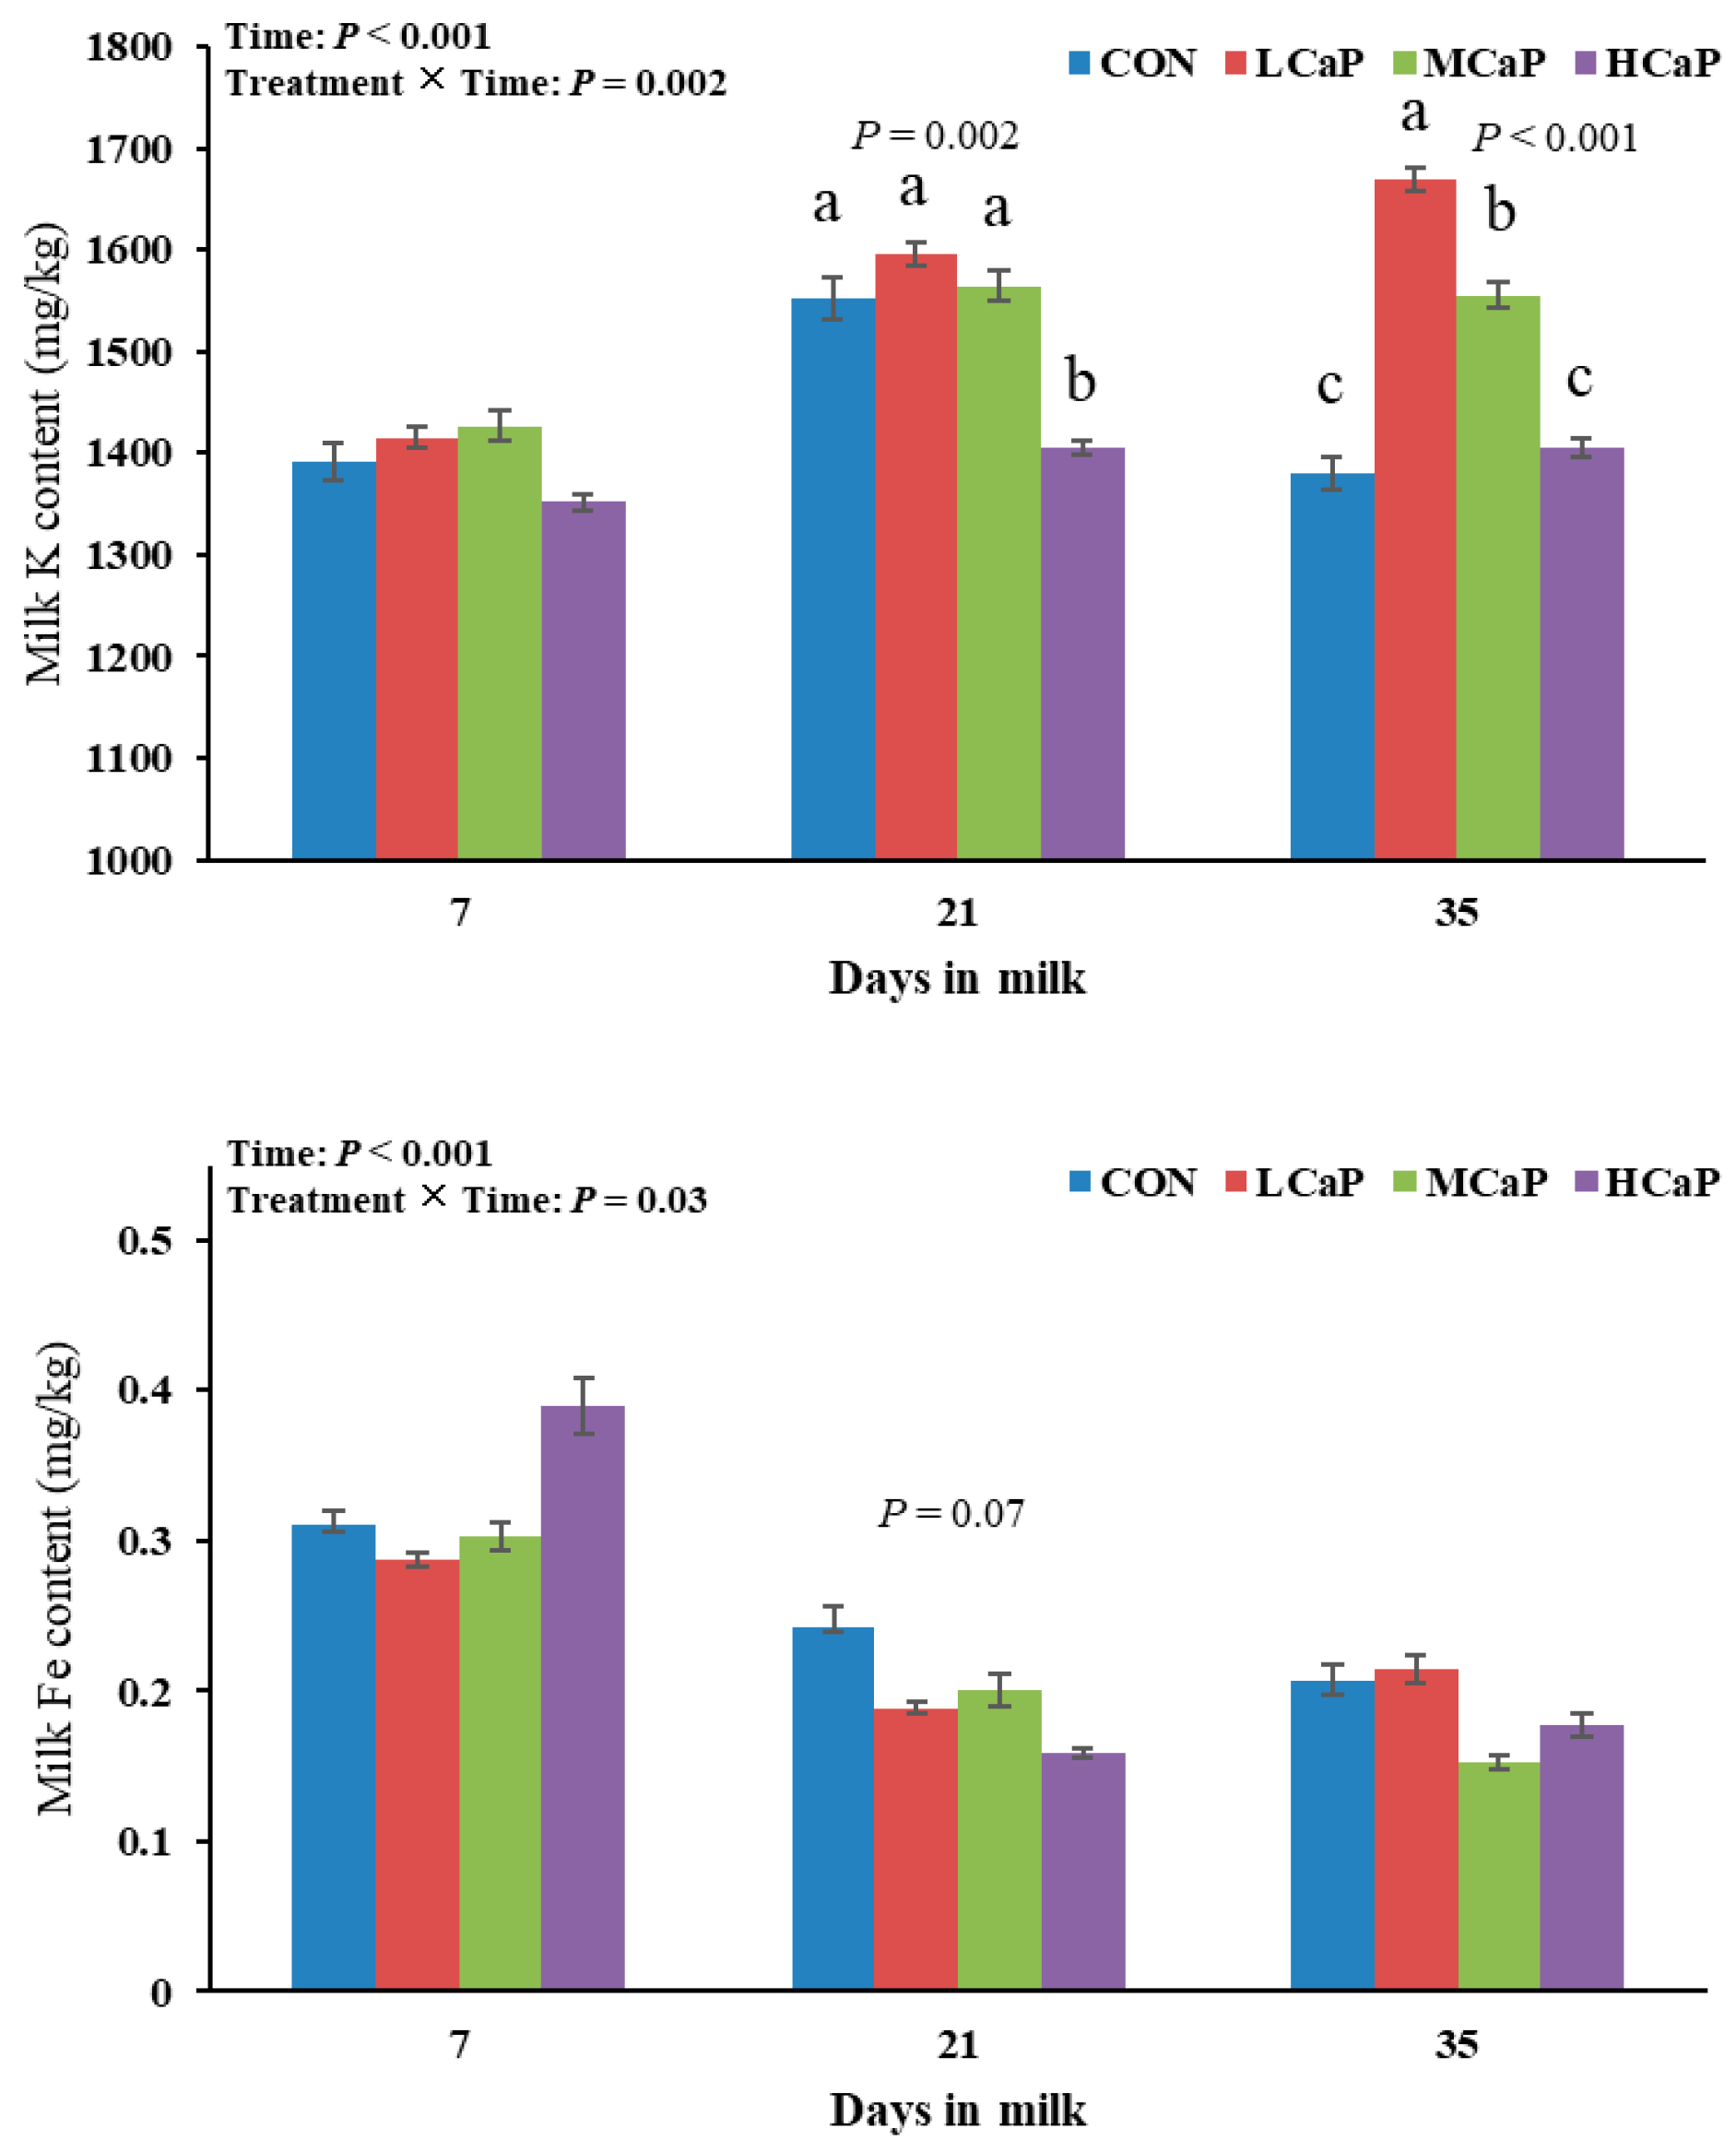
Figure 2.
Effects of dietary supplementation with different levels of calcium propionate on milk fatty acid (FA) profiles, including the Fe and K contents, of dairy cows during early lactation (1-35 DIM). CON: without calcium propionate; LCaP, MCaP, and HCaP had 200, 350, and 500 g/d calcium propionate per cow, respectively. a, b, c Means with no common superscript in the bar graph are significantly different (P < 0.05). The error bars represent the standard error. The P value at a time point indicates a significant difference among the groups at that time.
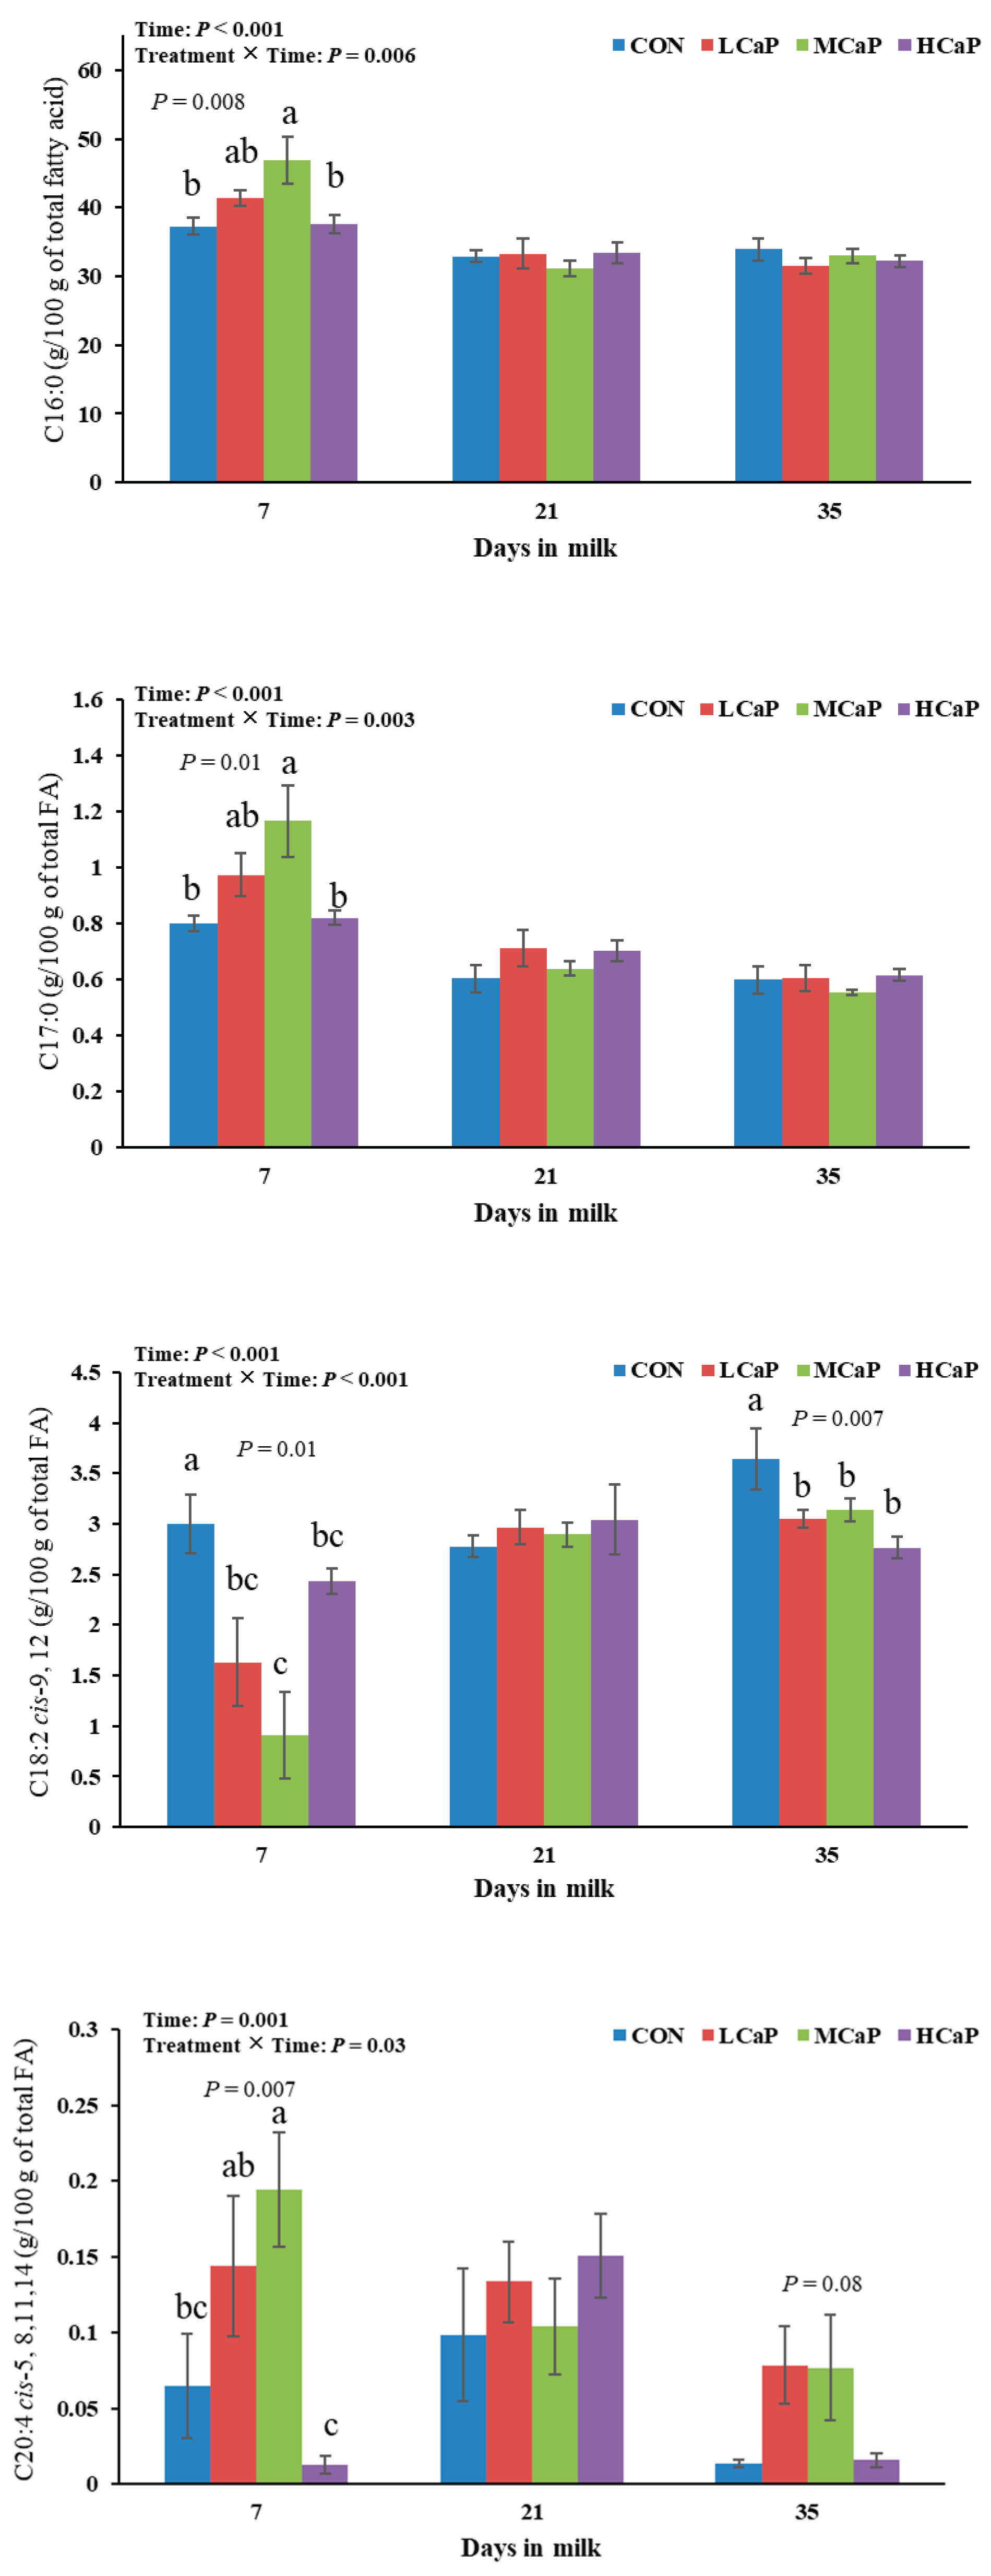

Table 1.
Initial characteristics of the dairy cows in each group.
| Items | Treatments 1 | |||
| CON | LCaP | MCaP | HCaP | |
| Body weight (kg) | 782 ± 22.6 | 790 ±26.9 | 777.8 ±31.2 | 768 ± 24.9 |
| Parity | 3.33 ± 0.56 | 3.17 ± 0.31 | 3.50 ±0.22 | 3.17 ± 0.31 |
| Previous 305-day milk yield (kg) | 12,710 ± 303 | 12,720 ± 672 | 12,522 ± 744 | 12,741 ± 832 |
1 CON, LCaP, MCaP, and HCaP had 0, 200, 350, and 500 g/d calcium propionate per cow, respectively.
Table 2.
Ingredients and chemical composition of the diets during early lactation and peak lactation.
Table 2.
Ingredients and chemical composition of the diets during early lactation and peak lactation.
| Items 1 | 1 - 35 DIM | >35 DIM |
| Ingredients, % of DM | ||
| Concentrate of the early of lactation 2 | 41.9 | — |
| Concentrate of the peak of lactation 3 | — | 37.0 |
| Full-fat extruded soybean | — | 0.35 |
| Distiller’s dried grain with soluble | — | 0.84 |
| Molasses | — | 1.95 |
| Alfalfa silage | — | 1.77 |
| Cotton seed | 2.28 | 3.58 |
| Steam-flaked corn | 3.58 | 8.27 |
| Sprouting corn bran | 2.19 | 1.98 |
| Fat powder 4 | 1.14 | 1.03 |
| Megalac | 0.50 | 0.78 |
| Wet brewers’ grains | 3.73 | 4.53 |
| Pelleted beet pulp | 1.31 | 1.03 |
| Alfalfa hay | 9.90 | 5.89 |
| Oat hay | 2.16 | 2.04 |
| Corn silage | 31.3 | 28.96 |
| Chemical composition, % of DM | ||
| Dry matter (DM), % of fresh weight | 50.0 | 50.5 |
| Crude protein (CP) | 17.7 | 16.4 |
| Net energy for lactation (NEL) 5, MJ/kg DM | 7.20 | 7.30 |
| Ether extract | 4.20 | 4.80 |
| Neutral detergent fiber (aNDF) | 28.0 | 29.7 |
| Acid detergent fiber (ADF) | 15.9 | 17.8 |
| Starch | 23.5 | 26.0 |
| Ash | 9.10 | 8.90 |
| Ca | 0.85 | 0.87 |
| P | 0.42 | 0.47 |
1 The diet for early lactation was fed to dairy cows from calving to d 35 postpartum; the diet for lactation was fed to dairy cows after d 36 postpartum. 2 The concentrate for early lactation was manufactured by Beijing Sanyuan Seed Technology Co., Ltd. (Beijing, China) with the chemical composition of DM, 88.50%; CP, 23.91%; aNDF, 13.20%; ADF, 7.40%; Ash, 13.1%; Ca, 1.41%; P, 0.58%; K, 1.20%; Mg, 0.58%; Na, 0.99%; Cu, 46.25 mg/kg; Fe, 80.30 mg/kg; Zn, 136.8 mg/kg; vitamin A, 20.53 kIU/kg; vitamin D, 3,548.5 IU/kg; and vitamin E, 116.9 IU/kg. 3 The concentrate for the peak of lactation was manufactured by Beijing Sanyuan Seed Technology Co., Ltd. (Beijing, China) with the chemical composition of DM, 88.30%; CP, 20.5%; aNDF, 14.40%; ADF, 7.90%; Ash, 12.7%; Ca, 1.37%; P, 0.67%; K, 1.32%; Mg, 0.58%; Na, 0.93%; Cu, 38.98 mg/kg; Fe, 171.3 mg/kg; Zn, 117.9 mg/kg; vitamin A, 16.60 kIU/kg; vitamin D, 2,766 IU/kg; and vitamin E, 150.7 IU/kg. 4 Fat power (C16:0 > 90%) is produced by Yihai Kerry Foodstuffs Industries (Tianjin) Co. Ltd. (Tianjin, China). 5 NEL was calculated according to NRC (2001).
Table 3.
Effects of dietary supplementation with different levels of calcium propionate during early lactation on the productive performance of dairy cows during the peak of lactation (36–125 DIM).
Table 3.
Effects of dietary supplementation with different levels of calcium propionate during early lactation on the productive performance of dairy cows during the peak of lactation (36–125 DIM).
| Items | Treatments1 | SEM2 | P value2 | |||||||
| CON | LCaP | MCaP | HCaP | Treatment | L | Q | Time | Treatment × Time | ||
| DMI, kg/d | 29.93 | 30.08 | 31.71 | 31.27 | 0.39 | 0.36 | 0.11 | 0.81 | 0.30 | 0.44 |
| Yield, kg/d | ||||||||||
| Milk | 49.36 | 50.62 | 53.67 | 52.76 | 0.82 | 0.27 | 0.09 | 0.62 | 0.03 | 0.97 |
| 4% FCM4 | 49.65 | 51.15 | 55.82 | 53.27 | 1.16 | 0.24 | 0.14 | 0.44 | 0.01 | 0.58 |
| ECM5 | 53.71 | 55.24 | 60.11 | 57.24 | 1.11 | 0.26 | 0.13 | 0.38 | 0.01 | 0.65 |
| Fat | 1.99 | 2.06 | 2.28 | 2.14 | 0.06 | 0.40 | 0.25 | 0.46 | 0.01 | 0.47 |
| Protein | 1.63 | 1.67 | 1.77 | 1.70 | 0.02 | 0.25 | 0.18 | 0.33 | 0.01 | 0.94 |
| Lactose | 2.62 | 2.64 | 2.79 | 2.75 | 0.04 | 0.48 | 0.20 | 0.78 | 0.004 | 0.48 |
| Milk composition, % | ||||||||||
| Fat | 4.03 | 4.09 | 4.27 | 4.00 | 0.10 | 0.74 | 0.91 | 0.41 | 0.14 | 0.49 |
| Protein | 3.33 | 3.32 | 3.31 | 3.23 | 0.03 | 0.70 | 0.33 | 0.57 | 0.56 | 0.93 |
| Lactose | 5.31 | 5.22 | 5.19 | 5.20 | 0.02 | 0.07 | 0.02 | 0.23 | < 0.001 | 0.92 |
| SCC6, × 1000 cell/mL | 147.8 | 268.8 | 199.9 | 192.0 | 39.30 | 0.78 | 0.76 | 0.43 | 0.86 | 0.64 |
1 CON, LCaP, MCaP, and HCaP had 0, 200, 350, and 500 g/d calcium propionate per cow, respectively. 2 SEM: Standard error of the mean. 3 L: Linear effects of calcium propionate supplementation; Q: Quadratic effects of calcium propionate supplementation. 4 4% FCM: 4% fat-corrected milk. 5 ECM: Energy-corrected milk. 6 SCC: Somatic cell count.
Table 4.
Effects of dietary supplementation with different levels of calcium propionate on the milk mineral composition of dairy cows during early lactation (1-35 DIM).
Table 4.
Effects of dietary supplementation with different levels of calcium propionate on the milk mineral composition of dairy cows during early lactation (1-35 DIM).
| Items, mg/kg | Treatments1 | SEM2 | P value3 | |||||||
| CON | LCaP | MCaP | HCaP | Treatment | L | Q | Time | Treatment × Time | ||
| Ca | 1,210 | 1,252 | 1,172 | 1,210 | 15.78 | 0.29 | 0.59 | 0.79 | <0.001 | 0.75 |
| P | 1,009a | 1,027a | 968.8ab | 917.2b | 13.30 | 0.002 | 0.002 | 0.06 | <0.001 | 0.18 |
| Mg | 114.7ab | 120.8a | 109.3b | 107.8b | 1.42 | 0.002 | 0.01 | 0.07 | 0.02 | 0.70 |
| K | 1,441b | 1,560a | 1,514a | 1,387b | 14.22 | <0.001 | 0.07 | <0.001 | <0.001 | 0.002 |
| Fe | 0.25 | 0.23 | 0.22 | 0.24 | 0.01 | 0.45 | 0.47 | 0.15 | <0.001 | 0.03 |
| Zn | 4.10b | 4.66a | 4.04b | 4.06b | 0.10 | 0.05 | 0.51 | 0.09 | <0.001 | 0.94 |
a, b, c Means in the same row with different superscripts are significantly different (P ≤ 0.05). 1 CON, LCaP, MCaP, and HCaP had 0, 200, 350, and 500 g/d calcium propionate per cow, respectively. 2 SEM: Standard error of the mean. 3 L: Linear effects of calcium propionate supplementation; Q: Quadratic effects of calcium propionate supplementation.
Table 5.
Effects of dietary supplementation with different levels of calcium propionate on the milk fatty acid proportions (% of total fatty acids) of dairy cows during early lactation (1-35 DIM).
Table 5.
Effects of dietary supplementation with different levels of calcium propionate on the milk fatty acid proportions (% of total fatty acids) of dairy cows during early lactation (1-35 DIM).
| Items | Treatments1 | SEM2 | P value3 | |||||||
| CON | LCaP | MCaP | HCaP | Treatment | L | Q | Time | Treatment × Time | ||
| C4:0 | 2.24 | 2.30 | 2.34 | 2.32 | 0.11 | 0.99 | 0.80 | 0.87 | 0.08 | 0.60 |
| C6:0 | 1.50 | 1.28 | 1.33 | 1.18 | 0.05 | 0.15 | 0.04 | 0.75 | 0.008 | 0.55 |
| C8:0 | 0.90 | 0.73 | 0.75 | 0.70 | 0.03 | 0.09 | 0.02 | 0.31 | 0.008 | 0.76 |
| C10:0 | 1.53 | 1.55 | 1.44 | 1.96 | 0.07 | 0.09 | 0.02 | 0.31 | 0.03 | 0.79 |
| C11:0 | 0.061 | 0.060 | 0.084 | 0.052 | 0.007 | 0.29 | 0.94 | 0.29 | 0.002 | 0.09 |
| C12:0 | 2.19 | 1.71 | 1.73 | 1.66 | 0.08 | 0.10 | 0.03 | 0.23 | 0.02 | 0.79 |
| C13:0 | 0.088 | 0.10 | 0.090 | 0.076 | 0.007 | 0.51 | 0.48 | 0.23 | 0.33 | 0.84 |
| C14:0 | 7.71 | 6.65 | 6.97 | 6.72 | 0.21 | 0.26 | 0.12 | 0.32 | 0.001 | 0.72 |
| C14:1 cis-9 | 0.72 | 0.68 | 0.70 | 0.73 | 0.03 | 0.87 | 0.87 | 0.44 | <0.001 | 0.65 |
| C15:0 | 0.66 | 0.61 | 0.62 | 0.64 | 0.03 | 0.91 | 0.76 | 0.50 | 0.002 | 0.81 |
| C15:1 cis-10 | 0.10 | 0.14 | 0.12 | 0.060 | 0.01 | 0.17 | 0.30 | 0.06 | <0.001 | 0.23 |
| C16:0 | 34.71 | 35.40 | 36.95 | 34.42 | 0.65 | 0.24 | 0.82 | 0.12 | <0.001 | 0.006 |
| C16:1 cis-9 | 2.02 | 2.40 | 2.40 | 2.23 | 0.09 | 0.37 | 0.35 | 0.11 | <0.001 | 0.17 |
| C17:0 | 0.67 | 0.76 | 0.79 | 0.71 | 0.02 | 0.07 | 0.22 | 0.01 | <0.001 | 0.003 |
| C17:1 cis-10 | 0.32 | 0.33 | 0.28 | 0.37 | 0.01 | 0.20 | 0.45 | 0.16 | 0.009 | 0.29 |
| C18:0 | 13.35 | 12.53 | 11.64 | 13.17 | 0.36 | 0.30 | 0.59 | 0.11 | <0.001 | 0.70 |
| C18:1 cis-9 | 25.72 | 27.77 | 26.71 | 28.52 | 0.89 | 0.72 | 0.37 | 0.94 | 0.41 | 0.43 |
| C18:1 trans-9 | 0.70 | 1.04 | 1.13 | 0.84 | 0.08 | 0.26 | 0.41 | 0.06 | 0.92 | 0.25 |
| C18:2 cis-9, 12 | 3.14a | 2.54b | 2.31b | 2.74ab | 0.10 | 0.003 | 0.02 | 0.002 | <0.001 | <0.001 |
| C18:2 trans-9, 12 | 0.027 | 0.032 | 0.033 | 0.039 | 0.003 | 0.47 | 0.14 | 0.80 | 0.005 | 0.46 |
| C18:3 cis-6, 9, 12 | 0.067 | 0.074 | 0.082 | 0.080 | 0.007 | 0.87 | 0.45 | 0.70 | 0.10 | 0.30 |
| C18:3 cis-9, 12, 15 | 0.079 | 0.087 | 0.11 | 0.14 | 0.01 | 0.27 | 0.08 | 0.51 | 0.37 | 0.39 |
| C20:0 | 0.16 | 0.14 | 0.20 | 0.17 | 0.01 | 0.19 | 0.45 | 0.99 | 0.27 | 0.30 |
| C20:1 cis-11 | 0.32 | 0.30 | 0.31 | 0.28 | 0.02 | 0.84 | 0.44 | 0.90 | 0.002 | 0.98 |
| C20:2 cis-11, 14 | 0.044 | 0.092 | 0.091 | 0.065 | 0.01 | 0.35 | 0.47 | 0.08 | 0.16 | 0.35 |
| C20:3 cis-8, 11, 14 | 0.091 | 0.095 | 0.090 | 0.071 | 0.006 | 0.17 | 0.09 | 0.20 | <0.001 | 0.73 |
| C20:3 cis-11, 14, 17 | 0.099 | 0.087 | 0.075 | 0.11 | 0.007 | 0.30 | 0.92 | 0.09 | 0.13 | 0.12 |
| C20:4 cis-5, 8, 11, 14 | 0.058b | 0.12a | 0.12a | 0.066b | 0.01 | 0.008 | 0.74 | <0.001 | 0.001 | 0.03 |
| C20:5 cis-5, 8, 11, 14, 17 | 0.010 | 0.016 | 0.014 | 0.015 | 0.002 | 0.72 | 0.34 | 0.55 | 0.81 | 0.59 |
| C21:0 | 0.039 | 0.067 | 0.038 | 0.042 | 0.009 | 0.64 | 0.86 | 0.46 | 0.46 | 0.98 |
| C22:0 | 0.087 | 0.095 | 0.99 | 0.12 | 0.01 | 0.39 | 0.14 | 0.48 | <0.001 | 0.40 |
| C22:1 cis-13 | 0.014 | 0.021 | 0.029 | 0.024 | 0.005 | 0.29 | 0.36 | 0.27 | 0.12 | 0.05 |
| C22:2 cis-13, 16 | 0.0085 | 0.022 | 0.016 | 0.018 | 0.003 | 0.45 | 0.31 | 0.29 | 0.61 | 0.61 |
| C22:6 cis-4, 7, 10, 13, 16, 19 | 0.045 | 0.050 | 0.050 | 0.047 | 0.009 | 0.99 | 0.91 | 0.82 | 0.14 | 0.48 |
| C23:0 | 0.022 | 0.020 | 0.056 | 0.028 | 0.008 | 0.45 | 0.51 | 0.57 | 0.49 | 0.61 |
| C24:0 | 0.078 | 0.13 | 0.11 | 0.096 | 0.02 | 0.85 | 0.76 | 0.40 | 0.18 | 0.63 |
| C24:1 cis-15 | 0.045 | 0.040 | 0.028 | 0.059 | 0.008 | 0.64 | 0.74 | 0.32 | 0.37 | 0.85 |
a, b, c Means in the same row with different superscripts are significantly different (P ≤ 0.05). 1 CON, LCaP, MCaP, and HCaP were mixed with 0, 200, 350, and 500 g/d calcium propionate per cow, respectively. 2 SEM: Standard error of the mean. 3 L: Linear effects of calcium propionate supplementation; Q: Quadratic effects of calcium propionate supplementation.
Table 6.
Effects of dietary supplementation with different levels of calcium propionate on the proportions (% of total fatty acids) of milk fatty acids according to the carbon chain length and degree of unsaturation of dairy cows during early lactation (1-35 DIM).
Table 6.
Effects of dietary supplementation with different levels of calcium propionate on the proportions (% of total fatty acids) of milk fatty acids according to the carbon chain length and degree of unsaturation of dairy cows during early lactation (1-35 DIM).
| Class of fatty acids1 | Treatments2 | SEM3 | P value4 | |||||||
| CON | LCaP | MCaP | HCaP | Treatment | L | Q | Time | Treatment × Time | ||
| SFA | 66.41 | 64.10 | 65.34 | 63.52 | 0.83 | 0.63 | 0.32 | 0.88 | 0.25 | 0.35 |
| MUFA | 29.97 | 32.71 | 31.70 | 33.11 | 0.83 | 0.60 | 0.26 | 0.70 | 0.54 | 0.47 |
| PUFA | 3.62a | 3.19b | 2.96b | 3.37ab | 3.62a | 0.03 | 0.11 | 0.01 | <0.001 | 0.003 |
| UFA | 33.59 | 35.90 | 34.66 | 36.48 | 0.83 | 0.63 | 0.32 | 0.88 | 0.25 | 0.35 |
| SCFA | 6.61 | 5.84 | 5.98 | 5.64 | 0.21 | 0.44 | 0.14 | 0.63 | 0.008 | 0.82 |
| MCFA | 48.27 | 47.75 | 49.66 | 46.57 | 0.82 | 0.49 | 0.65 | 0.41 | <0.001 | 0.06 |
| LCFA | 45.12 | 46.41 | 44.37 | 47.79 | 0.92 | 0.51 | 0.46 | 0.57 | 0.007 | 0.11 |
| Trans | 0.73 | 1.07 | 1.17 | 0.88 | 0.08 | 0.27 | 0.39 | 0.07 | 0.87 | 0.25 |
| SFA/UFA | 2.22 | 1.95 | 2.23 | 1.91 | 0.12 | 0.68 | 0.55 | 0.95 | 0.44 | 0.12 |
a, b, c Means in the same row with different superscripts are significantly different (P ≤ 0.05). 1 SFA: Saturated fatty acids; MUFA: Monounsaturated fatty acids; PUFA: Polyunsaturated fatty acids; UFA: Unsaturated fatty acids; SCFA: Short-chain fatty acids (acyl chain < 11 carbon atoms); MCFA: Medium-chain fatty acids (acyl chain > 10 carbon atoms and < 17 carbon atoms); LCFA: Long-chain fatty acids (acyl chain > 16 carbon atoms); Trans: Total trans fatty acids. 2 CON, LCaP, MCaP, and HCaP had 0, 200, 350, and 500 g/d calcium propionate per cow, respectively. 3 SEM: Standard error of the mean. 4 L: Linear effects of calcium propionate supplementation; Q: Quadratic effects of calcium propionate supplementation.
Disclaimer/Publisher’s Note: The statements, opinions and data contained in all publications are solely those of the individual author(s) and contributor(s) and not of MDPI and/or the editor(s). MDPI and/or the editor(s) disclaim responsibility for any injury to people or property resulting from any ideas, methods, instructions or products referred to in the content. |
© 2025 by the authors. Licensee MDPI, Basel, Switzerland. This article is an open access article distributed under the terms and conditions of the Creative Commons Attribution (CC BY) license (http://creativecommons.org/licenses/by/4.0/).
Copyright: This open access article is published under a Creative Commons CC BY 4.0 license, which permit the free download, distribution, and reuse, provided that the author and preprint are cited in any reuse.


