1. Introduction
Cassava (
Manihot esculenta Crantz) remains a cornerstone crop for food security and rural livelihoods across sub-Saharan Africa [
1]. Renowned for its resilience to erratic climate conditions, cassava contributes significantly to both subsistence farming and agro-industrial processing [
2]. Nigeria, the world’s leading producer of cassava, underscores the crop’s strategic importance in meeting national food demands and generating economic value [
3].
Despite its wide cultivation, cassava productivity is frequently constrained by genotype × environment (G×E) interactions. These interactions challenge breeders by complicating the identification of genotypes that perform consistently across diverse agro-ecological zones [
4,
5]. Genotypic variation in yield stability and adaptability can mask the true genetic potential of clones under fluctuating conditions, thus limiting the effectiveness of conventional selection approaches.
To mitigate these challenges, statistical methodologies that quantify stability and responsiveness have become integral to plant breeding programs. Among these, the Finlay-Wilkinson (FW) regression model offers a dual-parameter framework for evaluating genotypic performance. The intercept reflects a clone’s average yield performance across environments, while the slope quantifies its sensitivity to environmental changes. Genotypes with high intercepts and near-unit slopes are typically considered ideal-combining productivity with predictable adaptability.
This study employs FW regression and trait-based cluster analysis to assess the performance of 42 cassava genotypes evaluated across multiple seasons. By profiling yield potential and environmental responsiveness, the research aims to identify broadly adapted and stable clones suitable for strategic deployment in breeding pipelines. The results are expected to inform data-driven genotype selection and support precision breeding for cassava improvement in Nigeria and similar production systems.
2. Materials and Methods
2.1. Study Location and Plant Materials
The field evaluation was conducted over two consecutive cropping seasons (2019/2020 and 2020/2021) at the International Institute of Tropical Agriculture (IITA), Ibadan, Nigeria (Latitude 7.488249°N, Longitude 3.904875°E; altitude: 207 m). The site is representative of the humid tropics and has historically been used for cassava breeding trials. A total of 42 cassava genotypes rich in provitamin A were selected, including three white-fleshed checks (TMEB419, TME693, and IBA980581) and one yellow-fleshed check (IBA070593). All planting materials were sourced from the Cassava Breeding Unit at IITA.
2.2. Experimental Design and Field Layout
The trial was structured using a split-plot design with two replications. Genotype served as the main plot factor, while harvest time-measured in Months After Planting (MAP): 6, 9, and 12 MAP-was designated as the subplot factor. Within each replication, genotypes were randomly distributed across the three harvest times. Individual plots measured 4 m × 2 m (8 m2) and were subdivided into three equal subplots of 2.67 m2, each accommodating four plants arranged in two rows. Plant spacing was maintained at 1 m × 0.8 m, resulting in a total experimental area of 336 m2 per replicate and 672 m2 across both replications.
2.3. Trait Measurement
Phenotypic data were collected at each harvest interval, targeting both agronomic and physiological traits. The measured traits included: sprouting rate, plant vigor, incidence of cassava mosaic disease (CMD), plant height, number of harvested plants, root number (RTNO), root weight (RTWT), root size (RTSZ), fresh root yield (FYLD), harvest index (HI), total carotenoids (TC), dry matter content (DM), and shoot weight (SHTWT). Among these, FYLD (t/ha) was prioritized as the principal trait for stability and performance assessment across environments.
2.4. Statistical Analysis and Model Specification
Mixed models using REML and BLUP accounted for genotype, season, and harvest-time interactions [
6]. FW regression regressed FYLD against environment index to compute slope and intercept. Clustering techniques including K-means [
7] and Ward’s method [
8] were employed, with dendrograms used for hierarchical visualization [
9]. Cluster validity was assessed using ANOVA, following the approach outlined by Hair et al. [
10]. The REML/BLUP is particularly suited for multi-season cassava evaluations with hierarchical and unbalanced data structures [
11]. Data analysis was performed in R [
12] using the lme4 package [
6] to fit linear mixed-effects models.
The trial followed a split-plot design, and the final model specified genotype (Accession_name), harvest time (Months After Planting, MAP), year (season), and their two-way and three-way interactions as fixed effects. Random effects were assigned to replication (nested within year) and subplot-level errors to account for within-replicate variation. A singular fit warning arose during model optimization, attributed to a non-estimable random interaction term (Accession_name × REP × Year); this term was removed to ensure valid model convergence.
The full model was expressed as:
Where:
μ: Overall mean.
Fixed Effects:
Ai: Genotype (main plot factor, fixed effect).
Mj: Harvest Time (subplot factor, fixed effect).
Yk: Year/Seasons (fixed effect).
R{n(k)} = Random effect of replication nested within year
ϵijkn=Residual error
Interactions:
A×M: Genotype × Harvest Time (to assess stability across harvests).
A×Y: Genotype × Year (to assess genotype performance across years).
M×Y: Harvest Time × Year (to assess harvest time effects across years).
2.5. Genotype Stability Analysis via Finlay–Wilkinson Regression
Following mixed-model evaluation, Finlay-Wilkinson regression was applied to quantify genotype × environment interaction by regressing FYLD against the environmental index, defined as combinations of harvest time and year [
13]. The regression parameters-intercept (mean yield) and slope (responsiveness to environmental quality)-were estimated using ordinary least squares (OLS). These parameters served as the basis for classifying genotypes into distinct performance categories. Visualization, clustering, and trait interpretation were executed using the ggplot2 and dplyr packages in R [
14,
15].
3. Results
3.1. High-Yielding Cassava Genotypes and Their Environmental Responsiveness
From the
Table 1, the Finlay-Wilkinson regression identified five genotypes with the highest intercept values, indicating superior mean yield potential across test environments. IITA-TMS-IBA180037 exhibited the highest intercept (5.25) coupled with a steep slope (2.75), suggesting exceptional yield potential but high responsiveness to favorable environments, which may imply greater variability under stress.
IITA-TMS-IBA180294 combined a high intercept (3.44) with a very low slope (0.588), indicating consistent high yield performance and low sensitivity to environmental variation - a desirable trait for stability. IITA-TMS-IBA180070 (Intercept: 2.29; Slope: 2.23) showed good yield with moderate responsiveness, suggesting adaptability but with some yield fluctuation. IITA-TMS-IBA180256 (Intercept: 1.52; Slope: 2.84) demonstrated modest intercept values but high environmental responsiveness, making it a candidate for performance maximization under optimal conditions. IITA-TMS-IBA180259 (Intercept: 1.51; Slope: 1.27) represented a balanced genotype with steady performance and moderate adaptability.
Overall, these accessions represent promising candidates for multi-environment trials, with IITA-TMS-IBA180294 showing particular potential for breeding programs targeting yield stability, while IITA-TMS-IBA180037 may be ideal for maximizing yield under favorable growth conditions.
3.2. Cassava Genotypes Exhibiting Extreme Yield Sensitivity to Environmental Conditions
Five cassava genotypes exhibited marked environmental sensitivity, with Finlay–Wilkinson regression slopes exceeding 5.0. Such steep slopes indicate a strong genotype × environment (G×E) interaction, where performance is highly contingent on favorable growing conditions as revealed in the
Table 2
IITA-TMS-IBA180081 recorded a slope of 8.42, the second-highest among this group, reflecting exceptionally high responsiveness but potentially erratic yields under suboptimal environments. IITA-TMS-IBA180073 (Slope = 7.61) demonstrated strong positive response potential, though its instability across conditions could hinder consistent performance. IITA-TMS-IBA180017 (Slope = 7.37) revealed very high sensitivity, suggesting limited yield reliability in stress-prone regions.
IITA-TMS-IBA180182 (Slope = 6.93) is indicative of pronounced G×E interaction, possibly requiring targeted environmental matching to harness its yield potential. IITA-TMS-IBA180146 showed the highest slope in this set (9.04), showing very strong responses to the environment -performing well in the best conditions but vulnerable in poor ones.
3.3. Stable and Predictable Cassava Genotypes with Near-Unit Environmental Response Slopes
In the
Table 3, it was revealed that four cassava genotypes exhibited slopes close to the ideal value of 1.0 in the Finlay-Wilkinson regression, indicating performance that closely tracks the environmental index without extreme fluctuations. Such near-unit slopes suggest predictable yield responses and suitability for environments with moderate variability.
IITA-TMS-IBA180018 (Intercept: 0.470; Slope: 1.54) maintained stability with only slight responsiveness, making it a steady performer in most settings. IITA-TMS-IBA180051 (Intercept: 1.81; Slope: 1.74) showed consistent performance with modest yield potential and moderate adaptability.
IITA-TMS-IBA180098 (Intercept: 4.02; Slope: 1.17) paired high yield potential with slight sensitivity to environmental changes, striking a favorable balance between productivity and stability. IITA-TMS-IBA180259 (Intercept: 1.51; Slope: 1.27) demonstrated balanced performance, maintaining dependable yields across varied conditions.
3.4. Cluster-Defined Performance Profiles from Finlay–Wilkinson Regression Traits
Hierarchical clustering (Ward’s method) on Finlay-Wilkinson intercepts and slopes grouped genotypes into three distinct performance profiles as revealed in the
Table 4. Centroid-based means summarize each cluster’s baseline yield (intercept) and environmental sensitivity (slope), clarifying agronomic use-cases across variable conditions.
Cluster 1 combined very low mean intercept (-7.23) with a very high mean slope (6.87), indicating extremely sensitive, low-yield behavior. Representative genotypes IITA-TMS-IBA180146 and IITA-TMS-IBA180081 align with an unstable profile and strong G×E interaction, suggesting high risk in marginal environments and suitability only for highly favorable, well-managed sites.
Cluster 2 showed a positive mean intercept (1.64) and moderate mean slope (2.20), reflecting moderate responsiveness with generally favorable yield. Representative genotypes IITA-TMS-IBA180073, IITA-TMS-IBA180256, and IBA180244 fit a balanced, adaptable profile, making them strong candidates for broader recommendation where environments vary but are not extremely stressful.
Cluster 3 had a negative mean intercept (-2.35) and a high mean slope (4.08), pointing to high sensitivity combined with low baseline yield. Representative genotypes IITA-TMS-IBA180037 and IITA-TMS-IBA180049 are prone to inconsistent performance under stress; targeted testing in high-potential sites may be necessary to justify advancement.
As shown in the
Table 5, Analysis of variance (ANOVA) revealed highly significant differences among clusters for both regression traits-slope and intercept-confirming that the clustering captured meaningful variation in genotype performance.
The slope which determines or measure the sensitivity shows that the effect of cluster membership on slope was highly significant (F = 40.89, P <0.001), with clusters differing strongly in their responsiveness to environmental variation. This validates the trait-based grouping, especially the distinction between highly sensitive (Cluster 1 and 3) and moderately responsive genotypes (Cluster 2).
The intercept which determines the baseline yields shows that cluster differences in intercept were even more pronounced (F = 102.10, P<0.001) indicating substantial variation in average yield potential across clusters. This supports the agronomic interpretation that Cluster 2 genotypes offer superior baseline performance, while Clusters 1 and 3 are comparatively low-yielding.
The extremely low P-values (P < 0.001) for both traits confirm that the observed differences are statistically robust and unlikely due to chance. These results reinforce the validity of the cluster profiles derived from regression traits and justify their use in genotype selection and recommendation strategies.
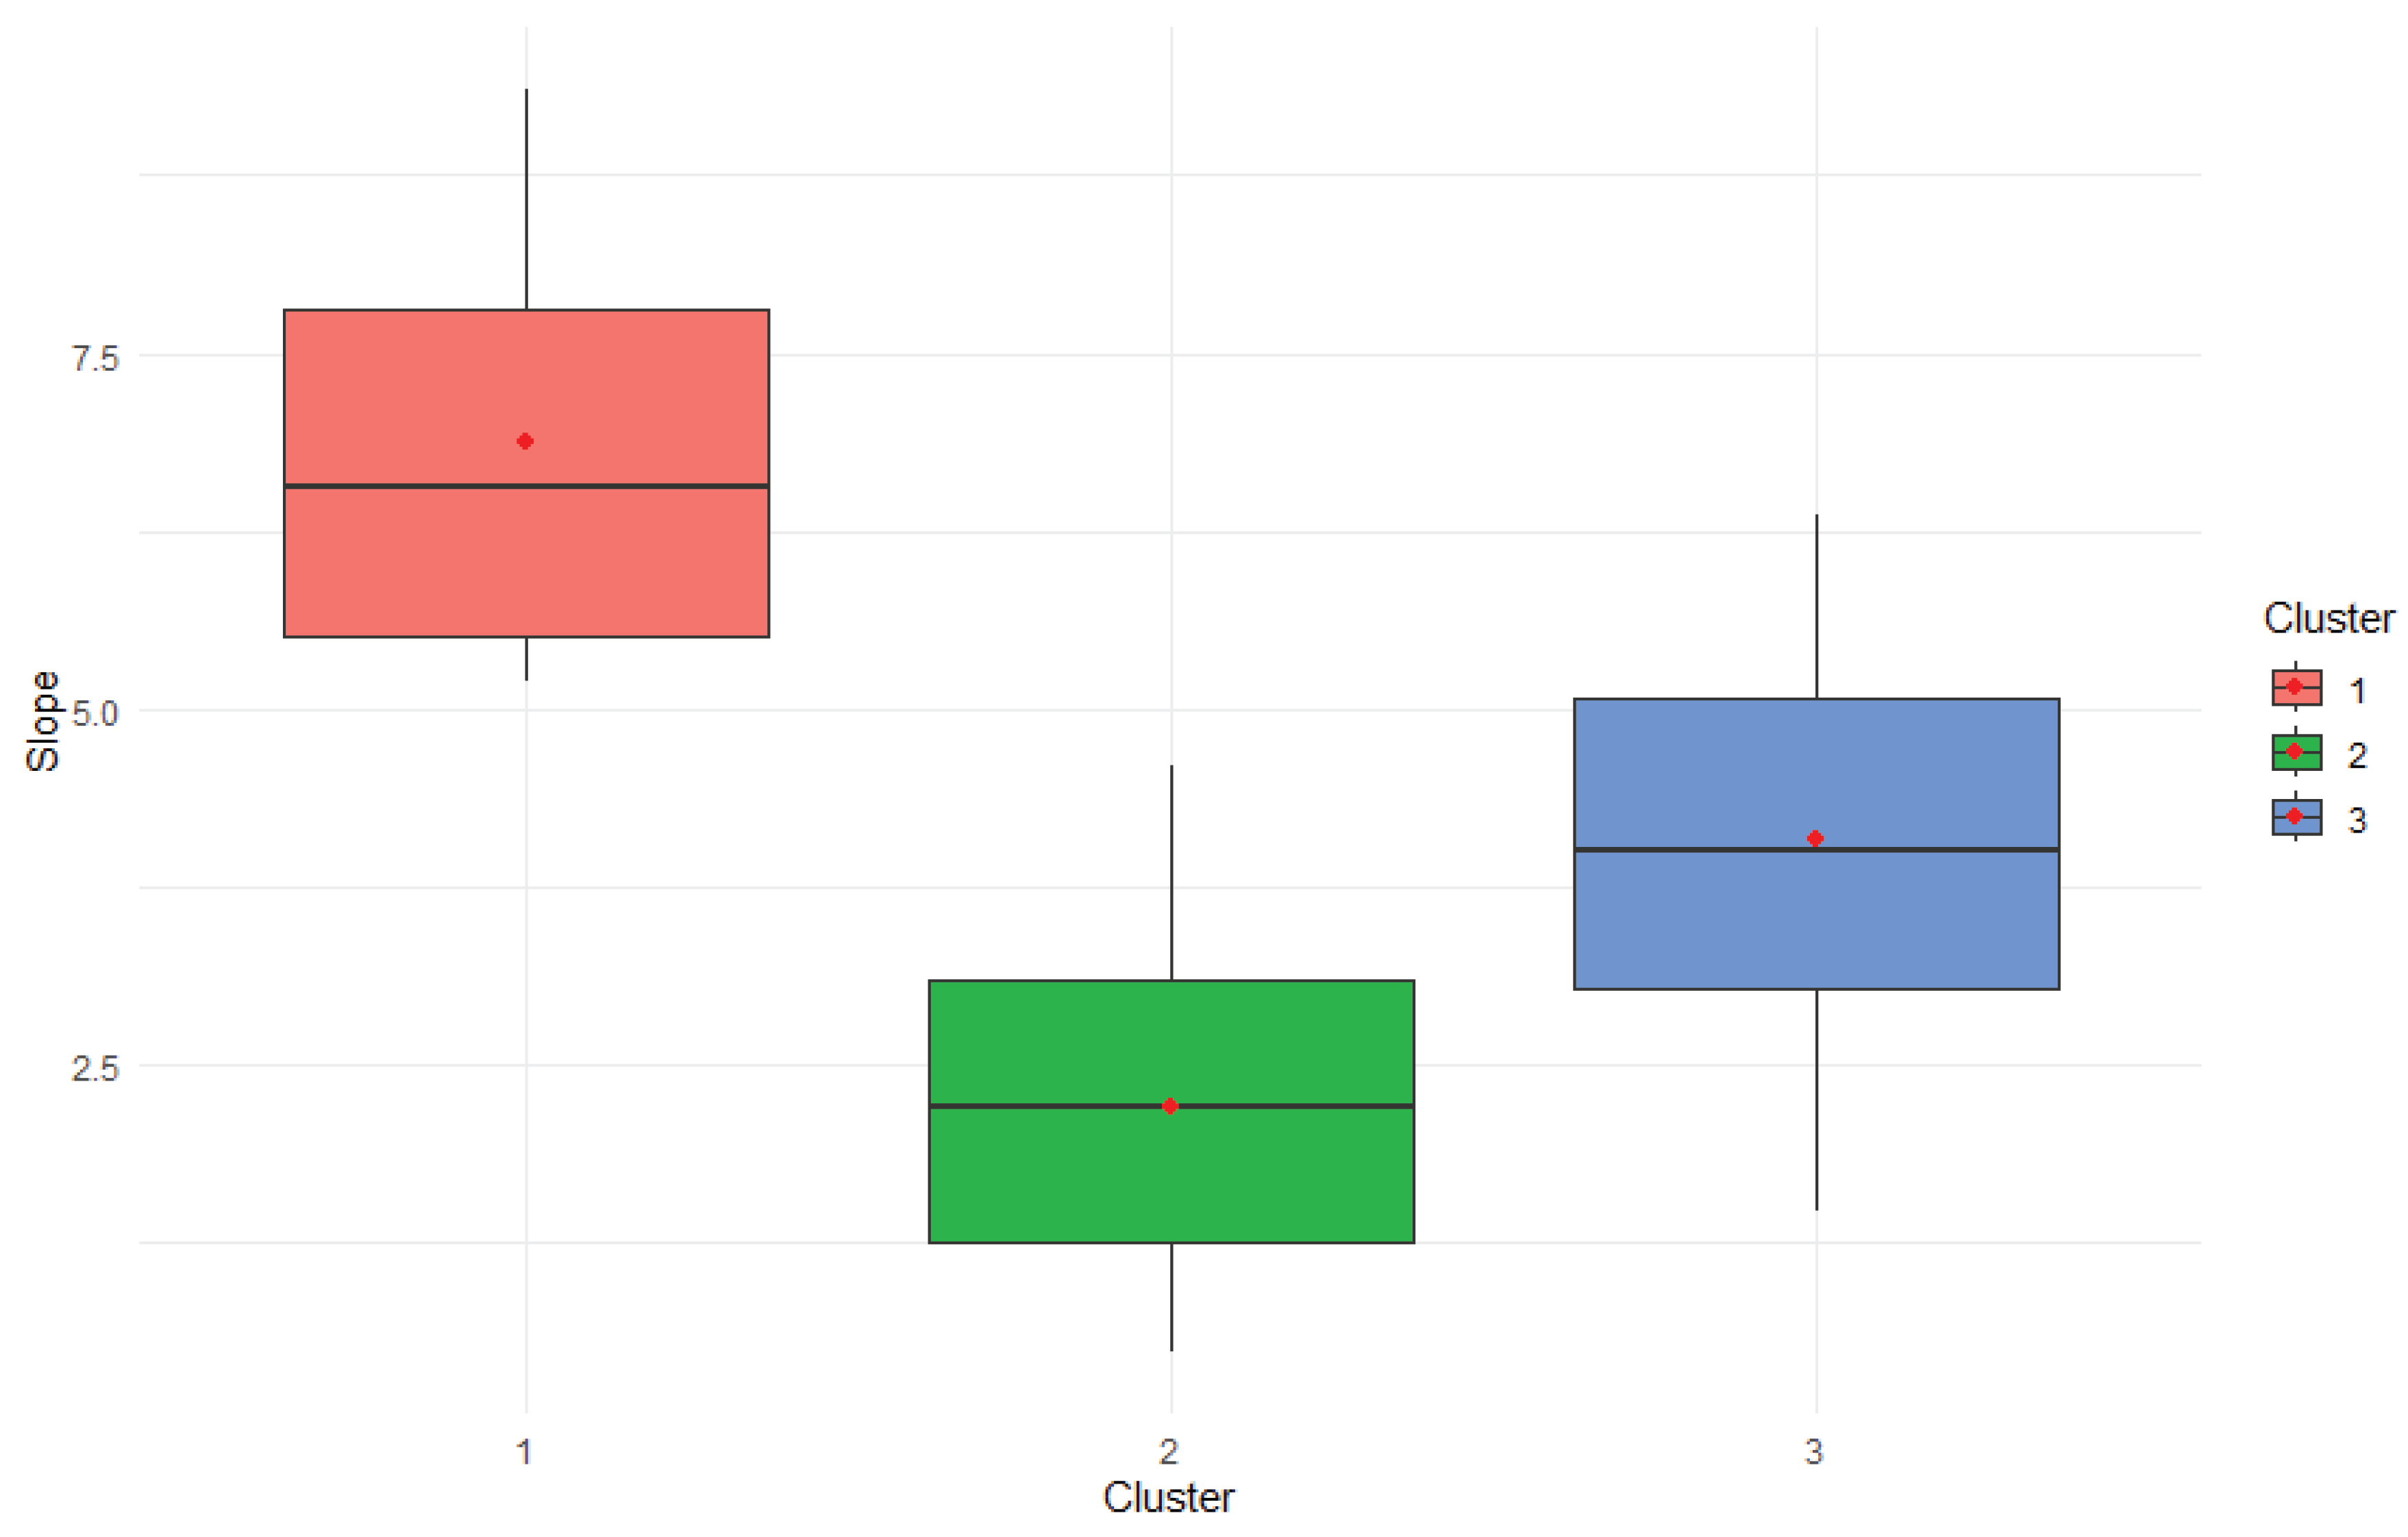
3.5. Visual Summary of Environmental Sensitivity Across Clusters
The boxplot as revealed in the
Figure 1 illustrates the distribution of environmental sensitivity (slope values) among the three genotype clusters derived from k-means analysis. Each cluster is color-coded (Cluster 1: red, Cluster 2: green, Cluster 3: blue), with the boxes representing the interquartile range (IQR) and horizontal lines indicating the median slope within each group. Red dots mark the mean slope values for visual emphasis.
Cluster 1 exhibited the highest slope values overall, indicating extreme responsiveness to environmental variation and suggesting a high genotype × environment interaction. Cluster 2 showed moderate slopes, reflecting balanced adaptability across environments. Cluster 3 had intermediate to high slopes, but with greater variability, implying less predictable performance.
The clear separation in slope distributions supports the statistical findings from the ANOVA (
Table 5), confirming that clusters differ significantly in their environmental sensitivity profiles.
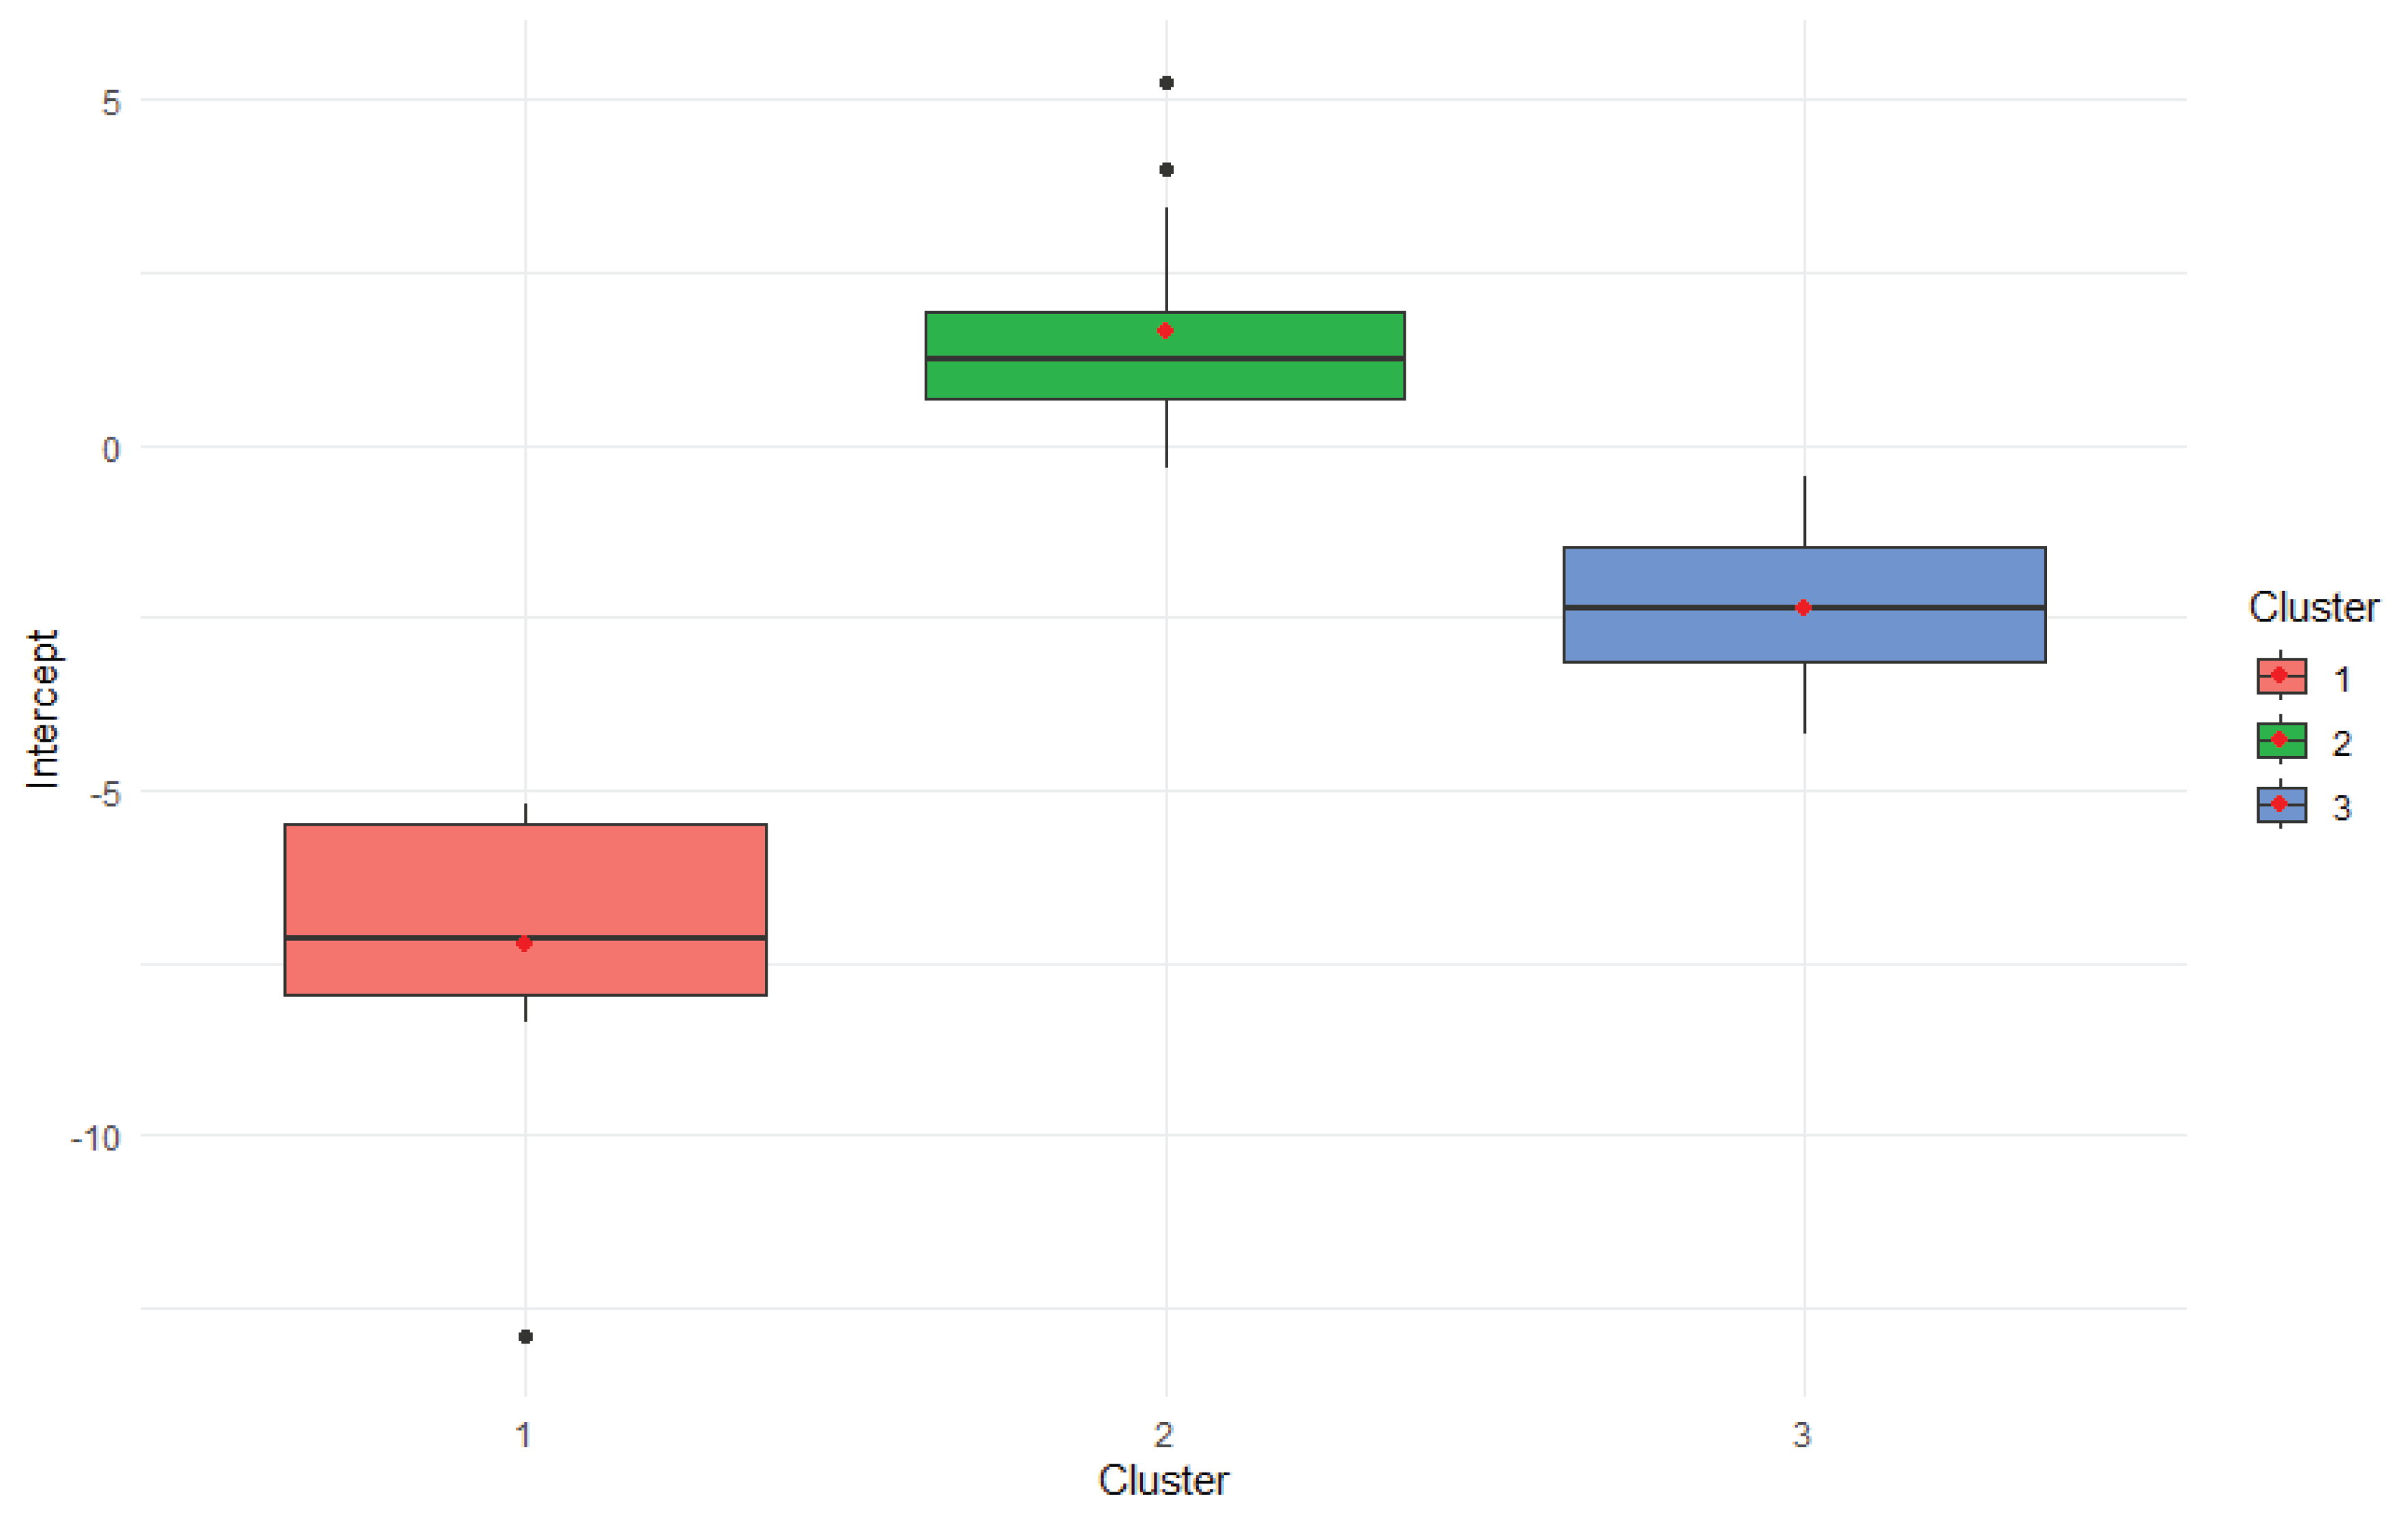
3.6. Baseline Performance Variation Across Clusters
The boxplot in
Figure 2 displays the distribution of intercept values-representing baseline performance in the absence of environmental influence-across the three genotype clusters. As with the slope plot, clusters are color-coded (Cluster 1: red, Cluster 2: green, Cluster 3: blue). Each box shows the interquartile range (IQR), with the median indicated by a horizontal line and red dots marking the mean intercept values.
Cluster 2 demonstrated the highest intercept values, suggesting strong inherent performance regardless of environmental conditions. Cluster 1 had lower intercepts, indicating that its genotypes may rely more heavily on favorable environments to achieve optimal performance. Cluster 3 showed moderate intercepts with wider variability, reflecting heterogeneous baseline potential within the group.
This pattern complements the slope analysis, revealing a trade-off between baseline performance and environmental responsiveness. Together, these plots highlight distinct genotype strategies: Cluster 2 favors stability, Cluster 1 thrives under environmental shifts, and Cluster 3 occupies a middle ground with mixed traits.
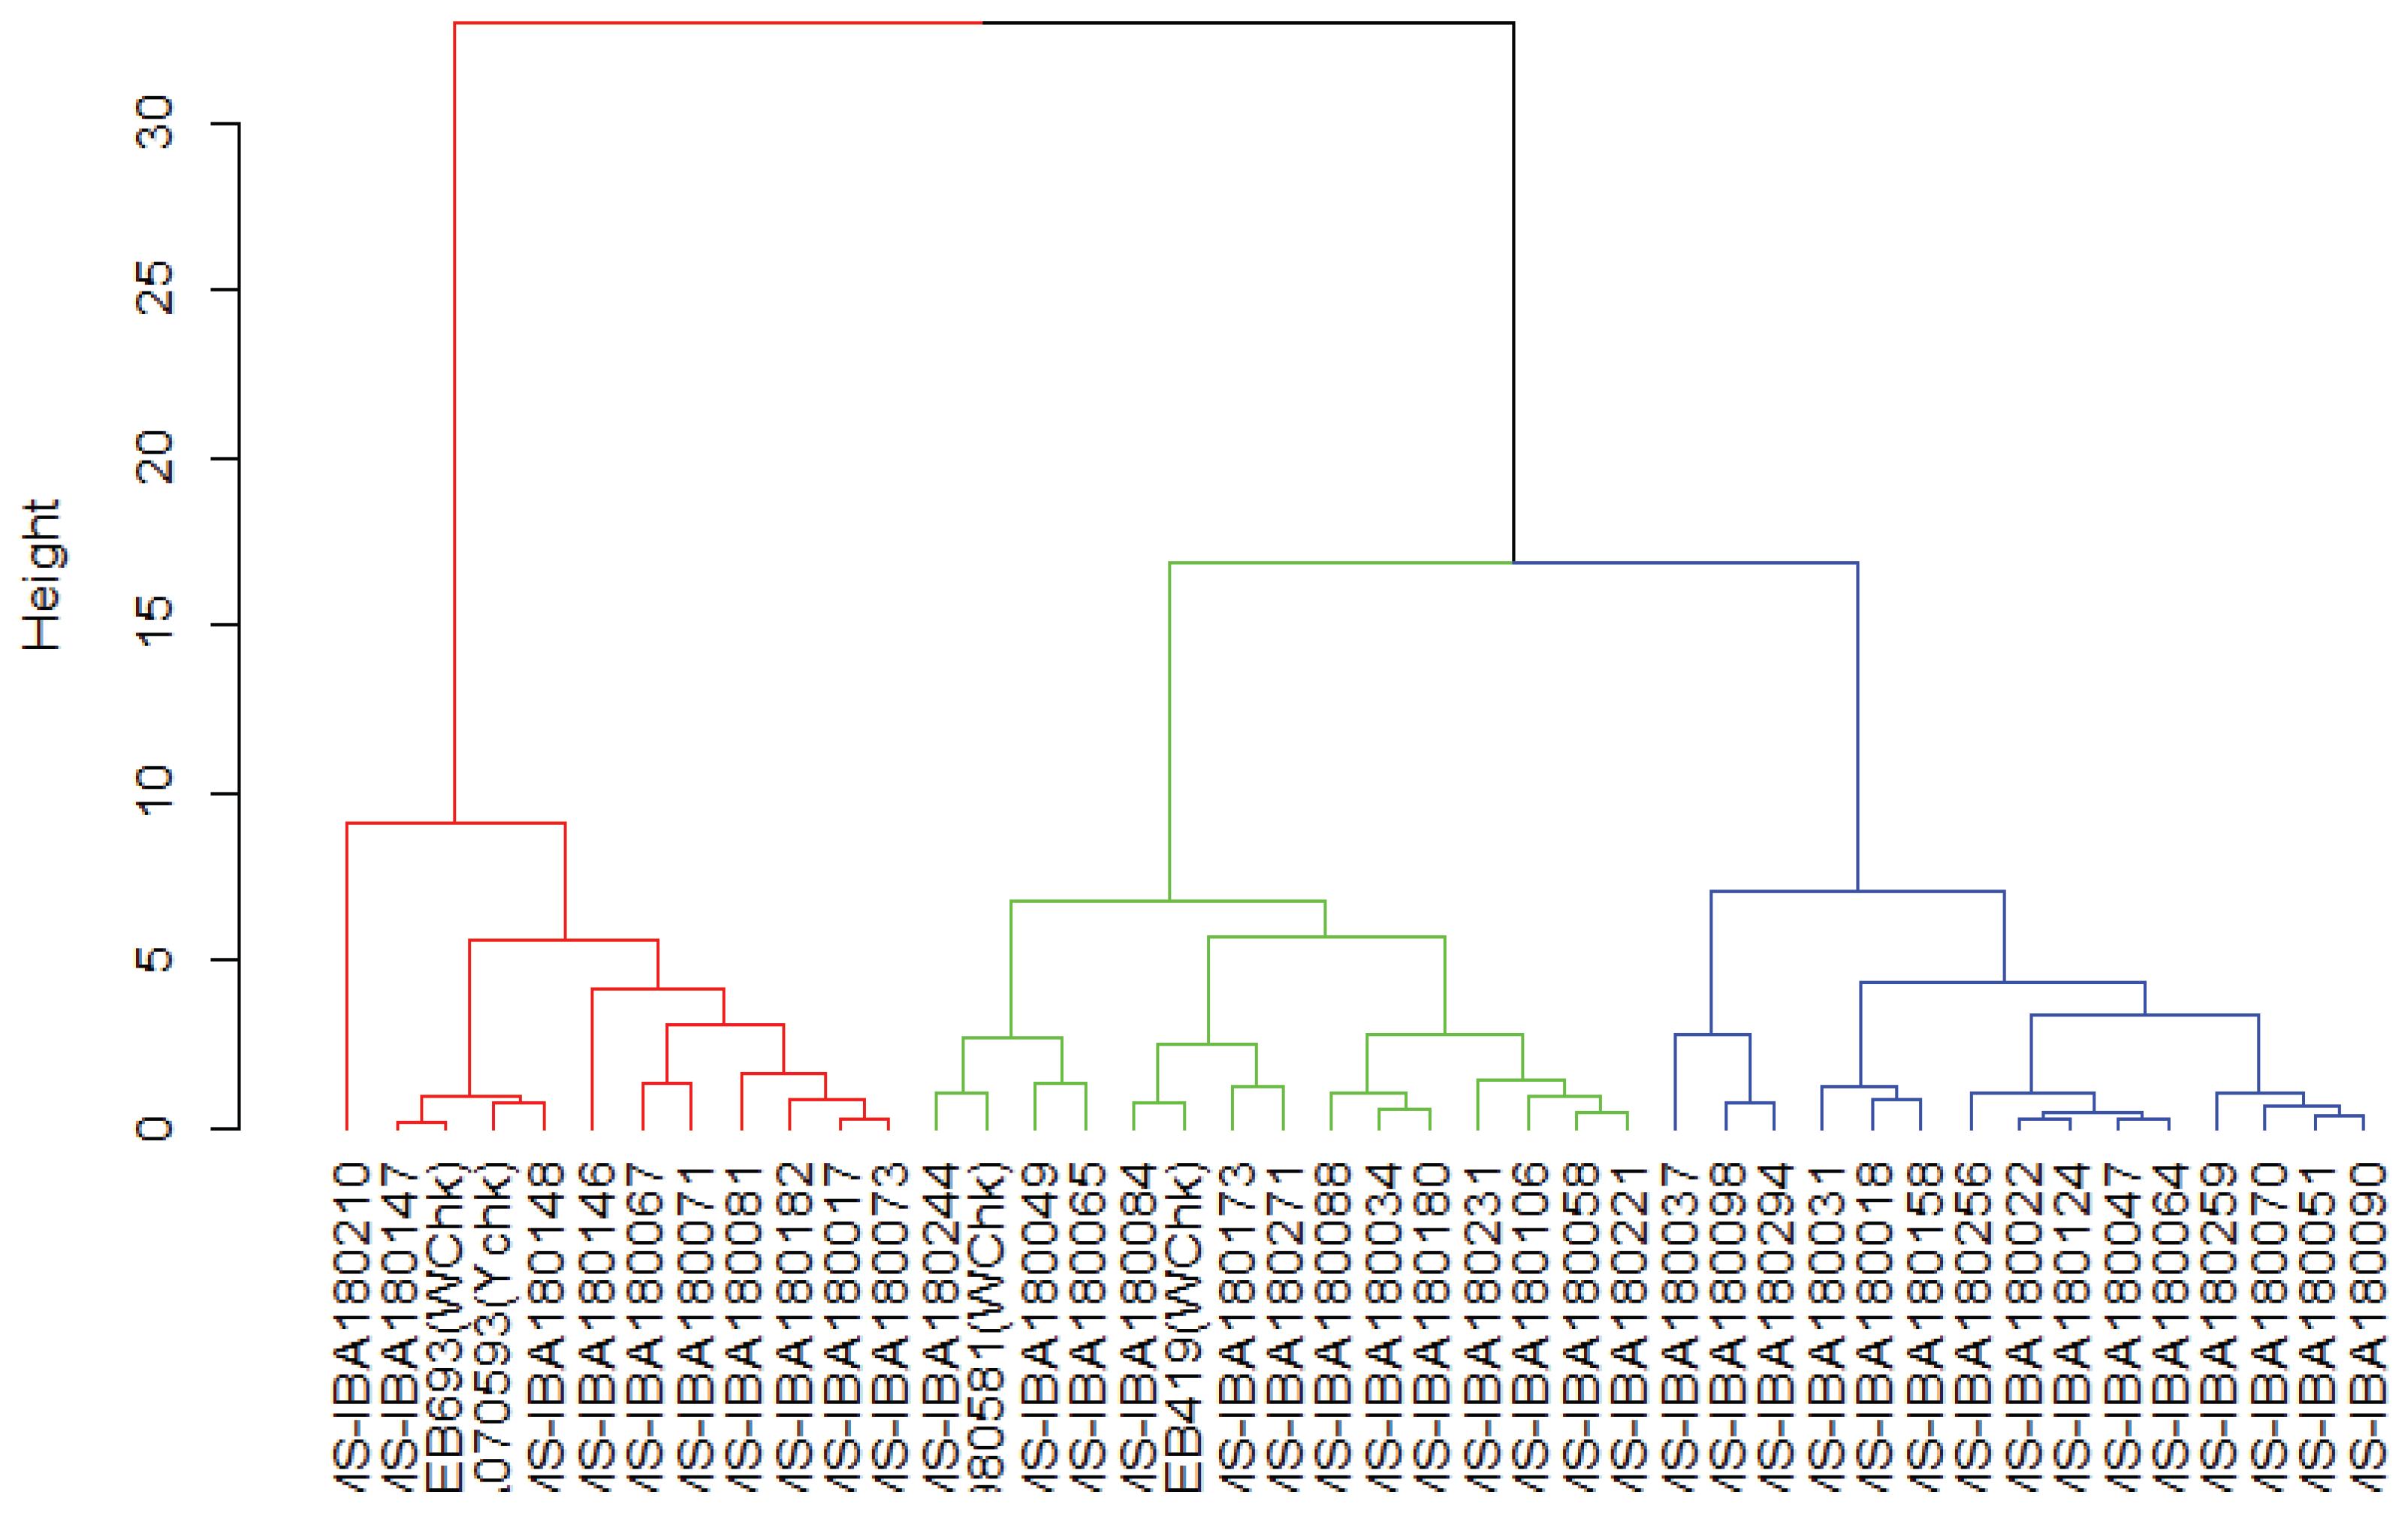
3.7. Genetic Clustering Reveals Population Structure Among Cassava Genotypes
The hierarchical clustering dendrogram as revealed in the
Figure 3 illustrates the genetic relationships among the cassava genotypes based on their molecular profiles. The genotypes are grouped into three distinct clusters-red, green, and blue-indicating varying degrees of genetic similarity. Genotypes within the same cluster exhibit closer genetic relationships, and are thus similar while those separated by greater branch heights reflect higher levels of dissimilarity. This clustering pattern suggests underlying genetic structure within the population, potentially linked to geographic origin, breeding history, or phenotypic traits.
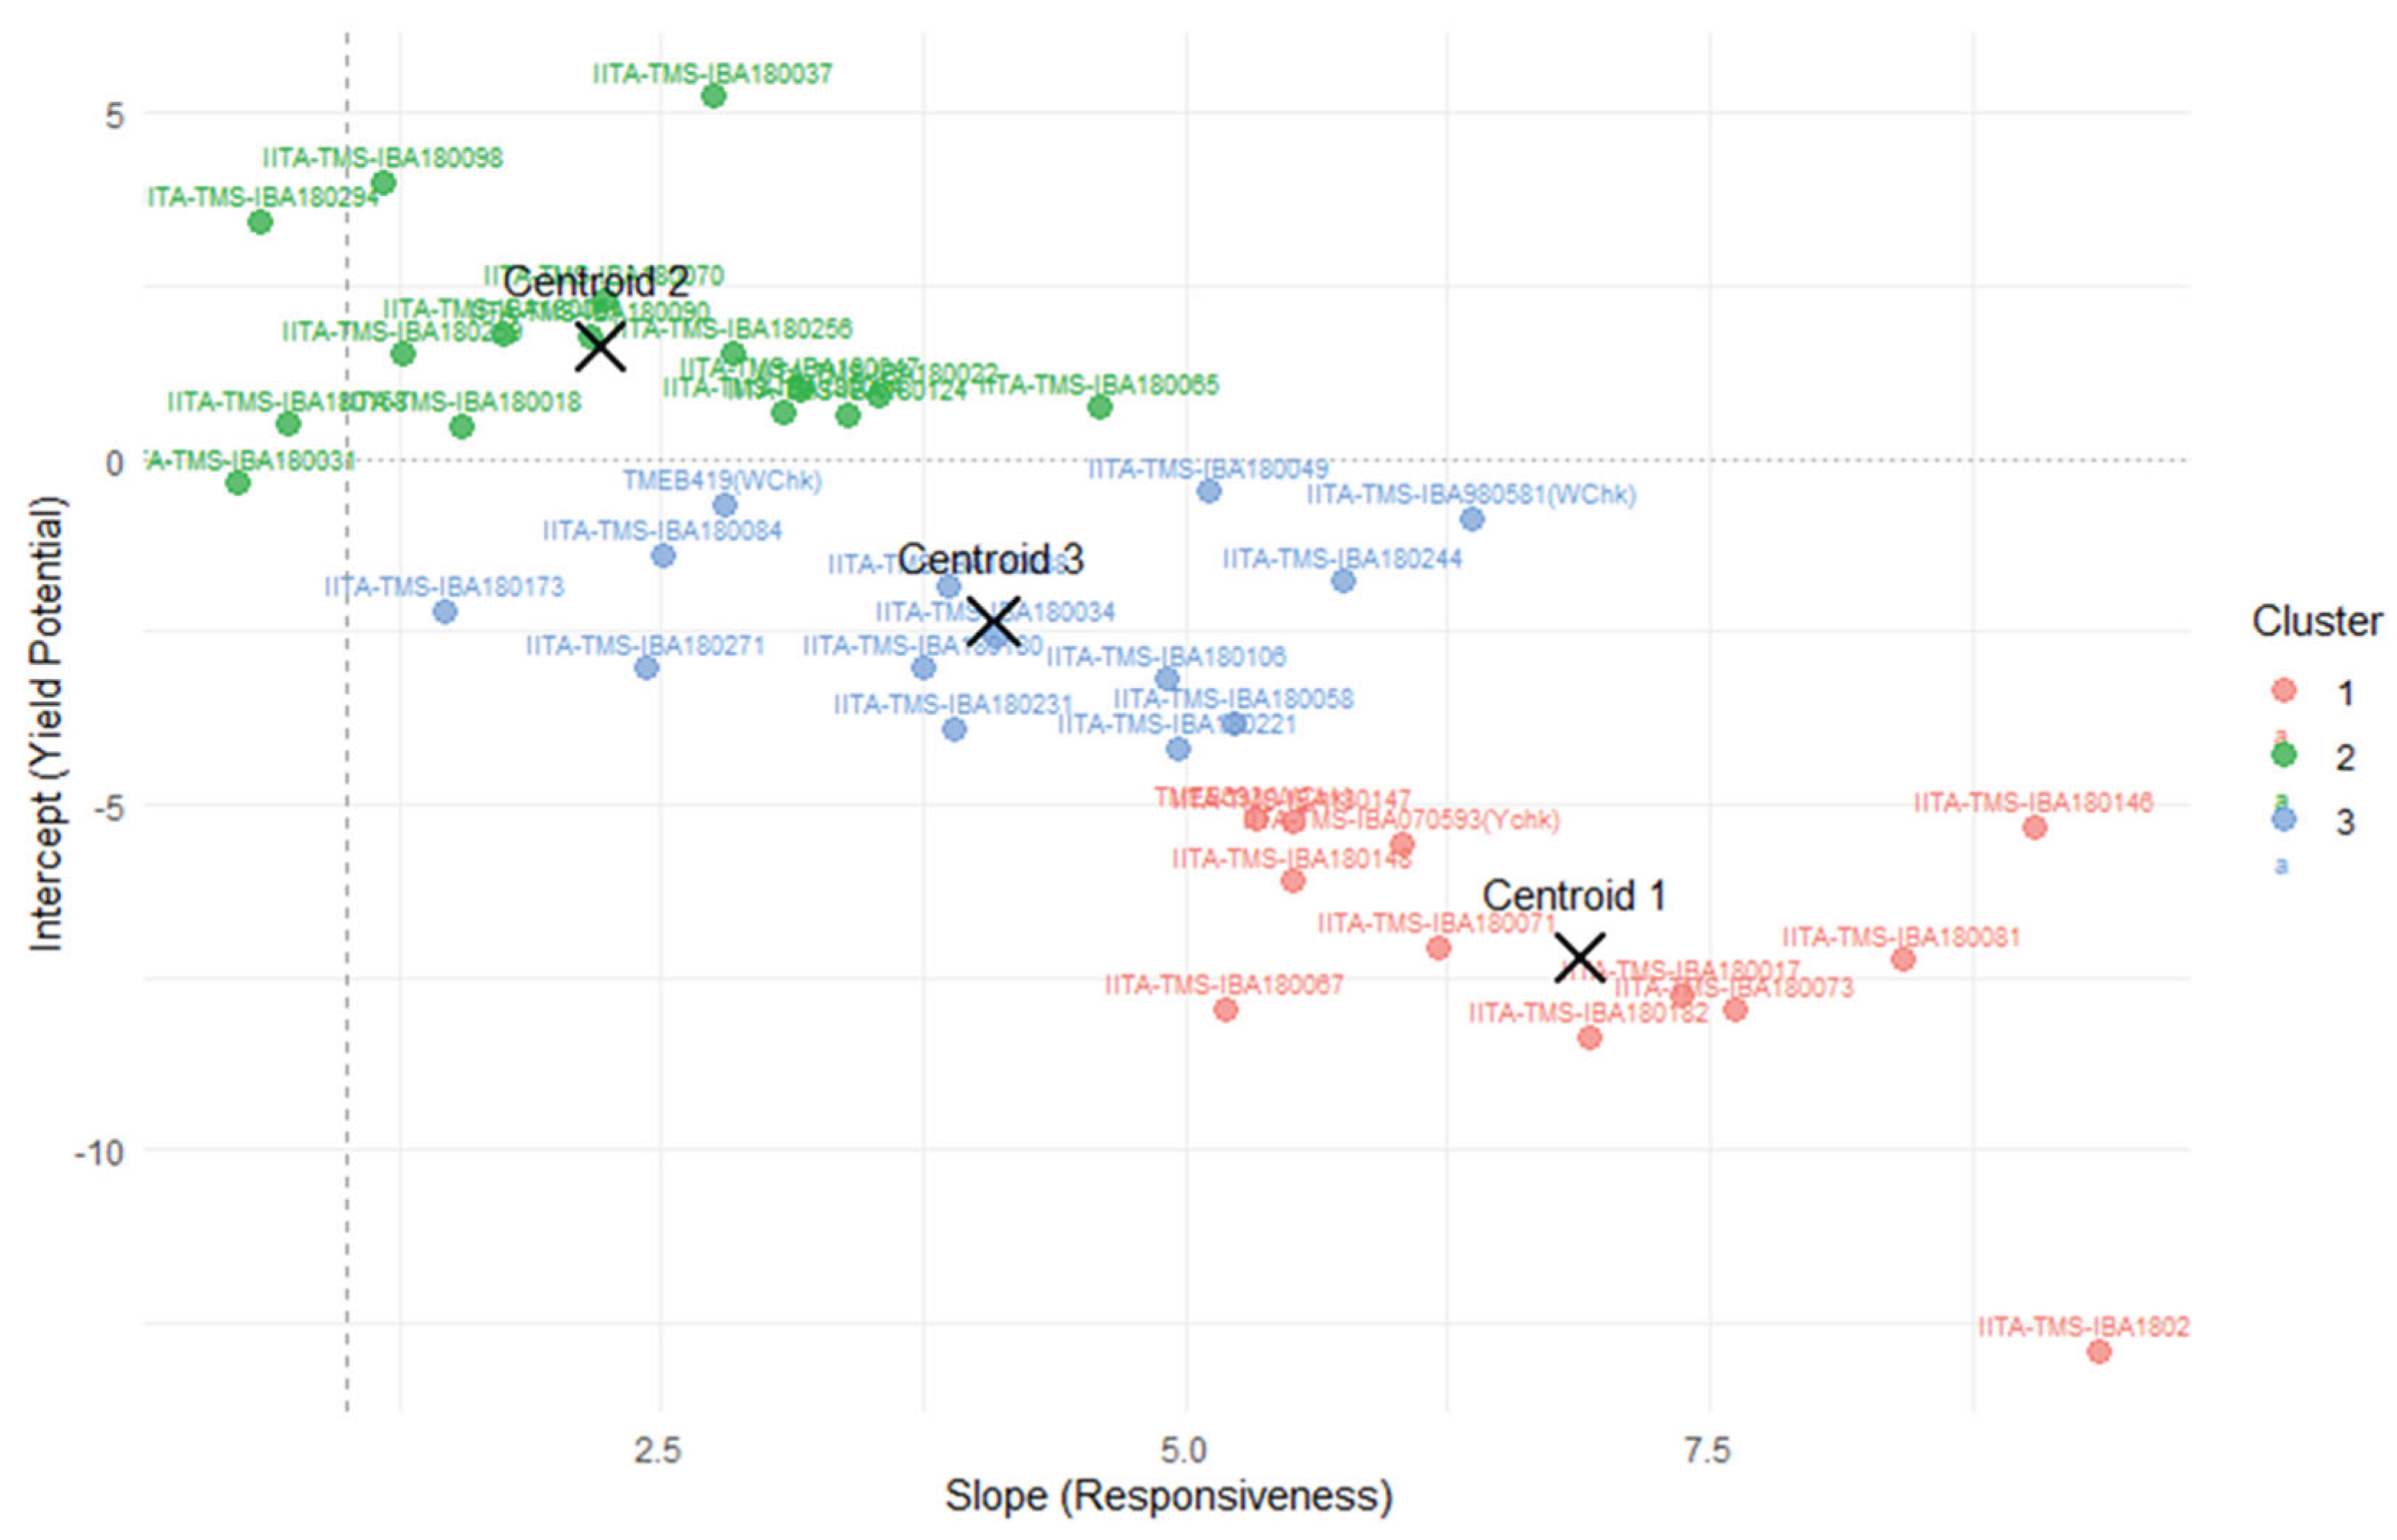
3.8. Yield-Responsiveness Analysis Highlights Genotypic Adaptability Across Environments
The scatter plot in the
Figure 4 illustrates the relationship between yield (intercept) and environmental sensitivity (slope) across various cassava genotypes. These centroids summarize the average slope and intercept values for genotypes in each of the three clusters identified through k-means
. Each genotype is represented by a labeled point, color-coded by cluster membership: Cluster 1 (red), Cluster 2 (blue), and Cluster 3 (green). Genotypes with higher intercepts exhibit greater yield potential, while those with steeper slopes are more responsive to environmental changes. This dual-axis evaluation enables the identification of genotypes that combine high productivity with adaptive responsiveness-ideal candidates for breeding programs targeting variable agroecological zones.
4. Discussion
4.1. Genotype Performance and Stability Based on Finlay–Wilkinson Regression
Genotype performance and stability were assessed using slope and intercept estimates derived from Finlay-Wilkinson regression. The intercept reflects average yield under neutral environmental conditions, while the slope indicates a genotype’s responsiveness to environmental variation. A slope near unity (1.0) suggests balanced adaptability; values above 1.0 indicate increased responsiveness to favorable environments, whereas slopes below 1.0 imply conservative, stable performance with minimal environmental influence [
16]
Several genotypes demonstrated high yield potential and warrant further exploration. Notably, IITA-TMS-IBA180037 (intercept = 5.25, slope = 2.75) and IITA-TMS-IBA180294 (intercept = 3.44, slope = 0.59) combined strong baseline yields with contrasting environmental sensitivities-the former being highly responsive, and the latter showing minimal sensitivity. Genotypes such as IBA180256 and IBA180259 displayed modest yields with slopes above 1.0, indicating moderate responsiveness and reasonable stability. These accessions represent promising candidates for multi-environment testing and region-specific adaptation.
In contrast, genotypes with extreme slope values (> 5.0), including IBA180081, IBA180073, and IBA180146, exhibited highly sensitive responses to environmental variation. While they may perform well under optimal conditions, their erratic behavior in stress-prone or marginal environments raises concerns about reliability. Caution is advised when considering these genotypes for broad deployment. While these genotypes may achieve high yields under ideal conditions, their extreme sensitivity heightens the risk of substantial yield reductions when exposed to environmental stress.
Genotypes with slopes close to 1.0 were interpreted as stable performers with predictable behavior across diverse conditions [
17]. These near-unit slope genotypes represent reliable, low-risk choices for breeding or cultivation in regions where environmental conditions fluctuate moderately [
18]
. For example,
IBA180098 (intercept = 4.02, slope = 1.17) and
IBA180259 (intercept = 1.51, slope = 1.27) represent agronomically balanced clones suitable for moderate environments. These results reinforce their value in resilient farming systems. These near-unit slope genotypes represent reliable, low-risk choices for breeding or cultivation in regions where environmental conditions fluctuate moderately.
Thorough assessment is recommended for genotypes that combine low yield potential (negative intercepts) with excessive sensitivity, as they may contribute to instability in production systems. Future refinement should incorporate multi-trait evaluations-including CMD resistance, dry matter content, and nutritional profiles-alongside performance clustering tools such as dendrograms. This trait-level insight supports informed genotype selection tailored to ecological zones and strengthens strategic breeding pipelines.
Although Finlay–Wilkinson regression focuses on yield performance across environments, its outputs intercept and slope can be combined with other agronomic and nutritional traits to create a multi-trait dataset [
19] This expanded dataset can then be used for hierarchical clustering to identify genotypes with desirable combinations of yield stability, disease resistance, and nutritional quality. This trait-level insight supports informed genotype selection tailored to ecological zones and strengthens strategic breeding pipelines.
4.2. Trait-Based Hierarchical Clustering of Genotypic Performance
Hierarchical clustering based on Finlay-Wilkinson regression parameters (intercept and slope) effectively classified the 42 cassava genotypes into three biologically distinct groups. Cluster 1, represented by genotypes such as IITA-TMS-IBA180146 and IBA180081, exhibited extreme environmental sensitivity (mean slope = 6.87) coupled with markedly low baseline yields (mean intercept = –7.23), suggesting unstable performance and high genotype × environment interaction [
16].
Cluster 2 included IBA180073, IBA180256, and IBA180244, and was characterized by moderate responsiveness (mean slope = 2.20) alongside positive yield potential (mean intercept = 1.64), indicating this group comprises broadly adaptable genotypes suitable for regional deployment.
In contrast, Cluster 3, which comprised genotypes such as IBA180037 and IBA180049, showed elevated sensitivity (mean slope = 4.08) but negative intercepts (–2.35), reflecting inconsistent yield behavior and limited resilience under marginal conditions. This trait-based clustering enhances genotype selection strategies by aligning performance profiles with agroecological contexts and guiding breeders in the identification of clones for specific farming systems [
20]
4.3. Trait-Based Hierarchical Clustering of Genotypic Performance
Hierarchical clustering based on Finlay-Wilkinson regression parameters (intercept and slope) effectively classified the 42 cassava genotypes into three biologically meaningful groups. The clusters separate high-risk, environment-dependent genotypes (Clusters 1 and 3) from a more dependable, adaptable group (Cluster 2), guiding both selection and deployment strategies
Cluster 1 represented by genotypes such as IITA-TMS-IBA180146 and IBA180081, exhibited extreme environmental sensitivity with a mean slope 6.87 coupled with markedly low baseline yields mean intercept of -7.23. This profile suggests unstable performance and a strong genotype × environment interaction, making these genotypes less reliable under variable conditions.
Cluster 2 which included IBA180073, IBA180256, and IBA180244, was characterized by moderate responsiveness with a mean slope of 2.20 and positive yield potential mean intercept of 1.64. These genotypes appear broadly adaptable and may be suitable for regional deployment across moderately variable environments.
Cluster 3 comprising genotypes such as IBA180037 and IBA180049, showed elevated sensitivity with a mean slope of 4.08 but negative intercepts mean of -2.35, reflecting inconsistent yield behavior and limited resilience under marginal conditions.
This trait-based clustering approach enhances genotype selection strategies by aligning performance profiles with agroecological contexts. It provides breeders with a practical framework for identifying clones suited to specific farming systems and environmental conditions [
21]
4.4. Cluster-Based Variation in Yield Stability and Environmental Sensitivity
4.4.1. ANOVA-Based Validation of Cluster Differentiation
Significant differences in both environmental sensitivity (slope) and baseline yield (intercept) across genotype clusters (P < 0.001) validate the agronomic relevance of the groupings and reinforce their utility in guiding targeted breeding decisions [
22]. Specifically, Cluster 2 genotypes exhibited balanced responsiveness and positive yield potential, making them suitable for broad regional deployment. Cluster 3 included candidates with moderate responsiveness but lower yield, potentially useful in stress-prone agroecologies. In contrast, Cluster 1 contained highly sensitive genotypes with poor baseline productivity, requiring cautious evaluation before recommendation.
A one-way analysis of variance (ANOVA) was conducted to assess whether significant differences existed among genotype clusters in terms of yield (intercept) and environmental responsiveness (slope), based on Finlay-Wilkinson regression outputs. The results revealed strong statistical significance for both parameters. Slope values differed markedly across clusters (F(2,39) = 40.89, P < 0.001), indicating clear variation in genotype sensitivity to environmental conditions. Similarly, intercept values showed highly significant differences (F(2,39) = 102.10, P < 0.001), reflecting distinct baseline yield level [
23]
. These findings support the biological relevance of the clustering structure and validate the use of grouped genotypic behavior to inform breeding and deployment decisions.
4.4.2. Centroid Analysis and Agronomic Implications
This study applied Finlay-Wilkinson regression and k-means clustering to evaluate yield stability and environmental responsiveness among 42 cassava genotypes across multi-season trials. Regression coefficients (intercept and slope) effectively captured genotype-specific performance traits, while clustering analysis grouped accessions into distinct phenotypic profiles. One-way ANOVA confirmed statistically significant differences in both slope and intercept values across clusters (P < 0.001), reinforcing the agronomic relevance of the grouping approach.
Cluster 2 encompassed genotypes with moderate responsiveness (mean slope = 2.20) and positive yield baselines (mean intercept = 1.64), identifying this group as broadly adaptable and promising for regional deployment. Cluster 3 included accessions with higher environmental sensitivity (mean slope = 4.08) but lower baseline yields (mean intercept = –2.35), suggesting limited suitability and potential instability under marginal conditions. Cluster 1, although highly responsive (mean slope = 6.87), exhibited the lowest average yield (mean intercept = –7.23), indicating strong genotype × environment interaction and limited agronomic value without targeted environmental support.
Centroid analysis provided deeper insight into the biological behavior of clustered genotypes [
24]
. Cluster 1, characterized by an extremely high mean slope and negative intercept, encompassed genotypes with exaggerated responsiveness and poor baseline yield-suggesting instability and high G×E interaction. Cluster 2 presented the most promising profile, combining moderate slope and positive intercept values, indicating adaptability alongside productive potential. These genotypes may be suitable for flexible deployment across regions. Meanwhile, Cluster 3 demonstrated responsiveness without stable performance, as reflected by its slope and negative intercept combination. Centroid positioning proved clustering useful for grouping genotypes by agronomic traits and helped identify those best suited for targeted growing conditions [
25]
. These results give breeders a useful guide for choosing genotypes that match different growing conditions. In future studies, combining genetic information, environmental data, and multiple trait measurements can help improve how genotypes are grouped. This will make it easier to select and deploy the right varieties for diverse farming environments.
4.4.3. Convergent Performance Among Genetically Diverse Cassava Genotypes
Genotypes were grouped using Finlay-Wilkinson regression traits-intercept and slope-which reflect yield potential and environmental responsiveness. Cluster 1 comprised highly sensitive, low-yielding genotypes; Cluster 2 included moderate, stable performers; while Cluster 3 displayed mixed traits, including check varieties and genotypes with variable responsiveness.
Interestingly, genotypes identified as stable performers in Cluster 2 were distributed across all three dendrogram groupings, suggesting that performance stability can arise from genetically diverse backgrounds. For instance,
IITA-TMS-IBA180073 appeared in dendrogram group 1 (red),
IITA-TMS-IBA180244 in group 2 (green), and
IITA-TMS-IBA180256 in group 3 (blue). This pattern implies that genotypes from different genetic lineages may have been selected or developed to perform similarly under varying environmental conditions due to shared traits such as stable yield and adaptability. It highlights the potential for convergence in agronomic performance across genetically distinct genotypes, offering valuable diversity for breeding programs [
26]
A notable example is the group of genotypes
IITA-TMS-IBA180018,
IBA180051,
IBA180098, and
IBA180259, which all exhibit moderate intercepts and slopes near 1.0-1.7. These values indicate stable performance with slight responsiveness to environmental variation. Their grouping within dendrogram cluster 3 suggests not only trait similarity but possibly shared ancestry, breeding history, or selection pressure. This cluster represents a valuable pool of genotypes that are not overly sensitive to environmental fluctuations and maintain reasonable yield potential-ideal for environments where consistency and adaptability are prioritized [
26]
Further comparison reveals that genotypes in dendrogram group 3, such as
IBA180018,
IBA180051,
IBA180098, and
IBA180259, had higher intercepts and lower slopes, indicating superior yield potential and greater stability. In contrast, genotypes in Cluster 2 from the Finlay-Wilkinson regression
IBA180073,
IBA180244, and
IBA180256 showed lower intercepts and higher slopes, suggesting moderate yield with greater environmental responsiveness. This contrast underscores the value of integrating trait-based and hierarchical clustering approaches to identify genotypes suited to specific agronomic contexts, whether for broad adaptation or targeted environmental resilience [
27]
A distinct subset of genotypes-IITA-TMS-IBA180037, IBA180294, IBA180070, IBA180256, and IBA180259 all exhibited the highest intercept values, indicating superior yield potential irrespective of their slope values. These genotypes were all grouped within the third dendrogram cluster, suggesting that this cluster may represent a genetically diverse but agronomically elite group. The variation in slope among these genotypes highlights that high yield can coexist with both stability and responsiveness, offering breeders flexible options for different environmental conditions [
28]
A group of genotypes IITA-TMS-IBA180081, IBA180073, IBA180017, IBA180182, and IBA180146 all exhibited extreme slope values, indicating high sensitivity to environmental variation and strong genotype-by-environment interaction. These genotypes were all clustered within dendrogram group 1, suggesting that this cluster represents a trait-based grouping of highly responsive but potentially unstable performers. These genotypes might perform very well when growing conditions are perfect, but they are less reliable when the environment is challenging. This insight highlights the importance of matching genotype selection to environmental context and underscores the value of trait-based clustering in identifying high-risk, high-reward candidates.
This emphasizes the importance of tailoring genotype selection to specific environmental conditions, where genotypes are selected based on how well they perform under particular growing conditions. Choosing the right genotype for the right environment ensures better yield stability and reduces the risk of crop failure [
28]
These findings further stress the importance of environment-specific breeding strategies in cassava improvement. By identifying genotypes that perform reliably under particular environmental conditions-whether stable across diverse settings or responsive in high-input systems, breeders can make more targeted selections. Matching genotypes to their optimal environments not only enhance yield stability but also supports sustainable and climate-resilient agriculture.
5. Recommendation
While this study applied dendrogram clustering based on Finlay-Wilkinson regression traits (slope and intercept), future analyses could enhance this approach by incorporating additional agronomic and nutritional traits-such as CMD resistance, dry matter content, and total carotenoids-into the clustering process. By evaluating genotypes across multiple dimensions simultaneously, multi-trait clustering would enable the identification of genotypes that are not only high-yielding and stable, but also disease-resistant and nutrition ally valuable. This integrated selection strategy would support more targeted breeding for diverse agroecological zones and consumer needs.
In addition, future research should validate clustered genotypes under field conditions across multiple agroecological zones to confirm performance consistency, incorporate molecular marker data to strengthen genotype classification and trace breeding lineages, explore genotype × environment interactions more deeply, using environmental covariates to refine adaptability profiles, include farmer-preferred traits (e.g., root texture, taste, processing quality) to ensure adoption and impact and apply machine learning or advanced statistical models to improve clustering accuracy and trait prediction.
6. Conclusions
This study employed Finlay-Wilkinson regression alongside k-means and hierarchical clustering to evaluate yield stability and environmental responsiveness among 42 cassava genotypes across multi-season trials. Regression parameters-intercept and slope-served as quantitative descriptors of baseline yield potential and sensitivity to environmental variation. The analytical framework revealed meaningful variation in genotype adaptation, identifying distinct performance classes within the population.
Cluster analysis partitioned genotypes into three biologically relevant groups with clear agronomic implications. One-way ANOVA confirmed highly significant differences among clusters for both intercept (F = 102.1; P < 0.001) and slope (F = 40.89; P < 0.001), validating the grouping strategy. Cluster 2 displayed the most desirable trait profile, combining moderate responsiveness (mean slope = 2.20) with positive yield performance (mean intercept = 1.64), indicating broad adaptability and deployment potential. Cluster 3 genotypes exhibited high environmental sensitivity but negative yield baselines, suggesting limited suitability except under targeted stress-resilient management. Cluster 1 comprised highly responsive genotypes with poor baseline yield (mean intercept = =7.23), limiting their agronomic utility.
Dendrogram profiling reinforced these classifications by delineating genotypic relationships based on slope–intercept similarity. Cluster 2 accessions showed consistent yield expression across seasons and moderate slope behavior, supporting their advancement into multi-location trials. Cluster 3 may offer value in breeding programs targeting stress resilience traits, while Cluster 1 genotypes warrant further evaluation under controlled input scenarios due to their unstable performance.
Overall, these results provide breeders with a strategic tool for breeding decisions for choosing cassava genotypes that fit specific growing environments and production needs. Future studies should combine multiple traits, genetic data, and environmental information to improve how genotypes are grouped and selected. Involving farmers in on-farm testing can also help ensure that recommended varieties perform well in real conditions and are more likely to be adopted by smallholder communities.
Supplementary Materials
The following supporting information can be downloaded at the website of this paper posted on Preprints.org.
Author Contributions
For research articles with several authors, a short paragraph specifying their individual contributions must be provided. The following statements should be used “Conceptualization, O.B.; E.P; A.G; E.T and K.T; methodology, O.B.; E.P; A.G; E.T and K.T; software, O.B.;E.P; P.I; and P.A; validation, E.P; A.G; E.T; K.T; P.I; T.A and P.A.,; formal analysis, O.D.; investigation, E.P; A.G; E.T;K.T; P.I’ P.A,; and T.A.; resources, E.P; P.I; P.A and T.A.; data curation, O.B; P.A.; writing—original draft preparation, O.B.; writing—review and editing, O.B.; E.P; A.G; E.T and K.T.; visualization, O.B.; supervision, E.P; A.G; E.T; K.T; P.I; T.A and P.A,; project administration, E.P, P.I. All authors have read and agreed to the published version of the manuscript.
Funding
This research received no external funding
Acknowledgments
This research forms part of the findings from a thesis conducted at the International Institute of Tropical Agriculture (IITA), Nigeria, in collaboration with the Department of Crop Production, Federal University of Technology, Minna, Nigeria. The authors gratefully acknowledge the Cassava Breeding Unit at IITA for their technical and logistical support throughout the study. Special thanks are extended to the dedicated field staff whose assistance during data collection-particularly in multi-stage harvest evaluations-was invaluable.
Conflicts of Interest
“The authors declare no conflicts of interest.”
Abbreviations
The following abbreviations are used in this manuscript:
| CMD |
Cassava Mosaic Disease |
References
- Otekunrin, O. A. (2024). Cassava (Manihot esculenta Crantz): A global scientific footprint—production, trade, and bibliometric insights. Discover Agriculture, 2, Article 94. [CrossRef]
- National Root Crops Research Institute. (2024, February 27). The resilience and versatility of cassava: A staple root crop in Africa. Available online:https://nrcri.gov.ng/the-resilience-and-versatility-of-cassava-a-staple-root-crop-in-africa/ (accessed on Day15th August, 2025.
- Omoluabi, J. E., & Ibitoye, S. J. (2024). Cassava production and agricultural growth in Nigeria: Analysis of effects and forecast. GSC Advanced Research and Reviews, 21(1), 37–46. [CrossRef]
- Karim, K. Y., & Norman, P. E. (2021). Genotype × environment interaction and stability analysis for selected agronomic traits in cassava (Manihot esculenta). International Journal of Environment, Agriculture and Biotechnology, 6(8), 1–12. Retrieved from https://ijoear.com/assets/articles_menuscripts/file/IJOEAR-AUG-2021-4.pdf.
- Begna, T. (2020). The role of genotype by environmental interaction in plant breeding. International Journal of Agriculture and Biosciences, 9(5), 209–215. Retrieved from https://www.ijagbio.com/pdf-files/volume-9-no-5-2020/209-215.pdf.
- Bates, D., Mächler, M., Bolker, B., & Walker, S. (2015). Fitting Linear Mixed-Effects Models Using lme4. Journal of Statistical Software, 67(1), 1–48. [CrossRef]
- MacQueen, J. B. (1967). Some methods for classification and analysis of multivariate observations. In L. M. Le Cam & J. Neyman (Eds.), Proceedings of the Fifth Berkeley Symposium on Mathematical Statistics and Probability (Vol. 1, pp. 281–297). University of California Press.
- Ward, J. H. (1963). Hierarchical grouping to optimize an objective function. Journal of the American Statistical Association, 58(301), 236–244. [CrossRef]
- Sokal, R. R., & Sneath, P. H. A. (1963). Principles of numerical taxonomy. W.H. Freeman.
- Hair, J. F., Black, W. C., Babin, B. J., & Anderson, R. E. (2010). Multivariate data analysis (7th ed.). Pearson.
- Piepho, H. P., Möhring, J., Melchinger, A. E., & Büchse, A. (2008). Blup for phenotypic selection in plant breeding and variety testing. Euphytica, 161, 209–228. [CrossRef]
- R Core Team. (2020). R: A language and environment for statistical computing (Version 4.0.3) [Computer software]. R Foundation for Statistical Computing. https://www.r-project.org/.
- Finlay, K. W., & Wilkinson, G. N. (1963). The analysis of adaptation in a plant-breeding programme. Australian Journal of Agricultural Research, 14(6), 742–754.
- Wickham, H., François, R., Henry, L., Müller, K., Vaughan, D., & Posit Software, PBC. (2023). dplyr: A grammar of data manipulation (Version 1.1.4) [R package]. Comprehensive R Archive Network (CRAN). https://cran.r-project.org/package=dplyr.
- Wickham, H., Chang, W., Henry, L., Pedersen, T. L., Takahashi, K., Wilke, C., Woo, K., Yutani, H., Dunnington, D., van den Brand, T., & Posit, PBC. (2025). ggplot2: Create elegant data visualisations using the grammar of graphics (Version 3.5.2) [R package]. Comprehensive R Archive Network (CRAN). https://cran.r-project.org/package=ggplot2.
- Eberhart, S. A., & Russell, W. A. (1966). Stability parameters for comparing varieties. Crop Science, 6(1), 36–40. [CrossRef]
- Carvalho, H. F., Rio, S., García-Abadillo, J., & Sánchez, J. I. (2024). Revisiting superiority and stability metrics of cultivar performances using genomic data: derivations of new estimators. Plant Methods, 20, Article 85. [CrossRef]
- Egea-Gilabert, C., Pagnotta, M. A., & Tripodi, P. (2021). Genotype × environment interactions in crop breeding. Agronomy, 11(8), 1644. [CrossRef]
- Jarquin, D., Howard, R., Crossa, J., Beyene, Y., Gowda, M., Martini, J. W. R., ... & Prasanna, B. M. (2020). Genomic prediction enhanced sparse testing for multi-environment trials. G3: Genes, Genomes, Genetics, 10(9), 3023–3033. [CrossRef]
- Bančič, J., Ovenden, B., Gorjanc, G. et al. Genomic selection for genotype performance and stability using information on multiple traits and multiple environments. Theor Appl Genet 136, 104 (2023). [CrossRef]
- van Eeuwijk, F. A., Bustos-Korts, D. V., & Malosetti, M. (2010). Two-mode clustering of genotype by trait and genotype by environment data. Euphytica, 175(3), 365–379. [CrossRef]
- Ebem, E. C., Afuape, S. O., Chukwu, S. C., & Ubi, B. E. (2021). Genotype × Environment Interaction and Stability Analysis for Root Yield in Sweet Potato (Ipomoea batatas [L.] Lam). Frontiers in Agronomy, 3, Article 665564. [CrossRef]
- Dalmaijer, E. S., Nord, C. L., & Astle, D. E. (2022). Statistical power for cluster analysis. BMC Bioinformatics, 23, Article 205. [CrossRef]
- Strickert, M., Sreenivasulu, N., Villmann, T., & Hammer, B. (2008). Robust centroid-based clustering using derivatives of Pearson correlation. In Proceedings of the First International Conference on Bio-inspired Systems and Signal Processing (BIOSTEC). ScitePress. https://www.scitepress.org/Papers/2008/10626/10626.pdf.
-
Sabaghnia, N., Shekari, F., Nouraein, M., & Janmohammadi, M. (2025). Cluster analysis of agronomic traits in chickpea genotypes under cool upland semi-arid region. Annals of Arid Zone, 64(1), 13–21. https://epubs.icar.org.in/index.php/AAZ/article/download/159002/59598.
-
Zakir, M. (2018). Review on genotype × environment interaction in plant breeding and agronomic stability of crops. Journal of Biology, Agriculture and Healthcare, 8(12), 1–9. https://www.iiste.org/Journals/index.php/JBAH/article/view/43065.
- Lian, L., & de los Campos, G. (2016). FW: An R package for Finlay–Wilkinson regression that incorporates genomic/pedigree information and covariance structures between environments. G3: Genes|Genomes|Genetics, 6(3), 589–597. [CrossRef]
- Pour-Aboughadareh, A., Jadidi, O., Jamshidi, B., Bocianowski, J., & Niemann, J. (2025). Cross-talk between stability parameters and selection models: A new procedure for improving the identification of superior genotypes in multi-environment trials. BMC Research Notes, 18, Article 306. https://bmcresnotes.biomedcentral.com/articles/10.1186/s13104-025-07366-1.
|
Disclaimer/Publisher’s Note: The statements, opinions and data contained in all publications are solely those of the individual author(s) and contributor(s) and not of MDPI and/or the editor(s). MDPI and/or the editor(s) disclaim responsibility for any injury to people or property resulting from any ideas, methods, instructions or products referred to in the content. |
© 2025 by the authors. Licensee MDPI, Basel, Switzerland. This article is an open access article distributed under the terms and conditions of the Creative Commons Attribution (CC BY) license (http://creativecommons.org/licenses/by/4.0/).