Preprint
Review

This version is not peer-reviewed.

Operational Cycle Detection for Mobile Mining Equipment: An Integrative Scoping Review with Narrative Synthesis

A peer-reviewed article of this preprint also exists.

Submitted:

28 August 2025

Posted:

29 August 2025

You are already at the latest version

Abstract

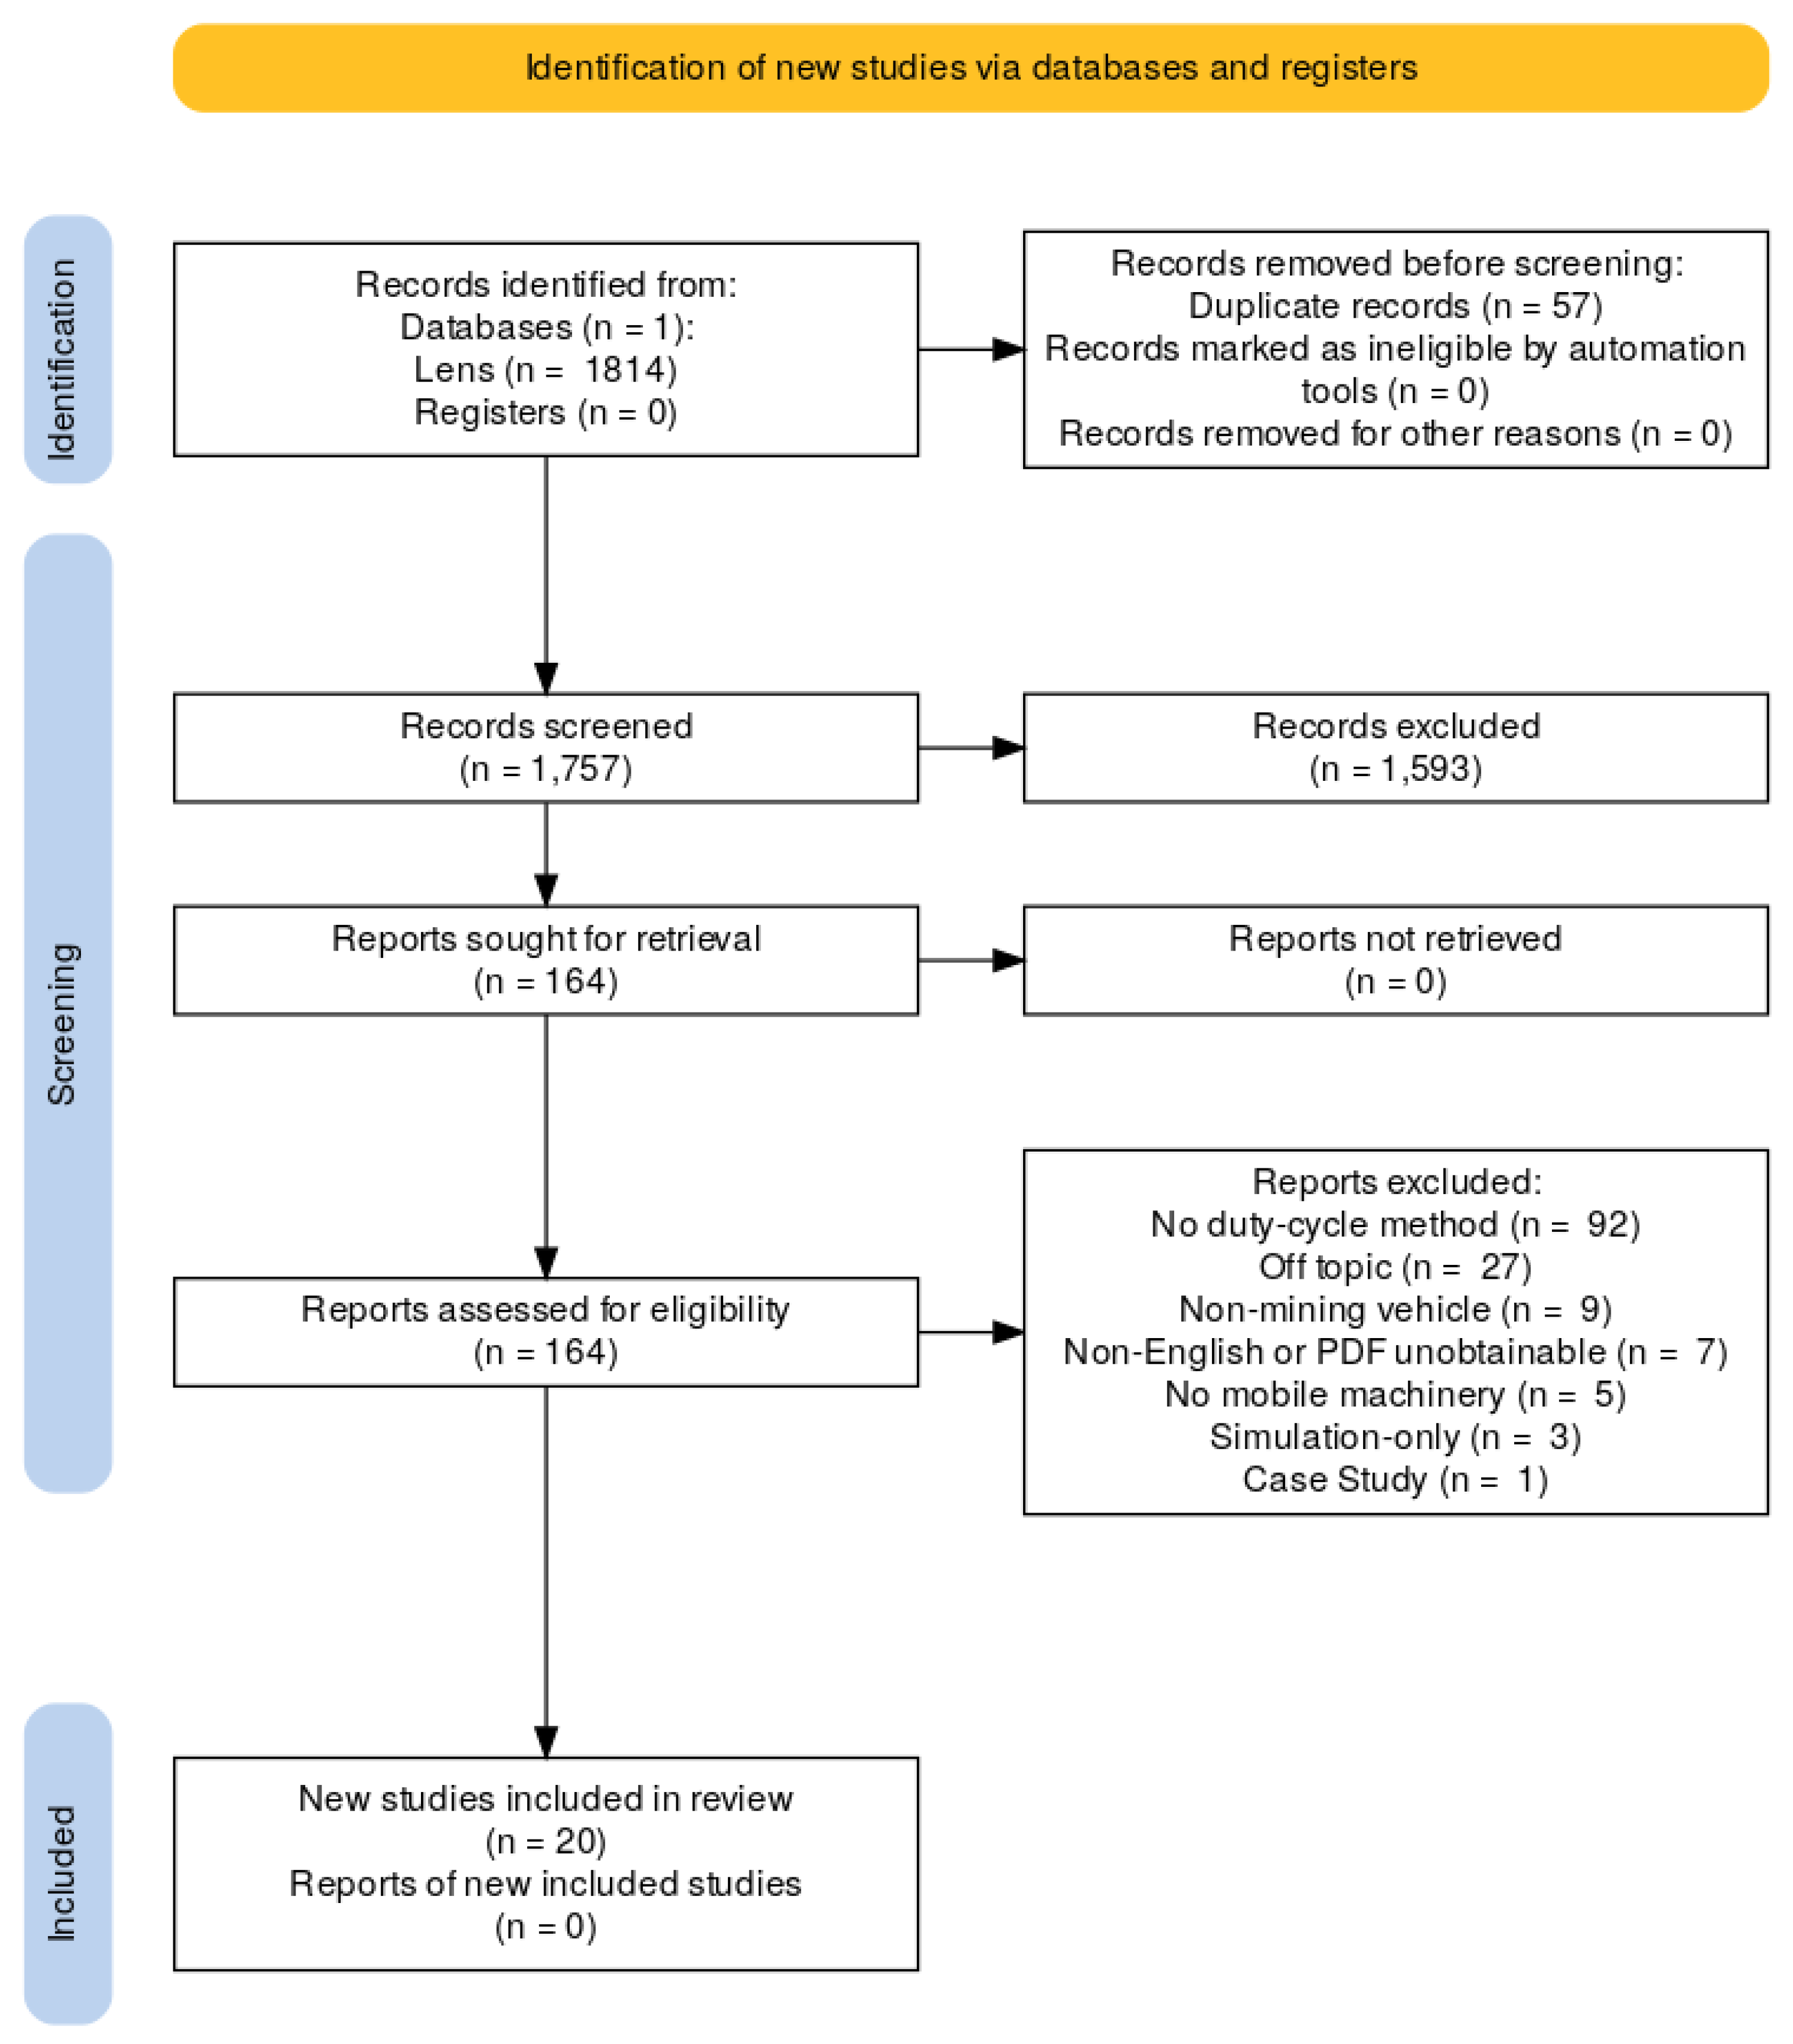
Background: Accurate operational cycle detection underpins maintenance, production analytics and energy management for mobile equipment in mining. Yet no review has investigated the landscape of operational cycle detection literature in mining. Methods: Following the Preferred Reporting Items for Systematic Reviews and Meta‐Analyses, Scoping Review extension (PRISMA-ScR) framework, we searched the Lens database on June 27, 2025, for records published 2000–2025 that segment mobile mining vehicle telemetry into discrete operating modes. After de-duplication (n = 1,757) and two-stage screening, 20 empirical studies met all criteria (19 diesel, 1 battery-electric). Due to the sparse research involving battery electric vehicles (BEVs) in mining, three articles performing cycle detection on heavy-duty vehicles in a similar operational context to mining are synthesized. A bespoke three-axis Transferability Lens—created to measure cross-domain applicability of modelling approaches—was applied to four expert-selected passenger BEV studies to investigate cross-domain synthesis. Results: Early diesel work used single-sensor thresholds, often achieving >90\% site-specific accuracy, while recent studies increasingly employ types of neural networks using multivariate datasets. While the cycle detection research on mining BEVs, even supplanted with additional heavy-duty BEV studies, is sparse, similar approaches are favoured. The transferability appraisal suggests only moderate sensor-mapping and retraining effort when adapting automotive BEV classifiers to mining vehicle cycle detection. Conclusions: Persisting gaps in the literature include the absence of public mining datasets, inconsistent evaluation metrics, and limited real-time validation.

Keywords: 
;  ;  ;  ;  

1. Introduction

Accurate and timely planning of mining operations is paramount to ensuring profitability at the mine site by minimizing equipment downtime and costly interruptions. Mobile mining equipment, such as load–haul–dump vehicles (LHDs), haul trucks, and jumbo drills, operate in harsh, unforgiving environments where wear, variability, and unpredictable demands complicate task execution  [1]. A key task that allows for more accurate planning is the identification of a mobile mining machine’s state of operation at a given time (e.g., identifying that an LHD is scooping up ore). Successful detection of these operating states allows for better predictive maintenance  [2], greater control of production  [3], and energy optimization  [4]. While this activity can be described using a variety of terms, we opt to use "operational cycle detection", or "cycle detection" in short, for clarity’s sake. Each of these cycles also consists of discrete operational modes, which we simply refer to as "modes".
Despite the importance of operational cycle detection, currently there is no review or taxonomy of techniques specifically designed for and applied to mobile mining vehicles. Recent work reinforces the gap:  [5] synthesizes work on heap perception, bucket trajectory planning, autonomous navigation, and monitoring / fault diagnosis, but does not offer a taxonomy for cycle detection on mobile mining vehicles. Likewise,  [3] explicitly calls its work one of the first, and  [6] catalogues enabling technologies without proposing any cycle detection taxonomy — together underscoring the absence of a focused review. Beyond this absence, the industry’s rapid shift to battery-electric fleets (commercial units currently operate in more than 20 mines around the world, with more planned  [7]) introduces another challenge. Battery electric vehicle (BEV) operational cycles are fundamentally different from diesel ones — in particular, the State-of-Charge (SoC) derating of batteries can cause identical tasks to show varying power signatures within a single shift. Accurate detection of these nuances is critical: it can help inform battery pack sizing during design, allows SoC-aware dispatch strategies, and optimizes charging logistics in daily operations  [8].
To address these emerging challenges, this review examines operational cycle detection methods applied to both diesel-powered and battery-electric mobile mining vehicles, while also evaluating the transferability of select cycle classification techniques developed for passenger electric vehicles. The overarching question guiding this review is as follows: which methods have been applied to classify duty cycles in mobile mining equipment, how do their methodological assumptions differ, and what is their potential transferability across domains? Framed in PICO terms, the population is mobile mining equipment, the intervention is operational cycle detection methodology, the comparator is cross-platform (diesel versus BEV) approaches, and the outcomes are classification accuracy, robustness, and applicability to mining contexts. By mapping this methodological landscape and identifying cross-domain insights, the review aims to close the current knowledge gap and accelerate the development of robust, real-time cycle detection algorithms for next-generation BEV mining fleets.
This review closes the current knowledge gap (namely, the absence of a Preferred Reporting Items for Systematic Reviews and Meta-Analyses extension for scoping reviews (PRISMA-ScR) guided review of operational cycle detection techniques for mobile mining equipment) by analyzing peer-reviewed studies published between 2000 and 2025. It delivers three contributions:
  • Comprehensive synthesis of operational cycle detection methods for mobile mining equipment.
  • Assessment of the applicability of automotive BEV approaches to mining environments.
  • Gap analysis identifying unresolved challenges such as the scarcity of public data sets and the lack of real-time deployment.
Section 1 covered the necessity for this review and its contributions. Section 2 details the review protocol (databases, inclusion criteria, PRISMA workflow) and the three-axis transferability framework. Section 3 classifies existing diesel operational cycle classification models. Section 4 surveys the single BEV specific paper found, but also analyses three other cycle detection papers involving non-mining BEVs that occur in environments with similar constraints to mining. Section 5 explores cross-domain techniques by applying the Transferability Lens to four BEV automotive cycle detection methodologies. Section 6 synthesizes the findings, identifies research gaps, and discusses future work, before concluding in Section 7. Through these contributions, the objective of this paper is to accelerate the development of robust diesel and BEV cycle detection algorithms that can be trusted across mines, fleets, and equipment generations.

2. Methods

This review employs (i) a structured scoping review search and selection process for operational cycle detection studies in mobile mining equipment, and (ii) a transferability appraisal that maps findings from selected battery-electric automotive studies into the mining context. No review protocol was prepared or registered for this scoping review.

2.1. Search and Selection Strategy

On 27 June 2025, we ran a structured search in the Lens database to capture operational cycle detection studies for mobile mining equipment. This database was chosen because (i) its federated index delivers more than 250 million scholarly and 140 million patent records, giving wider grey-literature coverage than Scopus or Web of Science alone; (ii) it contains the complete Institute of Electrical and Electronics Engineers, Society for Mining, Metallurgy & Exploration and Canadian Institute of Mining, Metallurgy and Petroleum proceedings, where mining-automation methods are often first disclosed; and (iii) optimizing complex proximity syntax across multiple platforms would have added substantial effort with little benefit. The final search string retrieved 11 of 12 sentinel papers, achieving 92% recall while maintaining  66% precision over the first 100 records. This final run yielded 1,567 records after de-duplication; backward and forward-citation chasing of the sentinel set added 251 records, safeguarding against jargon that might evade keyword filters, bringing the total to 1,814 records. The complete Boolean search string is provided in Appendix A. One article from the predefined sentinel set (Lewis  [9]) was not captured by the database search or citation chasing. This paper is cited in the narrative for context, but it is not counted among the included studies.
Studies were included if they (i) investigated mobile mining machinery, (ii) applied a method to segment sensor data into operational cycle modes, and (iii) relied on field or high-fidelity real-world data. Simulation-only studies and non-English publications were excluded.
Eligibility criteria and rationale: These criteria were chosen to ensure domain relevance and methodological comparability. Focusing on mobile mining machinery excludes adjacent heavy-equipment contexts unless explicitly assessed via the Transferability Lens. Requiring segmentation of telemetry into operational modes targets the central concept of cycle detection in the review. Field or high-fidelity data was mandated because simulation-only signals rarely capture operational noise and operator variability, reducing ecological validity. The time window (2000–2025) corresponds to the era of digital telemetry in mining, while the restriction only in English reflected the capacity of the reviewer’s language. Simulation-only and non-English studies were excluded for these reasons.
Grouping for synthesis: To facilitate comparison, included studies were classified along two axes: (a) type of equipment (diesel versus BEV) and (b) methodological family (rule-based thresholds, supervised machine learning, deep learning or unsupervised / semi-supervised approaches). This grouping informed the structure of Section 3 and Section 4 and underpins the cross-domain synthesis presented in Section 5.
All records were screened by a single reviewer using the Rayyan application [10], which provided semi-automated de-duplication and decision tracking. Title and abstract screening was conducted against three sequential yes/no gates: study design, mining-machine focus, and presence of an operational cycle detection method. Records that passed all three gates proceeded to full-text review, where they were evaluated against every eligibility row. Reasons for exclusion at both title/abstract and full-text stages were logged and are reflected in Figure 1. Because screening was performed by a single reviewer without duplicate checks, there is potential for selection bias. No disagreements arose, as no second screener was involved. Rayyan’s automation features were used solely for de-duplication and record tracking, not for automated exclusion.
In total, 1,888 records were identified through the database search and backward and forward citation search of sentinel papers. After de-duplication, 1,757 unique records remained for screening. Following title and abstract review, 1,593 were excluded, leaving 164 articles for full-text assessment. Of these, 144 were excluded because they were simulation-only, not mining-focused, or lacked a segmentation method. Twenty empirical studies met all eligibility criteria (19 diesel, 1 BEV) and were included in the synthesis. The flow of records through each stage of the review is illustrated in Figure 1.

2.2. Data Extraction and Charting Process

Data from each included study were charted using a standardized extraction form developed for this review. One reviewer extracted all study characteristics, including vehicle type, mine context, sensors and sampling rate, labelling approach, classification methodology, evaluation metrics, dataset size, and any reported funding or conflicts of interest. No automation tools were used for extraction. No contact with study authors was undertaken, as all required information was available in the published manuscripts.
Data items: Outcomes of interest included classification performance metrics such as per-mode precision, recall, F1-score, overall accuracy, and confusion between adjacent modes where reported. Other extracted variables comprised study identifiers (authors, year, venue), vehicle class and mining context, sensors and sampling rate, labelling or annotation source, methodological family (rule-based, supervised, or unsupervised), feature engineering steps, dataset size and duration, and any reported funding or conflicts of interest. These items were chosen to allow consistent comparison of methodological approaches across both diesel and BEV studies.
Critical appraisal: Consistent with guidance for scoping reviews, we did not undertake a formal critical appraisal or risk-of-bias assessment of individual studies. Our aim was to map the breadth and diversity of operational cycle detection methods, rather than to evaluate the effectiveness or comparative quality of specific implementations. Instead, methodological features and performance metrics were charted descriptively (Table 1), and issues of transferability and generalizability were examined narratively through the purpose-built Transferability Lens. As a result, the review does not make quality-weighted judgments on individual studies, but highlights trends, gaps, and methodological commonalities across the evidence base.

2.3. Synthesis of Results

Extracted data were synthesized descriptively, consistent with scoping review methodology. Studies were first grouped by equipment type (diesel versus battery-electric) and then by methodological family (rule-based thresholds, supervised machine learning, deep learning, or unsupervised / semi-supervised). Within each group, we tabulated study characteristics (Table 1) and reported outcomes in their original units (e.g., classification accuracy, precision/recall, F1-scores, energy- or cycle-time errors). Where feasible, simple counts were computed (e.g., number of studies per method family, proportion using CAN versus hydraulic pressure signals) to highlight frequency of approaches. No statistical synthesis (meta-analysis) was attempted, as study heterogeneity in metrics and contexts precluded pooling. Instead, trends, gaps, and methodological commonalities were summarized narratively in Section 3, Section 4, Section 5 and Section 6, supported by descriptive tables and the Transferability Lens framework (Section 2.2).

2.4. Transferability Lens and Rationale for Hand-Picked Exemplars

Although only one peer-reviewed paper addresses operational cycle detection for underground BEVs, several heavy-duty electric platforms have begun to tackle analogous challenges (e.g., high payload variation, steep gradients, and intense auxiliary loads). To reinforce Section 4 and broaden its relevance, we include three additional studies drawn from adjacent BEV domains: a construction loader, an industrial forklift, and an articulated transit bus. These vehicles were selected because their operational profiles exhibit key parallels with mobile mining machinery, such as repeated load-transport–dump cycles, mixed-mode traction demand, stop-and-go operation, and energy recovery via regenerative braking.
Also, the search targeted cycle detection for mining equipment only; its Boolean logic deliberately excluded battery-electric automotive terms to keep the sensitivity tractable. However, one of the central questions of this review—whether methods from other BEV domains can be effectively transplanted to mining—requires illustrative evidence from outside mining. Given the plethora of terminology used to describe similar activities (e.g., cycle identification, working stage recognition, operation mode detection), a second fully optimized database search would have been prohibitively time-intensive and still risked missing relevant studies. To address this, four articles were selected through an expert hand-search, ensuring coverage of diverse yet methodologically relevant BEV contexts. These studies were chosen because they (i) report end-to-end pipelines with transparent data engineering and feature construction, and (ii) articulate evaluation metrics clearly enough to support qualitative comparison. The aim is not to prescribe a ready-made toolkit, but to narrate how state-of-the-art approaches in the automotive domain could be adapted and applied to mining.
Because no published appraisal instrument captures such a domain shift, and context alignment issues are central to this review, a purpose-designed Transferability Lens was created. Each exemplar was evaluated along three dimensions:
  • Transfer distance: near, moderate, or far, reflecting vehicle class and terrain similarity.
  • Dataset-shift type: covariate, prior-probability, concept, or mixed.
  • Context alignment: high, medium, or low overlap in operating environment layout, grade profile, and payload regime.
This lens lets readers weigh how much methodological adaptation may be necessary before a given technique can succeed in BEV mining fleets, while keeping the discussion purely narrative.

3. Operational Cycle Detection for Diesel Mobile Mining Equipment

Across the 20 included studies (19 diesel, 1 BEV), extracted study characteristics are summarized in Table 1. These include vehicle class, mining context, sensors and sampling rate, labelling approach, methodological family, dataset size, performance outcomes, and reported funding. The following subsections organize the results thematically by methodological family. In addition, a single article from the sentinel set (Lewis  [9]), not captured by the formal search, is occasionally referenced to provide methodological context. This study is not part of the included corpus and is not reflected in the PRISMA counts or tables.

3.1. Sensors, Data Processing and Feature Engineering

The effective detection of vehicular cycles in mining depends on high-quality sensor data. Mobile mining equipment captures this data through a variety of sensors onboard, with four main ’families’ dominating current diesel-based approaches. Each family provides distinct and physically meaningful signals that help distinguish between operational cycle modes.
  • Hydraulic system pressure: These sensors measure pressure fluctuations in the lift, tilt, and pump circuits of the hydraulic system. Their near-rectangular pulses clearly segment the loader cycle into phases such as loading, hauling, dumping, and transiting.
  • Driveline kinematics: This family includes gear selection, engine revolutions per minute (RPM), and ground speed sensors. These signals help infer machine intent and movement patterns, such as identifying dumping while stationary through a spike in RPM at zero speed.
  • Brake-system hydraulics: These sensors capture pressure changes in the service and retarder brake lines. The spikes in these signals serve as strong indicators of dumping or controlled descents on ramps, which aids in phase detection.
  • Auxiliary streams: This group comprises lower-rate signals, such as fuel flow and turbo boost, and higher-rate streams, such as those originating from Inertial Measurement Units (IMUs) and the Global Positioning System (GPS). These enrich cycle detection models by providing load, terrain, and location cues; especially useful when primary sensors are unavailable or noisy.
A common challenge is the mismatch in sensor sampling rates, which can complicate downstream data analysis. To ensure consistency, high-frequency sensor data is typically resampled and stored on a unified timeline. This processing step allows for standardized downstream processing, such as sliding-window segmentation for Convolutional Neural Networks (CNNs), where segment lengths can range from 30 to 120 seconds  [3]. In some high-rate vibration studies, such as  [19], even more extreme sampling rates (12.8 kilohertz) are down-sampled to align with slower sensor streams, allowing simultaneous analysis of disparate streams.
Given the noisy and highly variable conditions under which sensor data is collected, many studies introduce a data preprocessing step to mitigate noise and inconsistencies. This can involve temporal smoothing (reducing high-frequency fluctuations while preserving underlying trends), using methods such as Locally Weighted Scatter Plot Smoothing (LOWESS), Kalman filtering, or robust linear and quadratic regression  [11,17,23]. In addition to smoothing, data processing can include statistical outlier removal, where values outside of a statistically defined range are removed to improve prediction accuracy  [19,20]. Variables are frequently normalized via min-max scaling or expressed as proportions of their maximum observed values to enhance comparability between samples  [15]. Feature selection techniques are then used to reduce dimensionality, including autocorrelation-based similarity filtering  [21], exhaustive combinatorial search  [2], or ranking by importance with a Random Forest model  [18].
Once predictions are made, a final step is often employed to suppress label flips; rapid, isolated changes in predicted mode that typically arise from momentary noise or classifier uncertainty, such as a single misclassified sample between two stretches of consistent labels (e.g., five seconds of loading, a half-second of dumping followed by five seconds of loading). These include majority voting over sliding windows and finite-state filtering approaches that impose temporal consistency by modeling state transitions with memory  [9,20].

3.2. Supervised Methods

Supervised cycle detection models begin with a training set in which every slice of sensor data has been tagged as a mode (“loading”, “hauling”, “dumping,” etc.). By examining how signals behave during each tagged period, the model aims to distinguish one activity from another.

3.2.1. Expert Systems

Early operational cycle detection systems relied on single-signal thresholds: if a measurement crossed a preset limit, the system declared a mode change. Although conceptually elegant and computationally frugal, these heuristic-based models falter when faced with vibration noise, sensor failure, and ambiguous stops.
Polak  [17] pioneered this approach with a two-stage routine tailored to hydraulic-bucket pressure data sampled at 1 Hertz (Hz). First, the raw pressure trace was smoothed using a Kalman filter to suppress noise while preserving the signal edges. After filtering, a 6 Mpa threshold was applied to distinguish between full and empty bucket states. Subsequently, a variance drop detector segmented the timeline into loading, haulage, and return phases. Despite relying on a single sensor channel, this method achieved a classification accuracy of 75%.
Wodecki et al.  [24] identified noise suppression as the primary performance bottleneck. Of the methods tested, only robust linear and quadratic regressions applied over a 61-second window were able to smooth a hydraulic pressure trace into a near square-wave form, successfully recovering all 20 ground-truth cycles.
Building on this insight, Stachowiak et al.  [27] combined LOWESS smoothing with a convolution-based step detector, reaching 96% precision and recall in identifying haulage states across more than 300 cycles. However, the method still misclassified approximately one-third of the loading events.
Single-sensor systems can fail when the sensor is damaged or when multiple stoppage-like states look identical on that channel  [15]. Researchers therefore began to merge readily available variables into more comprehensive data sets.
Krot et al.  [15] compensated for a failed hydraulic pressure sensor in haul trucks by implementing a set of four signal rules. A two-stage pulse filter, applied to brake pressure, engine RPM, gear position, and travel speed, successfully identified 90% of unloading events with only 5% false positives, while also delineating complete cycle boundaries.
Śliwiński et al.  [21] analyzed 19 1 Hz sensor streams, first identifying those whose temporal patterns correlated with the hydraulic-oil-pressure channel. They then filtered to stationary periods (speed = 0, gear = 0) where fuel consumption exceeded 10% of peak. Using only three common signals—speed, gear, and throttle position—they were able to reconstruct full work cycles even when hydraulic pressure data was unavailable.
Wodecki et al.  [24] adapted rule-based segmentation to drilling rigs, applying kernel density thresholds to 10 Hz current-draw data to distinguish idle and drilling modes. In parallel, a Hilbert envelope transform of 48 kHz acoustic data was used to verify the percussion frequency. This dual-signal approach successfully segmented a full shift into 28 boreholes, and even flagged instances of incorrect drilling.
In these studies, combinations of variables (for example, ’brake engaged + neutral gear + RPM spike = unload’) act as anchor points. These anchors are then expanded into dense, sample-level annotations using simple temporal logic such as pulse counting, windowed autocorrelation function similarity, or regime-specific thresholds. The result is a fault-tolerant, light calibration pipeline capable of both online deployment and retrofitting historical datasets without manual labelling. However, even multivariate rule sets falter when operator habits or machine variants break the underlying hand-coded assumptions: Limitations that motivate a transition towards data-driven models.

3.2.2. Machine Learning

Unlike rule-based models, data-driven approaches replace hand-tuned thresholds with algorithms that learn the mapping from sensor streams to operational states; in effect, building its own set of rules. Their evolution mirrors the richness of the available data.
Timusk et al.  [2] cast loaded vs unloaded-swing detection on an excavator as a supervised task. Forty-five hours of speed–vibration data were manually labelled; time-domain & statistical features were exhaustively pruned, and even elementary classifiers (k-Nearest Neighbors, Linear Discriminant Analysis, Support Vector Machine (SVM)) reached 94% accuracy (6% error)—proof that judicious features let simple data-driven models rival rule-based heuristics.
Jakobsson et al.  [12] fed a one-dimensional CNN with 50-Hz accelerometer windows and labels derived automatically from the mass and speed of the payload. The model hit 94% accuracy, beating classic baselines without feature crafting.
Skoczylas et al.  [20] adopted a fully off-board approach in which six axis-specific auto-encoders compressed 360 Hz inertial IMU windows into low-dimensional codes. These representations were then passed to a one-dimensional Visual Geometry Group 16-layer network, a convolutional neural network (CNN) architecture widely regarded as one of the most influential and high-performing models in computer vision  [28]. Applying logical sequence rules to the raw outputs improved classification performance, yielding an accuracy of 87.7%, with 91% precision and 96% recall.
Lewis  [9] trained a compact CNN on 10 Hz telemetry from a Caterpillar LHD; camera-derived labels plus morphological and Markov smoothing lifted accuracy from 66% to 80%.
Qi et al.  [18] paired Random-Forest Feature Selection with a Bi-LSTM network on five-second Controller Area Network (CAN) snapshots from a Sandvik LHD, achieving 91.8% weighted accuracy.
Skoczylas et al.  [3] auto-searched neural network topologies that used a variety of sensor streams; hydraulic pressure peaks served as weak labels. The best CNN scored 93% unloading accuracy for haul trucks but only 57% for LHDs.

3.3. Unsupervised and Semi-Supervised Methods

A major challenge with supervised cycle detection methods is the requirement for every data point be labelled in advance (e.g. ’loading’, ’hauling’). Creating these labels is slow and difficult. Experts usually need to carefully examine sensor data, cross-check them with operational logs, and align the signals with specific events. In underground mines, this process is even harder due to rough working conditions, faulty sensors, and constant changes in the way machines operate. These issues often make reliable manual labelling unrealistic. To address these challenges, researchers have turned to alternative approaches that reduce or eliminate this burden.
Unsupervised learning methods aim to infer structure in the data without relying on preexisting labels, typically by grouping similar data points together (also known as clustering). Semi-supervised learning offers a middle ground between unsupervised and supervised learning, by leveraging a small amount of labelled data alongside a larger pool of unlabelled samples. In mining applications, this can translate to significant annotation cost savings while still maintaining classification performance.
Wyłomańska and Zimroz  [25] pioneered a label-free approach to cycle detection on diesel LHDs by monitoring a single channel: engine RPM. They computed two complementary second-moment statistics—windowed variance (R) and cumulative energy (C)—to flag “trapping events” (stationary periods) whenever both metrics fell below an empirical 50 RPM threshold. Used individually, R tended to miss extended idle periods, while C tended to over-flag short stalling events. In combination, however, they identified 95 robust events (approximately 18% of the total shift), which corresponded almost exclusively to either idling at 700 RPM or sustained full-throttle operation at 2000 RPM.
While Wyłomańska and Zimroz  [25] demonstrated that careful signal analytics can eliminate the need for manual labelling, the study also revealed two key limitations: (i) thresholds require manual tuning for each machine, and (ii) subtle or multi-phase activities become indistinguishable when relying on a single variable. To address these constraints, subsequent research has integrated unsupervised or weakly supervised machine learning with domain expertise, aiming to balance automation with interpretability.
Markham et al.  [16] illustrate the most label-frugal end of the spectrum by converting five-second GPS data from 25 haul trucks into a ten-symbol sequence that encodes vehicle speed and proximity to shovels, stockpiles, and crushers. Without supplying a single hand annotation, they fit a Hidden Semi-Markov Model (HSMM) whose transition matrix was constrained only by obvious physical rules (e.g., a truck cannot jump directly from loading to empty transit). Compared to the mine’s curated fleet management log, the HSMM recovered 99% of loading events and 91% of dumps, even uncovering 24 valid operational cycles that the official record had missed.
Rather than eliminating labels entirely, Gawelski et al.  [11] focuses on identifying one mode (unloading) with high confidence and letting that cue propagate through the data set. A compact Support Vector Machine, trained on just two labelled shifts, recognized unloading whenever vehicle speed was zero and engine RPM sat between 1200 and 2500 RPM. These unloading data points are clustered with the Density-Based Spatial Clustering of Applications with Noise (DBSCAN) algorithm to identify successive cycle boundaries; everything between two clustered unloads was treated as a full operational cycle. The result was a complete cycle trace without consulting hydraulic or brake pressure channels, which are often noisy or missing in legacy data acquisition systems.
Saari and Odelius  [19] inverted the previous workflow: they allowed the algorithm to discover latent patterns first, then injected semantic meaning. A variational Bayesian Gaussian mixture model (VBGMM) ingested millions of 12.8 kHz vibration samples, augmented with speed, and clustered them into ten groups entirely label-free. Subsequently, less than 1% of the samples received expert assigned mode labels; the group that captured most of a label inherited that operational label. With just this single minute worth of labelled data, the VBGMM achieved 100% accuracy in identifying the idling mode and produced clean, easily interpretable partitions for loading, hauling, and transiting modes.
An overview of the major semi-supervised and unsupervised approaches is covered in Table 2.

3.4. Diesel Specific Trends & Key Limitations

Early cycle detection work on diesel haulage equipment relied almost exclusively on single channels (typically hydraulic cylinder pressure) mixed with fixed thresholds or simple statistical rules  [17,25]. Over the past decade, researchers have migrated toward multivariate inputs and increasingly sophisticated learning algorithms.
“Virtual-sensor” rule sets now fuse standard electronic control unit (ECU) signals such as brake pressure, gear, engine speed, and travel speed to withstand missing hydraulic pressure sensors  [11,15], while shallow classifiers demonstrated as far back as 2009 that well-curated features enable reliable mode labelling without hand-tuned thresholds  [2]. The latest generation of papers adopts deep networks—CNNs on vibration streams  [3,12] and Bi-LSTMs on five-second CAN snapshots  [18] to capture non-linear, context-dependent dynamics. However, only 4 of the 19 diesel studies run rule-based and data-driven models side by side on a common dataset, leaving practitioners without a benchmarked answer to the question ’Which approach is best for my fleet?’
Despite this progress, LHDs remain underrepresented. Most high-quality validations still target open-pit haul trucks; when loaders appear, performance often decreases (e.g., CNN accuracy drops from 93% on trucks to 57% on loaders in  [3]). Only two vibration or multi-sensor studies address LHD directly  [18,19], highlighting a data and methodology gap for the very machines that dominate production in narrow-vein and block-cave mines.
Another consistent finding is the strong imprint of operator style on sensor signatures. Cycle duration, braking patterns, and even average RPMs per mode change with individual driving habits or changing haul routes, can erode model accuracy  [9,11]. Few papers attempt domain adaptation or style-invariant training; most simply caution that larger and more diverse datasets are needed.
The widespread fragility of hydraulic pressure sensors (frequently damaged or completely absent) has made many legacy rule-based methods inoperable, prompting a shift to more reliable ECU-derived signals such as brake pressure, engine speed, and gear selection  [13,21].
Finally, the labour-intensive nature of supervised learning remains a significant bottleneck: high-performing models often require extensive manual labelling, such as annotating 45 hours of excavator operation  [2] or frame-by-frame video analysis of underground LHDs  [9]. This annotation burden scales poorly and impedes fleet-wide deployment.

4. Battery-Electric Vehicle Operational Cycle Detection: Evidence from Mining and Lessons from the Automotive Sector

Only one peer-reviewed study specific to mining BEVs met the eligibility criteria. Its characteristics (vehicle type, mine setting, sensor sources, method, data set size, and results) are included in Table 1. Because no formal critical evaluation was performed, the findings of this study are descriptively reported alongside three heavy-duty BEV analogues to contextualize the methodological approaches and highlight transferability considerations.

4.1. Unique Challenges of BEV Duty Cycles

Battery electric vehicles (BEVs) exhibit operational cycle behaviour that differs fundamentally from that of internal combustion engine vehicles due to their electric motors, regenerative braking capability, and auxiliary loads found in off-highway machinery. These differences compel the development of BEV-specific cycle definitions.
BEV operational cycles introduce complexities that render many diesel-based techniques insufficient or misleading. Unlike diesel vehicles, BEVs feature the following:
  • Aggressive speed transients: Instantaneous peak torque enables sharper accelerations and decelerations. BEV acceleration phases can be up to 26% longer, and with 18% higher magnitude, than comparable ICE phases—leaving less time for steady cruising and complicating phase detection  [29].
  • Regenerative-braking distortion: Deceleration profiles are structurally different due to regenerative braking. These introduce negative power spikes and longer braking windows that alter the temporal features classifiers must learn to recognize  [8,29].
  • Load asymmetry and State of Charge (SoC) variability: BEVs suffer from power derating under low battery or high temperature, making the same task look different in different contexts (a major challenge for supervised models that assume consistency).
Given these challenges, BEV cycle detection algorithms must not only infer vehicle activity but also do so under conditions of high variability, noisy power signatures, and sensor inconsistency. Mining-specific research in the BEV domain remains extremely sparse, with only one dedicated study identified through the database search.

4.2. Electric Haul-Truck Duty-Cycle Classification

Zhang et al.  [26] provide the only retrieved and published attempt to model a battery-electric, mining truck cycle directly from onboard telemetry. Working with a 220 tonne electric-drive haul truck on a 3.5 km open–pit route–two short ramps, one long incline, and a compacted-gravel surface with an estimated 3% rolling resistance, the authors captured six complete load-haul-return cycles, plus an additional idle transfer. These cycles were distilled into a single 1 500-second “representative” profile and then subdivided it into 146 fixed, 10-second windows, each described by 10 energy–relevant statistics that included speed, traction-power ratio and average road grade.
The resulting 146 by 10 feature matrix was standardized and reduced with Principal-Component Analysis (PCA). In this three-dimensional space, the Density-Peak Clustering algorithm uncovered three clear behavioural groups: high-power loaded hauling (C1), near-zero-power idling or coasting (C2) and high-speed dynamic braking return runs (C3).
To reconstruct a realistic cycle, the researchers fixed the idle share at roughly 170 seconds, then scaled the occurrences of C1 and C3 to preserve the measured loaded-haul/empty-return distance ratio. The final template comprises 930 seconds of loaded haul, 170 seconds of idle, and 400 seconds of regenerative return, covering 3.4 km loaded and 3.25 km empty-figures that align almost perfectly with the original GPS data. Speed, power, and grade traces of the synthetic cycle mirrored field statistics so closely that the authors deemed the reconstruction “strongly reflective” of real operation.
However, its scope is deliberately narrow: a single vehicle, one transport profile, and fixed length windows leave unanswered questions about generalization and the ability to deploy the approach in the field. These gaps underscore how emerging BEV operational cycle research remains compared to the more mature diesel literature.

4.3. Adjacent heavy-duty BEV studies

Although only one peer-reviewed study focusing specifically on underground BEVs was identified, this review also examines three additional operational cycle detection studies from non-mining BEV domains. These works are included not to prescribe ready-made solutions, but to illustrate how cycle detection techniques have been applied in contexts that share key operational characteristics with mining BEVs, such as heavy-duty workloads, terrain variability, and prevalent regenerative braking.
Several heavy-duty electric cycle detection articles have begun to tackle analogous challenges: high payload variation, steep gradients, and intense auxiliary loads. The three studies are summarized in Table 3.
Ren et al.  [30] begin with the classic “V-pattern” of construction loader work. After cleaning 20 CAN-logged cycles, they segment data by gear, speed, and hydraulic–pressure gradients, compress ten variables into three principal components, and then cluster 200 segments with K-means. Representative segments nearest each centroid are concatenated and scaled, yielding a synthetic cycle whose simulated energy demand differs from field tests by only 0.01 kWh—proof that mass variation and shovel-load peaks must be hard-wired into BEV loader cycles.
Tong and Guan  [31] address the challenge of a forklift’s constantly changing cargo weight. They process three months of 50 Hz telemetry by filtering it into 11,595 micro-trips, applying PCA for dimensionality reduction, and clustering the results. These clusters are then sequenced using a double-layer Markov chain—an 18 × 18 transition-probability matrix (TPM) at the macro-state level, paired with velocity–acceleration TPMs at the micro-state level. A genetic algorithm further refines the sequence until 13 statistical performance metrics match the ground truth within 1
Tong and Ng  [32] extends the micro-trip idea to electric buses on steep urban routes. GPS data is grouped into downhill, flat and uphill modes; gradient–sensitive vehicle-specific power is computed; and sub-cycles are concatenated until weekday and weekend profiles match 13 speed acceleration descriptors within 10%. The resulting Electric-Bus Driving Cycles with Road Gradient (EBDCRG) expose how continuous 6% slopes dampen aggressive driver inputs, paralleling the ramp effects faced by underground BEVs.
Crucially, each study isolates one mining-relevant complication: mass change, payload change, or steep gradients. Cycle detection systems for mining BEVs, particularly underground mining BEVs, must accommodate all three simultaneously. The techniques above provide a starting toolkit, but a comprehensive mining solution will require fusing mass, gradient, and payload-aware features.

4.4. Emerging Trends and Limitations

Although only four heavy-duty BEV studies are reviewed, a converging workflow emerges. All reject passenger vehicle operational cycles in favour of vehicle and context-specific templates that capture the dominant mechanical driver of energy use (whether it is shovel resistance, cargo mass, road slope, or haul/return asymmetry). Continuous telemetry is first chopped into short kinematic strokes or micro-trips, then passed through PCA, which typically compresses a dozen raw variables into three axes explaining >80% of the variance. Clustering (usually K-means, though  [26] employs Density–Peak and [31] fuse a double-layer Markov model with a genetic algorithm) labels these segments, after which representative windows are concatenated into a synthetic cycle. Fidelity is judged quantitatively: loader and forklift cycles reconstructed in a simulated environment only deviate <5% from measured energy use  [30,31], setting an informal benchmark for future work.
The same papers also expose persistent limitations of current BEV operational cycle detection techniques. Each cycle is tightly bound to a single machine, duty pattern, or route (i.e., one Hong Kong bus line, one V-pattern loading task, one representative haul), so transferability remains untested. Dataset sizes are modest, raising questions about statistical representativeness. Selective simplifications creep in, such as omitting lift-lower episodes in forklifts or passenger load in buses, potentially biasing energy estimates. Validation practices are also heterogeneous: while most report error rates, the haul-truck study by Zhang et al.  [26] rely on qualitative “good agreement”, underscoring the need for standard metrics across platforms.

5. Cross-Domain Transferability

Advancing operational cycle detection for battery electric mobile mining vehicles could benefit from techniques developed within the automotive domain. This section descriptively explores these cross-domain methods using a structured Transferability Lens, which evaluates three criteria: transfer distance, indicating similarity in vehicle and terrain; dataset shift, reflecting differences in data distributions; and context alignment, assessing environmental similarity (high, medium, or low). This framework clarifies the adaptation effort necessary for effective method transfer. In particular, all four automotive studies rely on unsupervised clustering pipelines, reflecting a broader trend in passenger electric vehicle cycle detection research toward data-driven discovery rather than supervised labelling. A summary of the lens application to each article is presented in Table 4 below.
Berzi et al.  [33] proposed a methodology to generate representative electric vehicle driving cycles for Florence using micro-trip clustering techniques. Their unsupervised approach used CAN bus and GPS signals collected at 4 Hz from approximately 2,500 km of data that spanned 13 electric vehicles. Key metrics included performance values, energy consumption accuracy, and Speed-Acceleration Probability Density comparisons. Through the transferability lens, the approach has a moderate transfer distance due to city-specific driving patterns, a covariate dataset shift from location-bound differences, and medium context alignment since urban conditions differ notably from mining environments. Adaptation would require medium effort for sensor mapping, low effort for retraining (due to procedural nature), and low effort for feature re-engineering. This method is promising, but it needs additional work.
Jing et al.  [34] introduced an innovative hierarchical clustering pipeline to address the limitations inherent to K-means clustering in electric vehicle cycle design. Their method processed GPS and On-Board Diagnostics (OBD) data sampled at 1 Hz, covering 1,162 micro-trips from a single BEV in China. It involved wavelet denoising, extracting fifteen kinematic features, applying PCA and agglomerative hierarchical clustering. The evaluation considered relative error in characteristic features, power efficiency simulations, and similarity of the velocity acceleration matrix. Under the transferability lens, the method has a moderate transfer distance due to region-specific data, covariate shifts from varying vehicle and traffic conditions, and medium context alignment owing to sparse environmental details. The adaptation effort across sensor mapping, retraining, and feature engineering would be low, positioning the approach as promising but requiring further development.
Kreutz et al.  [35] demonstrated a significant advancement in discovering common driving events from vehicle CAN data using a self-supervised learning approach combined with clustering. Using Tesla Model 3 data initially sampled at 200 Hz and resampled to 10 Hz, the authors applied various neural network encoders (such as Drive2Vec  [37], followed by clustering algorithms to segment driving data into meaningful events. The method’s effectiveness was evaluated against manually annotated ground-truth events. This approach is assessed to have a moderate transfer distance due to differences between passenger BEVs and mining BEVs, covariate shift from varied power train signals, and medium context alignment given general road versus underground settings. A medium effort would be needed in sensor mapping and retraining, while a feature engineering effort would be low. The approach shows promise, particularly in addressing manual annotation difficulties and in reducing sampling bias through its automated segmentation.
Wang et al.  [36] developed a typical urban driving cycle for BEVs in Xi’an, China, using kernel principal component analysis (KPCA) coupled with K-means and Random Forest clustering techniques. Data collection employed GPS, OBD, and VBOX sensors at 1 Hz, resulting in 1,414 micro-trips from one week’s operation of BEVs. Their unsupervised method featured fourteen kinematic parameters, KPCA dimension reduction, and refined clustering. The validation included cluster validity metrics, relative errors, and comparisons against standard legislative cycles. Evaluated through the transferability lens, this method possesses a moderate transfer distance due to the specificity of urban driving in the city of Xi’an, covariate data set shifts driven by localized traffic and driver behaviour, and medium context alignment. Adaptation efforts in sensor mapping, retraining, and feature engineering would be low, categorizing it as promising but requiring further evaluation and validation in mining applications.

6. Discussion

This review addressed the overarching question of which methods have been applied to detect operational cycles in mobile mining equipment, how methodological assumptions differ, and how transferable these approaches are across domains. In relation to the objectives set out in Section 1, the evidence synthesis shows that: (i) diesel studies have evolved from rule-based thresholds to multivariate deep learning architectures, (ii) the nascent BEV literature — both mining and heavy duty analogs favor unsupervised clustering pipelines with PCA-based compression, and (iii) significant gaps remain around open datasets, evaluation standards, and readiness for deployment. These findings inform both methodological practice and future research directions.

6.1. Trends in Operational Cycle Detection

Four overarching trends in operational cycle detection methodologies have been identified.
  • Shift from Thresholds to Learned Representations: Across both diesel and BEV platforms, there is a clear progression from hand-crafted rule sets to learned representations. Diesel studies have moved from single-variable and threshold-based, to supervised deep learning architectures such as CNNs and Bi-LSTMs  [3,18]. Similarly, BEV studies employ PCA-based feature compression and clustering pipelines that allow for flexible, data-driven phase discovery without predefined thresholds  [30,31].
  • Emergence of Modular, Pipeline-Oriented Architectures: A common architectural pattern is becoming apparent: segmentation, then dimensionality reduction, then clustering or classification, ending with post-processing or synthesis. This modular structure is evident in both unsupervised and supervised workflows, including  [21] for diesel and  [26,30] for BEVs. It offers a flexible foundation for adapting classifiers across platforms and signal types.
  • Toward Quantitative, Simulation-Based Validation: Earlier work often reported only qualitative agreement or raw cycle counts. Recent studies are trending toward more standardized, simulation-based validation: diesel classifiers are now evaluated using segment-level precision and recall  [9,18], while BEV studies benchmark reconstructed cycles using energy-consumption errors < 5%  [30,31]. This shift improves comparability and promotes methodological rigour.
  • Vehicle and Context Specific Operational Cycle Design: Diesel and BEV cycle detection pipelines are increasingly tailored to the operating conditions and mechanical realities of specific vehicle classes. Diesel studies differentiate loaders from haul trucks in both signal use and model architecture  [3,18], while BEV research encodes domain-specific constraints such as gradient bins  [32], shovel-resistance  [30] or payload mass  [31]. This marks a clear departure from generalized or automotive-style operational cycles.

6.2. Cross-domain Lessons

Recent passenger BEV duty-cycle literature increasingly adopts unsupervised and self-supervised methods, predominantly relying on clustering of raw telemetry data to identify recurring operational patterns without costly labels. Approaches range from classic partitioning methods, such as K-means, to advanced embedding-based clustering techniques. Although effective in generating representative cycles for on-road BEVs, the key unresolved challenge for underground mining BEVs remains: translating statistically derived clusters into specific and operationally meaningful activities. Currently, this critical mapping step is mainly performed manually, limiting the transition from descriptive analytics to actionable insights in mining operations.
Also, the four automotive studies demonstrated that algorithmic robustness is governed as much by hyperparameter choice as by model architecture. In future mining BEV cycle identification studies, the first step should therefore be a rapid global sensitivity analysis to isolate the most important parameters before committing to exhaustive tuning. Systematic ablation studies, largely absent from the mining literature, can then clarify which signals and design choices actually drive performance. Road vehicle research underscores the stakes. Jing et al. [34] showed that K-means is acutely sensitive to cluster count and random seeding; switching to agglomerative clustering delivered policy-coherent speed regimes without an onerous grid search. Kreutz et al. [35] demonstrated that window length and embedding dimension choice directly affect unsupervised event discovery, with dimensions of 10-20 and windows of 5-15 samples found to be optimal. Together, these findings advocate for a disciplined, empirically grounded hyper-parameter workflow in mining deployments.
Finally, while Markov chain-based approaches appear to be an attractive modelling choice, their practical limitations—especially around scalability and reproducibility—become apparent as both dataset size and system complexity grow. Wang et al.  [36] achieved a plausible urban BEV cycle using a Markov model, yet replication proved tenuous and computational costs escalated as state–space complexity grew, motivating a shift toward lighter PCA and clustering pipelines. Earlier safeguards proposed by Tong and Guan  [31] (state-space pruning, transition-probability regularization, and validation against held-out trips) remain instructive. For mining BEVs, where cycle modes change abruptly and data volumes are large, either reinstating these robustness measures or abandoning the Markov framework may be prudent. Ultimately, method selection should account for scalability and reproducibility, ensuring that results generalize across fleets and mine sites.

6.3. Research Gaps and Limitations

Several significant limitations remain unaddressed. A critical data-related gap is evident in the lack of publicly available datasets for mobile mining machinery, starkly contrasting the automotive industry, which benefits from numerous open datasets and standardized benchmarks  [38,39]. This shortage hampers reproducibility, prevents meaningful comparative analyzes, and limits the engagement of the larger research community.
Inconsistencies in metrics and evaluation practices also present significant hurdles. No standardized duty cycles currently exist for specific classes of mining vehicles, and even among identical machine types, the authors diverge in defining precise operational states and transition points. For example, when defining LHD operational cycles, ambiguity often arises around transitions between loading and loading modes due to overlapping mode signals.
From a modelling perspective, the potential of semi-supervised learning approaches remains significantly under utilized, despite their promise in addressing label scarcity and leveraging large volumes of unlabelled operational data.
Moreover, the application of explainable machine learning techniques is notably absent from existing research; methods such as SHAP values for interpretability  [40], have not been explored within published cycle detection studies, representing a critical research gap that could otherwise enhance practical adoption of current models.
Finally, substantial deployment challenges persist, marked by a notable gap between research demonstrations and production-ready, real-time cycle detection systems (only 3 out of the 20 cycle detection papers found through the search could be considered as evaluated in real time). Addressing real-world constraints, such as computational resource limitations, sensor noise, and latency requirements, is essential to transition promising research results into robust and reliable tools that mining operators can practically adopt and integrate into existing fleet management and maintenance workflows.
Limitations of the review process: Beyond the field-level gaps identified above, the review process itself carries limitations. Only one bibliographic database (Lens) was searched, which may have excluded relevant studies indexed elsewhere. The review was limited to English-language publications, and all screening and data extraction was carried out by a single reviewer, which introduces potential selection bias. To mitigate these risks, backward and forward citation chasing of sentinel papers and expert hand-searching of BEV exemplars were performed. However, it remains possible that some relevant studies were missed.

6.4. Future Research Opportunities

The primary barrier limiting progress in the detection of mobile mining equipment operational cycle is the absence of open data sets, preventing meaningful comparison between studies. Developing and releasing a mining cycle identification benchmark data set (similar in style to the Turbofan Engine Degradation Simulation Data Set provided by NASA  [41], pairing annotated CAN and inertial streams with clear metrics would enable consistent evaluations and facilitate direct comparison of methodologies.
Expanding research into unsupervised, semi-supervised, and self-supervised learning techniques (similar to the push seen in driving cycle literature for passenger vehicles) presents a promising opportunity. For instance, adopting techniques inspired by natural language processing (such as the Double Articulation Analyser method  [42]) could help better identify and characterize operational modes without extensive manual labelling.
Finally, there is considerable value in moving toward deployment-focused research, involving models tested in real-life operational settings. Future work could explore reinforcement learning-based post-processing techniques  [43] to continuously refine the models initially trained offline, as well as the development and validation of real-time data pipelines. Incorporating lightweight, latency-aware model architectures, such as those demonstrated in Tiny-scale Machine Learning anomaly detection applications  [1], could significantly enhance model suitability by allowing models to be deployed onto mobile mining equipment.

7. Conclusions

This review charted the evolution of operational cycle detection for mobile mining equipment, tracing the field’s shift from single-sensor thresholds to multivariate, machine learning-based pipelines for diesel fleets, and examining the nascent literature on battery-electric mining vehicles. By applying a purpose-built three-axis Transferability Lens, we also gauged how state-of-the-art automotive BEV techniques might be adapted to mobile mining equipment. In doing so, the paper fulfills its stated objectives: (i) synthesizing and contrasting diesel and BEV methodologies, (ii) evaluating the cross-domain applicability of non-mining BEV approaches, and (iii) exposing critical gaps—including the scarcity of open datasets, limited use of semi-/self-supervised learning, and the need for real-time, edge-ready solutions. Addressing these gaps will accelerate robust, easily deployed cycle detection systems for next-generation battery-electric mining fleets.

Supplementary Materials

The following supporting information can be downloaded at the website of this paper posted on Preprints.org.

Author Contributions

Conceptualization, A.M.d.C.; methodology, A.M.d.C.; software, A.M.d.C.; validation, A.M.d.C., M.T. and M.-C.L.; formal analysis, A.M.d.C.; investigation, A.M.d.C.; resources, M.-C.L.; data curation, A.M.d.C.; writing—original draft preparation, A.M.d.C.; writing—review and editing, A.M.d.C., M.T. and M.-C.L.; visualization, A.M.d.C.; supervision, M.T. and M.-C.L.; project administration, A.M.d.C.; All authors have read and agreed to the published version of the manuscript.

Funding

This research received no external funding. As there was no external funding, there was no funder involvement in the design, data collection, analysis, decision to publish, or manuscript preparation. Funding and conflict-of-interest declarations for each included study are provided in Supplementary Table S1.

Data Availability Statement

No new data were created or analyzed in this study. Data sharing is not applicable to this article.

Acknowledgments

During the preparation of this manuscript, the authors used ChatGPT (OpenAI, models GPT-4o, GPT-4.5, and o3) to assist with study design and the initial drafting of text, and employed NotebookLM (Google, July 2025 release) to aid in the exploratory analysis and interpretation of literature-derived data. The authors have reviewed and edited all AI-generated output and take full responsibility for the content of this publication.

Conflicts of Interest

The authors declare no conflicts of interest.

Abbreviations

    The following abbreviations are used in this manuscript:
BEV Battery-Electric Vehicle
CAN Controller Area Network (vehicle data bus)
CNN Convolutional Neural Network
DBSCAN Density-Based Spatial Clustering of Applications with Noise
ECU Electronic Control Unit
GPS Global Positioning System
VBGMM Variational Bayesian Gaussian Mixture Model
HSMM Hidden Semi-Markov Model
IMU Inertial Measurement Unit
KPCA Kernel Principal Component Analysis
LHD Load–Haul–Dump (vehicle)
LOWESS Locally Weighted Scatterplot Smoothing
LSTM Long Short-Term Memory network
Bi-LSTM Bidirectional Long Short-Term Memory network
OBD On-Board Diagnostics
PCA Principal Component Analysis
PRISMA-ScR Preferred Reporting Items for Systematic Reviews and Meta-Analyses – Scoping Review extension
RPM Revolutions Per Minute
SVM Support Vector Machine
SoC State of Charge (battery)
TPM Transition Probability Matrix

Appendix A. Search Strategy

The full Lens query executed on 27 June 2025 was:
year_published:[2000 TO 2025] AND
("duty cycle" OR "work cycle" OR "haulage cycle" OR
 "load-haul cycle" OR "machine cycle" OR "operating mode" OR
 "machine state" OR "regime detection" OR
 "cycle segmentation" OR "cycle identification" OR
 "state detection" OR "state recognition" OR
 "usage characterisation") AND
(loader* OR truck* OR haul* OR "load haul dump" OR LHD* OR
 scooptram* OR bogger* OR "wheel loader" OR vehicle* OR machine*) AND
(abstract:(mining OR underground OR "surface mine") OR
 title:(mining OR underground OR "wheel loader" OR "load haul dump"
 OR LHD*))
 NOT ("urban driving cycle" OR "traffic cycle")

References

  1. Fuente, R.d.l.; Radrigan, L.; Morales, A.S. Enhancing Predictive Maintenance in Mining Mobile Machinery through a TinyML-enabled Hierarchical Inference Network, 2024. arXiv:2411.07168 [cs] version: 1. [CrossRef]
  2. Timusk, M.; Lipsett, M.G.; McBain, J.; Mechefske, C.K. Automated Operating Mode Classification for Online Monitoring Systems. Journal of Vibration and Acoustics 2009, 131, 041003–. Section: 0. [CrossRef]
  3. Skoczylas, A.; Rot, A.; Stefaniak, P.; Śliwiński, P. Haulage Cycles Identification for Wheeled Transport in Underground Mine Using Neural Networks. Sensors (Basel, Switzerland) 2023, 23, 1331–1331, Section: 0. [Google Scholar] [CrossRef] [PubMed]
  4. Karimi, G.; Masih-Tehrani, M.; Pourbafarani, Z. Development of Wheel Loader Duty Cycle Using Hybrid Markov Chain and Genetic Algorithm. SAE International Journal of Commercial Vehicles 2021, 15, 51–64. [Google Scholar] [CrossRef]
  5. Xiao, W.; Liu, M.; Chen, X. Research Status and Development Trend of Underground Intelligent Load-Haul-Dump Vehicle—A Comprehensive Review. Applied Sciences 2022, 12. [Google Scholar] [CrossRef]
  6. Long, M.; Schafrik, S.; Kolapo, P.; Agioutantis, Z.; Sottile, J. Equipment and Operations Automation in Mining: A Review. Machines 2024, 12. [Google Scholar] [CrossRef]
  7. Epiroc AB. Epiroc wins large order for battery-electric vehicles for Canadian gold and copper mine. Press release, 2025. Ordered BEV versions of Boomer M20 SG, Scooptram ST18 SG, Scooptram ST14 SG and Minetruck MT42 SG for Hudbay Minerals’ Lalor mine; order booked Q1 2025 and valued at MSEK 100.
  8. Beltrami, D.; Iora, P.; Tribioli, L.; Uberti, S. Electrification of Compact Off-Highway Vehicles—Overview of the Current State of the Art and Trends. Energies 2021, 14, 5565. Number: 17 Publisher: Multidisciplinary Digital Publishing Institute. [CrossRef]
  9. Lewis, D. Machine Learning Approach to Underground Load Haul Dump Cycle Segmentation. Final Report 2018. [Google Scholar]
  10. Ouzzani, M.; Hammady, H.; Fedorowicz, Z.; Elmagarmid, A. Rayyan—a web and mobile app for systematic reviews. Systematic Reviews 2016, 5, 210. [Google Scholar] [CrossRef] [PubMed]
  11. Gawelski, D.; Jachnik, B.; Stefaniak, P.; Skoczylas, A. ICCCI (CCIS Volume) - Haul Truck Cycle Identification Using Support Vector Machine and DBSCAN Models 2020. pp. 338–350. Place: Germany Publisher: Springer International Publishing Section: 0. [CrossRef]
  12. Jakobsson, E.; Frisk, E.; Krysander, M.; Pettersson, R. Automated Usage Characterization of Mining Vehicles For Life Time Prediction. IFAC-PapersOnLine 2020, 53, 11950–11955, Section: 0. [Google Scholar] [CrossRef]
  13. Koperska, W.; Skoczylas, A.; Stefaniak, P. ICCCI (CCIS Volume) - A Simple Method of the Haulage Cycles Detection for LHD Machine. 2020. pp. 326–337. Place: Germany Publisher: Springer International Publishing Section: 0. [CrossRef]
  14. Kozłowski, T.; Michalak, A.; Zimroz, R.; Sliwinski, P.; Kaniewski, T. An Algorithm for Determining Unloading Cycles in Dump Truck. IOP Conference Series: Earth and Environmental Science 2019, 362, 012111–. Section: 0. [CrossRef]
  15. Krot, P.; Sliwinski, P.; Zimroz, R.; Gomolla, N. The identification of operational cycles in the monitoring systems of underground vehicles. Measurement 2020, 151, 107111–. Section: 0. [CrossRef]
  16. Markham, G.; Seiler, K.M.; Balamurali, M.; Hill, A.J. Load-Haul Cycle Segmentation with Hidden Semi-Markov Models - 2022 IEEE 18th International Conference on Automation Science and Engineering (CASE). 2022 IEEE 18th International Conference on Automation Science and Engineering (CASE) 2022, pp. 447–454. Publisher: IEEE Section: 0. [CrossRef]
  17. Polak, M. IDENTIFICATION OF LOADING PROCESS BASED ON HYDRAULIC PRESSURE SIGNAL - SGEM International Multidisciplinary Scientific GeoConference EXPO Proceedings. SGEM International Multidisciplinary Scientific GeoConference EXPO Proceedings 2016. Publisher: Stef92 Technology Section: 0. [CrossRef]
  18. Qi, Z.; Gu, Q.; Meng, Y.; Bai, G.; Ding, D. The load-haul-dump operation cycle recognition based on multi-sensor feature selection and bidirectional long short-term memory network. Measurement and Control 2023, 56, 1523–1533, Section: 0. [Google Scholar] [CrossRef]
  19. Saari, J.; Odelius, J. Detecting operation regimes using unsupervised clustering with infected group labelling to improve machine diagnostics and prognostics. Operations Research Perspectives 2018, 5, 232–244, Section: 0. [Google Scholar] [CrossRef]
  20. Skoczylas, A.; Stefaniak, P.; Anufriiev, S.; Koperska, W. Deep Learning for Ore Haulage Monitoring: Vibrational Analysis Using a VGG16 Network. IEEE Access 2025, 13, 33138–33147, Section: 0. [Google Scholar] [CrossRef]
  21. Śliwiński, P.; Andrzejewski, M.; Kaniewski, T.; Hebda-Sobkowicz, J.; Zimroz, R. Mining Goes Digital - Selection of variables acquired by the on-board monitoring system to determine operational cycles for haul truck vehicle 2019. pp. 525–533. Publisher: CRC Press Section: 0. [CrossRef]
  22. Stefaniak, P.; Zimroz, R.; Obuchowski, J.; Sliwinski, P.; Andrzejewski, M. An Effectiveness Indicator for a Mining Loader Based on the Pressure Signal Measured at a Bucket’s Hydraulic Cylinder. Procedia Earth and Planetary Science 2015, 15, 797–805, Section: 0. [Google Scholar] [CrossRef]
  23. Wodecki, J.; Michalak, A.; Stefaniak, P. Review of smoothing methods for enhancement of noisy data from heavy-duty LHD mining machines. E3S Web of Conferences 2018, 29, 00011–. Section: 0. [CrossRef]
  24. Wodecki, J.; Góralczyk, M.; Krot, P.; Ziętek, B.; Szrek, J.; Worsa-Kozak, M.; Zimroz, R.; Śliwiński, P.; Czajkowski, A. Process Monitoring in Heavy Duty Drilling Rigs—Data Acquisition System and Cycle Identification Algorithms. Energies 2020, 13, 6748–. Section: 0. [CrossRef]
  25. Wyłomańska, A.; Zimroz, R. Signal segmentation for operational regimes detection of heavy duty mining mobile machines – a statistical approach 2014. Section: 0.
  26. Zhang, X.; Wang, S.; Zhang, W. Research of Driving Cycle Construction for Electric Drive Mining Truck Based on Travelling Analysis Method 2018. pp. 117–126. Place: Germany Publisher: Springer Singapore Section: 0. [CrossRef]
  27. Stachowiak, M.; Koperska, W.; Jachnik, B.; Stefaniak, P. TRACKING OPERATION REGIMES OF THE LHD MACHINES BASED ON HYDRAULIC SIGNAL SIGNAL SMOOTHING ISSUES - SGEM International Multidisciplinary Scientific GeoConference EXPO Proceedings. SGEM International Multidisciplinary Scientific GeoConference EXPO Proceedings 2020, 20, 383–394. Publisher: STEF92 Technology Section: 0. [CrossRef]
  28. Simonyan, K.; Zisserman, A. Very Deep Convolutional Networks for Large-Scale Image Recognition, 2015, [arXiv:cs.CV/1409.1556].
  29. Ye, Y.; Zhao, X.; Zhang, J. Driving cycle electrification and comparison. Transportation Research Part D: Transport and Environment 2023, 123, 103900. [Google Scholar] [CrossRef]
  30. Ren, H.; Xu, M.; Lin, T.; Chen, Q.; Cai, S.; Guo, T. Working cycle condition construction for electric wheel loader based on principal component analysis and cluster analysis. Proceedings of the Institution of Mechanical Engineers, Part D: Journal of Automobile Engineering 2024, 238, 2905–2919, Section: 0. [Google Scholar] [CrossRef]
  31. Tong, Z.; Guan, S. Developing high-precision battery electric forklift driving cycle with variable cargo weight. Transportation Research Part D: Transport and Environment 2024, 136, 104443–104443, Section: 0. [Google Scholar] [CrossRef]
  32. Tong, H.Y.; Ng, K.W. Developing electric bus driving cycles with significant road gradient changes: A case study in Hong Kong. Sustainable Cities and Society 2023, 98, 104819. [Google Scholar] [CrossRef]
  33. Berzi, L.; Delogu, M.; Pierini, M. Development of driving cycles for electric vehicles in the context of the city of Florence. Transportation Research Part D: Transport and Environment 2016, 47, 299–322. Publisher: Elsevier BV. [CrossRef]
  34. Jing, Z.; Wang, T.; Zhang, S.; Wang, G. Development Method for the Driving Cycle of Electric Vehicles. Energies 2022, 15, 8715. [Google Scholar] [CrossRef]
  35. Kreutz, T.; Esbel, O.; Mühlhäuser, M.; Guinea, A.S. Unsupervised Driving Event Discovery Based on Vehicle CAN-data. 2022, pp. 4169–4174. arXiv:2301.04988 [cs]. [CrossRef]
  36. Wang, L.; Ma, J.; Zhao, X.; Li, X. Development of a Typical Urban Driving Cycle for Battery Electric Vehicles Based on Kernel Principal Component Analysis and Random Forest. IEEE Access 2021, 9, 15053–15065. [Google Scholar] [CrossRef]
  37. Hallac, D.; Bhooshan, S.; Chen, M.; Abida, K.; Sosic, R.; Leskovec, J. Drive2Vec: Multiscale State-Space Embedding of Vehicular Sensor Data, 2018, [arXiv:cs.LG/1806.04795].
  38. Walkowicz, K.; Kelly, K.; Duran, A. Fleet DNA; National Renewable Energy Laboratory, 2014.
  39. Lustbader, J.; Kotz, A. Medium- and Heavy-Duty Truck Duty Cycles, 2025. [CrossRef]
  40. Lundberg, S.; Lee, S.I. A Unified Approach to Interpreting Model Predictions, 2017, [arXiv:cs.AI/1705.07874].
  41. Saxena, A.; Goebel, K. Turbofan Engine Degradation Simulation Data Set. NASA Prognostics Data Repository, NASA Ames Research Center, Moffett Field, CA, 2008. Accessed: 2025-08-05.
  42. Takenaka, K.; Bando, T.; Nagasaka, S.; Taniguchi, T.; Hitomi, K. Contextual scene segmentation of driving behavior based on double articulation analyzer. In Proceedings of the 2012 IEEE/RSJ International Conference on Intelligent Robots and Systems, Vilamoura-Algarve, Portugal, 2012; pp. 4847–4852. [CrossRef]
  43. Radac, M.B.; Chirla, D.P. Near real-time online reinforcement learning with synchronous or asynchronous updates. Scientific Reports 2025, 15, 17158. [Google Scholar] [CrossRef] [PubMed]
Figure 1. PRISMA-ScR flow diagram illustrating the literature search and screening process.
Preprints 174307 g001
Table 1. Per-study results aligned to the review questions.
Study (Author–Year) Population / Platform Method & Signals Data & Validation Outcomes
Gawelski et al., 2020  [11] Haul trucks (diesel) SVM + DBSCAN on 1 Hz CAN (SPEED, ENGRPM, SELGEAR, BRAKEP, FUELS); 5 s MA; HYDOILP used only for training prep. ∼10 shifts; compared to HYDOILP-based algorithm and manual counts. Agreement with HYDOILP/operator logs; event-detection reliability ∼90%.
Jakobsson et al., 2020  [12] Mine truck (earthmoving) CNN (vs SVM/RF/KNN/MLP) on 3-axis accelerometer (50 Hz); fixed 2 s windows; auto labels from metadata (payload, speed). Weeks of data; train 3,016/class; oversampled 204,527/class; 80/20 split; Butterworth post-filter. Balanced test: accuracy >96%; per-mode TPR: Idle 0.93, Hauling 0.97, Empty 0.95, Loading 0.95, Unloading 0.94.
Karimi et al., 2021  [4] Wheel loader (Komatsu WA470) Hybrid Markov chain + GA; K-means; smartphone GPS. ∼80,000 points; χ 2 consistency; ADVISOR simulation vs EPA/EU cycles. Constructed cycles consistent; evaluation via fuel/emissions (no classifier accuracy).
Koperska et al., 2020  [13] LHD (wheel loader) Convolution of smoothed HYDOILP (1 Hz from 100 Hz) with inverted step; LOWESS + variants. 5 working days; >300 cycles; confusion matrix. Overall acc. 96%; “driving full” sens./prec. ∼98.7%/97.5%; loading sens. 67.6%, prec. 99.5%.
Kozlowski et al., 2019  [14] Dump truck Thresholds on ENGRPM+BRAKEP; HYDOILP for verification. 3 test sets (10/40/47 events). Unloading feasible without HYDOILP; reliability ∼90% (limited metrics).
Krot et al., 2020  [15] Underground haul trucks Rule-based “virtual sensor” using BRAKEP, SELGEAR, SPEED, ENGRPM (1 Hz); HYDOILP ref. 15 Hz for tuning. 3 sets; 97 unloading events; cross-set robustness. Detection ∼90%; false positives ∼5%; suitable for online/post.
Markham et al., 2022  [16] Haul truck (open-pit) HSMM (unsupervised) on GPS position/velocity (5 s); Viterbi/EM; FMS for validation. 25 trucks ∼24 h; manual subset of 24 cycles; precision/recall. Load P/R 95.1/98.8%; Dump 87.1/91.1%; Cycle 86.7/90.8%.
Polak et al., 2016  [17] Loader Kalman smoothing + statistical break detection on bucket-cylinder pressure (1 Hz). 2 days; 172,800 samples; 207 cycles; manual regime marks. Accuracy: Unloading 74.4%, Driving full 75.9%, Driving empty 80.2%.
Qi et al., 2023  [18] LHD (Sandvik LH514) RF feature selection + Bi-LSTM; baselines VBGM/SVM/RF/LSTM on multi-sensor (20 params @ 5 s; 5 real-time). Operational LHD data; weighted/per-mode F1. Weighted F1 = 91.75%; per-mode F1: Load 0.95, Haul 0.95, Dump 0.83, Transit 0.87.
Saari & Odelius, 2018  [19] Underground LHD (LH621) Unsupervised VBGM on vibration (12.8 kHz) + Cardan speed (5 s). 3 full days; cluster–label “infection” with small manual set; convergence across days. Reasonable separation of regimes; loading prominent; limited quantitative metrics.
Skoczylas et al., 2023  [3] Haul trucks; loaders Deep/conv nets on SPEED, SELGEAR, FUELUS, ENGRPM (100 Hz → 1 Hz); trucks partly thresholded. Initial 17,341 h (trucks) / 16,812 h (loaders); downsampled to 2-min/30-s; modified 10×10 CV. Trucks mean acc. 93% (unloading 96%, loading 90%); loaders mean acc. 58% (one loader ∼90%).
Skoczylas et al., 2025  [20] Haul trucks VGG16 on IMU (3 accel + 3 gyro, ∼360 Hz); axis autoencoders; rule-based post-process. 1,473 cycles; 2,462 h; 20 trucks; vs human detection; data-quality tiers. With unloading: acc. 82.1%, R 85.8%, P 95.0%; extended (no unload): acc. 87.7%, R 95.7%, P 91.4%.
Śliwiński et al., 2019  [21] Haul truck ACF-based cyclicity + rule-based cleaning on 1 Hz multivariate CAN; HYDOILP reference. Examples over 1 shift and 3 days; visual match. Suggests SPEED + GEAR plus one of {BRAKE, TRNBPS, FUEL, TPS, INTAKEP} suffice; no numeric accuracy.
Stefaniak et al., 2015  [22] Mining loader Kalman smoothing + thresholding on bucket-cylinder pressure. NR; expert validation. Identifies “full bucket ride” and “empty backward after unloading”; no numeric metrics.
Timusk et al., 2009  [2] Electromech. excavator (P&H TS4100); haul truck drives Supervised LS/C4.5/NN/RBF/SVM with PCA/ICA/EFS on speed-segment and vibration features. 45 h; ∼300 × 1-min records; ∼160 labeled speed profiles; 80% hold-back. Best kNN+EFS error 6%; empty swing as low as 3%; vibration features improved accuracy.
Wodecki et al., 2018  [23] LHD (wheel loader) Compare MA/EMA/LR/RLR/QR/RQR smoothing on HYDOILP for threshold segmentation. 280 min with 20 known cycles; % cycles detected. Recovery vs known 20: MA 105%, EMA 115%, LR 145%, RLR 100%, QR 170%, RQR 100%.
Wodecki et al., 2020  [24] Drill rigs (FaceMaster 1.7) Thresholding; KDE-based thresholds; Hilbert demodulation (current); instantaneous frequency (acoustic). 28 holes; compare vs on-board system. All 28 holes recovered; regime statistics align across sources.
Wyłomańska & Zimroz, 2014  [25] Heavy-duty mobile machines (loaders) Second-moment R & C statistics on ENG_RPM; trapping-event detection. Simulations + several hours of real ENG_RPM; visual/simulation validation. R detects traps >3 samples; C >2; trapping events 17–28% of signal.
Zhang et al., 2019  [26] Electric-drive mining truck (220 t) PCA + density-peak clustering on speed/power/torque/grade; 10 s “short-stroke” windows. 146 kinematic sequences; representative cycle vs field data. Three categories (loaded/high power; idle/no power; braked/high speed); representative mirrors field.
Stachowiak et al., 2020  [27] LHD (wheel loader; hydraulic) HYDOILP 1 Hz; ten smoothing methods (MA, WMA, EMA, DEMA, HMA, ALMA, LR, QR, LOWESS, Kalman); cycle detection via convolution with inverted step (rule thresholds). 3 h total across two samples: 1 h with 11 actual cycles; 2 h with 15 actual cycles; MA window 70 samples; validation by difference from actual counts and duration statistics. LOWESS best: correct count for both samples with minimal shift. Sample 1 (11): most methods 0 diff; HMA + 1 ; LR 1 ; Kalman 2 . Sample 2 (15): LOWESS 0; MA + 1 ; EMA + 5 ; DEMA + 13 ; WMA + 5 ; HMA + 10 ; ALMA + 2 ; LR 0; QR + 3 ; Kalman + 2 . Kalman delayed; DEMA/HMA produced spurious short cycles.
Table 2. Label-efficient learning strategies for operational cycle detection.
Strategy Key Study & Method Label Economy Headline Result
Fully generative discovery Markham et al. (2022)  [16]: Hidden Semi-Markov Model on symbolised five-second GPS fixes; physics rules only prune impossible transitions. 0 manual labels Retrieved 99% loading, 91% dumping modes; uncovered 24 cycles missing from the fleet log.
Event-anchored seeding Gawelski et al. (2020)  [11]: SVM learns the unloading pattern; DBSCAN clusters unload flags to bracket cycles. Labels for one sub-event Full duty-cycle trace generated without hydraulic or brake-pressure channels.
Cluster-first infection Saari & Odelius (2018)  [19]: VBGMM finds ten vibration-speed clusters; < 1 % expert tags “infect” clusters with regime labels. Minutes of tags Identified idling at 100% accuracy; clean partitions for loading, hauling, transit.
Table 3. Heavy-duty BEV analogues and their rationale for inclusion in the transferability lens.
Article Vehicle Studied Reason for Inclusion
Ren et al. 2024  [30] 5 t electric wheel loader Loader-centric segmentation that embeds variable-mass and shovel-resistance peaks; demonstrates a CAN-bus → PCA + K-means pipeline with < 3.5 % energy-error fidelity.
Tong & Guan 2024  [31] Counter-balanced battery-electric forklifts Double-layer Markov model captures dynamic payload profiles; large-scale (194 M points) micro-trip synthesis keeps 13 performance metrics within ± 1 % .
Tong & Ng 2023  [32] Battery-electric buses on steep Hong Kong routes Gradient-aware micro-trip assembly reproduces speed–acceleration statistics on ± 6 % slopes—an analogue for deep-ramp haulage.
* Percentages denote absolute error relative to measured values.
Table 4. Transferability assessment of selected automotive BEV studies using the Transferability Lens.
Paper Transfer Distance Covariate Shift Context Alignment Sensor Mapping Retraining Feature Eng. Final Decision
Berzi et al., 2016  [33] Moderate Location-bound (city vs. mine) Medium Medium Low Low Promising—extra work needed
Jing et al., 2022 [34] Moderate Region-specific vehicle & traffic Medium Low Low Low Promising—needs further development
Kreutz et al., 2022  [35] Moderate Power-train signal variance Medium Medium Medium Low Promising—strong on annotation reduction
Wang et al., 2021  [36] Moderate Localized driver & traffic patterns Medium Low Low Low Promising—warrants mine-site validation
Disclaimer/Publisher’s Note: The statements, opinions and data contained in all publications are solely those of the individual author(s) and contributor(s) and not of MDPI and/or the editor(s). MDPI and/or the editor(s) disclaim responsibility for any injury to people or property resulting from any ideas, methods, instructions or products referred to in the content.
Copyright: This open access article is published under a Creative Commons CC BY 4.0 license, which permit the free download, distribution, and reuse, provided that the author and preprint are cited in any reuse.
Prerpints.org logo

Preprints.org is a free preprint server supported by MDPI in Basel, Switzerland.

Subscribe

Disclaimer

Terms of Use

Privacy Policy

Privacy Settings

© 2026 MDPI (Basel, Switzerland) unless otherwise stated