
Submitted:
27 June 2024
Posted:
28 June 2024
You are already at the latest version
Abstract
With firm commitment to energy labelling, it is not a question of if but only of when the European Union will introduce an energy label for electric cars. To support such policy efforts, we conducted a scoping analysis of energy consumption and efficiency trade-offs for 342 electric car models sold in Europe. The results suggest that certified and real-world energy consumption average 19 ± 4 kWh/100 km and 21 ± 4 kWh/100 km, translating into drive ranges of 440 ± 120 km and 380 ± 110 km, respectively. Energy consumption is correlated with vehicle mass, frontal area, and battery capacity, but less so with rated power and vehicle price. Each 100 kg of vehicle mass and 0.1 m2 of frontal area tend to increase energy consumption by 0.20 ± 0.06 kWh/100 km and 0.72 ± 0.05 kWh/100 km. Raising battery capacity by 10 kWh increases vehicle mass by 145 kg, energy consumption by 0.6 kWh/100 km, and drive range by 45 km. Efficient vehicles are available at any price but drive range has a cost. Our findings point to considerable efficiency trade-offs that could be tapped by a dedicated energy label. We propose several options for categorizing vehicles on an efficiency scale from A to G, with and without additional utility parameters. Our analysis provides rationale for energy labelling of electric cars in Europe and could inspire similar analyses for other vehicle categories such as e-scooters, lightweight three- and four-wheelers, e-busses, e-trucks, and electric non-road machinery.
Keywords:
electric vehicles
; energy consumption
; efficiency trade-offs
; energy label
; labelling metrics
; consumer information
1. Introduction
The market for electric vehicles is booming. In 2022, annual sales of fully electric cars surpassed one million in the European Union (EEA, 2023) and 10 million worldwide (IEA, 2023). With an average annual growth of more than 50% over the past decade, electric cars are no longer niche products. They accounted for 15% of all new registrations in Europe in 2022 (ACEA, 2024) and may soon dominate the market if the European Union pursues its ambition to cut CO2 emissions from new cars sold to zero by 2035 (EC, 2023a).
Rising sales have been accompanied by a surge in model variety. In 2016, just about 30 models were available (EEA, 2016). To date, consumers can choose between several hundred models, including small electric city cars, luxurious sedans, and sport utility vehicles (EVD, 2023). High learning rates have been reducing production costs (Weiss et al., 2019), while electric vehicles benefit from an increased power density of batteries (Xu et al., 2023), an overall advanced energy management, and the use of wide bandgap semiconductors. The latter, representing a leap innovation, boosted charging efficiency from 60% a decade ago (Helmers and Marx, 2012) to 99.5% today (Yadlapalli et al., 2022).
Rapid innovation and growing market diversification will arguably increase the variability in the energy consumption values of vehicles. Energy labelling could address this situation. However, a dedicated energy label for electric cars does not exist yet in Europe. Instead, these vehicles are covered by a ‘car label’, comprising combustion, hybrid, and electric cars (EC, 1999). The label rating is based on the certified tailpipe CO2 emissions (EC, 2007a,b). Because electric cars do not emit CO2 at the tailpipe, they uniformly receive the highest rating (A to A+++, depending on the scheme in the respective country). Consumers can therefore not easily identify if a car is efficient or inefficient relative to its competitors.
We aim to address this shortcoming and establish the empirical basis for a dedicated energy label for electric cars in Europe. To this end, we collect and analyze vehicle attributes for 342 electric car models available on the European market in the autumn of 2023. The data are used to: i) characterize energy consumption and other vehicle characteristics, ii) identify energy efficiency trade-offs and statistical relationships between the vehicle characteristics, and iii) deduct options for a dedicated energy labelling scheme.
The article provides policymakers with an empirical basis for implementing a dedicated energy label for electric cars in Europe and could inspire similar analyses for other electric vehicles such as e-scooters, lightweight four-wheelers, e-busses, e-trucks, and electric non-road machinery.
Our research makes a timely contribution to Europe’s transition towards a decarbonized, digital, and resilient transport sector (EC, 2024), envisaging a 90% cut in greenhouse gas emissions by 2050 (EC 2020). As an interim target, the deployment of at least 30 million zero-emission vehicles is projected by 2030 (EC, 2020). So far, however, only 1.2% of the total EU car fleet (3 million vehicles) consists of battery electric or plug-in hybrid vehicles, while 0.1% of the trucks (6500 vehicles) have a zero-emission powertrain (ACEA 2024, numbers for 2022). Whereas the target of 30 million electric vehicles is a long way off, the time frame of 2030 is not. Hence, there is urgency in advancing the regulatory framework for electric vehicles. Energy efficiency is a key priority in this respect because economy-wide decarbonization and electrification will increase electricity demand (E-CUBE, 2020). The Energy Efficiency Directive (EC, 2023b) seeks to address this challenge and reduce the overall energy consumption in the European Union. In this context, it becomes increasingly important to support efficiency improvements for electric road vehicles, which are expected to consume 11% of the gross electricity supply in Germany by 2030 (Prognos, 2021), for example.
2. Methods
2.1. Data Collection
We begin by collecting vehicle data from the Electric Vehicle Database, which provides complete overview of all electric vehicles available in Europe (EVD, 2023). At the point of data collection in fall 2023, this database covered 342 individual vehicle models sold either in Germany, the Netherlands, or the United Kingdom. For these models, we obtained quantitative information on the following attributes: price [EUR], power [kW], vehicle mass [kg], length, width, and height [m], nominal and usable battery capacity [kWh], certified energy consumption according to the Worldwide harmonized Light vehicles Test Procedure (WLTP; EC, 2007a; UNECE, 2021) – separately for vehicle configurations with the lowest energy consumption (TEL - test energy low) and the highest energy consumption (TEH - test energy high) [kWh/100 km] during certification, minimum and maximum real-world energy consumption [kWh/100 km], minimum and maximum real-world drive range [km], as well as the drivetrain configuration (i.e., two-wheel or all-wheel drive). We benchmarked the collected data against information from BEV (2023) and the websites of vehicle manufacturers. We then supplemented the data with information on minimum, mean, and maximum real-world energy consumption [kWh/100 km] from Spritmonitor (2023), which reflects operating conditions in Germany. The data collection took place in the period between May and August 2023.
Our data set includes fully-electric passenger cars and light-commercial vehicles, classified as M1 and N1 vehicles, respectively (EC, 2007b). These vehicles are powered by an electric motor that draws electricity exclusively from an externally rechargeable battery. We excluded: i) fuel-cell vehicles running on hydrogen as well as ii) hybrid and plug-in hybrid vehicles equipped with an internal combustion engine. We included data for certified as well as real-world energy consumption as both parameters can deviate from each other depending on operating conditions. Certified energy consumption is understood here as the consumption value declared by manufacturers or certification bodies according to the standardized regulatory test procedure (EC, 2017). Real-world energy consumption refers to the energy consumption observed by vehicle users on the road.
Given the number of models included, we consider our data set (see Table S1 in the Supplementary Material) to be representative of electric car models sold in Europe in the period from autumn 2023 to summer 2024.
2.2. Data Analysis
First, we checked and corrected the data for typos, outliers, and implausible values. Second, we calculated for all vehicles:
- frontal area [m2] by multiplying vehicle width and height [m] and applying a generic correction factor of 85% (Bowling, 2010) to account for areas not covered by the vehicle;
- average real-world energy consumption [kWh/100 km] and drive range [km] as the arithmetic mean of the minimum and maximum values obtained from EVD (2023);
- average real-world drive range [km] based on the energy consumption data obtained from Spritmonitor (2023), by assuming direct proportionality between certified and real-world energy consumption and the corresponding drive range.
We characterized the data set by calculating mean, standard deviation, median, minimum, and maximum values of vehicle attributes (Table 1). Based on this analysis, we express values in the text as mean ± standard deviation, unless stated otherwise. Commas in between numbers separate order of magnitude in triples.
We then conducted two linear regression analyses. We started out with a simple univariate regression to model energy consumption Ei of vehicle model i as a function of a single vehicle attribute:
where α1 stands for the regression constant, β1 represents the regression coefficient, Ai denotes the attribute under consideration, and ɛi the unexplained regression residual. This model was applied separately to certified and real-world energy consumption and considered the following attributes: vehicle mass [kg], power [kW], frontal area [m2], drivetrain configuration (two-wheel versus all-wheel drive), price [EUR], as well as two battery-related attributes, namely nominal battery capacity [kWh] and drive range [km].
Next, we applied multiple linear regression to model energy consumption as a function of several vehicle attributes, considering those that are statistically independent of each other (i.e., a Pearson correlation coefficient r < 0.7; see Figure A1 in the Appendix) as:
where Mi represents vehicle mass [kg], Pi power [kW], Fi frontal area [m2], and Di the drivetrain configuration (two-wheel versus all-wheel drive). The multiple regression model was applied separately to certified and real-world energy consumption.
Models 1 and 2 assume a linear relationship between energy consumption and vehicle attributes, which may not always hold. We therefore follow the approach of Knittel (2011) and model energy consumption also as a power-law function of vehicle attributes, which equates to a linear relationship between the logarithms of dependent and explanatory variables. The model specifications are as follows:
where log depicts the logarithm base 10. A preliminary screening of residual plots reveals heteroscedasticity, which tends to bias the regression errors. Therefore, we follow the approach of Tietge et al. (2017) and estimate heteroscedasticity-robust standard errors for all regression coefficients with the ‘estimatr’ package (Blair et al., 2018).
We also applied univariate regression analysis to explore associations between i) real-world versus certified energy consumption, ii) usable versus nominal battery capacity, iii) vehicle mass versus nominal battery capacity, iv) frontal area and power versus vehicle mass, v) certified drive range versus nominal battery capacity, vi) real-world drive range versus usable battery capacity, v) price versus usable battery capacity and vi) price versus real-world drive range.
We consider results to be significant at a 5% level, unless stated otherwise. All analyses are conducted with R (R Core Team, 2022).
In a final step, we use our findings to propose metrics for the classification of vehicles on a future energy label. This involves subjective value judgements and intends to open a broader stakeholder discussion about energy labelling of electric cars. To classify vehicles, we consider the certified energy consumption of models, including all data for vehicle configurations with the lowest as well as highest energy consumption (WLTP TEL and TEH values). We adhere to the generally accepted A to G classification and distinguish seven efficiency classes, with and without additional utility parameters.
3. Results
3.1. Overview – Vehicle Attributes
Energy Consumption
The certified energy consumption of electric cars averages at 19 ± 4 kWh/100 km (31 ± 6 kWh/100 miles); the real-world energy consumption averages at 21 ± 4 kWh/100 km (33 ± 6 kWh/100 miles; see Table 1 and Figure 1). The corresponding drive ranges are 440 ± 120 km (272 ± 76 miles) and 380 ± 110 km (238 ± 68 miles), respectively. The difference between certified and real-world energy consumption is statistically significant based on a two-sided t-test at α=0.05 (95% significance level). This finding suggests that the European certification test underestimates, on average, energy consumption. However, the TEH energy consumption values, which comprise the least efficient variants of a vehicle model, are in fact a good proxy for the average real-world energy consumption of electric vehicles (Table 1).

Table 1.
Descriptive statistics of vehicle attributes; SD - standard deviation; Min – minimum value; Max – maximum value; comma depicts the thousand separator.
Table 1.
Descriptive statistics of vehicle attributes; SD - standard deviation; Min – minimum value; Max – maximum value; comma depicts the thousand separator.
| Parameter [Unit] (Sample size) | Mean | SD | Median | Min | Max |
|---|---|---|---|---|---|
| Energy consumption | |||||
| Certifieda [kWh/100 km] (501) | 19.4 | 3.8 | 18.5 | 13.0 | 30.7 |
| Certified - TEL [kWh/100 km] (312) | 18.5 | 3.4 | 17.6 | 13.0 | 28.3 |
| Certified - TEH [kWh/100 km] (189) | 20.7 | 3.9 | 19.8 | 144.3 | 30.7 |
| Real-worldb [kWh/100 km] (496) | 20.7 | 3.7 | 19.8 | 13.0 | 38.9 |
| Drive range, based on | |||||
| Certified energy consumptiona [km] (501) | 438 | 123 | 440 | 190 | 883 |
| Certified energy consumption - TEL [km] (312) | 449 | 128 | 455 | 190 | 883 |
| Certified energy consumption - TEH [km] (189) | 422 | 113 | 420 | 203 | 828 |
| Real-world energy consumptionb [km] (496) | 383 | 109 | 384 | 147 | 732 |
| Certified drive range per 1000 EUR vehicle price (549) | 7.00 | 2.47 | 7.02 | 1.34 | 17.17 |
| Real-world drive range per 1000 EUR vehicle price (493) | 6.50 | 2.06 | 6.69 | 1.25 | 11.00 |
| Nominal battery capacity [kWh] (342) | 76 | 22 | 77 | 23 | 128 |
| Usable battery capacity [kWh] (342) | 71 | 21 | 71 | 21 | 123 |
| Mass [kg] (342) | 2,102 | 351 | 2,128 | 1,012 | 2,975 |
| Power [kW] (342) | 230 | 139 | 190 | 33 | 828 |
| Frontal area [m2] (342) | 2.59 | 0.28 | 2.55 | 2.09 | 3.25 |
| Length [m] (342) | 4.71 | 0.39 | 4.75 | 3.60 | 5.45 |
| Width [m] (342) | 1.89 | 0.07 | 1.90 | 1.62 | 2.08 |
| Height [m] (342) | 1.62 | 0.14 | 1.61 | 1.35 | 1.94 |
| Pricec [EUR] (339) | 70,135 | 40,215 | 58,844 | 22,150 | 387,645 |
aincluding the two data sets on certified energy consumption TEL and TEH. bincluding the mid-point real-world energy consumption data obtained from EVD (2023), and the mean energy consumption data obtained from Spritmonitor (2023). cconsidering the average price in Germany and the Netherlands.
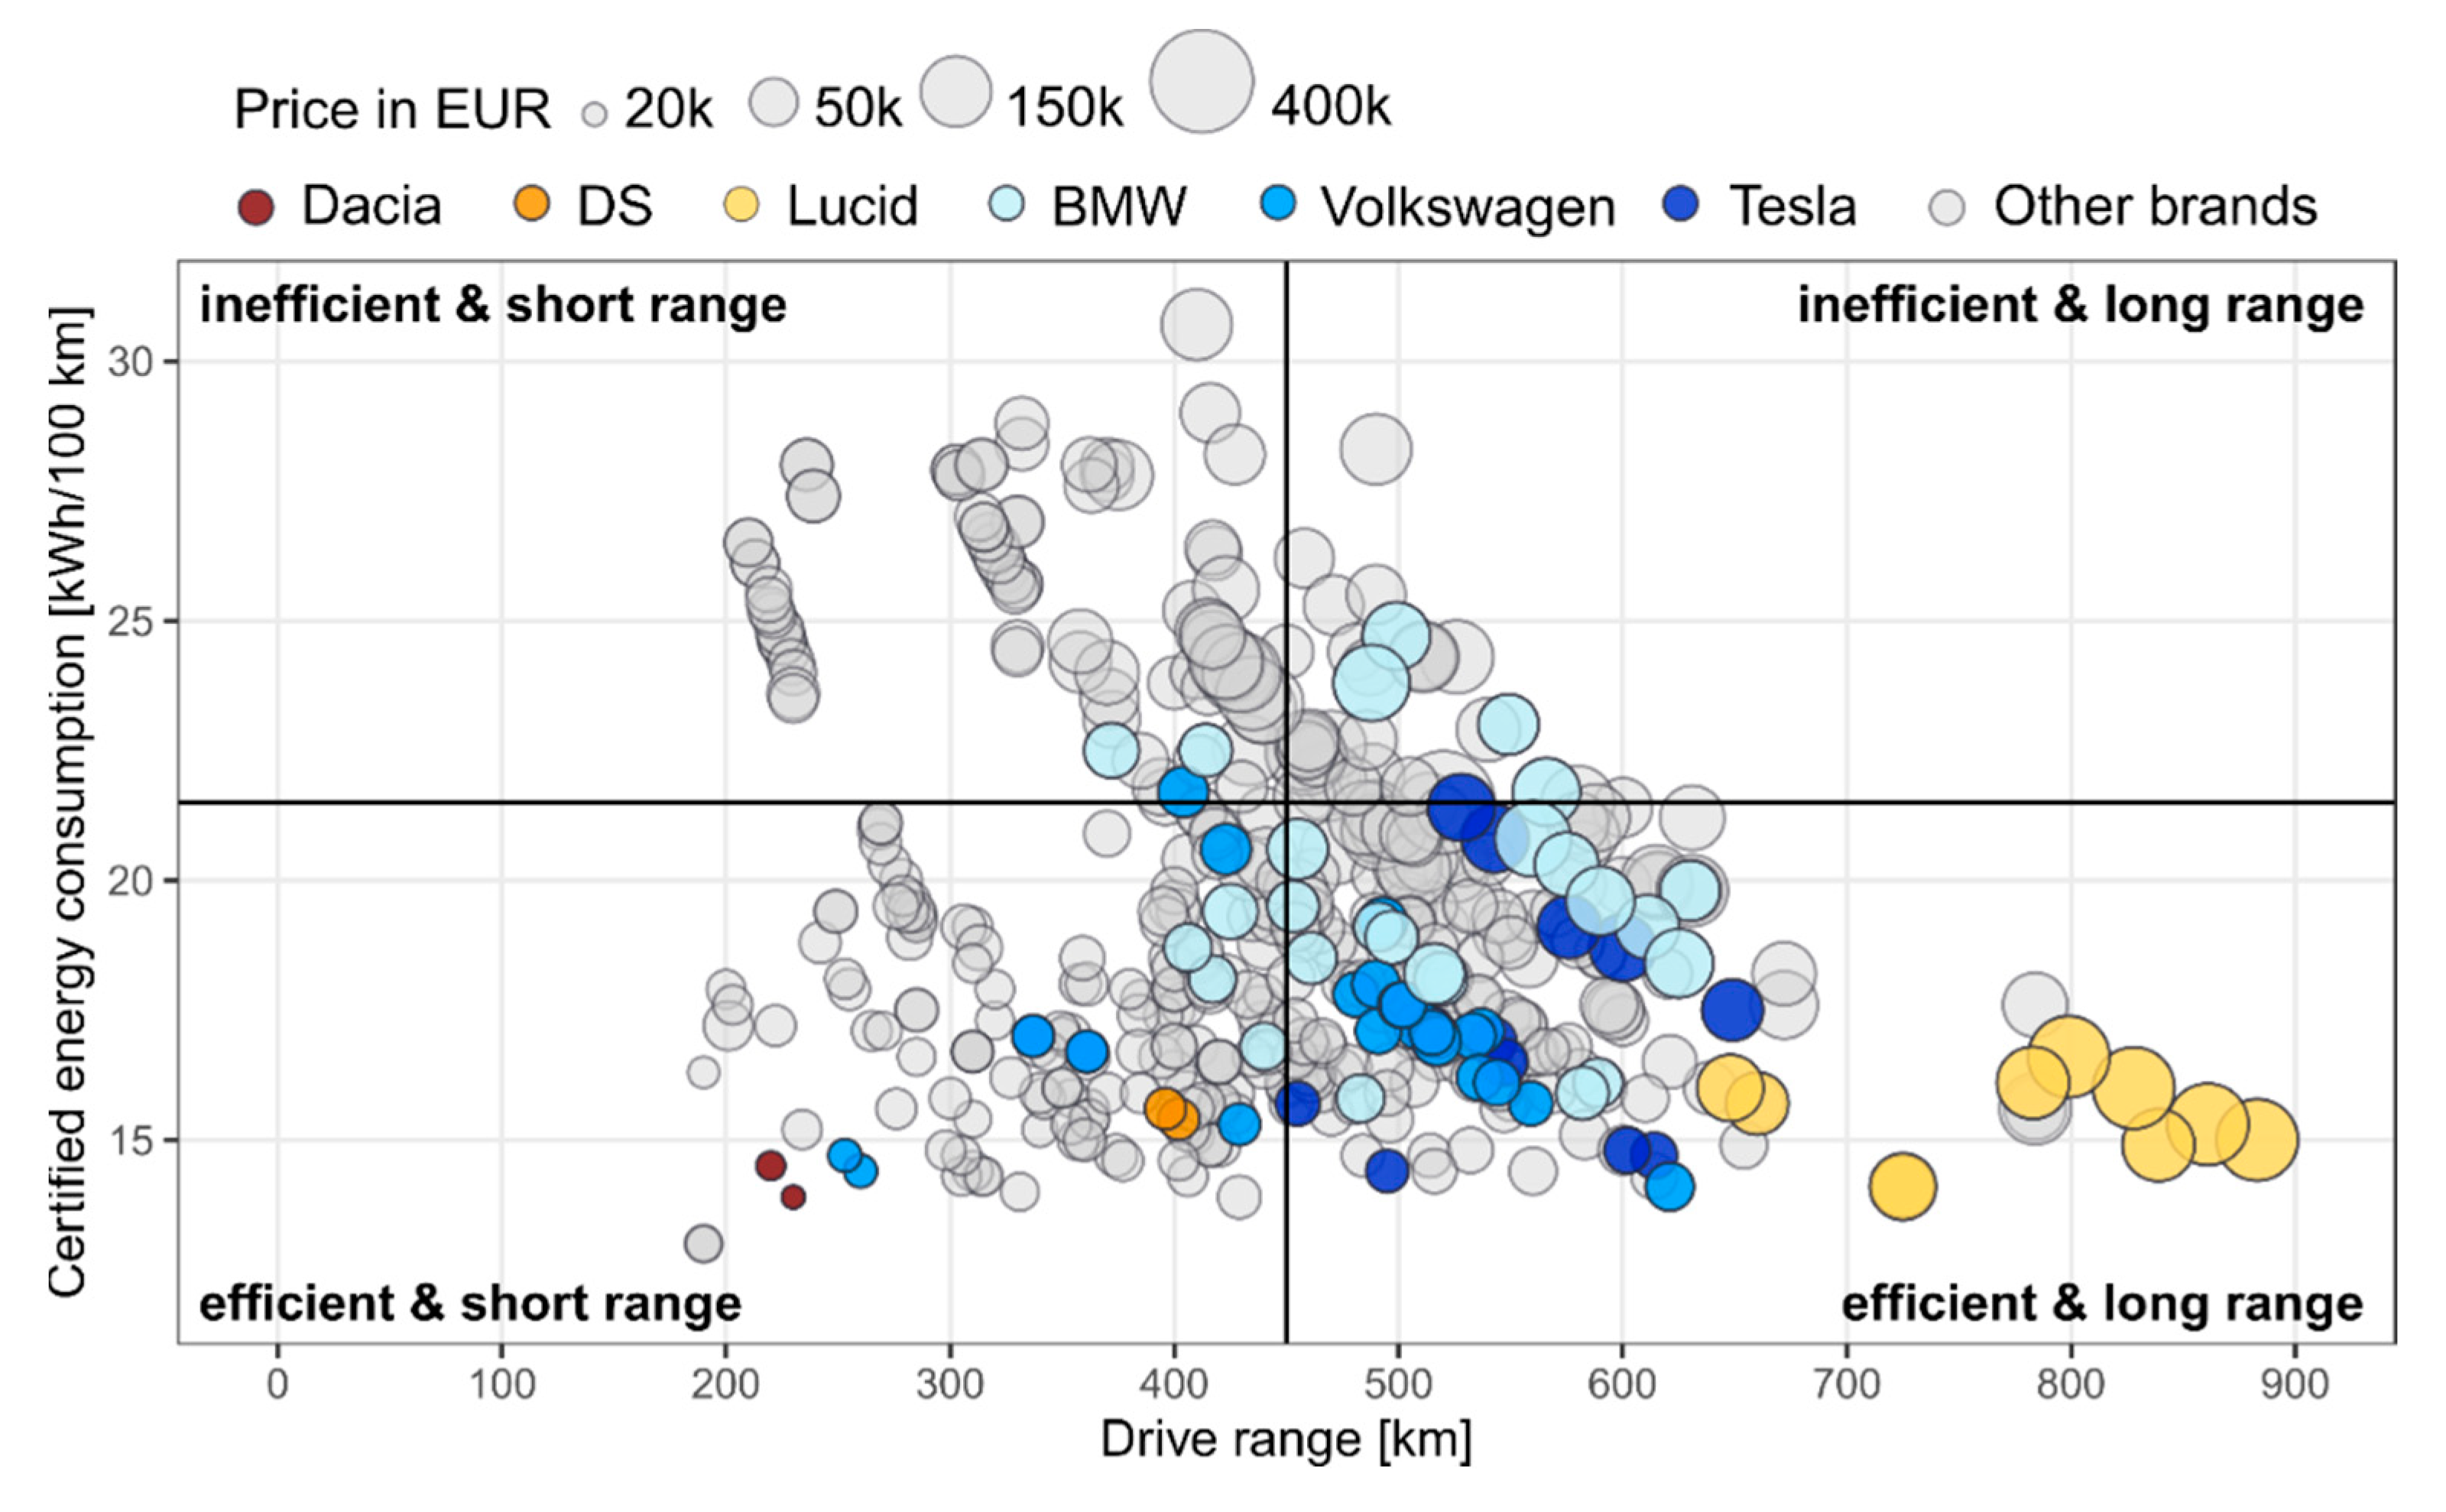
Brands differ in their average certified energy consumption and the drive range for a given price (Figure 2). Yet, drawing a conclusion about powertrain efficiency from Figure 2 is not straightforward as manufacturers vary in the types of vehicles produced and the market segment covered.
Other Vehicle Attributes
Electric cars sold in Europe in 2023 cost 70,000 ± 40,000 EUR. They have a mass of 2100 ± 350 kg and a rated motor power of 230 ± 140 kW. They are on average 4.70 ± 0.40 m long, 1.89 ± 0.07 m wide, and 1.62 ± 0.14 m high, and feature a frontal area of 2.59 ± 0.28 m2. Their nominal battery capacity of 76 ± 22 kWh exceeds usable battery capacity of 71 ± 21 kWh by some 5 kWh or 7% (Table 1). Many models are available in two-wheel and four-wheel drive mode (see Table S1 in the Supplementary Material) but there was not a single model available for less than 20,000 EUR at the point of data collection. These findings show that attributes span a wide range (Figure 1), which we expect to increase, if the market for electric vehicles continues to grow (IEA, 2023).
3.2. Regression Analyses – Efficiency Trade-Offs
The univariate regression models suggest that the energy consumption of electric cars depends strongly on frontal area as well as on vehicle mass and thus battery capacity, but less so on rated motor power and drivetrain configuration (two-wheel versus four-wheel drive; Figure A1 in the Appendix). Together, frontal area, mass, power, and number of driven axles can explain 55% and 60% of certified and real-world energy consumption. The multiple linear regression analysis reveals the following (see Figure 3 and Table A1):
- Each 100 kg of vehicle mass increases certified and real-world energy consumption by 0.20 ± 0.06 kWh/100 km and 0.17 ± 0.05 kWh/100 km, respectively (Figure 3a; Model 2); each doubling of mass increases certified and real-world energy consumption by around 24 ± 6% (Model 4).
- Each 1 m2 of frontal area increases certified and real-world energy consumption by 8.5 ± 0.6 kWh/100 km and 9.1 ± 0.5 kWh/100, respectively (Figure 3b; Model 2); each doubling in frontal area doubles the certified and real-world energy consumption (Model 4).
- Each 100 kW of rated power increases certified energy consumption by only 0.42 ± 0.18 kWh/100 km, whereas the effect on real-world energy consumption is insignificant (Figure 3c; Model 2); likewise, log-transformation suggests rated power does not affect significantly certified and real-world energy consumption (Model 4).
- Four-wheel drive does not significantly increase certified energy consumption but it tends to increase real-world energy consumption by 1.0 ± 0.3 kWh/100 km compared to two-wheel drivetrains (Model 2).
- Cheaper vehicles are more efficient (Figure 3f); vehicle prices cover a wide range and are weakly correlated with energy consumption; each 10,000 EUR in price increases certified and real-world energy consumption by some 0.3 ± 0.1 kWh/100 km (Model 1g); a doubling of vehicle price increases energy consumption by some 0.2 kWh/100 km (Model 3g).
The weak correlation of energy consumption and rated power contrasts with the findings for combustion engine vehicles, where both variables are strongly correlated (Weiss et al., 2020b). This difference can be explained, among others, by the recuperation of kinetic energy when braking and the absence of idling losses in electric cars.
But what about battery characteristics? The univariate regression analyses suggest that:
- Each additional 10 kWh of nominal battery capacity increases certified and real-world energy consumption by 0.59 ± 0.07 kWh/100 km and 0.51 ± 0.07 kWh/100 km, respectively (Model 1e); each doubling of battery capacity increases certified and real-world energy consumption by around 20% (Model 3e; Table A2).
- Each additional 100 km drive range tends to decrease certified and real-world energy consumption by 0.85 ± 0.13 kWh/100km and 0.88 ± 0.16 kWh/100 km, respectively (Model 1f); each doubling of drive range decreases certified and real-world energy consumption by roughly 15% (Model 3f; Table A2).
It is counterintuitive that drive range and energy consumption (Figure A1) show a negative correlation, because drive range can be boosted by larger batteries that increase vehicle mass, and hence energy consumption. However, there is a second mechanism, namely extending drive range by increasing the energy density of batteries and improving the overall drivetrain efficiency. Our data suggest that this second mechanism is statistically prevalent in the electric cars available to date (Figure 3e).
3.3. Complementary Regression Analyses
- Real-world energy consumption is significantly higher than certified energy consumption (Figure 4a); the discrepancy appears to decrease with higher consumption levels; each 1 kWh/100 km increase in certified energy consumption raises real-world energy consumption by only 0.88 ± 0.03 kwh/100 km (Model 1g).
- Usable battery capacity is on average 5 kWh below nominal battery capacity (Figure 4b); the discrepancy appears to increase for larger batteries; each 10 kWh increase in nominal battery capacity raises useable battery capacity by 9.3 ± 0.6 kWh (Model 1h).
- Each 10 kWh of nominal battery capacity increases vehicle mass by 143 ± 4 kg (Figure 4c); statistically, vehicles would weigh 1015 ± 34 kg without battery (Model 1i), suggesting that the electric battery accounts for roughly half (i.e., 1100 ± 400 kg) of the average mass of electric vehicles (2102 ± 351 kg; Table 1).
- With each 100 kg of vehicle mass, the frontal area of vehicles increases by 395 ± 36 cm2 (Model 1i) and power by 26 ± 2 kW (Figure 4d; Model 1k).
- Each 10 kWh in nominal battery capacity adds some 45 ± 2 km drive range during both certification and real-world driving (Figures 4e,f; Models 1k and 1l); each 10 kWh costs 12,000 ± 600 EUR (Figures 4e and 4f; Models 1m and 1n); a doubling in both nominal and usable battery capacity tends to increase certified and real-world drive range by nearly 80% (Models 3l and 3m).
- Vehicles with a larger battery and a longer drive range are more expensive; each 10 kWh nominal battery capacity raise vehicle price by 1,200 ± 60 EUR (Model 1n); each 10 km drive range add 1,500 ± 30 EUR to the vehicle price.
The results suggest there are ample benefits of increasing the energy density of batteries, which would allow for the decrease of vehicle mass and energy consumption, thereby increasing drive range.
3.3. Energy Labelling of Electric Cars
Our data allows for the classification of vehicles according to their energy consumption. However, any such classification is subjective and depends on the intended purpose. To be meaningful, classification criteria should be:
- Relevant - distinguish energy efficient from less energy efficient vehicles, thereby driving innovation and supporting efficiency improvements.
- Accurate - reflect, as correctly as possible, the energy consumption experienced by consumers on the road during normal operating conditions.
- Accessible - communicate information in a clear, visible, and easily understandable manner.
- Long-lasting - remain relevant in time, by being as technologically neutral and accommodating of innovation as possible.
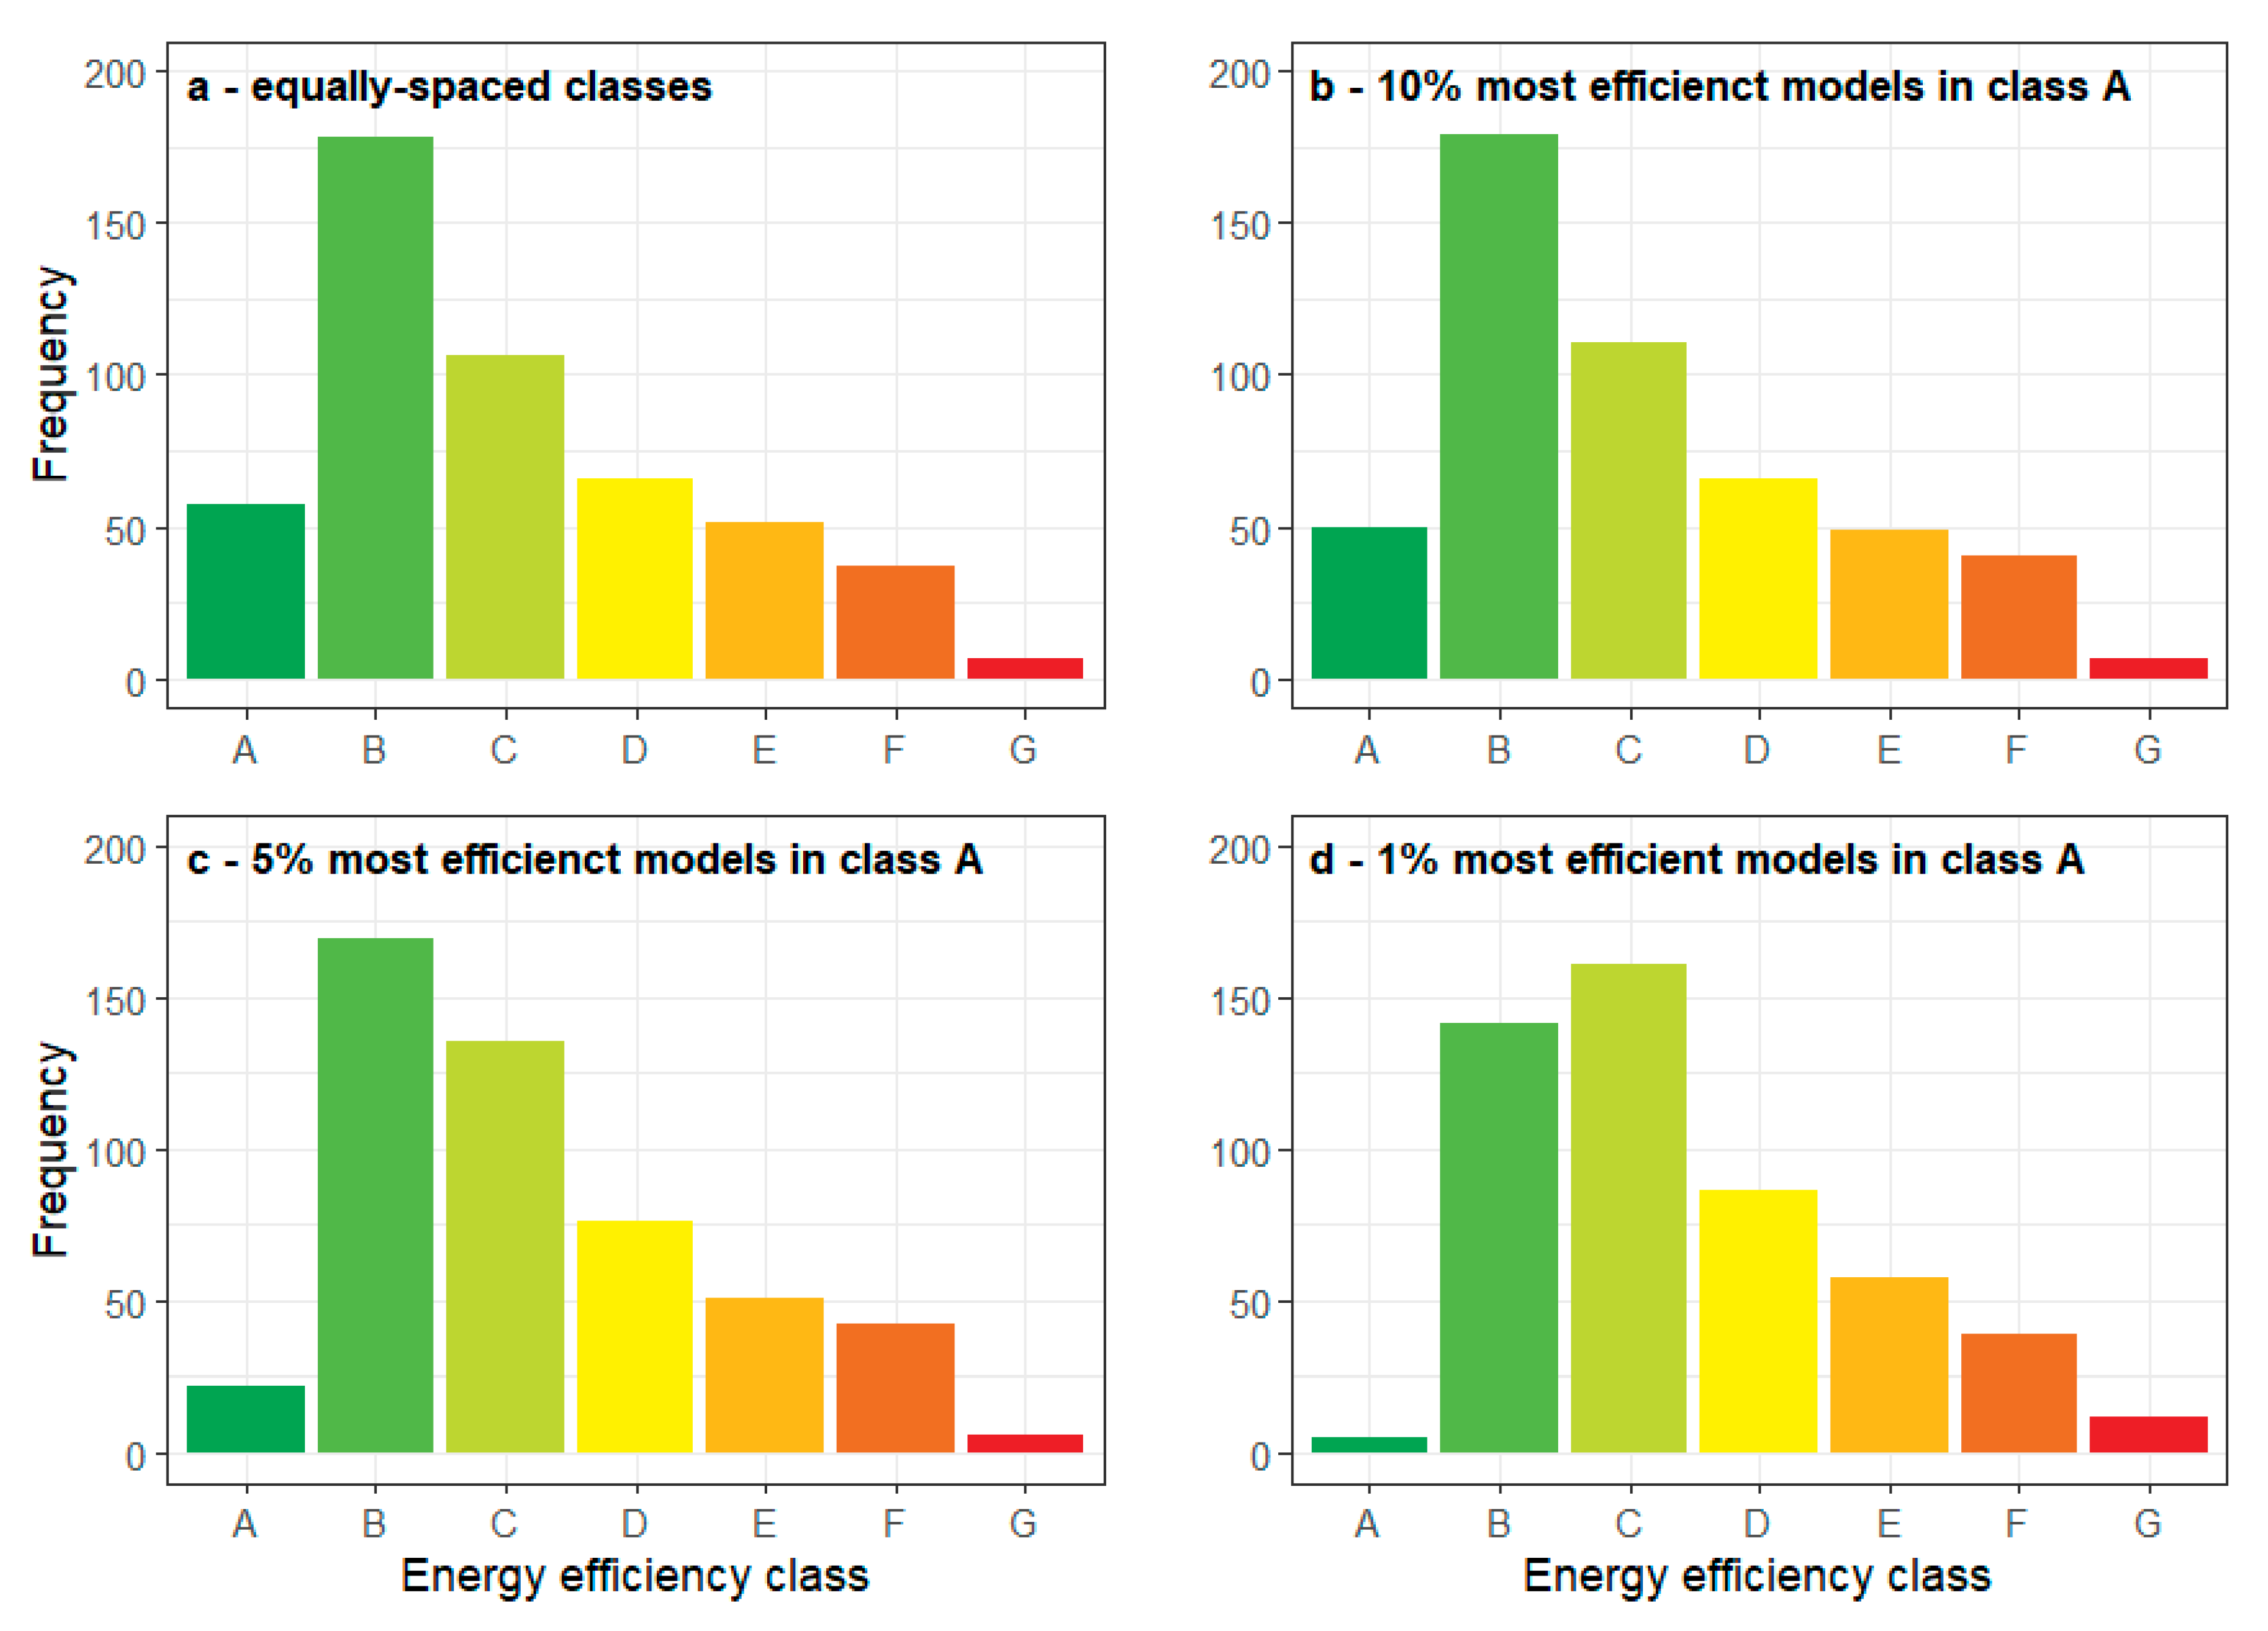
This way, classification criteria could consider first and foremost the certified energy consumption [kWh/100 km] of electric cars. Although there is systematic deviation between real-world and certified consumption data (Figure 3a), certified energy consumption is established through a standardized type-approval test and information is readily available for all vehicles on the European market. Table A3 shows the energy consumption values across seven classes from A to G. We present values for four scenarios in which classes are equally spaced over the data range (Figure 5a) and for which class A comprises the 10%, 5%, and 1% most efficient models with classes B to G being equally spaced over the remaining data range (Figures 5b-d). If such a classification scheme was adopted, most vehicles would fall in classes B and C.
Classifying vehicles according to their energy consumption avoids perverse incentives for, e.g., rebound effects and market distortions. It leaves manufacturers any degree of freedom to improve efficiency and would penalize large and heavy vehicles that pose more of a sustainability challenge in urban areas. However, efficiency improvements may be achieved through diminishing vehicle utility, for example, by decreasing cabin space or battery capacity. It could therefore be desirable to include additional utility parameters for the classification of vehicles. Germany and Spain follow such an approach by considering the mass and footprint of vehicles (Haq and Weiss, 2016). If utility parameters are considered, they should be quantifiable and reflect consumer utility in a meaningful manner. The higher the correlation of a utility parameter with energy consumption, the higher the risk of perverse market incentives.
Figure 5.
Distribution of vehicle models across efficiency classes A to G, based on all certified TEL and TEH energy consumption values; panel a) displays classes of equal size; panels b), c), and d) display class A representing the 10%, 5%, and 1% most efficient models, respectively while classes B to G comprising the remaining data points divided into equally sized intervals.
Suitable utility factors could include battery capacity or drive range. Opting for drive range would address range anxiety, which is a major market barrier for electric cars (She et al., 2017; Pamidimukkala et al., 2024). The label would then consider two dimensions, make the trade-offs between energy consumption and drive range transparent to consumers in relation to a given vehicle price. In fact, efficient vehicles are available at any price, but drive range has a cost – with the noteworthy exception of a few mid-priced cars that lie below the horizontal 15 kWh/100km line in Figure 6.
If so, the inclusion of such a utility parameter could reveal important information to consumers and provide incentive for manufacturers to increase drive range through efficiency improvements. The lower part of Table A3 provides numerical examples for a classification scheme with battery capacity and drive range as additional utility parameters.
4. Discussion
4.1. Strengths and Limitations of the Research
Based on EVD (2023), we have compiled a comprehensive dataset of attributes for 342 fully electric vehicles sold in the Netherlands, Germany, and the United Kingdom (Table S1 in the Supplementary Material). We consider the dataset to be representative for mass-produced electric cars available in Europe in 2023 and 2024. The identified trade-offs reflect the current state of technology and may hold for electric cars elsewhere in the world, given the global technology transfer across multinational manufacturers.
Our findings provide scientists with vehicle data for energy, transport, and economic modelling, and they offer policymakers an empirical basis from which to develop a dedicated energy label for electric cars. Additionaly, our results could also inspire similar analyses for other categories of electric vehicles such e-bikes, e-scooters, light electric three- and three-wheelers, as well as heavy-duty vehicles and non-road machinery.
Nevertheless, there are noteworthy limitations:
- Timeliness: The analysis reflects the characteristics of electric cars available in Europe in 2023 and early 2024. While our results may roughly hold for the short-term future and other markets, they will become less accurate over time. Incremental innovation, technological breakthroughs, and pricing policy in a growing market will affect vehicle attributes and their trade-offs.
- Vehicle sales: We capture vehicle models available to consumers but not actual vehicle sales. Therefore, our findings characterize the electric car market but not the fleet of electric cars operated on the road. Caution should be applied when using the energy consumption data for fleet-wide energy and emissions modelling.
- Vehicle models: The boundary of what constitutes a vehicle model rather than a variant of a model is not straightforward. We consider vehicles to be individual models if they differ by name or battery capacity. This way, similar vehicles such as Citroen e-SpaceTrourer, Fiat E-Ulysses, Peugeot e-Traveller, Opel Zafira, and Toyota Proace are included as individual models in our analysis. This approach causes an overrepresentation of vehicles that are technologically identical but sold under several brands. However, we consider it practical and justifiable given the challenges associated with implementing alternative system boundaries.
- Energy consumption: Real-world energy consumption reflects actual operating conditions that drivers experience on the road. However, these conditions can vary greatly depending on, e.g., ambient temperature, driver behavior, or road profile. There can be considerable variability in the real-world energy consumption of electric cars. Furthermore, data samples of real-world consumption values in Spritmonitor (2023) are still small for most models. Overall, we consider the real-world energy consumption values to be indicative of normal operating conditions, although they may not capture any specific conditions such as very low winter temperatures.
- System boundary: We focus here on the energy consumption during the use phase of electric vehicles. Evaluating the overall energetic and environmental impacts of such vehicles requires holistic life cycle assessment and includes vehicle production and end-of-life treatment (Helmers et al., 2020).
- Methods: Regression analysis requires that the data meet certain criteria, such as normality, homogeneity and independence (Zuur et al., 2011). Regression residuals should be uncorrelated with the independent variable. The diagnostic plots in Figures S1-S41 in the Supplementary Material suggest that this requirement many not always be met and that residuals can be heteroscedastic. We address the observed heteroscedasticity, as far as feasible, by estimating heteroscedasticity-robust standard errors for all regression coefficients (Blair, 2018).
4.2. Comparison of Results
The average certified and real-world energy consumption values (19 ± 4 kWh/100 km and 21 ± 4 kWh/100 km) are consistent with the literature. For example, consumption values of 19 kWh/100 km were reported by Madziel and Campisi (2023) based on a sample of 123 vehicles, whereas an average energy consumption of 22.5 kWh/100 km for electric cars certified and sold in the USA were found by Galvin (2022). Weiss et al. (2020a) reported certified and real-world energy consumption values of 16 ± 4 kWh/100 km and 18 ± 5 kWh/100 km, albeit for a sample of 218 vehicles produced between 1989 and 2019. The deviation between the values reported in the literature and those documented here is likely caused by an overall trend towards heavier and larger vehicles. In fact, the most efficient electric cars under real-world conditions are mostly smaller vehicles that were available already a decade ago (Spritmonitor, 2024). Considering all new car registrations in the European Union in 2022, EEA (2023) reports an average certified energy consumption of 16.6 kWh/100 km. This value is lower than the averages identified here, suggesting that considering available vehicle models rather than actual vehicle sales overrepresents large and relatively inefficient vehicles.
The identified efficiency trade-offs between vehicle attributes are broadly consistent with previous studies. The observed increase in energy consumption of 0.2 kWh/100 km with each 100 kg of vehicle mass is considerably lower than previously reported. Redelbach et al. (2012) give an increase of 0.4 kWh/100 km and Weiss et al. (2020a) of 0.6 kWh/100 km with each 100 kg of vehicle mass.
4.3. Implications for Policymakers
Deviation between Certified and Real-World Energy Consumption
Real-world energy consumption is significantly higher than certified energy consumption (Figure 4a), suggesting type-approval tends to underestimate the actual energy consumption of electric vehicles on the road. This observation demands attention from policymakers. If verified by other research, type-approval test procedures may need to be adapted to ensure that consumers receive accurate information about the energy consumption of electric vehicles.
Energy Labelling
The range of energy consumption values (Figure 1) suggests consumers would benefit from the implementation of an energy label for electric cars. In fact, labeling may become imperative once electric cars dominate the market, following the phase-out of combustion cars in Europe by 2035 (EC, 2023a). By that time, car owners' electricity costs will likely exceed those of any other labeled product. Although the European Commission has currently no plans to implement an energy label for electric vehicles (EC, 2022), it should review the car labeling directive by 31 December 2024 (EC, 2019). Our analysis offers a timely contribution to this review.
Regarding labelling metrics, distance-specific energy consumption [kWh/100 km; km/kWh] is an obvious choice. Standardized data are readily available from type approval; they are easily understandable and appropriate for characterizing the energy efficiency of vehicles. If policymakers prefer to include a utility factor, drive range could be a suitable choice as longer drive ranges present an obvious value added to consumers.
Regarding scaling, the energy labels for other products commonly follow a linear scaling (see Wiki, 2024). Such scaling is intuitive and could also be applied to electric vehicles. Non-linear scaling based on percentiles or ranks of values could be considered but may need to be carefully explained to consumers. Behavioral aspects are relevant in this context. Labelling too few or too many models as class A suggests efficient vehicles are unattainable or common. Both discourages efficiency improvements.
Regarding complementary information, the energy label may inform consumers about the drive range of vehicles and their electricity costs per year and/or distance driven. This way, the label would address important consumer concerns and it would prevent information asymmetry regarding the actual cost of vehicle ownership.
By addressing these points, policymakers can ensure that the energy label informs consumers adequately and creates a level playing field for vehicle manufacturers.
Efficiency Improvements
The wide range of energy consumption values (Figure 1 a-b) suggests that there is ample potential for efficiency improvements. In fact, electric cars have become less, not more, efficient in recent years mainly due their increasing size and mass. If we compare our findings with data for electric vehicles built between 1988 and 2019 (Weiss et al. 2020), it appears that electric cars have become 24% heavier (from 1690 ± 470 kg to 2100 ± 350 kg) and 35% more powerful (from 150 ± 127 kW to 230 ± 139 kW). Nominal battery capacity has increased 65% (from 46 ± 26 kWh to 76 ± 22 kWh) whereas certified energy consumption has increased 21% (from 16.0 ± 3.7 kWh/100 km to 19.4 ± 3.8 kWh/100 km). These findings are worrying because technical efficiency improvements (Yadlapalli et al., 2022; Xu et al., 2023) appear to trigger rebound effects, similar to those observed in past decades for conventional cars (Knittel, 2011; Weiss et al., 2020b).
Next to existing technical efficiency potentials (Zhao et al., 2019; Yadlapalli et al., 2022; Xu et al., 2023), these findings underscore the potential of downsizing and mode shift towards smaller electric cars and lightweight vehicles such as e-bikes, electric kick-scooters, or light electric three- or four-wheelers (see also Weiss et al., 2020a). As the electric vehicle fleet grows, rising electricity demand will increasingly challenge green electricity production and network transmission capacity (Lauvergne et al., 2022; Garcia et al., 2024). Reducing the size of vehicles decreases electricity consumption and can help manage peak electricity demand in combination with smart charging (Anastasiadis et al., 2019). Downsizing also reduces resource consumption of rare earth metals (Gielen and Lyons, 2022), for example, thereby contributing to more resilient and sustainable transportation.
5. Conclusions
This paper presents a comprehensive analysis of energy consumption and related trade-offs for electric cars sold in Europe. We draw the following conclusions:
- A large variety of electric cars is available to consumers; models sold in Europe have an average certified and real-world energy consumption of 19 ± 4 kWh/100 km and 21 ± 4 kWh/100 km, respectively.
- There are considerable efficiency trade-offs; energy consumption is positively correlated with frontal area, vehicle mass, and battery capacity, but less so with rated power; energy consumption is negatively correlated with drive range.
- Real-world energy consumption tends to be higher than certified energy consumption; however, our data suggest that the certified energy consumption of the least efficient model variants (TEH – test energy high) may provide a good proxy for real-world energy consumption.
- The electric battery accounts for roughly half (i.e., 1100 ± 400 kg) of the vehicle mass; nominal battery capacity is on average 5 kWh higher than usable battery capacity; each 10 kWh of nominal battery capacity adds some 143 kg to vehicle mass and 45 km drive range.
- Efficient vehicles are available at any price but drive range has a cost; models with low energy consumption are available across the entire price range; however, models with a long drive range tend to be more expensive than those with a shorter drive range; this points to an important range-price trade off consumers have to make when purchasing electric vehicles.
- Increasing model variability suggests that consumers need to be informed adequately about energy consumption, energy-related costs, and trade-offs they face when purchasing an electric car. We provide empirical examples of how to categorize the energy efficiency of electric cars on a labelling scale from A to G, with and without additional utility parameters such as battery capacity or drive range.
With firm commitment to energy labelling (Wiki, 2024) and continued market growth, it is only a matter of time until electric vehicles receive a dedicated energy label in Europe. Our findings support policy efforts in that direction and could inspire similar analyses for other electric vehicles such as e-bikes, e-scooters, and light electric three- and four-wheelers, e-busses, e-trucks, and electric non-road machinery.
Supplementary Materials
The following supporting information can be downloaded at the website of this paper posted on Preprints.org, Figure S1: title; Table S1: title; Video S1: title.
Author Contributions
EH and MW conceived the original idea. TW, AN, and MW collected the data. MW analyzed the data. MW, AN, and EH led the writing. All authors have read and approved the final manuscript.
Funding
Not applciable.
Institutional Review Board Statement
Not applicable.
Informed Consent Statement
Not applicable.
Data Availability Statement
The datasets supporting the research are included in the Supplementary Material.
Acknowledgments
We thank Juliana Stropp and the anonymous reviewers for their constructive comments on earlier drafts of the manuscript.
Conflicts of Interest
The authors declare no conflict of interest.
List of abbreviations and units
kg - kilogram
km - kilometer
kW - kilowatt
kWh - kilowatt-hour
m - meter
MAX - maximum value
MIN - minimum value
SD - standard deviation
TEH - ‘test energy high’; energy consumption value for the vehicle configuration with
the highest energy consumption during type approval
TEL - ‘test energy low’; energy consumption value for the vehicle configuration with the lowest energy consumption during type approval
Appendix A
Figure A1.
Correlation plot of vehicle attributes; color gradient, dot size, and numbers indicate the Pearson correlation coefficient; trailing zeros in the second decimal place are omitted; Range SM – drive range based on the average real-world energy consumption as given by Spritmonitor (2023); Range EVD – drive range based on average real-world energy consumption as given by EVD (2023); Range TEH – drive range based on certified TEH energy consumption values; Range TEL – drive range based on certified TEL energy consumption values; Real-world SM – real-world energy consumption as given by Spritmonitor (2023); Real-world EVD – real-world energy consumption as given by EVD (2023); WLTP TEH – certified TEH energy consumption; WLTP TEL – certified TEL energy consumption; Usable battery – usable battery capacity; Nominal battery – nominal battery capacity.
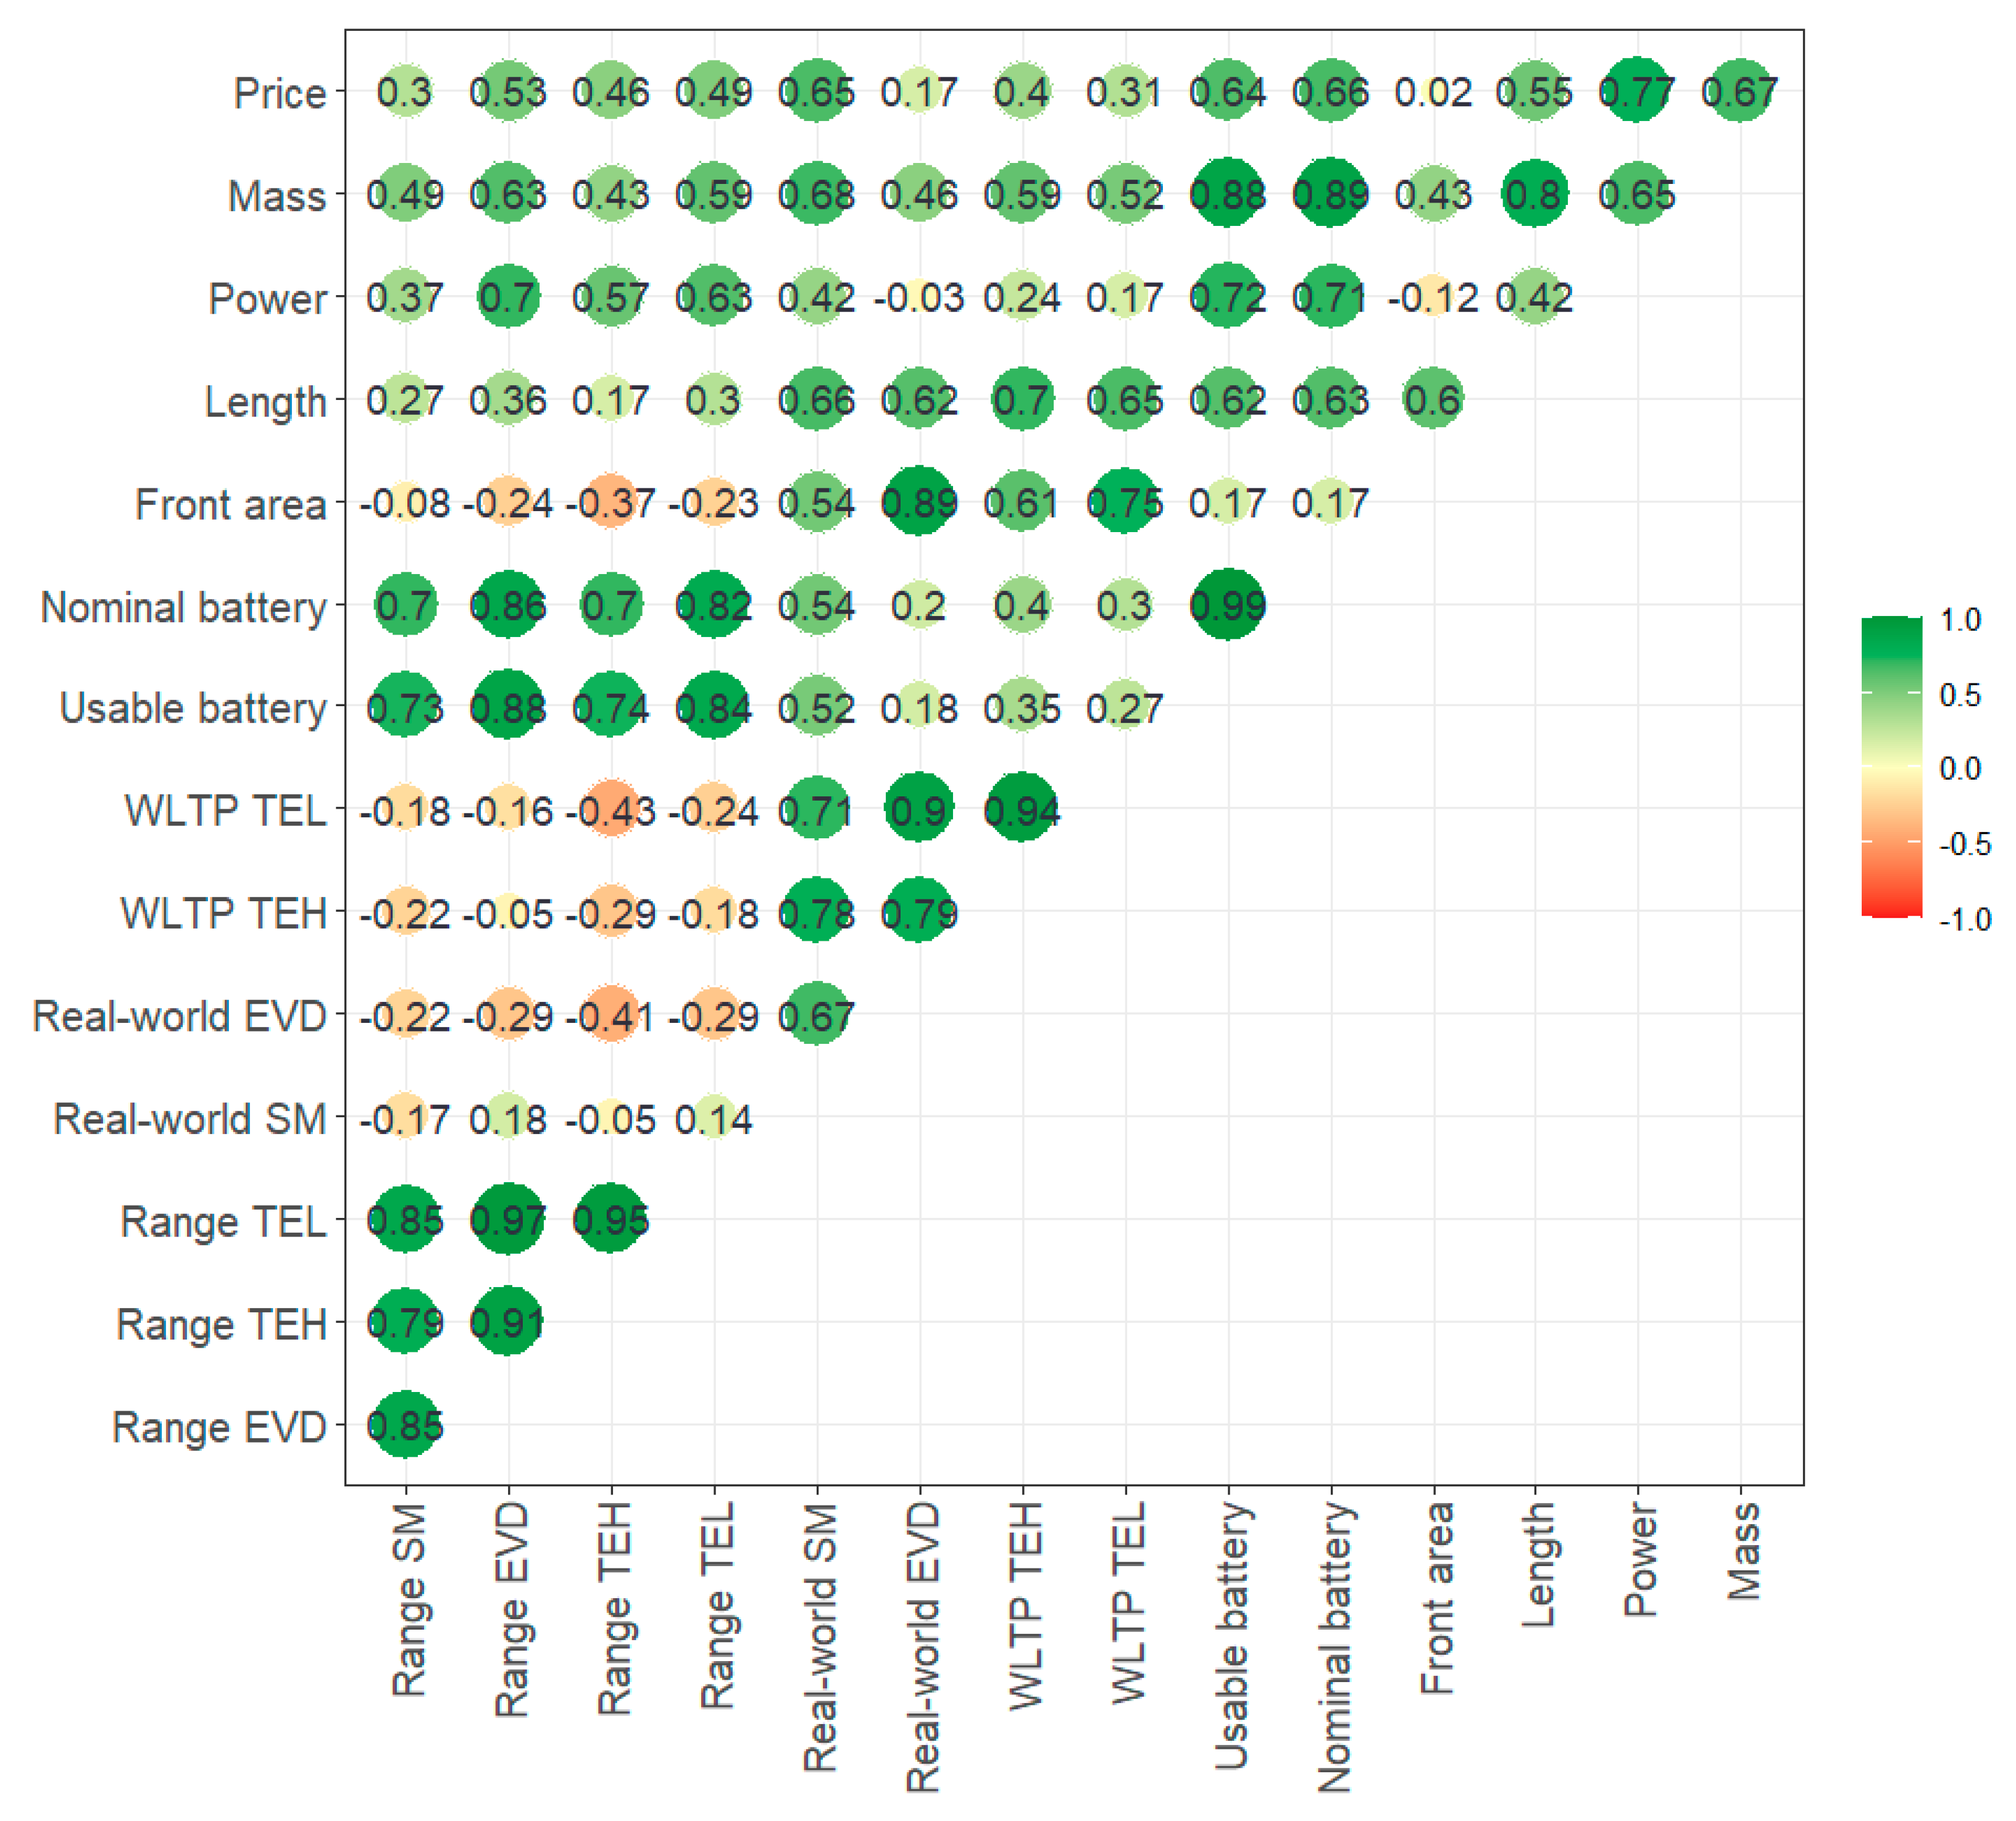
Table A1.
Summary statistics of regression analysis of certified and real-word energy consumption as a function of vehicle attributes; coefficients are significance at 1% level (***), 5% level (**), and 10% level (*).
Table A1.
Summary statistics of regression analysis of certified and real-word energy consumption as a function of vehicle attributes; coefficients are significance at 1% level (***), 5% level (**), and 10% level (*).
| Energy consumption | Coefficient | Value | Standard error | t value | Pr (>abs t) | p value | Adjusted R2 |
| Model 1a: energy consumption = α + β*mass | |||||||
| Certified | (Intercept)*** | 7.11 | 0.65 | 10.98 | 2.97 × 10⁻²⁵ | <2.2 × 10⁻¹⁶ | 0.30 |
| Mass*** | 5.80 × 10⁻³ | 3.21 × 10⁻⁴ | 18.07 | 1.56 × 10-56 | |||
| Real-world | (Intercept)*** | 9.47 | 0.61 | 15.42 | 4.40 × 10-44 | <2.2 × 10⁻¹⁶ | 0.26 |
| Mass*** | 5.44 × 10⁻³ | 3.19 × 10⁻⁴ | 17.03 | 1.63 × 10-51 | |||
| Model 1b: energy consumption = α + β*power | |||||||
| Certified | (Intercept)*** | 18.11 | 0.37 | 48.73 | 7.69 × 10-192 | 6.41 × 10⁻⁵ | 0.04 |
| Power*** | 5.33 × 10⁻³ | 1.32 × 10⁻⁴ | 4.03 | 6.41 × 10⁻⁵ | |||
| Real-world | (Intercept)*** | 20.13 | 0.34 | 59.24 | 1.35 × 10-226 | 0.02 | <0.01 |
| Power** | 2.70 × 10⁻³ | 1.19 × 10⁻³ | 2.27 | 2.36 × 10⁻² | |||
| Model 1c: energy consumption = α + β*frontal area | |||||||
| Certified | (Intercept)*** | -4.24 | 1.23 | -3.46 | 5.87 × 10⁻⁴ | <2.2 × 10⁻¹⁶ | 0.45 |
| Frontal area*** | 9.15 | 0.47 | 19.36 | 1.05 × 10-62 | |||
| Real-world | (Intercept)*** | -5.30 | 0.99 | -5.35 | 1.38 × 10⁻⁷ | <2.2 × 10⁻¹⁶ | 0.56 |
| Frontal area*** | 10.08 | 0.38 | 26.62 | 1.65 × 10-97 | |||
| Model 1d: energy consumption = α + β*driven axles | |||||||
| Certified | (Intercept)*** | 18.75 | 2.38 × 10⁻¹ | 78.77 | 1.20 × 10-283 | 5.90 × 10⁻⁶ | 0.04 |
| Driven axles*** | 1.45 | 3.17 × 10⁻¹ | 4.58 | 5.90 × 10⁻⁶ | |||
| Real-world | (Intercept)*** | 20.25 | 2.28 × 10⁻¹ | 88.68 | 1.43 × 10-305 | 1.11 × 10⁻⁴ | 0.02 |
| Driven axles*** | 1.23 | 3.15 × 10⁻¹ | 3.90 | 1.11 × 10⁻⁴ | |||
| Model 1e: energy consumption = α + β*nominal battery capacity | |||||||
| Certified | (Intercept)*** | 14.78 | 0.57 | 25.84 | 4.65 × 10-94 | 1.50 × 10⁻¹⁵ | 0.12 |
| Nominal battery capacity*** | 5.94 × 10⁻² | 7.21 × 10⁻³ | 8.243 | 1.50 × 10⁻¹⁵ | |||
| Real-world | (Intercept)*** | 16.94 | 0.55 | 31.04 | 3.72 × 10-118 | 2.07 × 10⁻¹² | 0.09 |
| Nominal battery capacity*** | 5.08 × 10⁻² | 7.04 × 10⁻³ | 7.21 | 2.07 × 10⁻¹² | |||
| Model 1f: energy consumption = α + β*drive range | |||||||
| Certified | (Intercept)*** | 23.13 | 0.68 | 34.01 | 4.93 × 10-132 | 2.37 × 10⁻¹⁰ | 0.08 |
| Certified drive range*** | -8.54 × 10⁻³ | 1.32 × 10⁻³ | -6.47 | 2.37 × 10⁻¹⁰ | |||
| Real-world | (Intercept)*** | 24.07 | 0.72 | 33.26 | 3.72 × 10-128 | 9.48 × 10⁻⁸ | 0.06 |
| Real-world drive range*** | -8.77 × 10⁻³ | 1.62 × 10⁻³ | -5.42 | 9.49 × 10⁻⁸ | |||
| Model 1g: energy consumption = α + β*price | |||||||
| Certified | (Intercept)*** | 16.99 | 0.39 | 43.42 | 6.50 × 10-171 | 1.41 × 10⁻⁹ | 0.13 |
| Price*** | 3.29 × 10⁻⁵ | 5.33 × 10⁻⁶ | 6.17 | 1.41 × 10⁻⁹ | |||
| Real-world | (Intercept)*** | 18.98 | 0.38 | 49.71 | 9.38 × 10-194 | 4.02 × 10⁻⁶ | 0.06 |
| Price*** | 2.63 × 10⁻⁵ | 5.65 × 10⁻⁶ | 4.66 | 4.02 × 10⁻⁶ | |||
| Model 2: energy consumption = α + β*mass + β*power + β*frontal area + β*driven axles | |||||||
| Certified | (Intercept)*** | -7.96 | 1.21 | -6.59 | 1.10 × 10⁻¹⁰ | <2.2 × 10⁻¹⁶ | 0.55 |
| Mass*** | 2.03 × 10⁻³ | 5.76 × 10⁻⁴ | 3.53 | 4.60 × 10⁻⁴ | |||
| Power*** | 4.16 × 10⁻³ | 1.83 × 10⁻³ | 2.27 | 2.35 × 10⁻² | |||
| Frontal area*** | 8.52 | 0.59 | 14.35 | 2.63 × 10-39 | |||
| Driven axles | 1.57 × 10⁻¹ | 3.59 × 10⁻¹ | 4.37 × 10⁻¹ | 6.63 × 10⁻¹ | |||
| Real-world | (Intercept)*** | -6.43 | 9.48 × 10⁻¹ | -6.78 | 3.37 × 10⁻¹¹ | <2.2 × 10⁻¹⁶ | 0.60 |
| Mass*** | 1.65 × 10⁻³ | 5.17 × 10⁻⁴ | 3.19 | 1.49 × 10⁻³ | |||
| Power | -1.34 × 10⁻³ | 1.47 × 10⁻³ | -9.10 × 10⁻¹ | 3.64 × 10⁻¹ | |||
| Frontal area*** | 9.16 | 0.50 | 18.48 | 2.74 × 10-58 | |||
| Driven axles*** | 1.02 | 3.40 × 10⁻¹ | 3.01 | 2.74 × 10⁻³ | |||
| Model 3a: log(energy consumption) = α + β*log(mass) | |||||||
| log(Certified) | (Intercept)*** | -1.61 | 0.23 | -6.893 | 1.66 × 10⁻¹¹ | <2.2e × 10-16 | 0.32 |
| log(Mass)*** | 5.96 × 10⁻¹ | 3.07 × 10⁻² | 19.41 | 5.80 × 10-63 | |||
| log(Real-world) | (Intercept)*** | -9.63 × 10⁻¹ | 1.99 × 10⁻¹ | -4.83 | 1.86e × 10-6 | <2.2 × 10⁻¹⁶ | 0.30 |
| log(Mass)*** | 5.22e × 10-1 | 2.64 × 10⁻² | 19.75 | 2.12 × 10-64 | |||
| Model 3b: log(energy consumption) = α + β*log(power) | |||||||
| log(Certified) | (Intercept)*** | 2.57 | 8.47 × 10⁻² | 30.35 | 2.19 × 10-115 | 5.76 × 10⁻⁶ | 0.05 |
| log(Power)*** | 7.11 × 10⁻² | 1.55 × 10⁻² | 4.58 | 5.76 × 10⁻⁶ | |||
| log(Real-world) | (Intercept)*** | 2.78 | 7.69 × 10⁻² | 36.17 | 5.84 × 10-141 | 1.73 × 10⁻³ | 0.02 |
| log(Power)*** | 4.47 × 10⁻² | 1.42 × 10⁻² | 3.15 | 1.73 × 10⁻³ | |||
| Model 3c: log(energy consumption) = α + β*log(frontal area) | |||||||
| log(Certified) | (Intercept)*** | 1.83 | 5.72 × 10⁻² | 32.01 | 4.60 × 10-123 | <2.2 × 10⁻¹⁶ | 0.43 |
| log(Frontal area)*** | 1.18 | 5.93 × 10⁻² | 19.93 | 1.84 × 10-65 | |||
| log(Real-world) | (Intercept)*** | 1.85 | 4.19 × 10⁻² | 44.21 | 8.20 × 10-174 | <2.2 × 10⁻¹⁶ | 0.57 |
| log(Frontal area)*** | 1.23 | 4.31 × 10⁻² | 28.62 | 6.06 × 10-107 | |||
| Model 3d: log(energy consumption) = α + β*driven axles | |||||||
| log(Certified) | (Intercept) | 2.91 | 1.17 × 10⁻² | 248.07 | 0.00 | 9.35 × 10⁻⁸ | 0.05 |
| Driven axles*** | 8.44 × 10⁻² | 1.56 × 10⁻² | 5.42 | 9.35 × 10⁻⁸ | |||
| log(Real-world) | (Intercept) | 2.99 | 1.06 × 10⁻² | 281.06 | 0.00 | 1.90 × 10⁻⁶ | 0.04 |
| Driven axles*** | 6.83 × 10⁻² | 1.42 × 10⁻² | 4.82 | 1.90 × 10⁻⁶ | |||
| Model 3e: log(energy consumption) = α + β*log(nominal battery capacity) | |||||||
| log(Certified) | (Intercept)*** | 1.98 | 1.00 × 10⁻¹ | 19.77 | 1.18 × 10-64 | <2.2 × 10⁻¹⁶ | 0.14 |
| log(Nominal battery capacity)*** | 2.24 × 10⁻¹ | 2.33 × 10⁻² | 9.63 | 3.04 × 10⁻²⁰ | |||
| log(Real-world) | (Intercept)*** | 2.23 | 8.61 × 10⁻² | 25.94 | 3.12 × 10-94 | <2.2 × 10⁻¹⁶ | 0.12 |
| log(Nominal battery capacity)*** | 1.84 × 10⁻¹ | 2.01 × 10⁻² | 9.17 | 1.23 × 10⁻¹⁸ | |||
| Model 3f: log(energy consumption) = α + β*log(drive range) | |||||||
| log(Certified) | (Intercept)*** | 3.85 | 0.20 | 19.66 | 3.86 × 10-64 | 3.34 × 10⁻⁶ | 0.05 |
| log(Certified drive range)*** | -1.50 × 10⁻¹ | 3.18 × 10⁻² | -4.70 | 3.34 × 10⁻⁶ | |||
| log(Real-world) | (Intercept)*** | 3.70 | 0.18 | 20.27 | 6.07 × 10-67 | 1.50 × 10⁻⁴ | 0.04 |
| log(Real-world drive range)*** | -1.16 × 10⁻¹ | 3.02 × 10⁻² | -3.83 | 1.46 × 10⁻⁴ | |||
| Model 3g: log(energy consumption) = α + β*log(price) | |||||||
| log(Certified) | (Intercept)*** | 7.93 × 10⁻¹ | 1.85 × 10⁻¹ | 4.29 | 2.18 × 10⁻⁵ | <2.2 × 10⁻¹⁶ | 0.23 |
| log(Price)*** | 1.94 × 10⁻¹ | 1.68 × 10⁻² | 11.55 | 1.69 × 10⁻²⁷ | |||
| log(Real-world) | (Intercept)*** | 1.22 | 1.94 × 10⁻¹ | 6.28 | 7.35 × 10⁻¹⁰ | <2.2 × 10⁻¹⁶ | 0.16 |
| log(Price)*** | 1.63 × 10⁻¹ | 1.78 × 10⁻² | 9.18 | 1.21 × 10⁻¹⁸ | |||
| Model 4: log(energy consumption) = α + β*log(mass) + β*log(power) + β*log(frontal area) + β*driven axles | |||||||
| log(Certified) | (Intercept) | -1.38 × 10⁻¹ | 3.70 × 10⁻¹ | -3.74 × 10⁻¹ | 7.09 × 10⁻¹ | <2.2 × 10⁻¹⁶ | 0.54 |
| log(Mass)*** | 2.43 × 10⁻¹ | 6.51 × 10⁻² | 3.73 | 2.10 × 10⁻⁴ | |||
| log(Power) | 1.29 × 10⁻² | 2.37 × 10⁻² | 5.45 × 10⁻¹ | 5.86 × 10⁻¹ | |||
| log(Frontal area)*** | 1.03 | 7.71 × 10⁻² | 13.41 | 3.28 × 10⁻³⁵ | |||
| Driven axles** | 3.99 × 10⁻² | 1.90 × 10⁻² | 2.10 | 3.59 × 10⁻² | |||
| log(Real-world) | (Intercept) | 2.87 × 10⁻¹ | 3.26 × 10⁻¹ | 8.82 × 10⁻¹ | 3.79 × 10⁻¹ | <2.2 × 10⁻¹⁶ | 0.63 |
| log(Mass)*** | 2.44 × 10⁻¹ | 6.04 × 10⁻² | 4.04 | × 10-5 | |||
| log(Power)* | -5.49 × 10⁻² | 1.96 × 10⁻² | -2.80 | 5.38 × 10⁻³ | |||
| log(Frontal area)*** | 1.02 | 6.93 × 10⁻² | 14.75 | 5.21 × 10-41 | |||
| Driven axles*** | 7.19 × 10⁻² | 1.48 × 10⁻² | 4.86 | 1.59 × 10⁻⁶ | |||
Table A2.
Summary statistics of regression analysis of energy consumption (real-world and certified) and vehicle mass, and power; coefficients are significance at 1% level (***), 5% level (**), and 10% level (*).
Table A2.
Summary statistics of regression analysis of energy consumption (real-world and certified) and vehicle mass, and power; coefficients are significance at 1% level (***), 5% level (**), and 10% level (*).
| Coefficient | Value | Standard error | t value | Pr (>abs t) | p value | Adjusted R2 | ||
| Real-world vs. Certified energy consumption | Model 1g: real-world energy consumption = α + β*certified energy consumption | |||||||
| (Intercept)*** | 4.11 | 4.77 × 10⁻¹ | 8.63 | 1.44 × 10⁻¹⁶ | <2.2 × 10⁻¹⁶ | 0.75 | ||
| Certified energy consumption*** | 8.77 × 10⁻¹ | 2.65 × 10⁻² | 33.14 | 8.93 × 10-118 | ||||
| Usable vs. Nominal battery capacity | Model 1h: usable battery capacity = α + β*nominal battery capacity | |||||||
| (Intercept) | 6.41 × 10⁻² | 4.12 × 10⁻¹ | 1.55 × 10⁻¹ | 8.77 × 10⁻¹ | <2.2 × 10⁻¹⁶ | 0.99 | ||
| Nominal battery capacity*** | 9.32 × 10⁻¹ | 6.18 × 10⁻³ | 150.85 | 1.56 × 10-313 | ||||
| Mass vs. Nominal battery capacity | Model 1i: mass = α + β*nominal battery capacity | |||||||
| (Intercept)*** | 1015 | 34 | 30 | 6.28 × 10-97 | <2.2 × 10⁻¹⁶ | 0.79 | ||
| Nominal battery capacity*** | 14.25 | 4.14 × 10⁻¹ | 34 | 8.42 × 10-113 | ||||
| Mass vs. Frontal area | Model 1j: mass = α + β*frontal area | |||||||
| (Intercept)*** | 697 | 184 | 3.80 | 1.79 × 10⁻⁴ | 1.44 × 10⁻¹³ | 0.18 | ||
| Frontal area*** | 460 | 60 | 7.71 | 1.44 × 10⁻¹³ | ||||
| Power vs. Mass | Model 1k: power = α + β*mass | |||||||
| (Intercept)*** | -315 | 29 | -11.05 | 1.90 × 10⁻¹ | <2.2 × 10⁻¹⁶ | 0.43 | ||
| Mass*** | 2.59 × 10⁻¹ | 1.52 × 10⁻² | 17.10 | 9.77 × 10-48 | ||||
| Certified drive range vs. Nominal battery capacity | Model 1l: certified drive range = α + β*nominal battery capacity | |||||||
| (Intercept)*** | 104 | 12 | 8.90 | 8.03 × 10⁻¹⁸ | <2.2 × 10⁻¹⁶ | 0.59 | ||
| Nominal battery capacity*** | 4.33 | 1.61 × 10⁻¹ | 26.91 | 1.73 × 10-102 | ||||
| Real-world drive range vs. Usable battery capacity | Model 1m: real-world drive range = α + β*usable battery capacity | |||||||
| (Intercept)*** | 68 | 8 | 8.37 | 6.10 × 10⁻¹⁶ | <2.2 × 10⁻¹⁶ | 0.71 | ||
| Usable battery capacity*** | 4.56 | 1.23 × 10⁻¹ | 36.99 | 1.82 × 10-144 | ||||
| Price vs. nominal battery capacity | Model 1n: price = α + β*nominal battery capacity | |||||||
| (Intercept) | -21,119 | 3,981 | -5.74 | 1.45 × 10⁻⁸ | <2.2 × 10⁻¹⁶ | 0.43 | ||
| Nominal battery capacity | 1196 | 59 | 20.23 | 1.57 × 10-71 | ||||
| Price vs. Certified drive range | Model 1o: price = α + β*certified drive range | |||||||
| (Intercept) | 6,059 | 4,951 | 1.22 | 2.22 × 10⁻¹ | <2.2 × 10⁻¹⁶ | 0.22 | ||
| Certified drive range*** | 150 | 13 | 12.02 | 1.06 × 10⁻²⁹ | ||||
| log(Real-world energy consumption) vs. log(Certified energy consumption) | Model 3g: log(real-world energy consumption) = α + β*log(certified energy consumption) | |||||||
| (Intercept)*** | 6.96 × 10⁻¹ | 6.22 × 10⁻² | 11.20 | 1.41 × 10⁻²⁵ | <2.2 × 10⁻¹⁶ | 0.73 | ||
| log(Certified energy consumption)*** | 7.94 × 10⁻¹ | 2.14 × 10⁻² | 37.03 | 1.47 × 10-132 | ||||
| log(Usable battery capacity) vs. log(Nominal battery capacity) | Model 3h: log(usable battery capacity) = α + β*log(nominal battery capacity) | |||||||
| (Intercept)*** | -1.16 × 10⁻¹ | 2.54 × 10⁻² | -4.55 | 7.65 × 10⁻⁶ | <2.2 × 10⁻¹⁶ | 0.99 | ||
| log(Nominal battery capacity)*** | 1.01 | 5.91 × 10⁻³ | 170.98 | 0.00 | ||||
| log(Mass) vs. log(Nominal battery capacity) | Model 3i:log(mass) = α + β*log(nominal battery capacity) | |||||||
| (Intercept)*** | 5.51 | 6.95 × 10⁻² | 79.36 | 1.82 × 10-221 | <2.2 × 10⁻¹⁶ | 0.80 | ||
| log(Nominal battery capacity)*** | 4.96 × 10⁻¹ | 1.58 × 10⁻² | 31.41 | 1.54 × 10-102 | ||||
| log(Mass) vs. log(Frontal area) | Model 3j:log(mass) = α + β*log(frontal area) | |||||||
| (Intercept)*** | 6.76 | 1.12 × 10⁻¹ | 60.32 | 1.14 × 10-183 | 2.17 × 10⁻¹⁶ | 0.21 | ||
| log(Frontal area)*** | 7.90 × 10⁻¹ | 9.89 × 10⁻² | 7.99 | 2.17 × 10⁻¹⁴ | ||||
| log(Power) vs. log(Mass) | Model 3k: log(power) = α + β*log(mass) | |||||||
| (Intercept)*** | -13.1 | 6.89 × 10⁻¹ | -18.97 | 3.011 × 10-55 | <2.2 × 10⁻¹⁶ | 0.54 | ||
| log(Power)*** | 2.40 | 9.13 × 10⁻² | 26.29 | 6.36 × 10-84 | ||||
| log(Certified drive range) vs. log(Nominal battery capacity) | Model 3l: log(certified drive range) = α + β*log(nominal battery capacity) | |||||||
| (Intercept)*** | 2.76 | 9.92 × 10⁻² | 27.81 | 5.07 × 10-107 | <2.2 × 10⁻¹⁶ | 0.62 | ||
| log(Nominal battery capacity)*** | 7.63 × 10⁻¹ | 2.29 × 10⁻² | 33.34 | 3.09 × 10-134 | ||||
| log(Real-world drive range) vs. log(Usable battery capacity) | Model 3m: log(real-world drive range) = α + β*log(usable battery capacity) | |||||||
| (Intercept)*** | 2.57 | 8.30 × 10⁻² | 30.94 | 1.13 × 10-117 | <2.2 × 10⁻¹⁶ | 0.73 | ||
| log(Usable battery capacity)*** | 7.97 × 10⁻¹ | 1.96 × 10⁻² | 40.66 | 9.56 × 10-160 | ||||
| log(Price) vs. log(Nominal battery capacity) | Model 3n: log(price) = α + β*log(nominal battery capacity) | |||||||
| (Intercept)*** | 6.51 | 1.68 × 10⁻¹ | 38.80 | 4.10 × 10-174 | <2.2 × 10⁻¹⁶ | 0.59 | ||
| log(Nominal battery capacity)*** | 1.06 | 3.97 × 10⁻² | 26.66 | 1.52 × 10-107 | ||||
| log(Price) vs. log(Certified drive range) | Model 3o: log(price) = α + β*log(certified drive range) | |||||||
| (Intercept)*** | 6.57 | 3.14 × 10⁻¹ | 20.94 | 5.77 × 10-72 | <2.2 × 10⁻¹⁶ | 0.25 | ||
| log(Certified drive range)*** | 7.45 × 10⁻¹ | 5.24 × 10⁻¹ | 14.23 | 2.59 × 10-39 | ||||
Table A3.
Vehicle coverage and energy consumption values for alternative labelling schemes; the data set includes 501 data points for certified energy consumption (TEH and TEL values).
Table A3.
Vehicle coverage and energy consumption values for alternative labelling schemes; the data set includes 501 data points for certified energy consumption (TEH and TEL values).
| Efficiency class | |||||||||
| Criterion | Classification | Class size | A | B | C | D | E | F | G |
| Certified energy consumption [kWh/100 km] | Equal class size over the entire data range | 2.53 | <15.5 | 15.5-18.0 | 18.1-20.6 | 20.7-23.1 | 23.2-25.6 | 25.7-28.2 | >28.2 |
| 10% vehicles in A, B-G equal class size | 2.55 | <15.4 | 15.4-18.0 | 18.1-20.5 | 20.6-23.1 | 23.2-25.6 | 25.7-28.2 | >28.2 | |
| 5% in A, B-G equal class size | 2.67 | <14.7 | 14.7-17.4 | 17.5-20.0 | 20.1-22.7 | 22.8-25.4 | 25.5-28.1 | >28.0 | |
| 1% in A, B-G equal class size | 2.78 | <14.0 | 14.0-16.8 | 16.9-19.6 | 19.7-22.3 | 22.4-25.1 | 25.2-27.9 | >27.9 | |
| Certified energy consumption per unit nominal battery capacity [10-4 km-1] | Equal class size over the entire data range | 8.34 | <20.8 | 20.8-29.1 | 29.2-37.5 | 37.6-45.8 | 45.9-54.2 | 54.3-62.5 | >62.5 |
| 10% vehicles in A, B-G equally spaced | 8.67 | <18.8 | 18.8-27.5 | 27.6-36.1 | 36.2-44.8 | 44.9-53.5 | 53.6-62.2 | >62.2 | |
| 5% in A, B-G equally spaced | 8.95 | <17.2 | 17.2-26.2 | 26.2-35.1 | 35.2-44.1 | 44.2-53.0 | 53.1-62.0 | >62.0 | |
| 1% in A, B-G equally spaced | 9.59 | <13.3 | 13.3-22.9 | 23.0-32.5 | 32.6-42.1 | 42.2-51.7 | 51.8-61.3 | >61.3 | |
| Certified energy consumption per 100 km drive range [kWh/104 km2] | Equal class size over the entire data range | 1.56 | <3.26 | 3.27-4.82 | 4.83-6.38 | 6.39-7.94 | 7.95-9.50 | 9.51-11.06 | >11.06 |
| 10% vehicles in A, B-G equally spaced | 1.61 | <2.96 | 2.97-4.57 | 4.58-6.18 | 6.19-7.79 | 7.80-9.40 | 9.41-11.01 | >11.01 | |
| 5% in A, B-G equally spaced | 1.67 | <2.62 | 2.63-4.29 | 4.30-5.96 | 5.97-7.63 | 7.64-9.29 | 9.30-10.97 | >10.97 | |
| 1% in A, B-G equally spaced | 1.78 | <1.94 | 1.94-3.72 | 3.73-5.50 | 5.51-7.28 | 7.29-9.06 | 9.07-10.84 | >10.84 | |
References
- ACEA (2024): Vehicles on European roads. ACEA - European Automobile Manufacturers’ Association. Source: https://www.acea.auto/files/ACEA-Report-Vehicles-on-European-roads-.pdf. Accessed: 27 April 2024.
- Anastasiadis, A.G., Kondylis, G.P, Polyzakisc, A., Vokas, G. (2019): Effects of increased electric vehicles into a distribution network. Energy Procedia 157: 586–593. [CrossRef]
- BEV (2023): BEV-Database. Eberhard Droege Consulting. Source: https://bev-database.de. Accessed: 5 August 2023.
- Blair, G., Cooper, J., Coppock, A., Humphreys, M., Sonnet, L., Fultz, N. (2018): Package ‘estimatr’. R Foundation for Statistical Computing, Vienna, Austria. Source: https://cran.r-project.org/web/packages/estimatr/estimatr.pdf. Accessed: 23 April 2018.
- Bowling, B. (2010): Air drag coefficients and frontal area calculation. Source: http://www.bgsoflex.com/airdragchart.html. Accessed: 30 May 2024.
- EC (1999): Directive 1999/94/EC of the European Parliament and of the Council of 13 December 1999 relating to the availability of consumer information on fuel economy and CO2 emissions in respect of the marketing of new passenger cars. EU – European Commission. Official Journal L012, p.16.
- EC (2007a): Regulation (EC) No 715/2007 of the European Parliament and of the Council of 20 June 2007 on type approval of motor vehicles with respect to emissions from light passenger cars and commercial vehicles (Euro 5 and Euro 6). EC – European Commission. Official Journal of the European Union L171, p.1-16. Consolidated version under: https://eur-lex.europa.eu/legal-content/EN/TXT/?uri=CELEX%3A02007R0715-20200901A. Accessed: 8 January 2024.
- EC (2007b): Directive 2007/46/EC establishing a framework for the approval of motor vehicles and their trailers, and of systems, components and separate technical units intended for such vehicles. EC – European Commission. Official Journal of the European Union. L263, p. 1-160.
- EC (2017): Commission Regulation (EU) 2017/1151 supplementing Regulation (EC) No 715/2007 of the European Parliament and of the Council on type-approval of motor vehicles with respect to emissions from light passenger and commercial vehicles (Euro 5 and Euro 6) and on access to vehicle repair and maintenance information, amending Directive 2007/46/EC of the European Parliament and of the Council, Commission Regulation (EC) No 692/2008 and Commission Regulation (EU) No 1230/2012 and repealing Commission Regulation (EC) No 692/2008. EC - European Commission. Official Journal of the European Union L175, pp. 1-839.
- EC (2019): Regulation (EU) 2019/631 of 17 April 2019 stetting CO2 emission performance standards for new passenger cars and for new light commercial vehicles, and repealing Regulations (EC) No 443/2009 and (EU) No 510/2011. EC – European Commission. Official Journal of the European Union L 111, p. 13.
- EC (2020): Sustainable and smart mobility strategy – Putting European transport on track for the future. Document SWD(2020) 331 final. EC – European Commission. Source: https://eur-lex.europa.eu/resource.html?uri=cellar:5e601657-3b06-11eb-b27b-01aa75ed71a1.0001.02/DOC_1&format=PDF. Accessed: 28 April 2024.
- EC (2022): Ecodesign and energy labelling working plan 2022-2024. EC – European Commission. Official Journal of the European Union C 182, p. 1-12.
- EC (2023a): Regulation (EU) 2023/851 of the European Parliament and of the Council of 19 April 2023 amending Regulation (EU) 2019/631 as regards strengthening the CO2 emission performance standards for new passenger cars and new light commercial vehicles in line with the Union’s increased climate ambition. EC – European Commission. Official Journal of the European Union L 110, p. 5-20.
- EC (2023b): Directive (EU) 2023/1791 of the European Parliament and of the Council of 13 September 2023 on energy efficiency and amending Regulation (EU) 2023/955 (recast). EC – European Commission. Official Journal of the European Union L 231, p. 1–111. Source: https://eur-lex.europa.eu/legal-content/EN/TXT/?uri=OJ%3AJOL_2023_ 231_R_0001&qid=1695186598766. Accessed: 24 April 2024.
- EC (2024): Transition pathway for a green, digital, and resilient EU mobility industrial ecosystem. News article, 29 January 2024. EC – European Commission, Directorate-General for Internal Market, Industry, Entrepreneurship and SMEs. Source: https://single-market-economy.ec.europa.eu/news/transition-pathway-green-digital-and-resilient-eu-mobility-industrial-ecosystem-2024-01-29_en. Accessed: 27 April 2024.
- E-CUBE (2020): 2030 peak power demand in North-West Europe. Report (Final version) – September 2020. E-CUBE Strategy Consultants and the Institute of Energy Economics at the University of Cologne gGmbH (EWI). Source: https://www.ewi.uni-koeln.de/cms/wp-content/uploads/2020/09/E-CUBE-EWI-2030-Peak-Power-Demand-in-North-West-Europe-vf3.pdf. Accessed: 28 April 2024.
- EEA (2016): Electric vehicles in Europe. Report No 20/2016. EEA - European Environmental Agency No 20/2016. [CrossRef]
- EEA (2023): New registrations of electric vehicles in Europe. EEA – European Environmental Agency. Source: https://www.eea.europa.eu/en/analysis/indicators/%20new-registrations-of-electric-vehicle. Accessed: 1 February 2024.
- EVD (2023): Electric vehicle database. EV Database (9-Five-9 Ventures BV). Source: https://ev-database.org. Accessed: 5 August 2023.
- Hucho, W.-H., Sovran, G. (1993): Aerodynamics of road vehicles. Annual Review of Fluid Mechanics 25, pp. 485-537.
- Galvin, R. (2022): Are electric vehicles getting too big and heavy? Modelling future vehicle journeying demand on a decarbonized US electricity grid. Energy Policy 161, 112746.
- Garcia, B.B., Ferraz, B., Vidor, F.F., Gazzana, D.S., Ferraz, R.G. (2024): Chapter eleven - Power loss analysis in distribution systems considering the massive penetration of electric vehicles. Editor(s): Gali, V., Canha, L.N., Resener, M., Ferraz, B., M., Varaprasad, V.G.: Advanced Technologies in Electric Vehicles, Academic Press, 2024, Pages 279-297, ISBN 9780443189999. [CrossRef]
- Gielen, D., Lyons, M. (2022): Critical materials for the energy transition: Rare earth elements. International Renewable Energy Agency, Abu Dhabi. Technical paper 2/2022. Source: https://www.irena.org/-/media/Irena/Files/Technical-papers/IRENA_Rare_Earth_Elements_2022.pdf?rev=6b1d592393f245f193b08eeed6512abc. Accessed: 14 June 2024.
- Haq, G., Weiss, M. (2016): CO2 labelling of passenger cars in Europe: Status, challenges, and future prospects. Energy Policy 95, pp. 324-335.
- Helmers, E., Marx, P. (2012): Electric cars: Technical characteristics and environmental impacts. Environmental Sciences Europe 24:14. [CrossRef]
- Helmers, E., Dietz, J., Weiss, M. (2020): Sensitivity analysis in the life-cycle assessment of.
- electric, vs. combustion engine cars under approximate real-world conditions. Sustainability 12, 1241. [CrossRef]
- IEA (2024): Global EV Outlook 2023: Executive summary. IEA – International Energy Agency. Source: https://www.iea.org/reports/global-ev-outlook-2023/executive-summary. Accessed: 27 April 2024.
- IEA (2023): Executive summary. Global EV outlook 2023. IEA – International Energy Agency. Source: https://www.iea.org/reports/global-ev-outlook-2023/executive-summary. Accessed: 21 March 2024.
- ICCT (2022): European vehicle market statistics – Pocketbook 2022/23. ICCT – International Council on Clean Transportation. Source: https://theicct.org/wp-content/uploads/2023/01/ICCT-European-Vehicle-Market-Statistics-Pocketbook_2022_23.pdf. Accessed: 27 September 2023.
- ICCT (2023): Electric vehicles market monitor for light-duty vehicles: China, Europe, United States, and India, 2022. Source: https://theicct.org/wp-content/uploads/2023/06/Major-Mkts_briefing_FINAL.pdf. Accessed: 27 September 2023.
- Knittel, C. (2011): Automobiles on steroids. Product attribute trade-offs and technological progress in the automobile sector. American Economic Review 101, pp. 3368-3399.
- Lauvergne, R., Perez, Y., Françon, M., Tejeda La Cruz, A. (2022): Integration of electric vehicles into transmission grids: A case study on generation adequacy in Europe in 2040. Applied Energy 326: 120030. doi.org/10.1016/j.apenergy.2022.120030.
- Madziel, M., Campisi, T. (2023): Energy consumption of electric vehicles: Analysis of selected parameters based on created database. Energies 16(3).
- Mittal, G., Garg, A., Pareek, K. (2023): A review of the technologies, challenges and policies implications of electric vehicles and their future development in India. Energy Storage e562, pp. 1-32.
- Pamidimukkala, A., Kermanshachi, S., Rosenberger, J.M., Hladik, G. (2024): Barriers and motivators to the adoption of electric vehicles: A global review. Green Energy and Intelligent Transportation 3(2), 100153.
- Prognos (2021): Entwicklung des Bruttostromverbrauches bis 2030. Prognos AG Berlin. Source: https://www.prognos.com/de/projekt/entwicklung-des-bruttostromverbrauches-bis-2030. Accessed: 28 April 2024.
- R Core Team (2022). R: A language and environment for statistical computing. R Foundation for Statistical Computing, Vienna, Austria. Source: https://www.R-project.org/. Accessed: 25 September 2022.
- Redelbach, M., Klötzke, M., Friedrich, H.E. (2012): Impact of lightweight design on energy consumption and cost effectiveness of alternative powertrain concepts. European Electric Vehicle Congress. 19-22 November 2012. Brussels, Belgium.
- She, Z.-Y., Sun, Q., Ma, J.-J., Xie, B.C. (2017): What are the barriers to widespread adoption of battery electric vehicles? A survey of public perception in Tianjin, China. Transport Policy 56, pp. 29-40.
- Spritmonitor (2023): Spritmonitor.de – Verbrauchswerte real erfahren. Fisch und Fischl GmbH, Thyrnau, Germany. Source: https://www.spritmonitor.de/. Accessed: 31 August 2023.
- Spritmonitor (2024): Spritmonitor.de. Sparsame Elektrofahrzeuge - E-Autos mit wenig Stromverbrauch. Fisch und Fischl GmbH, Thyrnau, Germany. Source: https://www.spritmonitor.de/de/sparsame_elektrofahrzeuge.html. Accessed: 18 April 2024.
- STHDA (2018): Linear regression assumption and diagnostics in R: Essentials. STHDA – Statistical Tools for High-throughput Data Analysis. Source: http://www.sthda.com/english/articles/39-regression-model-diagnostics/161-linear-regression-assumptions-and-diagnostics-in-r-essentials/. Accessed : 1 February 2024.
- Tietge, U., Mock, P., Franco, V., Zacharof, N. (2017): From laboratory to road: Modeling the divergence between official and real-world fuel consumption and CO2 emission values in the German passenger car market for the years 2001-2014. Energy Policy 103, pp. 212-222.
- UNECE (2021): Addendum 153 – UN Regulation No. 154. Source: https://unece.org/sites/default/files/2021-08/R154e.pdf. Accessed: 5 June 2024.
- Weiss, M., Zerfass, A., Helmers, E. (2019). Fully electric and plug-in hybrid cars - An analysis of learning rates, user costs, and costs for mitigating CO2 and air pollutant emissions. Journal of Cleaner Production 212: 1478-1489. [CrossRef]
- Weiss, M., Cloos, K.C., Helmers, E. (2020a): Energy efficiency trade-offs in small to large electric vehicles. Environmental Sciences Europe 32.
- Weiss, M. Irrgang, L., Kiefer, A.T., Josefine R. Roth J.R., Helmers, E. (2020b): Mass- and power-related efficiency trade-offs and CO2 emissions of compact passenger cars. Journal of Cleaner Production 243: 118326. [CrossRef]
- Wiki (2024): European Union energy label. Wikipedia. Source: https://en.wikipedia.org/wiki/European_Union_energy_label. Accessed: 17 April 2024.
- Xu, J., Cai, X, Cai, S, Shao, X, Hu, C, Lu, S, Ding, S. (2023): High-energy lithium-ion batteries: Recent progress and a promising future in applications. Energy Environ. Mater. 6: 12450. [CrossRef]
- Yadlapalli, R.T., Kotapati, A., Kandipati, R., Koritala, C.S. (2022): A review of energy efficient technologies for electric vehicle applications. Journal of Energy Storage 50, 104212.
- Zhao, C., Gong, G., Yu, C., Liu, Y., Zhong, S., Song, Y., Deng, C., Zhou, A., Ye, H. (2019): Research on key factors for range and energy consumption of electric vehicles. SAE Technical Paper 2019-01-0723. [CrossRef]
- Zuur, A.F., Ieno, E.N., Walker, N.J., Saveliev, A.A., Smith, G.M. (2009): Mixed effects models and extensions in ecology with R. Springer Science + Business Media. New York, USA.
Figure 1.
Box plots of vehicle attributes; dots represent individual vehicle models, vertical lines depict the median, upper and lower quartiles, and 1.5 times the interquartile range of the data; the y-axis is used to disperse the data and is unitless.
Figure 1.
Box plots of vehicle attributes; dots represent individual vehicle models, vertical lines depict the median, upper and lower quartiles, and 1.5 times the interquartile range of the data; the y-axis is used to disperse the data and is unitless.
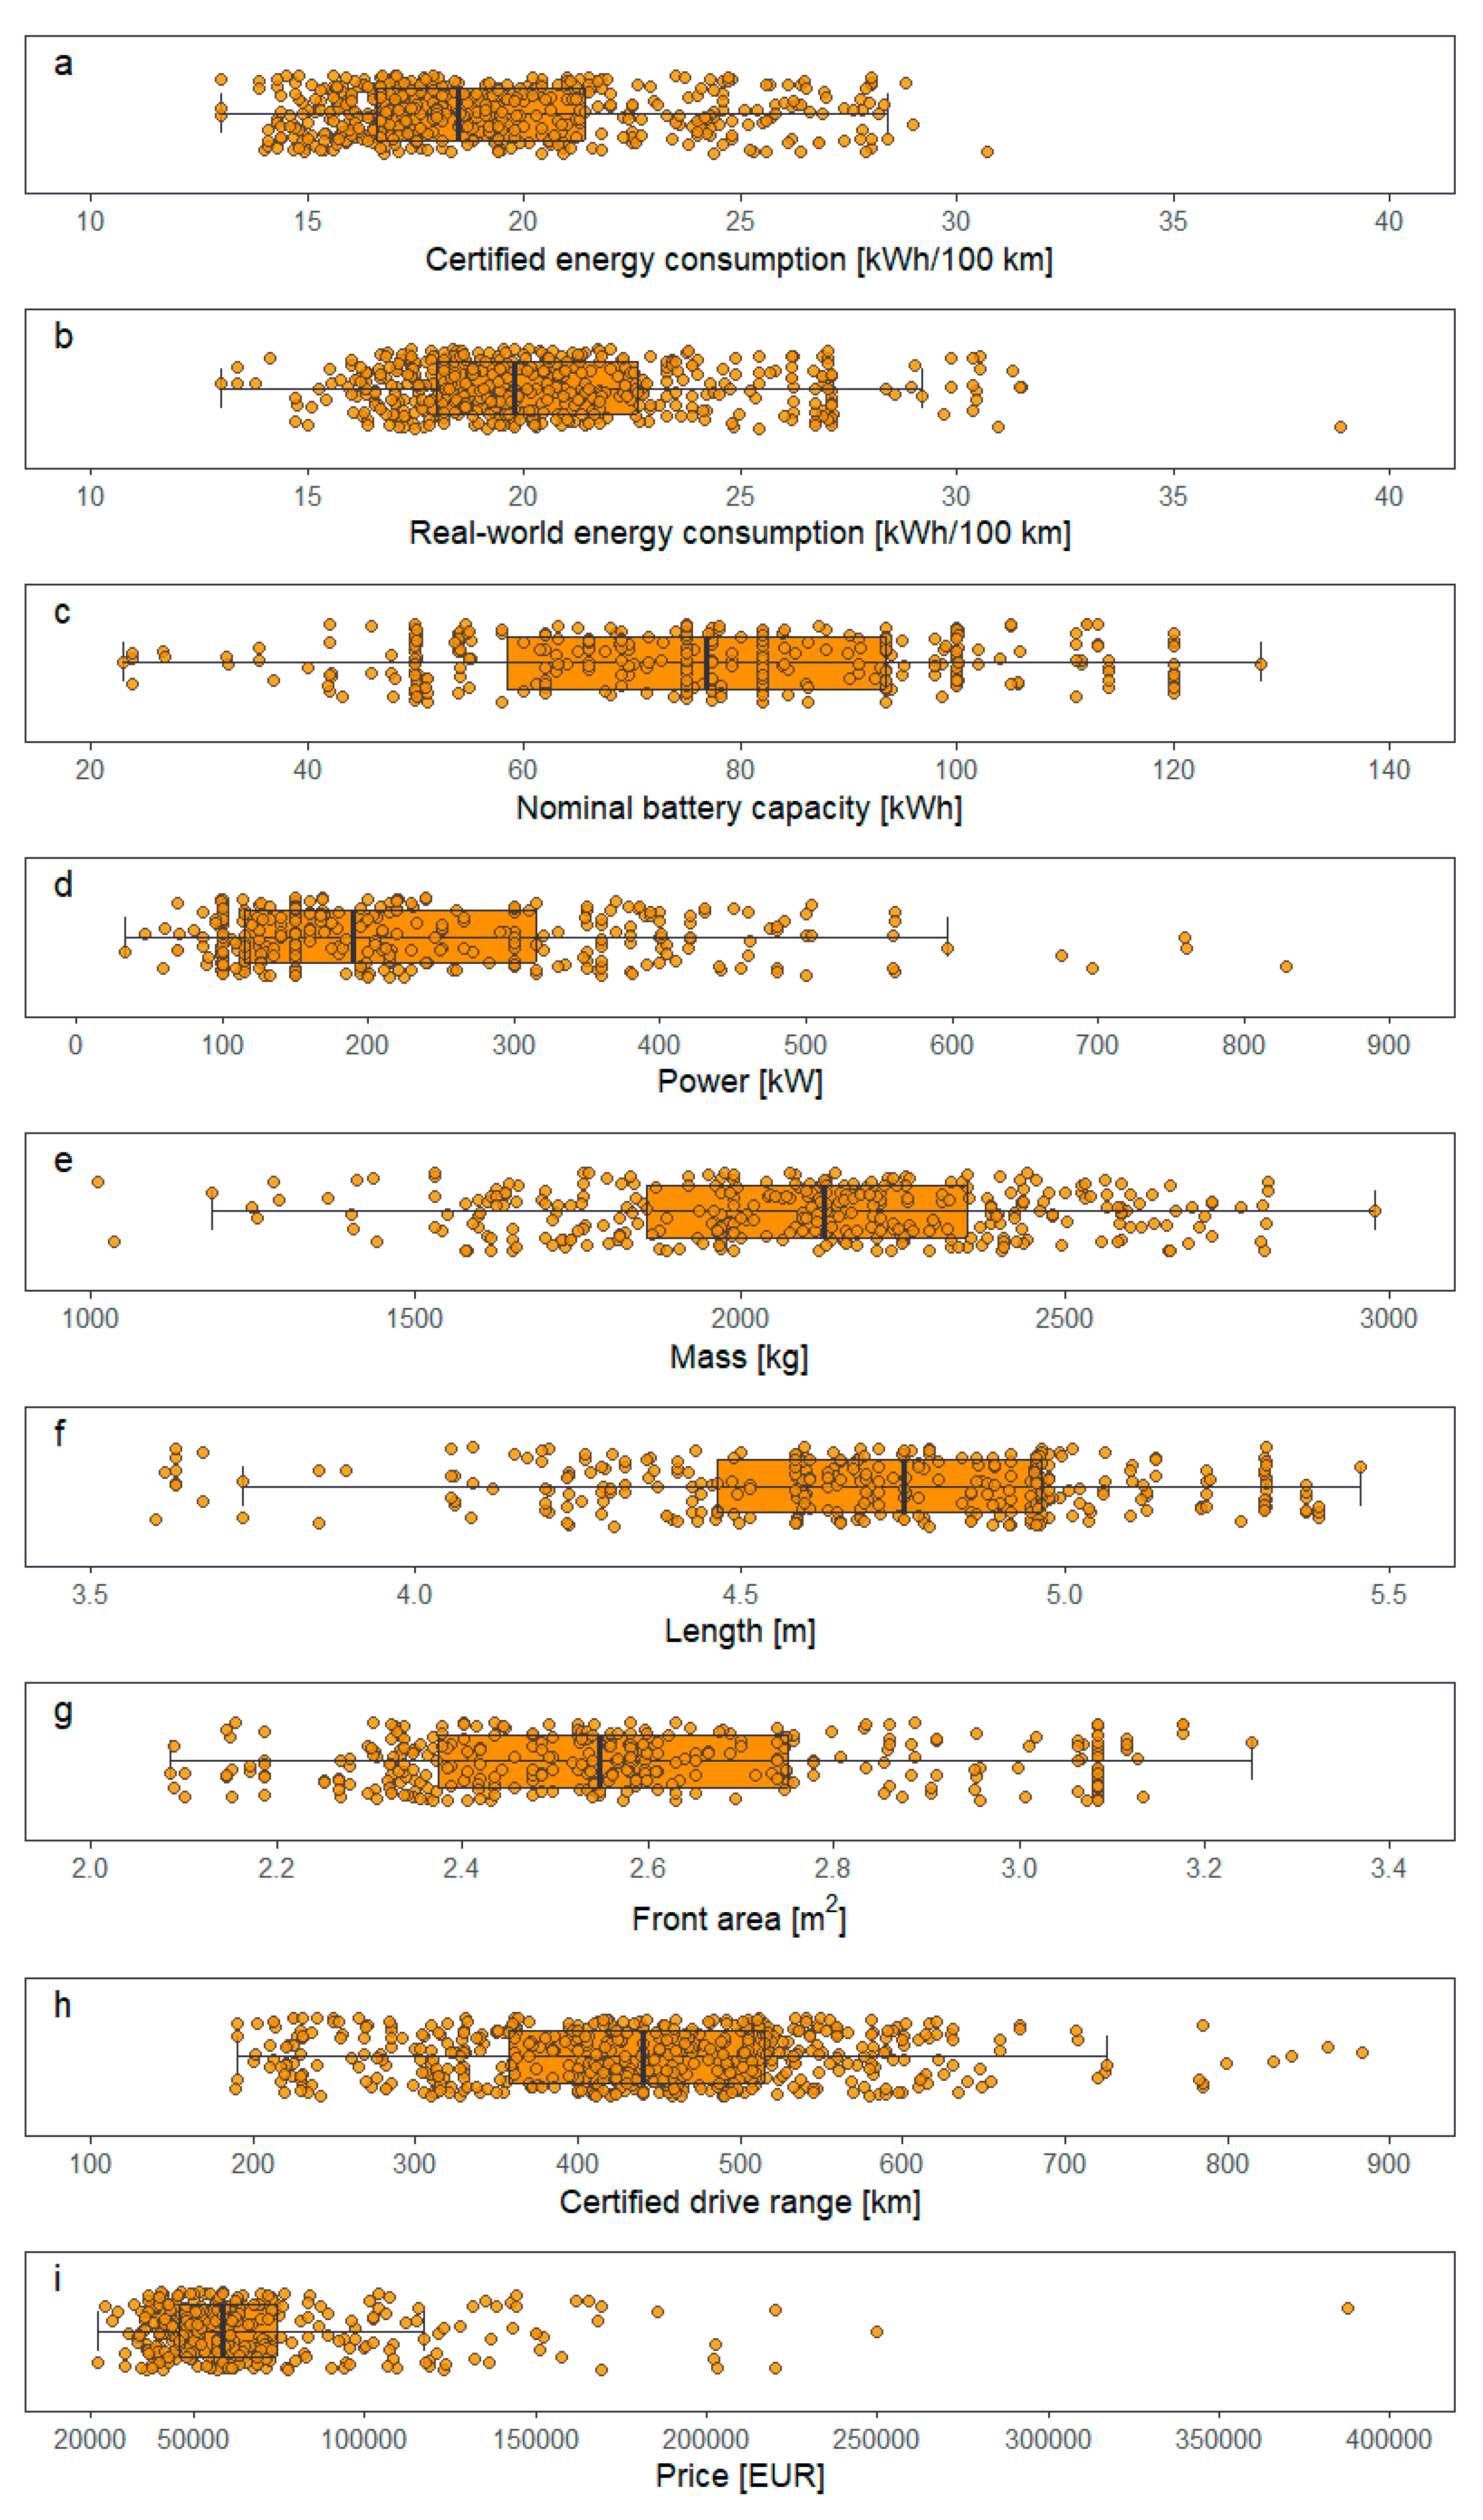
Figure 2.
Mean and standard deviation of certified energy consumption (a) and drive range per Euro vehicle price (b) by vehicle manufacturer.
Figure 2.
Mean and standard deviation of certified energy consumption (a) and drive range per Euro vehicle price (b) by vehicle manufacturer.
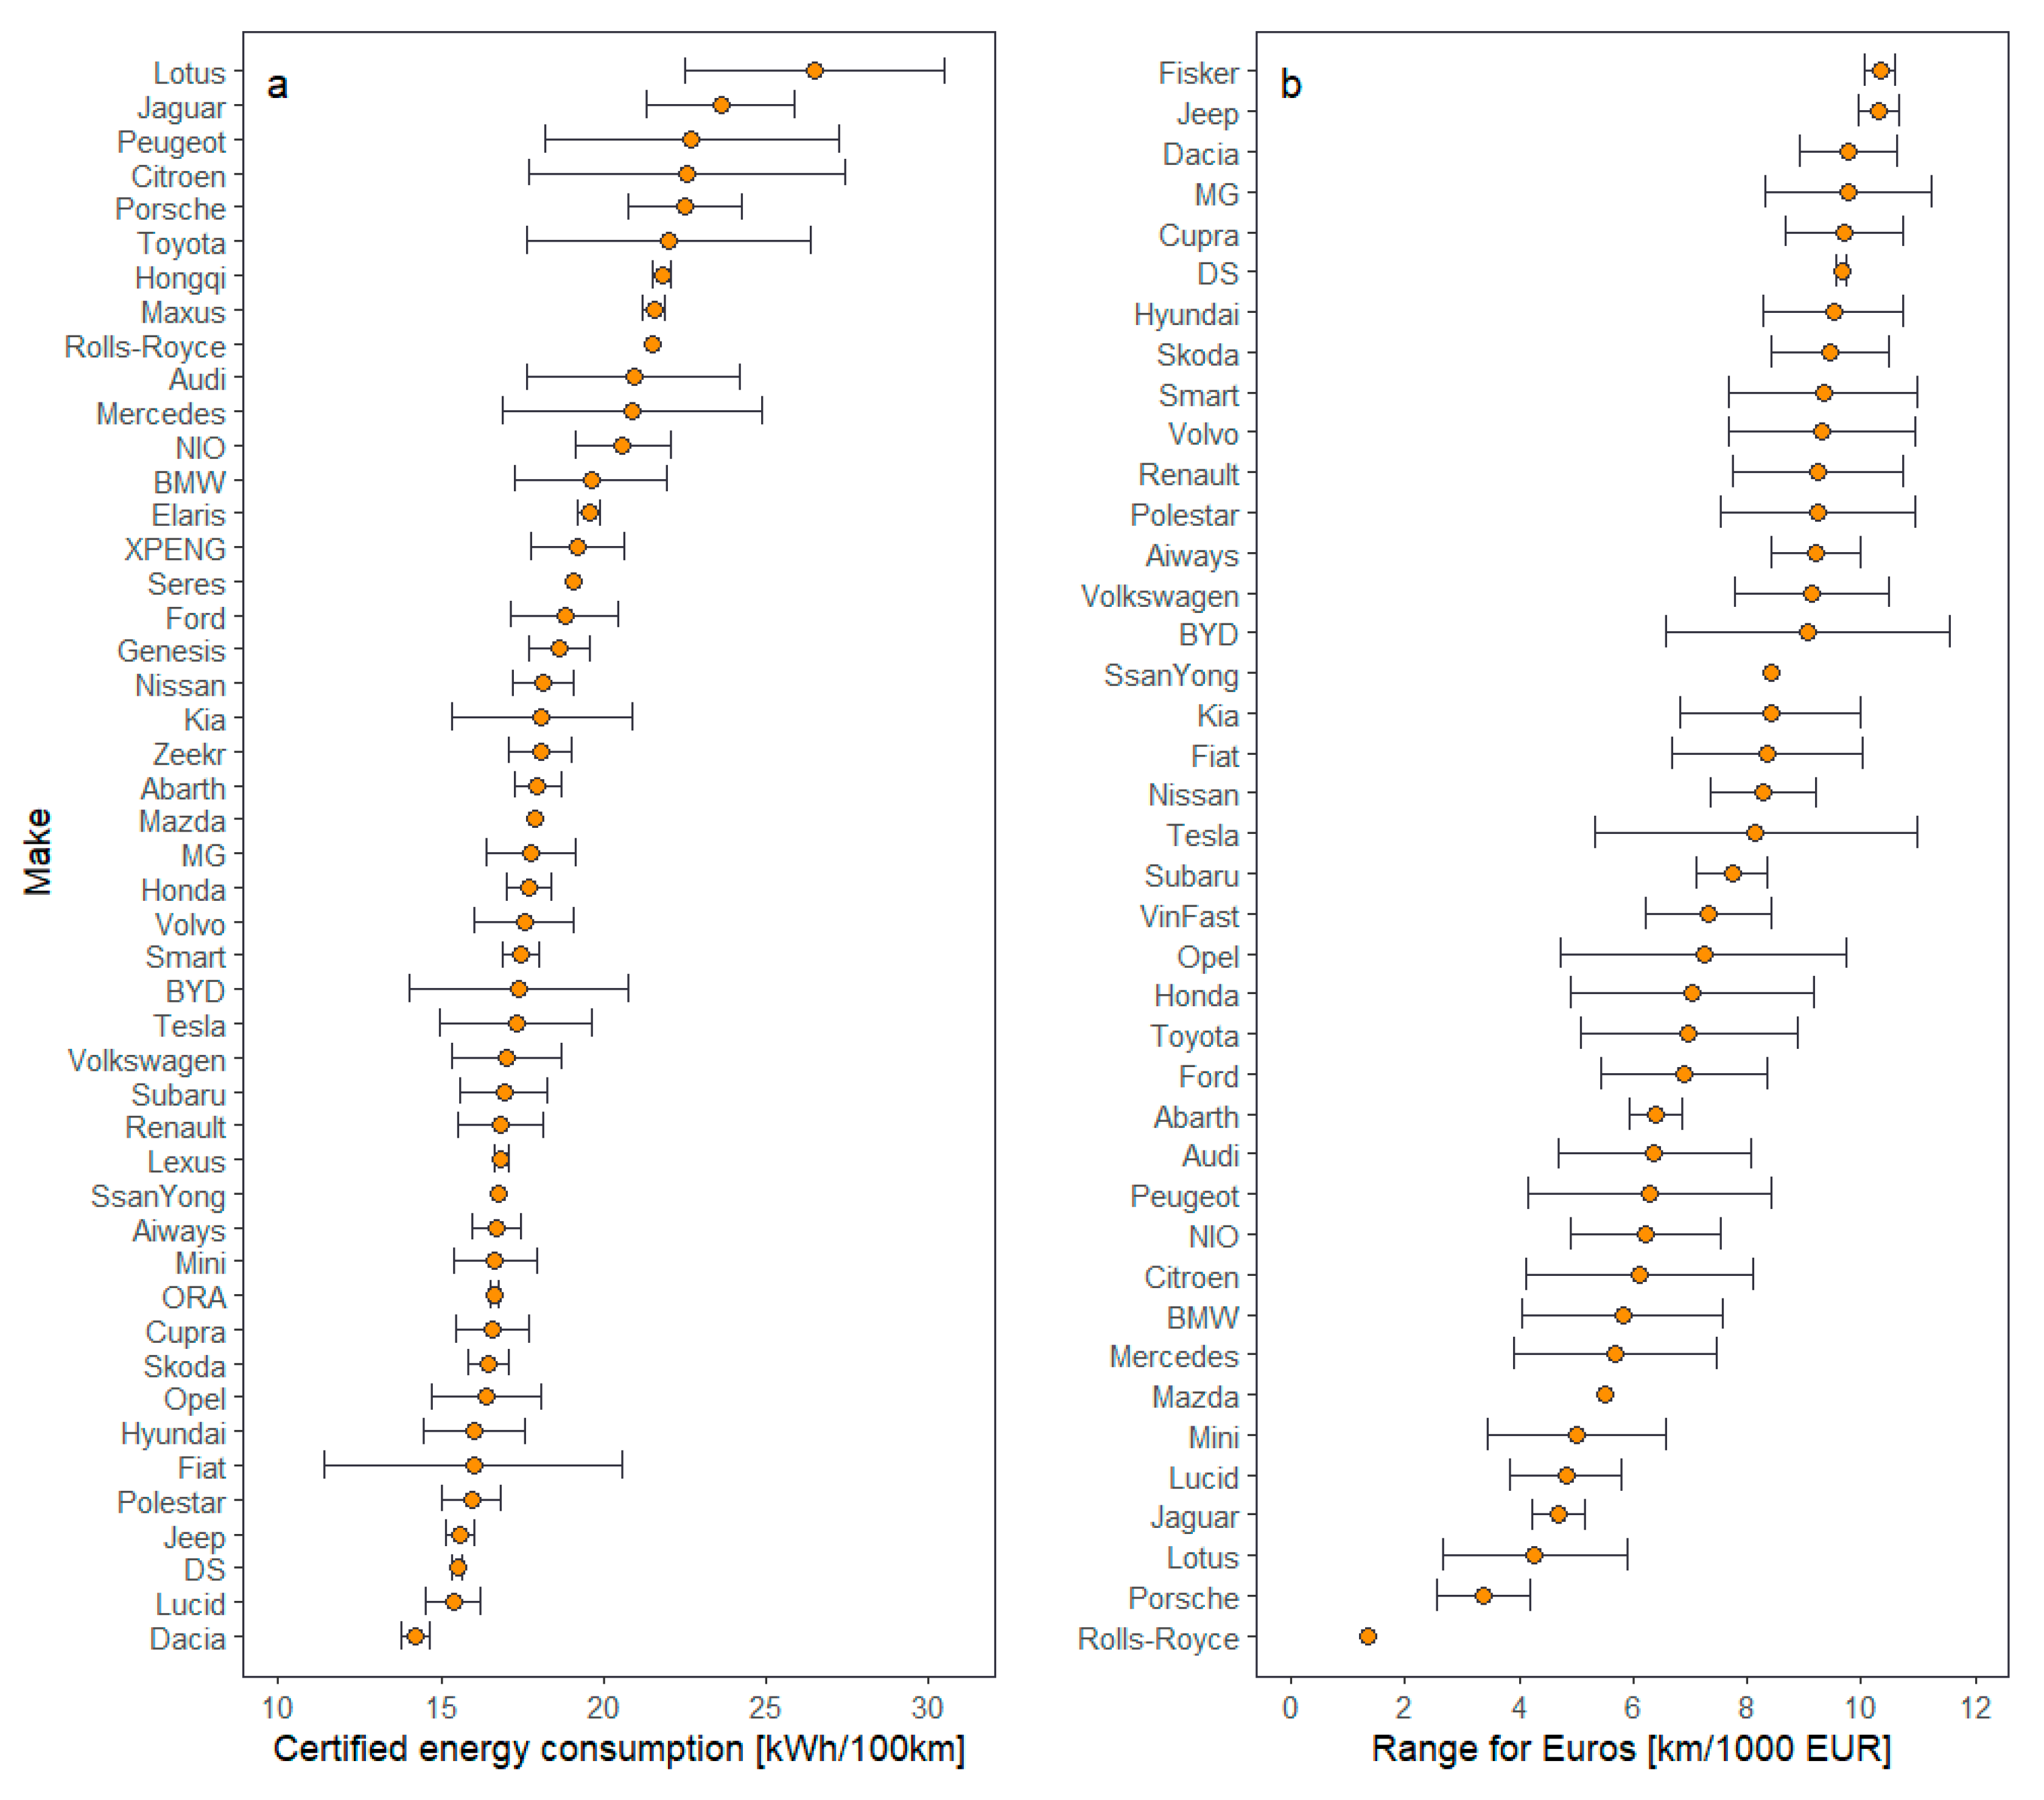
Figure 3.
Certified energy consumption (light blue) and real-world energy consumption (yellow) as a function of vehicle mass, frontal area, power, nominal battery capacity, and drive range; shaded areas represent the 95%-confidence interval of the regression line.
Figure 3.
Certified energy consumption (light blue) and real-world energy consumption (yellow) as a function of vehicle mass, frontal area, power, nominal battery capacity, and drive range; shaded areas represent the 95%-confidence interval of the regression line.
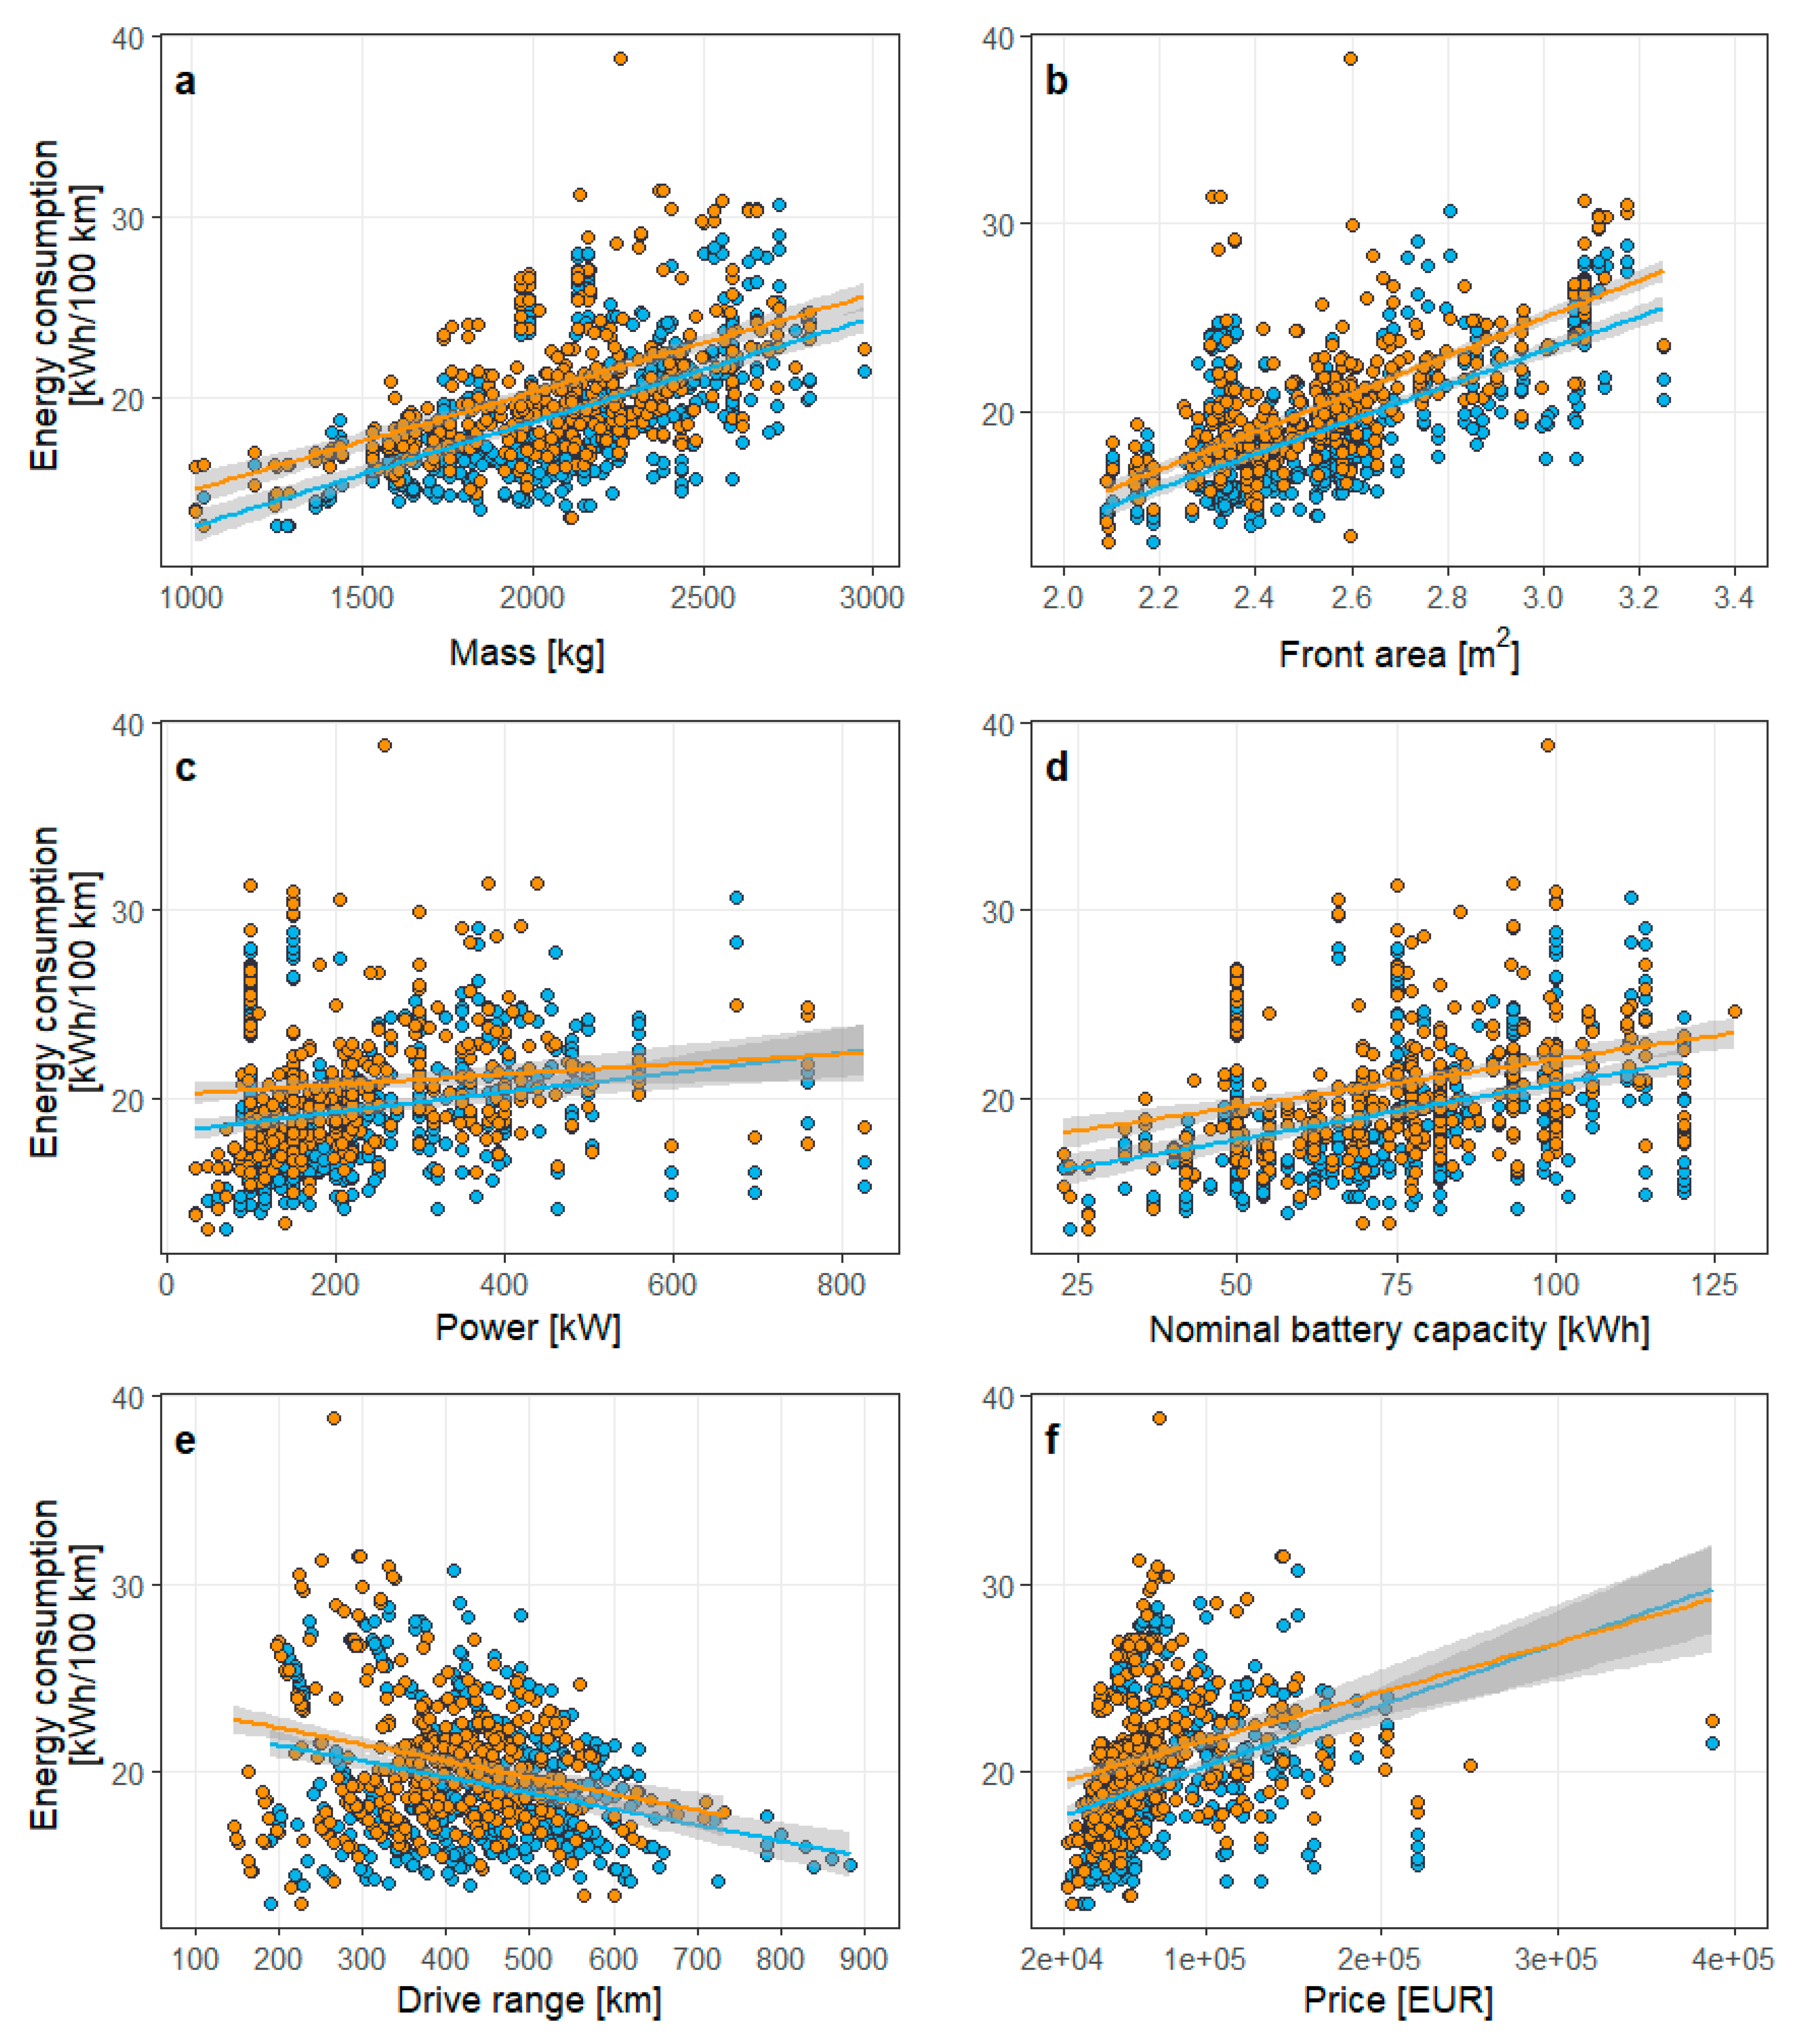
Figure 4.
Complementary regression analyses; thin black lines in Figures 4a/b depict a slope of one and a y-axis intercept of zero; shaded areas represent the 95%-confidence interval of the regression line.
Figure 4.
Complementary regression analyses; thin black lines in Figures 4a/b depict a slope of one and a y-axis intercept of zero; shaded areas represent the 95%-confidence interval of the regression line.
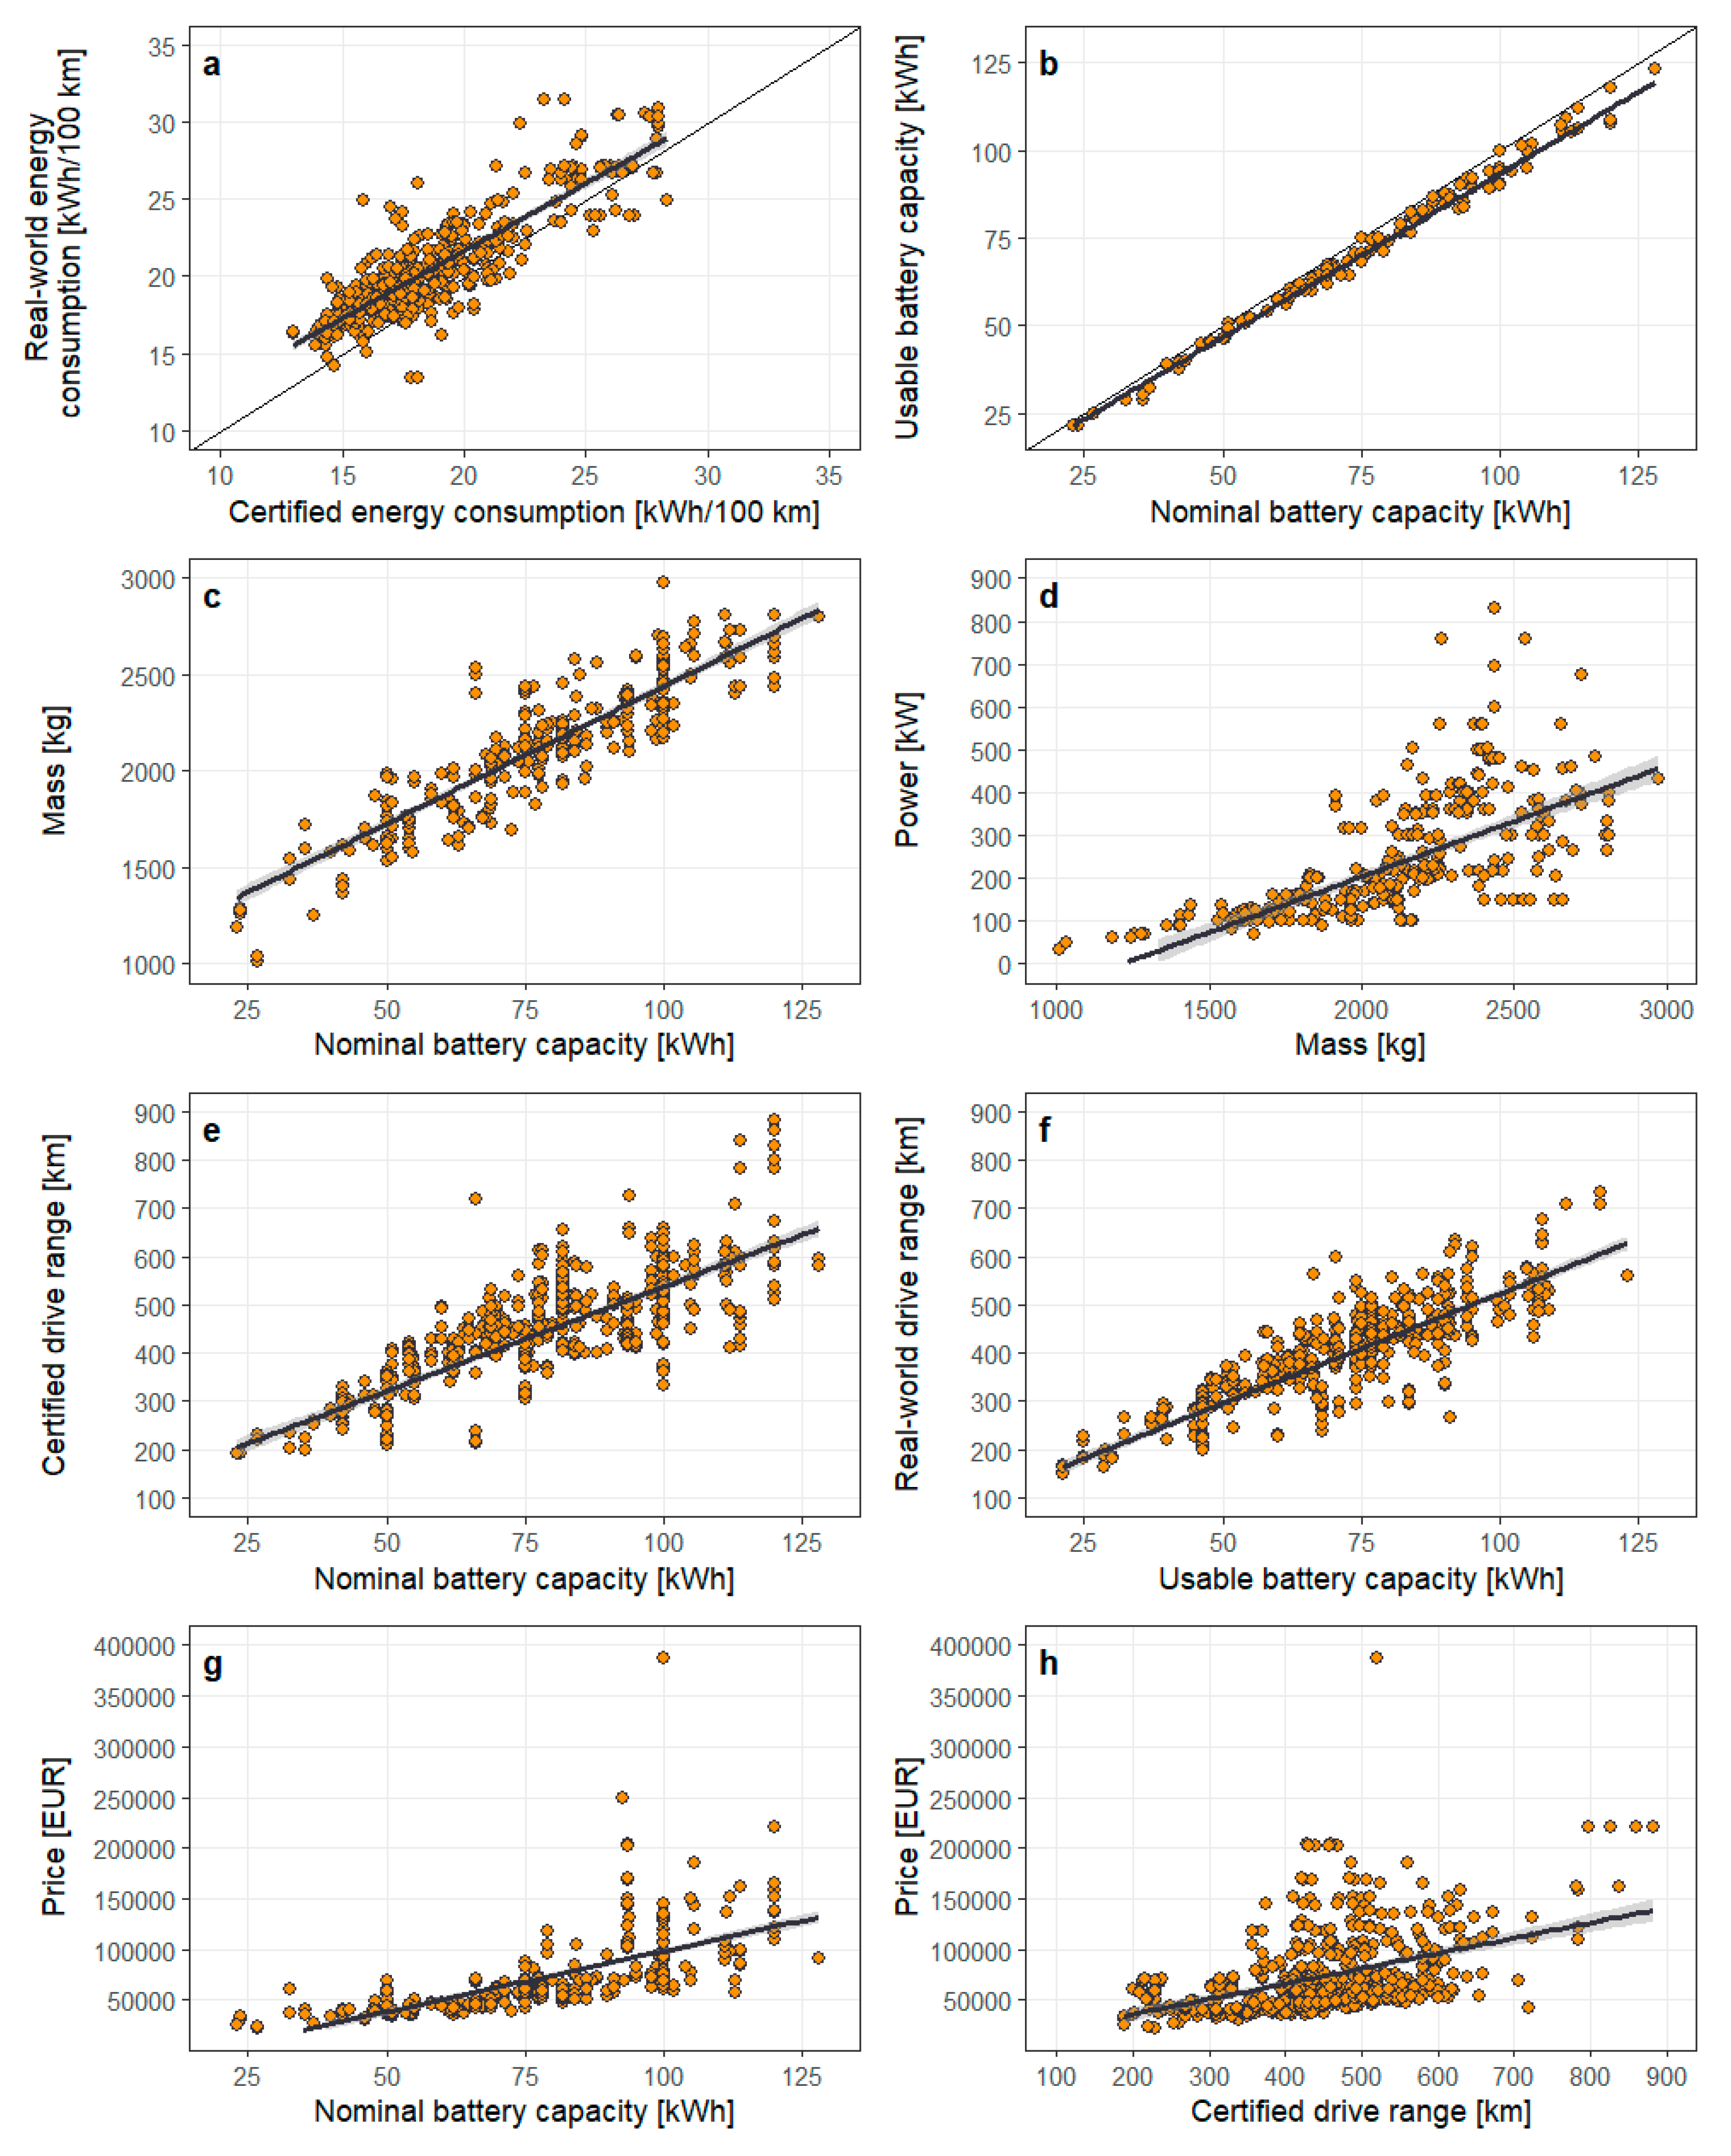
Figure 6.
Scatterplot of certified energy consumption and drive range, highlighting the three most popular brands (Tesla, Volkswagen, and BWM) and the three brands with the lowest average energy consumption (Dacia, DS, and Lucid); dot size is proportional to vehicle price.
Figure 6.
Scatterplot of certified energy consumption and drive range, highlighting the three most popular brands (Tesla, Volkswagen, and BWM) and the three brands with the lowest average energy consumption (Dacia, DS, and Lucid); dot size is proportional to vehicle price.
Disclaimer/Publisher’s Note: The statements, opinions and data contained in all publications are solely those of the individual author(s) and contributor(s) and not of MDPI and/or the editor(s). MDPI and/or the editor(s) disclaim responsibility for any injury to people or property resulting from any ideas, methods, instructions or products referred to in the content. |
© 2024 by the authors. Licensee MDPI, Basel, Switzerland. This article is an open access article distributed under the terms and conditions of the Creative Commons Attribution (CC BY) license (http://creativecommons.org/licenses/by/4.0/).
Copyright: This open access article is published under a Creative Commons CC BY 4.0 license, which permit the free download, distribution, and reuse, provided that the author and preprint are cited in any reuse.


